Embed Size (px)
DESCRIPTION
Metabolic Pathway Analysis: Elementary Modes. The technique of Elementary Flux Modes (EFM) was developed prior to extreme pathways ( EP ) by Stephan Schuster, Thomas Dandekar and co-workers: Pfeiffer et al. Bioinformatics, 15, 251 (1999) Schuster et al. Nature Biotech. 18, 326 (2000) - PowerPoint PPT Presentation
Citation preview
21. Lecture WS 2003/04
Bioinformatics III 1
Metabolic Pathway Analysis: Elementary ModesThe technique of Elementary Flux Modes (EFM) was developed prior to extreme
pathways (EP) by Stephan Schuster, Thomas Dandekar and co-workers:Pfeiffer et al. Bioinformatics, 15, 251 (1999)
Schuster et al. Nature Biotech. 18, 326 (2000)
The method is very similar to the „extreme pathway“ method to construct a basis
for metabolic flux states based on methods from convex algebra.
Extreme pathways are a subset of elementary modes, and for many systems, both
methods coincide.
Are the subtle differences important?
21. Lecture WS 2003/04
Bioinformatics III 2
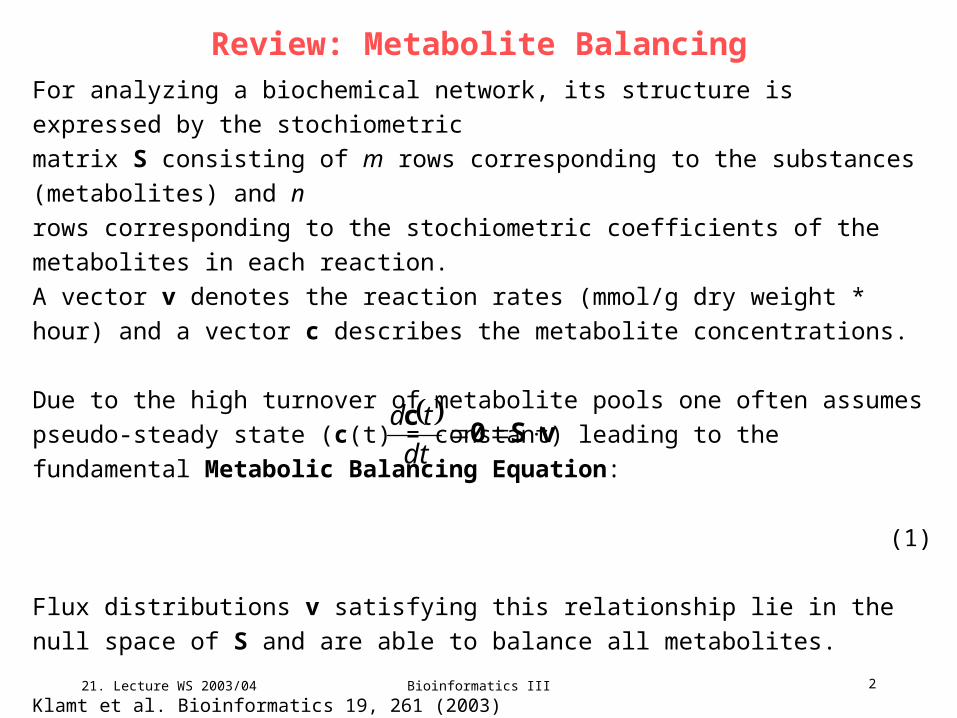
Review: Metabolite BalancingFor analyzing a biochemical network, its structure is expressed by the stochiometric
matrix S consisting of m rows corresponding to the substances (metabolites) and n
rows corresponding to the stochiometric coefficients of the metabolites in each
reaction.
A vector v denotes the reaction rates (mmol/g dry weight * hour) and a vector c
describes the metabolite concentrations.
Due to the high turnover of metabolite pools one often assumes pseudo-steady state
(c(t) = constant) leading to the fundamental Metabolic Balancing Equation:
(1)
Flux distributions v satisfying this relationship lie in the null space of S and are able
to balance all metabolites.
Klamt et al. Bioinformatics 19, 261 (2003)
vS0
c
dt
td
21. Lecture WS 2003/04
Bioinformatics III 3
Review: Metabolic flux analysisMetabolic flux analysis (MFA): determine preferably all components of the flux
distribution v in a metabolic network during a certain stationary growth experiment.
Typically some measured or known rates must be provided to calculate unknown
rates. Accordingly, v and S are partioned into the known (vb, Sb) and unknown part
(va, Sa).
(1) leads to the central equation for MFA describing a flux scenario:
0 = S v = Sa va + Sb vb.
The rank of Sa determines whether this scenario is redundant and/or
underdetermined. Redundant systems can be checked on inconsistencies. In
underdetermined scenarios, only some element of va are uniquely calculable.
Klamt et al. Bioinformatics 19, 261 (2003)
21. Lecture WS 2003/04
Bioinformatics III 4
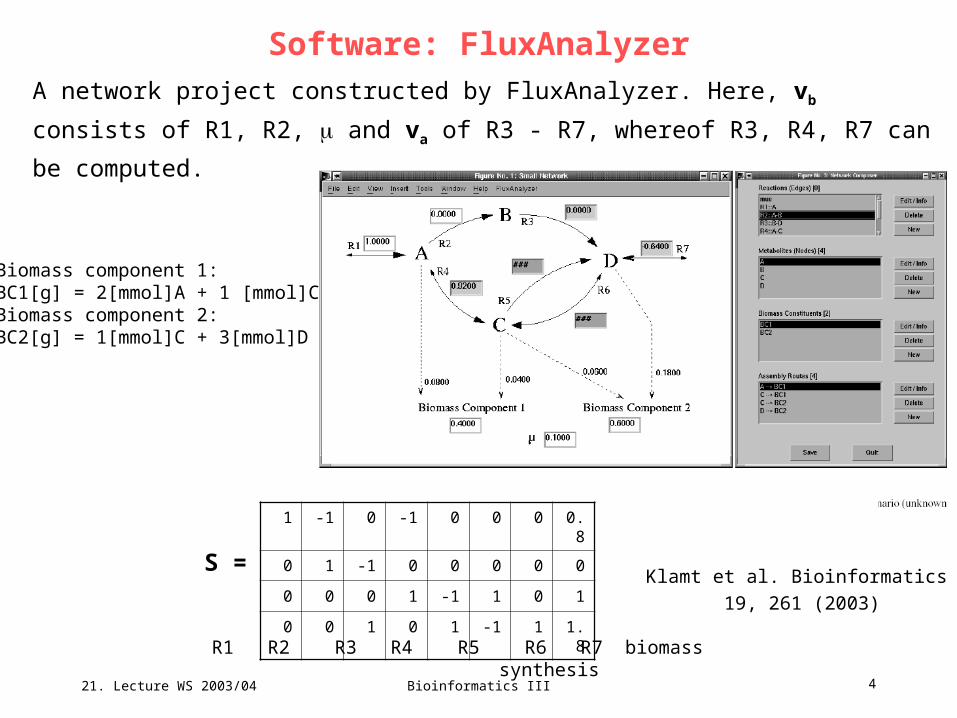
Software: FluxAnalyzerA network project constructed by FluxAnalyzer. Here, vb consists of R1, R2,
and va of R3 - R7, whereof R3, R4, R7 can be computed.
1 -1 0 -1 0 0 0 0.8
0 1 -1 0 0 0 0 0
0 0 0 1 -1 1 0 1
0 0 1 0 1 -1 1 1.8
R1 R2 R3 R4 R5 R6 R7 biomasssynthesis
S =Klamt et al. Bioinformatics
19, 261 (2003)
Biomass component 1:BC1[g] = 2[mmol]A + 1 [mmol]CBiomass component 2:BC2[g] = 1[mmol]C + 3[mmol]D
21. Lecture WS 2003/04
Bioinformatics III 5
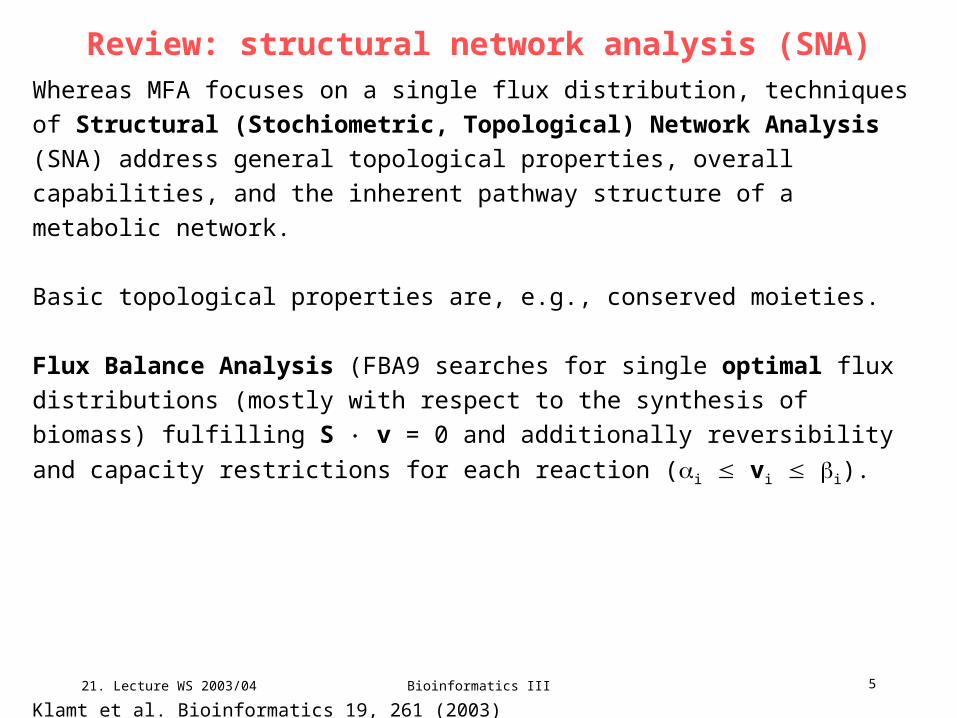
Review: structural network analysis (SNA)Whereas MFA focuses on a single flux distribution, techniques of Structural
(Stochiometric, Topological) Network Analysis (SNA) address general
topological properties, overall capabilities, and the inherent pathway structure of a
metabolic network.
Basic topological properties are, e.g., conserved moieties.
Flux Balance Analysis (FBA9 searches for single optimal flux distributions (mostly
with respect to the synthesis of biomass) fulfilling S v = 0 and additionally
reversibility and capacity restrictions for each reaction (i vi i).
Klamt et al. Bioinformatics 19, 261 (2003)
21. Lecture WS 2003/04
Bioinformatics III 6
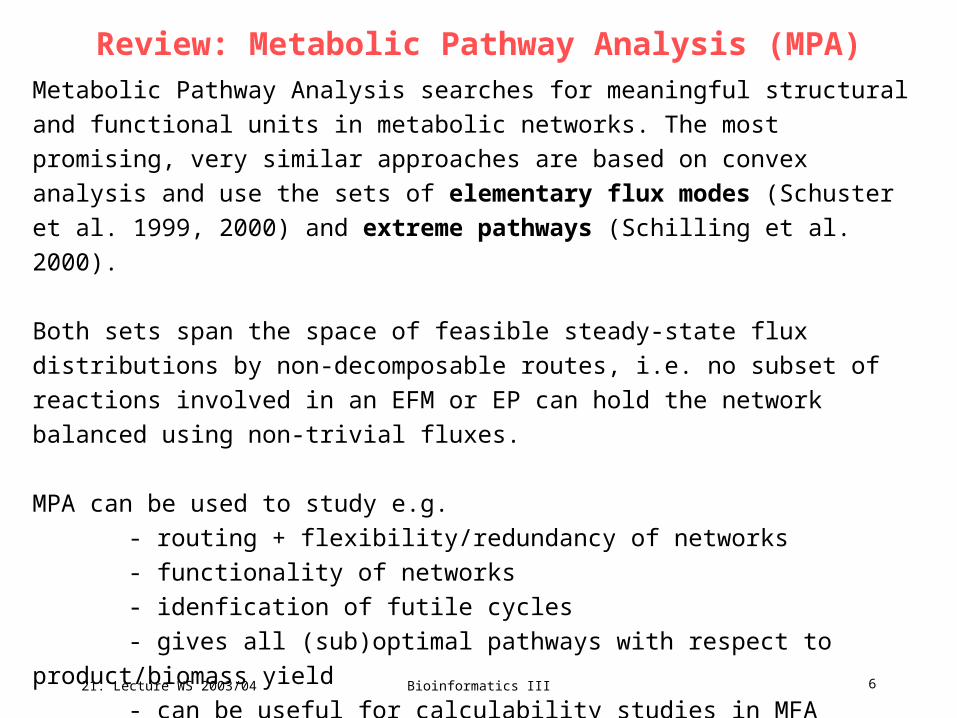
Review: Metabolic Pathway Analysis (MPA)Metabolic Pathway Analysis searches for meaningful structural and functional units
in metabolic networks. The most promising, very similar approaches are based on
convex analysis and use the sets of elementary flux modes (Schuster et al. 1999,
2000) and extreme pathways (Schilling et al. 2000).
Both sets span the space of feasible steady-state flux distributions by non-
decomposable routes, i.e. no subset of reactions involved in an EFM or EP can hold
the network balanced using non-trivial fluxes.
MPA can be used to study e.g.
- routing + flexibility/redundancy of networks
- functionality of networks
- idenfication of futile cycles
- gives all (sub)optimal pathways with respect to product/biomass yield
- can be useful for calculability studies in MFA
Klamt et al. Bioinformatics 19, 261 (2003)

21. Lecture WS 2003/04
Bioinformatics III 7
Elementary Flux ModesStart from list of reaction equations and a declaration of reversible and irreversible
reactions and of internal and external metabolites.
E.g. reaction scheme of monosaccharide Fig.1
metabolism. It includes 15 internal
metabolites, and 19 reactions.
S has dimension 15 19.
It is convenient to reduce this matrix
by lumping those reactions that
necessarily operate together.
{Gap,Pgk,Gpm,Eno,Pyk},
{Zwf,Pgl,Gnd}
Such groups of enzymes can be detected automatically.
This reveals another two sequences {Fba,TpiA} and {2 Rpe,TktI,Tal,TktII}.
Schuster et al. Nature Biotech 18, 326 (2000)
21. Lecture WS 2003/04
Bioinformatics III 8
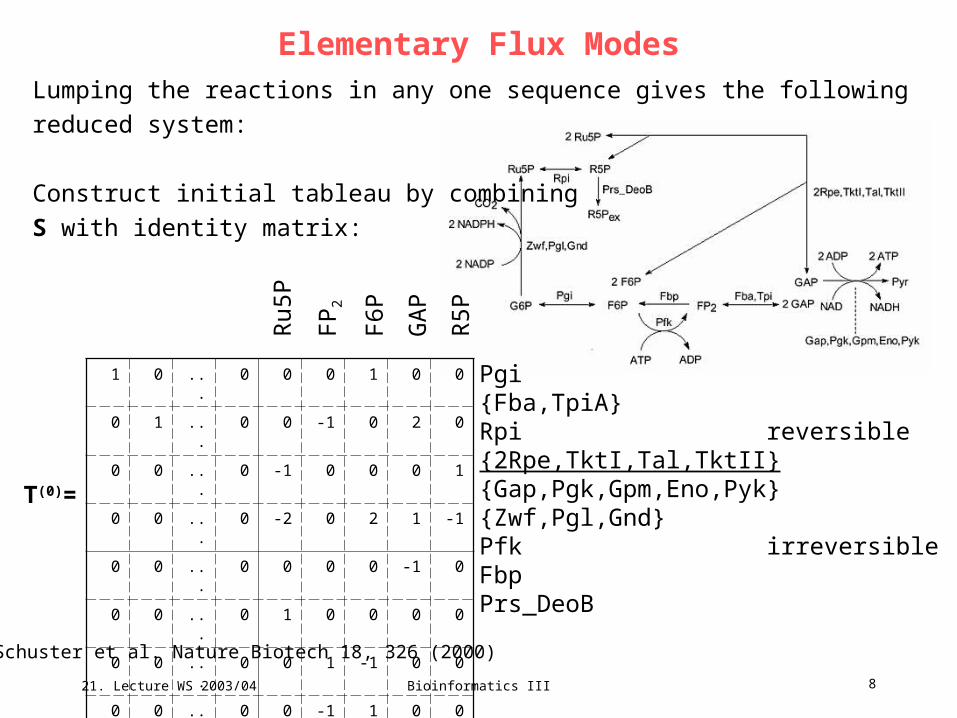
Elementary Flux ModesLumping the reactions in any one sequence gives the following reduced system:
Construct initial tableau by combining
S with identity matrix:
1 0 ... 0 0 0 1 0 0
0 1 ... 0 0 -1 0 2 0
0 0 ... 0 -1 0 0 0 1
0 0 ... 0 -2 0 2 1 -1
0 0 ... 0 0 0 0 -1 0
0 0 ... 0 1 0 0 0 0
0 0 ... 0 0 1 -1 0 0
0 0 ... 0 0 -1 1 0 0
0 0 ... 1 0 0 0 0 -1
Pgi{Fba,TpiA}Rpi reversible{2Rpe,TktI,Tal,TktII}{Gap,Pgk,Gpm,Eno,Pyk}{Zwf,Pgl,Gnd}Pfk irreversibleFbpPrs_DeoB
Schuster et al. Nature Biotech 18, 326 (2000)
Ru5
P
FP
2
F6P
GA
P
R5P
T(0)=
21. Lecture WS 2003/04
Bioinformatics III 9
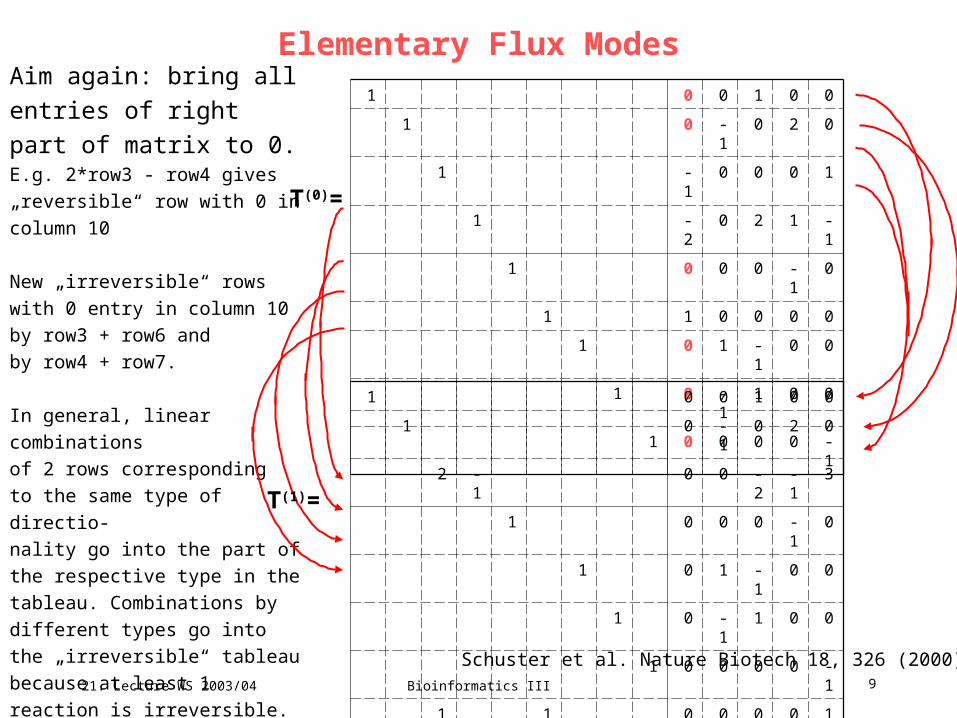
Elementary Flux ModesAim again: bring all entries
of right part of matrix to 0.E.g. 2*row3 - row4 gives
„reversible“ row with 0 in column
10
New „irreversible“ rows with 0 entry
in column 10 by row3 + row6 and
by row4 + row7.
In general, linear combinations
of 2 rows corresponding
to the same type of directio-
nality go into the part of
the respective type in the
tableau. Combinations by
different types go into the
„irreversible“ tableau
because at least 1 reaction is
irreversible. Irreversible reactions
can only combined using positive
coefficients.Schuster et al. Nature Biotech 18, 326 (2000)
1 0 0 1 0 0
1 0 -1 0 2 0
1 -1 0 0 0 1
1 -2 0 2 1 -1
1 0 0 0 -1 0
1 1 0 0 0 0
1 0 1 -1 0 0
1 0 -1 1 0 0
1 0 0 0 0 -1
1 0 0 1 0 0
1 0 -1 0 2 0
2 -1 0 0 -2 -1 3
1 0 0 0 -1 0
1 0 1 -1 0 0
1 0 -1 1 0 0
1 0 0 0 0 -1
1 1 0 0 0 0 1
1 2 0 0 2 1 -1
T(1)=
T(0)=
21. Lecture WS 2003/04
Bioinformatics III 10
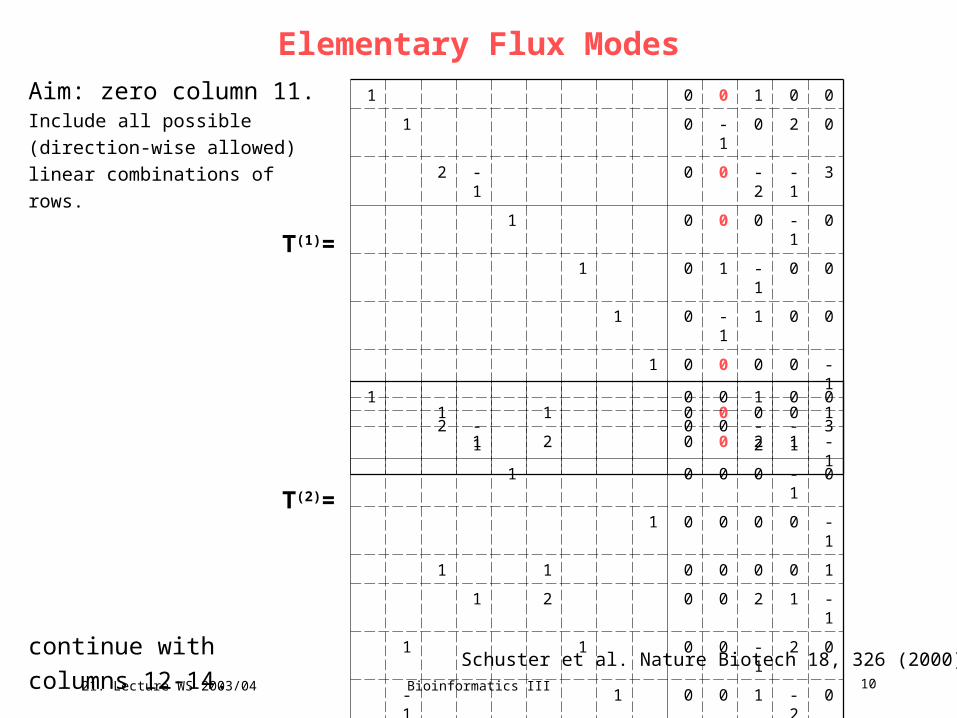
Elementary Flux ModesAim: zero column 11.Include all possible (direction-wise
allowed) linear combinations of
rows.
continue with columns 12-
14. Schuster et al. Nature Biotech 18, 326 (2000)
1 0 0 1 0 0
1 0 -1 0 2 0
2 -1 0 0 -2 -1 3
1 0 0 0 -1 0
1 0 1 -1 0 0
1 0 -1 1 0 0
1 0 0 0 0 -1
1 1 0 0 0 0 1
1 2 0 0 2 1 -1
1 0 0 1 0 0
2 -1 0 0 -2 -1 3
1 0 0 0 -1 0
1 0 0 0 0 -1
1 1 0 0 0 0 1
1 2 0 0 2 1 -1
1 1 0 0 -1 2 0
-1 1 0 0 1 -2 0
1 1 0 0 0 0 0
T(2)=
T(1)=
21. Lecture WS 2003/04
Bioinformatics III 11
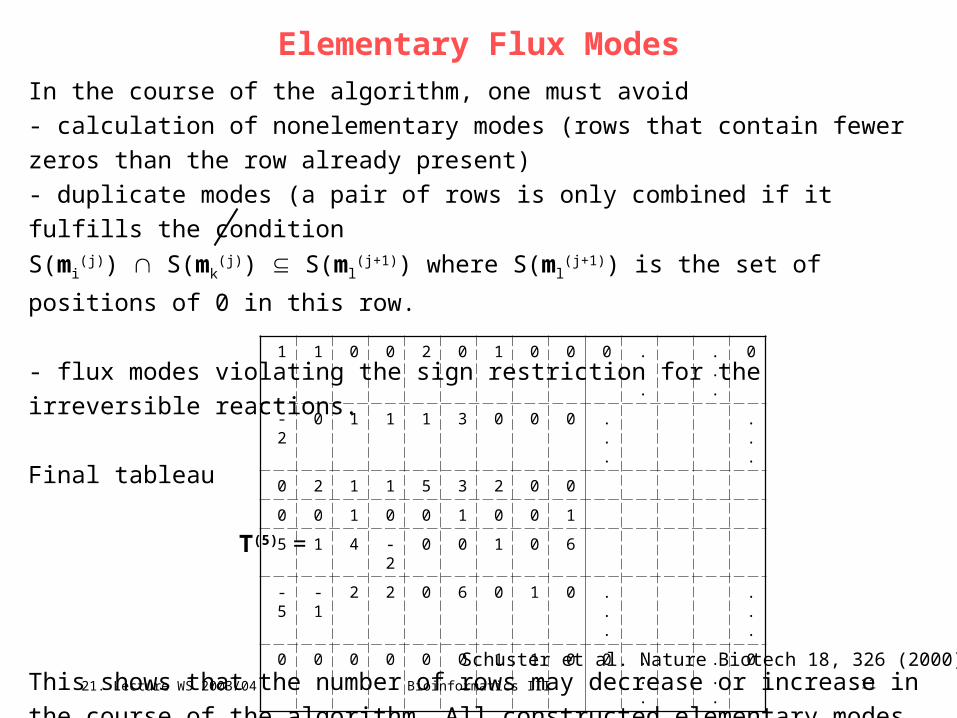
Elementary Flux ModesIn the course of the algorithm, one must avoid
- calculation of nonelementary modes (rows that contain fewer zeros than the row
already present)
- duplicate modes (a pair of rows is only combined if it fulfills the condition
S(mi(j)) S(mk
(j)) S(ml(j+1)) where S(ml
(j+1)) is the set of positions of 0 in this row.
- flux modes violating the sign restriction for the irreversible reactions.
Final tableau
T(5) =
This shows that the number of rows may decrease or increase in the course of the
algorithm. All constructed elementary modes are irreversible.
Schuster et al. Nature Biotech 18, 326 (2000)
1 1 0 0 2 0 1 0 0 0 ... ... 0
-2 0 1 1 1 3 0 0 0 ... ...
0 2 1 1 5 3 2 0 0
0 0 1 0 0 1 0 0 1
5 1 4 -2 0 0 1 0 6
-5 -1 2 2 0 6 0 1 0 ... ...
0 0 0 0 0 0 1 1 0 0 ... ... 0
21. Lecture WS 2003/04
Bioinformatics III 12
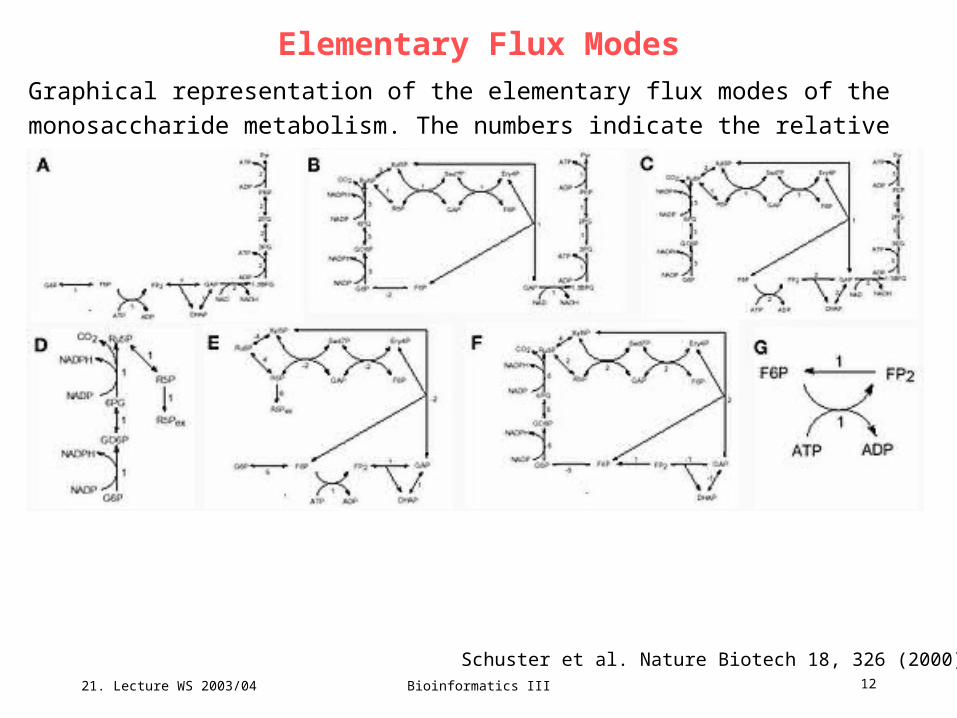
Elementary Flux ModesGraphical representation of the elementary flux modes of the monosaccharide
metabolism. The numbers indicate the relative flux carried by the enzymes.
Fig. 2
Schuster et al. Nature Biotech 18, 326 (2000)
21. Lecture WS 2003/04
Bioinformatics III 13
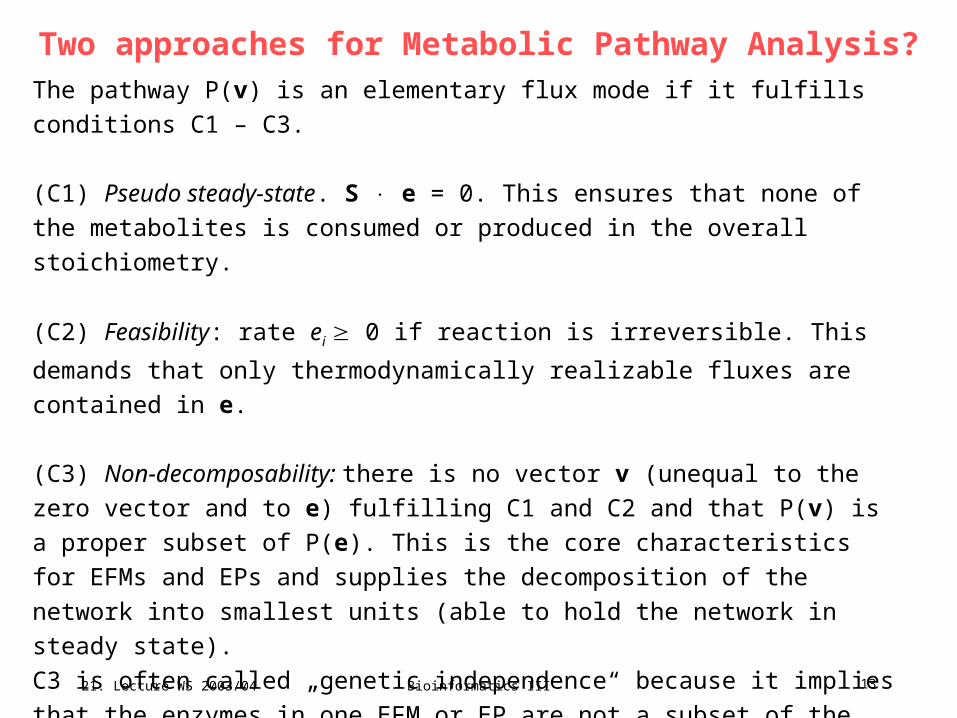
Two approaches for Metabolic Pathway Analysis?The pathway P(v) is an elementary flux mode if it fulfills conditions C1 – C3.
(C1) Pseudo steady-state. S e = 0. This ensures that none of the metabolites is
consumed or produced in the overall stoichiometry.
(C2) Feasibility: rate ei 0 if reaction is irreversible. This demands that only
thermodynamically realizable fluxes are contained in e.
(C3) Non-decomposability: there is no vector v (unequal to the zero vector and to
e) fulfilling C1 and C2 and that P(v) is a proper subset of P(e). This is the core
characteristics for EFMs and EPs and supplies the decomposition of the network
into smallest units (able to hold the network in steady state).
C3 is often called „genetic independence“ because it implies that the enzymes in
one EFM or EP are not a subset of the enzymes from another EFM or EP.
Klamt & Stelling Trends Biotech 21, 64 (2003)
21. Lecture WS 2003/04
Bioinformatics III 14
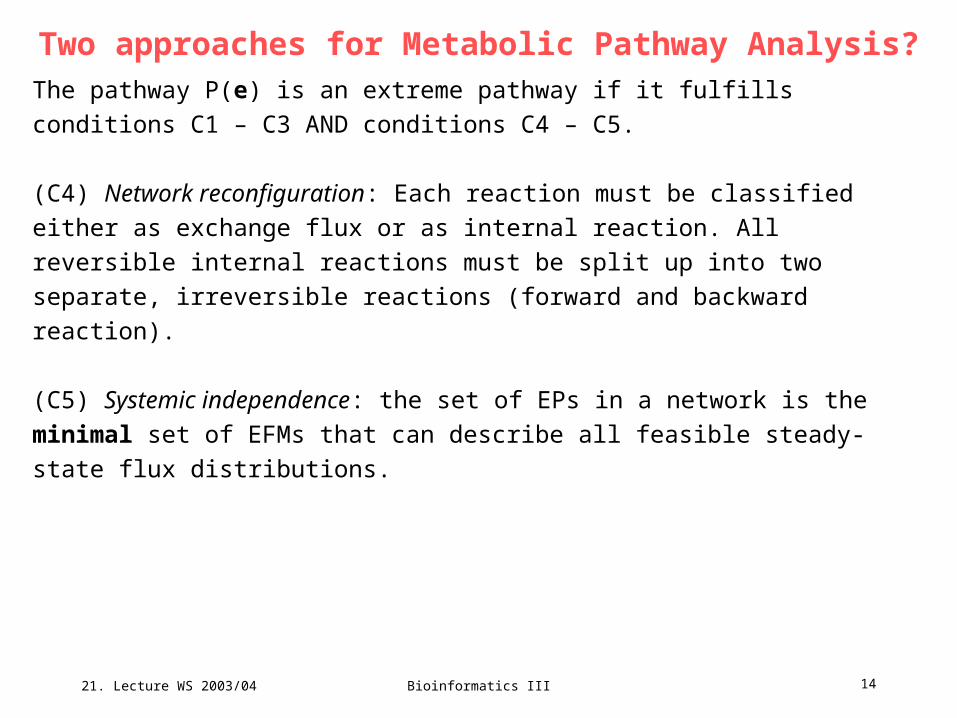
Two approaches for Metabolic Pathway Analysis?The pathway P(e) is an extreme pathway if it fulfills conditions C1 – C3 AND
conditions C4 – C5.
(C4) Network reconfiguration: Each reaction must be classified either as exchange
flux or as internal reaction. All reversible internal reactions must be split up into
two separate, irreversible reactions (forward and backward reaction).
(C5) Systemic independence: the set of EPs in a network is the minimal set of
EFMs that can describe all feasible steady-state flux distributions.
Klamt & Stelling Trends Biotech 21, 64 (2003)
21. Lecture WS 2003/04
Bioinformatics III 15
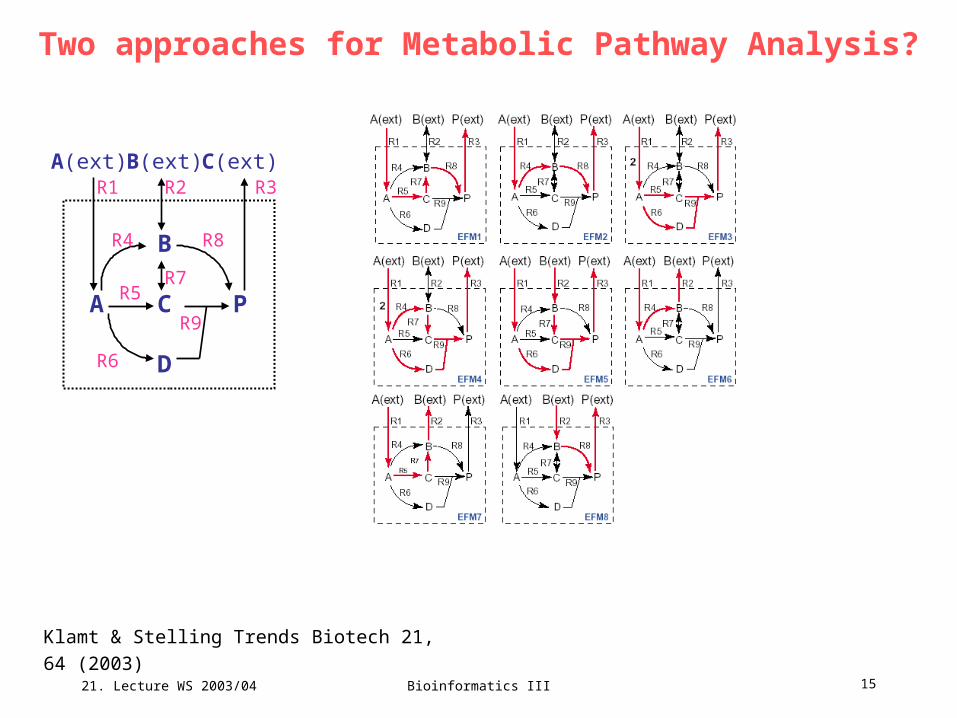
Two approaches for Metabolic Pathway Analysis?
Klamt & Stelling Trends Biotech 21, 64 (2003)
A C P
B
D
A(ext) B(ext) C(ext)R1 R2 R3
R5
R4 R8
R9
R6
R7
21. Lecture WS 2003/04
Bioinformatics III 16
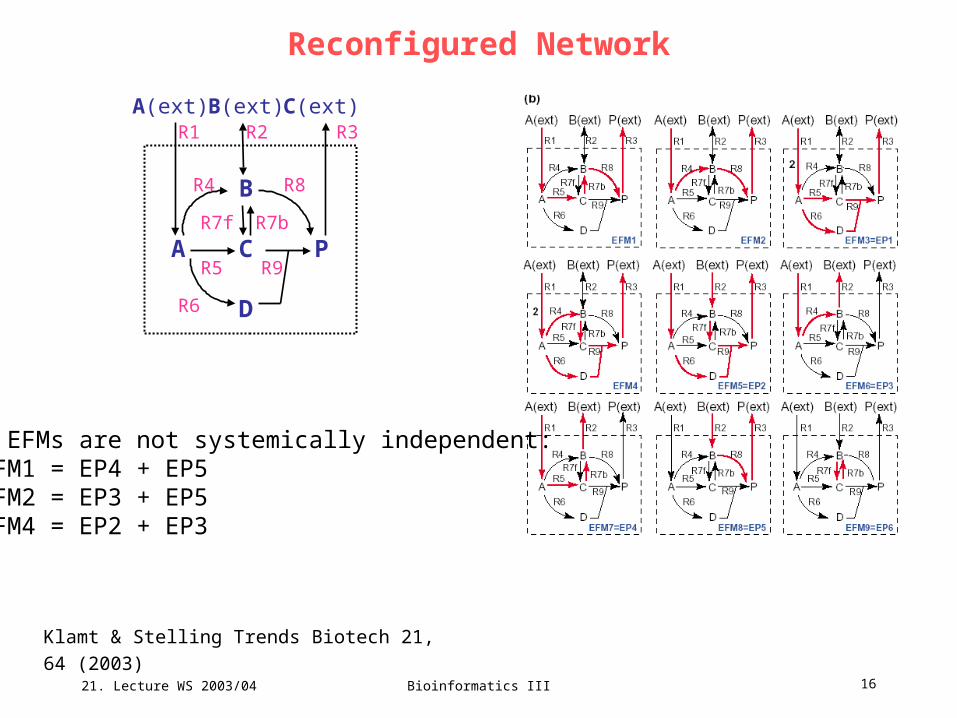
Reconfigured Network
Klamt & Stelling Trends Biotech 21, 64 (2003)
A C P
B
D
A(ext) B(ext) C(ext)R1 R2 R3
R5
R4 R8
R9
R6
R7bR7f
3 EFMs are not systemically independent:EFM1 = EP4 + EP5EFM2 = EP3 + EP5EFM4 = EP2 + EP3

21. Lecture WS 2003/04
Bioinformatics III 17
Property 1 of EFMs
Klamt & Stelling Trends Biotech 21, 64 (2003)
The only difference in the set of EFMs emerging upon reconfiguration consists in
the two-cycles that result from splitting up reversible reactions. However, two-cycles
are not considered as meaningful pathways.
Valid for any network: Property 1
Reconfiguring a network by splitting up reversible reactions leads to the same set of
meaningful EFMs.
21. Lecture WS 2003/04
Bioinformatics III 18
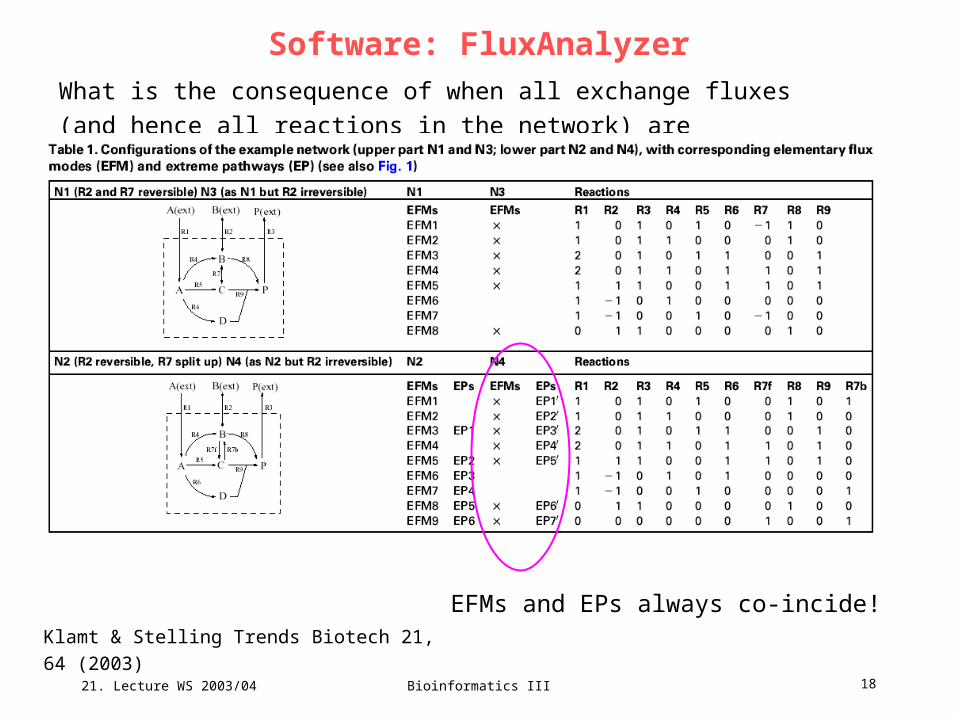
Software: FluxAnalyzerWhat is the consequence of when all exchange fluxes (and hence all
reactions in the network) are irreversible?
Klamt & Stelling Trends Biotech 21, 64 (2003)
EFMs and EPs always co-incide!
21. Lecture WS 2003/04
Bioinformatics III 19
Property 2 of EFMs
Klamt & Stelling Trends Biotech 21, 64 (2003)
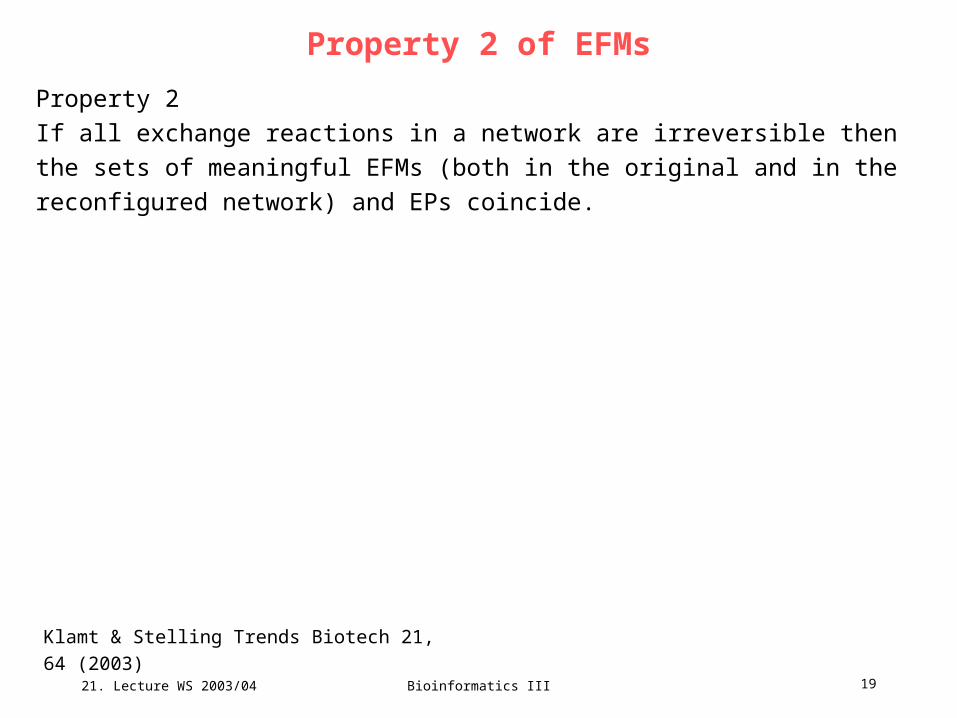
Property 2
If all exchange reactions in a network are irreversible then the sets of meaningful
EFMs (both in the original and in the reconfigured network) and EPs coincide.

21. Lecture WS 2003/04
Bioinformatics III 20
Reconfigured Network
Klamt & Stelling Trends Biotech 21, 64 (2003)
A C P
B
D
A(ext) B(ext) C(ext)R1 R2 R3
R5
R4 R8
R9
R6
R7bR7f
3 EFMs are not systemically independent:EFM1 = EP4 + EP5EFM2 = EP3 + EP5EFM4 = EP2 + EP3
21. Lecture WS 2003/04
Bioinformatics III 21
Comparison of EFMs and EPs
Klamt & Stelling Trends Biotech 21, 64 (2003)
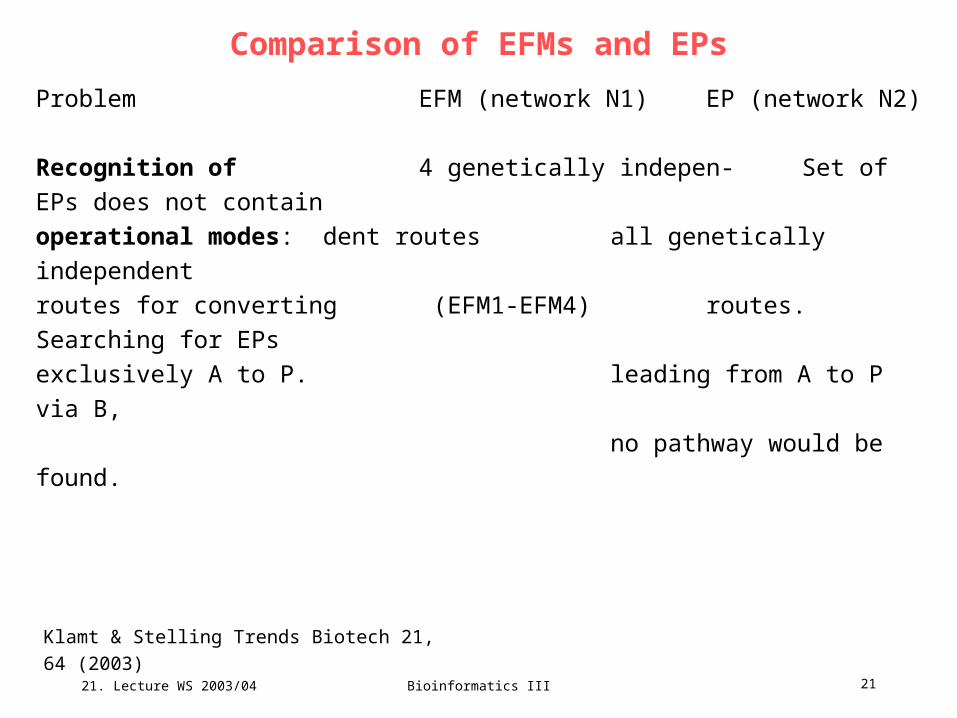
Problem EFM (network N1) EP (network N2)
Recognition of 4 genetically indepen- Set of EPs does not contain
operational modes: dent routes all genetically independent
routes for converting (EFM1-EFM4) routes. Searching for EPs
exclusively A to P. leading from A to P via B,
no pathway would be found.

21. Lecture WS 2003/04
Bioinformatics III 22
Comparison of EFMs and EPs
Klamt & Stelling Trends Biotech 21, 64 (2003)
Problem EFM (network N1) EP (network N2)
Finding all the EFM1 and EFM2 are One would only find the
optimal routes: optimal because they suboptimal EP1, not the
optimal pathways for yield one mole P per optimal routes EFM1 and
synthesizing P during mole substrate A EFM2.
growth on A alone. (i.e. R3/R1 = 1),
whereas EFM3 and
EFM4 are only sub-
optimal (R3/R1 = 0.5).
21. Lecture WS 2003/04
Bioinformatics III 23
Comparison of EFMs and EPs
Klamt & Stelling Trends Biotech 21, 64 (2003)
EFM (network N1)
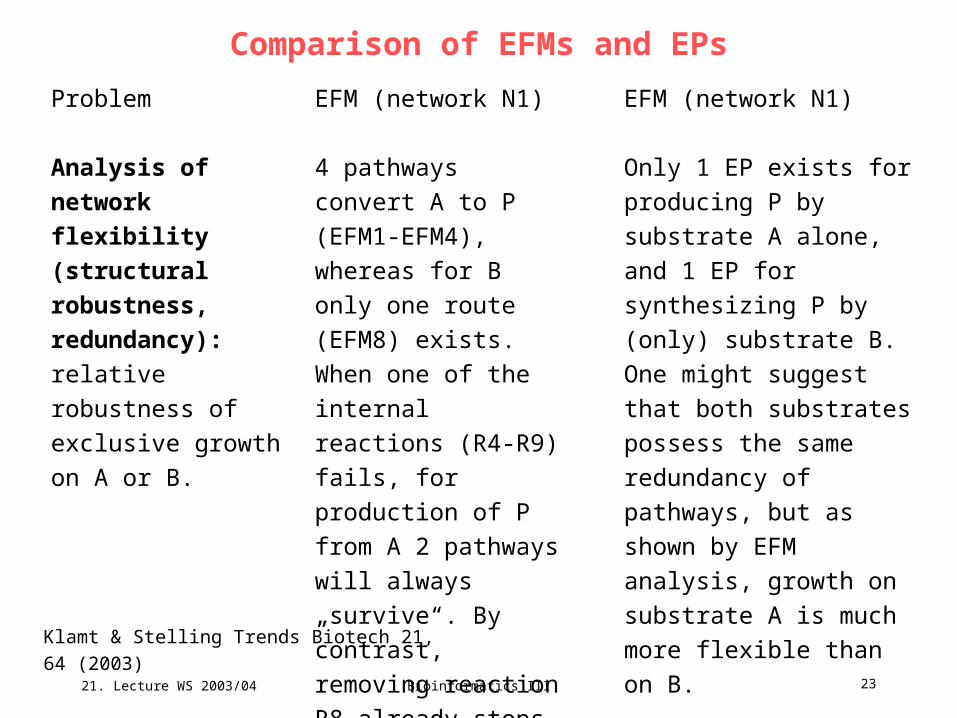
4 pathways convert A
to P (EFM1-EFM4),
whereas for B only one
route (EFM8) exists.
When one of the
internal reactions (R4-
R9) fails, for production
of P from A 2 pathways
will always „survive“. By
contrast, removing
reaction R8 already
stops the production of
P from B alone.
EFM (network N1)
Only 1 EP exists for
producing P by substrate A
alone, and 1 EP for
synthesizing P by (only)
substrate B. One might
suggest that both
substrates possess the
same redundancy of
pathways, but as shown by
EFM analysis, growth on
substrate A is much more
flexible than on B.
Problem
Analysis of network
flexibility (structural
robustness,
redundancy):
relative robustness of
exclusive growth on
A or B.
21. Lecture WS 2003/04
Bioinformatics III 24
Comparison of EFMs and EPs
Klamt & Stelling Trends Biotech 21, 64 (2003)
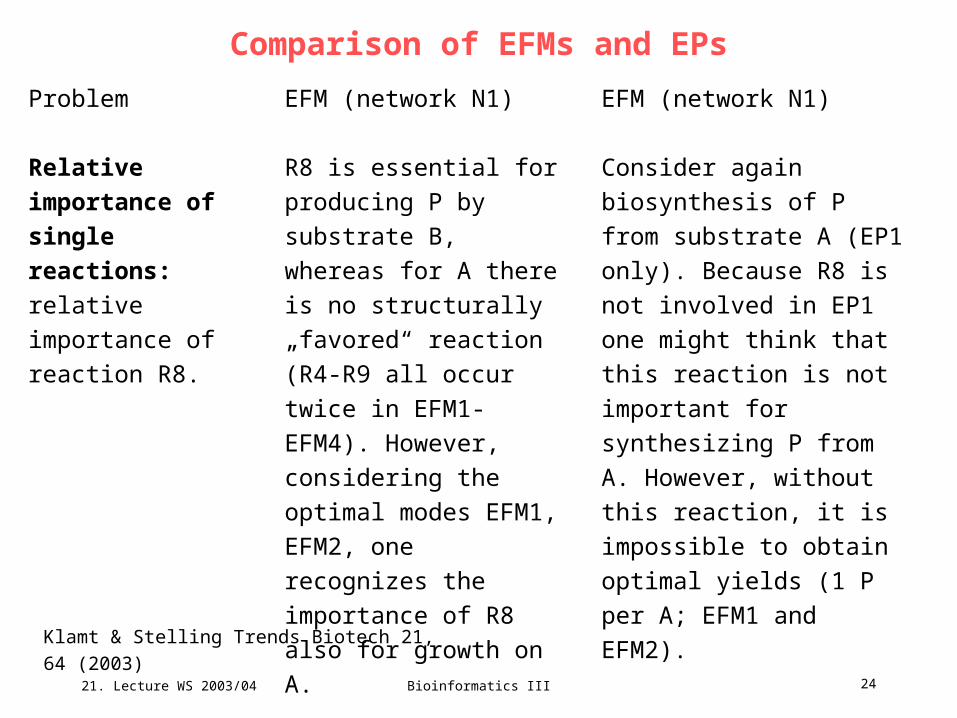
EFM (network N1)
R8 is essential for
producing P by substrate
B, whereas for A there is
no structurally „favored“
reaction (R4-R9 all occur
twice in EFM1-EFM4).
However, considering the
optimal modes EFM1,
EFM2, one recognizes the
importance of R8 also for
growth on A.
EFM (network N1)
Consider again biosynthesis
of P from substrate A (EP1
only). Because R8 is not
involved in EP1 one might
think that this reaction is not
important for synthesizing P
from A. However, without this
reaction, it is impossible to
obtain optimal yields (1 P per
A; EFM1 and EFM2).
Problem
Relative importance
of single reactions:
relative importance of
reaction R8.
21. Lecture WS 2003/04
Bioinformatics III 25
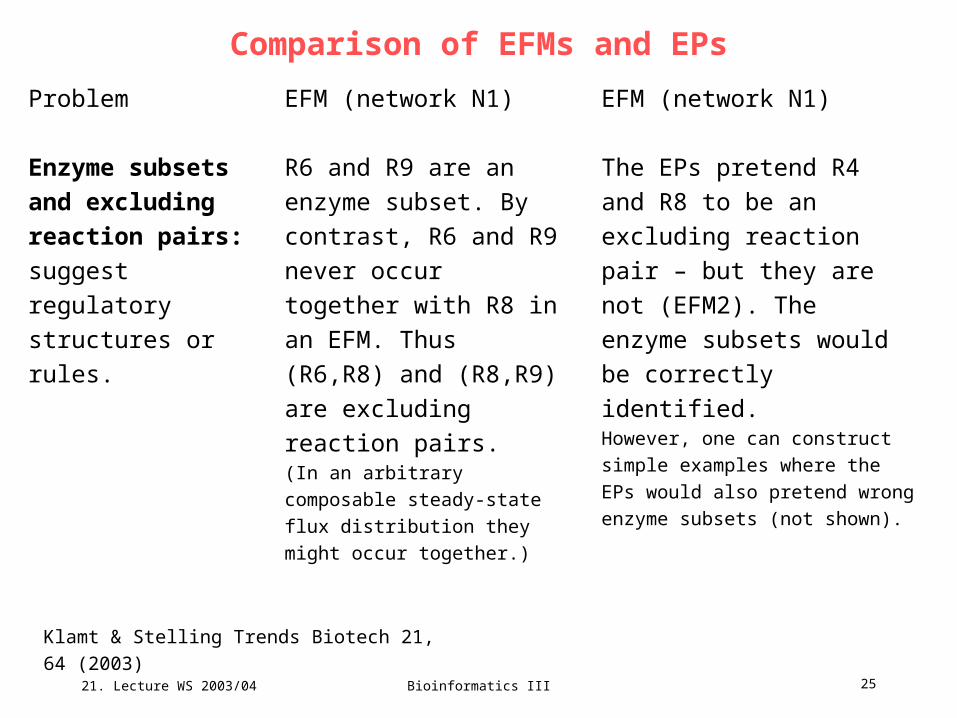
Comparison of EFMs and EPs
Klamt & Stelling Trends Biotech 21, 64 (2003)
EFM (network N1)
R6 and R9 are an enzyme
subset. By contrast, R6
and R9 never occur
together with R8 in an
EFM. Thus (R6,R8) and
(R8,R9) are excluding
reaction pairs.(In an arbitrary composable
steady-state flux distribution they
might occur together.)
EFM (network N1)
The EPs pretend R4 and R8
to be an excluding reaction
pair – but they are not
(EFM2). The enzyme
subsets would be correctly
identified. However, one can construct simple
examples where the EPs would also
pretend wrong enzyme subsets (not
shown).
Problem
Enzyme subsets
and excluding
reaction pairs:
suggest regulatory
structures or rules.
21. Lecture WS 2003/04
Bioinformatics III 26
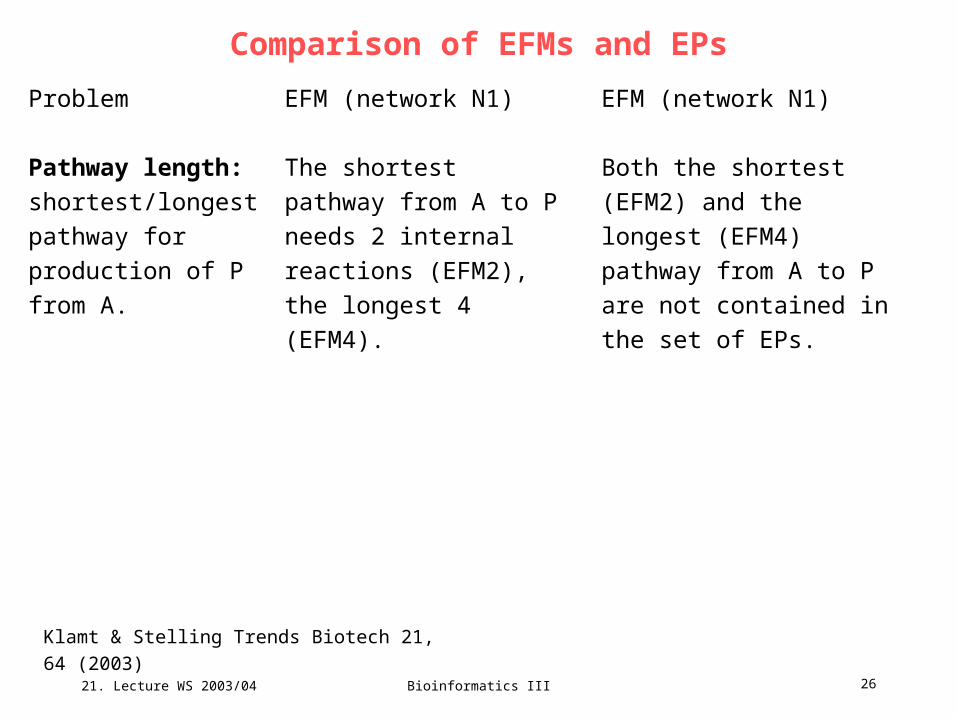
Comparison of EFMs and EPs
Klamt & Stelling Trends Biotech 21, 64 (2003)
EFM (network N1)
The shortest pathway
from A to P needs 2
internal reactions (EFM2),
the longest 4 (EFM4).
EFM (network N1)
Both the shortest (EFM2)
and the longest (EFM4)
pathway from A to P are not
contained in the set of EPs.
Problem
Pathway length:
shortest/longest
pathway for
production of P from
A.
21. Lecture WS 2003/04
Bioinformatics III 27
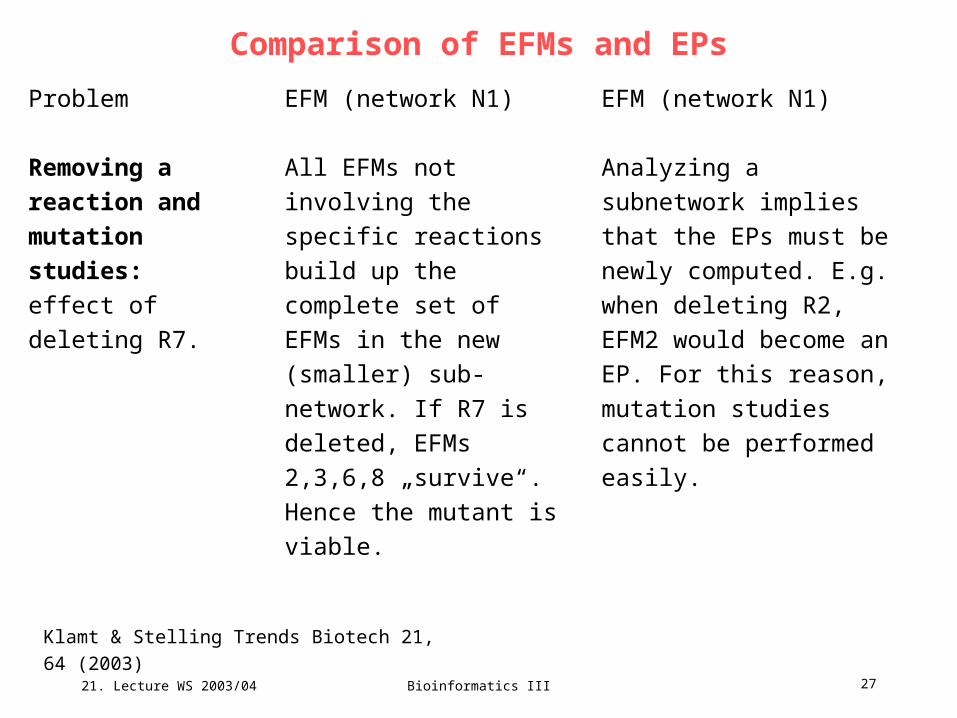
Comparison of EFMs and EPs
Klamt & Stelling Trends Biotech 21, 64 (2003)
EFM (network N1)
All EFMs not involving the
specific reactions build up
the complete set of EFMs
in the new (smaller) sub-
network. If R7 is deleted,
EFMs 2,3,6,8 „survive“.
Hence the mutant is
viable.
EFM (network N1)
Analyzing a subnetwork
implies that the EPs must be
newly computed. E.g. when
deleting R2, EFM2 would
become an EP. For this
reason, mutation studies
cannot be performed easily.
Problem
Removing a
reaction and
mutation studies:
effect of deleting R7.
21. Lecture WS 2003/04
Bioinformatics III 28
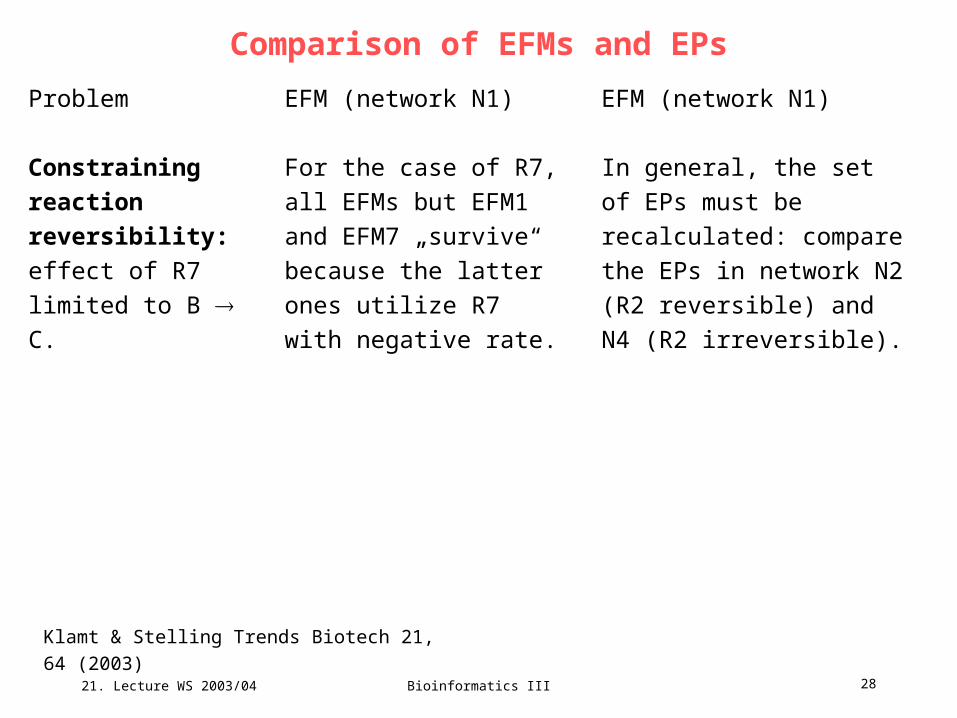
Comparison of EFMs and EPs
Klamt & Stelling Trends Biotech 21, 64 (2003)
EFM (network N1)
For the case of R7, all
EFMs but EFM1 and
EFM7 „survive“ because
the latter ones utilize R7
with negative rate.
EFM (network N1)
In general, the set of EPs
must be recalculated:
compare the EPs in network
N2 (R2 reversible) and N4
(R2 irreversible).
Problem
Constraining
reaction
reversibility:
effect of R7 limited to
B C.
21. Lecture WS 2003/04
Bioinformatics III 29
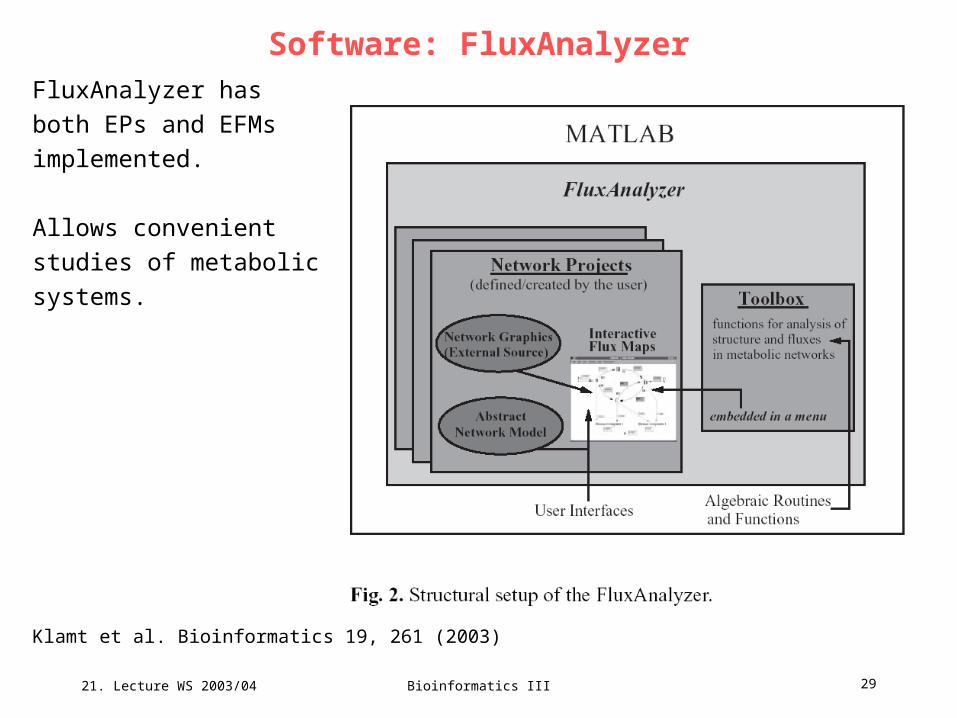
Software: FluxAnalyzerFluxAnalyzer has
both EPs and EFMs
implemented.
Allows convenient
studies of metabolic
systems.
Klamt et al. Bioinformatics 19, 261 (2003)
21. Lecture WS 2003/04
Bioinformatics III 30
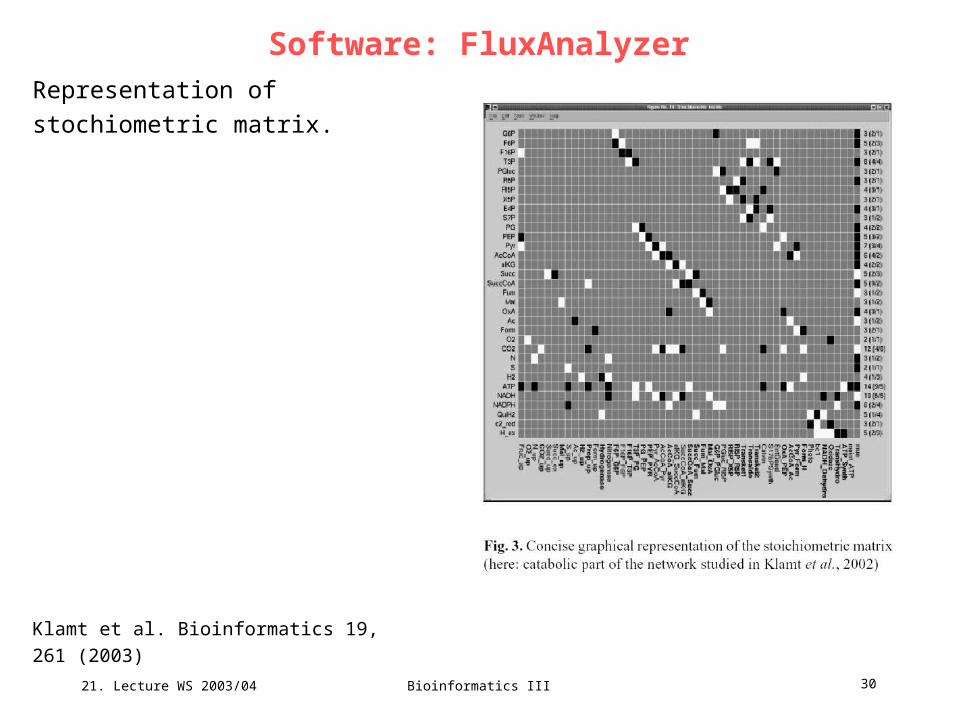
Software: FluxAnalyzerRepresentation of stochiometric
matrix.
Klamt et al. Bioinformatics 19, 261 (2003)
21. Lecture WS 2003/04
Bioinformatics III 31
Application of elementary modesMetabolic network structure of E.coli determines
key aspects of functionality and regulation
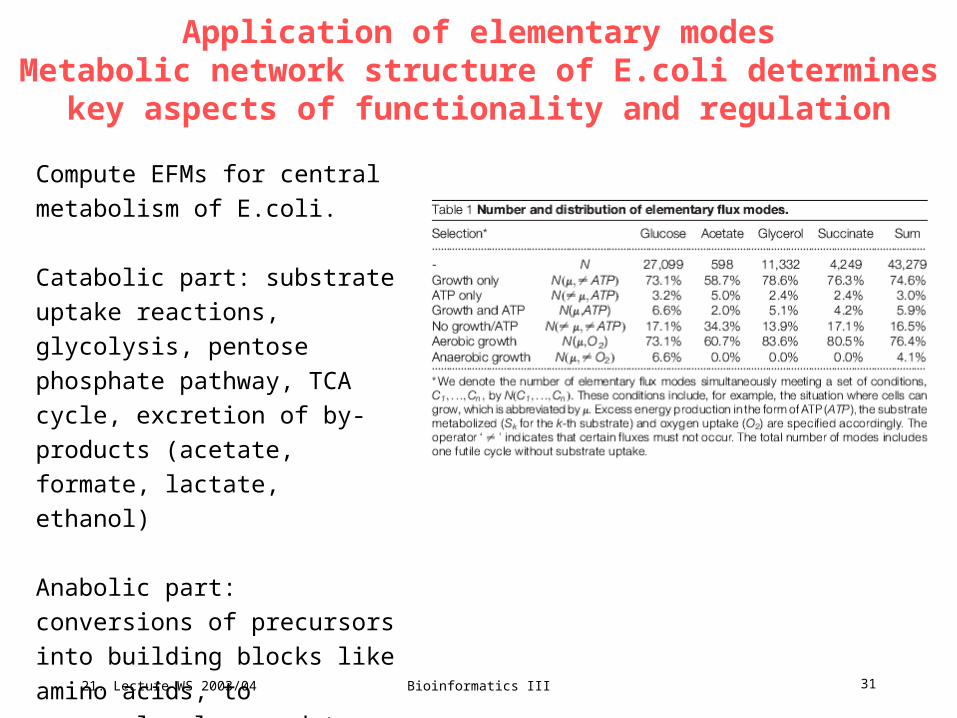
Compute EFMs for central
metabolism of E.coli.
Catabolic part: substrate uptake
reactions, glycolysis, pentose
phosphate pathway, TCA cycle,
excretion of by-products (acetate,
formate, lactate, ethanol)
Anabolic part: conversions of
precursors into building blocks like
amino acids, to macromolecules,
and to biomass.
Stelling et al. Nature 420, 190 (2002)
21. Lecture WS 2003/04
Bioinformatics III 32
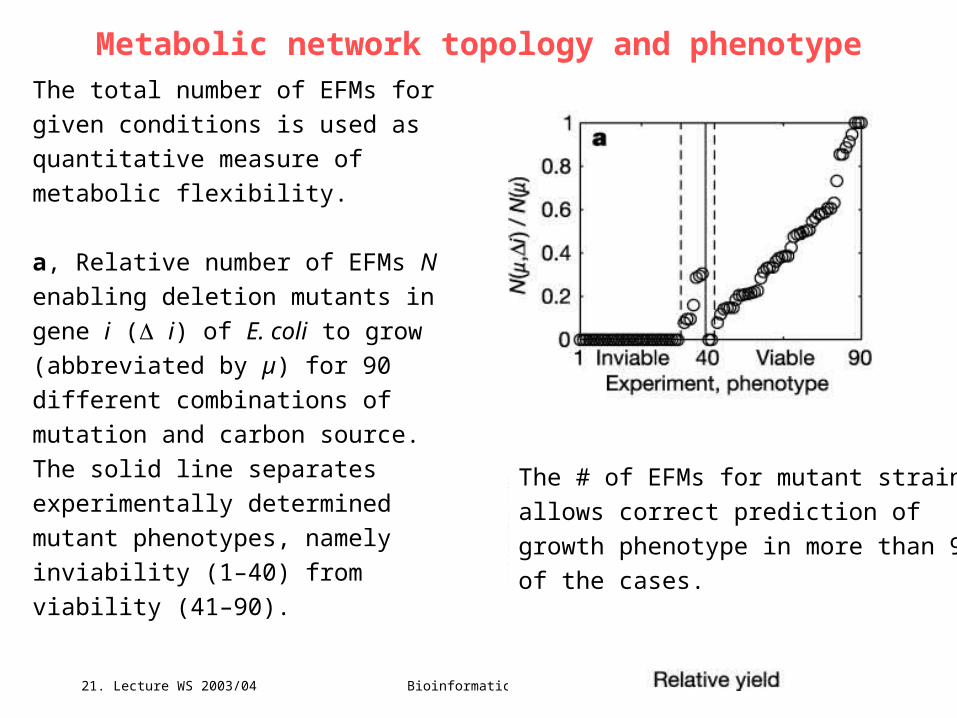
Metabolic network topology and phenotypeThe total number of EFMs for given
conditions is used as quantitative
measure of metabolic flexibility.
a, Relative number of EFMs N enabling
deletion mutants in gene i ( i) of E. coli
to grow (abbreviated by µ) for 90 different
combinations of mutation and carbon
source. The solid line separates
experimentally determined mutant
phenotypes, namely inviability (1–40)
from viability (41–90).
Stelling et al. Nature 420, 190 (2002)
The # of EFMs for mutant strain
allows correct prediction of
growth phenotype in more than 90%
of the cases.
21. Lecture WS 2003/04
Bioinformatics III 33
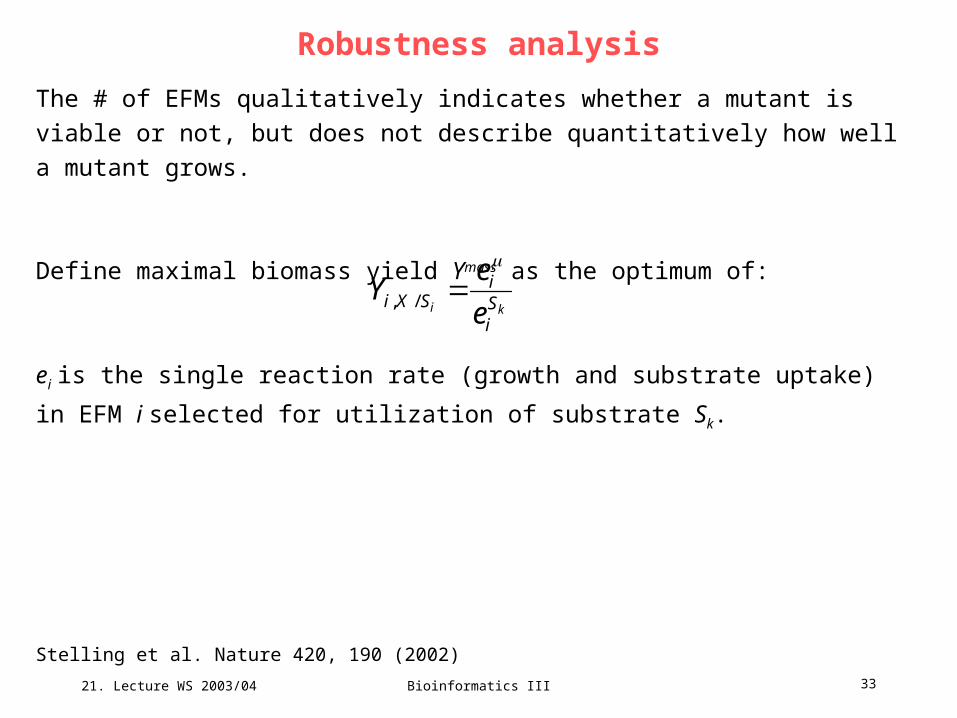
Robustness analysis
The # of EFMs qualitatively indicates whether a mutant is viable or not, but does
not describe quantitatively how well a mutant grows.
Define maximal biomass yield Ymass as the optimum of:
ei is the single reaction rate (growth and substrate uptake) in EFM i selected for
utilization of substrate Sk.
Stelling et al. Nature 420, 190 (2002)
ki Si
iSXi e
eY
/,
21. Lecture WS 2003/04
Bioinformatics III 34
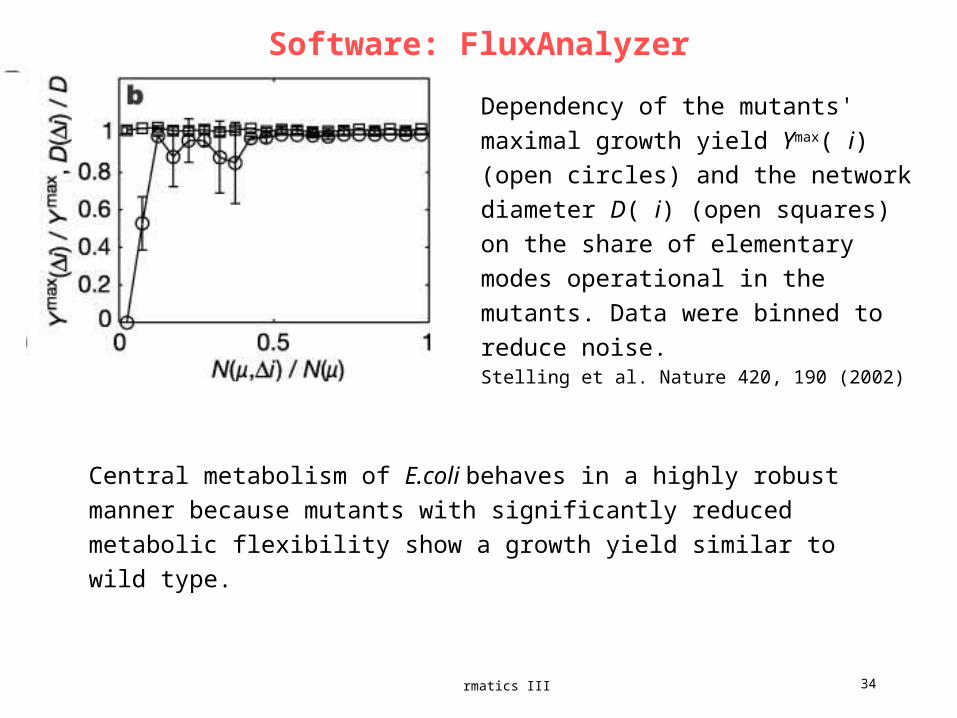
Software: FluxAnalyzer
Dependency of the mutants' maximal
growth yield Ymax( i) (open circles) and the
network diameter D( i) (open squares) on
the share of elementary modes
operational in the mutants. Data were
binned to reduce noise. Stelling et al. Nature 420, 190 (2002)
Central metabolism of E.coli behaves in a highly robust manner because
mutants with significantly reduced metabolic flexibility show a growth yield
similar to wild type.
21. Lecture WS 2003/04
Bioinformatics III 35
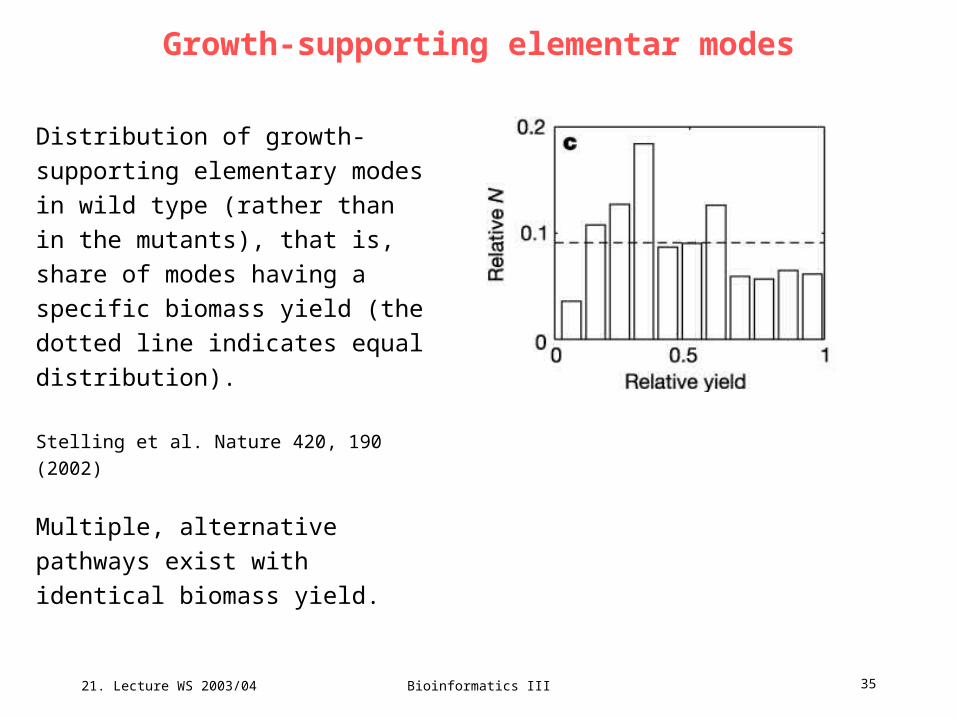
Distribution of growth-supporting
elementary modes in wild type (rather
than in the mutants), that is, share of
modes having a specific biomass
yield (the dotted line indicates equal
distribution).
Stelling et al. Nature 420, 190 (2002)
Multiple, alternative pathways exist
with identical biomass yield.
Growth-supporting elementar modes
21. Lecture WS 2003/04
Bioinformatics III 36
Assume that optimization during biological evolution can be characterized by the
two objectives of flexibility (associated with robustness) and of efficiency.
Flexibility means the ability to adapt to a wide range of environmental conditions,
that is, to realize a maximal bandwidth of thermodynamically feasible flux
distributions (maximizing # of EFMs).
Efficiency could be defined as fulfilment of cellular demands with an optimal
outcome such as maximal cell growth using a minimum of constitutive elements
(genes and proteins, thus minimizing # EFMs).
These 2 criteria pose contradictory challenges.
Optimal cellular regulation needs to find a trade-off.
Can regulation be predicted by EFM analysis?
Stelling et al. Nature 420, 190 (2002)
21. Lecture WS 2003/04
Bioinformatics III 37
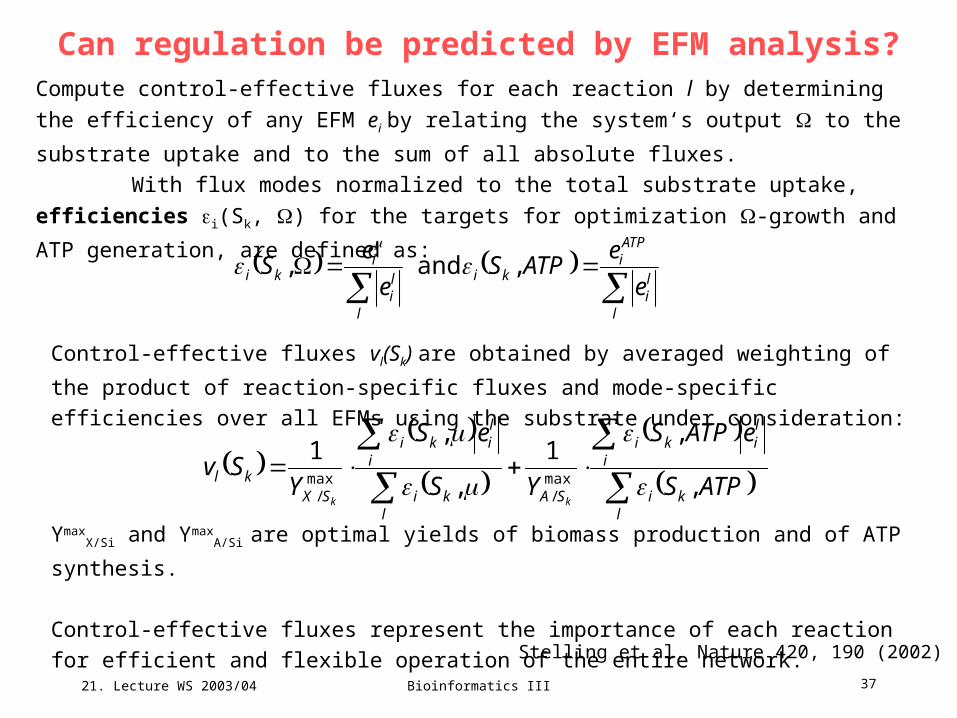
Compute control-effective fluxes for each reaction l by determining the efficiency of any EFM
ei by relating the system‘s output to the substrate uptake and to the sum of all absolute
fluxes.
With flux modes normalized to the total substrate uptake, efficiencies i(Sk, ) for
the targets for optimization -growth and ATP generation, are defined as:
Can regulation be predicted by EFM analysis?
Stelling et al. Nature 420, 190 (2002)
l
li
ATPi
ki
l
li
iki
e
eATPS
e
eS ,and,
Control-effective fluxes vl(Sk) are obtained by averaged weighting of the product of reaction-
specific fluxes and mode-specific efficiencies over all EFMs using the substrate under
consideration:
lki
i
liki
SAl
ki
i
liki
SXkl ATPS
eATPS
YS
eS
YSv
kk,
,1
,
,1
max/
max/
YmaxX/Si and Ymax
A/Si are optimal yields of biomass production and of ATP synthesis.
Control-effective fluxes represent the importance of each reaction for efficient and flexible
operation of the entire network.
21. Lecture WS 2003/04
Bioinformatics III 38
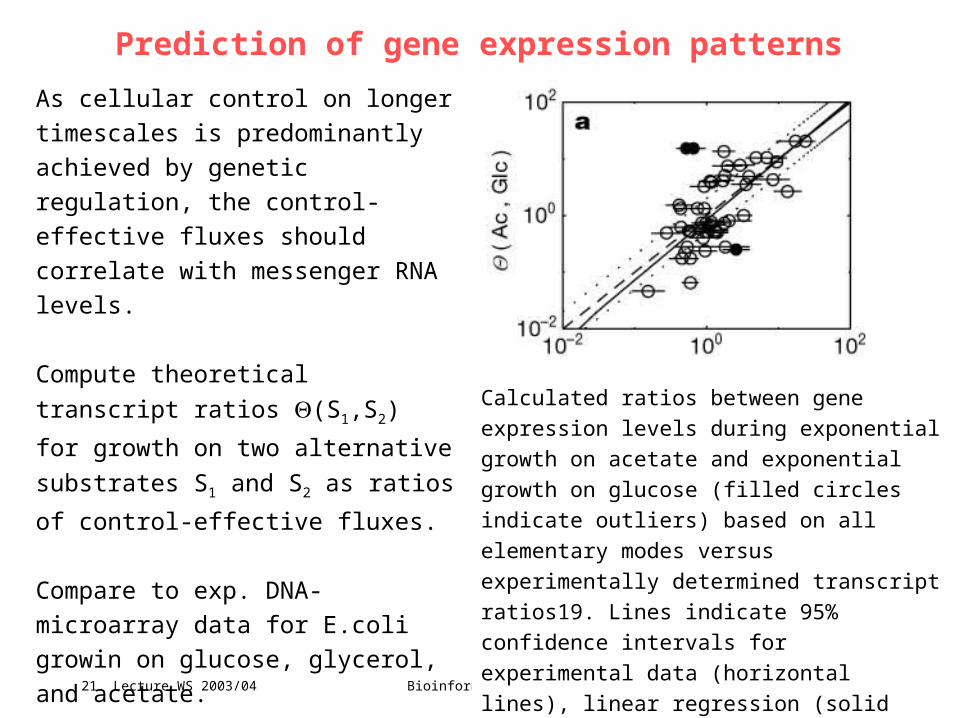
Prediction of gene expression patterns
As cellular control on longer timescales
is predominantly achieved by genetic
regulation, the control-effective fluxes
should correlate with messenger RNA
levels.
Compute theoretical transcript ratios
(S1,S2) for growth on two alternative
substrates S1 and S2 as ratios of
control-effective fluxes.
Compare to exp. DNA-microarray data
for E.coli growin on glucose, glycerol,
and acetate.
Excellent correlation!Stelling et al. Nature 420, 190 (2002)
Calculated ratios between gene expression levels
during exponential growth on acetate and
exponential growth on glucose (filled circles
indicate outliers) based on all elementary modes
versus experimentally determined transcript
ratios19. Lines indicate 95% confidence intervals
for experimental data (horizontal lines), linear
regression (solid line), perfect match (dashed
line) and two-fold deviation (dotted line).
21. Lecture WS 2003/04
Bioinformatics III 39
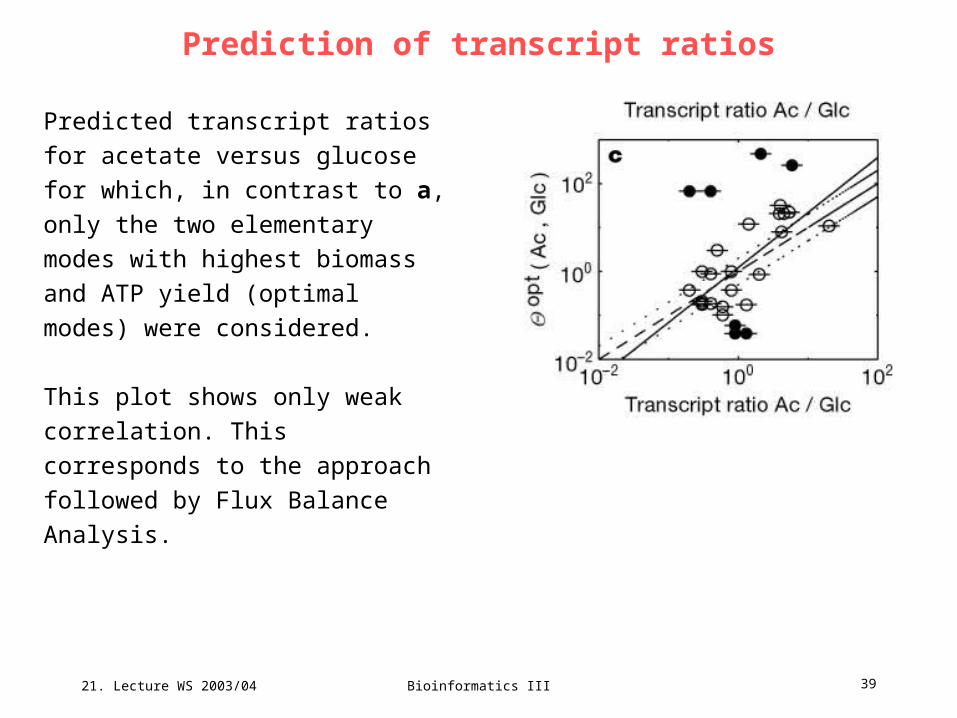
Predicted transcript ratios for acetate
versus glucose for which, in contrast to
a, only the two elementary modes with
highest biomass and ATP yield
(optimal modes) were considered.
This plot shows only weak correlation.
This corresponds to the approach
followed by Flux Balance Analysis.
Stelling et al. Nature 420, 190 (2002)
Prediction of transcript ratios

21. Lecture WS 2003/04
Bioinformatics III 40
SummaryEFM are a robust method that offers great opportunities for studying functional and
structural properties in metabolic networks.
Klamt & Stelling suggest that the term „elementary flux modes“ should be used
whenever the sets of EFMs and EPs are identical.
In cases where they don‘t, EPs are a subset of EFMs.
It remains to be understood more thoroughly how much valuable information about
the pathway structure is lost by using EPs.
Ongoing Challenges:
- study really large metabolic systems by subdividing them
- combine metabolic model with model of cellular regulation.
Klamt & Stelling Trends Biotech 21, 64 (2003)


![[Christina Smolke] the Metabolic Pathway Engineeri(BookFi.org)](https://img.pdfslide.net/doc/110x75/563db9c0550346aa9a9f9818/christina-smolke-the-metabolic-pathway-engineeribookfiorg.jpg)