Embed Size (px)
Citation preview
Can Metabolomics Be Used for Short and Long Term Dietary and Nutritional Assessment?
Preliminary Results From Proof of Concept Projects
Western Human Nutrition Research Center430 West Health Sciences Dr., Davis, CA 95695
Joint Agency Workshop on Dietary Intakeand Nutritional Assessment
John W. Newman
March 31, 2009
Ph2-1Ph2-3
Ph6-5 Ph7
Ph8-2Ph9-3
Ph9-6
Ph9-4
Ph2-2
Ph2-4
Ph9-1
Ph9-2
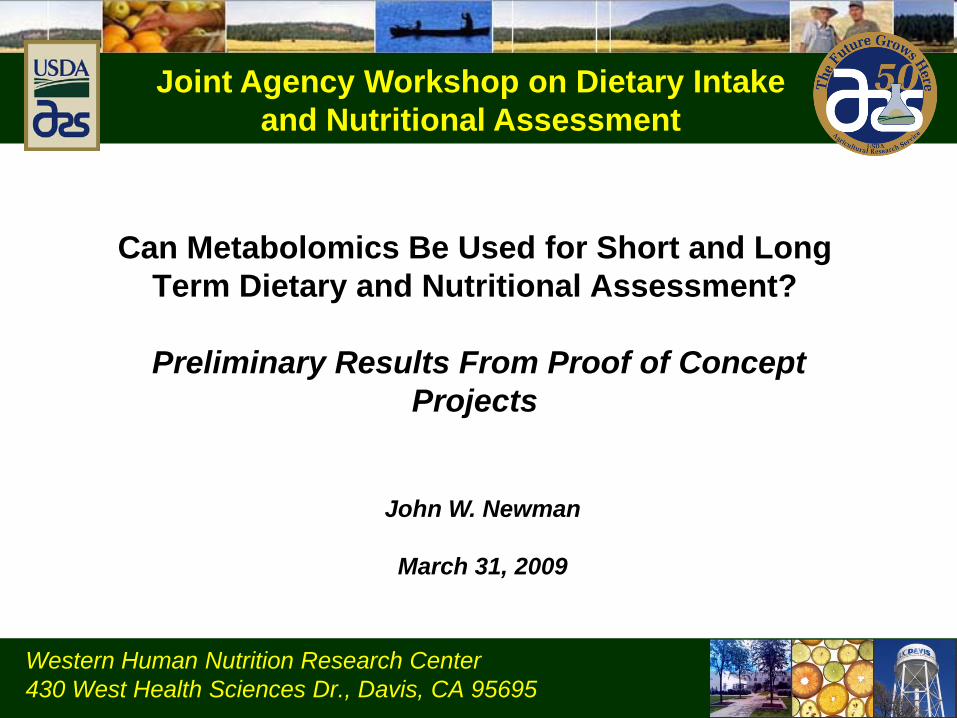
The Metabolome Is Derived From Both Endogenous and Exogenous Sources
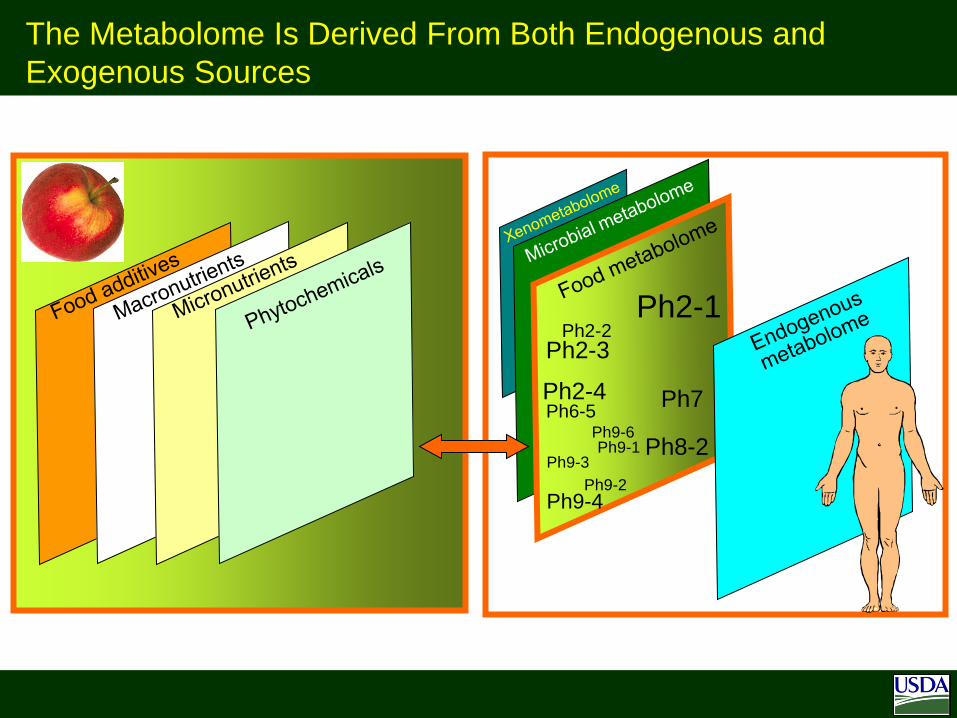
• A variety of studies are underway evaluating this question.
• The MEDE Study – Aberystwyth Univ. / Newcastle Univ., United Kingdom
• Plasma Biomarkers of Whole vs. Refined Grain – USDA, WHNRC, Davis CA.
• Phytochemical Biomarkers of Plant Intake – INRA, Clermont-Ferrand, France
• Circulating Markers of “Fish Oil” Consumption – USDA, WHNRC, Davis CA.
Can Metabolomics Aid Dietary Assessment?
The MEDE StudyMEtabolomics to characterise Dietary Exposure
NuGO and SYSDIET Metabolomics workshop 24 February 2009
Newcastle UniversityPr. John C. MathersDr. Gaëlle FavéMr. Graham HaroldDr. Long Xie
Aberystwyth UniversityPr. John H. DraperDr. Manfred E. BeckmannDr. Shaobo ZhouDr. WanChang LinMs. Kathleen Tailliart
GOAL: Evaluate metabolomics as an alternative tool for dietary assessment
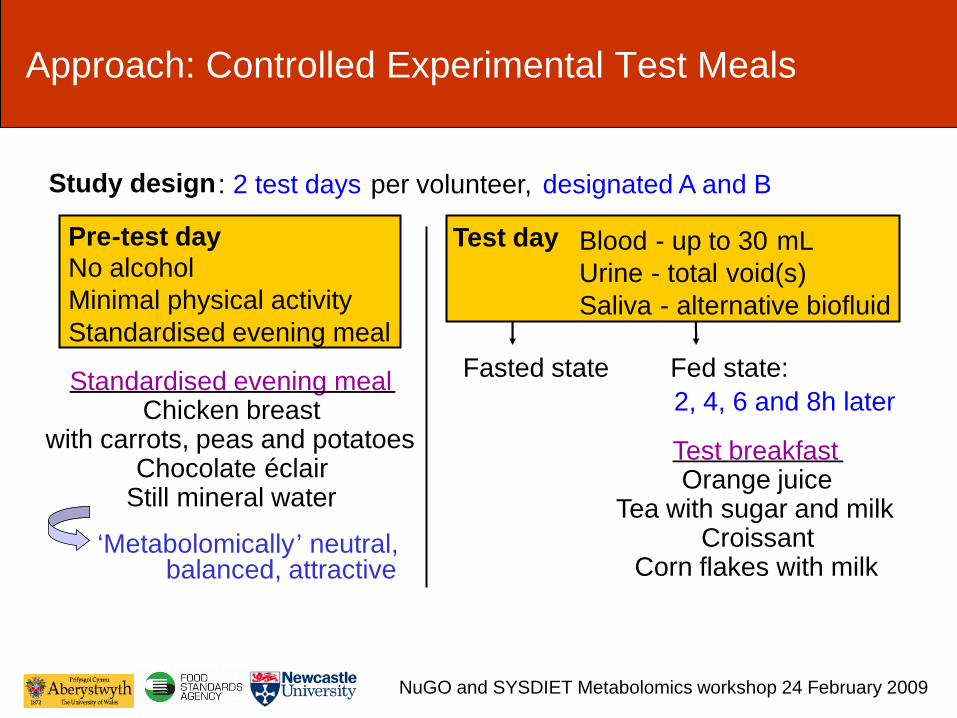
Approach: Controlled Experimental Test Meals
Pre-test dayNo alcoholMinimal physical activityStandardised evening meal
Test day Blood - up to 30 mLUrine - total void(s)Saliva - alternative biofluid
Fasted state Fed state:2, 4, 6 and 8h later
Study design : 2 test days per volunteer, designated A and B
Standardised evening mealChicken breast
with carrots, peas and potatoesChocolate éclair
Still mineral water
‘Metabolomically’ neutral, balanced, attractive
Test breakfastOrange juice
Tea with sugar and milkCroissant
Corn flakes with milk
NuGO and SYSDIET Metabolomics workshop 24 February 2009
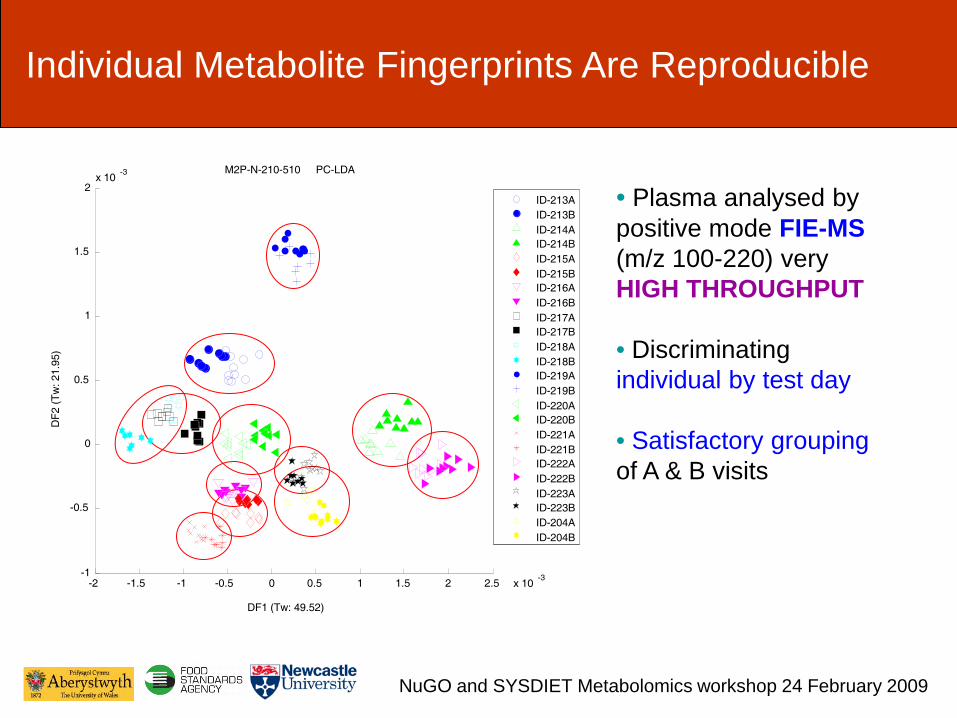
Individual Metabolite Fingerprints Are Reproducible
-2 -1.5 -1 -0.5 0 0.5 1 1.5 2 2.5 x 10⁻³-1
-0.5
0
0.5
1
1.5
2x 10 -3
DF1 (Tw: 49.52)
M2P-N-210-510 PC-LDA
DF2
(Tw
: 21.
95)
ID-213AID-213BID-214AID-214BID-215AID-215BID-216AID-216BID-217AID-217BID-218AID-218BID-219AID-219BID-220AID-220BID-221AID-221BID-222AID-222BID-223AID-223BID-204AID-204B
• Plasma analysed by positive mode FIE-MS (m/z 100-220) veryHIGH THROUGHPUT
• Discriminating individual by test day
• Satisfactory grouping of A & B visits
NuGO and SYSDIET Metabolomics workshop 24 February 2009
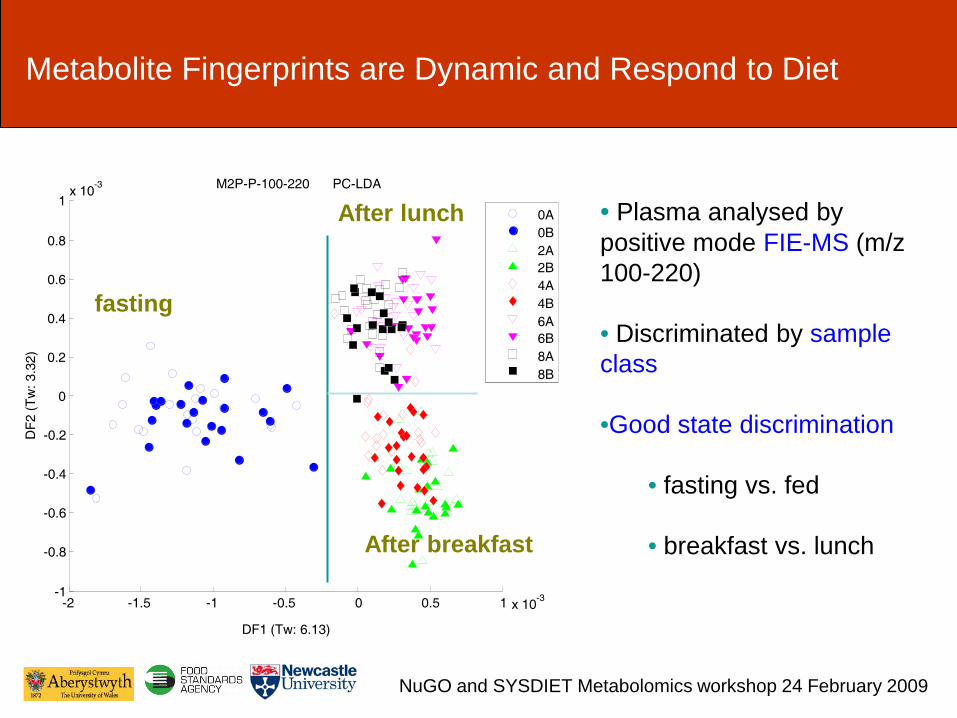
Metabolite Fingerprints are Dynamic and Respond to Diet
• Plasma analysed by positive mode FIE-MS (m/z 100-220)
• Discriminated by sample class
•Good state discrimination
• fasting vs. fed
• breakfast vs. lunch
fasting
After breakfast
After lunch
-2 -1.5 -1 -0.5 0 0.5 1 x 10⁻³-1
-0.8
-0.6
-0.4
-0.2
0
0.2
0.4
0.6
0.8
1x 10⁻³ M2P-P-100-220 PC-LDA
DF1 (Tw: 6.13)
DF2
(Tw
: 3.3
2)
0A0B2A2B4A4B6A6B8A8B
NuGO and SYSDIET Metabolomics workshop 24 February 2009
Changes in the Postprandial Plasma Metabolome with a High vs. Low Glycemic Diet Challenge
Western Human Nutrition Research Center430 West Health Sciences Dr., Davis, CA 95695
Plasma Biomarkers of Grain Consumption
John NewmanTheresa Pedersen
Dmitry GrapovAlison KeenanWilliam Keyes
Nancy KeimWilliam Horn
Sridevi Krishnan
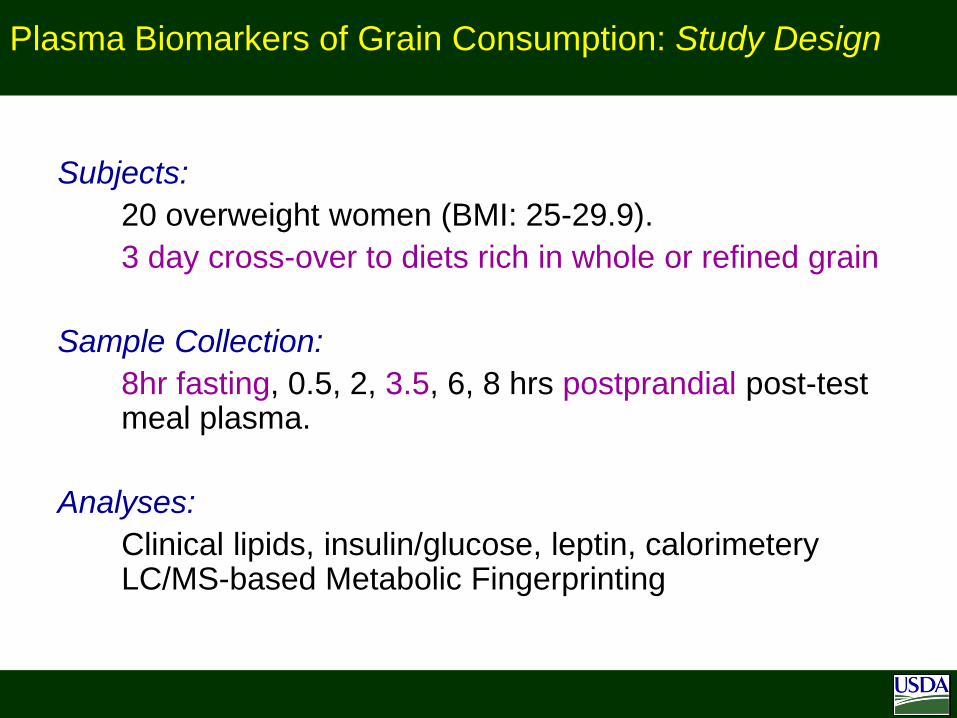
Subjects:20 overweight women (BMI: 25-29.9). 3 day cross-over to diets rich in whole or refined grain
Sample Collection:8hr fasting, 0.5, 2, 3.5, 6, 8 hrs postprandial post-test meal plasma.
Analyses:Clinical lipids, insulin/glucose, leptin, calorimetery LC/MS-based Metabolic Fingerprinting
Plasma Biomarkers of Grain Consumption: Study Design
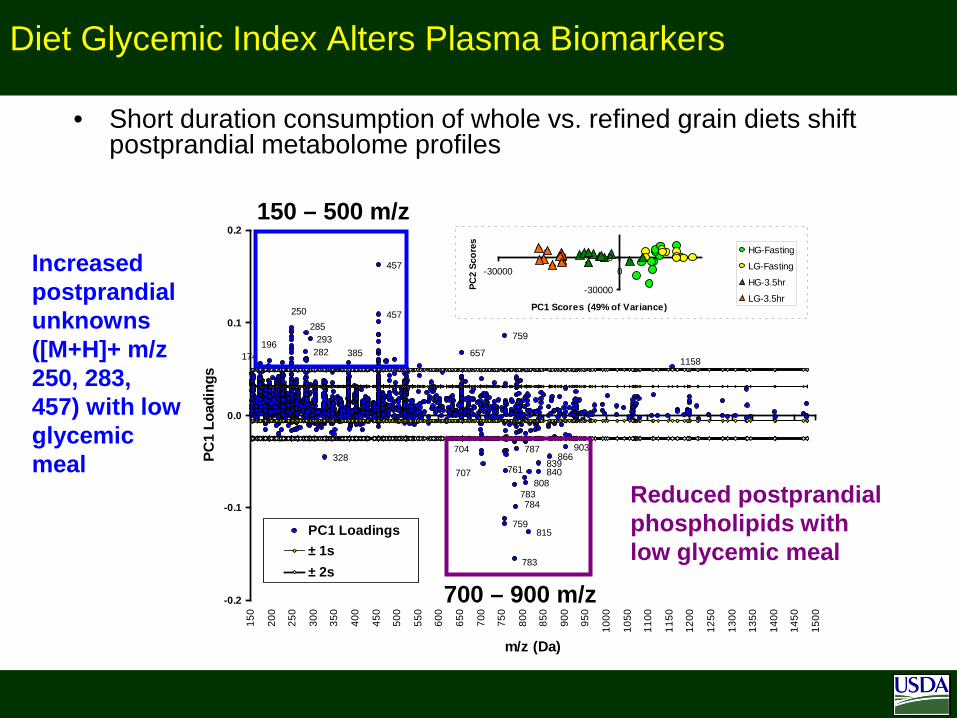
Diet Glycemic Index Alters Plasma Biomarkers
• Short duration consumption of whole vs. refined grain diets shift postprandial metabolome profiles
1158174196
704
784
328
282293
250 457
457
657
759
787
761
783808
839840
866903
707
759815
783
285
385
-0.2
-0.1
0.0
0.1
0.2
150
200
250
300
350
400
450
500
550
600
650
700
750
800
850
900
950
1000
1050
1100
1150
1200
1250
1300
1350
1400
1450
1500
m/z (Da)
PC1
Load
ings
PC1 Loadings± 1s± 2s
-30000
0-30000 0
PC1 Scores (49% of Variance)
PC2
Scor
es HG-Fasting
LG-Fasting
HG-3.5hr
LG-3.5hr
Reduced postprandial phospholipids with low glycemic meal
Increased postprandial unknowns ([M+H]+ m/z 250, 283, 457) with low glycemic meal
150 – 500 m/z
700 – 900 m/z
NuGO and SYSDIET Metabolomics workshop 2009
Characterizing the Food metabolome to discover new biomarkers of food intake
a proof-of-concept study on Citrus
Hubert J, Llorach R, Martin JF, Pujos-Guillot E, Claude S,Bérard A, Bennetau-Pelissero C, Morand C, Scalbert A, Manach C.
UMR 1019, Unité de Nutrition Humaine Centre Clermont-Ferrand-Theix, France
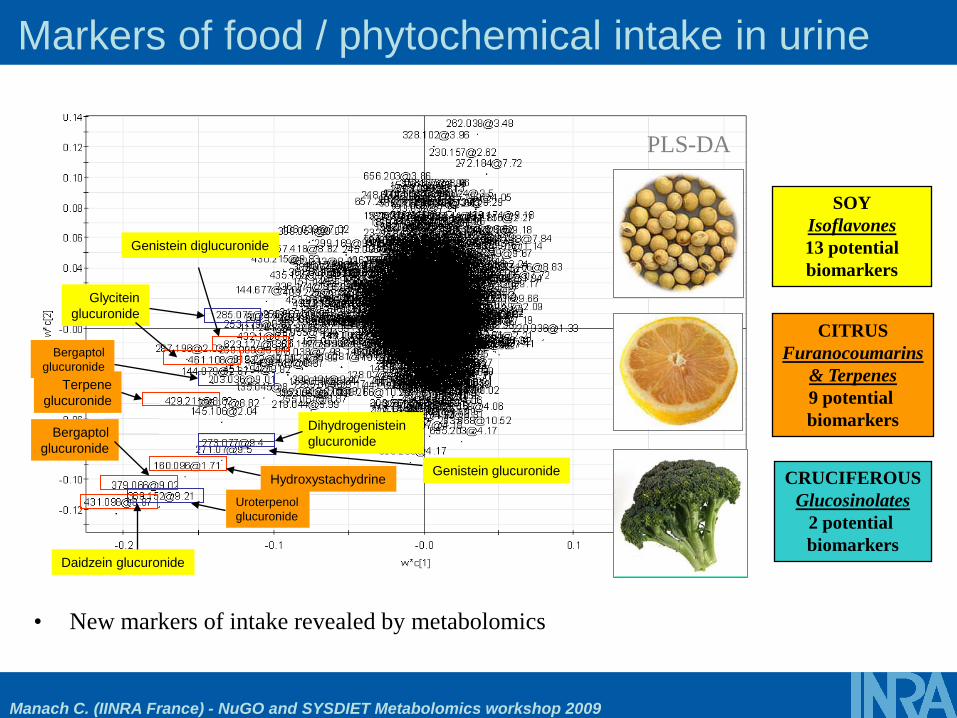
Daidzein glucuronide
Bergaptolglucuronide
Uroterpenol glucuronide
Hydroxystachydrine
Dihydrogenistein glucuronide
Genistein glucuronide
Terpeneglucuronide
Glyciteinglucuronide
Bergaptol glucuronide
Genistein diglucuronide
PLS-DA
SOYIsoflavones13 potential biomarkers
CITRUSFuranocoumarins
& Terpenes9 potential biomarkers
• New markers of intake revealed by metabolomics
CRUCIFEROUSGlucosinolates
2 potential biomarkers
Markers of food / phytochemical intake in urine
Manach C. (IINRA France) - NuGO and SYSDIET Metabolomics workshop 2009
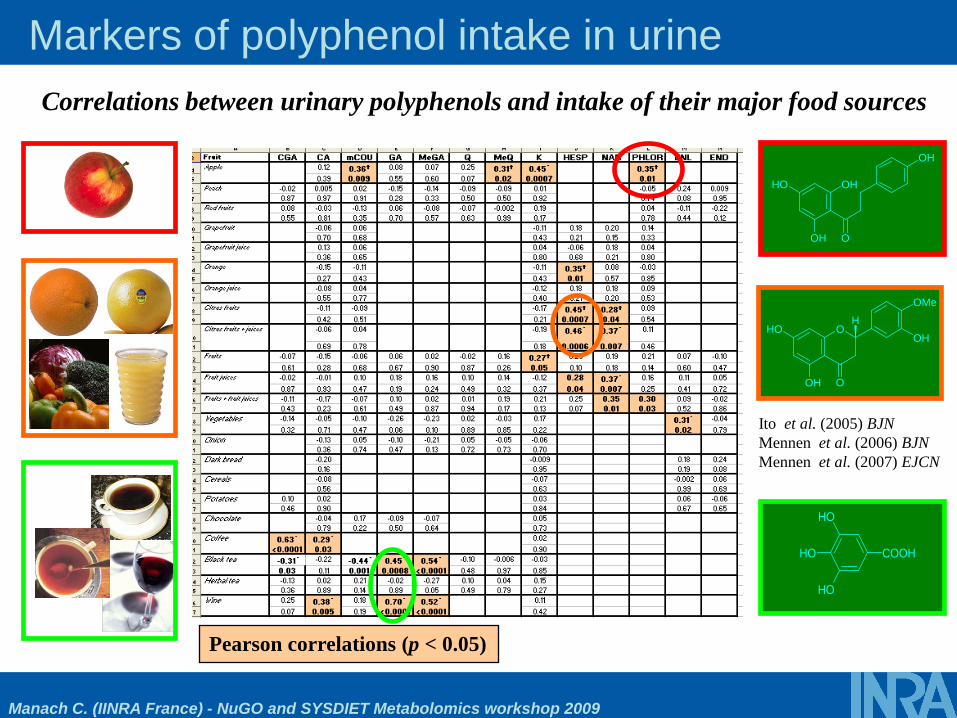
Correlations between urinary polyphenols and intake of their major food sources
Markers of polyphenol intake in urine
Pearson correlations (p < 0.05)
Ito et al. (2005) BJNMennen et al. (2006) BJNMennen et al. (2007) EJCN
OH OH
OH O
OH
O
OMe
OH
OH
OH
O
H
OH
OH
OH
COOH
Manach C. (IINRA France) - NuGO and SYSDIET Metabolomics workshop 2009
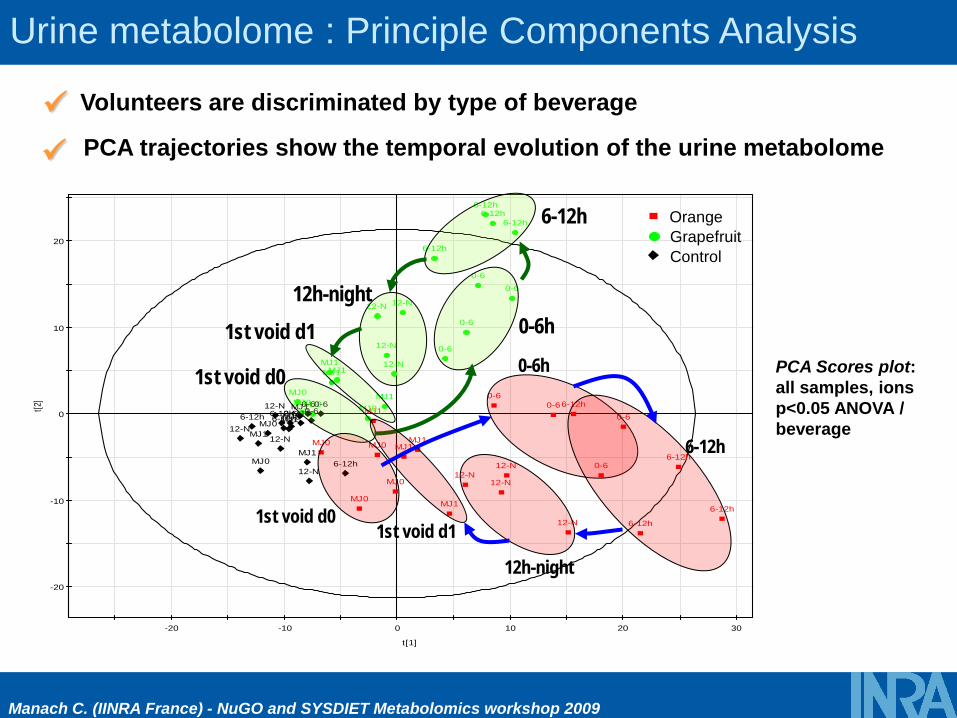
Urine metabolome : Principle Components Analysis
PCA Scores plot: all samples, ions p<0.05 ANOVA / beverage
PCA trajectories show the temporal evolution of the urine metabolome
-20
-10
0
10
20
-20 -10 0 10 20 30
t[2]
t[1]
MJ0
MJ0MJ0
MJ0
0-60-6
0-6
0-6
6-12h
6-12h
6-12h
6-12h12-N
12-N
12-N12-N
MJ1
MJ1
MJ1
MJ1
MJ0MJ0MJ0
MJ0
0-6
0-6
0-6
0-6
6-12h
6-12h
6-12h6-12h
12-N
12-N
12-N
12-N
MJ1MJ1
MJ1
MJ1
MJ0MJ0MJ0
MJ0
0-60-60-60-6
6-12h6-12h
6-12h
6-12h
12-N
12-N
12-N12-N
MJ1
MJ1
MJ1
MJ1
0-6h
6-12h
12h-night
1st void d1
1st void d0
OrangeGrapefruitControl
1st void d01st void d1
0-6h
6-12h
12h-night
Manach C. (IINRA France) - NuGO and SYSDIET Metabolomics workshop 2009
Volunteers are discriminated by type of beverage
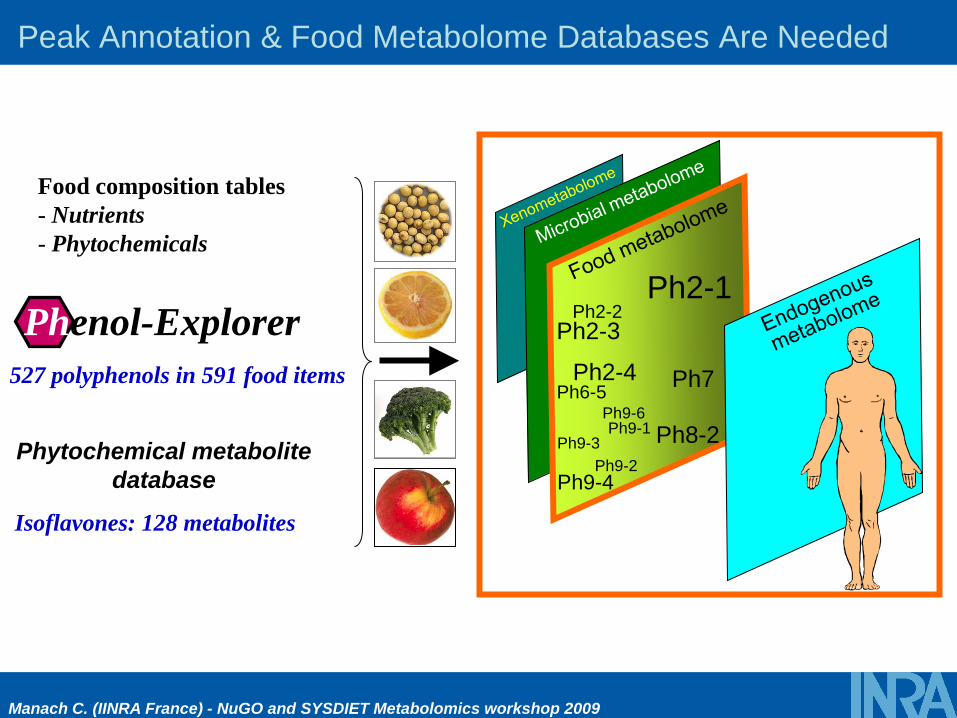
Phenol-ExplorerPhenol-Explorer527 polyphenols in 591 food items
Isoflavones: 128 metabolites
Food composition tables- Nutrients- Phytochemicals
Phytochemical metabolitedatabase
Ph2-1Ph2-3
Ph6-5 Ph7
Ph8-2Ph9-3
Ph9-6
Ph9-4
Ph2-2
Ph2-4
Ph9-1
Ph9-2
Peak Annotation & Food Metabolome Databases Are Needed
Manach C. (IINRA France) - NuGO and SYSDIET Metabolomics workshop 2009
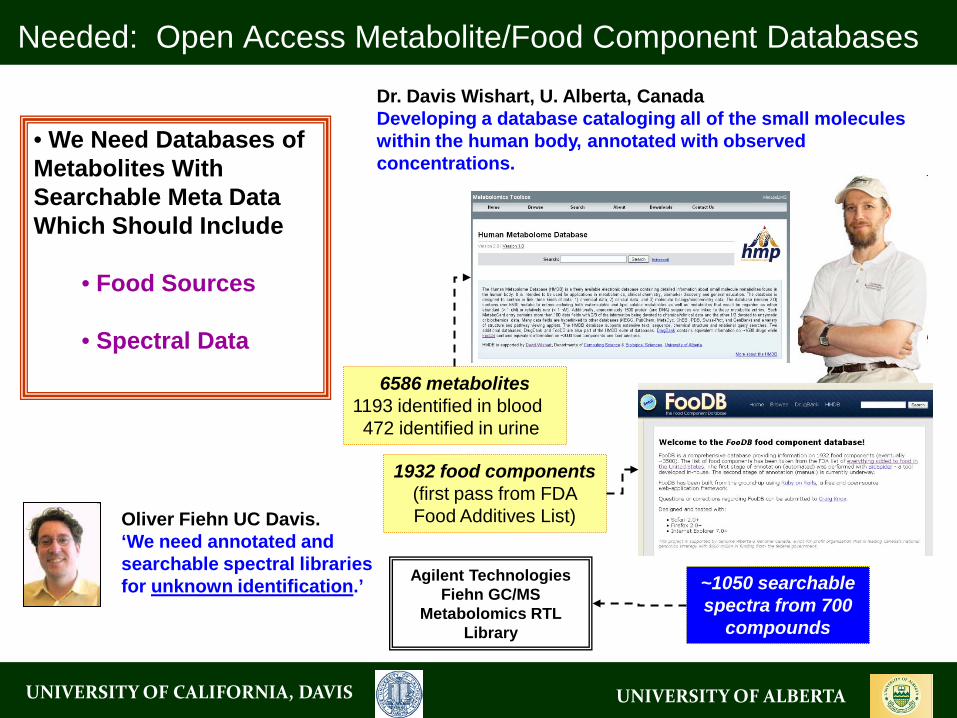
6586 metabolites1193 identified in blood472 identified in urine
1932 food components(first pass from FDA Food Additives List)
Needed: Open Access Metabolite/Food Component Databases
UNIVERSITY OF ALBERTA
Oliver Fiehn UC Davis.‘We need annotated and searchable spectral libraries for unknown identification.’
Dr. Davis Wishart, U. Alberta, CanadaDeveloping a database cataloging all of the small molecules within the human body, annotated with observed concentrations.
Agilent Technologies Fiehn GC/MS
Metabolomics RTL Library
• We Need Databases of Metabolites With Searchable Meta Data Which Should Include
• Food Sources
• Spectral Data
UNIVERSITY OF CALIFORNIA, DAVIS
~1050 searchable spectra from 700
compounds
Red Blood Cell Phospholipids: Reporters of compliance and lipid intake
Western Human Nutrition Research Center430 West Health Sciences Dr., Davis, CA 95695
Circulating Biomarkers of Lipid Intake
John NewmanTheresa Pedersen
Dmitry GrapovAlison KeenanWilliam Keyes
Charles StephensenGertrud SchusterPatrice Armstrong Alina WhetstoneXiaowen Jiang
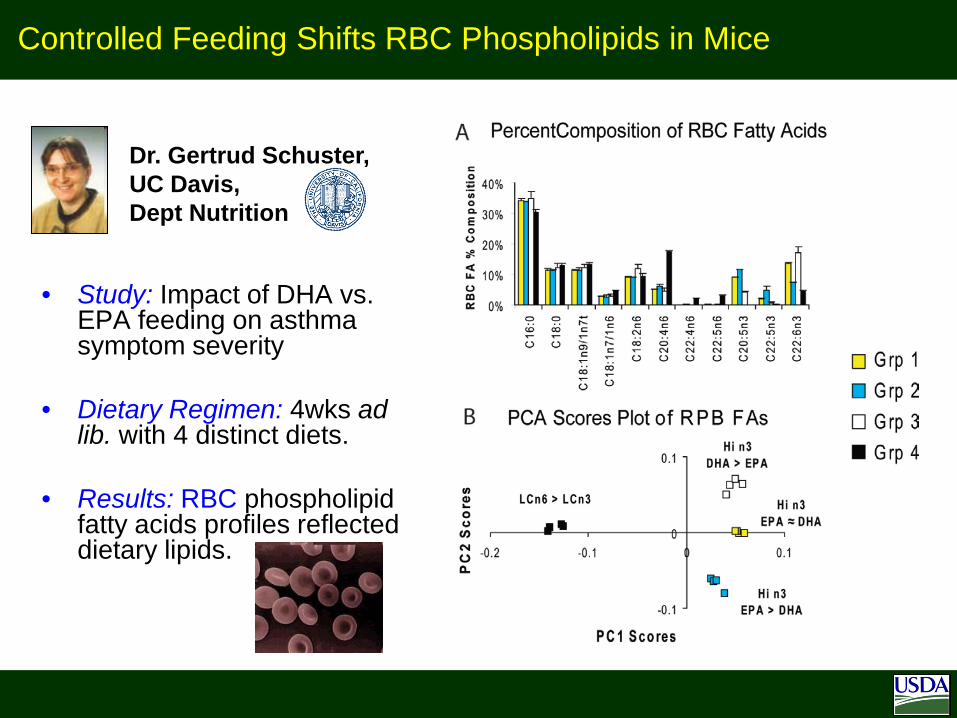
Controlled Feeding Shifts RBC Phospholipids in Mice
• Study: Impact of DHA vs. EPA feeding on asthma symptom severity
• Dietary Regimen: 4wks ad lib. with 4 distinct diets.
• Results: RBC phospholipid fatty acids profiles reflected dietary lipids.
Dr. Gertrud Schuster,UC Davis,Dept Nutrition
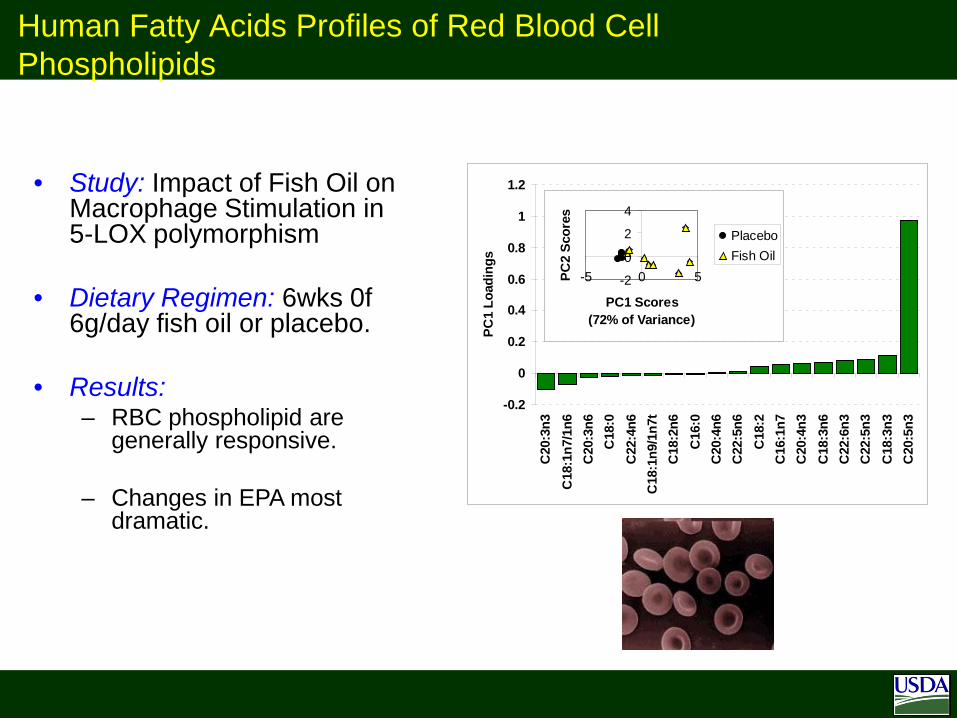
Human Fatty Acids Profiles of Red Blood Cell Phospholipids
-0.2
0
0.2
0.4
0.6
0.8
1
1.2
C20
:3n3
C18
:1n7
/1n6
C20
:3n6
C18
:0C
22:4
n6C
18:1
n9/1
n7t
C18
:2n6
C16
:0C
20:4
n6C
22:5
n6C
18:2
C16
:1n7
C20
:4n3
C18
:3n6
C22
:6n3
C22
:5n3
C18
:3n3
C20
:5n3
PC1
Load
ings
-2
0
2
4
-5 0 5
PC1 Scores(72% of Variance)
PC2
Scor
es
PlaceboFish Oil
• Study: Impact of Fish Oil on Macrophage Stimulation in 5-LOX polymorphism
• Dietary Regimen: 6wks 0f 6g/day fish oil or placebo.
• Results:– RBC phospholipid are
generally responsive.
– Changes in EPA most dramatic.
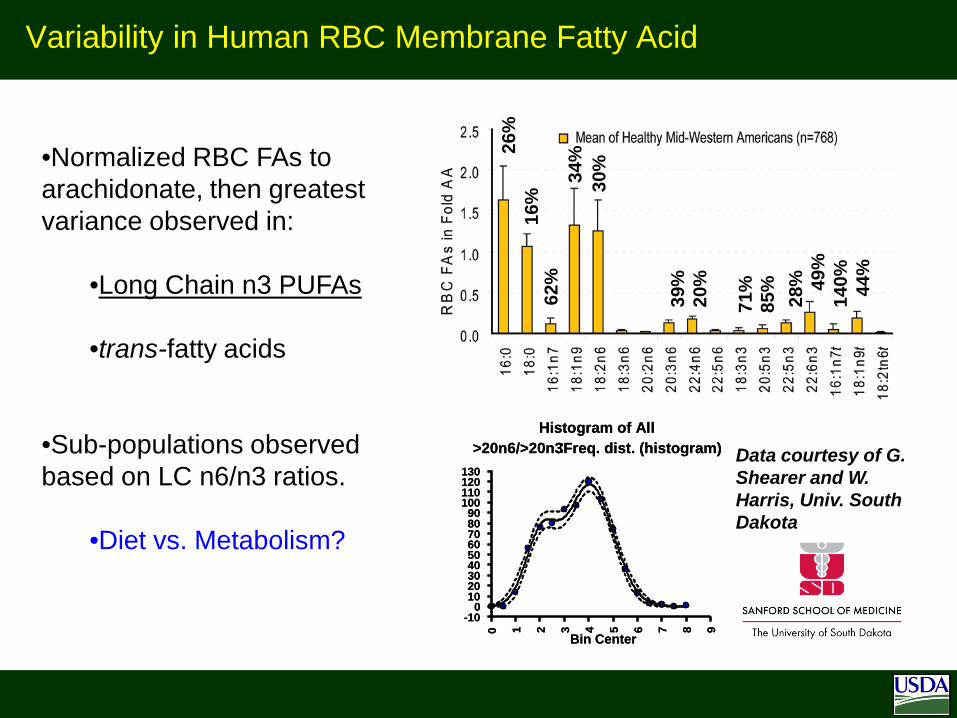
Variability in Human RBC Membrane Fatty Acid
Data courtesy of G. Shearer and W. Harris, Univ. South Dakota
•Normalized RBC FAs to arachidonate, then greatest variance observed in:
•Long Chain n3 PUFAs
•trans-fatty acids
•Sub-populations observed based on LC n6/n3 ratios.
•Diet vs. Metabolism?26
%16
%62
%34
%30
%
49%
44%
39%
20%
85%
71%
28%
140%
Histogram of All>20n6/>20n3:Freq. dist. (histogram)
0 1 2 3 4 5 6 7 8 9
-100
102030405060708090
100110120130
Bin Center
Histogram of All>20n6/>20n3:Freq. dist. (histogram)
0 1 2 3 4 5 6 7 8 9
-100
102030405060708090
100110120130
Bin Center
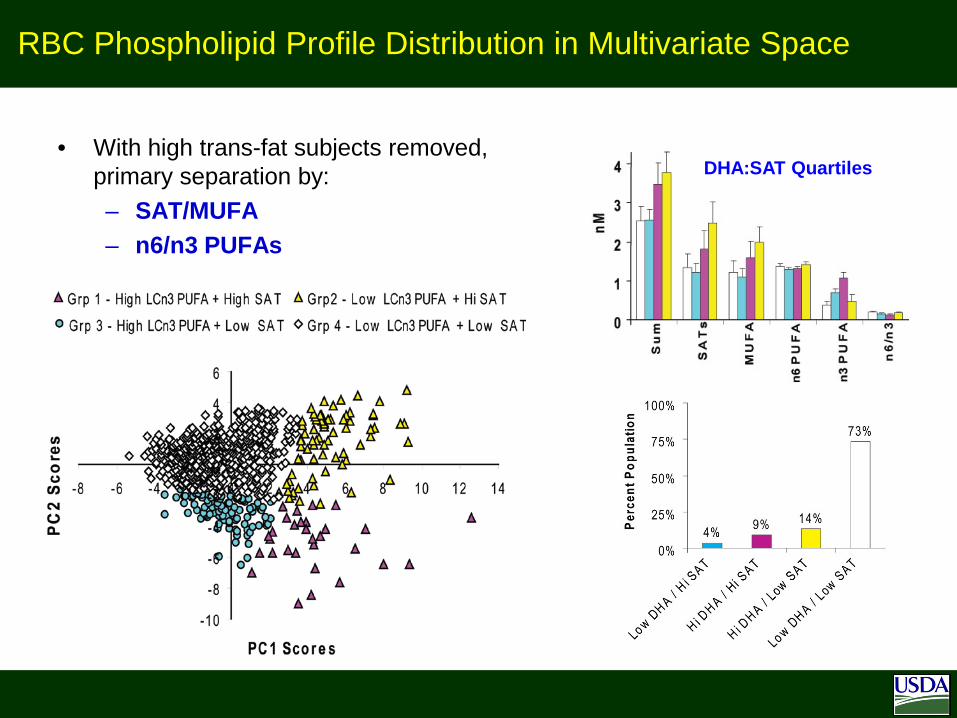
RBC Phospholipid Profile Distribution in Multivariate Space
• With high trans-fat subjects removed, primary separation by:– SAT/MUFA– n6/n3 PUFAs
DHA:SAT Quartiles
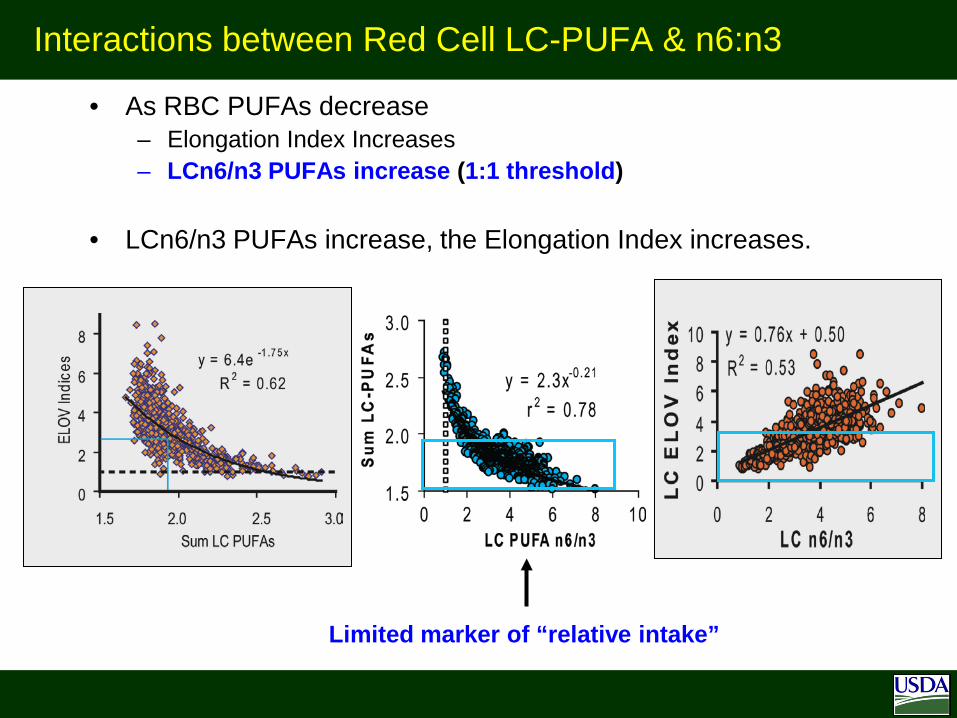
• As RBC PUFAs decrease – Elongation Index Increases– LCn6/n3 PUFAs increase (1:1 threshold)
• LCn6/n3 PUFAs increase, the Elongation Index increases.
Interactions between Red Cell LC-PUFA & n6:n3
Limited marker of “relative intake”
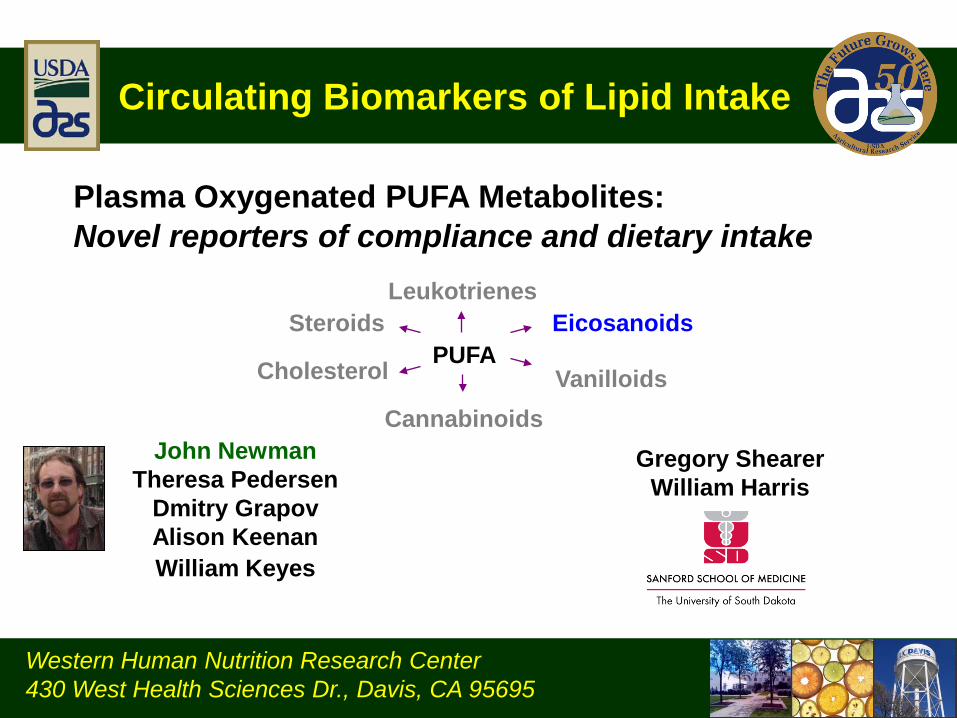
Plasma Oxygenated PUFA Metabolites:Novel reporters of compliance and dietary intake
Western Human Nutrition Research Center430 West Health Sciences Dr., Davis, CA 95695
Circulating Biomarkers of Lipid Intake
John NewmanTheresa Pedersen
Dmitry GrapovAlison KeenanWilliam Keyes
Gregory ShearerWilliam Harris
PUFAEicosanoids
Leukotrienes
CannabinoidsVanilloids
Steroids
Cholesterol
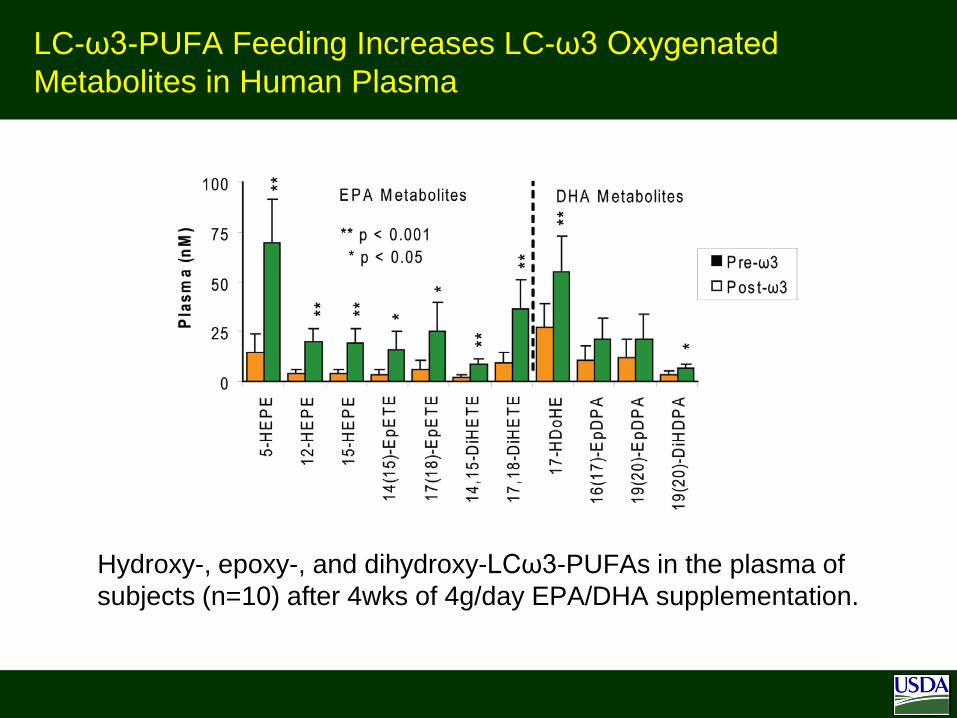
LC-ω3-PUFA Feeding Increases LC-ω3 Oxygenated Metabolites in Human Plasma
Hydroxy-, epoxy-, and dihydroxy-LCω3-PUFAs in the plasma of subjects (n=10) after 4wks of 4g/day EPA/DHA supplementation.
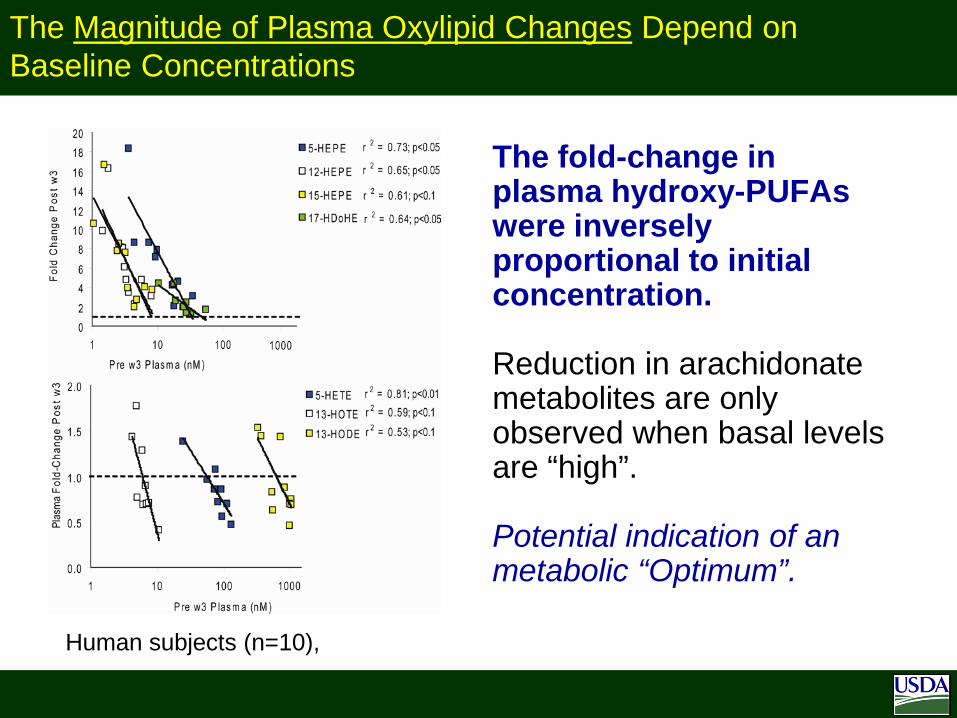
The Magnitude of Plasma Oxylipid Changes Depend on Baseline Concentrations
The fold-change in plasma hydroxy-PUFAs were inversely proportional to initial concentration.
Reduction in arachidonate metabolites are only observed when basal levels are “high”.
Potential indication of an metabolic “Optimum”.
Human subjects (n=10),
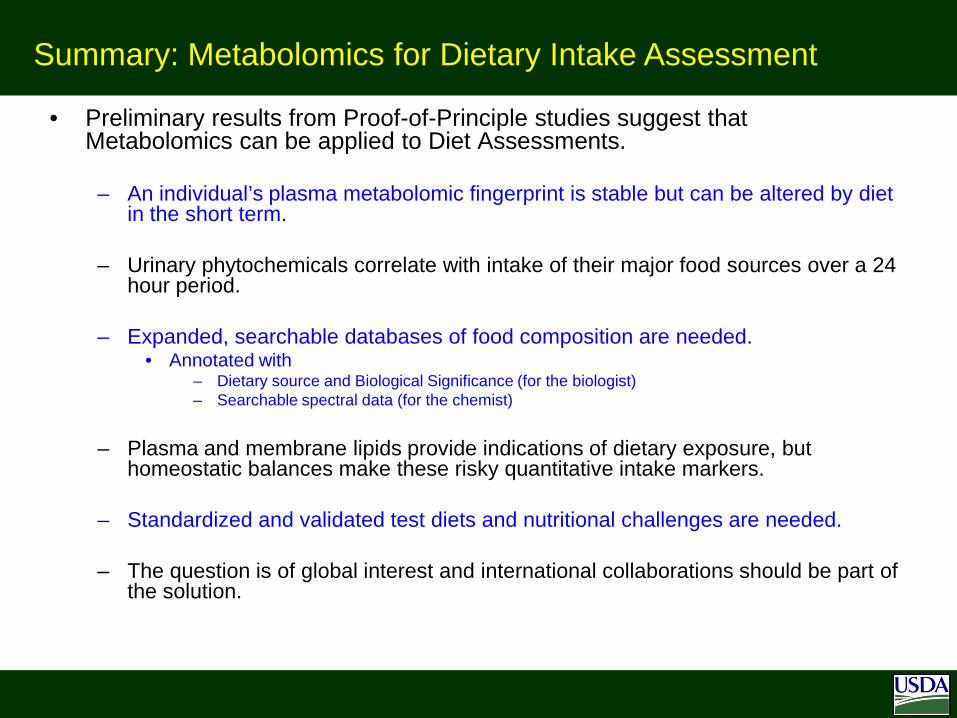
• Preliminary results from Proof-of-Principle studies suggest that Metabolomics can be applied to Diet Assessments.
– An individual’s plasma metabolomic fingerprint is stable but can be altered by diet in the short term.
– Urinary phytochemicals correlate with intake of their major food sources over a 24 hour period.
– Expanded, searchable databases of food composition are needed. • Annotated with
– Dietary source and Biological Significance (for the biologist)– Searchable spectral data (for the chemist)
– Plasma and membrane lipids provide indications of dietary exposure, but homeostatic balances make these risky quantitative intake markers.
– Standardized and validated test diets and nutritional challenges are needed.
– The question is of global interest and international collaborations should be part of the solution.
Summary: Metabolomics for Dietary Intake Assessment
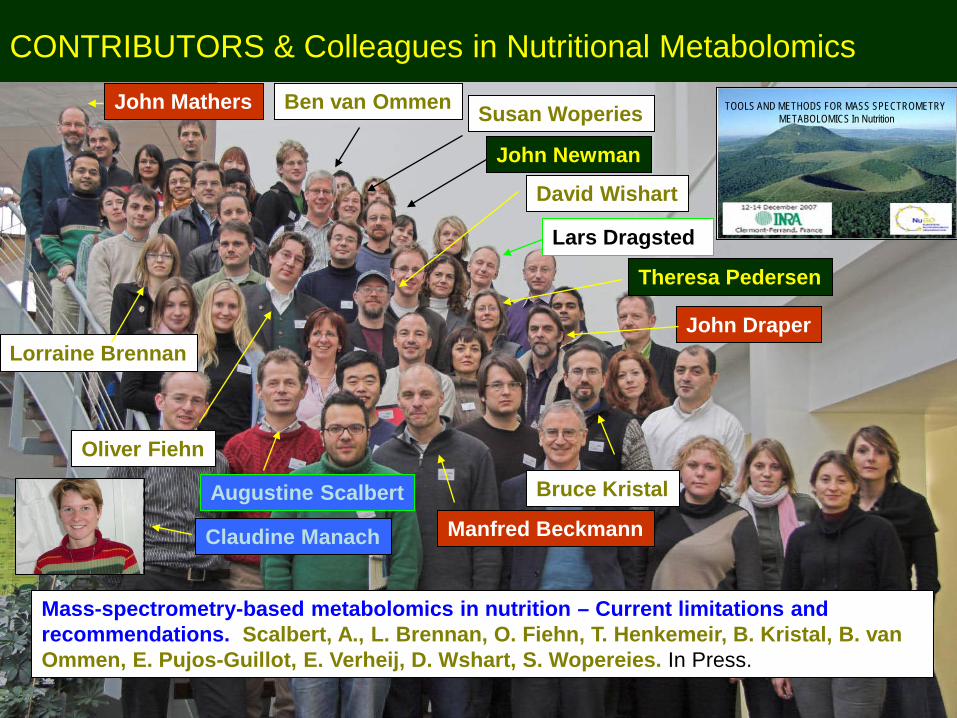
Bruce Kristal
Theresa Pedersen
Augustine Scalbert
David Wishart
John Mathers
John Newman
John DraperLorraine Brennan
Ben van Ommen
Manfred Beckmann
Oliver Fiehn
Susan Woperies
Lars Dragsted
Claudine Manach
TOOLS AND METHODS FOR MASS SPECTROMETRY METABOLOMICS In Nutrition
Mass-spectrometry-based metabolomics in nutrition – Current limitations and recommendations. Scalbert, A., L. Brennan, O. Fiehn, T. Henkemeir, B. Kristal, B. van Ommen, E. Pujos-Guillot, E. Verheij, D. Wshart, S. Wopereies. In Press.
CONTRIBUTORS & Colleagues in Nutritional Metabolomics
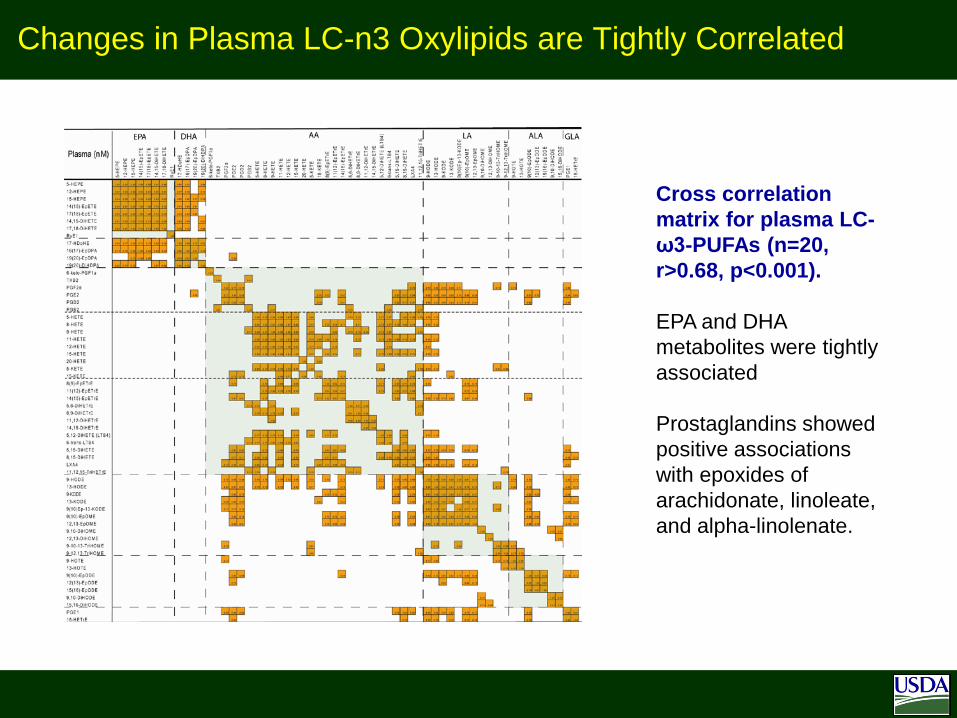
Cross correlation matrix for plasma LC-ω3-PUFAs (n=20, r>0.68, p<0.001).
EPA and DHA metabolites were tightly associated
Prostaglandins showed positive associations with epoxides of arachidonate, linoleate, and alpha-linolenate.
Changes in Plasma LC-n3 Oxylipids are Tightly Correlated


![Proteomic and Metabolomic Characterization of Human ...diseasebiophysics.seas.harvard.edu/wp-content/... · metabolomic[9,10] analysis of the individual compartments of a microfluidic](https://img.pdfslide.net/doc/110x75/6034f7cd36b07b58d426adf3/proteomic-and-metabolomic-characterization-of-human-metabolomic910-analysis.jpg)
![Systems Metabolomic Lecture[1]](https://img.pdfslide.net/doc/110x75/546af5e0b4af9f486b8b45b1/systems-metabolomic-lecture1.jpg)