Embed Size (px)
Citation preview
Metabolomic Profiling of Autoimmune Hepatitis: The DiagnosticUtility of Nuclear Magnetic Resonance SpectroscopyJia-bo Wang,†,¶ Shi-biao Pu,†,§,¶ Ying Sun,‡,¶ Zhong-feng Li,∥ Ming Niu,† Xian-zhong Yan,⊥
Yan-ling Zhao,† Li-feng Wang,# Xue-mei Qin,∇ Zhi-jie Ma,○ Ya-ming Zhang,† Bao-sen Li,‡
Sheng-qiang Luo,◆ Man Gong,◆ Yong-qiang Sun,◆ Zheng-sheng Zou,*,‡ and Xiao-he Xiao*,◆
†China Military Institute of Chinese Medicine, 302 Military Hospital, Beijing 100039, PR China‡Diagnosis and Treatment Center for Non-infectious Diseases, 302 Military Hospital, Beijing 100039, PR China§Yunnan University of Traditional Chinese Medicine, Kunming 650500, PR China∥Capital Normal University, Beijing 100089, PR China⊥National Center of Biomedical Analysis, Academy of Military Medical Sciences, Beijing 100850, PR China#The Institute of Translational Hepatology, The Research Center for Biological Therapy, 302 Military Hospital, Beijing 100039, PRChina∇Shanxi University, Taiyuan 030006, PR China○Beijing Friendship Hospital, Capital Medical University, Beijing 100050, PR China◆Integrative Medical Center, 302 Military Hospital, Beijing 100039, PR China
*S Supporting Information
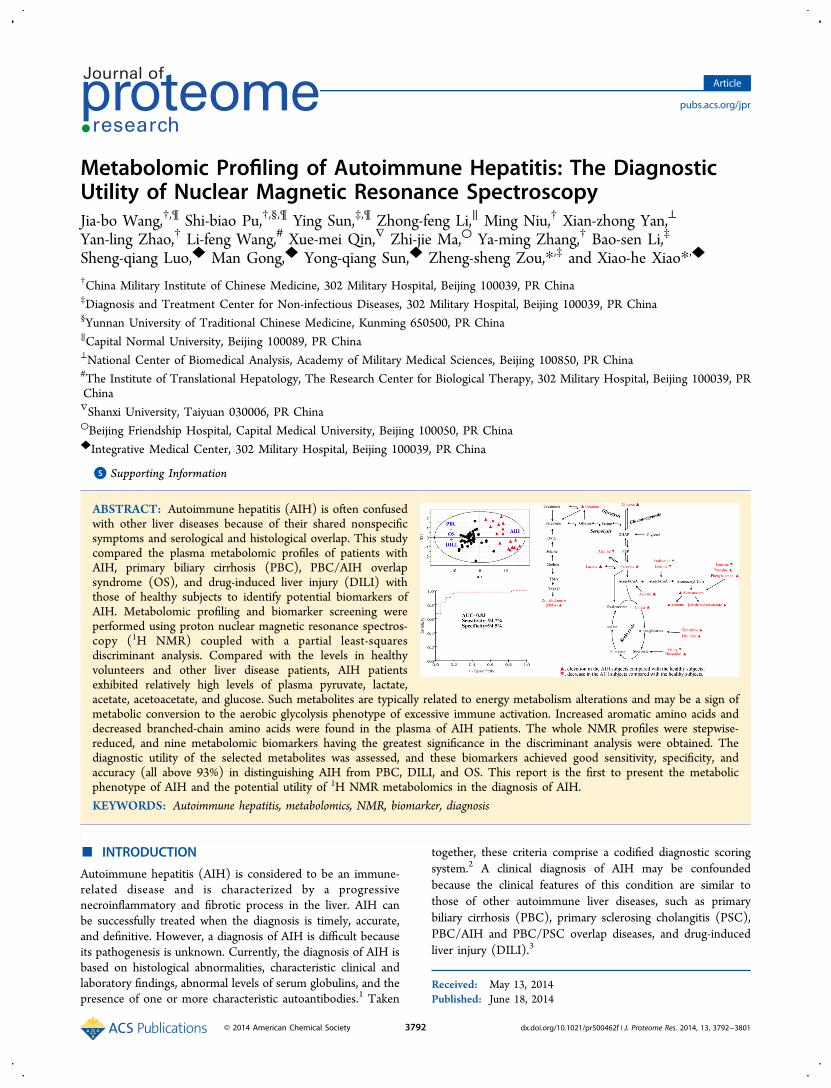
ABSTRACT: Autoimmune hepatitis (AIH) is often confusedwith other liver diseases because of their shared nonspecificsymptoms and serological and histological overlap. This studycompared the plasma metabolomic profiles of patients withAIH, primary biliary cirrhosis (PBC), PBC/AIH overlapsyndrome (OS), and drug-induced liver injury (DILI) withthose of healthy subjects to identify potential biomarkers ofAIH. Metabolomic profiling and biomarker screening wereperformed using proton nuclear magnetic resonance spectros-copy (1H NMR) coupled with a partial least-squaresdiscriminant analysis. Compared with the levels in healthyvolunteers and other liver disease patients, AIH patientsexhibited relatively high levels of plasma pyruvate, lactate,acetate, acetoacetate, and glucose. Such metabolites are typically related to energy metabolism alterations and may be a sign ofmetabolic conversion to the aerobic glycolysis phenotype of excessive immune activation. Increased aromatic amino acids anddecreased branched-chain amino acids were found in the plasma of AIH patients. The whole NMR profiles were stepwise-reduced, and nine metabolomic biomarkers having the greatest significance in the discriminant analysis were obtained. Thediagnostic utility of the selected metabolites was assessed, and these biomarkers achieved good sensitivity, specificity, andaccuracy (all above 93%) in distinguishing AIH from PBC, DILI, and OS. This report is the first to present the metabolicphenotype of AIH and the potential utility of 1H NMR metabolomics in the diagnosis of AIH.
KEYWORDS: Autoimmune hepatitis, metabolomics, NMR, biomarker, diagnosis
■ INTRODUCTION
Autoimmune hepatitis (AIH) is considered to be an immune-related disease and is characterized by a progressivenecroinflammatory and fibrotic process in the liver. AIH canbe successfully treated when the diagnosis is timely, accurate,and definitive. However, a diagnosis of AIH is difficult becauseits pathogenesis is unknown. Currently, the diagnosis of AIH isbased on histological abnormalities, characteristic clinical andlaboratory findings, abnormal levels of serum globulins, and thepresence of one or more characteristic autoantibodies.1 Taken
together, these criteria comprise a codified diagnostic scoringsystem.2 A clinical diagnosis of AIH may be confoundedbecause the clinical features of this condition are similar tothose of other autoimmune liver diseases, such as primarybiliary cirrhosis (PBC), primary sclerosing cholangitis (PSC),PBC/AIH and PBC/PSC overlap diseases, and drug-inducedliver injury (DILI).3
Received: May 13, 2014Published: June 18, 2014
Article
pubs.acs.org/jpr
© 2014 American Chemical Society 3792 dx.doi.org/10.1021/pr500462f | J. Proteome Res. 2014, 13, 3792−3801
Many studies have attempted to identify autoantibodies thatare specific to AIH patients; however, serological overlap canconfound a diagnosis of AIH with other chronic liver diseases,such as PBC, acute and chronic viral hepatitis, and drug-induced hepatitis, or with concurrent autoimmune diseases,such as inflammatory bowel disease (IBD).4,5 Recently, themetabolic liver disease non-alcoholic steatohepatitis (NASH)was found to share autoimmune features with AIH and PBC,including anti-nuclear antibodies (ANA) and anti-mitochon-drial antibodies (AMA), which were more frequently detectedin women of advanced age.3 The overall sensitivity of thecodified scoring system for establishing a definite or probableAIH diagnosis is 89.8%;6 however, the specificity fordiscriminating AIH from overlapping syndromes, such asPBC and/or PSC, is only 60.8%.7 In addition to the relativelylow sensitivity and specificity of this scoring system, thisdiagnostic approach is complex, time-consuming, and ex-pensive. Additionally, laboratory or histological tests arerequired. However, histological tests cannot be performed inpatients with acute and severe liver lesions because of the lackof permissive conditions for a liver biopsy. In these patients, thediagnostic accuracy of the scoring system is limited. Recently,scoring systems have been proposed to simplify clinical testingand to accelerate diagnosis; however, the reliability of these newscoring systems needs to be further validated. Therefore, anovel rapid and specific diagnostic method for AIH is greatlyneeded for clinical practice.Metabolomics is defined as the quantitative measurement of
the multiparametric metabolic response of living systems topathophysiological stimuli or genetic modifications, which isoften used in toxicity assessment, disease diagnosis, andfunctional genomics. By measuring changes in metaboliteconcentrations, the range of biochemical effects that areinduced by a disease can be determined. Because the liverhas a primary role in metabolism, metabolomics has beensuccessfully applied to identify the biomarkers in most types ofliver diseases, including non-alcoholic fatty liver disease(NAFLD), alcoholic liver diseases, viral hepatitis, fibrosis,cirrhosis, hepatocellular carcinoma (HCC), and cholangiocar-
cinoma. These biomarkers have been systematically reviewed.8
Additionally, metabolomics has been well-studied in immuneand allergy diseases, such as asthma and multiple sclerosis.9−11
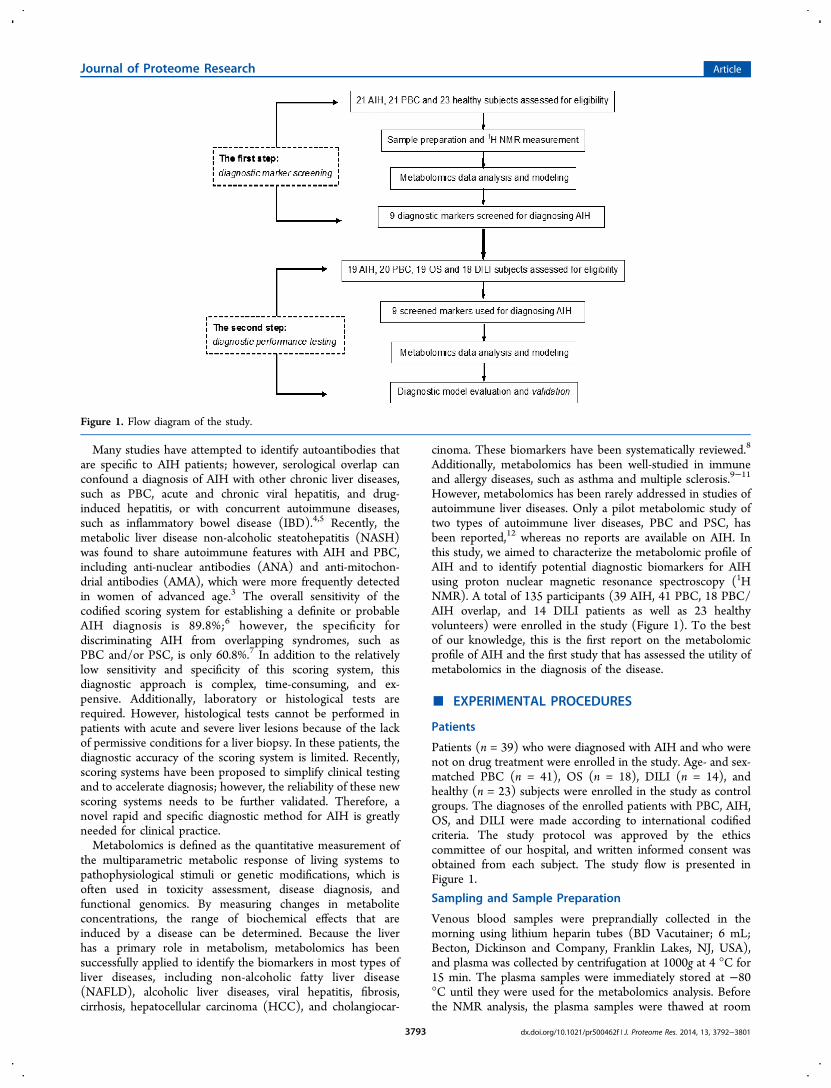
However, metabolomics has been rarely addressed in studies ofautoimmune liver diseases. Only a pilot metabolomic study oftwo types of autoimmune liver diseases, PBC and PSC, hasbeen reported,12 whereas no reports are available on AIH. Inthis study, we aimed to characterize the metabolomic profile ofAIH and to identify potential diagnostic biomarkers for AIHusing proton nuclear magnetic resonance spectroscopy (1HNMR). A total of 135 participants (39 AIH, 41 PBC, 18 PBC/AIH overlap, and 14 DILI patients as well as 23 healthyvolunteers) were enrolled in the study (Figure 1). To the bestof our knowledge, this is the first report on the metabolomicprofile of AIH and the first study that has assessed the utility ofmetabolomics in the diagnosis of the disease.
■ EXPERIMENTAL PROCEDURES
Patients
Patients (n = 39) who were diagnosed with AIH and who werenot on drug treatment were enrolled in the study. Age- and sex-matched PBC (n = 41), OS (n = 18), DILI (n = 14), andhealthy (n = 23) subjects were enrolled in the study as controlgroups. The diagnoses of the enrolled patients with PBC, AIH,OS, and DILI were made according to international codifiedcriteria. The study protocol was approved by the ethicscommittee of our hospital, and written informed consent wasobtained from each subject. The study flow is presented inFigure 1.
Sampling and Sample Preparation
Venous blood samples were preprandially collected in themorning using lithium heparin tubes (BD Vacutainer; 6 mL;Becton, Dickinson and Company, Franklin Lakes, NJ, USA),and plasma was collected by centrifugation at 1000g at 4 °C for15 min. The plasma samples were immediately stored at −80°C until they were used for the metabolomics analysis. Beforethe NMR analysis, the plasma samples were thawed at room
Figure 1. Flow diagram of the study.
Journal of Proteome Research Article
dx.doi.org/10.1021/pr500462f | J. Proteome Res. 2014, 13, 3792−38013793
Table
1.Clin
ical
Characteristics
ofthePop
ulations
EnrolledforScreeningMetabolic
Markers,DiagnosticPerform
ance
Test,andPredictionin
theStud
ya
step
1:screeningmetabolicmarkers
step
2:diagnosticperformance
testandpredictio
n
controls
controls
AIH
healthy
PBC
AIH
PBC
OS
DILI
clinicalparameters
(n=21)
(n=23)
(n=21)
(n=18)
(n=20)
(n=18)
(n=14)
gender
(M/F),n
1/20
1/22
1/20
1/17
2/18
1/17
1/13
age,median,range(y)
53(35−
67)
51(35−
67)
52(37−
65)
54(34−
67)
53(36−
67)
54(38−
68)
51(34−
62)
bilirubin,m
edian,
range(μmol/L)
39(24−
144)
8(5−19)
35(17−
126)
36(19−
137)
34(16−
129)
41(17−
151)
51(31−
172)
ALP
,median,
range
(IU/L)
153(83−
801)
77(39−
128)
461(271−918)
155(96−
824)
467(269−906)
487(252−919)
351(196−519)
AST
,median,
range
(IU/L)
137(51−
560)
27(19−
38)
115(69−
958)
149(63−
591)
123(81−
941)
151(71−
814)
132(59−
1002)
ALT
,median,
range
(IU/L)
213(86−
473)
31(22−
41)
165(77−
1011)
231(79 −
574)
159(67−
964)
179(84−
986)
159(78−
976)
IgG,m
edian,
range
(g/L)
27.5
(16.1−
38.9)
9.7(7.6−11.9)
15.3(9.8−28.4)
28.2(17.3−
39.7)
17.3
(10.7−
36.5)
21.1
(11.4−
42.3)
16.2(9.7−29.3)
IgM,m
edian,
range
(g/L)
2.3(0.9−4.3)
1.2(0.6−3.1)
4.2(1.8−9.2)
1.8(0.9−4.4)
3.7(1.5−10.0)
2.8(1.6−8.5)
2.9(1.5−8.7)
ANA,m
ediantiters
(ranges),n
1:160(1:80−
1:1040),16
1:320(1:160−1:1000),14
1:160(1:80−
1:1040),15
1:320(1:160−1:1000),15
1:320(1:80−
1:1120),13
ASM
A,m
ediantiters
(ranges),n
1:320(1:80−
1:880),5
1:320(1:80−
1:880),3
1:160(1:80−
1:560),8
AMA,m
ediantiters
(ranges),n
1:160(1:40−
1:440),2
11:160(1:40−
1:480),2
01:160(1:40−
1:520),1
6
absenceof
viral
hepatitis
yes
yes
yes
yes
yes
yes
yes
pretreatment
nono
nono
nono
noaAbbreviations:A
LP,alkalinephosphatase;AST
,aspartateam
inotransferase;A
LT,alanine
aminotransferase;IgG
,immunoglobulin
G;IgM
,immunoglobulin
M;A
NA,anti-n
uclearantibody;SM
A,smooth
muscleantibody;
ASM
A,anti-smooth
muscleantibody.
Journal of Proteome Research Article
dx.doi.org/10.1021/pr500462f | J. Proteome Res. 2014, 13, 3792−38013794
temperature, and 200 μL aliquots were mixed with 400 μL ofD2O and centrifuged at 12 000g for 10 min at 4 °C. Thereafter,500 μL of the supernatant was added into a 5 mm NMR tube,and NMR acquisition was immediately performed.
NMR Measurement1H NMR spectra were obtained using an NMR spectrometer(Varian Medical Systems, Inc., Palo Alto, CA, USA) at a protonfrequency of 600 MHz at 25 °C with a Carr−Purcell−Meiboom−Gill (CPMG) spin−echo pulse sequence and a totalspin−spin relaxation delay (2nτ) of 320 ms to attenuate thebroad signals from proteins and lipoproteins because of theirshort transverse relaxation time. The free induction decays(FIDs) were collected into 64 K data points with a spectral
width of 8000 Hz and 64 scans. The FIDs were zero-filled todouble size and multiplied by an exponential line-broadeningfactor of 1.0 Hz before Fourier transform.All of the plasma 1H NMR spectra were manually phased and
baseline-corrected using MestReNova software (Mestrelab,Inc., Santiago de Compostela, Spain). The NMR spectrawere calibrated by the endogenous lactate (1.33 ppm) asreference. For the CPMG spectra, each spectrum over therange of δ 0.4−10.0 was data-reduced into integrated regions ofequal width (0.005 ppm). The regions that contained theresonance from residual water (δ 4.6−5.1) were excluded. Theintegral values of each spectrum were normalized to a constant
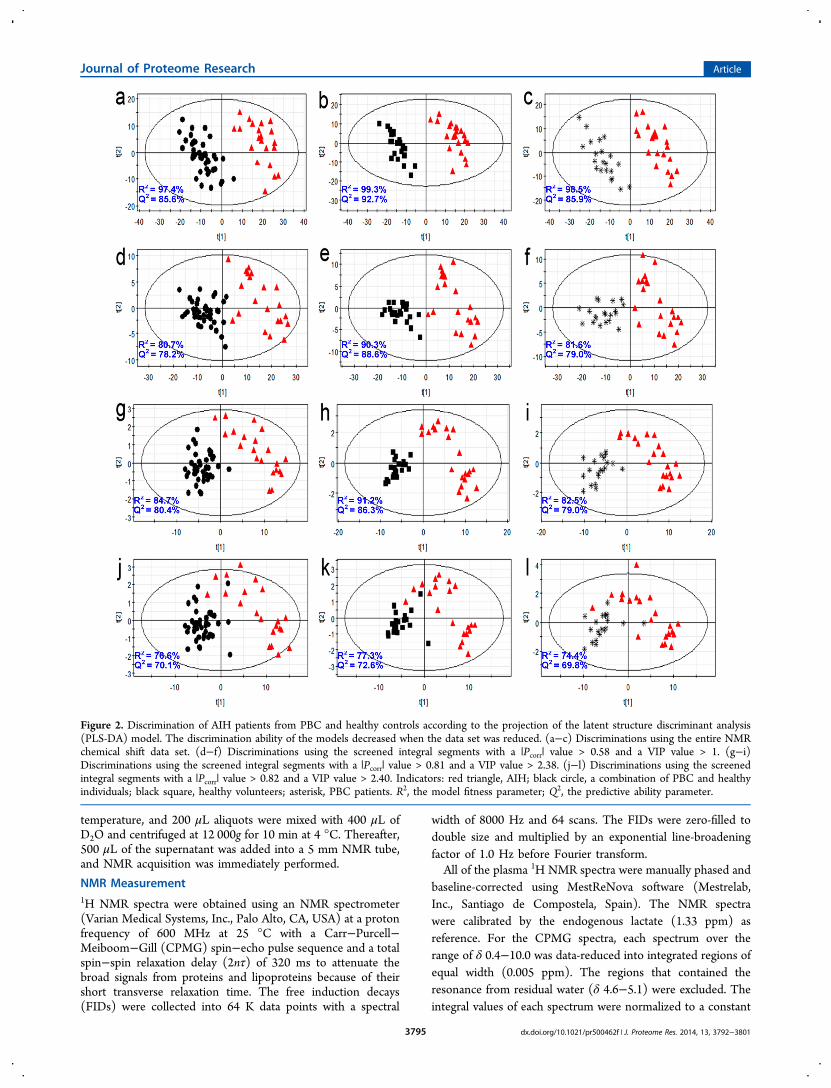
Figure 2. Discrimination of AIH patients from PBC and healthy controls according to the projection of the latent structure discriminant analysis(PLS-DA) model. The discrimination ability of the models decreased when the data set was reduced. (a−c) Discriminations using the entire NMRchemical shift data set. (d−f) Discriminations using the screened integral segments with a |Pcorr| value > 0.58 and a VIP value > 1. (g−i)Discriminations using the screened integral segments with a |Pcorr| value > 0.81 and a VIP value > 2.38. (j−l) Discriminations using the screenedintegral segments with a |Pcorr| value > 0.82 and a VIP value > 2.40. Indicators: red triangle, AIH; black circle, a combination of PBC and healthyindividuals; black square, healthy volunteers; asterisk, PBC patients. R2, the model fitness parameter; Q2, the predictive ability parameter.
Journal of Proteome Research Article
dx.doi.org/10.1021/pr500462f | J. Proteome Res. 2014, 13, 3792−38013795
sum of all the integrals in a spectrum to reduce any significantconcentration differences between the samples.
Metabolomics Data Analysis and Modeling
The resulting integral data were imported into the SIMCA-Pprogram (version 11.00; Umetrics, Umea, Sweden) for amultivariate analysis. All of the NMR data variables were mean-centered and Pareto-scaled before the analysis. A partial least-squares discriminant analysis (PLS-DA) was used to identifythe differential metabolites between the groups. The variableimportance in the projection (VIP) value and the correlationcoefficient (Pcorr) were used to reflect the importance of themetabolites.13 A |Pcorr| value > 0.58 and a VIP value > 1 were apriori considered to be statistically significant on the basis ofthe literature.14 Then, the proper cutoff values of the VIP and |Pcorr| values were stepwise-screened to find a small set ofmetabolite biomarkers with the greatest significance todiscriminate AIH from the other liver diseases.
Model Validation
The established model was subjected to a Y-scramblingstatistical validation to test the possibility of a chancecorrelation, where the class membership was randomly shuffled200 times, and the parameters for model fitness (R2) andpredictive ability (Q2) were calculated. The Q2 value wasexpected to be low (less than 0); a high Q2 value would suggestthat the predictive ability of the model was due to a chancecorrelation.15
In addition, the leave-one-out cross-validation method wasemployed to estimate the actual performance of the establishedPLS-DA model in diagnosing AIH, PBC, DILI, and AIH/PBCoverlap patients. Using this method, one patient sample was leftout at a time, and the PLS-DA prediction model wasconstructed with the remaining data (a training set). Theprediction model was constructed with the same number oforiginal components as the previous PLS-DA classificationmodel. An a priori cutoff value of 0.5 was used to predict theclass membership of the left-out sample. This process wasrepeated until every sample had been tested once.16 Addition-ally, receiver operating characteristic (ROC) testing wasconducted to further evaluate the performance of theestablished models in diagnosing the different patients. Thediagnostic values were assessed using the area under thereceiver operating characteristic (ROC) curve.
■ RESULTS
Patient Clinical Baseline Characteristics
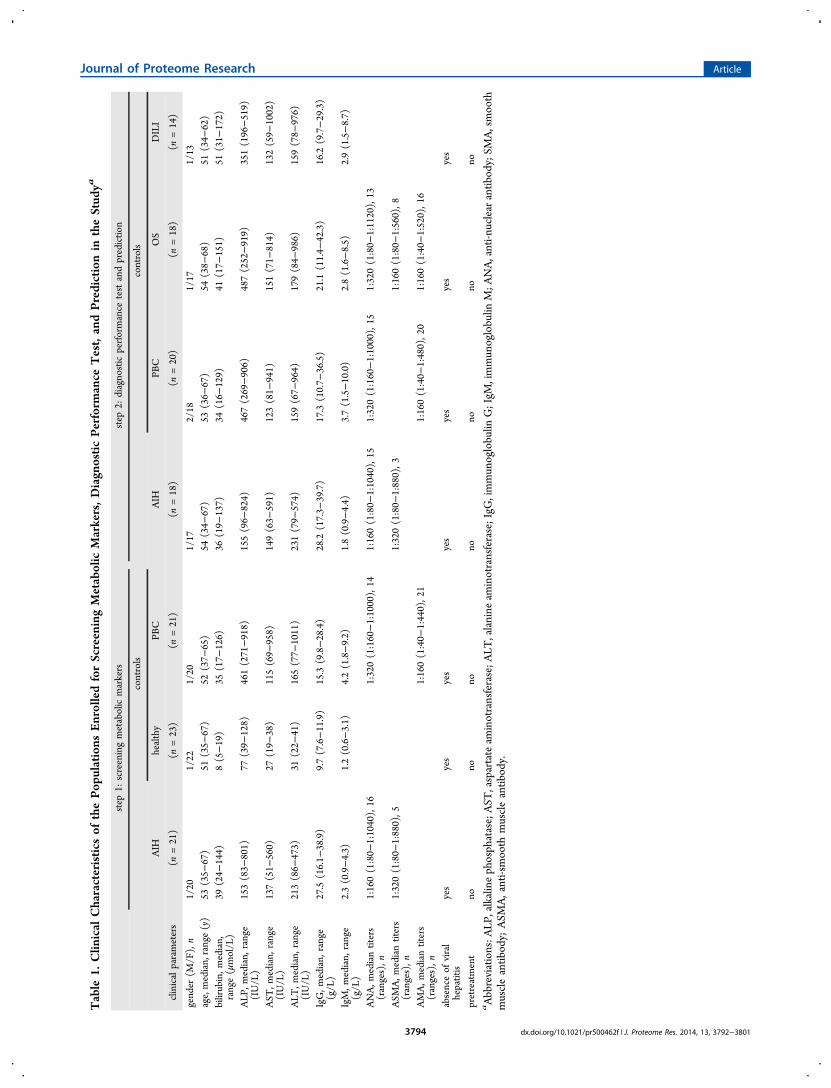
The clinical baseline characteristics of the patients aresummarized in Table 1. Previous epidemiological studies havedemonstrated that women are affected by these diseases morefrequently than men. Consistent with those results, theincidence of PBC, AIH, and OS was higher in the femalesthan in males in our data set. Furthermore, to avoid the impactof the treatment drugs on the metabolomics analysis, none ofthe enrolled patients had received any pretreatment, includingtraditional Chinese medicine therapy.
PLS-DA Discrimination and Metabolic Marker Screening
The metabolomic profiles of the AIH patients were comparedwith those of the PBC and healthy volunteers to preliminarilyscreen potential biomarkers and to test their diagnostic utility.When using the entire NMR chemical shift data set (1802integral segments of a chemical shift), the established PLS-DAmodel exhibited good ability to discriminate the AIHindividuals from PBC and healthy individuals (Figure 2a−c).To reduce the data set in the model, we used an a priori cutoffVIP value > 1 and a |Pcorr| value > 0.58, based on theliterature.14 Using this reduced data set, the established modelstill exhibited a good ability to discriminate the AIH individualsfrom the PBC and healthy individuals (Figure 2d−f). Tofurther reduce the data set, the cutoffs of the VIP and |Pcorr|values were screened stepwise with incremental steps of 0.02and 0.01, respectively. In the screening process, the evaluationparameters for model fitness (R2) and predictive ability (Q2)were continuously reduced. The established model still hadgood diagnostic ability for correctly discriminating the AIHsubjects from the PBC and healthy subjects when the cutoffsfor the VIP and |Pcorr| values were set at 2.38 and 0.81,respectively (Figure 2g−i). However, the model could notefficiently discriminate the AIH individuals from the PBC andhealthy individuals when the cutoffs for the VIP and |Pcorr|values were set at 2.40 and 0.82, respectively (Figure 2j−l).Therefore, the selected data comprised the minimal data set
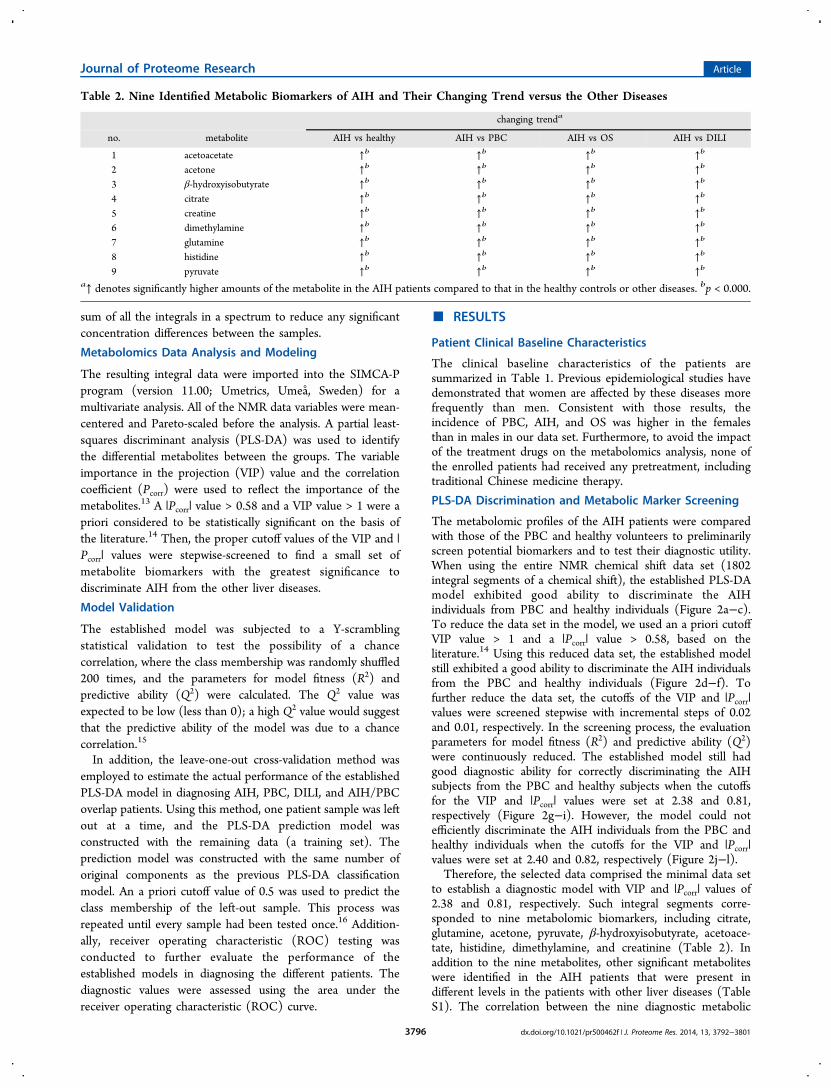
to establish a diagnostic model with VIP and |Pcorr| values of2.38 and 0.81, respectively. Such integral segments corre-sponded to nine metabolomic biomarkers, including citrate,glutamine, acetone, pyruvate, β-hydroxyisobutyrate, acetoace-tate, histidine, dimethylamine, and creatinine (Table 2). Inaddition to the nine metabolites, other significant metaboliteswere identified in the AIH patients that were present indifferent levels in the patients with other liver diseases (TableS1). The correlation between the nine diagnostic metabolic
Table 2. Nine Identified Metabolic Biomarkers of AIH and Their Changing Trend versus the Other Diseases
changing trenda
no. metabolite AIH vs healthy AIH vs PBC AIH vs OS AIH vs DILI
1 acetoacetate ↑b ↑b ↑b ↑b
2 acetone ↑b ↑b ↑b ↑b
3 β-hydroxyisobutyrate ↑b ↑b ↑b ↑b
4 citrate ↑b ↑b ↑b ↑b
5 creatine ↑b ↑b ↑b ↑b
6 dimethylamine ↑b ↑b ↑b ↑b
7 glutamine ↑b ↑b ↑b ↑b
8 histidine ↑b ↑b ↑b ↑b
9 pyruvate ↑b ↑b ↑b ↑b
a↑ denotes significantly higher amounts of the metabolite in the AIH patients compared to that in the healthy controls or other diseases. bp < 0.000.
Journal of Proteome Research Article
dx.doi.org/10.1021/pr500462f | J. Proteome Res. 2014, 13, 3792−38013796
markers and the clinical indices of AIH and other diseases areshown in Tables S2−S5. The intercept of the Q2 curves (FigureS3) indicated that the diagnostic models were statisticallyreliable and that the high predictability was not due tooverfitting of the data.
Diagnostic Performance Test and Prediction
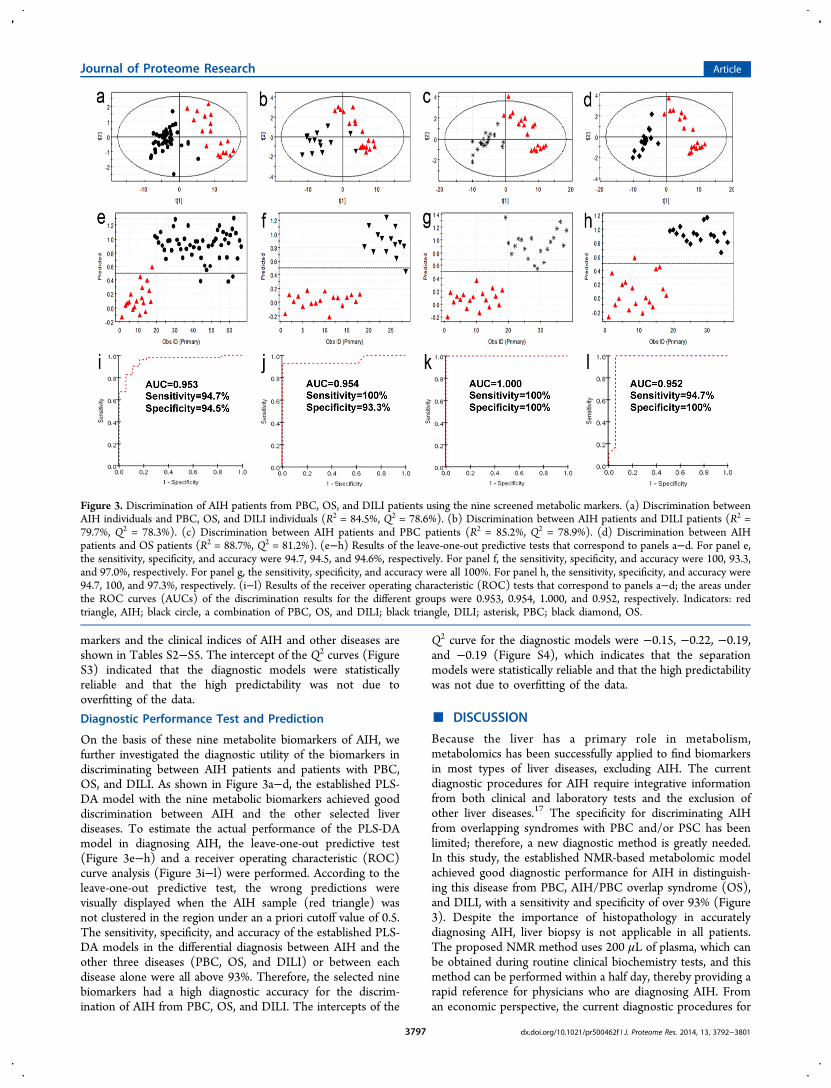
On the basis of these nine metabolite biomarkers of AIH, wefurther investigated the diagnostic utility of the biomarkers indiscriminating between AIH patients and patients with PBC,OS, and DILI. As shown in Figure 3a−d, the established PLS-DA model with the nine metabolic biomarkers achieved gooddiscrimination between AIH and the other selected liverdiseases. To estimate the actual performance of the PLS-DAmodel in diagnosing AIH, the leave-one-out predictive test(Figure 3e−h) and a receiver operating characteristic (ROC)curve analysis (Figure 3i−l) were performed. According to theleave-one-out predictive test, the wrong predictions werevisually displayed when the AIH sample (red triangle) wasnot clustered in the region under an a priori cutoff value of 0.5.The sensitivity, specificity, and accuracy of the established PLS-DA models in the differential diagnosis between AIH and theother three diseases (PBC, OS, and DILI) or between eachdisease alone were all above 93%. Therefore, the selected ninebiomarkers had a high diagnostic accuracy for the discrim-ination of AIH from PBC, OS, and DILI. The intercepts of the
Q2 curve for the diagnostic models were −0.15, −0.22, −0.19,and −0.19 (Figure S4), which indicates that the separationmodels were statistically reliable and that the high predictabilitywas not due to overfitting of the data.
■ DISCUSSION
Because the liver has a primary role in metabolism,metabolomics has been successfully applied to find biomarkersin most types of liver diseases, excluding AIH. The currentdiagnostic procedures for AIH require integrative informationfrom both clinical and laboratory tests and the exclusion ofother liver diseases.17 The specificity for discriminating AIHfrom overlapping syndromes with PBC and/or PSC has beenlimited; therefore, a new diagnostic method is greatly needed.In this study, the established NMR-based metabolomic modelachieved good diagnostic performance for AIH in distinguish-ing this disease from PBC, AIH/PBC overlap syndrome (OS),and DILI, with a sensitivity and specificity of over 93% (Figure3). Despite the importance of histopathology in accuratelydiagnosing AIH, liver biopsy is not applicable in all patients.The proposed NMR method uses 200 μL of plasma, which canbe obtained during routine clinical biochemistry tests, and thismethod can be performed within a half day, thereby providing arapid reference for physicians who are diagnosing AIH. Froman economic perspective, the current diagnostic procedures for
Figure 3. Discrimination of AIH patients from PBC, OS, and DILI patients using the nine screened metabolic markers. (a) Discrimination betweenAIH individuals and PBC, OS, and DILI individuals (R2 = 84.5%, Q2 = 78.6%). (b) Discrimination between AIH patients and DILI patients (R2 =79.7%, Q2 = 78.3%). (c) Discrimination between AIH patients and PBC patients (R2 = 85.2%, Q2 = 78.9%). (d) Discrimination between AIHpatients and OS patients (R2 = 88.7%, Q2 = 81.2%). (e−h) Results of the leave-one-out predictive tests that correspond to panels a−d. For panel e,the sensitivity, specificity, and accuracy were 94.7, 94.5, and 94.6%, respectively. For panel f, the sensitivity, specificity, and accuracy were 100, 93.3,and 97.0%, respectively. For panel g, the sensitivity, specificity, and accuracy were all 100%. For panel h, the sensitivity, specificity, and accuracy were94.7, 100, and 97.3%, respectively. (i−l) Results of the receiver operating characteristic (ROC) tests that correspond to panels a−d; the areas underthe ROC curves (AUCs) of the discrimination results for the different groups were 0.953, 0.954, 1.000, and 0.952, respectively. Indicators: redtriangle, AIH; black circle, a combination of PBC, OS, and DILI; black triangle, DILI; asterisk, PBC; black diamond, OS.
Journal of Proteome Research Article
dx.doi.org/10.1021/pr500462f | J. Proteome Res. 2014, 13, 3792−38013797
AIH, which include a set of autoimmune antibodies and clinicalbiochemistry indices, cost over 1000 RMB (160 USD);however, the NMR-based metabolomics test costs approx-imately 50 RMB (8 USD). Therefore, the 1H NMR-basedmetabolomics diagnostic approach may offer useful referencevalues for clinicians in practice.AIH is an immune-related disease with progressive liver
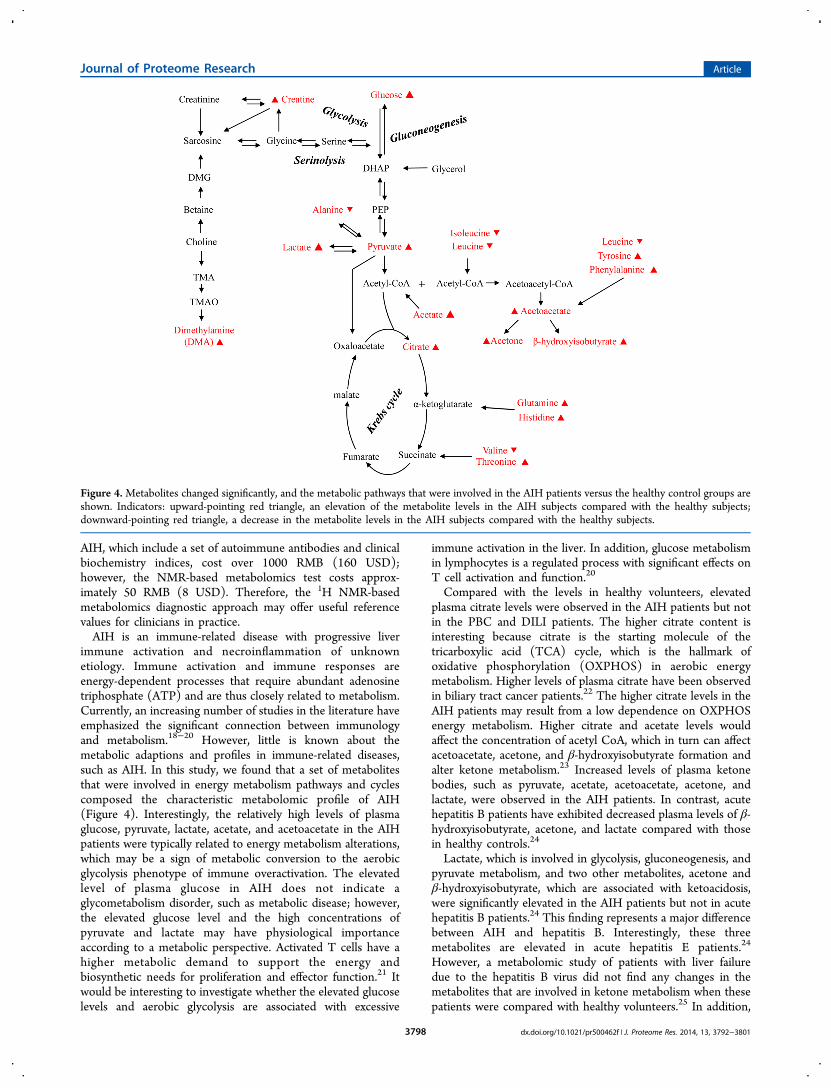
immune activation and necroinflammation of unknownetiology. Immune activation and immune responses areenergy-dependent processes that require abundant adenosinetriphosphate (ATP) and are thus closely related to metabolism.Currently, an increasing number of studies in the literature haveemphasized the significant connection between immunologyand metabolism.18−20 However, little is known about themetabolic adaptions and profiles in immune-related diseases,such as AIH. In this study, we found that a set of metabolitesthat were involved in energy metabolism pathways and cyclescomposed the characteristic metabolomic profile of AIH(Figure 4). Interestingly, the relatively high levels of plasmaglucose, pyruvate, lactate, acetate, and acetoacetate in the AIHpatients were typically related to energy metabolism alterations,which may be a sign of metabolic conversion to the aerobicglycolysis phenotype of immune overactivation. The elevatedlevel of plasma glucose in AIH does not indicate aglycometabolism disorder, such as metabolic disease; however,the elevated glucose level and the high concentrations ofpyruvate and lactate may have physiological importanceaccording to a metabolic perspective. Activated T cells have ahigher metabolic demand to support the energy andbiosynthetic needs for proliferation and effector function.21 Itwould be interesting to investigate whether the elevated glucoselevels and aerobic glycolysis are associated with excessive
immune activation in the liver. In addition, glucose metabolismin lymphocytes is a regulated process with significant effects onT cell activation and function.20
Compared with the levels in healthy volunteers, elevatedplasma citrate levels were observed in the AIH patients but notin the PBC and DILI patients. The higher citrate content isinteresting because citrate is the starting molecule of thetricarboxylic acid (TCA) cycle, which is the hallmark ofoxidative phosphorylation (OXPHOS) in aerobic energymetabolism. Higher levels of plasma citrate have been observedin biliary tract cancer patients.22 The higher citrate levels in theAIH patients may result from a low dependence on OXPHOSenergy metabolism. Higher citrate and acetate levels wouldaffect the concentration of acetyl CoA, which in turn can affectacetoacetate, acetone, and β-hydroxyisobutyrate formation andalter ketone metabolism.23 Increased levels of plasma ketonebodies, such as pyruvate, acetate, acetoacetate, acetone, andlactate, were observed in the AIH patients. In contrast, acutehepatitis B patients have exhibited decreased plasma levels of β-hydroxyisobutyrate, acetone, and lactate compared with thosein healthy controls.24
Lactate, which is involved in glycolysis, gluconeogenesis, andpyruvate metabolism, and two other metabolites, acetone andβ-hydroxyisobutyrate, which are associated with ketoacidosis,were significantly elevated in the AIH patients but not in acutehepatitis B patients.24 This finding represents a major differencebetween AIH and hepatitis B. Interestingly, these threemetabolites are elevated in acute hepatitis E patients.24
However, a metabolomic study of patients with liver failuredue to the hepatitis B virus did not find any changes in themetabolites that are involved in ketone metabolism when thesepatients were compared with healthy volunteers.25 In addition,
Figure 4.Metabolites changed significantly, and the metabolic pathways that were involved in the AIH patients versus the healthy control groups areshown. Indicators: upward-pointing red triangle, an elevation of the metabolite levels in the AIH subjects compared with the healthy subjects;downward-pointing red triangle, a decrease in the metabolite levels in the AIH subjects compared with the healthy subjects.
Journal of Proteome Research Article
dx.doi.org/10.1021/pr500462f | J. Proteome Res. 2014, 13, 3792−38013798
high levels of plasma lactate and pyruvate have been found inpatients with non-alcoholic steatohepatitis (NASH)26 and in amouse model of non-alcoholic fatty liver disease (NAFLD);27
however, the most altered metabolic pathways in fatty liver-related diseases were lipids28 and bile salts.29
In the AIH patients, we did not observe any evident changesin plasma bile salts compared with that in the healthy controls.However, significant alterations in bile acids have been found inother autoimmune liver diseases, primary biliary cirrhosis(PBC), and primary sclerosing cholangitis (PSC) in a pilotstudy.12 Therefore, bile salts may be important biomarkers indiscriminating AIH from PBC and PSC. In a recent review,cholestatic phenotypes have an estimated prevalence of 14−18% in patients with AIH.30 A diagnosis of AIH with cholestaticphenotypes is important for optimizing clinical treatmentsbecause the severity of cholestasis in AIH patients has beenassociated with diminished responsiveness of corticosteroidtreatment.31 Metabolomics may be useful in investigating thepathogenic mechanisms of overlap between AIH and otherautoimmune liver diseases. Limited by the resolving ability ofNMR, the detailed profiles of the bile acid spectrum wereinaccessible in this study. In other metabolomic studies thatutilized gas or liquid chromatography−tandem mass spectrom-etry, the ratios of conjugated versus unconjugated bile acids andglyco- versus tauro-conjugated bile acids were importantbiomarkers in chronic cholestatic liver diseases.12,32 However,the differences in bile acid metabolism between AIH, PBC,PSC, and other cholestatic liver diseases that are induced byviruses are unclear.Elevated creatine levels were observed in the AIH group
compared with that in the healthy controls and in the PBC, OS,and DILI patients. Creatine is phosphorylated to phosphoc-reatine in muscle, and an elevated concentration may indicatethe physiological state of an energy metabolism disorder.9,33
Because most creatine (>95%) is stored in muscles asphosphocreatine, which should not diffuse across themembrane of muscle cells, elevated plasma creatine levelsmay indicate low blood uptake by muscles.32 This reduceduptake would lead to a low energy supply and may beassociated with clinical symptoms, such as fatigue, whichfrequently occur in AIH patients. Detecting muscle phosphoc-reatine levels in AIH patients may further confirm thispostulation. In addition, the codevelopment of AIH andpolymyositis, dermatomyositis, and other inflammatory myo-pathies that are closely related to creatine metabolism mayoccur.34,35 The observed elevation of plasma creatine levels inthe AIH patients needs further clarification in relationship tocoexisting myopathic diseases.Elevated serum histidine, tyrosine, and phenylalanine levels
were observed in the AIH patients compared with those in thehealthy controls, indicating that abnormal amino acidmetabolism occurs in AIH. In contrast, these three aminoacids were found to decrease in patients with acute hepatitis Band E, and these decreases were attributed to low levels ofbiosynthesis precursors.24 Elevated serum tyrosine and phenyl-alanine levels have been observed in NAFLF/NASH26 andHCC patients.36 Therefore, AIH, HCC, and NASH, but notacute hepatitis B and E, may trigger similar molecular eventsthat are involved in tyrosine and phenylalanine metabolism.Tyrosine, phenylalanine, and histidine are aromatic amino acids(AAAs) that are typically elevated in patients with liver failureand fulminant hepatitis37 and are accompanied by decreasedbranched-chain amino acids (BCAAs).38 Elevated AAAs and
decreased BCAAs, including leucine/isoleucine and valine, wereobserved in the AIH patients compared with those in thehealthy controls. According to this amino acid metabolismfeature, AIH patients may progress to hepatic encephalopathy,especially cirrhosis and late-stage patients. An acute severepresentation has been observed in AIH patients, which ischaracterized by hepatic encephalopathy within 8 weeks ofclinical symptoms.5,39
In summary, we presented the metabolomic profile andmetabolic phenotype of AIH for the first time. Our resultsemphasize the relationship and interaction between theautoimmune response and metabolism. Despite the importanceof altering cell metabolism using current treatments (pre-dnisone and azathioprine) and despite the immunosuppressiveeffects of these drugs, little is known about the metabolicadaptations that occur in vivo, which interfere with theautoimmune response and inflammation. Further investigationinto this interaction could offer a new perspective on thepathogenesis of autoimmune liver diseases and noveltherapeutic targets. Moreover, we provided proof-of-conceptevidence that the 1H NMR analysis of plasma metabolites canbe used to differentiate AIH patients from PBC, DILI, andPBC/AIH overlap patients. Magnetic resonance imagingtechnology has become commonplace in clinical diagnosis;therefore, NMR technology could be easily incorporated into astandard laboratory test approach.There were two main limitations to this study. First, the
sample size of this study was limited due to the small number ofoverlap patients and the absence of PSC patients. In addition,blood samples from asymptomatic patients in the early stage ofAIH were not collected. It is challenging to make an accuratediagnosis in asymptomatic patients who account for 34−45% ofall AIH patients.40 Therefore, the ability to make an earlydiagnosis of AIH is valuable. In future studies, we will use thismetabolomics method to screen asymptomatic patients withsuspected AIH in the clinic. Those patients will be followed,and the progression of their disease will be monitored toevaluate the early diagnostic capability of the metabolomicsmethod.
■ ASSOCIATED CONTENT*S Supporting Information
Representative plasma 1H NMR spectra; representative 600MHz one-dimensional CPMG 1H NMR spectra of healthyhuman plasma sample measured at 64 K; PLS-DA modelvalidation of AIH and controls (healthy and PBC individuals);PLS-DA model validation of AIH and controls (PBC, OS, andDILI individuals); identification for the screened integralsegments with the specified |Pcorr| cutoffs and VIP values;correlation analysis between the nine diagnostic metabolicbiomarkers and clinical indices in AIH; correlation analysisbetween the nine diagnostic metabolic biomarkers and clinicalindices in PBC; correlation analysis between the nine diagnosticmetabolic biomarkers and clinical indices in OS; andcorrelation analysis between the nine diagnostic metabolicbiomarkers and clinical indices in DILI. This material isavailable free of charge via the Internet at http://pubs.acs.org.
■ AUTHOR INFORMATIONCorresponding Authors
*(Z.-s.Z.) E-mail: [email protected]; Tel/Fax: +86 10 66933424.
Journal of Proteome Research Article
dx.doi.org/10.1021/pr500462f | J. Proteome Res. 2014, 13, 3792−38013799
*(X.-h.X.) E-mail: [email protected], [email protected]; Tel/Fax: +86 10 6693 3322.
Author Contributions¶J.-b.W., S.-b.P., and Y.S. contributed equally to this work.
Notes
The authors declare no competing financial interest.
■ ACKNOWLEDGMENTSThis work was supported by the National Natural ScienceFoundation of China (nos. 81373984 and 81330090) and theNational Key Technology R&D Program (no. 2012ZX10005010-002-002). The authors acknowledge Fu-sheng Wang forhis suggestions regarding the study design and comments onthe manuscript.
■ ABBREVIATIONSAIH, autoimmune hepatitis; AAAs, aromatic amino acids;AMA, antimitochondrial antibodies; ANA, antinuclear antibod-ies; BCAAs, branched chain amino acids; DILI, drug-inducedliver injury; OS, PBC/AIH overlap syndrome; PBC, primarybiliary cirrhosis; Pcorr, correlation coefficient; PLS-DA, partialleast-squares discriminant analysis; Q2, parameter for thepredictive ability of the model; R2, parameter for the fitnessof the model; ROC, receiver operating characteristic; VIP,variable importance in the projection; 1H NMR, proton nuclearmagnetic resonance spectroscopy
■ REFERENCES(1) Edward, L.; Krawitt, M. D. Autoimmune hepatitis. N. Engl. J. Med.2006, 354, 54−66.(2) Alvarez, F.; Berg, P. A.; Bianchi, F. B.; Bianchi, L.; Burroughs, A.K.; Cancado, E. L.; et al. International Autoimmune Hepatitis Groupreport: review of criteria for diagnosis of autoimmune hepatitis. J.Hepatol. 1999, 31, 929−938.(3) Czaja, A. J. Challenges in the diagnosis and management ofautoimmune hepatitis. Can. J. Gastroenterol. 2013, 27, 531−539.(4) Zachou, K.; Muratori, P.; Koukoulis, G. K.; Granito, A.; Gatselis,N.; Fabbri, A.; et al. Autoimmune hepatitis − current management andchallenges. Aliment. Pharmacol. Ther. 2013, 38, 887−913.(5) Manns, M. P.; Czaja, A. J.; Gorham, J. D.; Krawitt, E. L.; Mieli-Vergani, G.; Vergani, D.; Vierling, J. M. Diagnosis and management ofautoimmune hepatitis. Hepatology 2010, 51, 2193−2213.(6) Manns, M. P.; Strassburg, C. P. Autoimmune hepatitis: clinicalchallenges. Gastroenterology 2001, 120, 1502−1517.(7) Boberg, K. M.; Fausa, O.; Haaland, T.; Holter, E.; Mellbye, O. J.;Spurkland, A.; Schrumpf, E. Features of autoimmune hepatitis inprimary sclerosing cholangitis: an evaluation of 114 primary sclerosingcholangitis patients according to a scoring system for the diagnosis ofautoimmune hepatitis. Hepatology 1996, 23, 1369−1376.(8) Beyoglu, D.; Idle, J. R. The metabolomic window intohepatobiliary disease. J. Hepatol. 2013, 59, 842−858.(9) Saude, E. J.; Skappak, C. D.; Regush, S.; Cook, K.; Ben-Zvi, A.;Becker, A.; Moqbel, R.; Sykes, B. D.; Rowe, B. H.; Adamko, D. J.Metabolomic profiling of asthma: diagnostic utility of urine nuclearmagnetic resonance spectroscopy. J. Allergy Clin. Immunol. 2011, 127,757−764.(10) Reisdorph, N.; Wechsler, M. E. Utilizing metabolomics todistinguish asthma phenotypes: strategies and clinical implications.Allergy 2013, 68, 959−962.(11) Mehrpour, M.; Kyani, A.; Tafazzoli, M.; Fathi, F.; Joghataie, M.T. A metabonomics investigation of multiple sclerosis by nuclearmagnetic resonance. Magn. Reson. Chem. 2013, 51, 102−109.(12) Trottier, J.; Białek, A.; Caron, P.; Straka, R. J.; Heathcote, J.;Milkiewicz, P.; Barbier, O. Metabolomic profiling of 17 bile acids in
serum from patients with primary biliary cirrhosis and primarysclerosing cholangitis: a pilot study. Dig. Liver Dis. 2012, 44, 303−310.(13) Broadhurst, D. I.; Kell, D. B. Statistical strategies for avoidingfalse discoveries in metabolomics and related experimengts. Metab-olomics 2006, 2, 171−196.(14) van den Berg, R. A.; Hoefsloot, H. C.; Westerhuis, J. A.; Smilde,A. K.; van der Werf, M. J. Centering, scaling, and transformations:improving the biological information content of metabolomics data.BMC Genomics 2006, 8, 142.(15) Chang, D.; Weljie, A.; Newton, J. Leveraging latent informationin NMR spectra for robust predictive models. Pac. Symp. Biocomput.2007, 115−126.(16) Brindle, J. T.; Antti, H.; Holmes, E.; Tranter, G.; Nicholson, J.K.; Bethell, H. W.; Clarke, S.; Schofield, P. M.; McKilligin, E.;Mosedale, D. E.; Grainger, D. J. Rapid and noninvasive diagnosis ofthe presence and severity of coronary heart disease using 1H-NMR-based metabonomics. Nat. Med. 2002, 8, 1439−1444.(17) Czaja, A. J. The management of autoimmune hepatitis beyondconsensus guidelines. Aliment. Pharmacol. Ther. 2013, 38, 343−364.(18) Jones, R. G.; Thompson, C. B. Revving the engine: signaltransduction fuels T cell activation. Immunity 2007, 27, 173−178.(19) Vander Heiden, M. G.; Cantley, L. C.; Thompson, C. B.Understanding the Warburg effect: the metabolic requirements of cellproliferation. Science 2009, 324, 1029−1033.(20) Gatza, E.; Wahl, D. R.; Opipari, A. W.; Sundberg, T. B.; Reddy,P.; Liu, C.; Glick, G. D.; Ferrara, J. L. M. Manipulating thebioenergetics of alloreactive T cells causes their selective apoptosisand arrests graft-versus-host disease. Sci. Transl. Med. 2011, 3, 67ra8.(21) MacIver, N. J.; Jacobs, S. R.; Wieman, H. L.; Wofford, J. A.;Coloff, J. L.; Rathmell, J. C. Glucose metabolism in lymphocytes is aregulated process with significant effects on immune cell function andsurvival. J. Leukocyte Biol. 2008, 84, 949−957.(22) Wen, H.; Yoo, S. S.; Kang, J.; Kim, H. G.; Park, J.-S.; Jeong, S.;Lee, J. I.; Kwon, H. N.; Kang, S.; Lee, D.-H.; Park, S. A new NMR-based metabolomics approach for the diagnosis of biliary tract cancer.J. Hepatol. 2010, 52, 228−233.(23) Lardy, H. A.; Paetkau, V.; Walter, P. Paths of carbon ingluconeogenesis and lipogenesis: the role of mitochondria in supplyingprecursors of phosphoenolpyruvate. Proc. Natl. Acad. Sci. U.S.A. 1965,53, 1410−1415.(24) Munshi, S. U.; Taneja, S.; Bhavesh, N. S.; Shastri, J.; Aggarwal,R.; Jameel, S. Metabonomic analysis of hepatitis E patients showsderegulated metabolic cycles and abnormalities in amino acidmetabolism. J. Viral Hepatitis 2011, 18, e591−e602.(25) Yu, K.; Sheng, G.; Sheng, J.; Chen, Y.; Xu, W.; Liu, X.; Cao, H.;Qu, H.; Cheng, Y.; Li, L. A metabonomic investigation on thebiochemical perturbation in liver failure patients caused by hepatitis Bvirus. J. Proteome Res. 2007, 6, 2413−2419.(26) Kalhan, S. C.; Guo, L.; Edmison, J.; Dasarathy, S.; McCullough,A. J.; Hanson, R. W.; et al. Plasma metabolomic profile in non-alcoholic fatty liver disease. Metabolism 2011, 60, 404−413.(27) Toye, A. A.; Dumas, M. E.; Blancher, C.; Rothwell, A. R.;Fearnside, J. F.; Wilder, S. P.; et al. Subtle metabolic and liver genetranscriptional changes underlie diet-induced fatty liver susceptibilityin insulin-resistant mice. Diabetologia 2007, 50, 1867−1879.(28) Puri, P.; Wiest, M. M.; Cheung, O.; Mirshahi, F.; Sargeant, C.;Min, H. K.; et al. The plasma lipidomic signature of non-alcoholicsteatohepatitis. Hepatology 2009, 50, 1827−1838.(29) Garcia-Canaveras, J. C.; Donato, M. T.; Castell, J. V.; Lahoz, A.A comprehensive untargeted metabonomic analysis of human steatoticliver tissue by RP and HILIC chromatography coupled to massspectrometry reveals important metabolic alterations. J. Proteome Res.2011, 10, 4825−4834.(30) Czaja, A. J. Cholestatic phenotypes of autoimmune hepatitis.Clin. Gastroenterol. Hepatol. [Online early access.] DOI: 10.1016/j.cgh.2013.08.039. Published Online: Sept 9, 2013.(31) Chazouilleres, O.; Wendum, D.; Serfaty, L.; et al. Primary biliarycirrhosis−autoimmune hepatitis overlap syndrome: clinical featuresand response to therapy. Hepatology 1998, 28, 296−301.
Journal of Proteome Research Article
dx.doi.org/10.1021/pr500462f | J. Proteome Res. 2014, 13, 3792−38013800
(32) Wang, X.; Zhang, A.; Han, Y.; Wang, P.; Sun, H.; Song, G.;Dong, T.; Yuan, Y.; Yuan, X.; Zhang, M.; Xie, N.; Zhang, H.; Dong,H.; Dong, W. Urine metabolomics analysis for biomarker discoveryand detection of jaundice syndrome in patients with liver disease. Mol.Cell. Proteomics 2012, 11, 370−380.(33) Fitch, C. D.; Sinton, D. W. A study of creatine metabolism indiseases causing muscle wasting. J. Clin. Invest. 1964, 43, 444−452.(34) Hounoki, H.; Shinoda, K.; Ogawa, R.; Taki, H.; Tsuneyama, K.;Tobe, K. Simultaneously developed polymyositis and autoimmunehepatitis. BMJ Case Rep. 2011, 8, bcr0920114763.(35) Kurihara, Y.; Shishido, T.; Oku, K.; Takamatsu, M.; Ishiguro, H.;Suzuki, A.; Sekita, T.; Shinagawa, T.; Ishihara, T.; Nakashima, R.; Fujii,T.; Okano, Y. Polymyositis associated with autoimmune hepatitis,primary biliary cirrhosis, and autoimmunethrombocytopenic purpura.Mod. Rheumatol. 2011, 21, 325−329.(36) Gao, H.; Lu, Q.; Liu, X.; Cong, H.; Zhao, L.; Wang, H.; et al.Application of 1H NMR based metabonomics in the study ofmetabolic profiling of human hepatocellular carcinoma and livercirrhosis. Cancer Sci. 2009, 100, 782−785.(37) Tessari, P.; Vettore, M.; Millioni, R.; Puricelli, L.; Orlando, R.Effect of liver cirrhosis on phenylalanine and tyrosine metabolism.Curr. Opin. Clin. Nutr. Metab. Care 2010, 13, 81−86.(38) Tajiri, K.; Shimizu, Y. Branched-chain amino acids in liverdiseases. World J. Gastroenterol. 2013, 19, 7620−7629.(39) Kessler, W. R.; Cummings, O. W.; Eckert, G.; Chalasani, N.;Lumeng, L.; Kwo, P. Y. Fulminant hepatic failure as the initialpresentation of acute autoimmune hepatitis. Clin. Gastroenterol.Hepatol. 2004, 2, 625−631.(40) Feld, J. J.; Dinh, H.; Arenovich, T.; Marcus, V. A.; Wanless, I. R.;Heathcote, E. J. Autoimmune hepatitis: effect of symptoms andcirrhosis on natural history and outcome. Hepatology 2005, 42, 53−62.
Journal of Proteome Research Article
dx.doi.org/10.1021/pr500462f | J. Proteome Res. 2014, 13, 3792−38013801