Embed Size (px)
Citation preview

TECHNICAL ADVANCE
Metabolomic profiling of wild-type and mutant soybean rootnodules using laser-ablation electrospray ionization massspectrometry reveals altered metabolism
Beverly J. Agtuca1 , Sylwia A. Stopka2 , Sterling Evans1 , Laith Samarah2 , Yang Liu3, Dong Xu3,
Minviluz G. Stacey1 , David W. Koppenaal4, Ljiljana Pa�sa-Toli�c4, Christopher R. Anderton4 , Akos Vertes2 and
Gary Stacey1*1Divisions of Plant Sciences and Biochemistry, Christopher S. Bond Life Sciences Center, University of Missouri, Columbia,
MO, 65211, USA,2Department of Chemistry, The George Washington University, Washington, DC, 20052, USA,3Department of Electrical Engineering and Computer Science, Informatics Institute and Christopher S. Bond Life Sciences
Center, University of Missouri-Columbia, Columbia, MO, 65211, USA, and4Environmental Molecular Sciences Laboratory, Earth and Biological Sciences Directorate, Pacific Northwest National Labo-
ratory, 902 Battelle Boulevard, Richland, WA, 99354, USA
Received 19 June 2019; revised 5 April 2020; accepted 17 April 2020.
*For correspondence (e-mail: [email protected]).
SUMMARY
The establishment of the nitrogen-fixing symbiosis between soybean and Bradyrhizobium japonicum is a
complex process. To document the changes in plant metabolism as a result of symbiosis, we utilized laser
ablation electrospray ionization-mass spectrometry (LAESI-MS) for in situ metabolic profiling of wild-type
nodules, nodules infected with a B. japonicum nifH mutant unable to fix nitrogen, nodules doubly infected
by both strains, and nodules formed on plants mutated in the stearoyl-acyl carrier protein desaturase
(sacpd-c) gene, which were previously shown to have an altered nodule ultrastructure. The results showed
that the relative abundance of fatty acids, purines, and lipids was significantly changed in response to the
symbiosis. The nifH mutant nodules had elevated levels of jasmonic acid, correlating with signs of nitrogen
deprivation. Nodules resulting from the mixed inoculant displayed similar, overlapping metabolic distribu-
tions within the sectors of effective (fix+) and ineffective (nifH mutant, fix�) endosymbionts. These data are
inconsistent with the notion that plant sanctioning is cell autonomous. Nodules lacking sacpd-c displayed
an elevation of soyasaponins and organic acids in the central necrotic regions. The present study demon-
strates the utility of LAESI-MS for high-throughput screening of plant phenotypes. Overall, nodules
disrupted in the symbiosis were elevated in metabolites related to plant defense.
Keywords: LAESI-MS, nodulation, nitrogen fixation, metabolites, plant defense, sacpd-c, soybean, sanc-
tions, high-throughput, mass spectrometry, technical advance.
INTRODUCTION
The nitrogen-fixing symbiosis between legumes and rhizo-
bia provides approximately 40 million tons of nitrogen into
agricultural systems each year (Oldroyd, 2013; Udvardi and
Poole, 2013). This symbiotic relationship is ecologically
beneficial because it improves soil health, diminishes the
use of fossil fuels, and lessens the negative environmental
effects resulting from agricultural practices (Hardy and
Havelka, 1975; Udvardi and Poole, 2013; Vicente and Dean,
2017). Recently, there has been a resurgence of interest in
the possibility of transferring the rhizobial, nitrogen-fixing
symbiosis to non-legumes (e.g. corn) (Charpentier and
Oldroyd, 2010; Beatty and Good, 2011). However, for this
to become a practical possibility, a more in-depth under-
standing of the physiology of legume nodule formation
and function is required.
The symbiotic interaction between the symbiont,
Bradyrhizobium japonicum, and soybean roots involves a
© 2020 Society for Experimental Biology and John Wiley & Sons Ltd 1
The Plant Journal (2020) doi: 10.1111/tpj.14815

complex communication process involving different sig-
naling molecules crucial for the initiation and development
of root nodules (Stacey, 2007; Oldroyd, 2013). The net
result of this communication and coordination is the for-
mation of a specialized organ, called a nodule, on the
roots. Biological nitrogen fixation (BNF) takes place inside
the nodules, where atmospheric dinitrogen is converted
into ammonia, a nutrient form that can be metabolized by
plants (Udvardi and Poole, 2013).
To determine the molecular mechanisms involved in
nodulation, researchers have utilized transcriptomics and
proteomics to identify and characterize genes and proteins
critical for the symbiosis (Stacey et al., 2006; Libault, 2018).
Relatively few studies have explored the nodule metabo-
lome. Although transcriptomics and proteomics are
undoubtedly useful, they do not provide direct evidence
that the genes and proteins detected are indeed metaboli-
cally active under the various conditions studied. On the
other hand, metabolomic profiling provides a direct read-
out of the metabolism that is occurring. Most of the pub-
lished studies of the nodule metabolome have used bulk
methods, in which the nodules were extracted and the
metabolites were measured. For example, studies have uti-
lized technologies such as gas chromatography-mass
spectrometry (MS), high-performance liquid chromatogra-
phy-MS, and capillary electrophoresis-MS (Sato et al.,
1998; Soga et al., 2003; Colebatch et al., 2004; Desbrosses
et al., 2005; Barsch et al., 2006a,b; Larrainzar et al., 2007;
Harada and Fukusaki, 2009; Brechenmacher et al., 2010;
Zhang et al., 2012; Wang et al., 2015). All of these
approaches require extensive sample preparation that
eliminates the possibility of also acquiring information on
the spatial distribution of the various metabolites. Spatial
information can be beneficial by, for example, allowing
correlation between the distribution of metabolites pro-
duced in a single pathway or related pathways, such as
hormonal pathways regulating plant growth. Acquiring
information on the spatial distribution of metabolites
requires the use of MS methods that are spatially explicit
MS techniques. For example, matrix-assisted laser desorp-
tion/ionization (MALDI)-MS imaging (MSI) is a technique,
most commonly performed under vacuum, for spatially
mapping biomolecules (Veli�ckovi�c et al., 2018). However,
this method requires the application of an organic matrix
resulting in spectral interference and it can suffer from a
narrow dynamic range (Ye et al., 2013; Gemperline et al.,
2015). Ambient, direct analysis MS methods, such as laser
ablation electrospray ionization MS (LAESI-MS), are gain-
ing popularity because of the ability to spatially probe bio-
logical tissues with minimal sample preparation. Briefly,
LAESI-MS utilizes a mid-infrared laser that couples energy
directly into the O-H vibrations of water molecules (Nemes
and Vertes, 2007). Because plant cells have a high-water
content, this technique is amenable to the direct analysis
of metabolites. Previously, we demonstrated the applica-
tion of LAESI-MS for the direct analysis of soybean nod-
ules infected by wild-type (WT) B. japonicum (Stopka et al.,
2017). In this study, known metabolites in the nodules
were detected similarly to other bulk MS analyses; how-
ever, the LAESI-MS approach provided information on the
spatial distribution of these metabolites.
To provide insight into the soybean symbiotic relation-
ship, plant and bacterial mutants are key tools for the identi-
fication of metabolites required for the establishment and
maintenance of symbiotic nitrogen fixation. For example, to
study nodules that are unable to fix nitrogen (fix�), a
B. japonicum strain with a mutation in the nifH gene, which
encodes the nitrogenase reductase enzyme (Hahn et al.,
1984), can be studied at the metabolic level. Under some cir-
cumstances, nodules can be simultaneously infected with
two strains, localizing to distinct sectors. For example, some
studies have looked closely at nodules infected simultane-
ously with effective (fix+) and ineffective (fix�) rhizobia. Inthis case, the white sectors infected by the fix� strain can be
distinguished from the red (as a result of leghemoglobin)
sectors formed by the fix+ strain. In a number of studies, the
host plant is suggested to have the ability to ‘sanction’ nod-
ules that are unable to fix nitrogen (or fix lower levels of
nitrogen) (Denison, 2000; Kiers et al., 2003). One example is
the study by Regus et al. (2017), who looked specifically at
nodules doubly infected by fix� and fix+ rhizobia. Their sur-
prising conclusion, based largely on microscopy, was that
the plant applied sanctions were cell autonomous and
applied exclusively within the doubly infected nodules to
those sectors infected by the fix� rhizobia. Given that most
plant responses to stress are systemic, this conclusion was
surprising and, hence, in the present study, we examined the
case of doubly infected nodules at a deeper level by examin-
ing themetabolome of the fix� and fix+ sectors.
In addition to examination of nodules resulting from infec-
tion by bacterial mutants, a variety of studies have also uti-
lized plant mutants; for example, to help elucidate signaling
steps involved in nodule initiation (Oldroyd, 2013). Previ-
ously, we showed that the infection of a soybean mutant
defective in the sacpd-c gene not only resulted in nodules
with reduced fixation ability, but also prominent necrotic
areas in the center of the nodules (Gillman et al., 2014). Sub-
sequently, it was found that the sacpd-cmutant nodules also
showed a significantly higher expression of genes usually
associated with plant response to pathogen infection (Krish-
nan et al., 2016). Hence, in the present study, we examined
the metabolome of these sacpd-c mutant nodules to eluci-
date changes associatedwith the necrotic regions.
We employed LAESI-MS, as a result of its capability for
in situ sampling of defined areas, for the rapid phenotypic
screening of nodules that were unable to fix nitrogen,
either because of mutations in the symbiont or the host.
Three different mutants were analyzed: (i) nodules that
© 2020 Society for Experimental Biology and John Wiley & Sons Ltd,The Plant Journal, (2020), doi: 10.1111/tpj.14815
2 Beverly J. Agtuca et al.
were infected by a nifH (fix�) bacterial strain; (ii) nodules
that were infected by a mixed inoculum [wild-type (fix+)
B. japonicum (WT) and nifH (fix�) mutant strain]; and (iii)
sacpd-c mutant nodules. Here, we present the specific
metabolites and affected biochemical pathways based on
these different symbiotic interactions.
RESULTS
Carbon and nitrogen metabolism detected in nitrogen-
fixing soybean roots
In a previous study, we demonstrated the utility of LAESI-
MS to explore the spatial distribution of metabolites in
soybean nodules infected by WT B. japonicum (Stopka
et al., 2017). The metabolites detected and identified were
similar to those identified through bulk MS analyses; how-
ever the LAESI-MS technique provided additional informa-
tion on their spatial distribution. The absence of spatial
variation in ion suppression effects in LAESI-MS of plant
tissues has been demonstrated in the literature. Early
demonstration of meaningful relative metabolite abun-
dances in molecular imaging of plant tissues by LAESI-MS
showed that the spatial variations of secondary metabolite
levels agreed with the pigmentation pattern in variegated
leaves (Nemes et al., 2008). Ion suppression effects for rel-
ative and absolute quantitation for other matrixes and ana-
lytes by LAESI-MS have been considered in the literature.
Successful relative quantitation of antibiotics in the pres-
ence of microbial metabolite gradients and an agar gel
matrix was demonstrated (Li et al., 2016). Absolute quanti-
tation of a neurotoxin in over 180 shellfish samples by
LAESI-MS was demonstrated against regulatory laboratory
results and certified reference materials (Beach et al.,
2016).
As part of the technical validation of the method, we
also demonstrated in-source fragmentation of only certain
molecules, whereas another study reported no in-source
fragmentation (Stopka et al., 2017). To provide stronger
confidence in our results, in a separate study, we utilized a
different MS technique, MALDI-MSI, where we spatially
mapped all metabolites (including those found via LAESI-
MS) in a three-dimensional (3D) configuration within soy-
bean nodules (Veli�ckovi�c et al., 2018).
These previous studies gave us the impetus to utilize
LAESI-MS in a more biologically focused study aiming to
characterize the metabolism associated with soybean nod-
ule function. For example, a vital aspect of a functioning
symbiosis is the exchange of carbon and nitrogen com-
pounds between the host and symbiont (Vance and Hei-
chel, 1991; Udvardi and Poole, 2013). To understand the
metabolism occurring within the soybean roots that were
infected with WT B. japonicum, we sampled three distinct
areas of the primary root anatomy (Figure S1a). Two areas
were sampled at the uninfected and infected root areas,
which were located both on the primary root. The unin-
fected root area was approximately 2 cm away from the
initial developing nodule and the infected root area was at
the point-of-contact with the nodule. The third analyzed
area was the intact nodules from the primary root (Fig-
ure S1a). By selectively targeting each of the distinctive
areas, six biological root segments and nodules were ana-
lyzed using LAESI-MS. Within the uninfected root area,
infected root area, and intact nodule, we detected approxi-
mately 112, 495, and 344 ions, known as spectral features,
respectively, in the negative ion mode. These features are
presumed to represent metabolic constituents, some of
which were identified including 16, 37, and 49 metabolites
within each respective root area (Table S1). To determine
the area specific metabolites, multivariate statistical analy-
sis was performed on the three sample groups. Using par-
tial least squares discriminant analysis (PLS-DA), all three
groups showed a high degree of separation (Figure S1b).
Comparative analyses of infected and uninfected legumes
was performed previously (Barsch et al., 2006a; Brechen-
macher et al., 2010; Lardi et al., 2016). However, these anal-
yses were bulk measurements lacking any spatial
information. In our experiments, we preserved the spatial
information at the distant areas by selectively targeting the
three different regions on the primary root segment
infected by WT B. japonicum.
By sampling carbon and nitrogen metabolism in the dif-
ferent regions of the primary root, we were able to detect
biomolecules that were highly abundant in particular sam-
ple groups (Figure S2 and Table S1). For example, soyas-
aponins, glucosides, and jasmonic acids (JAs) were
detected in higher abundance in the infected root area (Fig-
ure S2a), whereas, in the uninfected root area, lipids, and
sugars were mainly observed (Figure S2b). In the nodule
sample group, several metabolites involved in biological
nitrogen fixation were detected (e.g. adenine, glutamate,
and glutamic acid) (Figure S2c). We were able to detect
hormones, including gibberellin and JA, within the nod-
ules only (Figure S2c).
Following an untargeted approach, pathway enrichment
analysis was performed on each sample group using the
Kyoto Encyclopedia of Genes and Genomes (KEGG) data-
base (https://www.genome.jp/kegg) (Figure S3). In the
infected root area, affected pathways included carbon
metabolism and fatty acid biosynthesis (Figure S3a). As
expected, the carbon metabolism pathway was elevated in
the infected root area because this is the point of nodule
attachment. In the uninfected root area (Figure S3b), we
observed a higher fold enrichment of starch and sucrose
metabolism, whereas amino sugar and nucleotide sugar
metabolism were more abundant in the infected root area.
Furthermore, nitrogen metabolism was strongly enriched
within the nodule (Figure S3c), similar to the findings of
Stopka et al. (2017). Altogether, LAESI-MS has the
© 2020 Society for Experimental Biology and John Wiley & Sons Ltd,The Plant Journal, (2020), doi: 10.1111/tpj.14815
LAESI-MS of wild-type and mutant soybean root nodules 3

capability to detect and localize specific metabolites at dif-
ferent regions of the whole, symbiotic nitrogen-fixing root.
Exploring the metabolite coverage of intact mutant
nodules in soybean that are disrupted in symbiosis
Three nodule types were investigated, including the WT
infected, nifH-infected, and the plant sacpd-c mutant.
Recently, there has been renewed interest in the role that
the plant immune system might play in nodule formation
and maintenance (Cao et al., 2017). To explore this within
the context of nodule metabolism, we made use of sacpd-c
mutant plants for which the nodules show altered ultra-
structure and a concomitant increase in the expression of
genes usually associated with a plant immune response
(Gillman et al., 2014; Krishnan et al., 2016).
Nodules formed by the WT and nifH mutant strains
could be easily differentiated by optical microscopy
because of their distinct coloring of the infection zone. The
WT infected nodules showed a reddish hue in the central
region (as a result of the expression of leghemoglobin),
whereas nodules infected by the nifH mutant strain
showed a white central zone (Figure 1a). These samples
were analyzed using LAESI-MS in both positive and nega-
tive ion modes (Figure S4), in an effort to attain broad
molecular coverage. Likewise, the sacpd-c nodules (Fig-
ure 1a) were also distinguishable by microscopy as a result
of the central necrotic zone (Gillman et al., 2014; Krishnan
et al., 2016). All three groups showed separation when
looking at the PLS-DA plot in Figure 1(b). A closer exami-
nation using volcano plots provided the significantly abun-
dant metabolites in each sample group compared to the
WT infected nodules. These plots had customary cut-off
values of 1 and �1 for log2(fold change) (FC) and P < 0.05
(Figures 1c,d). In total, 663 spectral features were detected
in negative ion mode, of which 127 were significantly
abundant in the nifH nodules and 113 were significantly
abundant in the WT infected nodules (Figure 1c). When
comparing the sacpd-c nodules and WT nodules, 683 spec-
tral features were observed. Among these, 176 were more
abundant in the sacpd-c nodules, whereas 66 were higher
in the WT (Figure 1d). From these two volcano plots, some
significantly regulated metabolites were annotated
(a)
(b) (c) (d)
Figure 1. Metabolite profiling and compounds differentially present in wild-type (WT) and mutant nodules detected in negative ion mode.
(a) Brightfield images of 100-µm thick, nodule sections. Scale bars = 500 lm.
(b) Partial least squares discriminant analysis (PLS-DA) score plot showing the separation of sample types for the WT in red, Bradyrhizobium japonicum nifH
mutant in blue, and sacpd-c mutant nodules in green.
(c, d) Volcano plots showing the number of spectral features biologically and statistically different (i.e. at least a fold change of 2 and a P < 0.05) between the
various sample types. (c) Here, FC = InifH/IWT; thus, compared to B. japonicum WT, significantly downregulated metabolites in B. japonicum nifH nodules are
shown in blue and significantly upregulated species are shown in red. (d) Here, FC = Isacpd-c/IWT; thus, significantly downregulated metabolites in B. japonicum
sacpd-c nodules are shown in green and significantly upregulated species are shown in red.
© 2020 Society for Experimental Biology and John Wiley & Sons Ltd,The Plant Journal, (2020), doi: 10.1111/tpj.14815
4 Beverly J. Agtuca et al.

(Tables S2 and S3) and their roles were investigated in the
symbiotic relationship.
Spatial profiling of nifH and WT nodule sections reveals
differential metabolite distributions
A significant advantage of the in situ LAESI-MS technique
is that it provides molecular information about metabolite
abundance within the confines of the spatial areas sam-
pled. For example, as part of our comparison of nodules
infected by WT B. japonicum versus nodules infected by
the nifH mutant strain, we used LAESI-MS to individually
sample specific regions within the nodule (i.e. epidermis,
cortex and central infection zone). Using a cryostat micro-
tome, soybean root nodules were sectioned to 60 µmthickness and the mid-infrared laser probed the section to
interrogate different anatomical regions of the sample. At
each sample collection region, a mass spectrum in positive
ion mode was obtained to allow ion tracking of metabolite
intensities as a function of location based on absolute ion
counts (Figure 2). Our previous work of single shot abla-
tion in the inner and outer layer (Stopka et al., 2017)
showed that soyasaponin bg was localized in the nodule
epidermis and outer cortex, whereas heme B, reflecting
leghemoglobin distribution, is a useful marker for the cen-
tral infection zone.
Optical images before and after laser ablation of the WT
and nifH nodules provided landmarks of the sampled areas
(Figure 2a,b). The WT nodule lateral profiling consisted of
six laser craters, two of which were at the outer cortex
layer and four within the infection zone (Figure 2a). In this
case, each crater was 300 lm in diameter. Using the
metabolite markers, we tracked the distribution of soyas-
aponin bg and heme B. As observed before, only the outer
layers revealed the presence of soyasaponin bg (Figure 2c),
whereas the inner infection zone showed higher abun-
dance of heme B (Figure 2e). Because the ablation shots
resulted in a large crater, the sixth shot consisted of mate-
rial from both the infection zone and the outer layer (Fig-
ure 2a). As a result of the smaller size of the nifH nodule,
we could acquire only four ablation craters by LAESI-MS
(Figure 2b). Similar to the WT nodules, soyasaponin bgwas abundant at the first and fourth shot, which was local-
ized at the outer layer (Figure 2d). However, consistent
with the lack of red color, heme B showed lower
(a) (b)
(c) (d)
(e) (f)
Figure 2. Spatial profiling of nodule sections inoculated with Bradyrhizobium japonicum wild-type (WT) or nifH mutant in positive ion mode.
Bright field images of before and after ablation: (a) six ablation positions in WT nodule section, and (b) four ablation positions in nodule section with nifH
mutant strain. Scale bars = 500 lm. Ion chromatograms (c and d) showing intensity profiles of soyasaponin bg at m/z = 1069.56 that is present in the outer layer
of the nodules. Ion chromatograms for heme B at m/z = 616.178 that is present at higher intensities (e) in the WT nodule compared to the (f) nifH nodule.
© 2020 Society for Experimental Biology and John Wiley & Sons Ltd,The Plant Journal, (2020), doi: 10.1111/tpj.14815
LAESI-MS of wild-type and mutant soybean root nodules 5
abundance in the infection zone of the nifH nodule com-
pared to the WT nodule (Figure 2f).
Using in situ LAESI-MS lateral profiling, we further
explored the distribution of other metabolites at the differ-
ent regions of the sectioned nodule. By way of example,
Figure 3 shows the results of MS analysis in negative ion
mode from the inner and outer regions of both the WT and
nifH nodules after hierarchical clustering and multivariate
statistical analysis. We detected species with a significant
fold change > 2 and P < 0.05. In general from negative and
positive ion modes, there were a total of 100 metabolites
that were unique in the infection zone and 93 in the outer
layer of the sectioned nodules that were infected by the
WT B. japonicum or the nifH strain (Table S4). The outer
layer and infection zone shared 44 common metabolites
for both sectioned nodules. Taking a closer look at the
outer layer, 56 distinctive metabolites were detected in the
nifH sample and 81 in the WT sample. In the ‘central zone’,
110 metabolites were detected in the WT sample as com-
pared to 34 in the nifH sample (Table S4). The column den-
drogram that is displayed in the heat map showed
separate nodes between the outer layer and the infection
zone areas, as well as having a distinctive separation of
metabolites (Figure 3a). Here, a clear distinction could be
observed for the outer layer and infection zone of both sec-
tioned nodules independent of bacterial strain. Using the
PLS-DA model and combining the covariance and correla-
tion loading profiles, S-plots were constructed (Figure 3b,c).
The metabolites located at the wings of the S-plots are
considered to be significant for each sample group. For
example, in the S-plot of the WT and nifH nodules, the top
wing represents metabolites significant in the outer layer
and the bottom wing displays the infection zone (Fig-
ure 3b,c). Further inspection of these compounds was per-
formed using box-and-whisker plots (Figure 3d) that were
normalized by summing and Pareto scaling. For example,
(a) (b) (c)
(d)
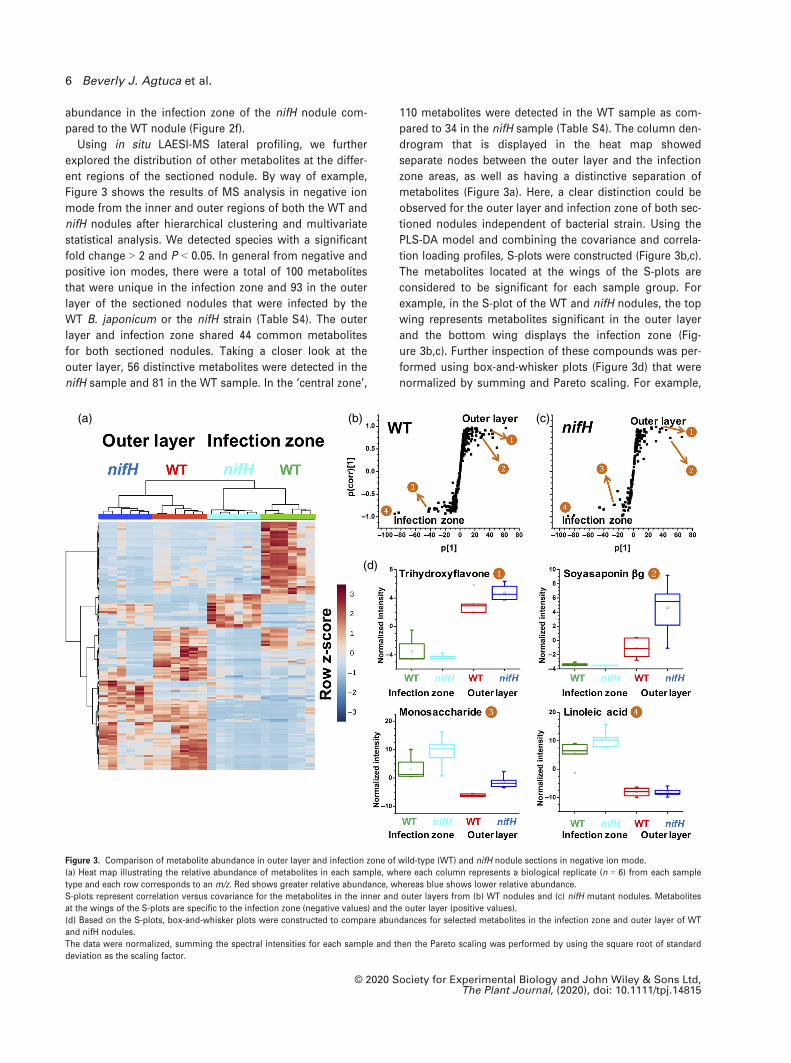
Figure 3. Comparison of metabolite abundance in outer layer and infection zone of wild-type (WT) and nifH nodule sections in negative ion mode.
(a) Heat map illustrating the relative abundance of metabolites in each sample, where each column represents a biological replicate (n = 6) from each sample
type and each row corresponds to an m/z. Red shows greater relative abundance, whereas blue shows lower relative abundance.
S-plots represent correlation versus covariance for the metabolites in the inner and outer layers from (b) WT nodules and (c) nifH mutant nodules. Metabolites
at the wings of the S-plots are specific to the infection zone (negative values) and the outer layer (positive values).
(d) Based on the S-plots, box-and-whisker plots were constructed to compare abundances for selected metabolites in the infection zone and outer layer of WT
and nifH nodules.
The data were normalized, summing the spectral intensities for each sample and then the Pareto scaling was performed by using the square root of standard
deviation as the scaling factor.
© 2020 Society for Experimental Biology and John Wiley & Sons Ltd,The Plant Journal, (2020), doi: 10.1111/tpj.14815
6 Beverly J. Agtuca et al.
trihydroxyflavone and soyasaponin bg were more abun-
dant in the outer layer than the infection zone of the WT
and nifH nodules, whereas a monosaccharide and linoleic
acid were highly localized in the infection zone. This analy-
sis allowed us to determine what metabolites were prefer-
entially present at the different layers of the nodule when
comparing differently sampled nodules.
The metabolites that showed strong localization in either
the outer or inner regions for both the WT versus nifH
mutant nodules are listed in Table 1 from positive and
negative ion mode datasets. In the infection zone of the
WT nodules, metabolites such as glycerophospholipids
[PA(16:0/18:1)], nucleobase-like molecules (adenine,
cyclic-ADP ribose), gibberellin, and homoisocitrate were
abundant, whereas, at the outer layer, tricarboxylic acids
(homocitrate) and fatty acids (arachidic acid, tuberonic acid
glucoside) were higher in abundance. These are known
metabolites from previous studies that have an essential
role in the nitrogen-fixing symbiosis and organogenesis
(Udvardi and Poole, 2013). Furthermore, metabolites
involved in purine metabolism were highly abundant in
the infection zone of the WT nodules (Table 1). In the nifH
nodules, a lower abundance of purines was observed
because this mutant displayed nitrogen-deficiency symp-
toms. Our results were similar to a study that used bulk
metabolic analysis (Lardi et al., 2016). However, in the pre-
sent study, we were able to spatially localize these metabo-
lites in the WT at the infection zone using LAESI-MS.
Additionally, jasmonate related metabolites (e.g. JA,
methyl jasmonate, dihydrojasmonic acid, and hydroxyjas-
monic acid) were abundant in the nifH mutant nodules
within both the infection zone and outer layer (Table 1). JA
Table 1 Localization of metabolites that showed differential abundance detected in sections of nodules formed by either Bradyrhizobiumjaponicum wild-type (WT) or nifH mutant strain at the outer layer and the infection zone. These species had a significant fold change,FC = InifH/IWT ≥ 2, and P < 0.05 and were from positive and negative ion mode datasets
nifH WT
CompoundKEGGID Log2(FC) Compound
KEGGID Log2(FC)
Infection zoneJasmonic acida,c,�,* C08491 �4.6 Cholined,+,* C00114 3.9Glycosyl glycerol-phosphatea,c,�,** C01225 �4.3 Coniceinee,+,** C10138 3.8N-Feruloylglycinee,�,** �3.3 Trihydroxy-tetramethoxyflavone
glucosidea,�,**3.6
Heptosea,�,* C02076 �3.0 PA(16:0/18:1)c,�,* C00416 3.1Hydroxy dimethoxyflavoneglucosided,�,*
�3.0 Adenineb,+,** C00147 3.0
Epoxyoctadecenoic acida,c,�,** C08368 �2.5 Acetyl-glutamic acida,c,�,** C03871 2.8Oxooctadecatrienoic acida,c,�,** C16320 �2.4 Gluconic acidd,�,** C00257 2.5Trihydroxyflavanone glucosided,�,* C09099 �2.1 Cyclic-ADP ribosed,�,* C13050 2.5Dihydrojasmonic acida,c,�,** C16309 �1.9 Coumesterola,c,�,** C10205 2.3Methyl jasmonatea,�,* C11512 �1.5 Hexose phosphatea,c,�,** C01097 1.6
Outer layerHeptosea,�,** C02076 �4.3 Trihydroxy-tetramethoxyflavone
glucosidea,�,**6.0
N-Feruloylglycinee,�,** �4.2 Trihydroxyoctadecenoic acida,�,** C14833 3.0Glycosyl glycerol-phosphatea,c,�,** C01225 �4.2 Ajmalined,�,* C06542 2.5Hydroxyjasmonic acida,�,** C21385 �3.3 Gibberellinb,�,* C01699 2.2Dissacharidea,c,+,** C00208 �2.5 Acetyl-glutamic acida,c,�,* C03871 2.1Tetrahydroxyflavanone glucosidea,c,�,* C16408 �2.0 Methylcitrate/homoisocitratea,�,* C01251 1.7Vanillic acidd,�,* C06672 �1.7 Arachidic acidd,�,** C06425 1.2Phosphocholined,+,* C00588 �1.6 Tuberonic acid glucosidea,c,�,** C08558 1.1Oxooctadecatrienoic acida,c,�,** C16320 �1.2 Gluconic acida,c,�,** C00514 1.0
aCompounds assigned based on ultra-high mass accuracy of 21T-Fourier transform ion cyclotron resonance-mass spectrometry (MS).bCompounds assigned based on in-house tandem MS of standards performed under identical conditions.cCompounds assigned based on tandem MS databases comparisons (http://metlin.scripps.edu; NIST/EPA/NIH Mass Spectral Library Version2.2).dCompounds assigned from Stopka et al. (2017).eCompounds assigned from Veli�ckovi�c et al. (2018).+Positive ion mode.�Negative ion mode.*P < 0.05.** P < 0.005.
© 2020 Society for Experimental Biology and John Wiley & Sons Ltd,The Plant Journal, (2020), doi: 10.1111/tpj.14815
LAESI-MS of wild-type and mutant soybean root nodules 7

is a phytohormone that not only is essential for plant
development, but also plays a role in the response to
wounding and plant defense against biotic and abiotic
stresses (Liechti and Farmer, 2002; Wasternack, 2007;
Wasternack and Hause, 2013; Koo, 2018). However, JA
biosynthesis is also upregulated at the transcriptional level
during nitrogen deprivation (Pauwels et al., 2009). Hence,
elevation of JA within the nifH nodules may simply be a
reflection of nitrogen deprivation, although we cannot
exclude the possibility that the elevation of JA levels could
also reflect induction of a plant immunity response.
The sacpd-c mutant nodules reveal dramatic nodule
ultrastructure and metabolite distribution changes
Nodules formed on sacpd-c mutant (FN8) plant roots have
morphological defects, such as the formation of central
cavities or necrotic lesions, which were not observed in
WT nodules (Figure 1a). The sacpd-c mutant bacteroid
ultrastructure was distinctive, where the cells close to the
necrotic lesion were in various stages of degradation (Gill-
man et al., 2014). The presence of the central necrotic zone
is a distinctive feature of the sacpd-c mutant nodules and
therefore of particular interest. We sectioned at 60 µmthickness at the center of the whole nodule, where the
necrotic lesion was visualized. The slices (n = 6) were used
for the lateral profiling across the whole section and an
example of a slice is shown in Figure S5(a). In total, there
were eight ablation craters, and, for each crater, we
obtained mass spectra including the outer layer at shot 1
and the lesion at shot 4 (Figure S5b). From the mass spec-
tra, we were able to track the abundance of metabolites
that were localized and distributed throughout the section
of the nodule (Figure S5c). For example, adenosine was
localized abundantly in the necrotic lesion at the third,
fourth, and sixth shots. However, there was no abundance
of adenosine at the fifth shot. Because the lesion area is
thin and a fragile feature, limited material could be sam-
pled (Figure S5a,c). Also, the fifth shot was at the starting
point of the central necrotic zone as shown in the older
nodule around 28 days (Figure S6b). Heme B was
detected, which was more abundant in the infection zone
compared to the necrotic lesion, whereas dihydroxyflavone
was only localized in the outer layer. As a result of the
large sampling area and fine structural features of the
sacpd-c nodules, lateral profiling was limited in spatial res-
olution compared to the nifH and WT profiling. Several
laser shots sampled material from both the different layers
and necrotic regions; thus, to improve molecular distribu-
tion mapping in this case, a higher spatial resolution is
required.
Thus, instead of lateral profiling, we used selective tar-
geting of the infection zone of a WT nodule (n = 10) and
the lesion of the sacpd-c nodule (n = 10) for comparison
(Figure 4a,b). This allowed us to have a significant
statistical analysis with respect to capturing the metabo-
lites that might be responsible for these necrotic regions
and the significant compounds present in the healthy WT
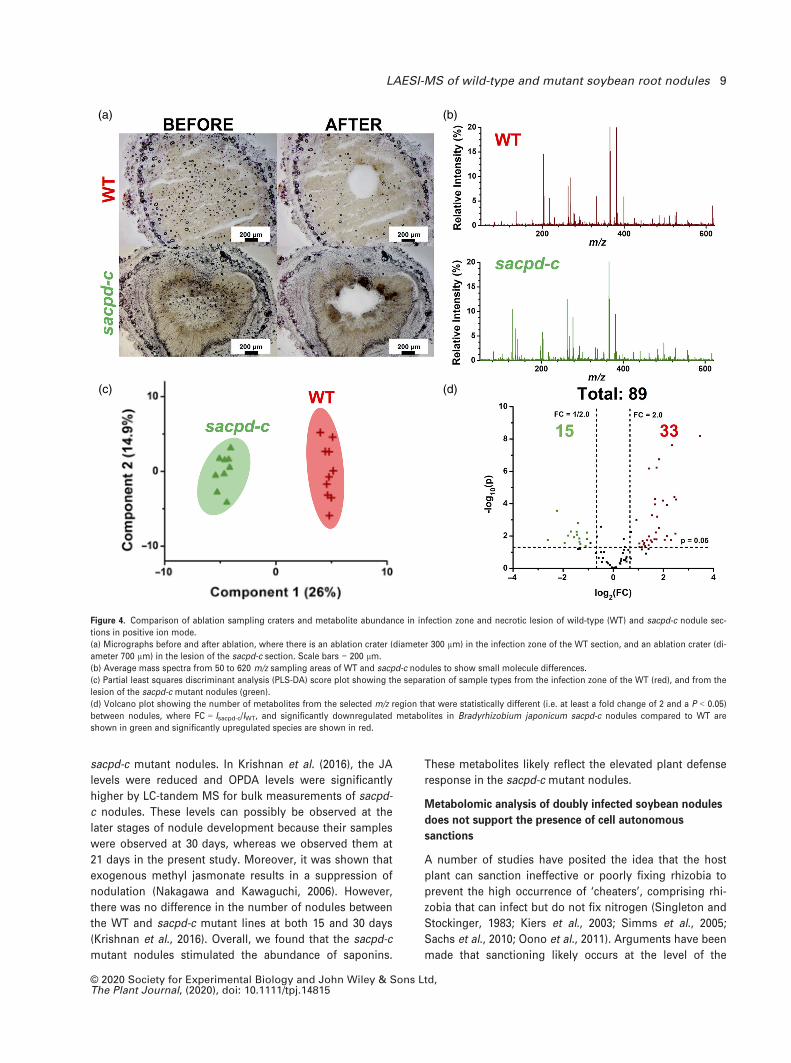
nodules in positive ion mode (Figure 4). The PLS-DA
showed separation between the WT and the sacpd-c abla-
tion craters (Figure 4c). In total, 89 significantly different
spectral features were detected from this analysis. Fifteen
features were significantly more abundant within the
lesion area of the sacpd-c mutant nodules and 33 were sig-
nificantly more abundant in the infection zone of the WT
nodules (Figure 4d). The metabolites that were considered
significant in each case were then ordered by their FC
impact (Table 2). In general, the lesion of the sacpd-c was
composed of sugars, saponins, organic acids (gluconic
acid), and flavanone glucosides. By contrast, the infection
zone of the WT contained metabolites related to biological
nitrogen fixation, such as amino acids, nucleobase contain-
ing compounds, tricarboxylic acids, porphyrin and vita-
mins (heme B, riboflavin), and fatty acids. In addition, oleic
acid was detected as well with a FC of 1.6 in the WT nod-
ules relative to the sacpd-c nodules.
Fatty acids, including palmitic acid, stearic acid, oleic
acid, linoleic acid, and linolenic acid, are known to be
abundant in soybean plants (Lakhssassi et al., 2017). Oleic
acid content was found to be reduced in the sacpd-c
mutants compared to WT soybean seeds. These results are
consistent with our findings of significantly higher oleic
acid content in the infection zone of the WT root nodules
compared to sacpd-c lesions. In a previous study, we
showed that the detected fatty acids are not breakdown
products (Stopka et al., 2017) (Figure S1). We analyzed the
level of in-source fragmentation of lipids by examining
standards for lipids detected in soybean samples with ESI
and LAESI-MS. We found that using LAESI-MS ‘in-source
fragmentation of lipid species did not yield fatty acid ions,
but rather the corresponding ketene cleavage products for
the phosphatidylglycerol (PG) and phosphatidylcholine
(PC) species’ (Stopka et al., 2017).
The class of compounds known as the triterpenoid sapo-
nins were found to be significantly more abundant in the
necrotic lesion of the sacpd-c nodules with a FC ranging
between 2 and 4 (Table 2). Saponins have surfactant prop-
erties that form stable soap-like foams (Hostettmann and
Marston, 2005), which may explain the visual manifesta-
tion of water-soaked areas around the soft necrotic tissue
within the nodules from the sacpd-c plants. External fac-
tors, including various biotic and abiotic stimuli with elici-
tation of methyl jasmonate, a signal component in plant
defense responses, can produce saponins (Faizal and Gee-
len, 2013). Along with the high presence of saponins
detected in the sacpd-c nodules, we also detected signifi-
cant accumulation of methyl jasmonate (FC = 3.24) in
these nodules (Table S1). However, there was no change
in JA and 12-oxophytodienoic acid (OPDA) levels in the
© 2020 Society for Experimental Biology and John Wiley & Sons Ltd,The Plant Journal, (2020), doi: 10.1111/tpj.14815
8 Beverly J. Agtuca et al.
sacpd-c mutant nodules. In Krishnan et al. (2016), the JA
levels were reduced and OPDA levels were significantly
higher by LC-tandem MS for bulk measurements of sacpd-
c nodules. These levels can possibly be observed at the
later stages of nodule development because their samples
were observed at 30 days, whereas we observed them at
21 days in the present study. Moreover, it was shown that
exogenous methyl jasmonate results in a suppression of
nodulation (Nakagawa and Kawaguchi, 2006). However,
there was no difference in the number of nodules between
the WT and sacpd-c mutant lines at both 15 and 30 days
(Krishnan et al., 2016). Overall, we found that the sacpd-c
mutant nodules stimulated the abundance of saponins.
These metabolites likely reflect the elevated plant defense
response in the sacpd-c mutant nodules.
Metabolomic analysis of doubly infected soybean nodules
does not support the presence of cell autonomous
sanctions
A number of studies have posited the idea that the host
plant can sanction ineffective or poorly fixing rhizobia to
prevent the high occurrence of ‘cheaters’, comprising rhi-
zobia that can infect but do not fix nitrogen (Singleton and
Stockinger, 1983; Kiers et al., 2003; Simms et al., 2005;
Sachs et al., 2010; Oono et al., 2011). Arguments have been
made that sanctioning likely occurs at the level of the
(a) (b)
(c) (d)
Figure 4. Comparison of ablation sampling craters and metabolite abundance in infection zone and necrotic lesion of wild-type (WT) and sacpd-c nodule sec-
tions in positive ion mode.
(a) Micrographs before and after ablation, where there is an ablation crater (diameter 300 µm) in the infection zone of the WT section, and an ablation crater (di-
ameter 700 µm) in the lesion of the sacpd-c section. Scale bars = 200 lm.
(b) Average mass spectra from 50 to 620 m/z sampling areas of WT and sacpd-c nodules to show small molecule differences.
(c) Partial least squares discriminant analysis (PLS-DA) score plot showing the separation of sample types from the infection zone of the WT (red), and from the
lesion of the sacpd-c mutant nodules (green).
(d) Volcano plot showing the number of metabolites from the selected m/z region that were statistically different (i.e. at least a fold change of 2 and a P < 0.05)
between nodules, where FC = Isacpd-c/IWT, and significantly downregulated metabolites in Bradyrhizobium japonicum sacpd-c nodules compared to WT are
shown in green and significantly upregulated species are shown in red.
© 2020 Society for Experimental Biology and John Wiley & Sons Ltd,The Plant Journal, (2020), doi: 10.1111/tpj.14815
LAESI-MS of wild-type and mutant soybean root nodules 9

nodule in indeterminate nodulating plants, where the bac-
teroids are terminally differentiated and, hence, there is no
advantage for the ‘cheaters’ with regard to subsequent
growth. However, there remained the possibility that sanc-
tioning could occur at the level of individual bacteroids of
determinate nodulating plants, such as soybean, because
some fraction of the bacteroids do retain the ability for lim-
ited cell division and, to some extent, can regrow from
senescent nodules (Mergaert et al., 2006). Indeed, recent
studies (Regus et al., 2015; Regus et al., 2017) have exam-
ined this question using two determinate nodulating plant
species, Acmispon strigosus and Lotus japonicus. Based
on microscopy and histology, it was reported that sanc-
tioning occurred at the level of the plant cell and was cell
autonomous. That is, within doubly infected nodules, only
those sectors infected by the fix� rhizobia showed signs of
early senescence, which they equated with sanctioning
(Regus et al., 2015; Regus et al., 2017). The idea that sanc-
tioning within nodules could be cell autonomous was sug-
gested by Maunoury et al. (2010), based on the histology
of Medicago truncatula indeterminate nodules.
Because most plant responses to stress are to some
degree systemic, the idea of ‘cell autonomous’ sanctions
within legume nodules seemed worthy of investigation,
especially given our ability to spatially analyzed metabo-
lite distribution using LAESI-MS. Hence, we established
doubly infected soybean nodules using the protocols of
Regus et al. (2017) and analyzed the fix� and fix+ sectors
separately. As indicated previously, the sampled sectors
could be easily distinguished by their relative colors as
visualized using a stereomicroscope (Figure S7a). Also,
the WT rhizobia expressed green fluorescent protein
(GFP) and, hence, we were able to visualize the different
sectors using the fluorescence microscope (Figure S8).
Note that, in nodules infected solely by the WT strain
expressing GFP, there were no significant changes in
morphology or metabolite distribution relative to those
not expressing GFP.
Overall, eight biologically replicated nodules were ana-
lyzed from separate plants that were infected by a 3:7 (WT:
nifH mutant) ratio. A sample of the analysis is shown in Fig-
ure 5(a) and Figure S7(b-c), which shows the two distinct
sectors being sampled by the laser. The green outline rep-
resents the effective rhizobia (CI WT; CI stands for co-inocu-
lated) sector that had a lighter contrast color, whereas the
yellow outline shows the ineffective rhizobia (CI nifH) sector
as a result of a darker contrast (Figure 5a). After the sec-
tioned nodules were ablated at the two different sectors,
Table 2 Top 16 molecular species that were identified in sections of soybean root nodules from either the infection zone of wild-type (WT)or from sacpd-c mutant plants at the necrotic lesion. These species had a significant fold change, FC = Isacpd-c/IWT ≥ 2 and P < 0.05
sacpd-c (lesion) WT (infection zone)
Compound KEGG ID Log2(FC) Compound KEGG ID Log2(FC)
Trihydroxyflavonea,b,�,* C01477 �4.4 PA(16:0/18:1)c,�,** C00416 6.7Flavon malonyl glucosided,�,** �4.2 Reduced glutathioned,+,** C00051 5.4Soyasaponin Ia,b,�,** C08983 �3.8 PE(18:1/18:2)c,�,* C00157 2.9Heptosea,�,** C02076 �3.6 Butene tricarboxylatea,�,** C16579 2.1Pentosec,�,** C00181 �3.5 PE(16:0/18:1)c,�,** C13877 2.0Dehydrosoyasaponin Ia,c,�,** C13837 �3.0 Riboflavind,+,** C00255 1.9Soyasaponin IId,�,** C12081 �3.0 PG(16:0/18:1)c,�,** C13883 1.8Gluconic acida,c,�,* C00257 �3.0 S-Adenosylmethionined,e,+,** C00019 1.6Tryptophana,c,�,* C00078 �3.0 Cyclohexylammoniumd,+,** C00571 1.6Soyasaponin agd,�,* C08982 �3.0 Oleic acidd,�,* C00712 1.6Dihydroxyisoflavonea,c,�,** C14344 �2.9 PI(16:0/18:2)c,�,** 1.5Soyasaponin Vd,�,** �2.2 Jasmonoyl aminocyclopropane carboxylated,+,** 1.5Dihydroxy methoxyflavone glucosided,�,* C10381 �2.1 Methylcitrate/homoisocitratea,�,** C01251 1.5Tetrahydroxyflavanone glucosidea,c,�,** C16408 �2.0 UDP-hexosee,�,* C00052 1.4N-Feruloylglycinee,�,* �1.8 Heme bd,+,** C00032 1.3Glucaratea,�,* C00879 �1.4 PA(18:2/18:2)c,�,** 1.1
aCompounds assigned based on ultra-high mass accuracy of 21T-Fourier transform ion cyclotron resonance-mass spectrometry (MS).bCompounds assigned based on in-house tandem MS of standards performed under identical conditions.cCompounds assigned based on tandem MS databases comparisons (http://metlin.scripps.edu; NIST/EPA/NIH Mass Spectral Library Version2.2).dCompounds assigned from Stopka et al. (2017).eCompounds assigned from Veli�ckovi�c et al. (2018).+Positive ion mode.�Negative ion mode.*P < 0.05.**P < 0.005.
© 2020 Society for Experimental Biology and John Wiley & Sons Ltd,The Plant Journal, (2020), doi: 10.1111/tpj.14815
10 Beverly J. Agtuca et al.

the data were collected and analyzed statistically in a PLSD-
A score plot in negative ion mode (Figure 5b). The plot
included the comparison between three sets of sampled
nodules: (i) nodules that were infected by WT B. japonicum
(presented in blue); (ii) nodules that were infected by the
nifH mutant B. japonicum (red); and (iii) nodules that were
3:7 co-inoculated that have sectors of CI WT (green) and CI
nifH (yellow). As expected, there was a separation between
single infected WT and nifH nodules. However, the two co-
inoculated samples (CI WT and CI nifH) showed significant
overlap with each other and were not considered separated
(Figure 5b). A 3D PLSD-A plot that showed the three major
components was used to explore the lack of separation
among the co-inoculated samples (Figure S9). We were
able to confirm the ultrastructural differences between the
WT and fix� sectors, as reported by Regus et al. (2017),
whereas the metabolic data suggested that both sectors
were likely under metabolic stress and could not be consid-
ered normal. Hence, although the data are consistent with
the idea of sanctions acting at the level of individual nod-
ules, they are inconsistent with the notion that the plant
can sanction at the level of individual infected cells or sec-
tors within a single nodule.
Approximately 200 spectral features were detected from
each of the sectioned nodules in negative ion mode. In
terms of significant metabolites, there was a total of 326
with a significant fold change of FC ≥ 2 and P < 0.05 from
all sampled nodules as shown in the Venn diagram (Fig-
ure 5c). Each set of sampled areas (ablation spots at the
infection zone or the specific sectors) within the nodules
(WT, nifH, CI WT, and CI nifH) have their unique metabo-
lites ranging between 30 and 120. Interestingly, there were
only seven metabolites overlapping between the WT and
the nifH, whereas 25 overlapped among the co-inoculated
sectors (Figure 5c). The few metabolites that overlapped
between two or three sets of sampled areas within the sec-
tioned nodules include dihydrojasmonic acid that was only
present at the nifH and CI WT and not detected at the CI
nifH and WT (Figure 5d). By contrast, adenine was
detected in the WT and the co-inoculated sectors, although
there was a significantly higher abundance of adenine in
the WT compared to all other samples. Acetyl tributyl
citrate was present in the nifH and both sectors, whereas
gluconic acid was detected in the WT and CI WT/nifH sec-
tors. However, gluconic acid was significantly more abun-
dant in the CI WT (Figure 5d).
a) (b) (c)
d)
Figure 5. Metabolite abundance in sectors of nodules co-infected by Bradyrhizobium japonicum wild-type (WT) and nifH strains in negative ion mode.
(a) Optical image of a co-infected soybean root nodule section that contained two sectors; a co-inoculated WT (CI WT) shown in green and a co-inoculated nifH
mutant (CI nifH) shown in yellow. Each sector was targeted by laser ablation electrospray ionization-mass spectrometry for analysis with a spot size of approxi-
mately 200 lm in diameter. Arrows indicate the laser ablation craters.
(b) The partial least squares discriminant analysis (PLS-DA) score plot of WT, nifH and co-inoculated sectors revealed separation; however, the two sectors in
the co-inoculated nodules, CI WT and CI nifH, showed an overlap.
(c) A Venn diagram showing the number of biologically and statistically significant metabolites that were detected in the four sampled regions.
(d) Box-and-whisker plots for selected metabolites comparing normalized intensities. The data were normalized by summing and Pareto scaling.
© 2020 Society for Experimental Biology and John Wiley & Sons Ltd,The Plant Journal, (2020), doi: 10.1111/tpj.14815
LAESI-MS of wild-type and mutant soybean root nodules 11
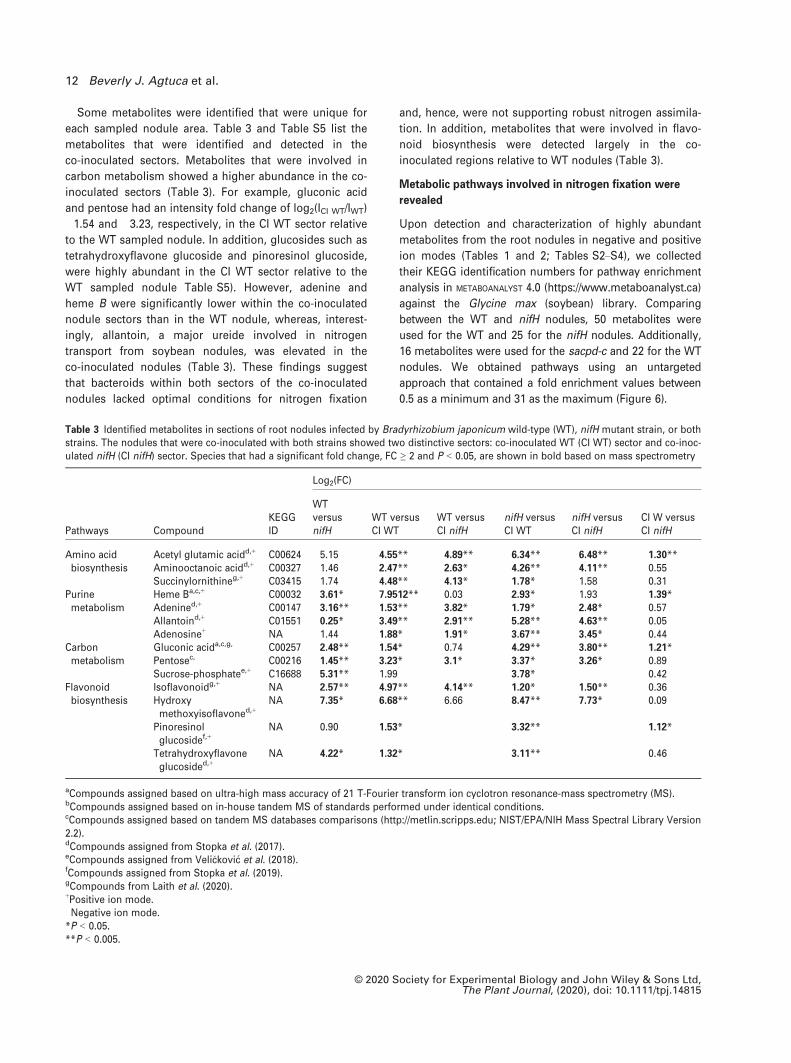
Some metabolites were identified that were unique for
each sampled nodule area. Table 3 and Table S5 list the
metabolites that were identified and detected in the
co-inoculated sectors. Metabolites that were involved in
carbon metabolism showed a higher abundance in the co-
inoculated sectors (Table 3). For example, gluconic acid
and pentose had an intensity fold change of log2(ICI WT/IWT)
�1.54 and �3.23, respectively, in the CI WT sector relative
to the WT sampled nodule. In addition, glucosides such as
tetrahydroxyflavone glucoside and pinoresinol glucoside,
were highly abundant in the CI WT sector relative to the
WT sampled nodule Table S5). However, adenine and
heme B were significantly lower within the co-inoculated
nodule sectors than in the WT nodule, whereas, interest-
ingly, allantoin, a major ureide involved in nitrogen
transport from soybean nodules, was elevated in the
co-inoculated nodules (Table 3). These findings suggest
that bacteroids within both sectors of the co-inoculated
nodules lacked optimal conditions for nitrogen fixation
and, hence, were not supporting robust nitrogen assimila-
tion. In addition, metabolites that were involved in flavo-
noid biosynthesis were detected largely in the co-
inoculated regions relative to WT nodules (Table 3).
Metabolic pathways involved in nitrogen fixation were
revealed
Upon detection and characterization of highly abundant
metabolites from the root nodules in negative and positive
ion modes (Tables 1 and 2; Tables S2–S4), we collected
their KEGG identification numbers for pathway enrichment
analysis in METABOANALYST 4.0 (https://www.metaboanalyst.ca)
against the Glycine max (soybean) library. Comparing
between the WT and nifH nodules, 50 metabolites were
used for the WT and 25 for the nifH nodules. Additionally,
16 metabolites were used for the sacpd-c and 22 for the WT
nodules. We obtained pathways using an untargeted
approach that contained a fold enrichment values between
0.5 as a minimum and 31 as the maximum (Figure 6).
Table 3 Identified metabolites in sections of root nodules infected by Bradyrhizobium japonicum wild-type (WT), nifH mutant strain, or bothstrains. The nodules that were co-inoculated with both strains showed two distinctive sectors: co-inoculated WT (CI WT) sector and co-inoc-ulated nifH (CI nifH) sector. Species that had a significant fold change, FC ≥ 2 and P < 0.05, are shown in bold based on mass spectrometry
Pathways CompoundKEGGID
Log2(FC)
WTversusnifH
WT versusCI WT
WT versusCI nifH
nifH versusCI WT
nifH versusCI nifH
CI W versusCI nifH
Amino acidbiosynthesis
Acetyl glutamic acidd,+ C00624 �5.15 �4.55** �4.89** �6.34** �6.48** �1.30**Aminooctanoic acidd,+ C00327 1.46 �2.47** �2.63* �4.26** �4.11** �0.55Succinylornithineg,+ C03415 �1.74 �4.48** �4.13* �1.78* �1.58 0.31
Purinemetabolism
Heme Ba,c,+ C00032 3.61* 7.9512** 0.03 �2.93* �1.93 1.39*Adenined,+ C00147 3.16** 1.53** 3.82* �1.79* �2.48* �0.57Allantoind,+ C01551 0.25* �3.49** �2.91** �5.28** �4.63** �0.05Adenosine+ NA �1.44 �1.88* �1.91* �3.67** �3.45* �0.44
Carbonmetabolism
Gluconic acida,c,g,� C00257 2.48** �1.54* �0.74 �4.29** �3.80** 1.21*Pentosec,� C00216 1.45** �3.23* �3.1* �3.37* �3.26* 0.89Sucrose-phosphatee,+ C16688 5.31** �1.99 �3.78* 0.42
Flavonoidbiosynthesis
Isoflavonoidg,+ NA �2.57** �4.97** �4.14** 1.20* 1.50** 0.36Hydroxymethoxyisoflavoned,+
NA 7.35* �6.68** �6.66 �8.47** �7.73* �0.09
Pinoresinolglucosidef,+
NA 0.90 �1.53* �3.32** 1.12*
Tetrahydroxyflavoneglucosided,+
NA 4.22* �1.32* �3.11** 0.46
aCompounds assigned based on ultra-high mass accuracy of 21 T-Fourier transform ion cyclotron resonance-mass spectrometry (MS).bCompounds assigned based on in-house tandem MS of standards performed under identical conditions.cCompounds assigned based on tandem MS databases comparisons (http://metlin.scripps.edu; NIST/EPA/NIH Mass Spectral Library Version2.2).dCompounds assigned from Stopka et al. (2017).eCompounds assigned from Veli�ckovi�c et al. (2018).fCompounds assigned from Stopka et al. (2019).gCompounds from Laith et al. (2020).+Positive ion mode.�Negative ion mode.*P < 0.05.**P < 0.005.
© 2020 Society for Experimental Biology and John Wiley & Sons Ltd,The Plant Journal, (2020), doi: 10.1111/tpj.14815
12 Beverly J. Agtuca et al.
There were many pathways that were affected in either of
the WT, nifH, or sacpd-c nodules. Some top pathways that
were influenced in the nifH mutant nodules were alpha-
linolenic acid metabolism, flavonoid biosynthesis, and indole
alkaloid biosynthesis (Figure 6a). By contrast, the pathways
that had a higher fold enrichment in the WT infected nodules
were zeatin (cytokinin) biosynthesis, ABC transporters, ribo-
flavin metabolism, starch and sucrose metabolism, and pur-
ine metabolism (Figure 6a). From the sacpd-c enrichment
analysis, the pathways more abundant were flavone and fla-
vonol biosynthesis, indole alkaloid biosynthesis, and diter-
penoid biosynthesis (Figure 6b). The pathways with a higher
fold enrichment in the WT relative to the sacpd-c nodules are
mostly known BNF pathways: zeatin biosynthesis, lysine
biosynthesis, cysteine and methionine metabolism, and sul-
fur relay system (Figure 6b). Thus, taken together, mutageniz-
ing the rhizobial nifH and the soybean sacpd-c impacted the
association of symbiosis and nodule morphology. The plant
can sense the occurrence of competent and incompetent rhi-
zobia within the nodule, which resulted in changes in several
metabolites and pathways.
DISCUSSION
Over the history of BNF research, mutant bacteria or plants
have been an indispensable resource for studying gene func-
tion in nodulation (Halverson and Stacey, 1986; Sadowsky
et al., 1991; Sanjuan et al., 1994; Sagan et al., 1995; Loh et al.,
2001; Kawaguchi et al., 2002; Hossain et al., 2006; Sandal
et al., 2006; Kachroo et al., 2008; Yamaya-Ito et al., 2017). In
the present study, we aimed to use such mutants to demon-
strate the utility of LAESI-MS spatial profiling, as well as to
address interesting questions related to nodule metabolism.
LAESI-MS: a unique tool for spatially detecting
metabolites within the nodule
In the present study, we found that purine metabolism was
highly abundant in the infection zone of the WT nodules
while, a low abundance of purines was observed in the
nifH nodules since this mutant displayed nitrogen-defi-
ciency symptoms. This is expected because de novo pur-
ine biosynthesis is required for the formation of ureides,
which are the primary molecules used for nitrogen trans-
port from soybean nodules. This biosynthesis is involved
in the conversion of amino acids and nucleotides to
monophosphates, followed by oxidation to xanthine, and,
lastly, to a final ureide product, such as allantoin (Smith
and Atkins, 2002; Baral et al., 2016).
Additionally, other pathways, including zeatin (cytokinin)
biosynthesis, ABC transporters, riboflavin metabolism, and
starch and sucrose metabolism, had a higher fold enrich-
ment in the WT infected nodules than the nifH mutant nod-
ules. As expected, these pathways are involved with BNF
and organogenesis. Also, infected nodules require carbon
and nitrogen flux between the endosymbionts and the
plant host (Atkins, 1987). Zeatin biosynthesis is an impor-
tant pathway for plant growth and development in general,
especially for the development of nodules (Atkins, 1987;
Udvardi and Poole, 2013). Indeed, activation of cytokinin
perception is now recognized as a key event in the initia-
tion of nodule formation (Oldroyd and Downie, 2008).
Leghemoglobin is an oxygen carrier that must be present
for the continuation of nitrogen fixation in the central
infected zone of the nodules (Brewin, 1991). The bacteroids
require an adequate supply of oxygen for respiration and
leghemoglobin ensures that oxygen is present when nec-
essary. As expected, there was a low abundance of heme
B in nifH nodules, reflected in the white/pale pink col-
oration in the infection zone. Studies have shown that
early senescence of nodules, associated with fix� nodules,
is not only a result of nitrogen deficiency triggered by inef-
fective nitrogen fixation (Banba et al., 2001; Kumagai et al.,
2007), but likely also involves the activation of plant
defense responses (Suganuma et al., 2003).
In the WT nodules, within the infection zone, homo-
citrate (FC = 1.70) was found to be significantly elevated
relative to the nifH nodules. Homocitrate is a component
of the iron-molybdenum cofactor in the nitrogenase com-
plex (Hakoyama et al., 2009), which could account for its
abundance because, in this case, we cannot discern
whether the metabolite is originating from the bacteroids
or from the plant. Iron is also crucial for nitrogen fixation
because it is one of the elements that is required in nitro-
genase cofactors. Nodules have elevated levels of this ele-
ment and, hence, homocitrate could also play a role in iron
chelation and transport (Moreau et al., 1995; LeVier et al.,
1996; Moreau et al., 1998; Udvardi and Poole, 2013). One
study found that FEN1 (fail in enlargement of infected
cells) encodes homocitrate synthase that is specific to the
nodule-infected cells. The fen1 host mutants were similar
in nodule formation to fix� mutants and homocitrate was
absent within the nodules (Hakoyama et al., 2009). Accord-
ingly, this suggests that the homocitrate detected in the
present study is of plant origin.
Lack of biological nitrogen fixation induces metabolites
related to plant defense
Rhizobial infection and nodule formation are accompanied
by the need to synthesize a variety of new membranes
(e.g. symbiosome membrane that surrounds the bac-
teroids). Indeed, it was estimated that the capacity for
membrane biogenesis would need to be upregulated at
least 35-fold to fulfill the need for nodule formation (Roth
and Stacey, 1989). This estimation is consistent with the
relative upregulation of glycerophospholipid/glycerolipid
biosynthesis found in WT nodules relative to that found in
the various mutant nodules.
In plants, fatty acids play critical signaling roles, specifi-
cally in responses to abiotic and biotic stresses. These
© 2020 Society for Experimental Biology and John Wiley & Sons Ltd,The Plant Journal, (2020), doi: 10.1111/tpj.14815
LAESI-MS of wild-type and mutant soybean root nodules 13

(a)
(b)
Figure 6. Pathway enrichment analysis comparing mutant and wild-type (WT) root nodules.
Enriched pathways for (a) nifH and (b) sacpd-c versus WT and vice versa, which highlight up- and downregulated pathways related to biological nitrogen fixa-
tion and their statistical significance. Analysis was based on all identified metabolites with an ion intensity fold change ≥ 2 and a P < 0.05 using the METABOANA-
LYST 4.0 web resource from both positive and negative ion mode datasets.
© 2020 Society for Experimental Biology and John Wiley & Sons Ltd,The Plant Journal, (2020), doi: 10.1111/tpj.14815
14 Beverly J. Agtuca et al.
metabolites also function as energy storage molecules in
all plant cells and are critical to membrane integrity and
fluidity (Lim et al., 2017). Of the fatty acids, linolenic acid is
the most abundant in plant membranes and is required for
nodulation because Brechenmacher et al. (2010) found an
increase of linolenic and octadecenoic acids during the
infection process. However, from our studies, we found
that the linolenic acid metabolism was enriched by 12.3-
fold in the nifH mutant relative to WT nodules (Figure 6a).
Hakoyama et al. (2011) analyzed a Lotus symbiotic mutant,
sen1, which forms nodules when infected by rhizobia, but
does not fix nitrogen. This nodulation phenotype was simi-
lar to that in our study when we used mutagenized rhizo-
bia (nifH) in soybean. Hakoyama et al. (2011) were able to
identify the causal gene, SEN1 (stationary endosymbiont
nodule), which encodes an integral membrane protein and
is essential for symbiosome and bacteroid differentiation
in legume nodules. In our analyses, because the nifH nod-
ules include an impairment of symbiosome integrity, we
suggest that the host requires an abundance of linolenic
acid related metabolites to support the membrane struc-
ture of the symbiosomes within the infection zone. There-
fore, the increase of these fatty acids (linolenic and
octadecenoic acids) is required for the upregulation of
metabolic pathways for the synthesis and maintenance of
infected-cell membranes during the infection process and
nodulation.
However, although fatty acids are critical for membrane
biogenesis, they also play a variety of roles in plant
responses to abiotic and biotic stresses (Lim et al., 2017).
Polyunsaturated fatty acids (e.g. linolenic acid) are of par-
ticular importance and their accumulation correlates with
increased pathogen resistance. For example, JA is derived
from linolenic acid and is an example of oxygenated fatty
acids, called oxylipins, many of which play important roles
in plant defense. Previous studies have reported that dis-
ruption of the symbiosome membrane leads to the loss of
BNF and the induction of endogenous defense-like
responses in the host cell (Banba et al., 2001; Kiers et al.,
2003; Oono et al., 2011). Hence, the elevation in fatty acids
(linolenic acid and octadecenoic acids) in nifH mutant nod-
ules, relative to WT nodules, is of particular note and likely
reflects the induction of defense pathways that have also
been associated with the senescent morphology found in
fix� nodules. This is also consistent with the elevation of
JA associated compounds in the nifH nodules, although
we cannot rule out that the elevation of these compounds
is also a response to nitrogen deprivation. Many studies
applied JA exogenously to examine the initial perception
and signaling events of the nitrogen-fixing symbiosis (Ding
and Oldroyd, 2009; Hause and Schaarschmidt, 2009). JA
application to legume roots affects the early epidermal
responses during rhizobial infection. For example, JA acts
as a negative regulator of many of the early signaling
events involved in nodule formation (Ding and Oldroyd,
2009). The addition of JA causes a decrease in nodule
number on roots (Miwa et al., 2006; Sun et al., 2006). How-
ever, limited data are available regarding endogenous
levels of JAs during the development of nodules. Zdyb
et al. (2011) concluded that endogenous levels of JA are
not involved in the development and function of root nod-
ules in Medicago. There were no significant differences in
JA between roots nodulated with WT Sinorhizobium meli-
loti or by mutant strains, unable to fix nitrogen, relative to
non-nodulated roots. Transgenic M. truncatula with altered
JA biosynthesis showed no alteration in nodule number
and morphology (Zdyb et al., 2011). These findings would
suggest that, at least with regard to M. truncatula, endoge-
nous JA has little involvement in nodulation. However,
these conclusions may not extend to determinate
nodulating plants such as soybean. In general, the
metabolite data suggest that the plant can distinguish
between nodules that are fixing adequate nitrogen and
those that do not, resulting in changes in metabolism,
some of which are consistent with the specific induction of
processes normally associated with defense to plant patho-
gens.
Analysis of host sanctioning in doubly infected nodules
Histological and ultrastructural studies provide evidence
that the plant can ‘sanction’ nodules providing inadequate
nitrogen by limiting physiological inputs and reducing the
survival of ineffective ‘cheater’ rhizobia (Singleton and
Stockinger, 1983; Kiers et al., 2003; Simms et al., 2005;
Sachs et al., 2010; Oono et al., 2011). Although the ‘mech-
anisms’ of this process remain unclear, the data strongly
support the occurrence of such sanctioning at the level of
the nodule. However, as noted above, previous studies,
especially that of Regus et al. (2017), suggested that sanc-
tioning, at least with regard to determinate nodulating
plants, could occur at the level of specific bacteroids or at
least within specific sectors of a single nodule. The stud-
ies that posit the occurrence of such ‘cell autonomous’
sanctioning have relied largely on microscopy and/or his-
tology. Hence, we were interested in looking at this idea
at a deeper level using the ability to spatially analyze
metabolite distributions. LAESI-MS analysis was made
possible by the very clear and obvious demarcation of the
fix� and fix+ sectors based on microscopy, including fluo-
rescent labeling of fix+ sectors. This ability gave us confi-
dence that cross contamination between the sectors
sampled was minimal. The data obtained clearly indicate
that, in doubly infected nodules, both the fix� and fix+
sectors were not physiologically normal. Overall, such
doubly infected nodules, regardless of sector, showed
symptoms of reduced nitrogen flux and suboptimal condi-
tions for BNF (e.g. lower heme B levels). A variety of stud-
ies, as reviewed by Prell and Poole (2006), indicate that
© 2020 Society for Experimental Biology and John Wiley & Sons Ltd,The Plant Journal, (2020), doi: 10.1111/tpj.14815
LAESI-MS of wild-type and mutant soybean root nodules 15
carbon and nitrogen from both the host and bacteroids
become mutually dependent, with each feeding back to
modulate the metabolism of the other. This may provide
the mechanism by which the plant sanctions specific nod-
ules based on their overall nitrogen output. Hence, our
data are inconsistent with the occurrence of cell autono-
mous sanctions, suggesting that the plant sanctions at
the level of specific nodules likely through the action of
feedback mechanisms that monitor carbon and nitrogen
flux.
Although the combined results are consistent with this
conclusion, an intriguing result was the finding that allan-
toin, the major ureide involved in nitrogen transport from
soybean nodules, was elevated in the co-inoculated nod-
ules [log2(FC) = 3.49] relative to nodules infected by WT
B. japonicum. Fujihara and Yamaguchi (1980) reported that
allantoin gradually increased over time in nodulated soy-
beans, reaching a maximum 60 days after sowing, under
conditions where BNF was supported. Under their condi-
tions, this correlated with the time of flowering, after which
it is likely that carbon would primarily be directed to seed
set and development. Consistent with this, at the late
reproductive stage, the nitrogenase activity diminished,
whereas there were still high concentrations of ureides in
the senescent nodules. It was suggested that ureides
formed at these late stages could arise from destruction of
nucleic acids as a result of the plant’s efforts to harvest
nitrogen to support seed development (Fujihara and Yam-
aguchi, 1980). Hence, given the timing of our analysis at
21 days after sowing, ureide synthesis within the WT nod-
ules would not be expected to occur at a high level. How-
ever, we assumed that the co-inoculated nodules were
undergoing senescence because we detected an abun-
dance of phenolic glucosides in the co-inoculated WT sec-
tor than the WT nodules. Previous studies have
documented the accumulation of such phenolic com-
pounds during nodule senescence (Veereshlingam et al.,
2004; Pislariu et al., 2019). Therefore, assuming that the co-
inoculated nodules were undergoing senescence, then
they might be considered physiologically older and, thus,
further along in their ability to produce ureides. Likewise,
ureide production in these doubly infected, senescent nod-
ules could also be relying on the degradation of nucleic
acids as a source of nitrogen.
Metabolites involved in flavonoid biosynthesis had a
higher abundance in the co-inoculated regions relative to
WT nodules. Flavonoids are derived from the phenyl propa-
noid pathway and have a role in signaling and enhancing
nodulation (Spaink et al., 1987; Spaink et al., 1991), whereas
similar compounds from this pathway function as crucial
molecules in the defense of plants against pathogens (Par-
niske et al., 1990; Nov�ak et al., 2004). Indeed, one such com-
pound, glyceollin, is known to increase in soybean nodules
undergoing late season senescence (Karr et al., 1992). It is
tempting to speculate that early senescence normally associ-
ated with fix� nodules may be the result of the accumulation
of bacterial toxic flavonoid-like compounds. For example,
rhizobium mutants that were susceptible to specific
phytoalexins showed reduced nodule occupancy when co-
inoculatedwith theWT strain (Soedarjo andBorthakur, 1998).
Another function of flavonoid biosynthesis in symbiotic
nitrogen-fixing nodules depends on the regulation of nitro-
gen availability. We found a metabolite profile consistent
with reduced nitrogen flux within the co-inoculated nodules,
whereas the data suggest that the carbon flux remains rela-
tively high. The production of flavonoids in nodules is stim-
ulated upon disruption of the carbon/nitrogen ratios
(Hunter, 1983), which may be responsible in part for the
elevation of flavonoids found in the co-inoculated nodules.
Alteration of fatty acid composition in the SAPCD-C
mutant nodules resulted in dramatic changes in
morphology and metabolism
SACPD-C plays a critical role in fatty acid biosynthesis,
where the enzyme catalyzes the conversion of the satu-
rated fatty acid, stearic acid, into the monounsaturated
fatty acid, oleic acid (Shanklin and Cahoon, 1998; Kachroo
et al., 2007). Consistent with this, we found that oleic acid
was more abundant in the WT nodules relative to the
sacpd-c nodules. This finding is consistent with that
reported by Gillman et al. (2014). Soybean sacpd-c mutants
have been sought after because of the desire to increase
stearate levels in seeds, which is useful for the production
of specific margarines from soybean oil, as well as a reduc-
tion in adverse cardiovascular impacts (Hunter et al., 2009;
Gillman et al., 2014). However, an unexpected and unde-
sired effect of mutations in the sacpd-c gene is that they
drastically affect nodule morphology. Interestingly, given
their obvious differences in nodule appearance relative to
the WT, the sacpd-c mutant nodules only showed an
approximate 50% reduction in BNF, as measured by acety-
lene reduction (Gillman et al., 2014; Krishnan et al., 2016).
However, this reduction might be sufficient to induce sanc-
tioning mechanisms within the plant to reduce carbon flow
to the nodule.
Krishnan et al. (2016) reported an elevation in the
expression of specific genes normally associated with
plant pathogen defense within the sacpd-c mutant nod-
ules. For example, Pathogenesis-Related 1 (PR-1) gene
expression was significantly increased in 15- and 30-day
nodules (Krishnan et al., 2016). Our results are consistent
with these findings because the mutant nodules also
showed a significant elevation in alkaloid and flavonoid
biosynthesis. Because the sacpd-c mutant plants develop
nodules with a necrotic lesion at the central zone, flavo-
noid biosynthesis could reflect a general stress response
and the production of antimicrobial compounds (Parniske
et al., 1990; Nov�ak et al., 2004). Furthermore, organic acids,
© 2020 Society for Experimental Biology and John Wiley & Sons Ltd,The Plant Journal, (2020), doi: 10.1111/tpj.14815
16 Beverly J. Agtuca et al.
such as gluconic acid, accumulated in the necrotic lesion
of the sacpd-c nodules with a log2(FC) = 3.0 (Table 2). Glu-
conic acid is an essential metabolite for rhizobacteria to
solubilize minerals and insoluble phosphates, which
increases phosphate availability for plants (Babu-Khan
et al., 1995). A previous study (de Werra et al., 2009) noted
a close association of gluconic acid metabolism with
antagonistic activity against plant pathogens. There is no
evidence that symbiosomes produce gluconic acid within
the nodules. However, there is evidence that gluconic acid
levels do affect the flux of phosphorus (Rosendahl et al.,
1991; Gaude et al., 2004). The symbiosomes were appar-
ently disintegrating within the necrotic area of the sacpd-c
nodules, which would result in the release of free-living
rhizobia that occupied the intercellular spaces, as observed
by Krishnan et al. (2016). Perhaps, this effect may result in
the release of bacterial elicitor compounds that would gen-
erally elevate plant defense signaling and metabolites
associated with these processes.
It is unclear what role saponins and endogenous methyl
jasmonate play within soybean nodules. Saponins can
contribute to innate immunity as antimicrobial phytopro-
tectants in roots and root exudates (Faizal and Geelen,
2013; Tsuno et al., 2017). For example, saponin is localized
in the epidermal layer of root tips and lateral roots (Har-
alampidis et al., 2002). Another study showed that sapo-
nins have a role in nodulation in Medicago, where they
were localized at the meristematic and outer regions of the
indeterminate nodules (Kemen et al., 2014). Therefore,
saponins may simply act as a chemical barrier in the outer
root cell layers (e.g. epidermis). This correlates well with
our results that show saponins localized at the outer layer
of the WT, nifH, and sacpd-c nodules. However, it is note-
worthy that saponins were abundant at the necrotic lesion
of the sacpd-c mutant nodules, perhaps also playing an
antimicrobial role. It was shown that saponins are acti-
vated when pathogenic fungi infect plant tissue and dis-
rupt the membranes. As a result, saponins damage the
fungal plasma membrane by forming membrane pores,
which cause fungal cell death (Faizal and Geelen, 2013).
Whether the synthesis of saponins is a result of or the
cause of the necrosis found at the center of the sacpd-c
mutant nodules cannot be determined at this time.
In the present study, our sampled mutant nodules (nifH
and sacpd-c) showed metabolites that were involved in
plant defense pathways. Therefore, our findings highlight
the more recent recognition that plant innate immunity
plays a crucial role in the legume symbiosis (Gourion
et al., 2015; T�oth and Stacey, 2015; Cao et al., 2017).
Metabolites such as linolenic acid, saponins, flavonoids,
and JA were highly abundant either in the nifH, co-inocu-
lated or sacpd-c nodules relative to the WT nodules.
Hence, the present study provides metabolomic support
for the notion that defects in BNF are associated with
induction of plant defense responses (Figure 7). More
research is vital before we will be able to fully understand
the role of plant innate immunity in nitrogen-fixing sym-
biosis.
We also sampled the three different regions of the pri-
mary root (uninfected root area, infected root area, and
nodule area) that were infected by the wild-type bacteria.
The distribution of metabolites in each area of the primary
root correlated agreeably with the literature of carbon flux
from the shoot to the nodule, which is responsible for
nitrogen assimilation and bacterial respiration (Atkins,
1987; Sanchez et al., 1991; Udvardi and Poole, 2013).
Within the nodules, there was an abundance of hormones
including gibberellin and JA, as expected, because these
metabolites are involved in organogenesis and regulation
of the mutualistic symbiosis (Ding and Oldroyd, 2009).
Overall, these results align well with other BNF studies that
showed the exchange of nitrogen and carbon resources
between the host and the rhizobia (Udvardi and Poole,
2013).
The results of the present study contribute to a better
understanding of the establishment of a functional symbio-
sis where metabolomic data is limited, especially with
regard to the spatial distribution of metabolites within the
nodule. Therefore, the observations of the present study
demonstrate that LAESI-MS can be considered as a rela-
tively high-throughput system for metabolically screening
in situ tissues and mutants with respect to addressing a
wide range of questions in plant biology. An exciting
recent development is the ability of LAESI-MS to analyze
the metabolome of single plant cells (Stopka et al., 2018),
which provides a means to investigate how single cell
responses contribute individually to the overall plant
response to rhizobial infection.
EXPERIMENTAL PROCEDURES
Plant growth and treatment
Soybean (Glycine max (L.) Merr.) seeds of ‘Williams 82 and a fastneutron induced mutant line FN8 were used. The FN8 line wasderived from cultivar ‘Williams 82 and shown to contain a deletionin the gene encoding stearoyl-acyl carrier protein desaturaseencoding gene C (sacpd-c) (Bolon et al., 2011; Gillman et al.,2014). Seeds were surface-sterilized with 20% (v/v) bleach for10 min and rinsed five times in sterile water. The sterile seedswere planted into pots containing a mixture of sterilized vermi-culite and perlite in a proportion of 3:1, respectively. At the time ofsowing, the sterile seeds were inoculated with either B. japonicumUSDA 110 (WT) or the nifH mutant (500 ll per seed). Bacterialgrowth is described in Methods S1. In the case of mixed inocula-tion (Methods S2), the WT and nifH mutant were mixed at ratiosof 1:19 and 3:7, respectively, similar to those reported previously(Regus et al., 2017). Plants were grown in the greenhouse under a16:8 h light/dark photocycle at 30°C. After 21 days of growth, thenodules attached to the primary root were harvested, immediatelyfrozen in liquid nitrogen, and stored at �80°C until LAESI-MS anal-ysis. Overall, the four nodule types analyzed were: (i) nodules
© 2020 Society for Experimental Biology and John Wiley & Sons Ltd,The Plant Journal, (2020), doi: 10.1111/tpj.14815
LAESI-MS of wild-type and mutant soybean root nodules 17
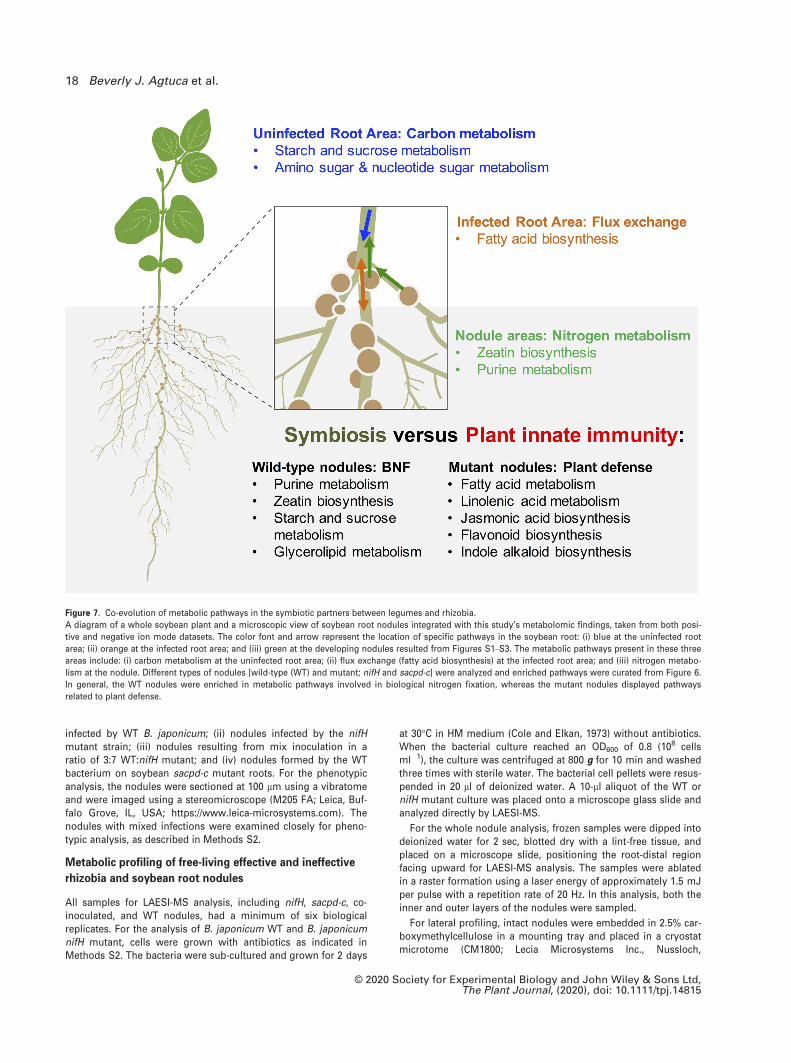
infected by WT B. japonicum; (ii) nodules infected by the nifHmutant strain; (iii) nodules resulting from mix inoculation in aratio of 3:7 WT:nifH mutant; and (iv) nodules formed by the WTbacterium on soybean sacpd-c mutant roots. For the phenotypicanalysis, the nodules were sectioned at 100 lm using a vibratomeand were imaged using a stereomicroscope (M205 FA; Leica, Buf-falo Grove, IL, USA; https://www.leica-microsystems.com). Thenodules with mixed infections were examined closely for pheno-typic analysis, as described in Methods S2.
Metabolic profiling of free-living effective and ineffective
rhizobia and soybean root nodules
All samples for LAESI-MS analysis, including nifH, sacpd-c, co-inoculated, and WT nodules, had a minimum of six biologicalreplicates. For the analysis of B. japonicum WT and B. japonicumnifH mutant, cells were grown with antibiotics as indicated inMethods S2. The bacteria were sub-cultured and grown for 2 days
at 30°C in HM medium (Cole and Elkan, 1973) without antibiotics.When the bacterial culture reached an OD600 of 0.8 (108 cellsml�1), the culture was centrifuged at 800 g for 10 min and washedthree times with sterile water. The bacterial cell pellets were resus-pended in 20 ll of deionized water. A 10-ll aliquot of the WT ornifH mutant culture was placed onto a microscope glass slide andanalyzed directly by LAESI-MS.
For the whole nodule analysis, frozen samples were dipped intodeionized water for 2 sec, blotted dry with a lint-free tissue, andplaced on a microscope slide, positioning the root-distal regionfacing upward for LAESI-MS analysis. The samples were ablatedin a raster formation using a laser energy of approximately 1.5 mJper pulse with a repetition rate of 20 Hz. In this analysis, both theinner and outer layers of the nodules were sampled.
For lateral profiling, intact nodules were embedded in 2.5% car-boxymethylcellulose in a mounting tray and placed in a cryostatmicrotome (CM1800; Lecia Microsystems Inc., Nussloch,
Figure 7. Co-evolution of metabolic pathways in the symbiotic partners between legumes and rhizobia.
A diagram of a whole soybean plant and a microscopic view of soybean root nodules integrated with this study’s metabolomic findings, taken from both posi-
tive and negative ion mode datasets. The color font and arrow represent the location of specific pathways in the soybean root: (i) blue at the uninfected root
area; (ii) orange at the infected root area; and (iii) green at the developing nodules resulted from Figures S1–S3. The metabolic pathways present in these three
areas include: (i) carbon metabolism at the uninfected root area; (ii) flux exchange (fatty acid biosynthesis) at the infected root area; and (iii) nitrogen metabo-
lism at the nodule. Different types of nodules [wild-type (WT) and mutant; nifH and sacpd-c] were analyzed and enriched pathways were curated from Figure 6.
In general, the WT nodules were enriched in metabolic pathways involved in biological nitrogen fixation, whereas the mutant nodules displayed pathways
related to plant defense.
© 2020 Society for Experimental Biology and John Wiley & Sons Ltd,The Plant Journal, (2020), doi: 10.1111/tpj.14815
18 Beverly J. Agtuca et al.
Germany; https://www.leica-microsystems.com) that was set to�10�C for approximately 30 min until the samples were frozen inthe embedding medium. The embedded nodules were affixedonto a specimen mount and sectioned to 60-µm thickness andthaw-mounted directly onto a microscope slide. The sectionednodule samples were imaged using a microscope (IX71; Olympus,Tokyo, Japan; https://www.olympus-lifescience.com) before andafter LAESI-MS analysis to determine the interrogated sampleareas. In addition, Methods S2 describes how the co-inoculatednodules were observed before LAESI-MS analysis. Using a man-ual stage, the sections were laterally profiled by ablating eachsample area with three laser shots of approximately 1.5 mJ perpulse. Between two to six ablated spots were obtained from eachlateral section. LAESI-MS instrumentation (Stopka et al., 2017),pathway analysis, and metabolite identification are described inMethods S3–S7.
ACKNOWLEDGEMENTS
The material is based on work supported by the US Depart-ment of Energy (DOE), Office of Biological and EnvironmentalResearch (OBER) under award number DOE-FOA-0001192 andNational Science Foundation (NSF) Plant Genome Programunder award number IOS-1734145. We thank Dr Hans-MartinFischer from the Eidgen€ossische Technische HochschuleZ€urich, CH-8093 Z€urich, Switzerland, for providing us the B.japonicum fix� mutant H1 (nifH) strain. We thank Frank Bakerand Alexander Jurkevich from the Molecular Cytology Core atthe C. S. Bond Life Sciences Center, the University of Mis-souri, for their help on the microscope images. We acknowl-edge Yaya Cui, Cuong Xuan Nguyen, Marina Cotta, TomasPellizzaro Pereira, Fernanda Plucani do Amaral, and ThalitaTuleski for helping to grow numerous soybean plants. We alsothank Md Shakhawat Hossain, as well as Katalin T�oth, MarinaCotta, Arati Poudel, Ritesh Kumar, and Fernanda Plucani doAmaral, for reading and editing earlier versions of this manu-script. J. Robil is acknowledged for the graphic design of Fig-ure 7. B.J.A. would like to acknowledge the University ofMissouri’s College of Agriculture, Food and Natural Resources(CAFNR) and Office of Graduate Studies for the George Wash-ington Carver Fellowship and Gus T. Ridgel Fellowship; andthe DOE Mickey Leland Fellowship. S.E. was supported by theUniversity of Missouri’s FRIPS (Freshmen research in plantSciences) program.
AUTHOR CONTRIBUTIONS
BJA, SAS, CRA, AV, and GS designed the experiments.
MGS provided the sacpd-c seeds. BJA, SAS, SE, and LS
performed the research. BJA, SAS, SE, LS, YL, and DX ana-
lyzed the data. BJA wrote the article with input from SAS,
CRA, MGS, DX, DWK, LP, LS, AV, and GS.
CONFLICT OF INTERESTS
The authors declare no conflict of interest.
DATA AVAILABILITY STATEMENT
Raw metabolomic data are available upon request to the
corresponding author.
SUPPORTING INFORMATION
Additional Supporting Information may be found in the online ver-sion of this article.
Figure S1. Metabolite profiling of soybean root anatomy wheninfected by WT B. japonicum using LAESI-MS in negative ionmode.
Figure S2. Box-and-whisker plots of significant metabolites thatwere highly abundant in the different areas of the primary rootfrom negative ion mode.
Figure S3. Fold enrichments represented by bar lengths for path-ways highly affected in soybean primary roots by WT B. japon-icum infection.
Figure S4. Mass spectra from LAESI-MS.
Figure S5. Comparison of metabolite profiles for 60-µm nodulesections derived from sacpd-c mutant plants in positive ion mode.
Figure S6. Microscopy images of nodule ultrastructure frommutant plant line sacpd-c.
Figure S7. Phenotypic screening of co-inoculated nodules at differ-ent rhizobia inoculum ratios.
Figure S8. Fluorescence microscope images of nifH and 3:7 (WT:nifH) co-inoculated nodules.
Figure S9. 3D PLS-DA score plot contrasting LAESI-MS data ofWT, nifH, and co-inoculated nodules.
Table S1. List of identified and unknown peaks that were highlyabundant in the different areas of the WT primary root based onFigures S1–S3.
Table S2. List of metabolites relating to Figure 1 with significantfold changes in the sacpd-c and nifH compared to the WT with aFC, of ≥ 2 and P < 0.05.
Table S3. List of identified and unknown compounds relating toFigure 1 in negative and positive ion mode datasets.
Table S4. List of compounds relating to Figure 3 with significantfold changes in the infection zone and outer layer when compar-ing nodules formed by either B. japonicum WT or nifH mutantstrain.
Table S5. Annotated metabolites that were significantly differentbetween nodule types.
Methods S1. Bacterial growth conditions.
Methods S2. Nodules that were infected by mix-inoculums
Methods S3. Instrumentation for LAESI-MS.
Methods S4. Data and pathway analysis.
Methods S5. Sample preparation for tandem electrospray ioniza-tion mass spectrometry (ESI-MS/MS).
Methods S6. Tandem electrospray ionization mass spectrometry(ESI-MS/MS).
Methods S7. Metabolite identification.
REFERENCES
Atkins, C. (1987) Metabolism and translocation of fixed nitrogen in the
nodulated legume. Plant Soil, 100, 157–169.Babu-Khan, S., Yeo, T.C., Martin, W.L., Duron, M.R., Rogers, R.D. and Gold-
stein, A.H. (1995) Cloning of a mineral phosphate-solubilizing gene from
Pseudomonas cepacia. Appl. Environ. Microbiol. 61, 972–978.Banba, M., Siddique, A.-B.-M., Kouchi, H., Izui, K. and Hata, S. (2001) Lotus
japonicus forms early senescent root nodules with Rhizobium etli. Mol.
Plant-Microbe Interact. 14, 173–180.Baral, B., da Silva, J.A.T. and Izaguirre-Mayoral, M.L. (2016) Early signaling,
synthesis, transport and metabolism of ureides. J. Plant Physiol. 193, 97–109.
Barsch, A., Carvalho, H.G., Cullimore, J.V. and Niehaus, K. (2006a) GC-MS
based metabolite profiling implies three interdependent ways of ammo-
nium assimilation in Medicago truncatula root nodules. J. Biotechnol.
127, 79–83.Barsch, A., Tellstr€om, V., Patschkowski, T., K€uster, H. and Niehaus, K.
(2006b) Metabolite profiles of nodulated alfalfa plants indicate that
© 2020 Society for Experimental Biology and John Wiley & Sons Ltd,The Plant Journal, (2020), doi: 10.1111/tpj.14815
LAESI-MS of wild-type and mutant soybean root nodules 19
distinct stages of nodule organogenesis are accompanied by global
physiological adaptations. Mol. Plant-Microbe Interact. 19, 998–1013.Beach, D.G., Walsh, C.M., Cantrell, P., Rourke, W., O’Brien, S., Reeves, K.
and McCarron, P. (2016) Laser ablation electrospray ionization high-reso-
lution mass spectrometry for regulatory screening of domoic acid in
shellfish. Rapid Commun. Mass Spectrom. 30, 2379–2387.Beatty, P.H. and Good, A.G. (2011) Future prospects for cereals that fix
nitrogen. Science, 333, 416–417.Bolon, Y.T., Haun, W.J., Xu, W.W. et al. (2011) Phenotypic and genomic
analyses of a fast neutron mutant population resource in soybean. Plant
Physiol. 156, 240–253.Brechenmacher, L., Lei, Z., Libault, M., Findley, S., Sugawara, M., Sad-
owsky, M.J., Sumner, L.W. and Stacey, G. (2010) Soybean metabolites
regulated in root hairs in response to the symbiotic bacterium Bradyrhi-
zobium japonicum. Plant Physiol. 153, 1808–1822.Brewin, N.J. (1991) Development of the legume root nodule. Annu. Rev. Cell
Biol. 7, 191–226.Cao, Y., Halane, M.K., Gassmann, W. and Stacey, G. (2017) The role of plant
innate immunity in the legume-rhizobium symbiosis. Annu. Rev. Plant
Biol. 68, 535–561.Charpentier, M. and Oldroyd, G. (2010) How close are we to nitrogen-fixing
cereals? Curr. Opin. Plant Biol. 13, 556–564.Cole, M.A. and Elkan, G.H. (1973) Transmissible resistance to penicillin G,
neomycin, and chloramphenicol in Rhizobium japonicum. Antimicrob.
Agents Chemother. 4, 248–253.Colebatch, G., Desbrosses, G., Ott, T., Krusell, L., Montanari, O., Kloska, S.,
Kopka, J. and Udvardi, M.K. (2004) Global changes in transcription
orchestrate metabolic differentiation during symbiotic nitrogen fixation
in Lotus japonicus. Plant J. 39, 487–512.de Werra, P., P�echy-Tarr, M., Keel, C. and Maurhofer, M. (2009) Role of glu-
conic acid production in the regulation of biocontrol traits of Pseu-
domonas fluorescens CHA0. Appl. Environ. Microbiol. 75, 4162–4174.Denison, R.F. (2000) Legume sanctions and the evolution of symbiotic coop-
eration by rhizobia. Am. Nat. 156, 567–576.Desbrosses, G.G., Kopka, J. and Udvardi, M.K. (2005) Lotus japonicus meta-
bolic profiling. Development of gas chromatography-mass spectrometry
resources for the study of plant-microbe interactions. Plant Physiol. 137,
1302–1318.Ding, Y. and Oldroyd, G.E. (2009) Positioning the nodule, the hormone dic-
tum. Plant Signal. Behav. 4, 89–93.Faizal, A. and Geelen, D. (2013) Saponins and their role in biological pro-
cesses in plants. Phytochem. Rev. 12, 877–893.Fujihara, S. and Yamaguchi, M. (1980) Nitrogen fixation and allantoin for-
mation in soybean plants. Agric. Biol. Chem. 44, 2569–2573.Gaude, N., Tippmann, H., Flemetakis, E., Katinakis, P., Udvardi, M. and
D€ormann, P. (2004) The galactolipid digalactosyldiacylglycerol accumu-
lates in the peribacteroid membrane of nitrogen-fixing nodules of soy-
bean and Lotus. J. Biol. Chem. 279, 34624–34630.Gemperline, E., Jayaraman, D., Maeda, J., An�e, J.-M. and Li, L. (2015) Multi-
faceted investigation of metabolites during nitrogen fixation in Medicago
via high resolution MALDI-MS imaging and ESI-MS. J. Am. Soc. Mass
Spectrom. 26, 149–158.Gillman, J.D., Stacey, M.G., Cui, Y.Y., Berg, H.R. and Stacey, G. (2014) Dele-
tions of the SACPD-C locus elevate seed stearic acid levels but also result
in fatty acid and morphological alterations in nitrogen fixing nodules.
BMC Plant Biol. 14, 143.
Gourion, B., Berrabah, F., Ratet, P. and Stacey, G. (2015) Rhizobium–legume
symbioses: the crucial role of plant immunity. Trends Plant Sci. 20, 186–194.
Hahn, M., Meyer, L., Studer, D., Regensburger, B. and Hennecke, H. (1984)
Insertion and deletion mutations within the nif region of rhizobium-
japonicum. Plant Mol. Biol. 3, 159–168.Hakoyama, T., Niimi, K., Watanabe, H., Tabata, R., Matsubara, J., Sato, S.,
Nakamura, Y., Tabata, S., Jichun, L. and Matsumoto, T. (2009) Host plant
genome overcomes the lack of a bacterial gene for symbiotic nitrogen
fixation. Nature, 462, 514–517.Hakoyama, T., Niimi, K., Yamamoto, T., Isobe, S., Sato, S., Nakamura,
Y., Tabata, S., Kumagai, H., Umehara, Y. and Brossuleit, K. (2011)
The integral membrane protein SEN1 is required for symbiotic nitro-
gen fixation in Lotus japonicus nodules. Plant Cell Physiol. 53, 225–236.
Halverson, L.J. and Stacey, G. (1986) Effect of lectin on nodulation by wild-
type Bradyrhizobium japonicum and a nodulation-defective mutant.
Appl. Environ. Microbiol. 51, 753–760.Harada, K. and Fukusaki, E. (2009) Profiling of primary metabolite by means
of capillary electrophoresis-mass spectrometry and its application for
plant science. Plant Biotechnol. 26, 47–52.Haralampidis, K., Trojanowska, M. and Osbourn, A.E. (2002) Biosynthesis of
triterpenoid saponins in plants. In History and Trends in Bioprocessing
and Biotransformation (Dutta, N.N., Hammar, F., Haralampidis, K., et al.
eds). Vol. 75, Berlin, Heidelberg: Springer, pp. 31–49.Hardy, R. and Havelka, U. (1975) Nitrogen fixation research: a key to world
food? Science, 188, 633–643.Hause, B. and Schaarschmidt, S. (2009) The role of jasmonates in mutualis-
tic symbioses between plants and soil-born microorganisms. Phyto-
chemistry, 70, 1589–1599.Hossain, M.S., Umehara, Y. and Kouchi, H. (2006) A novel Fix symbiotic
mutant of Lotus japonicus, Ljsym105, shows impaired development and
premature deterioration of nodule infected cells and symbiosomes. Mol.
Plant-Microbe Interact. 19, 780–788.Hostettmann, K. and Marston, A. (2005) Saponins. Cambridge: Cambridge
University Press.
Hunter, J.E., Zhang, J. and Kris-Etherton, P.M. (2009) Cardiovascular dis-
ease risk of dietary stearic acid compared with trans, other saturated,
and unsaturated fatty acids: a systematic review. Am. J. Clin. Nutr. 91,
46–63.Hunter, W.J. (1983) Soybean root and nodule nitrate reductase. Physiol.
Plant. 59, 471–475.Kachroo, A., Fu, D.-Q., Havens, W., Navarre, D., Kachroo, P. and Ghabrial,
S.A. (2008) An oleic acid–mediated pathway induces constitutive defense
signaling and enhanced resistance to multiple pathogens in soybean.
Mol. Plant-Microbe Interact. 21, 564–575.Kachroo, A., Shanklin, J., Whittle, E., Lapchyk, L., Hildebrand, D. and
Kachroo, P. (2007) The Arabidopsis stearoyl-acyl carrier protein-desat-
urase family and the contribution of leaf isoforms to oleic acid synthesis.
Plant Mol. Biol. 63, 257–271.Karr, D., Emerich, D. and Karr, A. (1992) Accumulation of the phytoalexin,
glyceollin, in root nodules of soybean formed by effective and ineffective
strains of Bradyrhizobium japonicum. J. Chem. Ecol. 18, 997–1008.Kawaguchi, M., Imaizumi-Anraku, H., Koiwa, H., Niwa, S., Ikuta, A.,
Syono, K. and Akao, S. (2002) Root, root hair, and symbiotic mutants
of the model legume Lotus japonicus. Mol. Plant-Microbe Interact. 15,
17–26.Kemen, A.C., Honkanen, S., Melton, R.E., Findlay, K.C., Mugford, S.T., Haya-
shi, K., Haralampidis, K., Rosser, S.J. and Osbourn, A. (2014) Investiga-
tion of triterpene synthesis and regulation in oats reveals a role for b-amyrin in determining root epidermal cell patterning. Proc. Natl Acad.
Sci. USA, 111, 8679–8684.Kiers, E.T., Rousseau, R.A., West, S.A. and Denison, R.F. (2003) Host sanc-
tions and the legume–rhizobium mutualism. Nature, 425, 78–81.Koo, A.J. (2018) Metabolism of the plant hormone jasmonate: a sentinel for
tissue damage and master regulator of stress response. Phytochem. Rev.
17, 51–80.Krishnan, H.B., Alaswad, A.A., Oehrle, N.W. and Gillman, J.D. (2016) Dele-
tion of the SACPD-C locus alters the symbiotic relationship between
Bradyrhizobium japonicum USDA110 and soybean, resulting in elicita-
tion of plant defense response and nodulation defects. Mol. Plant-
Microbe Interact. 29, 862–877.Kumagai, H., Hakoyama, T., Umehara, Y., Sato, S., Kaneko, T., Tabata, S.
and Kouchi, H. (2007) A novel ankyrin-repeat membrane protein, IGN1, is
required for persistence of nitrogen-fixing symbiosis in root nodules of
Lotus japonicus. Plant Physiol. 143, 1293–1305.Laith, A.Z., Rikkita, K., Tina, T.H. et al. (2020) Single-cell metabolic profiling:
metabolite formulas from isotopic fine structures in heterogeneous plant
cell populations. Anal. Chem. 92(10), 7289–7298. https://doi.org/10.1021/acs.analchem.0c00936
Lakhssassi, N., Colantonio, V., Flowers, N.D., Zhou, Z., Henry, J., Liu, S. and
Meksem, K. (2017) Stearoyl-acyl carrier protein desaturase mutations
uncover an impact of stearic acid in leaf and nodule structure. Plant
Physiol. 174, 1531–1543.Lardi, M., Murset, V., Fischer, H.-M., Mesa, S., Ahrens, C.H., Zamboni, N.
and Pessi, G. (2016) Metabolomic profiling of Bradyrhizobium
© 2020 Society for Experimental Biology and John Wiley & Sons Ltd,The Plant Journal, (2020), doi: 10.1111/tpj.14815
20 Beverly J. Agtuca et al.

diazoefficiens-induced root nodules reveals both host plant-specific and
developmental signatures. Int. J. Mol. Sci. 17, 815.
Larrainzar, E., Wienkoop, S., Weckwerth, W., Ladrera, R., Arrese-Igor, C.
and Gonz�alez, E.M. (2007) Medicago truncatula root nodule proteome
analysis reveals differential plant and bacteroid responses to drought
stress. Plant Physiol. 144, 1495–1507.LeVier, K., Day, D.A. and Guerinot, M.L. (1996) Iron uptake by symbiosomes
from soybean root nodules. Plant Physiol. 111, 893–900.Li, H., Balan, P. and Vertes, A. (2016) Molecular imaging of growth, metabo-
lism, and antibiotic inhibition in bacterial colonies by laser ablation elec-
trospray ionization mass spectrometry. Angew. Chem. Int. Ed. 55, 15035–15039.
Libault, M. (2018) Transcriptional reprogramming of legume genomes: per-
spective and challenges associated with single-cell and single cell-type
approaches during nodule development. Front. Plant Sci. 9, 1600.
Liechti, R. and Farmer, E.E. (2002) The jasmonate pathway. Science, 296,
1649–1650.Lim, G.-H., Singhal, R., Kachroo, A. and Kachroo, P. (2017) Fatty acid–and
lipid-mediated signaling in plant defense. Annu. Rev. Phytopathol. 55,
505–536.Loh, J.T., Yuen-Tsai, J.P.Y., Stacey, M.G., Lohar, D., Welborn, A. and Stacey,
G. (2001) Population density-dependent regulation of the Bradyrhizo-
bium japonicum nodulation genes. Mol. Microbiol. 42, 37–46.Maunoury, N., Redondo-Nieto, M., Bourcy, M., Van de Velde, W., Alunni,
B., Laporte, P., Durand, P., Agier, N., Marisa, L. and Vaubert, D. (2010)
Differentiation of symbiotic cells and endosymbionts in Medicago trun-
catula nodulation are coupled to two transcriptome-switches. PLoS ONE,
5, e9519.
Mergaert, P., Uchiumi, T., Alunni, B., Evanno, G., Cheron, A., Catrice, O.,
Mausset, A.-E., Barloy-Hubler, F., Galibert, F. and Kondorosi, A. (2006)
Eukaryotic control on bacterial cell cycle and differentiation in the Rhizo-
bium–legume symbiosis. Proc. Natl Acad. Sci. USA, 103, 5230–5235.Miwa, H., Sun, J., Oldroyd, G.E. and Allan Downie, J. (2006) Analysis of cal-
cium spiking using a cameleon calcium sensor reveals that nodulation
gene expression is regulated by calcium spike number and the develop-
mental status of the cell. Plant J. 48, 883–894.Moreau, S., Day, D.A. and Puppo, A. (1998) Ferrous iron is transported
across the peribacteroid membrane of soybean nodules. Planta, 207, 83–87.
Moreau, S., Meyer, J.-M. and Puppo, A. (1995) Uptake of iron by symbio-
somes and bacteroids from soybean nodules. FEBS Lett. 361, 225–228.Nakagawa, T. and Kawaguchi, M. (2006) Shoot-applied MeJA suppresses
root nodulation in Lotus japonicus. Plant Cell Physiol. 47, 176–180.Nemes, P., Barton, A.A., Li, Y. and Vertes, A. (2008) Ambient molecular
imaging and depth profiling of live tissue by infrared laser ablation elec-
trospray ionization mass spectrometry. Anal. Chem. 80, 4575–4582.Nemes, P. and Vertes, A. (2007) Laser ablation electrospray ionization for
atmospheric pressure, in vivo, and imaging mass spectrometry. Anal.
Chem. 79, 8098–8106.Nov�ak, K., Lis�a, L. and �Skrdleta, V. (2004) Rhizobial nod gene-inducing
activity in pea nodulation mutants: dissociation of nodulation and flavo-
noid response. Physiol. Plant. 120, 546–555.Oldroyd, G.E. (2013) Speak, friend, and enter: signalling systems that pro-
mote beneficial symbiotic associations in plants. Nat. Rev. Microbiol. 11,
252–263.Oldroyd, G.E. and Downie, J.A. (2008) Coordinating nodule morphogenesis
with rhizobial infection in legumes. Annu. Rev. Plant Biol. 59, 519–546.Oono, R., Anderson, C.G. and Denison, R.F. (2011) Failure to fix nitrogen by
non-reproductive symbiotic rhizobia triggers host sanctions that reduce
fitness of their reproductive clonemates. Proc. Roy. Soc. Lond. B Biol.
Sci. 278, 2698–2703.Parniske, M., Zimmermann, C., Cregan, P. and Werner, D. (1990) Hypersen-
sitive reaction of nodule cells in the glycine sp./Bradyrhizobium japon-
icum-symbiosis occurs at the genotype-specific level. Botanica Acta, 103,
143–148.Pauwels, L., Inz�e, D. and Goossens, A. (2009) Jasmonate-inducible gene:
what does it mean? Trends Plant Sci. 14, 87–91.Pislariu, C.I., Sinharoy, S., Torres-Jerez, I., Nakashima, J., Blancaflor, E.B.
and Udvardi, M.K. (2019) The nodule-specific PLAT domain protein
NPD1 is required for nitrogen-fixing symbiosis. Plant Physiol. 180,
1480–1497.
Prell, J. and Poole, P. (2006) Metabolic changes of rhizobia in legume nod-
ules. Trends Microbiol. 14, 161–168.Regus, J., Gano, K., Hollowell, A., Sofish, V. and Sachs, J. (2015) Lotus
hosts delimit the mutualism–parasitism continuum of B radyrhizobium.
J. Evol. Biol. 28, 447–456.Regus, J.U., Quides, K.W., O’Neill, M.R., Suzuki, R., Savory, E.A., Chang,
J.H. and Sachs, J.L. (2017) Cell autonomous sanctions in legumes target
ineffective rhizobia in nodules with mixed infections. Am. J. Bot. 104,
1299–1312.Rosendahl, L., Glenn, A.R. and Dilworth, M.J. (1991) Organic and inorganic
inputs into legume root nodule nitrogen fixation. In Biology and bio-
chemistry of nitrogen fixation (Dilworth, M.J., and Glenn, A.R., eds). Lon-
don: Elsevier London, pp. 259–291.Roth, L. and Stacey, G. (1989) Bacterium release into host cells of nitrogen-
fixing soybean nodules: the symbiosome membrane comes from three
sources. Eur. J. Cell Biol. 49, 13–23.Sachs, J., Russell, J., Lii, Y., Black, K., Lopez, G. and Patil, A. (2010) Host
control over infection and proliferation of a cheater symbiont. J. Evol.
Biol. 23, 1919–1927.Sadowsky,M.J., Cregan, P.B., Gottfert, M., Sharma, A., Gerhold, D., Rodriguez-
Quinones, F., Keyser, H.H., Hennecke, H. and Stacey, G. (1991) The Bradyrhi-
zobium japonicum nolA gene and its involvement in the genotype-specific
nodulation of soybeans. Proc. Natl Acad. Sci. USA, 88, 637–641.Sagan, M., Morandi, D., Tarenghi, E. and Duc, G. (1995) Selection of nodula-
tion and mycorrhizal mutants in the model plant Medicago truncatula
(Gaertn.) after c-ray mutagenesis. Plant Sci. 111, 63–71.Sanchez, F., Padilla, J.E., Perez, H. and Lara, M. (1991) Control of nodulin
genes in root-nodule development and metabolism. Annu. Rev. Plant
Biol. 42, 507–528.Sandal, N., Petersen, T.R., Murray, J., Umehara, Y., Karas, B., Yano, K.,
Kumagai, H., Yoshikawa, M., Saito, K. and Hayashi, M. (2006) Genetics
of symbiosis in Lotus japonicus: recombinant inbred lines, comparative
genetic maps, and map position of 35 symbiotic loci. Mol. Plant-Microbe
Interact. 19, 80–91.Sanjuan, J., Grob, P., Goettfert, M., Hennecke, H. and Stacey, G. (1994)
NodW is essential for full expression of the common nodulation genes
in Bradyrhizobium japonicum. Mol. Plant Microbe Interact. 7, 364–369.Sato, T., Yashima, H., Ohtake, N., Sueyoshi, K., Akao, S., Harper, J.E. and
Ohyama, T. (1998) Determination of leghemoglobin components and
xylem sap composition by capillary electrophoresis in hypernodulation
soybean mutants cultivated in the field. Soil Sci. Plant Nutr. 44, 635–645.Shanklin, J. and Cahoon, E.B. (1998) Desaturation and related modifications
of fatty acids. Annu. Rev. Plant Biol. 49, 611–641.Simms, E.L., Taylor, D.L., Povich, J., Shefferson, R.P., Sachs, J., Urbina, M.
and Tausczik, Y. (2005) An empirical test of partner choice mechanisms
in a wild legume–rhizobium interaction. Proc. Roy. Soc. B Biol. Sci. 273,
77–81.Singleton, P. and Stockinger, K. (1983) Compensation against ineffective
nodulation in soybean 1. Crop Sci. 23, 69–72.Smith, P.M. and Atkins, C.A. (2002) Purine biosynthesis. Big in cell division,
even bigger in nitrogen assimilation. Plant Physiol. 128, 793–802.Soedarjo, M. and Borthakur, D. (1998) Mimosine, a toxin produced by the
tree-legume Leucaena provides a nodulation competition advantage to
mimosine-degrading Rhizobium strains. Soil Biol. Biochem. 30, 1605–1613.
Soga, T., Ohashi, Y., Ueno, Y., Naraoka, H., Tomita, M. and Nishioka, T.
(2003) Quantitative metabolome analysis using capillary electrophoresis
mass spectrometry. J. Proteome Res. 2, 488–494.Spaink, H.P., Sheeley, D.M., van Brussel, A.A., Glushka, J., York, W.S., Tak,
T., Geiger, O., Kennedy, E.P., Reinhold, V.N. and Lugtenberg, B.J. (1991)
A novel highly unsaturated fatty acid moiety of lipo-oligosaccharide sig-
nals determines host specificity of Rhizobium. Nature, 354, 125.
Spaink, H.P., Wijffelman, C.A., Pees, E., Okker, R.J. and Lugtenberg, B.
(1987) Rhizobium nodulation gene nodD as a determinant of host speci-
ficity. Nature, 328, 337.
Stacey, G. (2007) The Rhizobium-legume nitrogen-fixing symbiosis. In Biol-
ogy of the Nitrogen Cycle (Bothe, H., Ferguson, S.J., and Newton, W.E.,
eds). London: Elsevier, p. 147–163.Stacey, G., Libault, M., Brechenmacher, L., Wan, J. and May, G.D. (2006)
Genetics and functional genomics of legume nodulation. Curr. Opin.
Plant Biol. 9, 110–121.
© 2020 Society for Experimental Biology and John Wiley & Sons Ltd,The Plant Journal, (2020), doi: 10.1111/tpj.14815
LAESI-MS of wild-type and mutant soybean root nodules 21

Stopka, S.A., Agtuca, B.J., Koppenaal, D.W., Pa�sa-Toli�c, L., Stacey, G.,
Vertes, A. and Anderton, C.R. (2017) Laser ablation electrospray ioniza-
tion mass spectrometry with ion mobility separation reveals metabolites
in the symbiotic interactions of soybean roots and rhizobia. Plant J. 91,
340–354.Stopka, S.A., Khattar, R., Agtuca, B.J., Anderton, C.R., Pa�sa-Toli�c, L., Sta-
cey, G. and Vertes, A. (2018) Metabolic noise and distinct subpopulations
observed by single cell LAESI mass spectrometry of plant cells in situ.
Front. Plant Sci. 9, 1646.
Stopka, S.A., Samarah, L.Z., Shaw, J.B. et al. (2019) Ambient metabolic pro-
filing and imaging of biological samples with ultrahigh molecular resolu-
tion using laser ablation electrospray ionization 21 Tesla FTICR mass
spectrometry. Anal. Chem. 91(8), 5028–5035. https://doi.org/10.1021/acs.analchem.8b05084
Suganuma, N., Nakamura, Y., Yamamoto, M., Ohta, T., Koiwa, H., Akao, S.
and Kawaguchi, M. (2003) The Lotus japonicus Sen1 gene controls rhizo-
bial differentiation into nitrogen-fixing bacteroids in nodules. Mol. Genet.
Genomics, 269, 312–320.Sun, J., Cardoza, V., Mitchell, D.M., Bright, L., Oldroyd, G. and Harris, J.M.
(2006) Crosstalk between jasmonic acid, ethylene and Nod factor signal-
ing allows integration of diverse inputs for regulation of nodulation.
Plant J. 46, 961–970.T�oth, K. and Stacey, G. (2015) Does plant immunity play a critical role during
initiation of the legume-rhizobium symbiosis? Front. Plant Sci. 6, 401.
Tsuno, Y., Fujimatsu, T., Endo, K., Sugiyama, A. and Yazaki, K. (2017) Soy-
asaponins, a new class of root exudates in soybean (Glycine max). Plant
Cell Physiol. 59, 366–375.Udvardi, M. and Poole, P.S. (2013) Transport and metabolism in legume-rhi-
zobia symbioses. Annu. Rev. Plant Biol. 64, 781–805.Vance, C. and Heichel, G. (1991) Carbon in N2 fixation: limitation or exqui-
site adaptation. Annu. Rev. Plant Biol. 42, 373–390.Veereshlingam, H., Haynes, J.G., Penmetsa, R.V., Cook, D.R., Sherrier, D.J.
and Dickstein, R. (2004) nip, a symbiotic Medicago truncatula mutant
that forms root nodules with aberrant infection threads and plant
defense-like response. Plant Physiol. 136, 3692–3702.
Veli�ckovi�c, D., Agtuca, B.J., Stopka, S.A., Vertes, A., Koppenaal, D.W.,
Pa�sa-Toli�c, L., Stacey, G. and Anderton, C.R. (2018) Observed meta-
bolic asymmetry within soybean root nodules reflects unexpected
complexity in rhizobacteria-legume metabolite exchange. ISME J. 12,
2335–2338.Vicente, E.J. and Dean, D.R. (2017) Keeping the nitrogen-fixation dream
alive. Proc. Natl Acad. Sci. USA, 114, 3009–3011.Wang, J.Y., Si, Z.Y., Li, F., Xiong, X.B., Lei, L., Xie, F.L., Chen, D.S., Li, Y.X.
and Li, Y.G. (2015) A purple acid phosphatase plays a role in nodule for-
mation and nitrogen fixation in Astragalus sinicus. Plant Mol. Biol. 88,
515–529.Wasternack, C. (2007) Jasmonates: an update on biosynthesis, signal trans-
duction and action in plant stress response, growth and development.
Ann. Bot. 100, 681–697.Wasternack, C. and Hause, B. (2013) Jasmonates: biosynthesis, perception,
signal transduction and action in plant stress response, growth and
development. An update to the 2007 review in Annals of Botany. Ann.
Bot. 111, 1021–1058.Yamaya-Ito, H., Shimoda, Y., Hakoyama, T., Sato, S., Kaneko, T., Hossain,
M.S., Shibata, S., Kawaguchi, M., Hayashi, M. and Kouchi, H. (2017)
Loss-of-function of ASPARTIC PEPTIDASE NODULE-INDUCED 1 (APN1)
in Lotus japonicus restricts efficient nitrogen-fixing symbiosis with speci-
fic Mesorhizobium loti strains. Plant J. 93, 5–16.Ye, H., Gemperline, E., Venkateshwaran, M., Chen, R., Delaux, P.M.,
Howes-Podoll, M., An�e, J.M. and Li, L. (2013) MALDI mass spectrome-
try-assisted molecular imaging of metabolites during nitrogen fixation
in the Medicago truncatula–Sinorhizobium meliloti symbiosis. Plant J.
75, 130–145.Zdyb, A., Demchenko, K., Heumann, J., Mrosk, C., Grzeganek, P., G€obel, C.,
Feussner, I., Pawlowski, K. and Hause, B. (2011) Jasmonate biosynthesis
in legume and actinorhizal nodules. New Phytol. 189, 568–579.Zhang, N., Venkateshwaran, M., Boersma, M., Harms, A., Howes-Podoll,
M., den Os, D., An�e, J.-M. and Sussman, M.R. (2012) Metabolomic profil-
ing reveals suppression of oxylipin biosynthesis during the early stages
of legume–rhizobia symbiosis. FEBS Lett. 586, 3150–3158.
© 2020 Society for Experimental Biology and John Wiley & Sons Ltd,The Plant Journal, (2020), doi: 10.1111/tpj.14815
22 Beverly J. Agtuca et al.
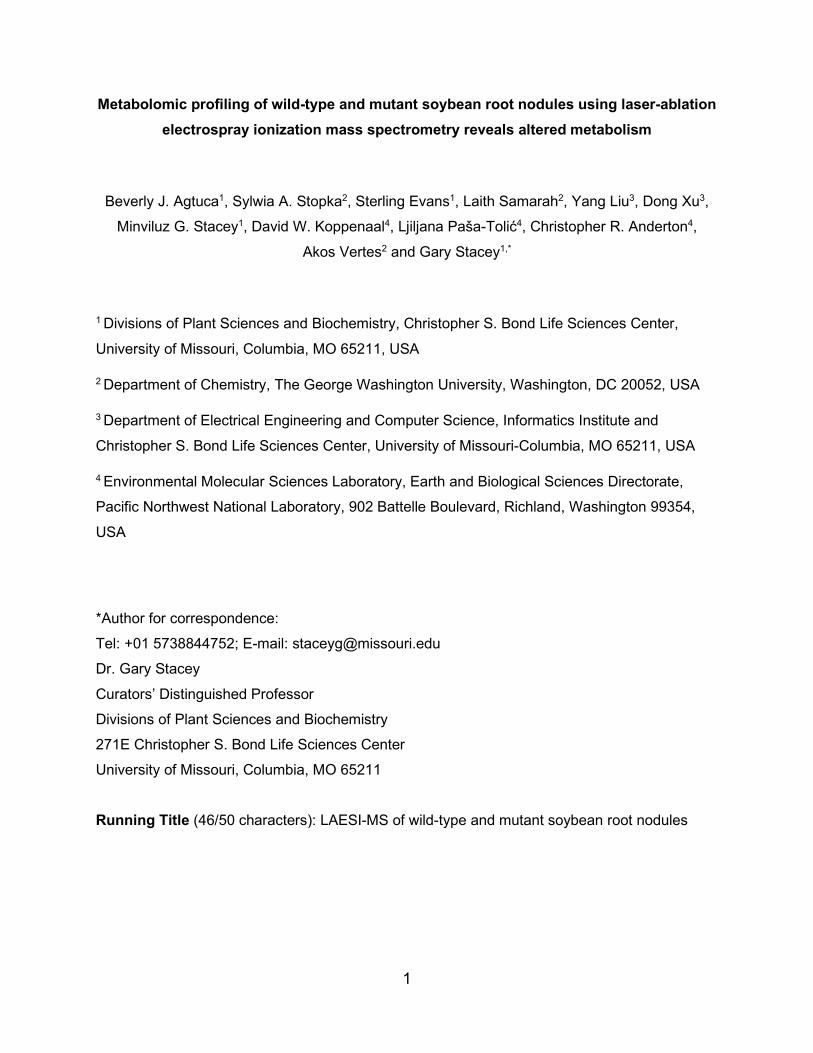
1
Metabolomic profiling of wild-type and mutant soybean root nodules using laser-ablation electrospray ionization mass spectrometry reveals altered metabolism
Beverly J. Agtuca1, Sylwia A. Stopka2, Sterling Evans1, Laith Samarah2, Yang Liu3, Dong Xu3,
Minviluz G. Stacey1, David W. Koppenaal4, Ljiljana Paša-Tolić4, Christopher R. Anderton4,
Akos Vertes2 and Gary Stacey1,*
1 Divisions of Plant Sciences and Biochemistry, Christopher S. Bond Life Sciences Center,
University of Missouri, Columbia, MO 65211, USA
2 Department of Chemistry, The George Washington University, Washington, DC 20052, USA
3 Department of Electrical Engineering and Computer Science, Informatics Institute and
Christopher S. Bond Life Sciences Center, University of Missouri-Columbia, MO 65211, USA
4 Environmental Molecular Sciences Laboratory, Earth and Biological Sciences Directorate,
Pacific Northwest National Laboratory, 902 Battelle Boulevard, Richland, Washington 99354,
USA
*Author for correspondence:
Tel: +01 5738844752; E-mail: [email protected]
Dr. Gary Stacey
Curators’ Distinguished Professor
Divisions of Plant Sciences and Biochemistry
271E Christopher S. Bond Life Sciences Center
University of Missouri, Columbia, MO 65211
Running Title (46/50 characters): LAESI-MS of wild-type and mutant soybean root nodules

2
SUPPORTING INFORMATION: Figures
Figure S1. Metabolite profiling of soybean root anatomy when infected by WT B. japonicum using LAESI-MS in negative ion mode. (a) Schematic showing locations of ablation spots for
LAESI-MS analysis (nodule, infected root area, and uninfected root area). (b) PLS-DA score plot
showing the separation of sample types for the nodule in red, the infected root area in orange,
and uninfected root area in purple.

3
Figure S2. Box and whisker plots of significant metabolites that were highly abundant in the different areas of the primary root from negative ion mode. (a) Infected root area shown
in orange, (b) uninfected root area shown in purple, and (c) the nodule shown in red. These
metabolite abundances had fold change values FC ≥ 2 and p < 0.05.
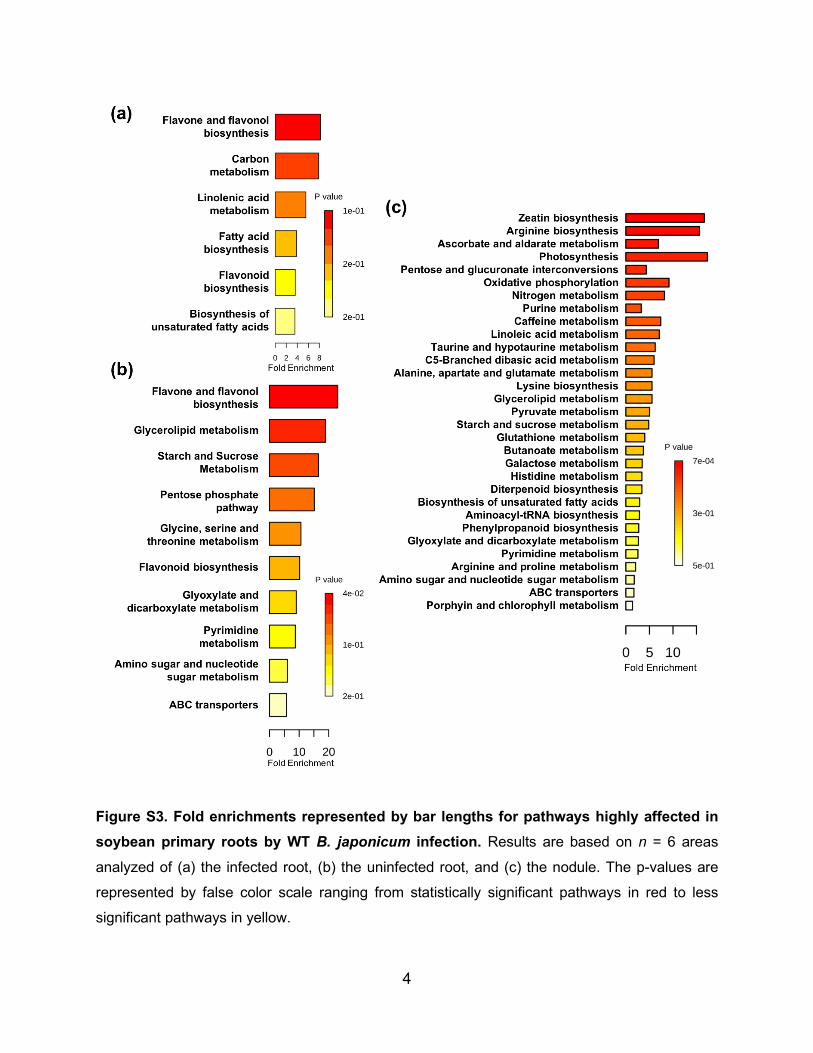
4
Figure S3. Fold enrichments represented by bar lengths for pathways highly affected in soybean primary roots by WT B. japonicum infection. Results are based on n = 6 areas
analyzed of (a) the infected root, (b) the uninfected root, and (c) the nodule. The p-values are
represented by false color scale ranging from statistically significant pathways in red to less
significant pathways in yellow.
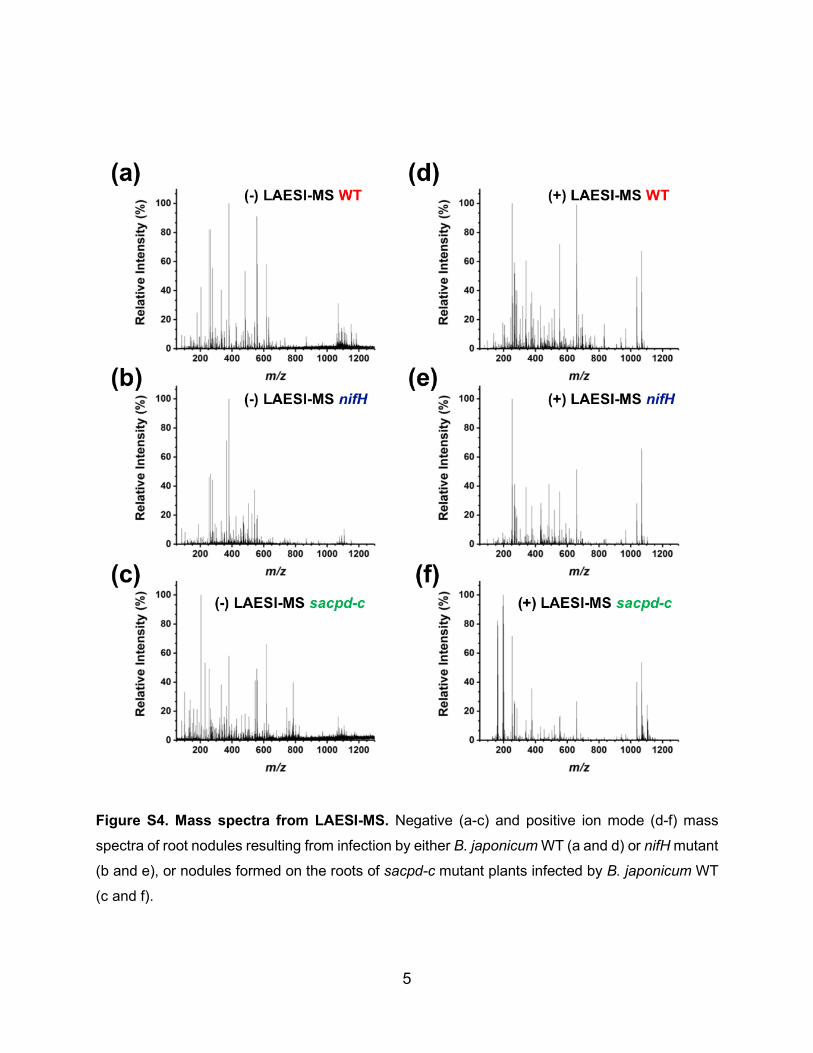
5
Figure S4. Mass spectra from LAESI-MS. Negative (a-c) and positive ion mode (d-f) mass
spectra of root nodules resulting from infection by either B. japonicum WT (a and d) or nifH mutant
(b and e), or nodules formed on the roots of sacpd-c mutant plants infected by B. japonicum WT
(c and f).
6
Figure S5. Comparison of metabolite profiles for 60 µm nodule sections derived from sacpd-c mutant plants in positive ion mode. (a) Bright field images before and after profiling
by ablations at 8 positions in sacpd-c. Scale bars = 200 µm. (b) Comparison of average mass
spectra from position 1 in the outer layer and position 4 in the necrotic lesion region. (c) Intensities
of adenosine at m/z= 268.117, an uncharacterized metabolite at m/z = 546.480, dihydroxyflavone
at m/z= 255.068, and heme B at m/z= 616.178 as a function of the number of laser pulses.
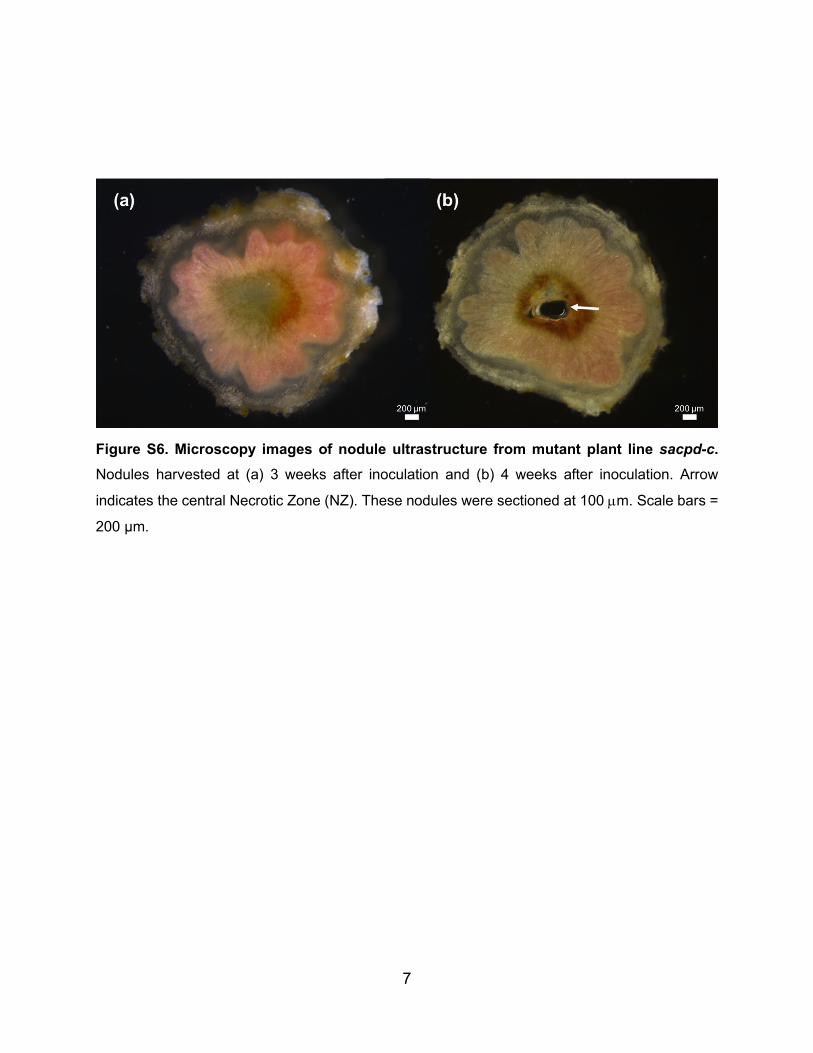
7
Figure S6. Microscopy images of nodule ultrastructure from mutant plant line sacpd-c. Nodules harvested at (a) 3 weeks after inoculation and (b) 4 weeks after inoculation. Arrow
indicates the central Necrotic Zone (NZ). These nodules were sectioned at 100 µm. Scale bars =
200 µm.

8
Figure S7. Phenotypic screening of co-inoculated nodules at different rhizobia inoculum ratios. (a) Comparison of sectioned nodules from plants that were infected by WT B. japonicum,
nifH mutant strain, and mixed inoculums of 1:19 and 3:7, with images of replicates for the latter
two. The 3:7 WT:nifH co-inoculated nodules showed the best phenotype of sectors. (b) An optical
image of a CI nodule that was embedded with CMC and was placed on a stage in the cryostat.
This image helped determine where the different sectors were pre-LAESI-MS analyses. (c) Before
and after images of a LAESI-MS analyzed 3:7 co-inoculated nodule. The after image illustrates
where the LAESI-MS ablation occurred (white arrows) in the distinctive sectors, where the
ablation spot size was ~300 µm. Yellow arrows represent the ineffective endosymbionts shown
in white and darker contrast, while white arrows display the effective endosymbionts shown in
red/pink and a lighter contrast. Scale bars represent 200 µm for the WT and nifH images and 0.5
mm for the co-inoculated nodule images.
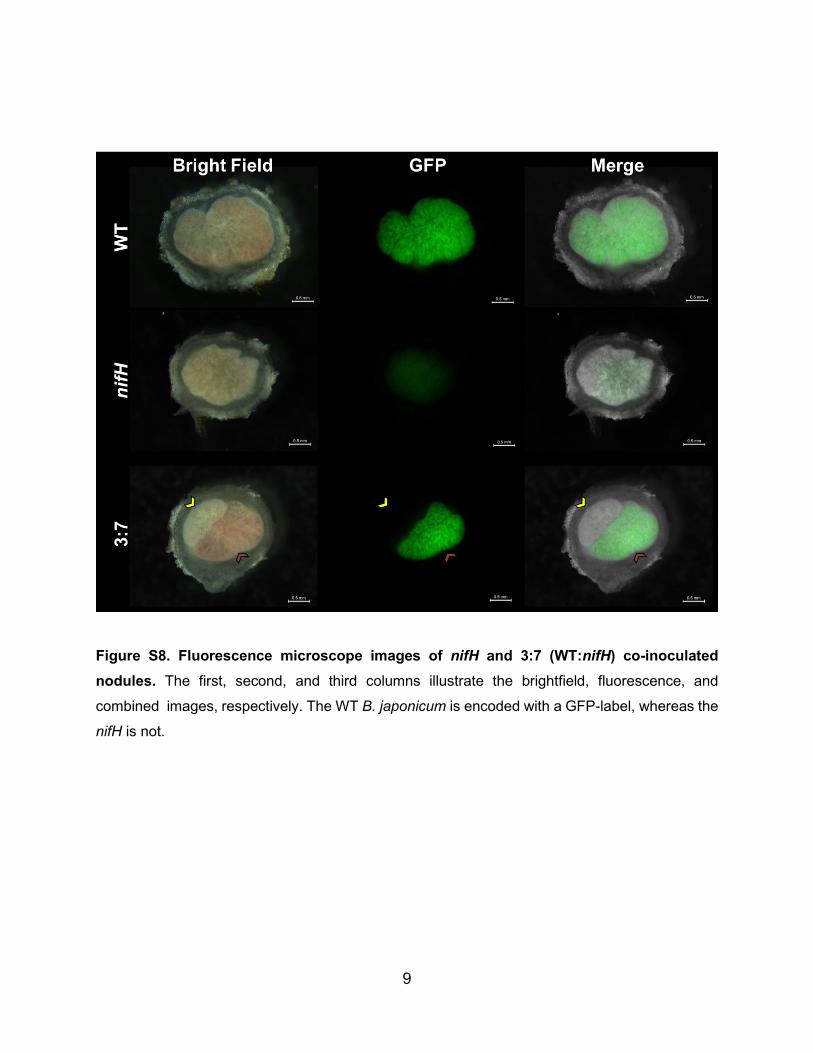
9
Figure S8. Fluorescence microscope images of nifH and 3:7 (WT:nifH) co-inoculated nodules. The first, second, and third columns illustrate the brightfield, fluorescence, and
combined images, respectively. The WT B. japonicum is encoded with a GFP-label, whereas the
nifH is not.
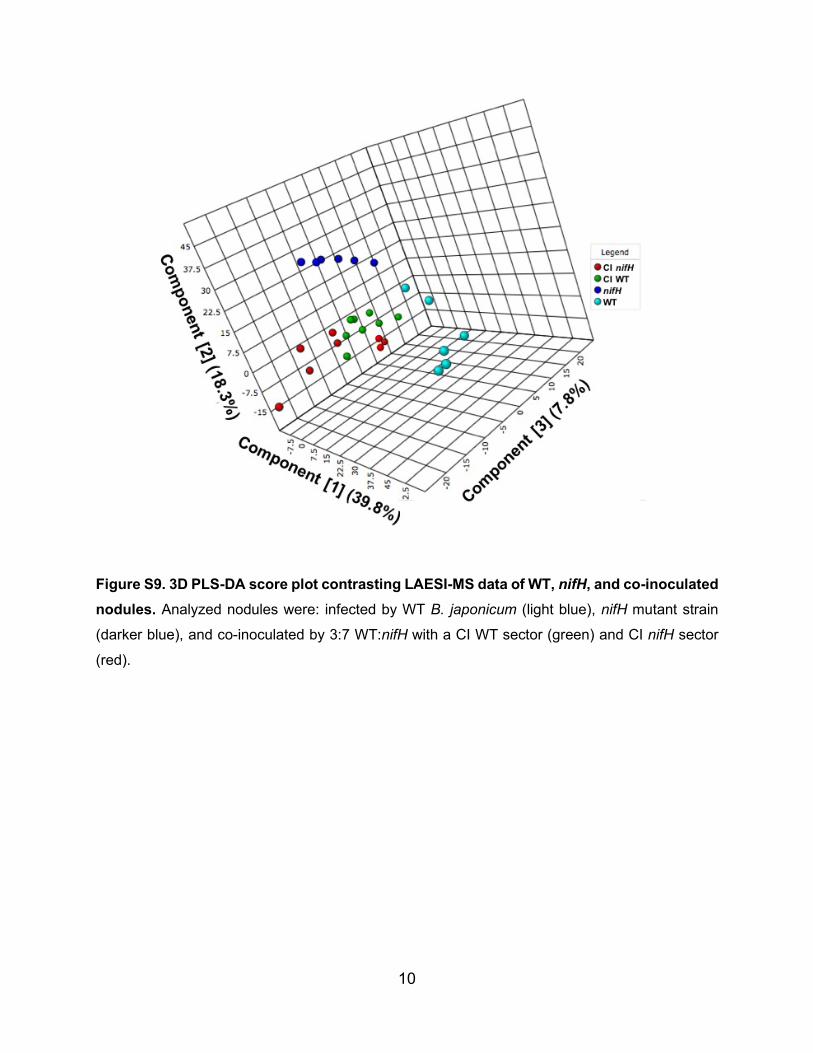
10
Figure S9. 3D PLS-DA score plot contrasting LAESI-MS data of WT, nifH, and co-inoculated nodules. Analyzed nodules were: infected by WT B. japonicum (light blue), nifH mutant strain
(darker blue), and co-inoculated by 3:7 WT:nifH with a CI WT sector (green) and CI nifH sector
(red).
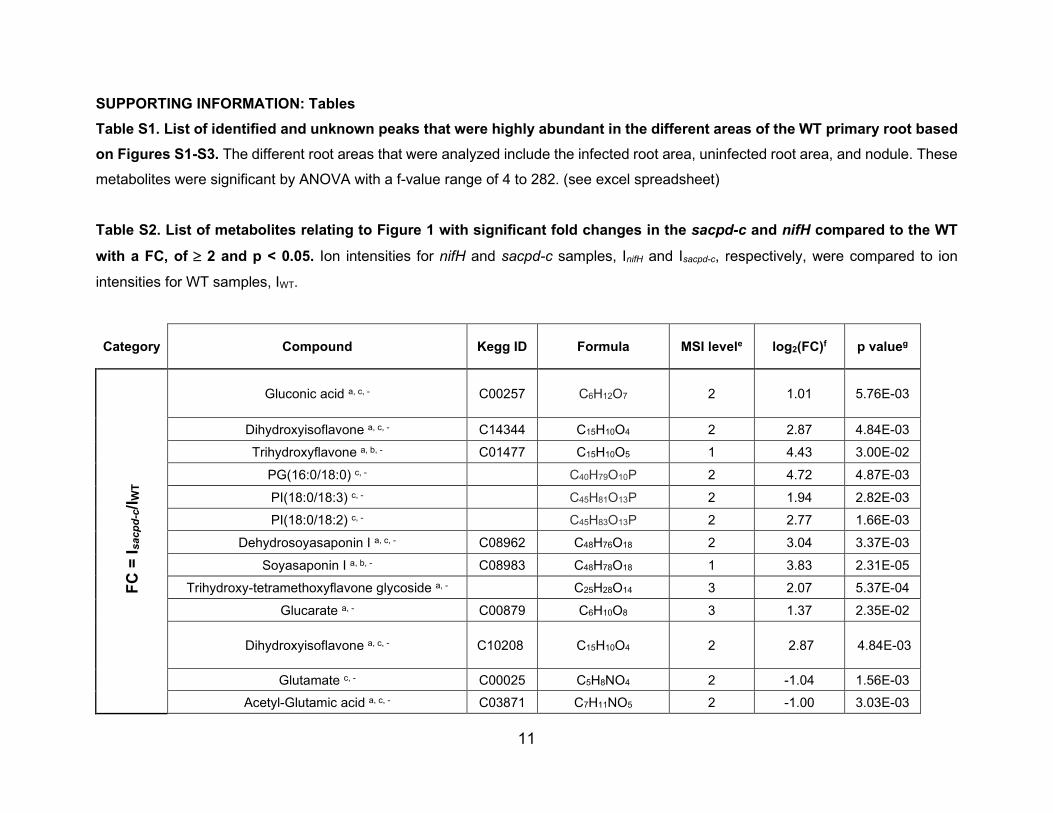
11
SUPPORTING INFORMATION: Tables Table S1. List of identified and unknown peaks that were highly abundant in the different areas of the WT primary root based on Figures S1-S3. The different root areas that were analyzed include the infected root area, uninfected root area, and nodule. These
metabolites were significant by ANOVA with a f-value range of 4 to 282. (see excel spreadsheet) Table S2. List of metabolites relating to Figure 1 with significant fold changes in the sacpd-c and nifH compared to the WT with a FC, of ≥ 2 and p < 0.05. Ion intensities for nifH and sacpd-c samples, InifH and Isacpd-c, respectively, were compared to ion
intensities for WT samples, IWT.
Category Compound Kegg ID Formula MSI levele log2(FC)f p valueg
FC
= I s
acpd
-c/I W
T
Gluconic acid a, c, - C00257 C6H12O7 2 1.01 5.76E-03
Dihydroxyisoflavone a, c, - C14344 C15H10O4 2 2.87 4.84E-03 Trihydroxyflavone a, b, - C01477 C15H10O5 1 4.43 3.00E-02
PG(16:0/18:0) c, - C40H79O10P 2 4.72 4.87E-03
PI(18:0/18:3) c, - C45H81O13P 2 1.94 2.82E-03 PI(18:0/18:2) c, - C45H83O13P 2 2.77 1.66E-03
Dehydrosoyasaponin I a, c, - C08962 C48H76O18 2 3.04 3.37E-03
Soyasaponin I a, b, - C08983 C48H78O18 1 3.83 2.31E-05 Trihydroxy-tetramethoxyflavone glycoside a, - C25H28O14 3 2.07 5.37E-04
Glucarate a, - C00879 C6H10O8 3 1.37 2.35E-02
Dihydroxyisoflavone a, c, - C10208 C15H10O4 2 2.87 4.84E-03
Glutamate c, - C00025 C5H8NO4 2 -1.04 1.56E-03 Acetyl-Glutamic acid a, c, - C03871 C7H11NO5 2 -1.00 3.03E-03

12
Methylcitrate/Homoisocitrate a, - C01251 C7H10O7 3 -1.48 3.02E-05
PA(16:0/18:1) c, - C00416 C37H71O8P 2 -6.72 1.42E-04 PA(18:2/18:2) c, - C39H69O8P 2 -1.13 4.10E-03
PE(16:0/18:2) c, - C00350 C39H74NO8P 2 -1.99 4.19E-07
PE(16:0/18:1) c, - C13877 C39H76NO8P 2 -1.99 4.19E-07 PE(18:1/18:2) c, - C00157 C41H75NO8P 2 -2.85 9.04E-03
PG(16:0/18:2) c, - C40H75O10 2 -1.72 1.02E-03
PG(16:0/18:1) c, - C13883 C40H77O10P 2 -1.76 1.02E-03
PI(16:0/18:2) c, - C43H79O13P 2 -1.43 5.61E-05
Cyclohexylamine c, + C00571 C6H13N 2 -1.58 1.19E-06
Glucosylpyridoxine a, c, + C03996 C14H21NO8 2 -1.52 1.44E-07
Adenosylmethionine a, c, + C00019 C15H22N6O5S 2 -1.62 1.22E-04
FC
= I n
ifH/I W
T
Methylcitrate/Homoisocitrate a, - C01251 C7H10O7 3 -1.37 4.09E-04
Coumesterol a, c, - C10205 C15H8O5 2 -2.31 1.00E-03
Butene tricarboxylate a, - C16579 C7H8O6 3 -2.81 6.74E-05
Hydroxyoctadecatrienoic acid a, c, - C16316 C18H30O3 2 -4.76 3.08E-02 Epoxyoctadecenoic acid a, c, - C08368 C18H32O3 2 -4.76 3.08E-02
Disaccharide a, c, - C00208 C12H22O11 2 4.37 2.50E-02
Adenine b, - C00147 C5H5N5 1 -1.47 2.13E-03 Pentose c, - C00181 C5H10O5 2 -1.45 1.20E-03
Acetyl-Glutamic acid a, c, - C03871 C7H11NO5 2 -3.45 2.45E-04
Gluconic acid a, c, - C00514 C6H12O7 2 -1.13 9.78E-05

13
Heme B a, c, + C00032 C34H32FeN4O4 2 -3.70 4.43E-02
Hexose phosphate a, c, - C01097 C6H13O9P 2 -1.04 3.57E-03 Gibberellin b, - C01699 C19H22O6 1 -1.28 3.52E-02
Benzoyloxyhydroxypropyl glucopyranosiduronic acid c, - C16H20O10 2 -2.36 2.77E-05
Dihydroxyisoflavone malonyl glycoside c, - C16191 C24H22O12 2 -2.11 9.72E-03
Hydroxy-dimethoxyflavone glycoside c, - C23H24O10 2 -5.16 1.95E-03
Hydroxyjasmonic acid glycoside/Tuberonic acid glycoside a, c, - C08558 C18H28O9 2 -1.29 1.30E-03
PG(18:1/18:1) c, - C00344 C42H79O10P 2 -2.51 1.74E-03
PI(16:0/18:2) c, - C45H78O13P 2 -1.95 4.00E-04 UDP-hexose a, - C00029 C15H24N2O17P2 3 -2.41 2.11E-02
Jasmonic acid a, c, - C08491 C12H18O3 2 4.57 1.47E-08
Hydroxyjasmonic acid a, - C21385 C12H18O4 3 3.29 6.33E-04
Dihydrojasmonic acid a, c, - C16309 C12H20O3 2 1.93 1.93E-03
Methyl jasmonate a, - C11512 C13H20O3 3 1.48 2.34E-02
Hydroperoxyoctadecadienoic acid a, c, - C07338 C18H32O4 2 2.38 3.30E-02
Oxooctadecatrienoic acid a, c, - C16320 C18H28O3 2 2.41 1.17E-04
Epoxyoctadecadienoic acid a, c, - C16316 C18H30O3 2 2.49 2.80E-04
Epoxyoctadecenoic acid a, c, - C08368 C18H32O3 2 2.44 2.80E-04
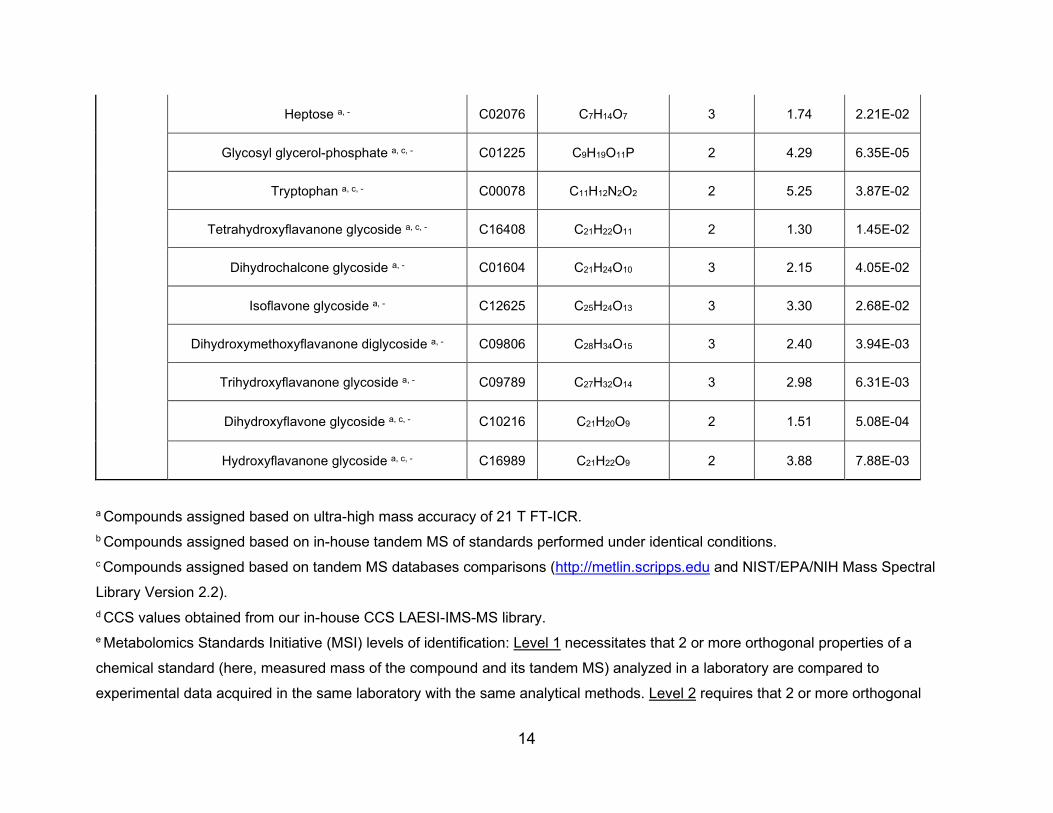
14
Heptose a, - C02076 C7H14O7 3 1.74 2.21E-02
Glycosyl glycerol-phosphate a, c, - C01225 C9H19O11P 2 4.29 6.35E-05
Tryptophan a, c, - C00078 C11H12N2O2 2 5.25 3.87E-02
Tetrahydroxyflavanone glycoside a, c, - C16408 C21H22O11 2 1.30 1.45E-02
Dihydrochalcone glycoside a, - C01604 C21H24O10 3 2.15 4.05E-02
Isoflavone glycoside a, - C12625 C25H24O13 3 3.30 2.68E-02
Dihydroxymethoxyflavanone diglycoside a, - C09806 C28H34O15 3 2.40 3.94E-03
Trihydroxyflavanone glycoside a, - C09789 C27H32O14 3 2.98 6.31E-03
Dihydroxyflavone glycoside a, c, - C10216 C21H20O9 2 1.51 5.08E-04
Hydroxyflavanone glycoside a, c, - C16989 C21H22O9 2 3.88 7.88E-03
a Compounds assigned based on ultra-high mass accuracy of 21 T FT-ICR. b Compounds assigned based on in-house tandem MS of standards performed under identical conditions. c Compounds assigned based on tandem MS databases comparisons (http://metlin.scripps.edu and NIST/EPA/NIH Mass Spectral
Library Version 2.2). d CCS values obtained from our in-house CCS LAESI-IMS-MS library. e Metabolomics Standards Initiative (MSI) levels of identification: Level 1 necessitates that 2 or more orthogonal properties of a
chemical standard (here, measured mass of the compound and its tandem MS) analyzed in a laboratory are compared to
experimental data acquired in the same laboratory with the same analytical methods. Level 2 requires that 2 or more orthogonal
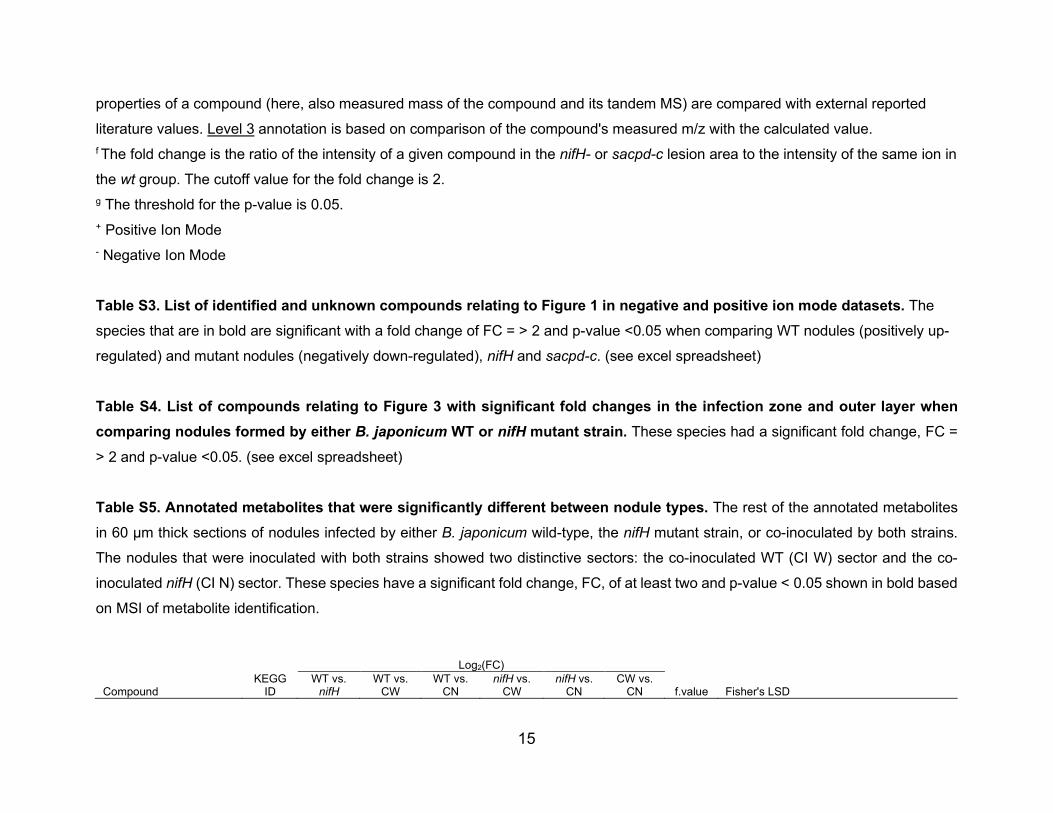
15
properties of a compound (here, also measured mass of the compound and its tandem MS) are compared with external reported
literature values. Level 3 annotation is based on comparison of the compound's measured m/z with the calculated value. f The fold change is the ratio of the intensity of a given compound in the nifH- or sacpd-c lesion area to the intensity of the same ion in
the wt group. The cutoff value for the fold change is 2. g The threshold for the p-value is 0.05. + Positive Ion Mode - Negative Ion Mode
Table S3. List of identified and unknown compounds relating to Figure 1 in negative and positive ion mode datasets. The
species that are in bold are significant with a fold change of FC = > 2 and p-value <0.05 when comparing WT nodules (positively up-
regulated) and mutant nodules (negatively down-regulated), nifH and sacpd-c. (see excel spreadsheet)
Table S4. List of compounds relating to Figure 3 with significant fold changes in the infection zone and outer layer when comparing nodules formed by either B. japonicum WT or nifH mutant strain. These species had a significant fold change, FC =
> 2 and p-value <0.05. (see excel spreadsheet) Table S5. Annotated metabolites that were significantly different between nodule types. The rest of the annotated metabolites
in 60 µm thick sections of nodules infected by either B. japonicum wild-type, the nifH mutant strain, or co-inoculated by both strains.
The nodules that were inoculated with both strains showed two distinctive sectors: the co-inoculated WT (CI W) sector and the co-
inoculated nifH (CI N) sector. These species have a significant fold change, FC, of at least two and p-value < 0.05 shown in bold based
on MSI of metabolite identification.
Log2(FC)
Compound KEGG
ID WT vs.
nifH WT vs.
CW WT vs.
CN nifH vs.
CW nifH vs.
CN CW vs.
CN f.value Fisher's LSD
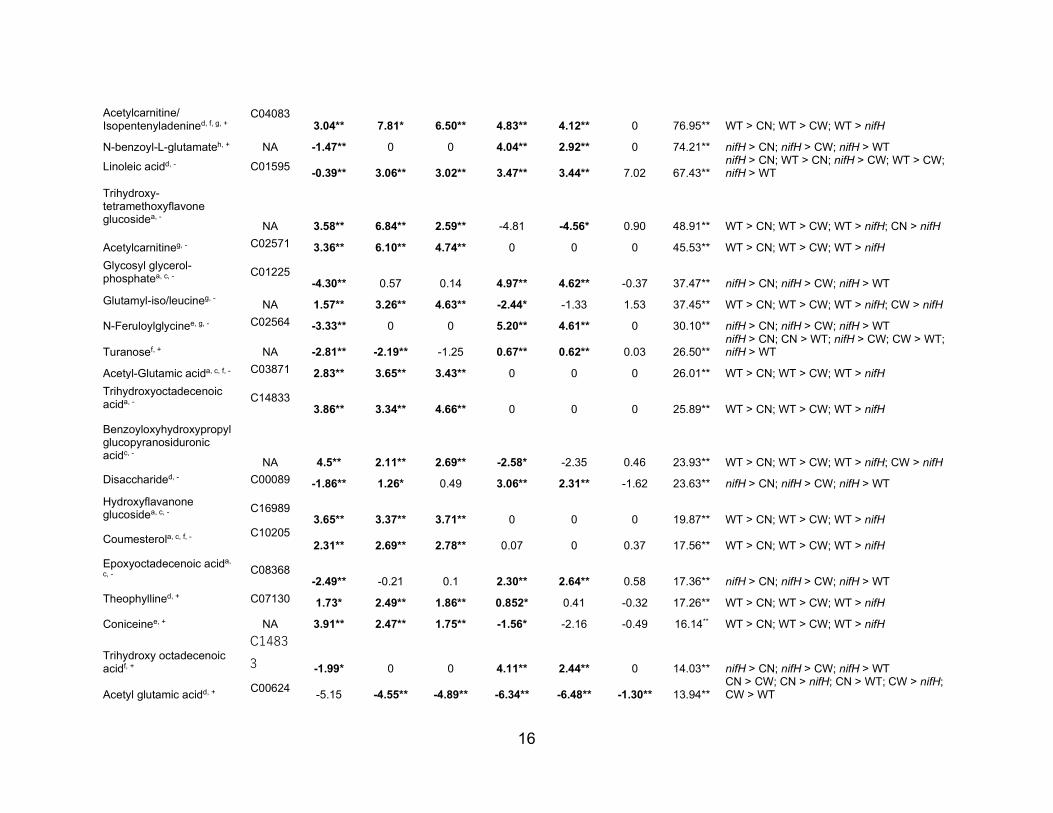
16
Acetylcarnitine/ Isopentenyladenined, f, g, +
C04083 3.04** 7.81* 6.50** 4.83** 4.12** 0 76.95** WT > CN; WT > CW; WT > nifH
N-benzoyl-L-glutamateh, + NA -1.47** 0 0 4.04** 2.92** 0 74.21** nifH > CN; nifH > CW; nifH > WT
Linoleic acidd, - C01595 -0.39** 3.06** 3.02** 3.47** 3.44** 7.02 67.43** nifH > CN; WT > CN; nifH > CW; WT > CW; nifH > WT
Trihydroxy-tetramethoxyflavone glucosidea, - NA 3.58** 6.84** 2.59** -4.81 -4.56* 0.90 48.91** WT > CN; WT > CW; WT > nifH; CN > nifH
Acetylcarnitineg, - C02571 3.36** 6.10** 4.74** 0 0 0 45.53** WT > CN; WT > CW; WT > nifH Glycosyl glycerol-phosphatea, c, - C01225
-4.30** 0.57 0.14 4.97** 4.62** -0.37 37.47** nifH > CN; nifH > CW; nifH > WT Glutamyl-iso/leucineg, - NA 1.57** 3.26** 4.63** -2.44* -1.33 1.53 37.45** WT > CN; WT > CW; WT > nifH; CW > nifH
N-Feruloylglycinee, g, - C02564 -3.33** 0 0 5.20** 4.61** 0 30.10** nifH > CN; nifH > CW; nifH > WT
Turanosef, + NA -2.81** -2.19** -1.25 0.67** 0.62** 0.03 26.50** nifH > CN; CN > WT; nifH > CW; CW > WT; nifH > WT
Acetyl-Glutamic acida, c, f, - C03871 2.83** 3.65** 3.43** 0 0 0 26.01** WT > CN; WT > CW; WT > nifH Trihydroxyoctadecenoic acida, - C14833
3.86** 3.34** 4.66** 0 0 0 25.89** WT > CN; WT > CW; WT > nifH
Benzoyloxyhydroxypropyl glucopyranosiduronic acidc, - NA 4.5** 2.11** 2.69** -2.58* -2.35 0.46 23.93** WT > CN; WT > CW; WT > nifH; CW > nifH Disaccharided, - C00089 -1.86** 1.26* 0.49 3.06** 2.31** -1.62 23.63** nifH > CN; nifH > CW; nifH > WT Hydroxyflavanone glucosidea, c, - C16989
3.65** 3.37** 3.71** 0 0 0 19.87** WT > CN; WT > CW; WT > nifH
Coumesterola, c, f, - C10205 2.31** 2.69** 2.78** 0.07 0 0.37 17.56** WT > CN; WT > CW; WT > nifH
Epoxyoctadecenoic acida,
c, - C08368 -2.49** -0.21 0.1 2.30** 2.64** 0.58 17.36** nifH > CN; nifH > CW; nifH > WT
Theophyllined, + C07130 1.73* 2.49** 1.86** 0.852* 0.41 -0.32 17.26** WT > CN; WT > CW; WT > nifH
Coniceinee, + NA 3.91** 2.47** 1.75** -1.56* -2.16 -0.49 16.14** WT > CN; WT > CW; WT > nifH
Trihydroxy octadecenoic acidf, +
C14833 -1.99* 0 0 4.11** 2.44** 0 14.03** nifH > CN; nifH > CW; nifH > WT
Acetyl glutamic acidd, + C00624 -5.15 -4.55** -4.89** -6.34** -6.48** -1.30** 13.94** CN > CW; CN > nifH; CN > WT; CW > nifH; CW > WT
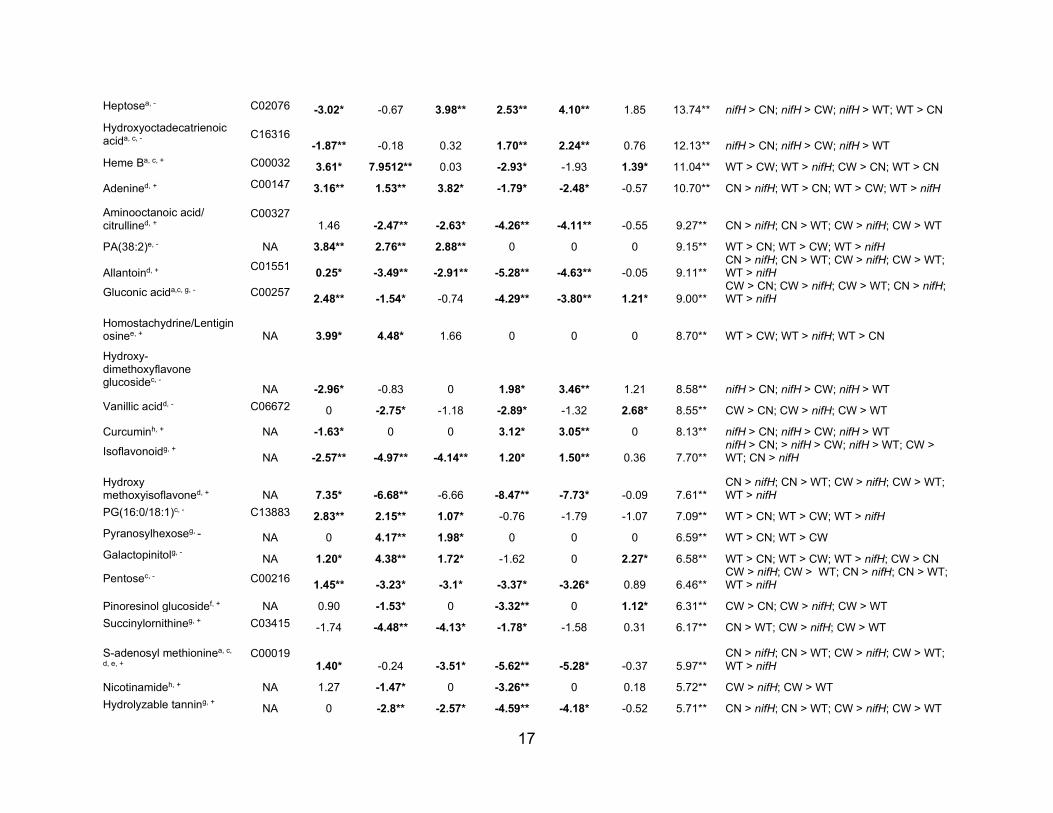
17
Heptosea, - C02076 -3.02* -0.67 3.98** 2.53** 4.10** 1.85 13.74** nifH > CN; nifH > CW; nifH > WT; WT > CN Hydroxyoctadecatrienoic acida, c, - C16316
-1.87** -0.18 0.32 1.70** 2.24** 0.76 12.13** nifH > CN; nifH > CW; nifH > WT Heme Ba, c, + C00032 3.61* 7.9512** 0.03 -2.93* -1.93 1.39* 11.04** WT > CW; WT > nifH; CW > CN; WT > CN
Adenined, + C00147 3.16** 1.53** 3.82* -1.79* -2.48* -0.57 10.70** CN > nifH; WT > CN; WT > CW; WT > nifH
Aminooctanoic acid/ citrullined, +
C00327 1.46 -2.47** -2.63* -4.26** -4.11** -0.55 9.27** CN > nifH; CN > WT; CW > nifH; CW > WT
PA(38:2)e, - NA 3.84** 2.76** 2.88** 0 0 0 9.15** WT > CN; WT > CW; WT > nifH
Allantoind, + C01551 0.25* -3.49** -2.91** -5.28** -4.63** -0.05 9.11** CN > nifH; CN > WT; CW > nifH; CW > WT; WT > nifH
Gluconic acida,c, g, - C00257 2.48** -1.54* -0.74 -4.29** -3.80** 1.21* 9.00** CW > CN; CW > nifH; CW > WT; CN > nifH; WT > nifH
Homostachydrine/Lentiginosinee, + NA 3.99* 4.48* 1.66 0 0 0 8.70** WT > CW; WT > nifH; WT > CN
Hydroxy-dimethoxyflavone glucosidec, - NA -2.96* -0.83 0 1.98* 3.46** 1.21 8.58** nifH > CN; nifH > CW; nifH > WT Vanillic acidd, - C06672 0 -2.75* -1.18 -2.89* -1.32 2.68* 8.55** CW > CN; CW > nifH; CW > WT
Curcuminh, + NA -1.63* 0 0 3.12* 3.05** 0 8.13** nifH > CN; nifH > CW; nifH > WT
Isoflavonoidg, + NA -2.57** -4.97** -4.14** 1.20* 1.50** 0.36 7.70** nifH > CN; > nifH > CW; nifH > WT; CW > WT; CN > nifH
Hydroxy methoxyisoflavoned, + NA 7.35* -6.68** -6.66 -8.47** -7.73* -0.09 7.61**
CN > nifH; CN > WT; CW > nifH; CW > WT; WT > nifH
PG(16:0/18:1)c, - C13883 2.83** 2.15** 1.07* -0.76 -1.79 -1.07 7.09** WT > CN; WT > CW; WT > nifH Pyranosylhexoseg, - NA 0 4.17** 1.98* 0 0 0 6.59** WT > CN; WT > CW Galactopinitolg, - NA 1.20* 4.38** 1.72* -1.62 0 2.27* 6.58** WT > CN; WT > CW; WT > nifH; CW > CN
Pentosec, - C00216 1.45** -3.23* -3.1* -3.37* -3.26* 0.89 6.46** CW > nifH; CW > WT; CN > nifH; CN > WT; WT > nifH
Pinoresinol glucosidef, + NA 0.90 -1.53* 0 -3.32** 0 1.12* 6.31** CW > CN; CW > nifH; CW > WT Succinylornithineg, + C03415 -1.74 -4.48** -4.13* -1.78* -1.58 0.31 6.17** CN > WT; CW > nifH; CW > WT
S-adenosyl methioninea, c,
d, e, + C00019
1.40* -0.24 -3.51* -5.62** -5.28* -0.37 5.97** CN > nifH; CN > WT; CW > nifH; CW > WT; WT > nifH
Nicotinamideh, + NA 1.27 -1.47* 0 -3.26** 0 0.18 5.72** CW > nifH; CW > WT Hydrolyzable tanning, + NA 0 -2.8** -2.57* -4.59** -4.18* -0.52 5.71** CN > nifH; CN > WT; CW > nifH; CW > WT
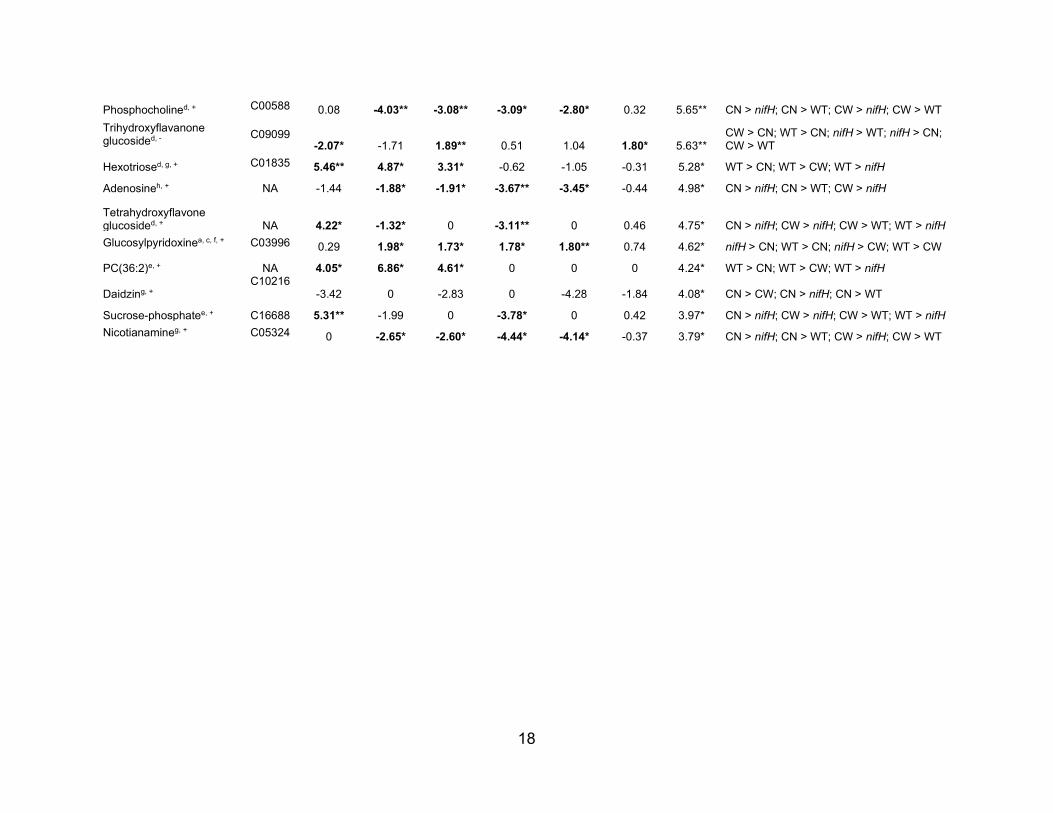
18
Phosphocholined, + C00588 0.08 -4.03** -3.08** -3.09* -2.80* 0.32 5.65** CN > nifH; CN > WT; CW > nifH; CW > WT Trihydroxyflavanone glucosided, - C09099
-2.07* -1.71 1.89** 0.51 1.04 1.80* 5.63** CW > CN; WT > CN; nifH > WT; nifH > CN; CW > WT
Hexotriosed, g, + C01835 5.46** 4.87* 3.31* -0.62 -1.05 -0.31 5.28* WT > CN; WT > CW; WT > nifH
Adenosineh, + NA -1.44 -1.88* -1.91* -3.67** -3.45* -0.44 4.98* CN > nifH; CN > WT; CW > nifH
Tetrahydroxyflavone glucosided, + NA 4.22* -1.32* 0 -3.11** 0 0.46 4.75* CN > nifH; CW > nifH; CW > WT; WT > nifH Glucosylpyridoxinea, c, f, + C03996 0.29 1.98* 1.73* 1.78* 1.80** 0.74 4.62* nifH > CN; WT > CN; nifH > CW; WT > CW
PC(36:2)e, + NA 4.05* 6.86* 4.61* 0 0 0 4.24* WT > CN; WT > CW; WT > nifH
Daidzing, + C10216
-3.42 0 -2.83 0 -4.28 -1.84 4.08* CN > CW; CN > nifH; CN > WT
Sucrose-phosphatee, + C16688 5.31** -1.99 0 -3.78* 0 0.42 3.97* CN > nifH; CW > nifH; CW > WT; WT > nifH Nicotianamineg, + C05324 0 -2.65* -2.60* -4.44* -4.14* -0.37 3.79* CN > nifH; CN > WT; CW > nifH; CW > WT

19
a Compounds assigned based on ultra-high mass accuracy of 21 T FT-ICR. b Compounds assigned based on in-house tandem MS of standards performed under
identical conditions. c Compounds assigned based on tandem MS databases comparisons
(http://metlin.scripps.edu and NIST/EPA/NIH Mass Spectral Library Version 2.2). d Compounds assigned in Stopka et al. 2017 e Compounds assigned in Veličković et al. 2018 f Compounds assigned in Stopka et al. 2019 g Compounds from Laith et al. 2020 accepted + Positive Ion Mode - Negative Ion Mode
*P < 0.05 and **P < 0.005

1
Metabolomic profiling of wild-type and mutant soybean root nodules using laser-ablation electrospray ionization mass spectrometry reveals altered metabolism
Beverly J. Agtuca1, Sylwia A. Stopka2, Sterling Evans1, Laith Samarah2, Yang Liu3, Dong Xu3,
Minviluz G. Stacey1, David W. Koppenaal4, Ljiljana Paša-Tolić4, Christopher R. Anderton4,
Akos Vertes2 and Gary Stacey1,*
1 Divisions of Plant Sciences and Biochemistry, Christopher S. Bond Life Sciences Center,
University of Missouri, Columbia, MO 65211, USA
2 Department of Chemistry, The George Washington University, Washington, DC 20052, USA
3 Department of Electrical Engineering and Computer Science, Informatics Institute and
Christopher S. Bond Life Sciences Center, University of Missouri-Columbia, MO 65211, USA
4 Environmental Molecular Sciences Laboratory, Earth and Biological Sciences Directorate,
Pacific Northwest National Laboratory, 902 Battelle Boulevard, Richland, Washington 99354,
USA
*Author for correspondence:
Tel: +01 5738844752; E-mail: [email protected]
Dr. Gary Stacey
Curators’ Distinguished Professor
Divisions of Plant Sciences and Biochemistry
271E Christopher S. Bond Life Sciences Center
University of Missouri, Columbia, MO 65211
Running Title (46/50 characters): LAESI-MS of wild-type and mutant soybean root nodules
2
SUPPORTING INFORMATION: Experimental Procedures
Methods S1. Bacterial growth conditions.
Bradyrhizobium japonicum USDA110 wild-type strain (WT) was from our (Stacey)
laboratory collection, whereas the B. japonicum fix-mutant H1 (nifH) strain, derived from
USDA110, was generously provided by Dr. Hans-Martin Fischer (Hahn et al., 1984). Bacterial
cells were grown for 2 d at 30°C in HM medium (Cole and Elkan, 1973) (HEPES, 1.3 g L-1; MES,
1.1 g L-1; Na2HPO4, 0.125 g L-1; Na2SO4, 0.25 g L-1; NH4Cl, 0.32 g L-1; MgSO4•7H2O, 0.18 g L-1;
FeCl3, 0.004 g L-1; CaCl2•2H2O, 0.013 g L-1; yeast extract, 0.25 g L-1; D-Ara, 1 g L-1; sodium
gluconate, 1 g L-1; and pH 6.6). The medium for the WT was supplemented with 25 mg L-1 of
tetracycline and 100 mg L-1 of spectinomycin, while that for the growth of the nifH mutant was
supplemented with 100 mg L-1 of spectinomycin and kanamycin. The bacterial culture reached
OD600=0.8 (108 cells ml-1). Then, the culture was centrifuged at 3,000 rpm for 10 min, washed 3x
with sterile water. This culture solution was then used as seedling inoculation.
Methods S2. Nodules that were infected by mix-inoculums
Three-week-old nodules, co-inoculated with B. japonicum WT that expressed green
fluorescent protein and nifH mutant at ratios of 3:7 and 1:19 (Regus et al., 2017), were sectioned
at 100 μm using a Vibratome 3000 Plus and imaged by a stereomicroscope (M205 FA, Leica,
Illinois, U.S.). The phenotype of nodules from different inoculum ratios was analyzed to distinguish
the white and red sectors, as well as the GFP expression from the fix+ rhizobia. The 3:7 ratio
nodules showed the best sector resolution and, hence, were used for analysis. These nodules
and their attached roots were harvested, frozen in liquid nitrogen, and stored at -80°C until LAESI-
MS analysis. The nodules were cryosectioned at 60 µm thickness and were imaged by a Canon
EOS REBEL T6 DSLR to indicate the directionality of the sectors. Next, the thaw-mounted
samples were imaged by an upright microscope (IX71, Olympus, Tokyo, Japan) before and after
LAESI-MS analysis to determine where the ablated sample areas were relative to the individual
sectors.
Methods S3. Instrumentation for LAESI-MS.
The LAESI-MS instrumentation was similar to our previous work (Stopka et al., 2017). A
homebuilt LAESI ion source was retrofitted on the front of a quadrupole time-of-flight mass
spectrometer equipped with traveling wave ion mobility separation (Synapt G2S, Waters, Milford,
MA). The laser component consisted of an optical parametric oscillator driven Nd:YAG laser (IR
3
Opolette HE 2731, Opotek, Carlsbad, CA) that produced 7 ns laser pulses at 2.94 μm with the
repetition rate in the 1-20 Hz range. The laser beam was steered through a 30 mm cage system
and a 75 mm focal length plano-convex ZnSe lens (Infrared Optical Products, Farmingdale, NY)
with its focal spot on the sample. A homebuilt Peltier stage was constructed and implemented in
the analysis to maintain a temperature of 0°C to reduce sample drying. Following the ablation, a
plume of neutrals is formed and expands into an electrospray oriented perpendicular to the
expansion direction and on axis with the MS orifice. Both positive and negative ion modes were
utilized, with emitter (MT320-50-5-5, New Objective, Woburn, MA) voltages and ESI solution
compositions of +3.3 kV and 1:1 (v/v) MeOH:H2O with 0.1% acetic acid for positive ion mode, and
-2.7 kV with 2:1 (v/v) mixture of MeOH:CHCl3 for negative ion mode. The IMS parameters were
set to 90 mL/min flow rate and 3.35 bar pressure for the nitrogen drift gas, 1.41 V for the delay
coefficient, and 40 V for the height and 650 m/s for the velocity of the traveling wave.
Methods S4. Data and pathway analysis.
All root segments, nodules, and free-living rhizobia had a minimum of six biological
replicates for LAESI-MS analysis. The data analysis for univariate, multivariate, and hierarchical
clustering statistical approaches were done using MetaboAnalyst 4.0, as previously described in
the supporting information of Stopka et al. (2017). The data was normalized (summing the
spectral intensities for each sample and then the Pareto scaling was done by using the square
root of standard deviation as the scaling factor.
Metabolite pathway enrichment was conducted using MetaboAnalyst 4.0 at
http://www.metaboanalyst.ca. We downloaded 133 soybean pathways from KEGG as our
metabolite set library and the metabolite sets that contained at least two compounds. KEGG
compound names were converted to HMDB compound names by mapping HMDB IDs.
Methods S5. Sample preparation for tandem electrospray ionization mass spectrometry (ESI-MS/MS).
Approximately 0.25 g of either WT, nifH, or sacpd-c soybean root nodules stored at -80°C
were gently plucked with sterile forceps and transferred to a pre-chilled mortar. The nodules were
ground with a pestle in liquid nitrogen until a fine powder was obtained. For identification of
metabolites in positive ion mode, 2 mL of 1:1 (v/v) methanol:water with 0.1 % acetic acid solution
were added to the mortar. The mixture was homogenized and then transferred to a 2 mL
Eppendorf tube. For negative ion mode, the powdered tissue was homogenized in 2:1 (v/v)
4
chloroform:methanol. The tubes were centrifuged at 5000×g for 5 min at 4°C and the supernatant
was transferred to new 2 mL Eppendorf tubes and stored at -80˚C for analysis by ESI-MS/MS.
Methods S6. Tandem electrospray ionization mass spectrometry (ESI-MS/MS).
The prepared lysate was transferred from Eppendorf tubes stored at -80˚C to a 500 μL
Hamilton syringe. The syringe was secured on a syringe pump and connected to a stainless
steel emitter (MT320-50-5-5, New Objective, Woburn, MA) through a fused silica tube. The flow
rate was set at 500 nL/min and the solution was sprayed by applying a voltage to the emitter at
+ 3300 V for positive ion mode and -2200 V for negative ion mode. The generated ions were
introduced into a Q-ToF mass spectrometer (Synapt G2S, Waters, Milford, MA) and the ions of
interest from the spectra obtained previously by LAESI-MS were selected for tandem MS by
collision induced dissociation (CID). Collision energies were ramped from 50 eV.
Methods S7. Metabolite identification.
The Metabolite Standard Initiative (MSI) level of metabolite identification was adopted for
peak assignments. Three different properties were used for peak assignments: (i) accurate mass,
(ii) tandem MS comparisons with one of three databases, http://metlin.scripps.edu,
NIST/EPA/NIH Mass Spectral Library Version 2.2, or our in-house collection of tandem mass
spectra of standards measured under identical conditions, and (iii) CCS comparisons with either
a database (Paglia et al., 2014) or an in-house CCS library acquired by LAESI-IMS-MS.
The in house LAESI-IMS-MS library is based on our CCS and tandem MS measurements
for a collection of 618 small metabolites (Mass Spectrometry Metabolite Library of Standards,
MSMLS, IROA Technologies, Bolton, MA) described at
https://www.sigmaaldrich.com/content/dam/sigma-aldrich/docs/Sigma/Datasheet/10/msmlsdat.pdf.


![Proteomic and Metabolomic Characterization of Human ...diseasebiophysics.seas.harvard.edu/wp-content/... · metabolomic[9,10] analysis of the individual compartments of a microfluidic](https://img.pdfslide.net/doc/110x75/6034f7cd36b07b58d426adf3/proteomic-and-metabolomic-characterization-of-human-metabolomic910-analysis.jpg)


![Systems Metabolomic Lecture[1]](https://img.pdfslide.net/doc/110x75/546af5e0b4af9f486b8b45b1/systems-metabolomic-lecture1.jpg)


