Embed Size (px)
Citation preview
MetaCom Sample Data and Tutorial Table of Contents
I. Recommended Additional Programs
A. Notepad ++
B. SQLite Manager Add-on for Firefox
II. Sample Input Data Formats
A. FNA output (from 454 Pyrosequencing)
B. FASTA file
C. TXT file with FASTA formatted sequences
D. MetaCom generated SQLite database file
III. BLAST File Size Comparison
IV. Project Settings
V. BLAST Analysis
A. BLAST Rules
VI Output SQLite File Table Explanation
I. Recommended Additional Programs
I highly recommend the installation of two additional programs when working with MetaCom. The
first is Notepad ++ (http://notepad-plus-plus.org/). This is a more advanced version of the standard
Notepad program that comes with most Windows installations, and is a versatile and low-memory usage
text editor. It is particularly useful for loading and searching very large text documents, such as output
FNA files (which can exceed 40 MB of text data). Many other text editors tend to be slow or hang
completely when opening or searching these large documents.
The second piece of software is the SQLite Manager Add-on for the Firefox web browser
(https://addons.mozilla.org/en-us/firefox/addon/SQLite-manager/ and http://www.mozilla.org/en-
US/firefox/new/). This is a very simple and easy to use SQLite viewer and editor, which can also be
installed on the portable version of Firefox (http://download.cnet.com/Mozilla-Firefox-Portable/3000-
2356_4-10437430.html) which can be installed on thumb drives to allow access to database files with
any computer. After installation, this add-on can be accessed by clicking on the main Firefox menu,
selecting “Web Developer”, and clicking “SQLite Manager”. This add-on also does not interfere with the
operation of MetaCom in most cases, as it doesn’t update its display live, so you can access the database
file you are writing to and occasionally click the “Refresh” button to obverse the analysis while it is in
progress.
II. Sample Input Data Formats
Included in the “MetaCom Sample Datasets.zip” file are four example input formats that MetaCom
recognizes.
The first is the “Sample_FNA.fna” file output that is generated by Roche 454 Pyrosequencing. This
file format should be viewable in most word processing programs (Word, Notepad, Notepad ++, etc.).It
is derived from the FASTA standard DNA sequence format, containing all the general features so that it
can be treated like a FASTA formatted file if needed. The header line starts with the standard “>” sign
and is then followed by the name of the sequence. The remaining pieces of information on the header
line are specific to the well on a 454 Pyrosequencing chip. Rank is a relative value indicating the signal
strength of that well’s output relative to the other wells, and the files are typically sorted by this value in
descending order. The x= and y= fields are the well location on the chip, and length is the length of the
read. As these additional values do not impact the actual analysis of data, they are not stored with
MetaCom, but the source input file is never altered, so they can still be found there, if desired.
The second file is the “Sample_FASTA.fasta” file. This is just a FASTA formatted .txt document with
the extension changed to .fasta. This file can be read with any text editor program.
The third file is the “Sample_TXT.txt” file. This file is a general text document that has the sequences
written in general FASTA format. For most other sequencing applications, this will likely be the style of
output you will see (or will have the option to output in a similar format).
The fourth file is the “Sample_DNASequencesOnly.sqlite” file. This is the first file made by MetaCom
when it reads in any of the aforementioned data files. This contains all of the data of the original files
converted into more easily accessible and processed format. To obtain a file that just contains the DNA
Sequences only (along with lookup tables linking the original sequence names, etc.), make a copy of the
.sqlite file after the reading in phase is done (you will see “Processing First Block…” in the status bar of
the program. You can also just drop the other BLAST tables from a partially analyzed file to obtain this
format. This is particularly useful as a starting point for multiple computer analyses as it contains all the
raw data that each computer can then process. These files can be rejoined later (see Post-Processing
Section below).
It is highly recommended to use a .sqlite sequences file when starting or resuming analyses, as there is
some moderate amount of time spent re-generating the simplified sequence list that this file contains
if one selects a .FNA or .FASTA file as the source. Using this source file then only requires that
processing and combining of identical sequences to occur once, when it is originally created from the
source files.
III. BLAST Result File Size Comparison
In addition to the four sample input data files, there are two files showing differences in BLAST
output saving, and the resulting file sizes.
The first file “SampleBLAST_Minimal Saving.sqlite” uses the standard blast settings, with 250 results
displayed, and does NOT save all the sequence results or any of the uncultured clone results. This is the
program’s default behavior to save disk space, as only the BLAST records that tie for the highest score
are saved with these settings (and these are the only ones needed to run the taxonomy analysis and
recommended hit functions).
The second file “SampleBLAST_SavingEverything.sqlite” has both “Save all BLAST results” and “Save
Uncultured Clone hits” selected, and again uses only 250 total results per sequence. This will include two
additional SQLite tables “AllTopHits” which will list all BLAST records that are not uncultured, but still
passed the minimum user defined levels of significance (up to the user defined number of results per
sequence) and “UnculturedHits” which will have the details for any BLAST hit that is categorized as
“Uncultured”.
The main difference between these two files is the output file size. The 8 sample sequences
generated ~38 kilobytes of data after BLAST analysis with the minimal saving method, but approximately
8 times more data (~319 kilobytes) when saving everything. This difference can become quite significant
as more sequence records are in the file to analyze. It should also be noted that these additional saved
tables will expand the file size even more rapidly when higher values are specified in the option for
results to return. This is due to the fact that nearly all sequences have less than 250 sequences that tie
for the highest BLAST score (the vast majority are under 20 tied matches), and thus all the remaining
sequences would only be saved to these two additional optional tables. File sizes of the database can
very quickly exceed 20 GB per file for even a few thousand input sequence records, which can cause file
instability on many operating systems, and will most likely prevent the file from being copied or moved
to new locations. If these additional outputs are desired, the multiple computer analysis method is
highly recommended to minimize the amount of data saved to each output file.
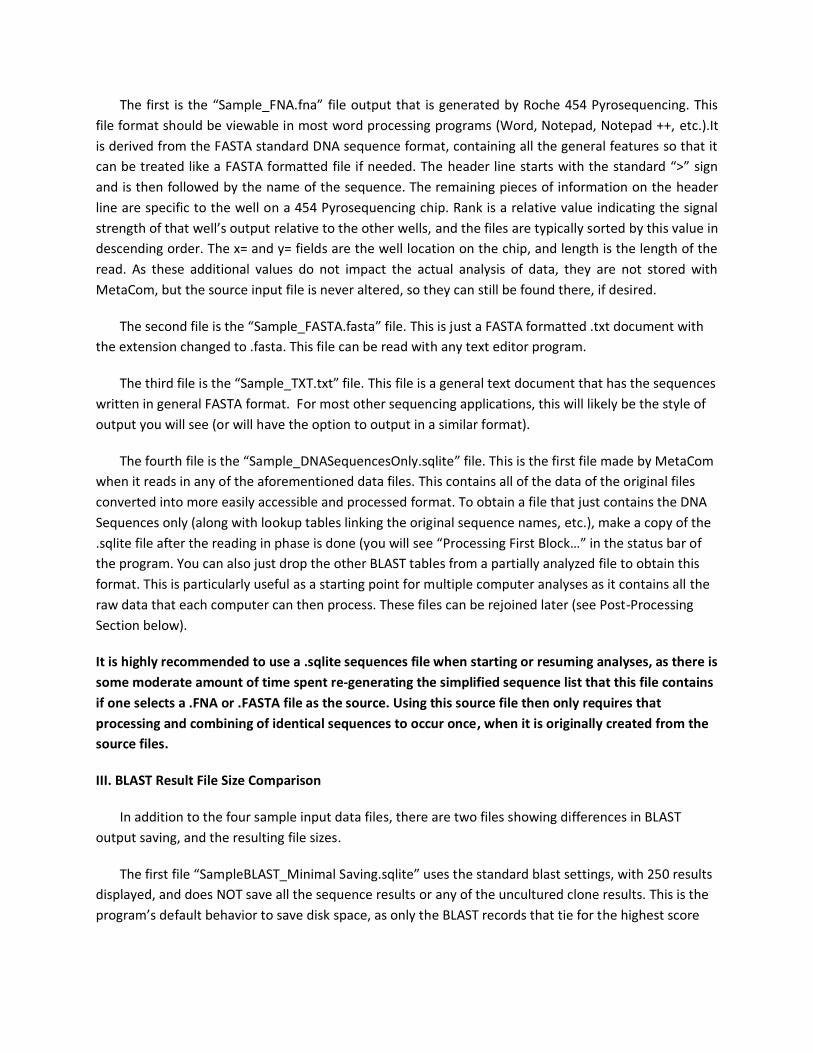
IV. Project Settings
The Project Name/Title setting allows you to control the name of all files that are generated by
MetaCom, and will aid in keeping result files organized. All output file names will start with this field’s
value and then “_Analysis.sqlite” or “_(specific table name).csv”. If a .sqlite file containing sequence
information is supplied as the source data, and this name is different from its name (without the
_Analysis part) , then the BLAST results and other analysis results will be saved to a different SQLite file,
and the source file will be unchanged. Note that in this case you may need to merge a copy of the
sequence source file with the results files before doing post-processing functions as the sequence data
tables would be absent.
The user’s email address field is necessary for (and REQUIRED by) the BLAST and NCBI databases. All
correspondence from these sites in respect to potential over-use and IP blocking will be directed to this
email. This email will not be used for any other purpose, and will only be saved to your local settings file,
not with any result output.
The Prefix for combined sequences allows you to set the new names for sequences that MetaCom
will save with. Each new sequence name will be <IDTag>### with the specified ID tag from this option,
followed by an incrementing number to distinguish sequences. Sequences are not numbered in any
particular order, other than their appearance in the .FASTA or .FNA file you select.
NOTE: Any sequences that contain EXACTLY identical sequences (including identical lengths of the
sequences) will be combined into one record with the new name. This will greatly decrease overall
processing time, and the number of records merged into one new name will be recorded with the data
as "Copies" to allow analysis based on the original number of input sequences from the .FASTA or .FNA
file.
NOTE 2: All original sequence names will be preserved in the table "OldNewNames" for ease of
reference.
The options for multiple computer analyses allow the user to spread the processing load between
multiple computers, and are used only for the BLAST analysis portion of the program. If the option to
use multiple computers is unchecked, these values are not used for anything. The first value is the
number of the computer in the set that identifies this computer. This computer will process the
sequences for that portion of the dataset only. Valid values are integers >= 1.The second value is the
total number of computers running this analysis on this file. Each computer will have 1/<this value>of
the dataset to analyze, with any remaining sequences from this division being processed by the last
computer in the set.
For example if the values were 3 and 6, this computer would process the sequences from 2/6 to 3/6 of
the way through the remaining ones to be done. (The first computer would run the sequences from 0/6
to 1/6 through the file, etc.).
V. BLAST Analysis Settings
It is important to note that since MetaCom conducts its BLAST analysis through the NCBI website
interface, it must obey the rules for scripting interaction with the BLAST database.
(http://blast.ncbi.nlm.nih.gov/Blast.cgi?CMD=Web&PAGE_TYPE=BlastDocs&DOC_TYPE=DeveloperInfo)
These guidelines are:
1.) Do not contact the server more often than once every three seconds.
2.) Do not poll for any single RID more often than once a minute.
3.) Use the URL parameter email, and tool, so that we can track your project and contact you if there
is a problem.
4.) Run scripts weekends or between 9 pm and 5 am Eastern Time weekday if more than 50
searches will be submitted.
MetaCom will automatically comply with guidelines 1-3, but compliance with guideline #4 is left to the
user. The options are available to push MetaCom beyond the limits described in these guidelines, but
doing so is at the user’s own risk. If your IP address is observed to send too many requests in too short
of a time period, BLAST will block your IP from sending additional sequences, and accessing the BLAST
website from your computer will display the lockout screen.
Refer to the tooltips in MetaCom (by hovering over the icons for further
description of program options. In particular, pay attention to the warnings, as
these are critical settings in terms of results generation sand output file sizes.
VI. Output SQLite File Table Explanations
This section will walk you through each of the output tables in the “Sample_AllAnalyses.sqlite” file.
The tables are listed here in alphabetical order, with tables in first half, then views in the second half,
the same order these would be found in using the SQLite Manager Add-on. The column names and
values will also be the same as the Excel file .csv (comma separated variable) files that are generated by
the ‘Export All Tables To Excel” button.
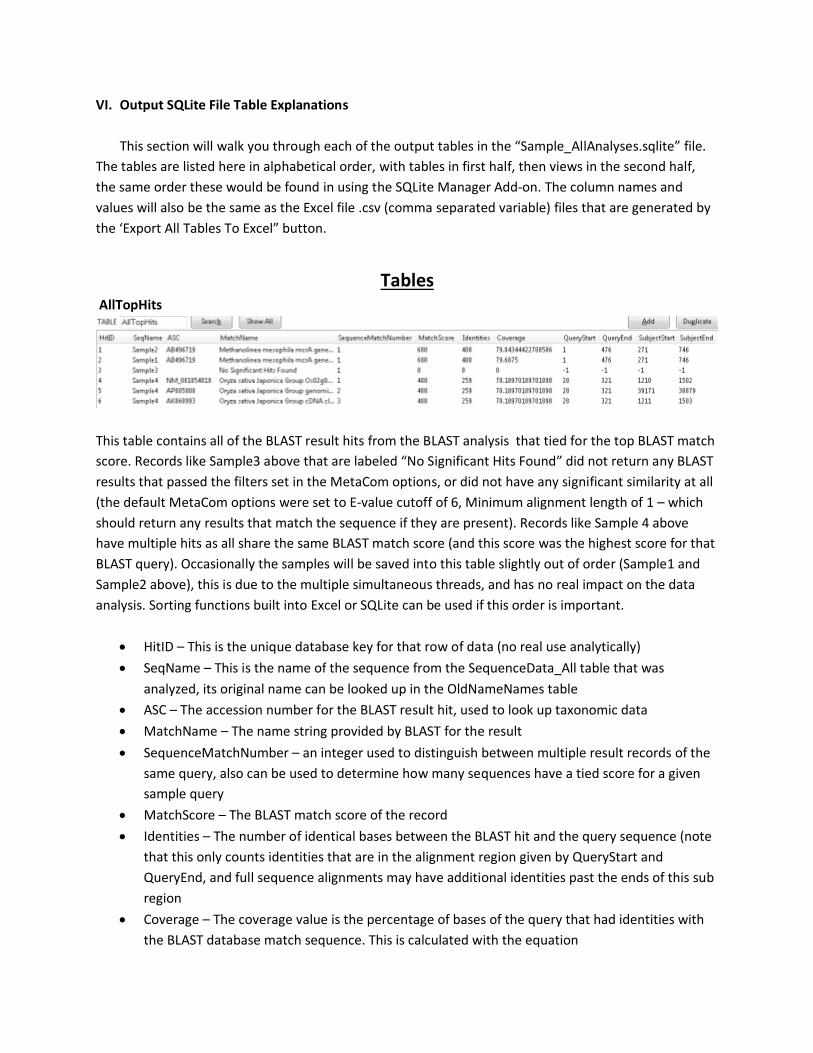
Tables AllTopHits
This table contains all of the BLAST result hits from the BLAST analysis that tied for the top BLAST match
score. Records like Sample3 above that are labeled “No Significant Hits Found” did not return any BLAST
results that passed the filters set in the MetaCom options, or did not have any significant similarity at all
(the default MetaCom options were set to E-value cutoff of 6, Minimum alignment length of 1 – which
should return any results that match the sequence if they are present). Records like Sample 4 above
have multiple hits as all share the same BLAST match score (and this score was the highest score for that
BLAST query). Occasionally the samples will be saved into this table slightly out of order (Sample1 and
Sample2 above), this is due to the multiple simultaneous threads, and has no real impact on the data
analysis. Sorting functions built into Excel or SQLite can be used if this order is important.
• HitID – This is the unique database key for that row of data (no real use analytically)
• SeqName – This is the name of the sequence from the SequenceData_All table that was
analyzed, its original name can be looked up in the OldNameNames table
• ASC – The accession number for the BLAST result hit, used to look up taxonomic data
• MatchName – The name string provided by BLAST for the result
• SequenceMatchNumber – an integer used to distinguish between multiple result records of the
same query, also can be used to determine how many sequences have a tied score for a given
sample query
• MatchScore – The BLAST match score of the record
• Identities – The number of identical bases between the BLAST hit and the query sequence (note
that this only counts identities that are in the alignment region given by QueryStart and
QueryEnd, and full sequence alignments may have additional identities past the ends of this sub
region
• Coverage – The coverage value is the percentage of bases of the query that had identities with
the BLAST database match sequence. This is calculated with the equation
(Identities/Query_Sequence_Length) *100. Note that the query sequence length used is for the
originally supplied query sequence, and not just for the region that aligned to the BLAST hit,
making this a good measure of how much of the entire sequence matched the hit.
• QueryStart – The bp location on the query sequence that the alignment started at for the BLAST
hit
• QueryEnd – The bp location on the query sequence that the alignment stopped at for the BLAST
hit
• SubjectStart – The bp location on the BLAST database sequence that the alignment with your
query sequence started at
• SubjectEnd – The bp location on the BLAST database sequence that the alignment with your
query sequence stopped at
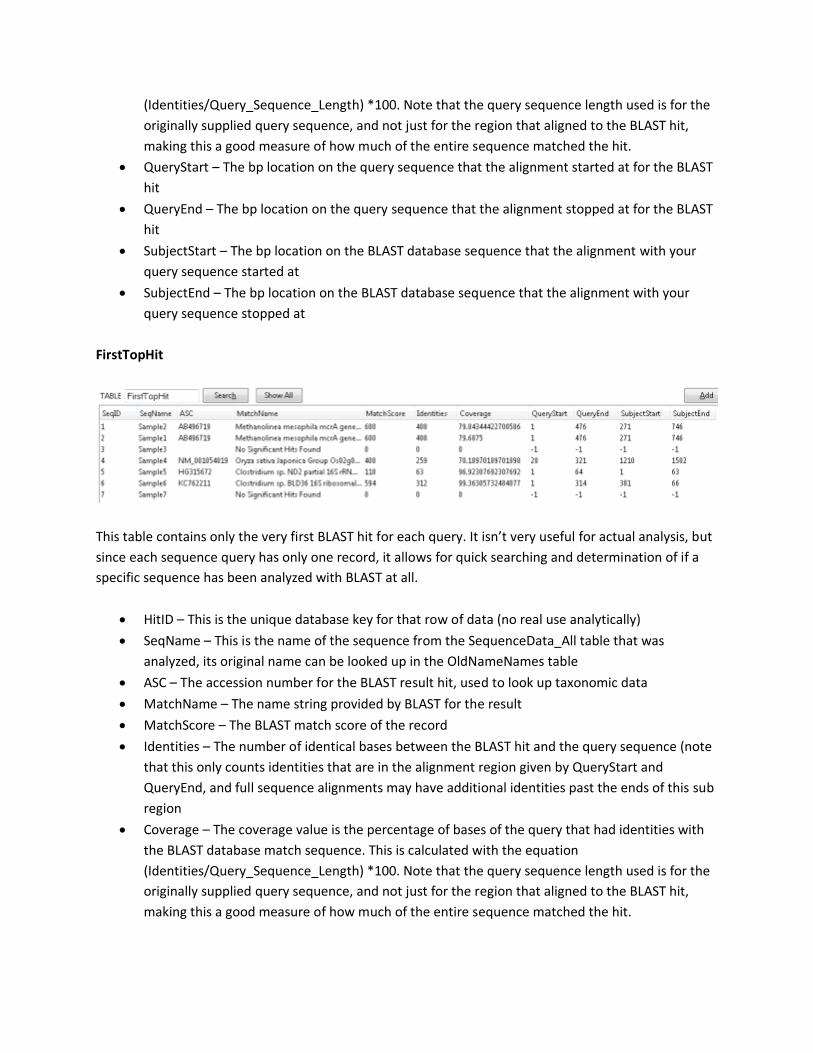
FirstTopHit
This table contains only the very first BLAST hit for each query. It isn’t very useful for actual analysis, but
since each sequence query has only one record, it allows for quick searching and determination of if a
specific sequence has been analyzed with BLAST at all.
• HitID – This is the unique database key for that row of data (no real use analytically)
• SeqName – This is the name of the sequence from the SequenceData_All table that was
analyzed, its original name can be looked up in the OldNameNames table
• ASC – The accession number for the BLAST result hit, used to look up taxonomic data
• MatchName – The name string provided by BLAST for the result
• MatchScore – The BLAST match score of the record
• Identities – The number of identical bases between the BLAST hit and the query sequence (note
that this only counts identities that are in the alignment region given by QueryStart and
QueryEnd, and full sequence alignments may have additional identities past the ends of this sub
region
• Coverage – The coverage value is the percentage of bases of the query that had identities with
the BLAST database match sequence. This is calculated with the equation
(Identities/Query_Sequence_Length) *100. Note that the query sequence length used is for the
originally supplied query sequence, and not just for the region that aligned to the BLAST hit,
making this a good measure of how much of the entire sequence matched the hit.
• QueryStart – The bp location on the query sequence that the alignment started at for the BLAST
hit
• QueryEnd – The bp location on the query sequence that the alignment stopped at for the BLAST
hit
• SubjectStart – The bp location on the BLAST database sequence that the alignment with your
query sequence started at
• SubjectEnd – The bp location on the BLAST database sequence that the alignment with your
query sequence stopped at
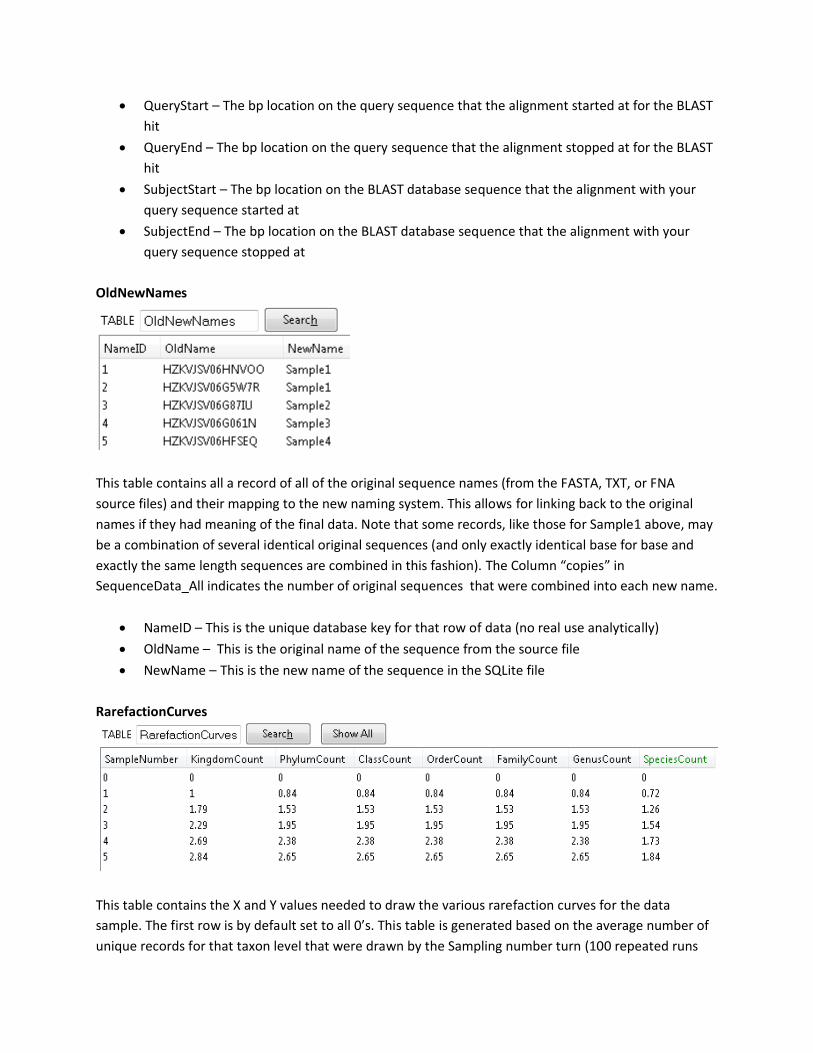
OldNewNames
This table contains all a record of all of the original sequence names (from the FASTA, TXT, or FNA
source files) and their mapping to the new naming system. This allows for linking back to the original
names if they had meaning of the final data. Note that some records, like those for Sample1 above, may
be a combination of several identical original sequences (and only exactly identical base for base and
exactly the same length sequences are combined in this fashion). The Column “copies” in
SequenceData_All indicates the number of original sequences that were combined into each new name.
• NameID – This is the unique database key for that row of data (no real use analytically)
• OldName – This is the original name of the sequence from the source file
• NewName – This is the new name of the sequence in the SQLite file
RarefactionCurves
This table contains the X and Y values needed to draw the various rarefaction curves for the data
sample. The first row is by default set to all 0’s. This table is generated based on the average number of
unique records for that taxon level that were drawn by the Sampling number turn (100 repeated runs
are used to calculate this average). Note that these values do count a blank record as a unique record,
but only for the very first blank record observed (so in cases where some species-level assignments were
impossible and the RecommendedHit table only assigns down to Genus with confidence, etc.) – this will
not have a large impact on the data results in larger datasets, but may be noticeable in very small
sample sets).
• SampleNumber – this is both the key vale for this table, and the number of random sampling
terms for that row of data. This will be the X value for the Rarefaction curves, and its range is the
range of total original sequences provided by the source file (each record from
RecommendedHits table is entered into the drawing pool multiple times equal to the number of
original sequences that were combined into the single new sequence query – see the “Copies”
field of SequenceData_All)
• Kingdom Count – Average number of unique kingdoms that were observed after SampleNumber
of samplings over 100 distinct drawings.
• Phylum Count – Average number of unique phylum that was observed after SampleNumber of
samplings over 100 distinct drawings.
• Class Count – Average number of unique classes that were observed after SampleNumber of
samplings over 100 distinct drawings.
• Order Count – Average number of unique orders that were observed after SampleNumber of
samplings over 100 distinct drawings.
• Family Count – Average number of unique families that were observed after SampleNumber of
samplings over 100 distinct drawings.
• Genus Count – Average number of unique genus that was observed after SampleNumber of
samplings over 100 distinct drawings.
• Species Count – Average number of unique species that were observed after SampleNumber of
samplings over 100 distinct drawings.
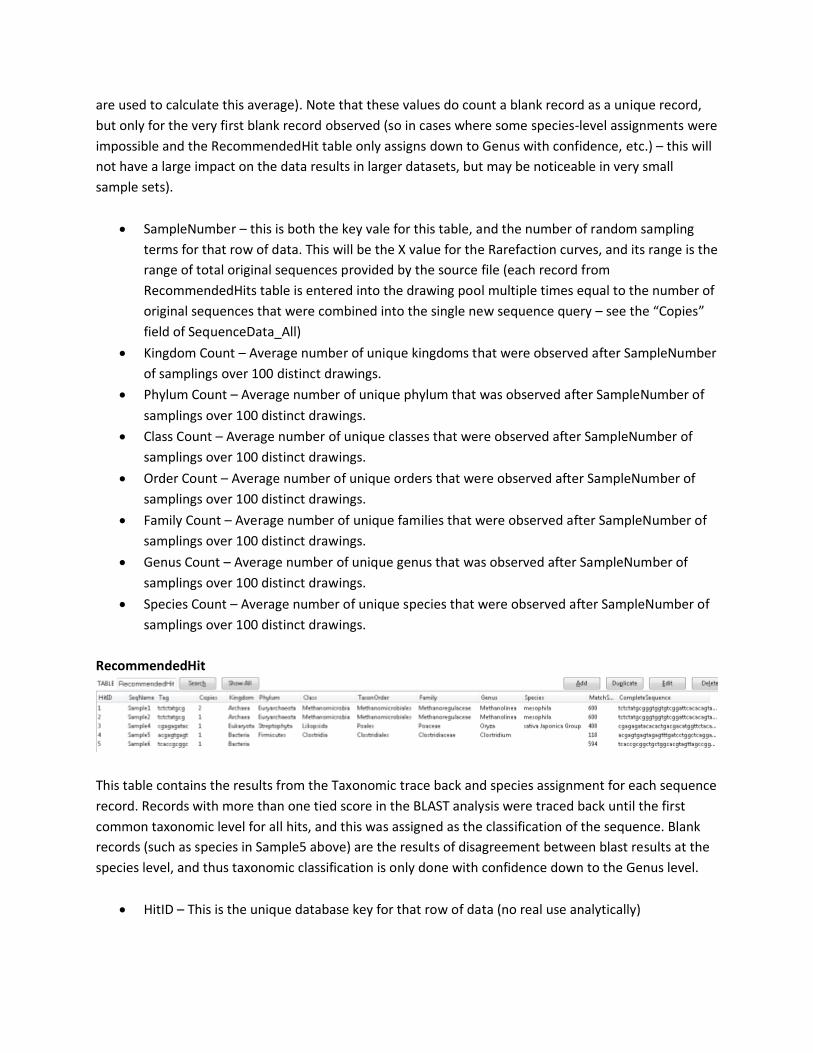
RecommendedHit
This table contains the results from the Taxonomic trace back and species assignment for each sequence
record. Records with more than one tied score in the BLAST analysis were traced back until the first
common taxonomic level for all hits, and this was assigned as the classification of the sequence. Blank
records (such as species in Sample5 above) are the results of disagreement between blast results at the
species level, and thus taxonomic classification is only done with confidence down to the Genus level.
• HitID – This is the unique database key for that row of data (no real use analytically)
• SeqName – This is the name of the sequence from the SequenceData_All table that was
analyzed, its original name can be looked up in the OldNameNames table
• Tag – The 10 bp tag from the front of the sequence read, corresponds to the MID of primers
designed for the 454 sequencing system, or is just the first 10 bp of sequence in the original file.
This is useful for grouping results from multiple experiments that were uniquely tagged.
• Copies – This indicates the number of exactly identical (in sequence and in length) original
sequences that were combined to make a single new sequence name
• Kingdom – The taxonomic classification at the Kingdom level shared by all BLAST results that
tied for the highest match score. This actually corresponds to the NCBI taxonomy rank level of
“super kingdom.” A blank entry indicates that not all BLAST records that tied for the highest
score agreed at this taxonomic level, and thus no assignment could be made with confidence.
• Phylum – The taxonomic classification at the Phylum level shared by all BLAST results that tied
for the highest match score. A blank entry indicates that not all BLAST records that tied for the
highest score agreed at this taxonomic level, and thus no assignment could be made with
confidence.
• Class – The taxonomic classification at the Class level shared by all BLAST results that tied for the
highest match score. A blank entry indicates that not all BLAST records that tied for the highest
score agreed at this taxonomic level, and thus no assignment could be made with confidence.
• TaxonOrder – The taxonomic classification at the Order level shared by all BLAST results that
tied for the highest match score. A blank entry indicates that not all BLAST records that tied for
the highest score agreed at this taxonomic level, and thus no assignment could be made with
confidence. Note that this is named “TaxonOrder” and not “Order” as the word “ORDER” is
actually an SQL command, and thus would cause errors if a column shared its name.
• Family –– The taxonomic classification at the Family level shared by all BLAST results that tied
for the highest match score. A blank entry indicates that not all BLAST records that tied for the
highest score agreed at this taxonomic level, and thus no assignment could be made with
confidence.
• Genus – The taxonomic classification at the Genus level shared by all BLAST results that tied for
the highest match score. A blank entry indicates that not all BLAST records that tied for the
highest score agreed at this taxonomic level, and thus no assignment could be made with
confidence.
• Species – The taxonomic classification at the Species level shared by all BLAST results that tied
for the highest match score. A blank entry indicates that not all BLAST records that tied for the
highest score agreed at this taxonomic level, and thus no assignment could be made with
confidence.
• Match Score – The BLAST result score for all tied matches for this sequence
• Complete Sequence – The full sequence of the query sequence for this data
SequenceData
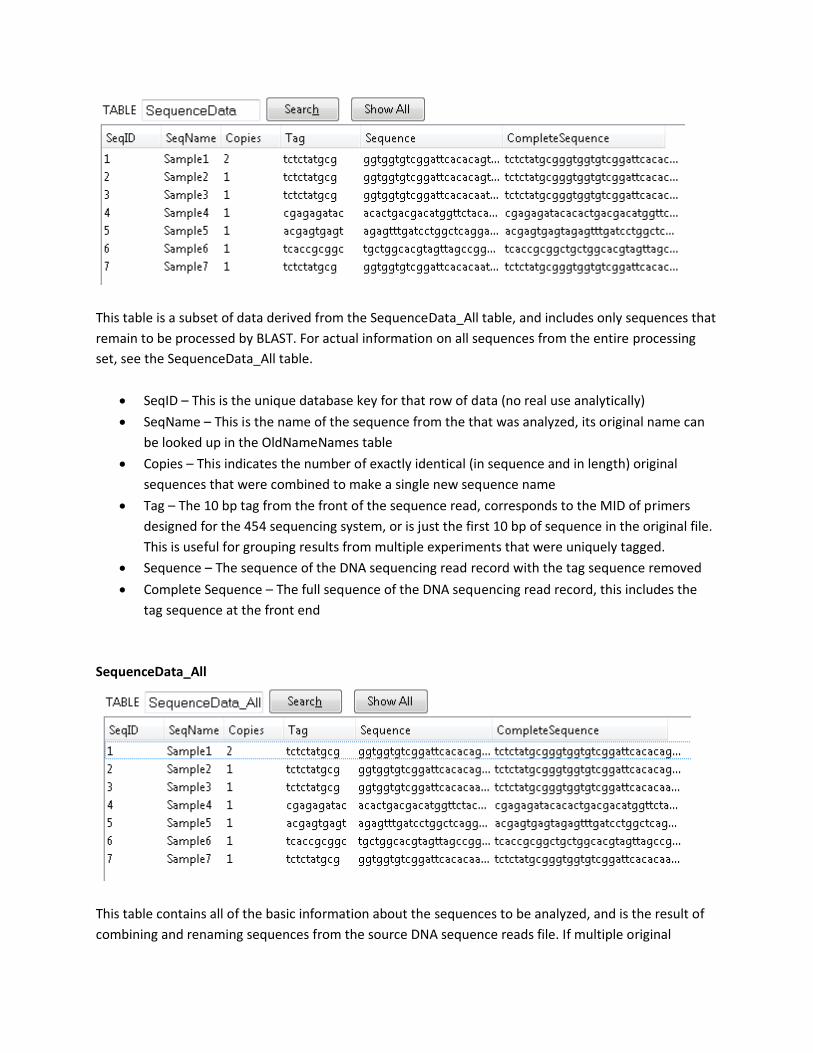
This table is a subset of data derived from the SequenceData_All table, and includes only sequences that
remain to be processed by BLAST. For actual information on all sequences from the entire processing
set, see the SequenceData_All table.
• SeqID – This is the unique database key for that row of data (no real use analytically)
• SeqName – This is the name of the sequence from the that was analyzed, its original name can
be looked up in the OldNameNames table
• Copies – This indicates the number of exactly identical (in sequence and in length) original
sequences that were combined to make a single new sequence name
• Tag – The 10 bp tag from the front of the sequence read, corresponds to the MID of primers
designed for the 454 sequencing system, or is just the first 10 bp of sequence in the original file.
This is useful for grouping results from multiple experiments that were uniquely tagged.
• Sequence – The sequence of the DNA sequencing read record with the tag sequence removed
• Complete Sequence – The full sequence of the DNA sequencing read record, this includes the
tag sequence at the front end
SequenceData_All
This table contains all of the basic information about the sequences to be analyzed, and is the result of
combining and renaming sequences from the source DNA sequence reads file. If multiple original
records existed, that contained exactly the same sequence base for base and were the exact same
length, then they were combined into a single record on this table, and the column “copies” indicates
how many identical sequence each record represents. This table contains ALL sequence records for the
analysis and should not be manually changed. The SequenceData table is a subset of data derived from
this table, which includes only sequences that remain to be processed by BLAST.
• SeqID – This is the unique database key for that row of data (no real use analytically)
• SeqName – This is the name of the sequence from the that was analyzed, its original name can
be looked up in the OldNameNames table
• Copies – This indicates the number of exactly identical (in sequence and in length) original
sequences that were combined to make a single new sequence name
• Tag – The 10 bp tag from the front of the sequence read, corresponds to the MID of primers
designed for the 454 sequencing system, or is just the first 10 bp of sequence in the original file.
This is useful for grouping results from multiple experiments that were uniquely tagged.
• Sequence – The sequence of the DNA sequencing read record with the tag sequence removed
• Complete Sequence – The full sequence of the DNA sequencing read record, this includes the
tag sequence at the front end
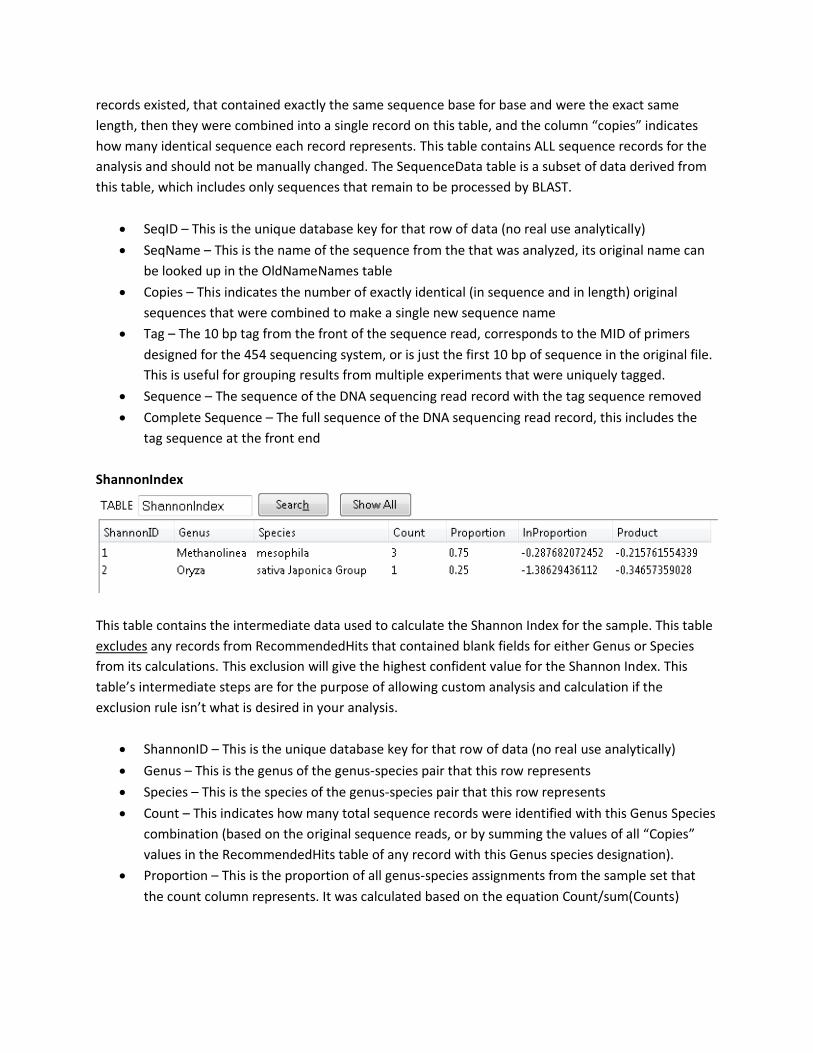
ShannonIndex
This table contains the intermediate data used to calculate the Shannon Index for the sample. This table
excludes any records from RecommendedHits that contained blank fields for either Genus or Species
from its calculations. This exclusion will give the highest confident value for the Shannon Index. This
table’s intermediate steps are for the purpose of allowing custom analysis and calculation if the
exclusion rule isn’t what is desired in your analysis.
• ShannonID – This is the unique database key for that row of data (no real use analytically)
• Genus – This is the genus of the genus-species pair that this row represents
• Species – This is the species of the genus-species pair that this row represents
• Count – This indicates how many total sequence records were identified with this Genus Species
combination (based on the original sequence reads, or by summing the values of all “Copies”
values in the RecommendedHits table of any record with this Genus species designation).
• Proportion – This is the proportion of all genus-species assignments from the sample set that
the count column represents. It was calculated based on the equation Count/sum(Counts)
• lnProportion – This is the natural log of the proportion column value (Note that in SQL language
the natural log function is called with “log(value)”, and the log base 10 function is
“log10(value)”).
• Product – This is the multiplication product of the Proportion and lnProportion Rows. The
Shannon index is the sum of this column multiplied by -1 (to correct the sign).
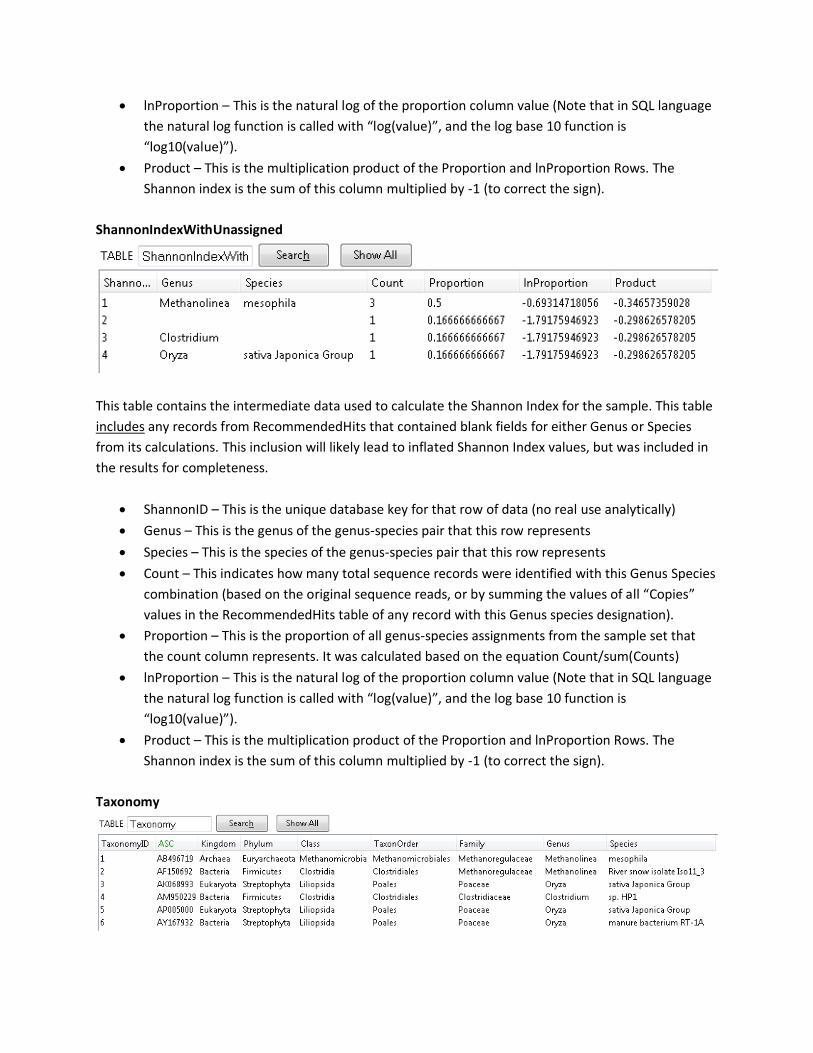
ShannonIndexWithUnassigned
This table contains the intermediate data used to calculate the Shannon Index for the sample. This table
includes any records from RecommendedHits that contained blank fields for either Genus or Species
from its calculations. This inclusion will likely lead to inflated Shannon Index values, but was included in
the results for completeness.
• ShannonID – This is the unique database key for that row of data (no real use analytically)
• Genus – This is the genus of the genus-species pair that this row represents
• Species – This is the species of the genus-species pair that this row represents
• Count – This indicates how many total sequence records were identified with this Genus Species
combination (based on the original sequence reads, or by summing the values of all “Copies”
values in the RecommendedHits table of any record with this Genus species designation).
• Proportion – This is the proportion of all genus-species assignments from the sample set that
the count column represents. It was calculated based on the equation Count/sum(Counts)
• lnProportion – This is the natural log of the proportion column value (Note that in SQL language
the natural log function is called with “log(value)”, and the log base 10 function is
“log10(value)”).
• Product – This is the multiplication product of the Proportion and lnProportion Rows. The
Shannon index is the sum of this column multiplied by -1 (to correct the sign).
Taxonomy
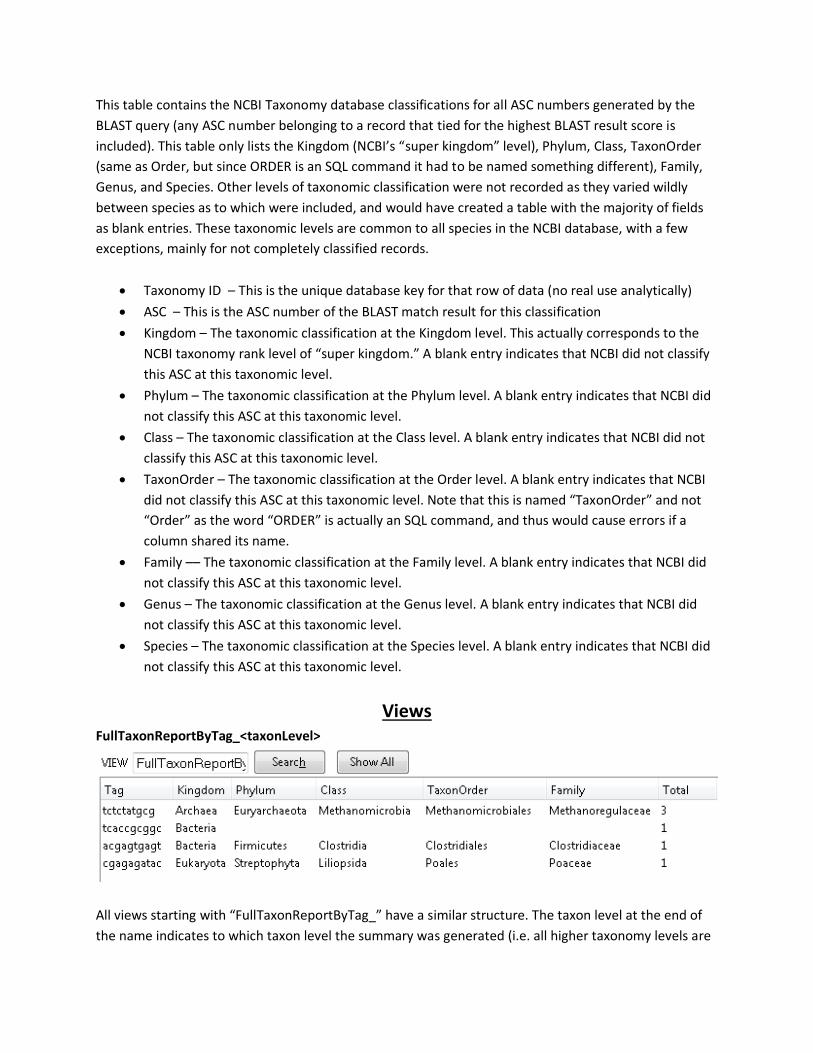
This table contains the NCBI Taxonomy database classifications for all ASC numbers generated by the
BLAST query (any ASC number belonging to a record that tied for the highest BLAST result score is
included). This table only lists the Kingdom (NCBI’s “super kingdom” level), Phylum, Class, TaxonOrder
(same as Order, but since ORDER is an SQL command it had to be named something different), Family,
Genus, and Species. Other levels of taxonomic classification were not recorded as they varied wildly
between species as to which were included, and would have created a table with the majority of fields
as blank entries. These taxonomic levels are common to all species in the NCBI database, with a few
exceptions, mainly for not completely classified records.
• Taxonomy ID – This is the unique database key for that row of data (no real use analytically)
• ASC – This is the ASC number of the BLAST match result for this classification
• Kingdom – The taxonomic classification at the Kingdom level. This actually corresponds to the
NCBI taxonomy rank level of “super kingdom.” A blank entry indicates that NCBI did not classify
this ASC at this taxonomic level.
• Phylum – The taxonomic classification at the Phylum level. A blank entry indicates that NCBI did
not classify this ASC at this taxonomic level.
• Class – The taxonomic classification at the Class level. A blank entry indicates that NCBI did not
classify this ASC at this taxonomic level.
• TaxonOrder – The taxonomic classification at the Order level. A blank entry indicates that NCBI
did not classify this ASC at this taxonomic level. Note that this is named “TaxonOrder” and not
“Order” as the word “ORDER” is actually an SQL command, and thus would cause errors if a
column shared its name.
• Family –– The taxonomic classification at the Family level. A blank entry indicates that NCBI did
not classify this ASC at this taxonomic level.
• Genus – The taxonomic classification at the Genus level. A blank entry indicates that NCBI did
not classify this ASC at this taxonomic level.
• Species – The taxonomic classification at the Species level. A blank entry indicates that NCBI did
not classify this ASC at this taxonomic level.
Views
FullTaxonReportByTag_<taxonLevel>
All views starting with “FullTaxonReportByTag_” have a similar structure. The taxon level at the end of
the name indicates to which taxon level the summary was generated (i.e. all higher taxonomy levels are
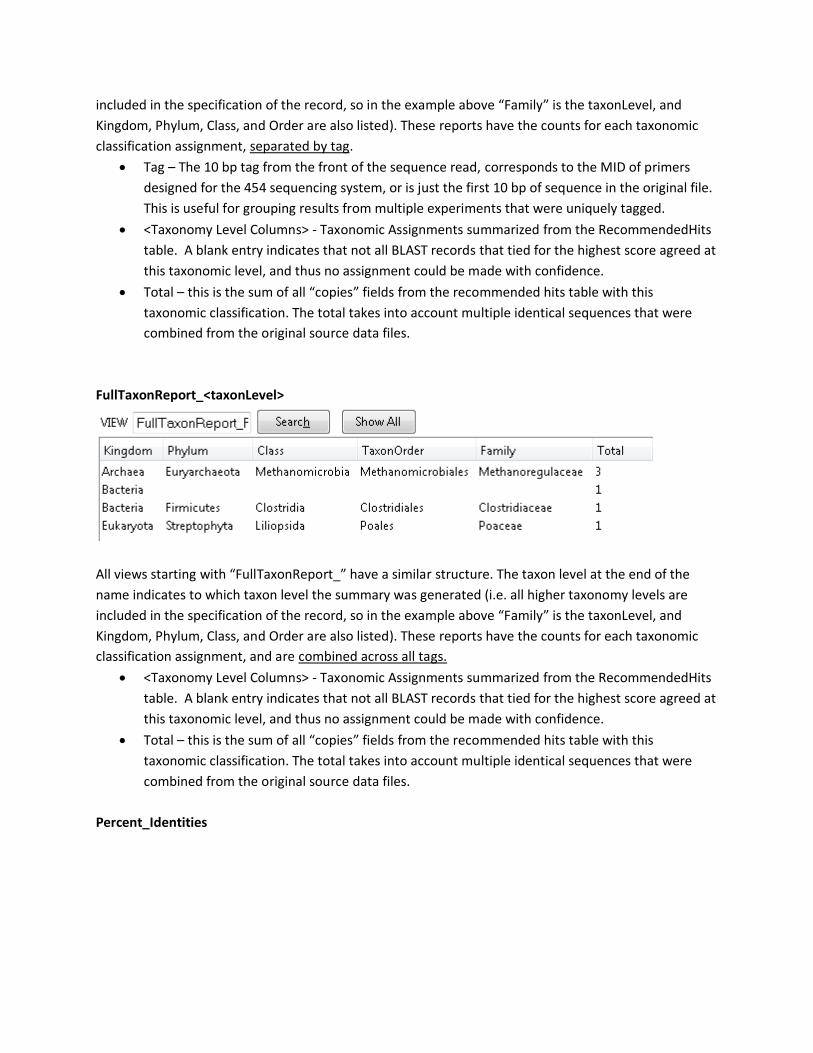
included in the specification of the record, so in the example above “Family” is the taxonLevel, and
Kingdom, Phylum, Class, and Order are also listed). These reports have the counts for each taxonomic
classification assignment, separated by tag.
• Tag – The 10 bp tag from the front of the sequence read, corresponds to the MID of primers
designed for the 454 sequencing system, or is just the first 10 bp of sequence in the original file.
This is useful for grouping results from multiple experiments that were uniquely tagged.
• <Taxonomy Level Columns> - Taxonomic Assignments summarized from the RecommendedHits
table. A blank entry indicates that not all BLAST records that tied for the highest score agreed at
this taxonomic level, and thus no assignment could be made with confidence.
• Total – this is the sum of all “copies” fields from the recommended hits table with this
taxonomic classification. The total takes into account multiple identical sequences that were
combined from the original source data files.
FullTaxonReport_<taxonLevel>
All views starting with “FullTaxonReport_” have a similar structure. The taxon level at the end of the
name indicates to which taxon level the summary was generated (i.e. all higher taxonomy levels are
included in the specification of the record, so in the example above “Family” is the taxonLevel, and
Kingdom, Phylum, Class, and Order are also listed). These reports have the counts for each taxonomic
classification assignment, and are combined across all tags.
• <Taxonomy Level Columns> - Taxonomic Assignments summarized from the RecommendedHits
table. A blank entry indicates that not all BLAST records that tied for the highest score agreed at
this taxonomic level, and thus no assignment could be made with confidence.
• Total – this is the sum of all “copies” fields from the recommended hits table with this
taxonomic classification. The total takes into account multiple identical sequences that were
combined from the original source data files.
Percent_Identities
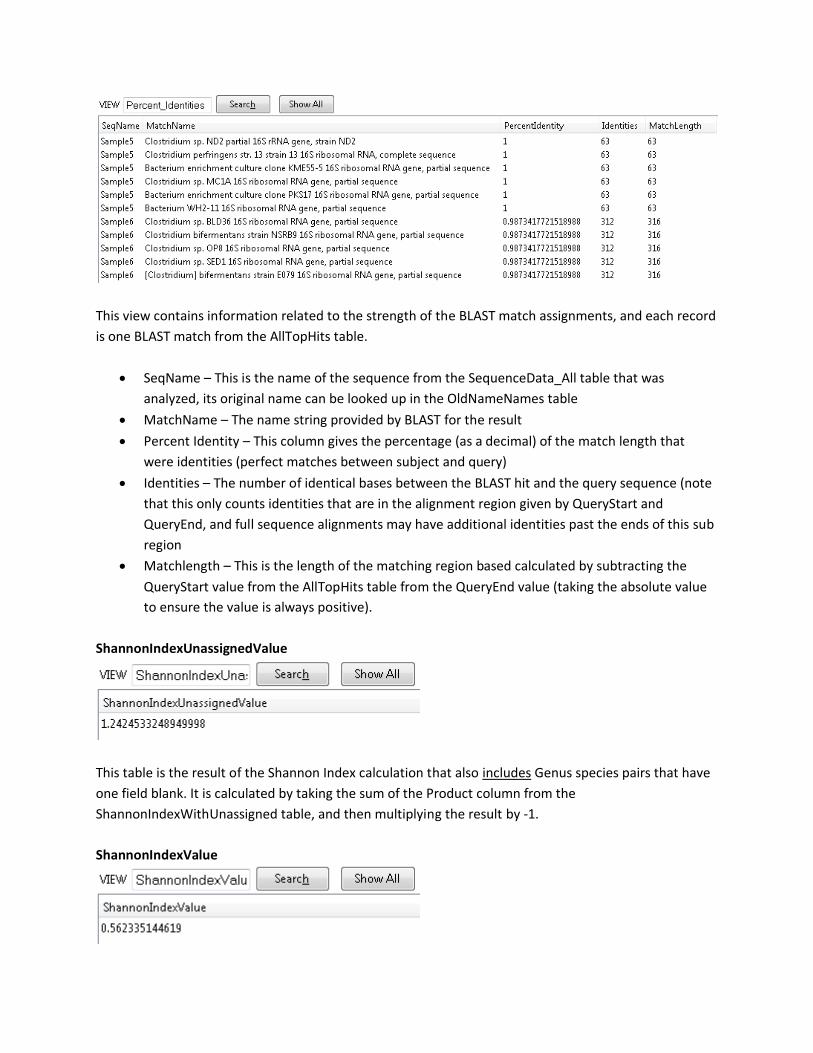
This view contains information related to the strength of the BLAST match assignments, and each record
is one BLAST match from the AllTopHits table.
• SeqName – This is the name of the sequence from the SequenceData_All table that was
analyzed, its original name can be looked up in the OldNameNames table
• MatchName – The name string provided by BLAST for the result
• Percent Identity – This column gives the percentage (as a decimal) of the match length that
were identities (perfect matches between subject and query)
• Identities – The number of identical bases between the BLAST hit and the query sequence (note
that this only counts identities that are in the alignment region given by QueryStart and
QueryEnd, and full sequence alignments may have additional identities past the ends of this sub
region
• Matchlength – This is the length of the matching region based calculated by subtracting the
QueryStart value from the AllTopHits table from the QueryEnd value (taking the absolute value
to ensure the value is always positive).
ShannonIndexUnassignedValue
This table is the result of the Shannon Index calculation that also includes Genus species pairs that have
one field blank. It is calculated by taking the sum of the Product column from the
ShannonIndexWithUnassigned table, and then multiplying the result by -1.
ShannonIndexValue
This table is the result of the Shannon Index calculation that excludes Genus species pairs that have one
field blank. It is calculated by taking the sum of the Product column from the ShannonIndex table, and
then multiplying the result by -1.
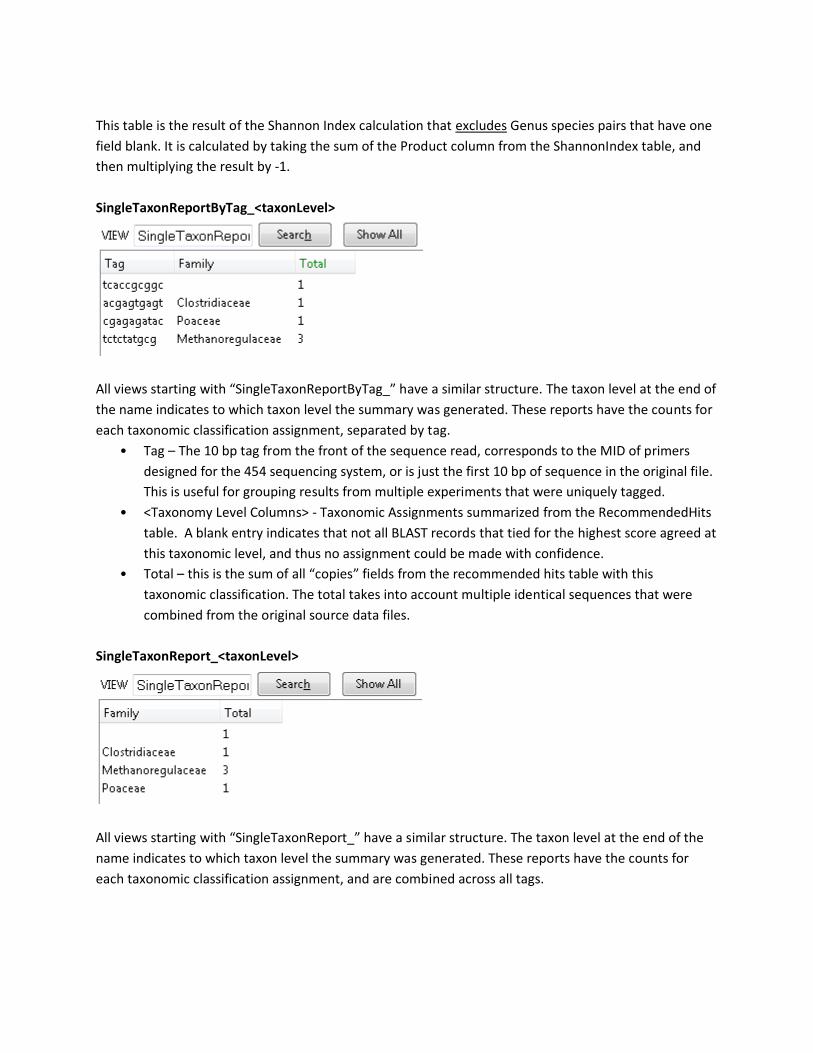
SingleTaxonReportByTag_<taxonLevel>
All views starting with “SingleTaxonReportByTag_” have a similar structure. The taxon level at the end of
the name indicates to which taxon level the summary was generated. These reports have the counts for
each taxonomic classification assignment, separated by tag.
• Tag – The 10 bp tag from the front of the sequence read, corresponds to the MID of primers
designed for the 454 sequencing system, or is just the first 10 bp of sequence in the original file.
This is useful for grouping results from multiple experiments that were uniquely tagged.
• <Taxonomy Level Columns> - Taxonomic Assignments summarized from the RecommendedHits
table. A blank entry indicates that not all BLAST records that tied for the highest score agreed at
this taxonomic level, and thus no assignment could be made with confidence.
• Total – this is the sum of all “copies” fields from the recommended hits table with this
taxonomic classification. The total takes into account multiple identical sequences that were
combined from the original source data files.
SingleTaxonReport_<taxonLevel>
All views starting with “SingleTaxonReport_” have a similar structure. The taxon level at the end of the
name indicates to which taxon level the summary was generated. These reports have the counts for
each taxonomic classification assignment, and are combined across all tags.

• <Taxonomy Level Columns> - Taxonomic Assignments summarized from the RecommendedHits
table. A blank entry indicates that not all BLAST records that tied for the highest score agreed at
this taxonomic level, and thus no assignment could be made with confidence.
• Total – this is the sum of all “copies” fields from the recommended hits table with this
taxonomic classification. The total takes into account multiple identical sequences that were
combined from the original source data files.


![CA IdentityMinder Java Developer's Guide Tutorial [Sample]](https://img.pdfslide.net/doc/110x75/55cf945a550346f57ba16d29/ca-identityminder-java-developers-guide-tutorial-sample.jpg)