Embed Size (px)
Citation preview

197
Emanuella Tarciana Vicente Bezerra et al.
REM, Int. Eng. J., Ouro Preto, 73(2), 197-203, apr. jun. | 2020
Emanuella Tarciana Vicente Bezerra1,2
https://orcid.org/0000-0002-1945-303X
Karen Soares Augusto1,3
https://orcid.org/0000-0002-0116-4993
Sidnei Paciornik1,4
https://orcid.org/0000-0001-6520-2007
1Pontifícia Universidade Católica do Rio de Janeiro –
PUC-RJ, Departamento de Engenharia Química e de
Materiais, Rio de Janeiro - Rio de Janeiro – Brasil.
E-mails: [email protected], [email protected], [email protected]
Abstract
The discrimination between pores and cracks is an important step in the micro-structural analysis of iron ore pellets. While the porosity is fundamental during the reduction process in blast furnaces, cracks are strongly detrimental to the mechanical strength. The usual image processing tools cannot automatically discriminate between these two types of features, especially in 3D images obtained, for instance, with x-ray microtomography (microCT). As pores and cracks have essentially the same x-ray absorbance, they cannot be discriminated by a simple intensity threshold. Given the complex shapes in 3D and the presence of many connections between pores and cracks, shape discrimination is not successful either. Thus, this article proposes the use of Deep Convolutional Neural Networks (DCNN) to discriminate between these 2 classes of discontinuities. The well-known U-NET architecture was employed. The network was trained by manually outlining representative objects of the 2 classes in a few layers of the 3D image. After optimization of the training parameters, the network was applied to the full image, successfully discriminating between pores and cracks. The trained network was then applied to the images of different pellets with good results. However, some residual errors are present. These characteristics are analyzed and possible solutions are proposed.
Keywords: x-ray microtomography, image analysis, deep convolutional networks; porosity; cracks.
Discrimination of pores and cracks in iron ore pellets using deep learning neural networkshttp://dx.doi.org/10.1590/0370-44672019730119
Metallurgy and materialsMetalurgia e materiais
1. Introduction
The pelletizing process consists of three main steps: preparation of the raw materials, formation of the green pellet, and heat treatment to harden the pellet. At the end of the process, the pellets are porous and may contain cracks. Pores originate in the preparation of the green pellets, when water fills the voids between the particles. As the burning starts, the water evaporates and is replaced by the air entering the system. (Meyer, 1980) Open pores connected to the surface facilitate the reactions and the heat exchange to which the pellets are submitted in the fur-naces, while closed pores do not connect with the surface and exert influence on the macroscopic properties of the pellet. (Klobes et al., 2006) Cracks are discon-tinuities that influence several character-istics, such as the compressive strength, which affects the pellet integrity during transport and inside the loaded furnace.
Two types of cracks can be found: thermal cracks, resulting from the sudden change of temperature during the heat treatment, which are usually found in the inner part of the pellets; and resilience cracks, formed by the handling and overlapping of the pellets, which cause mechanical ruptures, being generally larger and tending to ap-pear at the surface. (Fonseca, 2019).
The characterization of iron ore pellets allows to evaluate the quality of the pellet from its chemical, physical and microstructural properties. Most of the studies use Optical Microscopy (OM) as the main characterization method. Wag-ner et al. (2008) and Nellros and Thurley (2011) developed semi-automatic methods capable of creating a mosaic, covering the entire cross section of a pellet for analysis and classification of its different phases of composition. Castellanos et al. (2018) proposed a correlation between
optical microscopy and scanning elec-tron microscopy techniques to improve the identification of mineral phases and porosity. Iglesias et al. (2018) developed an automatic method for microstruc-tural characterization of iron ore. In another study, it was possible to perform a quantitative analysis of the degree of sintering from images obtained.(Nellros et al., 2015) However this technique, be-sides being destructive, provides only 2D information, limiting the study and the visualization of the internal and complete structure of the pellet. For this reason, x-ray microtomography (microCT) has been used with the advantage of being a non-destructive technique and having the ability to generate three-dimensional im-ages (3D). (Augusto and Paciornik, 2018)
Differentiation between pores and cracks is important for the microstructural analysis of pellets because porosity is a
198
Discrimination of pores and cracks in iron ore pellets using deep learning neural networks
REM, Int. Eng. J., Ouro Preto, 73(2), 197-203, apr. jun. | 2020
required feature, while cracks are detri-mental to the mechanical properties. Im-age analysis has been extensively used in this context. The usual sequence involves the following steps (Gomes et al., 2013):
• Pre-processing to reduce image defects, such as uneven background and noise.
• Segmentation, mostly by intensity thresholding, to discriminate the features of interest.
• Post-processing to correct errors from the segmentation step.
• Measurements of size, shape, tex-ture, among others.
• Measurement-based separation of features into classes.
This sequence is successful in many cases but fails under certain conditions. In the case of microCT, pores and cracks have the same x-ray absorbance and share the same intensity range in the im-ages. Thus, they cannot be discriminated by an intensity threshold. In 3D images, measurement-based classification does not work either, given the complexity of the size and shape distributions and, especially, due to the presence of many
interconnections between pores and cracks.
Recently there was a boom in the use of Machine Learning techniques that are able to mimic human recognition tasks. Importantly, once these algorithms are trained, they can learn from experi-ence and make decisions upon new data. (Tacchella et al., 2019) In the domain of image recognition and classification, a great improvement was reached with the so-called Convolutional Neural Networks (CNN). These networks use as input the pixel/voxel intensities/colors and automatically derive higher complexity features that can then be used for classification. (Goodfellow et al., 2016). This approach bypasses the traditional sequence outline above, as it does not require previous segmentation and measurements before classification.
With the evolution of hardware, especially Graphic Processing Units (GPU) that are extremely efficient in parallel processing of data, it has be-come practical to train deeper networks – meaning networks with several layers between input (that receive pixel/voxel
intensities) and output (that provide the desired object classes). This Deep Learning (DL) architecture is able to process the input pixels/voxels, and, as data propagates through the network layers, build ever more complex fea-tures that correspond to the detection of edges, orientations and other high-level descriptors of the objects. (Lecun et al., 2015)
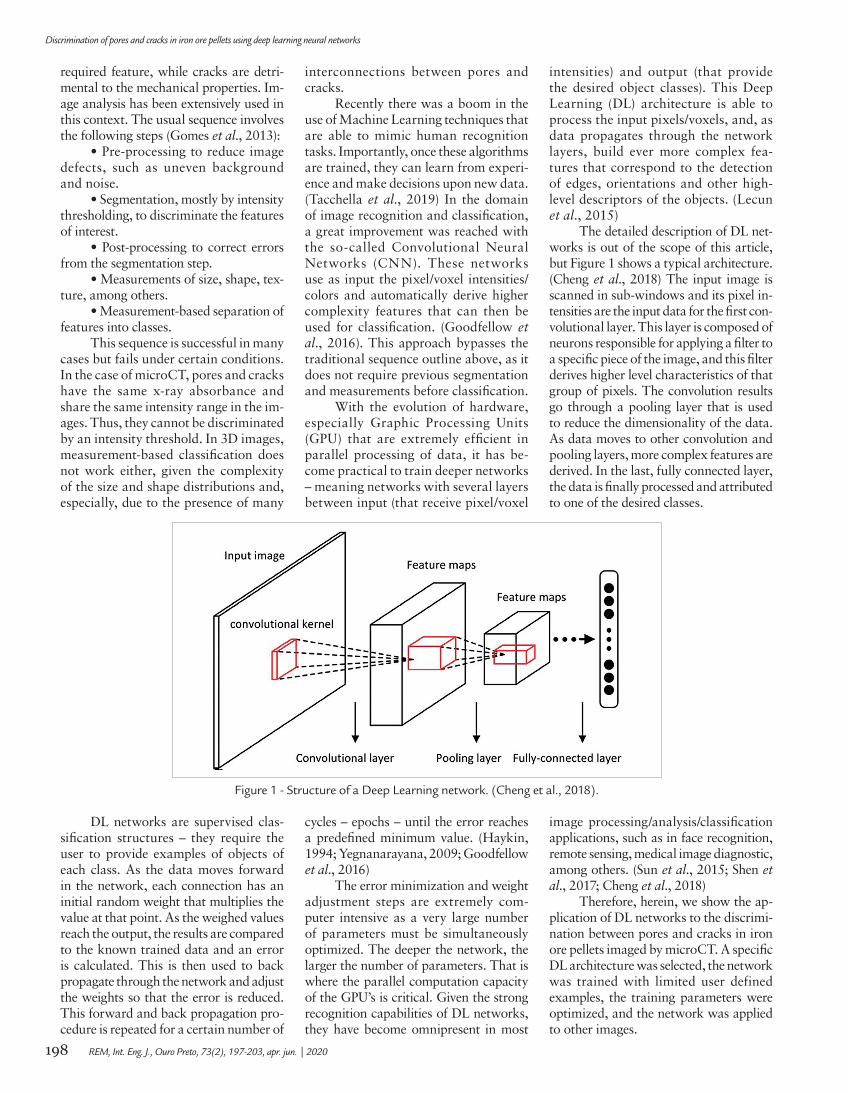
The detailed description of DL net-works is out of the scope of this article, but Figure 1 shows a typical architecture. (Cheng et al., 2018) The input image is scanned in sub-windows and its pixel in-tensities are the input data for the first con-volutional layer. This layer is composed of neurons responsible for applying a filter to a specific piece of the image, and this filter derives higher level characteristics of that group of pixels. The convolution results go through a pooling layer that is used to reduce the dimensionality of the data. As data moves to other convolution and pooling layers, more complex features are derived. In the last, fully connected layer, the data is finally processed and attributed to one of the desired classes.
Figure 1 - Structure of a Deep Learning network. (Cheng et al., 2018).
DL networks are supervised clas-sification structures – they require the user to provide examples of objects of each class. As the data moves forward in the network, each connection has an initial random weight that multiplies the value at that point. As the weighed values reach the output, the results are compared to the known trained data and an error is calculated. This is then used to back propagate through the network and adjust the weights so that the error is reduced. This forward and back propagation pro-cedure is repeated for a certain number of
cycles – epochs – until the error reaches a predefined minimum value. (Haykin, 1994; Yegnanarayana, 2009; Goodfellow et al., 2016)
The error minimization and weight adjustment steps are extremely com-puter intensive as a very large number of parameters must be simultaneously optimized. The deeper the network, the larger the number of parameters. That is where the parallel computation capacity of the GPU’s is critical. Given the strong recognition capabilities of DL networks, they have become omnipresent in most
image processing/analysis/classification applications, such as in face recognition, remote sensing, medical image diagnostic, among others. (Sun et al., 2015; Shen et al., 2017; Cheng et al., 2018)
Therefore, herein, we show the ap-plication of DL networks to the discrimi-nation between pores and cracks in iron ore pellets imaged by microCT. A specific DL architecture was selected, the network was trained with limited user defined examples, the training parameters were optimized, and the network was applied to other images.
199
Emanuella Tarciana Vicente Bezerra et al.
REM, Int. Eng. J., Ouro Preto, 73(2), 197-203, apr. jun. | 2020
2. Materials and methods
2.1 Samples and microCT image acquisition
2.2 Digital image processing and Deep Learning
The pellets analyzed in the present study were provided by Vale. A Zeiss XRadia 510 Versa microtomograph was used to ac-quire the 3D images. The x-ray source was set to 150 kV, 10 W. Using the so-called macro lens of the equipment (0.4X), it was possible to image full pellets with ~1 cm diameter. With 360o rotation, 4000 projections and binning 1 for acquisition and reconstruc-
tion, a pixel size of 7 µm was reached, cor-responding to approximately 14 µm spatial resolution. The acquisition conditions were the same for all pellets: total scan time of 10.6 h followed by the reconstruction procedure, that took a few minutes. The scan time can be optimized by changing the number of projections and other parameters, but we found that the parameters used were a good
compromise between time, spatial resolution and signal to noise ratio. Each 3D image contained 2008 slices with 2048 by 2004 pixels and 16 bits. (Augusto and Paciornik, 2018). Except for gluing to a support, no further specimen preparation was necessary.
The images were separated into 2 groups: training and test, as described in the following.
Image processing and DL network development was carried out in Dragonfly 4.0 (Object Research Systems, Montreal). To prepare the images for DL training and application, a few image processing steps were necessary.
Using traditional intensity threshold-ing and logic operations, both the solid part of the pellet and the pores/cracks were segmented and treated as Regions of Interest
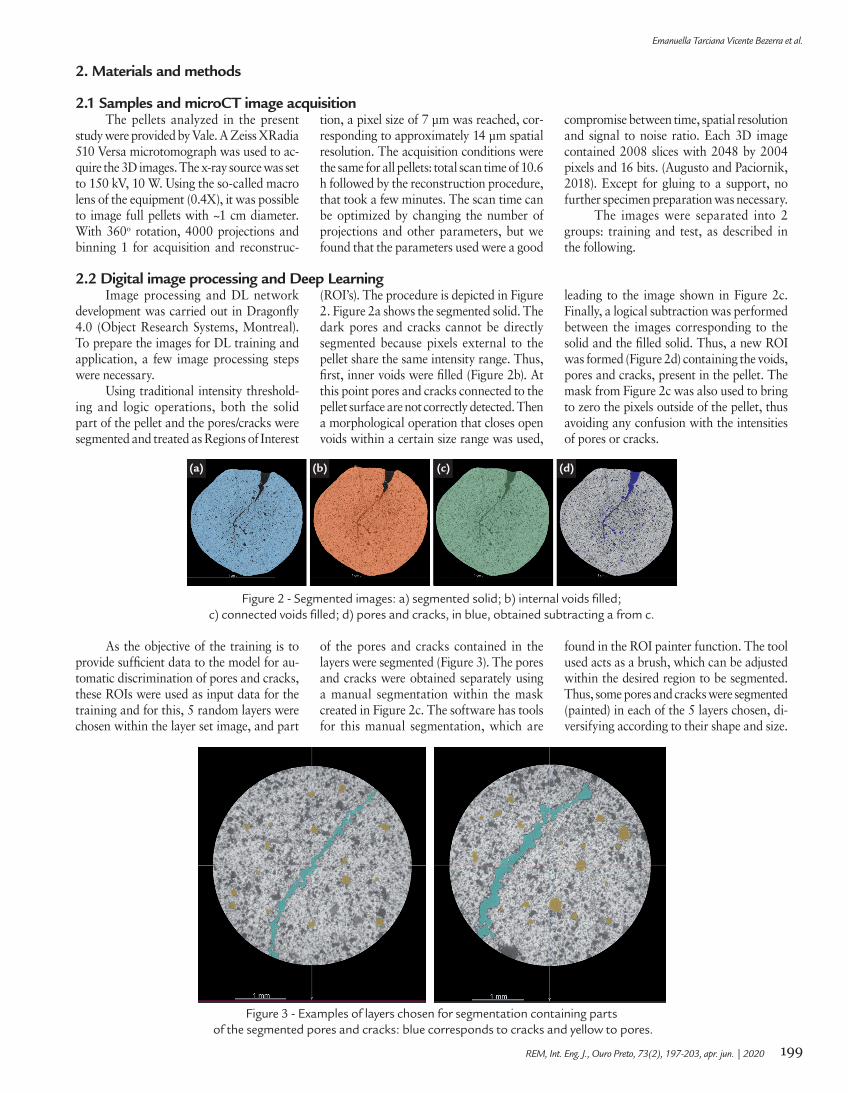
(ROI’s). The procedure is depicted in Figure 2. Figure 2a shows the segmented solid. The dark pores and cracks cannot be directly segmented because pixels external to the pellet share the same intensity range. Thus, first, inner voids were filled (Figure 2b). At this point pores and cracks connected to the pellet surface are not correctly detected. Then a morphological operation that closes open voids within a certain size range was used,
leading to the image shown in Figure 2c. Finally, a logical subtraction was performed between the images corresponding to the solid and the filled solid. Thus, a new ROI was formed (Figure 2d) containing the voids, pores and cracks, present in the pellet. The mask from Figure 2c was also used to bring to zero the pixels outside of the pellet, thus avoiding any confusion with the intensities of pores or cracks.
As the objective of the training is to provide sufficient data to the model for au-tomatic discrimination of pores and cracks, these ROIs were used as input data for the training and for this, 5 random layers were chosen within the layer set image, and part
of the pores and cracks contained in the layers were segmented (Figure 3). The pores and cracks were obtained separately using a manual segmentation within the mask created in Figure 2c. The software has tools for this manual segmentation, which are
found in the ROI painter function. The tool used acts as a brush, which can be adjusted within the desired region to be segmented. Thus, some pores and cracks were segmented (painted) in each of the 5 layers chosen, di-versifying according to their shape and size.
Figure 2 - Segmented images: a) segmented solid; b) internal voids filled;c) connected voids filled; d) pores and cracks, in blue, obtained subtracting a from c.
Figure 3 - Examples of layers chosen for segmentation containing parts of the segmented pores and cracks: blue corresponds to cracks and yellow to pores.
(a) (b) (c) (d)
200
Discrimination of pores and cracks in iron ore pellets using deep learning neural networks
REM, Int. Eng. J., Ouro Preto, 73(2), 197-203, apr. jun. | 2020
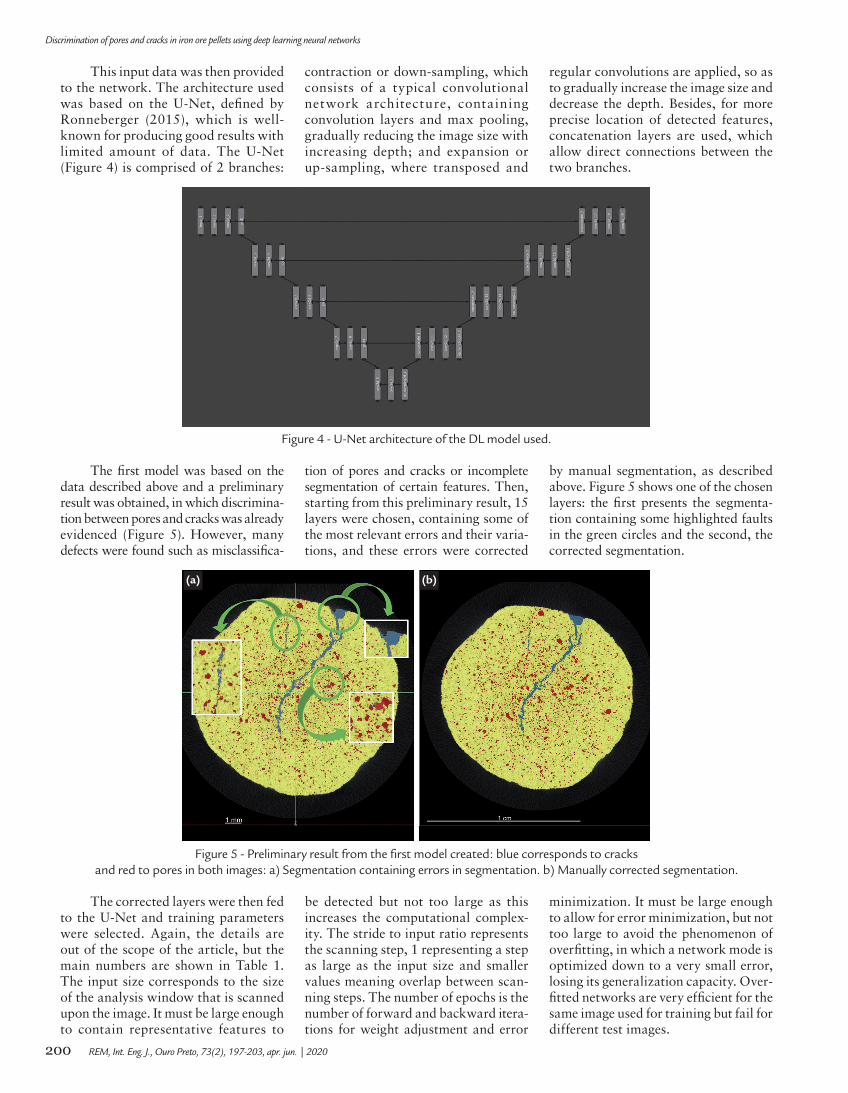
This input data was then provided to the network. The architecture used was based on the U-Net, defined by Ronneberger (2015), which is well-known for producing good results with limited amount of data. The U-Net (Figure 4) is comprised of 2 branches:
contraction or down-sampling, which consists of a typical convolutional network architecture, containing convolution layers and max pooling, gradually reducing the image size with increasing depth; and expansion or up-sampling, where transposed and
regular convolutions are applied, so as to gradually increase the image size and decrease the depth. Besides, for more precise location of detected features, concatenation layers are used, which allow direct connections between the two branches.
The first model was based on the data described above and a preliminary result was obtained, in which discrimina-tion between pores and cracks was already evidenced (Figure 5). However, many defects were found such as misclassifica-
tion of pores and cracks or incomplete segmentation of certain features. Then, starting from this preliminary result, 15 layers were chosen, containing some of the most relevant errors and their varia-tions, and these errors were corrected
by manual segmentation, as described above. Figure 5 shows one of the chosen layers: the first presents the segmenta-tion containing some highlighted faults in the green circles and the second, the corrected segmentation.
The corrected layers were then fed to the U-Net and training parameters were selected. Again, the details are out of the scope of the article, but the main numbers are shown in Table 1. The input size corresponds to the size of the analysis window that is scanned upon the image. It must be large enough to contain representative features to
be detected but not too large as this increases the computational complex-ity. The stride to input ratio represents the scanning step, 1 representing a step as large as the input size and smaller values meaning overlap between scan-ning steps. The number of epochs is the number of forward and backward itera-tions for weight adjustment and error
minimization. It must be large enough to allow for error minimization, but not too large to avoid the phenomenon of overfitting, in which a network mode is optimized down to a very small error, losing its generalization capacity. Over-fitted networks are very efficient for the same image used for training but fail for different test images.
Figure 4 - U-Net architecture of the DL model used.
Figure 5 - Preliminary result from the first model created: blue corresponds to cracks and red to pores in both images: a) Segmentation containing errors in segmentation. b) Manually corrected segmentation.
(a) (b)

201
Emanuella Tarciana Vicente Bezerra et al.
REM, Int. Eng. J., Ouro Preto, 73(2), 197-203, apr. jun. | 2020
Parameters Value
Input size 256
Stride to input ratio 1
Number of Epochs 50
Table 1 - DL network training parameters
3. Results and discussion
Figure 6 shows the results of the application of the optimized network to
3 different layers of the reference pellet, from which the training layers were se-
lected. Figure 7 depicts 3D renderings of this pellet showing pores and/or cracks.
Training is the most time- consum-ing step in the application of DL. The manual preparation of training data is a lengthy and tedious operation. The training of the network can also take substantial time depending on the im-age size and hardware capabilities. This training of the network lasted around 50 minutes, using a dual Intel® Xeon® CPU E5-2660 v3 @ 2.60GHz and 4 NVIDIA GeForce GTX 980 Ti GPU’s. However, once the network is trained, in principle it can be directly and effi-ciently applied to similar images of oth-er pellets. This generalization capability
is, indeed, one of the main advantages of the neural network approach.
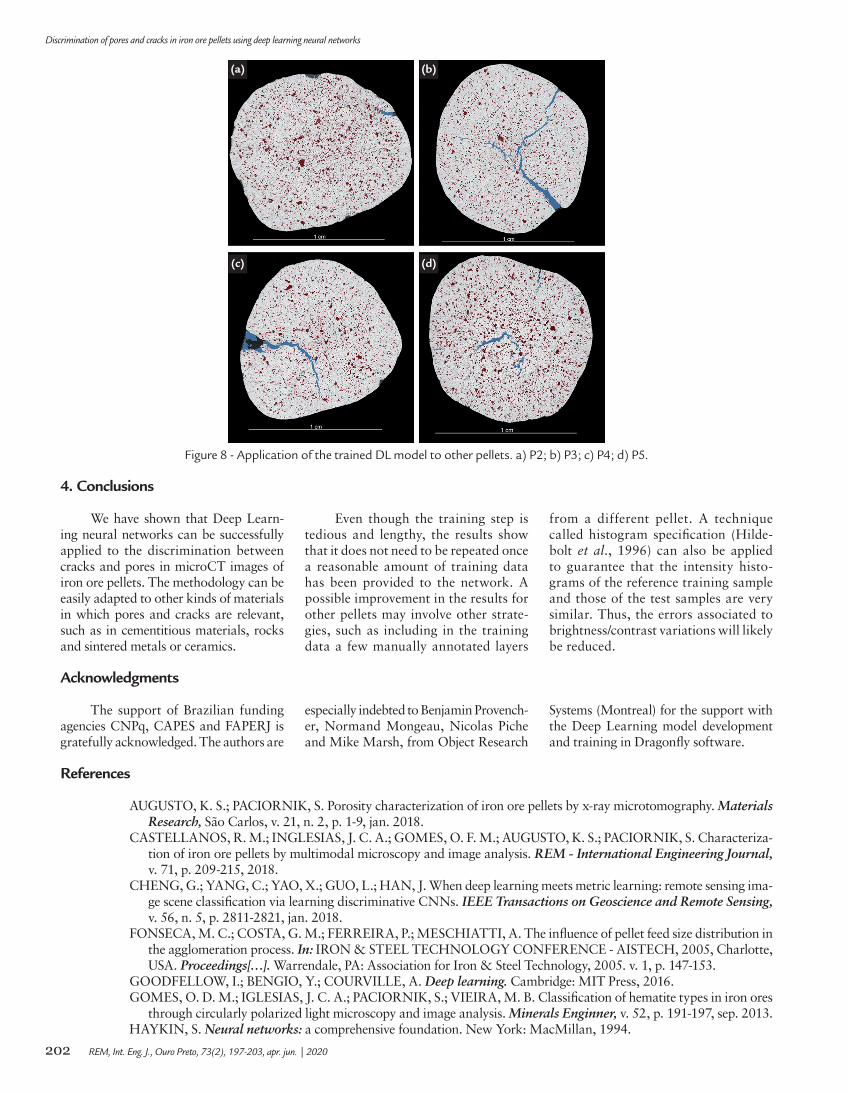
Thus, the DL model trained as described above was also applied to 4 other pellets tomographed under the same conditions. The results are shown in Figure 8 and are very promising. Pores and cracks were successfully dis-criminated, whereby even small pores and thin cracks were detected. In some cases, however, such as in Figure 8c, thicker parts of the cracks were not ac-curately detected.
There are several possible explana-tions for these errors. First, as the whole
DL approach is based on pixel intensi-ties, brightness/contrast variations be-tween the training reference pellet and the tested ones would affect the result. Second, it is hard to establish how much training data is enough. Evidently, the less the better, as this minimizes the la-bor-intensive step of manual segmenta-tion, but a limited training dataset will miss some important features, especially for objects with complex shapes. Third, as briefly mentioned above, the network training involves many parameters that must also be optimized, and the strategy is not always well defined.
Figure 6 - Application of trained DL network to 3 different layers of the reference sample where red is pores, blue is cracks and grey corresponds to solid.
Figure 7 - 3D renderings. a) Pores (red); b) Cracks (blue); c) Both.
(a) (b) (c)
202
Discrimination of pores and cracks in iron ore pellets using deep learning neural networks
REM, Int. Eng. J., Ouro Preto, 73(2), 197-203, apr. jun. | 2020
References
4. Conclusions
Acknowledgments
We have shown that Deep Learn-ing neural networks can be successfully applied to the discrimination between cracks and pores in microCT images of iron ore pellets. The methodology can be easily adapted to other kinds of materials in which pores and cracks are relevant, such as in cementitious materials, rocks and sintered metals or ceramics.
Even though the training step is tedious and lengthy, the results show that it does not need to be repeated once a reasonable amount of training data has been provided to the network. A possible improvement in the results for other pellets may involve other strate-gies, such as including in the training data a few manually annotated layers
from a different pellet. A technique called histogram specification (Hilde-bolt et al., 1996) can also be applied to guarantee that the intensity histo-grams of the reference training sample and those of the test samples are very similar. Thus, the errors associated to brightness/contrast variations will likely be reduced.
The support of Brazilian funding agencies CNPq, CAPES and FAPERJ is gratefully acknowledged. The authors are
especially indebted to Benjamin Provench-er, Normand Mongeau, Nicolas Piche and Mike Marsh, from Object Research
Systems (Montreal) for the support with the Deep Learning model development and training in Dragonfly software.
AUGUSTO, K. S.; PACIORNIK, S. Porosity characterization of iron ore pellets by x-ray microtomography. Materials Research, São Carlos, v. 21, n. 2, p. 1-9, jan. 2018.
CASTELLANOS, R. M.; INGLESIAS, J. C. A.; GOMES, O. F. M.; AUGUSTO, K. S.; PACIORNIK, S. Characteriza-tion of iron ore pellets by multimodal microscopy and image analysis. REM - International Engineering Journal, v. 71, p. 209-215, 2018.
CHENG, G.; YANG, C.; YAO, X.; GUO, L.; HAN, J. When deep learning meets metric learning: remote sensing ima-ge scene classification via learning discriminative CNNs. IEEE Transactions on Geoscience and Remote Sensing, v. 56, n. 5, p. 2811-2821, jan. 2018.
FONSECA, M. C.; COSTA, G. M.; FERREIRA, P.; MESCHIATTI, A. The influence of pellet feed size distribution in the agglomeration process. In: IRON & STEEL TECHNOLOGY CONFERENCE - AISTECH, 2005, Charlotte, USA. Proceedings[…]. Warrendale, PA: Association for Iron & Steel Technology, 2005. v. 1, p. 147-153.
GOODFELLOW, I.; BENGIO, Y.; COURVILLE, A. Deep learning. Cambridge: MIT Press, 2016.GOMES, O. D. M.; IGLESIAS, J. C. A.; PACIORNIK, S.; VIEIRA, M. B. Classification of hematite types in iron ores
through circularly polarized light microscopy and image analysis. Minerals Enginner, v. 52, p. 191-197, sep. 2013.HAYKIN, S. Neural networks: a comprehensive foundation. New York: MacMillan, 1994.
Figure 8 - Application of the trained DL model to other pellets. a) P2; b) P3; c) P4; d) P5.
(a) (b)
(c) (d)
203
Emanuella Tarciana Vicente Bezerra et al.
REM, Int. Eng. J., Ouro Preto, 73(2), 197-203, apr. jun. | 2020
All content of the journal, except where identified, is licensed under a Creative Commons attribution-type BY.
Received: 23 August 2019 - Accepted: 18 November 2019.
HILDEBOLT, C. F.; WALKUP, R. K.; CONOVER, G. L.; YOKOYAMA-CROTHERS, N.; BARTLETT, T. Q.; VANNIER, M. W.; SHROUT, M. K.; CAMP, J. J. Histogram-matching and histogram-flattening contrast correction methods: a comparison. Dentomaxillofacial Radiology, v. 25, n. 1, p. 42-47, 1996.
INGLESIAS, J. C. A.; AUGUSTO, K. S.; GOMES, O. F. M.; DOMINGUES, A. L. A.; VIEIRA, M. B.; CASAGRAN-DE, C.; PACIORNIK, S. Automatic characterization of iron ore by digital microscopy and image analysis. Journal of Materials Research and Technology, v. 7, p. 376-380, 2018.
KLOBES, P.; MEYER, K.; MUNRO, R. G. Porosity and specific surface area measurements for solid materials. Washington: National Institute of Standards and Technology, 2006.
LECUN, Y.; BENGIO, Y.; HILTON, G. Deep learning. Nature: International Journal of Science, v. 521, p. 436-444, may 2015.
MEYER, K. Pelletizing of iron ores. New York: Springer – Verlag Berlin Heidelberg, 1980.NELLROS, F.; THURLEY, M. J. Automated image analysis of iron-ore pellet structure using optical microscopy.
Minerals Engineering, v. 24, p. 1525-1531, 2011.NELLROS, F.; THURLEY, M. J.; JONSSON, H.; ANDERSON, C.; FORSMO, S. P. E. Automated measurement
of sintering degree in optical microscopy through image analysis of particle joins. Pattern Recognition, v. 48, p. 3451-3465, 2015.
RONNEBERGER, O.; FISCHER, P.; BROX, T. U-Net: convolutional networks for biomedical image segmentation. In: NAVAB N.; HORNEGGER J.; WELLS W.; FRANGI A. (ed.) Medical Image Computing and Computer--Assisted Intervention – MICCAI 2015. Springer, Cham, 2015. v. 9351, p. 234-241. (Lecture Notes in Computer Science).
SHEN, D.; WU, G.; SUK, H. Deep learning in medical image analysis. Annual Review of Biomedical Engineering, v. 19, p. 221-248, mar. 2017.
SUN, Y.; LIANG, D.; WANG, X.; TANG, X. DeepID3: face recognition with very deep neural networks. ArXiv, v. abs/1502.00873, 2015.
TACCHELLA, A.; ROMANO, S.; FERRALDESCHI, M.; SALVETTI, M. Collaboration between a human group and artificial intelligence can improve prediction of multiple sclerosis course: a proof-of-principle study. F1000Researc, v. 6, p. 2172-2185, may. 2019.
WAGNER, D. T.; ROUCO, H. V.; GOMES, O. F. M.; PACIORNIK, S.; VIEIRA, M. B. Caracterização de pelotas de minério de ferro por microscopia digital e análise de imagens. Tecnologia em Metalurgia e Materiais, v. 5, p. 215-218, 2008.
YEGNANARAYANA, B. Artificial neural networks. New Delhi: Prentice-Hall of India, 2009. 476 p.