Embed Size (px)
Citation preview
Metastable Beta TitaniumAlloys:Tuning Their Beta Phase Stability andLow-Temperature Martensitic Trans-formation
Le XuM.Sc. ThesisNovember, 2015
;

Metastable Beta Titanium Alloys:Tuning Their Beta Phase Stability and
Low-Temperature Martensitic Transformation
by
Le Xuto obtain the degree of Master of Science
at Delft University of Technology,
to be defended publicly on Friday November 6, 2015 at 11:00 AM.
Student number: 4323408
Project duration: October 2014 – November 2015
Thesis committee: Prof. dr. ir. S. van der Zwaag, TU Delft, Chairman of Thesis Committee
Prof. dr. W. Xu, TU Delft & Northeastern University, China
Dr. ir. M. J. M. Hermans, TU Delft
An electronic version of this thesis is available at http://repository.tudelft.nl/.


Preface
I am grinding my sample in the lab,
some sunny day.
I am sailing myself to somewhere,
somewhere we know,
free and easy.
I hear the bird chirping from somewhere,
somewhere you know,
peaceful and quiet.
I am not preparing the sample,
but preparing myself.
I know we will meet again,
some sunny day.
Le Xu
Delft, September 25, 2015
iii


Acknowledgements
During the past two years at TU Delft, I have learned and experienced way more than what
I could have anticipated and imagined at the time the wonderful journey began. I would
like to express my earnest gratitude to all who taught, helped and guided me throughout
the journey.
Many thanks to Prof. Sybrand van der Zwaag, my supervisor. You offered me the great
opportunity to do my master thesis project at the NovAM group. And many thanks to Prof.
Wei Xu and Dr. Qi Lu for co-supervision. I appreciate your unconditional help and inspira-
tional guidance throughout my thesis project. I learned a lot from you, especially the way of
thinking, the state of mind, and the qualities and methodologies to become an outstanding
professional.
Many thanks to my colleagues at the NovAM group and the office NB 1.20. I enjoyed the
fantastic year working with you all.
Many thanks to Lijing Xue, Frans Oostrum, Sander van Asperen, Dr. Maruti Hegde, Dr.
Richard Huizenga, and Kees Kwakernaak for technical support and kind help in the lab.
Special thanks to Adien and Jakob for your warm and unconditional hospitality during
the past two years. I will never forget the wonderful memories of hanging out with you
guys, the delicious food you cooked, and the board game we played.
Special thanks to all my friends around the world for unconditional support and en-
couragement from different aspects all the way regardless of the distance between us.
Lastly, my heartfelt gratitude to my family. You gave me everything. I do not know how
to put it into words. I love you.
Le Xu
Delft, October 2, 2015
v

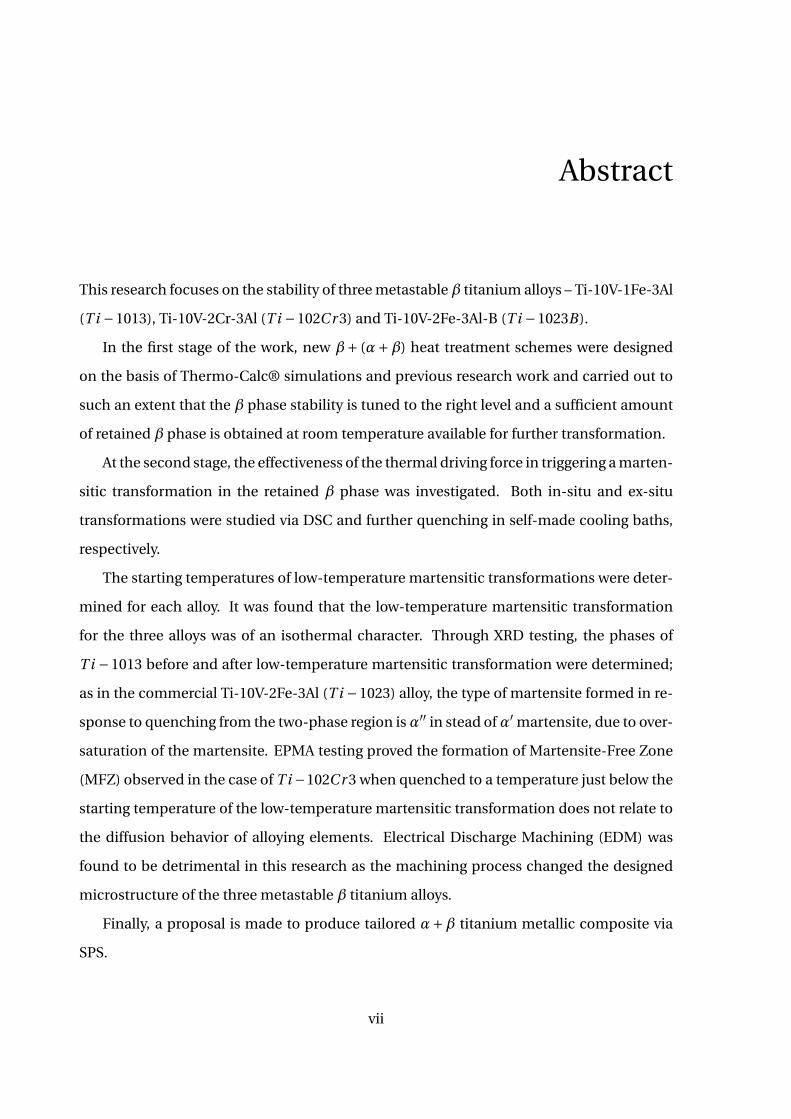
Abstract
This research focuses on the stability of three metastableβ titanium alloys – Ti-10V-1Fe-3Al
(T i −1013), Ti-10V-2Cr-3Al (T i −102Cr 3) and Ti-10V-2Fe-3Al-B (T i −1023B).
In the first stage of the work, new β+ (α+β) heat treatment schemes were designed
on the basis of Thermo-Calc® simulations and previous research work and carried out to
such an extent that the β phase stability is tuned to the right level and a sufficient amount
of retained β phase is obtained at room temperature available for further transformation.
At the second stage, the effectiveness of the thermal driving force in triggering a marten-
sitic transformation in the retained β phase was investigated. Both in-situ and ex-situ
transformations were studied via DSC and further quenching in self-made cooling baths,
respectively.
The starting temperatures of low-temperature martensitic transformations were deter-
mined for each alloy. It was found that the low-temperature martensitic transformation
for the three alloys was of an isothermal character. Through XRD testing, the phases of
T i −1013 before and after low-temperature martensitic transformation were determined;
as in the commercial Ti-10V-2Fe-3Al (T i −1023) alloy, the type of martensite formed in re-
sponse to quenching from the two-phase region isα′′ in stead ofα′ martensite, due to over-
saturation of the martensite. EPMA testing proved the formation of Martensite-Free Zone
(MFZ) observed in the case of T i −102Cr 3 when quenched to a temperature just below the
starting temperature of the low-temperature martensitic transformation does not relate to
the diffusion behavior of alloying elements. Electrical Discharge Machining (EDM) was
found to be detrimental in this research as the machining process changed the designed
microstructure of the three metastable β titanium alloys.
Finally, a proposal is made to produce tailored α+β titanium metallic composite via
SPS.
vii

Contents
1 Introduction 11.1 Classification of titanium alloys. . . . . . . . . . . . . . . . . . . . . . . . . . . . . 1
1.2 β and metastable β titanium alloys . . . . . . . . . . . . . . . . . . . . . . . . . . 2
1.3 Metastable phases in metastable β titanium alloys . . . . . . . . . . . . . . . . . 4
1.3.1 α′ martensite . . . . . . . . . . . . . . . . . . . . . . . . . . . . . . . . . . . 4
1.3.2 α′′ martensite . . . . . . . . . . . . . . . . . . . . . . . . . . . . . . . . . . . 5
1.3.3 ω phase . . . . . . . . . . . . . . . . . . . . . . . . . . . . . . . . . . . . . . . 6
1.4 Nucleation and diffusional growth process in metastable β titanium alloys . . 7
1.5 Stability of the β phase and its relation to the MS temperature . . . . . . . . . . 7
1.5.1 Alloying elements and β phase stability. . . . . . . . . . . . . . . . . . . . 8
1.5.2 Molybdenum equivalence. . . . . . . . . . . . . . . . . . . . . . . . . . . . 9
1.5.3 MS temperature . . . . . . . . . . . . . . . . . . . . . . . . . . . . . . . . . . 9
1.6 Martensitic transformation in metastable β titanium alloys. . . . . . . . . . . . 9
1.6.1 Martensite formed during quenching . . . . . . . . . . . . . . . . . . . . . 10
1.6.2 Athermal and isothermal martensitic transformation . . . . . . . . . . . 10
1.6.3 Low-temperature martensitic transformation . . . . . . . . . . . . . . . . 11
1.6.4 Stress-induced martensitic transformation . . . . . . . . . . . . . . . . . 11
1.7 Objectives of this work . . . . . . . . . . . . . . . . . . . . . . . . . . . . . . . . . . 11
2 Materials 132.1 Composition of as-received materials . . . . . . . . . . . . . . . . . . . . . . . . . 13
2.2 Initial heat treatment state and resulting microstructure . . . . . . . . . . . . . 15
2.3 Sample preparation . . . . . . . . . . . . . . . . . . . . . . . . . . . . . . . . . . . . 15
3 Thermo-Calc® Simulation 173.1 Objectives of the simulation work . . . . . . . . . . . . . . . . . . . . . . . . . . . 17
ix
x Contents
3.2 Simulation results . . . . . . . . . . . . . . . . . . . . . . . . . . . . . . . . . . . . . 18
3.3 Analysis and discussion of simulation results . . . . . . . . . . . . . . . . . . . . 18
3.3.1 Comparison of the simulation results . . . . . . . . . . . . . . . . . . . . . 21
3.3.2 Effects of the redistribution of solute elements . . . . . . . . . . . . . . . 21
3.3.3 Selection of the most relevant result. . . . . . . . . . . . . . . . . . . . . . 21
4 Heat Treatment andMetallography 23
4.1 Heat treatment design process . . . . . . . . . . . . . . . . . . . . . . . . . . . . . 23
4.1.1 Selection of heat treatment scheme . . . . . . . . . . . . . . . . . . . . . . 23
4.1.2 Selection of annealing temperature . . . . . . . . . . . . . . . . . . . . . . 24
4.2 Heat treatment experiments. . . . . . . . . . . . . . . . . . . . . . . . . . . . . . . 25
4.3 Methods for metallographic specimen preparation and examination . . . . . . 25
4.3.1 Electropolishing. . . . . . . . . . . . . . . . . . . . . . . . . . . . . . . . . . 26
4.3.2 Etching . . . . . . . . . . . . . . . . . . . . . . . . . . . . . . . . . . . . . . . 26
4.3.3 Optical microscopy . . . . . . . . . . . . . . . . . . . . . . . . . . . . . . . . 27
4.3.4 Metallographic image processing . . . . . . . . . . . . . . . . . . . . . . . 27
4.4 Results and discussion . . . . . . . . . . . . . . . . . . . . . . . . . . . . . . . . . . 27
4.4.1 Quenching from β single-phase region . . . . . . . . . . . . . . . . . . . . 27
4.4.2 Annealing for reaching equilibrium state . . . . . . . . . . . . . . . . . . . 28
4.4.3 Comparison between experiment and simulation results . . . . . . . . . 32
4.5 Conclusion of the heat treatment experiments . . . . . . . . . . . . . . . . . . . 33
5 Low-TemperatureMartensitic Transformation 35
5.1 In-situ method via Differential Scanning Calorimetry . . . . . . . . . . . . . . . 35
5.1.1 Reason of choosing DSC . . . . . . . . . . . . . . . . . . . . . . . . . . . . . 35
5.1.2 Sample preparation for DSC . . . . . . . . . . . . . . . . . . . . . . . . . . 36
5.1.3 DSC testing and results . . . . . . . . . . . . . . . . . . . . . . . . . . . . . 36
5.1.4 Discussion of DSC results . . . . . . . . . . . . . . . . . . . . . . . . . . . . 36
5.1.5 Metallographic examination of DSC samples and discussion. . . . . . . 37
5.1.6 Ex-situ testing of DSC cooled samples . . . . . . . . . . . . . . . . . . . . 39
5.1.7 Final remarks . . . . . . . . . . . . . . . . . . . . . . . . . . . . . . . . . . . 40
Contents xi
5.2 Ex-situ method via further quenching . . . . . . . . . . . . . . . . . . . . . . . . . 42
5.2.1 Further-quenching experiments . . . . . . . . . . . . . . . . . . . . . . . . 42
5.2.2 Results and discussion . . . . . . . . . . . . . . . . . . . . . . . . . . . . . . 42
5.3 X-ray diffraction . . . . . . . . . . . . . . . . . . . . . . . . . . . . . . . . . . . . . . 53
5.3.1 Materials . . . . . . . . . . . . . . . . . . . . . . . . . . . . . . . . . . . . . . 53
5.3.2 Experimental details . . . . . . . . . . . . . . . . . . . . . . . . . . . . . . . 53
5.3.3 XRD results and discussions . . . . . . . . . . . . . . . . . . . . . . . . . . 54
5.4 Electron probe micro-analysis . . . . . . . . . . . . . . . . . . . . . . . . . . . . . 59
5.4.1 Experimental details . . . . . . . . . . . . . . . . . . . . . . . . . . . . . . . 59
5.4.2 EPMA results and discussions . . . . . . . . . . . . . . . . . . . . . . . . . 59
5.5 Conclusion of low-temperature experiments. . . . . . . . . . . . . . . . . . . . . 61
6 Conclusion 63
7 Recommendations for FutureWork 65
A Fabricating Novel TitaniumMetallic Composites by SPS 67A.1 Introduction . . . . . . . . . . . . . . . . . . . . . . . . . . . . . . . . . . . . . . . . 67
A.2 Research work . . . . . . . . . . . . . . . . . . . . . . . . . . . . . . . . . . . . . . . 69
A.2.1 Project idea. . . . . . . . . . . . . . . . . . . . . . . . . . . . . . . . . . . . . 69
A.2.2 Theoretical basis of applying SIM effect as reinforcement. . . . . . . . . 70
A.2.3 Selection of powder bed preheating temperature . . . . . . . . . . . . . . 73
A.2.4 Controlled parameters . . . . . . . . . . . . . . . . . . . . . . . . . . . . . . 73
A.3 Expected research outcomes . . . . . . . . . . . . . . . . . . . . . . . . . . . . . . 74
A.4 Supplier information of titanium powders . . . . . . . . . . . . . . . . . . . . . . 75
Bibliography 77

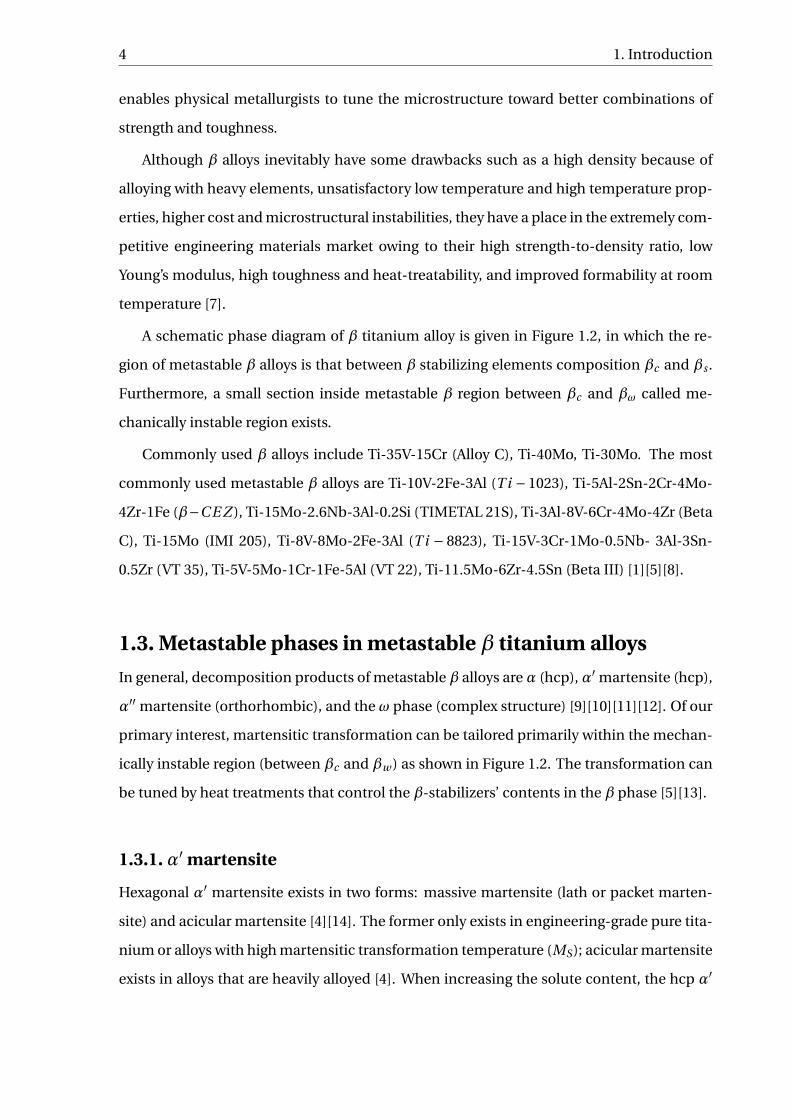
1Introduction
Featuring a relatively low density, a high specific strength, a good corrosion resistance,
superior biocompatibility, and an outstanding high-temperature strength and creep be-
havior, titanium and its alloys are superior lightweight engineering materials and are play-
ing an increasingly important role in airframes, jet engines and other aerospace engineer-
ing applications, especially for supersonic aircraft due to its higher requirement for high-
temperature strength.
From the advent of first commercial titanium produced by DuPont Company in 1948,
over 100 titanium alloys have been developed up to now. Only have 20 to 30 of them did
realize commercial application. Half the commercial titanium market share is occupied by
the classic Ti-6Al-4V alloy and roughly 25% is taken up by unalloyed titanium [1].
1.1. Classification of titanium alloysTitanium alloys are generally classified as α, β and α+β alloys, based on their crystal-
lographic phases at room temperature [2]. The temperature where the last remaining α-
phase transforms into the β phase upon heating is referred to as the β-transus. Pure tita-
nium mainly contains two phases: theα phase – with hexagonal close-packed (hcp) crystal
structure and existing below 882◦C – and the β phase – with body-centered cubic (bcc)
1
2 1. Introduction
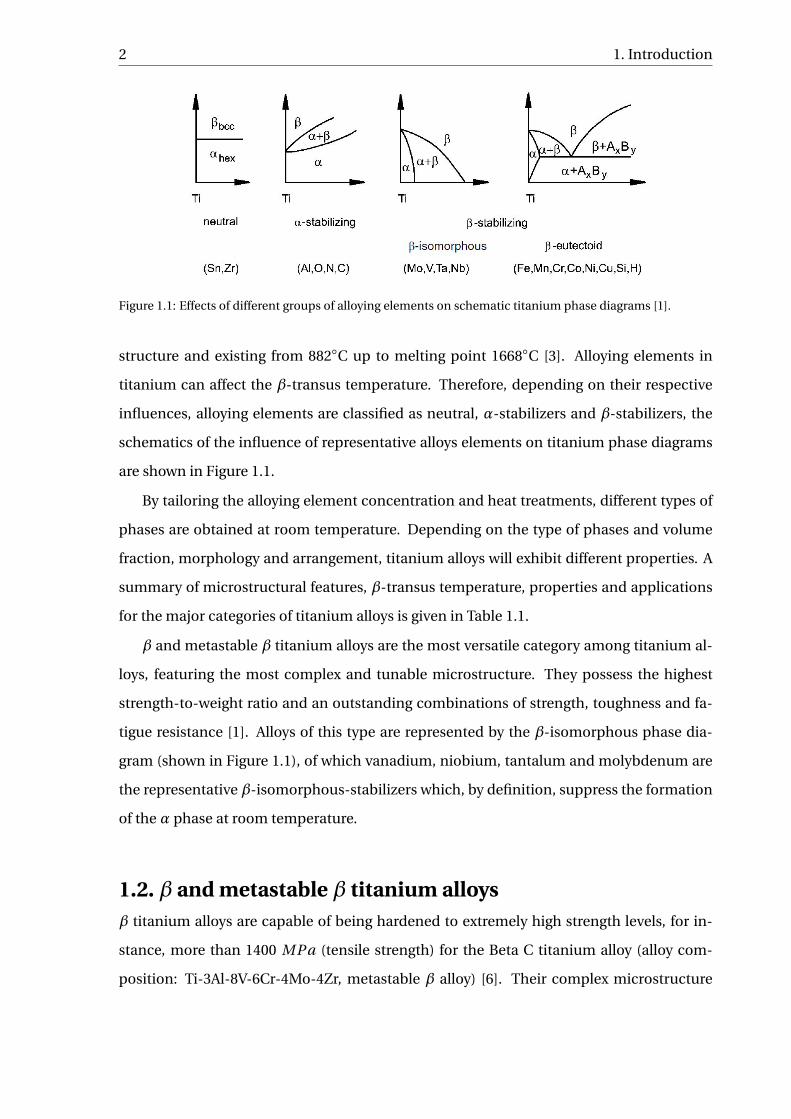
Figure 1.1: Effects of different groups of alloying elements on schematic titanium phase diagrams [1].
structure and existing from 882◦C up to melting point 1668◦C [3]. Alloying elements in
titanium can affect the β-transus temperature. Therefore, depending on their respective
influences, alloying elements are classified as neutral, α-stabilizers and β-stabilizers, the
schematics of the influence of representative alloys elements on titanium phase diagrams
are shown in Figure 1.1.
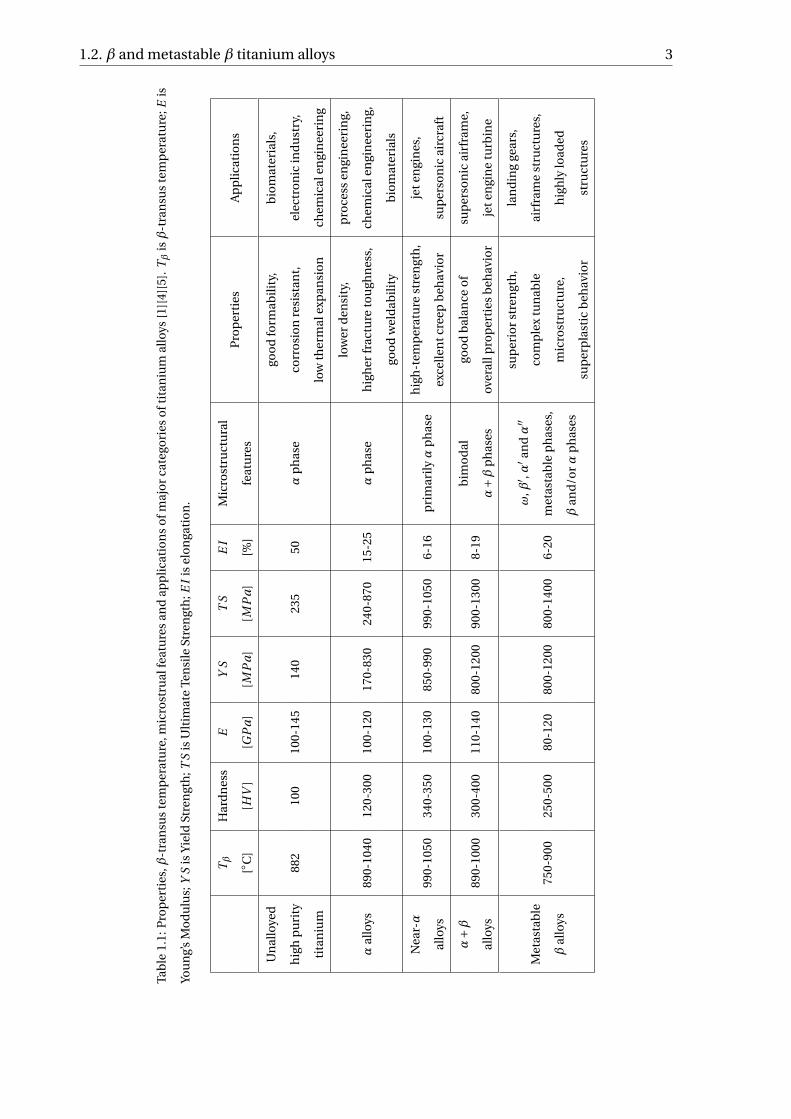
By tailoring the alloying element concentration and heat treatments, different types of
phases are obtained at room temperature. Depending on the type of phases and volume
fraction, morphology and arrangement, titanium alloys will exhibit different properties. A
summary of microstructural features, β-transus temperature, properties and applications
for the major categories of titanium alloys is given in Table 1.1.
β and metastable β titanium alloys are the most versatile category among titanium al-
loys, featuring the most complex and tunable microstructure. They possess the highest
strength-to-weight ratio and an outstanding combinations of strength, toughness and fa-
tigue resistance [1]. Alloys of this type are represented by the β-isomorphous phase dia-
gram (shown in Figure 1.1), of which vanadium, niobium, tantalum and molybdenum are
the representative β-isomorphous-stabilizers which, by definition, suppress the formation
of the α phase at room temperature.
1.2. β and metastable β titanium alloysβ titanium alloys are capable of being hardened to extremely high strength levels, for in-
stance, more than 1400 MPa (tensile strength) for the Beta C titanium alloy (alloy com-
position: Ti-3Al-8V-6Cr-4Mo-4Zr, metastable β alloy) [6]. Their complex microstructure
1.2. β and metastable β titanium alloys 3
Tab
le1.
1:P
rop
erti
es,β
-tra
nsu
ste
mp
erat
ure
,mic
rost
rual
feat
ure
san
dap
pli
cati
on
so
fmaj
or
cate
gori
eso
ftit
aniu
mal
loys
[1][
4][5
].Tβ
isβ
-tra
nsu
ste
mp
erat
ure
;Eis
You
ng’
sM
od
ulu
s;Y
Sis
Yie
ldSt
ren
gth
;TS
isU
ltim
ate
Ten
sile
Stre
ngt
h;E
Iis
elo
nga
tio
n.
Tβ
Har
dn
ess
EY
ST
SE
IM
icro
stru
ctu
ral
Pro
per
ties
Ap
plic
atio
ns
[◦C
][H
V]
[GP
a]
[MP
a]
[MP
a]
[%]
feat
ure
s
Un
allo
yed
goo
dfo
rmab
ility
,b
iom
ater
ials
,
hig
hp
uri
ty88
210
010
0-14
514
023
550
αp
has
eco
rro
sio
nre
sist
ant,
elec
tro
nic
ind
ust
ry,
tita
niu
mlo
wth
erm
alex
pan
sio
nch
emic
alen
gin
eeri
ng
low
erd
ensi
ty,
pro
cess
engi
nee
rin
g,
αal
loys
890-
1040
120-
300
100-
120
170-
830
240-
870
15-2
5α
ph
ase
hig
her
frac
ture
tou
ghn
ess,
chem
ical
engi
nee
rin
g,
goo
dw
eld
abili
tyb
iom
ater
ials
Nea
r-α
990-
1050
340-
350
100-
130
850-
990
990-
1050
6-16
pri
mar
ilyα
ph
ase
hig
h-t
emp
erat
ure
stre
ngt
h,
jete
ngi
nes
,
allo
ysex
celle
ntc
reep
beh
avio
rsu
per
son
icai
rcra
ft
α+β
890-
1000
300-
400
110-
140
800-
1200
900-
1300
8-19
bim
od
algo
od
bal
ance
of
sup
erso
nic
airf
ram
e,
allo
ysα+β
ph
ases
over
allp
rop
erti
esb
ehav
ior
jete
ngi
ne
turb
ine
750-
900
250-
500
80-1
2080
0-12
0080
0-14
006-
20
ω,β
′ ,α′ an
dα′′
met
asta
ble
ph
ases
,
βan
d/o
rα
ph
ases
sup
erio
rst
ren
gth
,la
nd
ing
gear
s,
Met
asta
ble
com
ple
xtu
nab
leai
rfra
me
stru
ctu
res,
βal
loys
mic
rost
ruct
ure
,h
igh
lylo
aded
sup
erp
last
icb
ehav
ior
stru
ctu
res
4 1. Introduction
enables physical metallurgists to tune the microstructure toward better combinations of
strength and toughness.
Although β alloys inevitably have some drawbacks such as a high density because of
alloying with heavy elements, unsatisfactory low temperature and high temperature prop-
erties, higher cost and microstructural instabilities, they have a place in the extremely com-
petitive engineering materials market owing to their high strength-to-density ratio, low
Young’s modulus, high toughness and heat-treatability, and improved formability at room
temperature [7].
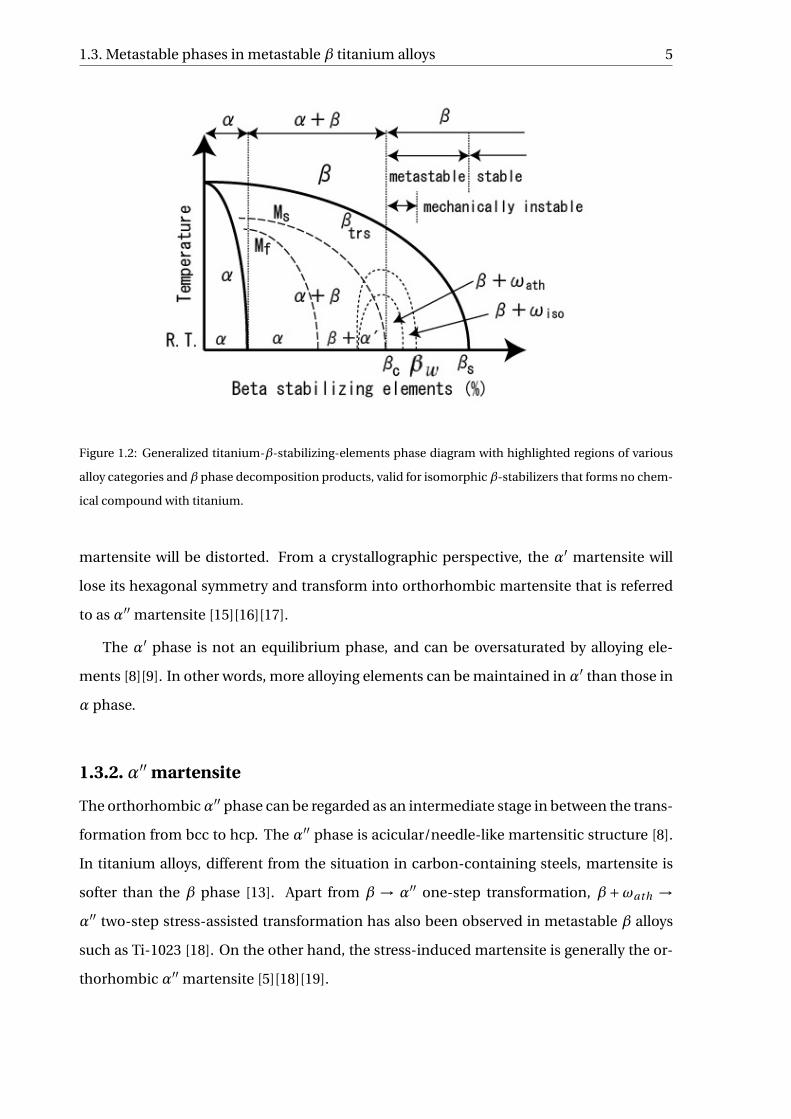
A schematic phase diagram of β titanium alloy is given in Figure 1.2, in which the re-
gion of metastable β alloys is that between β stabilizing elements composition βc and βs .
Furthermore, a small section inside metastable β region between βc and βω called me-
chanically instable region exists.
Commonly used β alloys include Ti-35V-15Cr (Alloy C), Ti-40Mo, Ti-30Mo. The most
commonly used metastable β alloys are Ti-10V-2Fe-3Al (T i −1023), Ti-5Al-2Sn-2Cr-4Mo-
4Zr-1Fe (β−C E Z ), Ti-15Mo-2.6Nb-3Al-0.2Si (TIMETAL 21S), Ti-3Al-8V-6Cr-4Mo-4Zr (Beta
C), Ti-15Mo (IMI 205), Ti-8V-8Mo-2Fe-3Al (T i − 8823), Ti-15V-3Cr-1Mo-0.5Nb- 3Al-3Sn-
0.5Zr (VT 35), Ti-5V-5Mo-1Cr-1Fe-5Al (VT 22), Ti-11.5Mo-6Zr-4.5Sn (Beta III) [1][5][8].
1.3. Metastable phases in metastable β titanium alloys
In general, decomposition products of metastable β alloys areα (hcp), α′ martensite (hcp),
α′′ martensite (orthorhombic), and the ω phase (complex structure) [9][10][11][12]. Of our
primary interest, martensitic transformation can be tailored primarily within the mechan-
ically instable region (between βc and βw ) as shown in Figure 1.2. The transformation can
be tuned by heat treatments that control the β-stabilizers’ contents in the β phase [5][13].
1.3.1. α′ martensite
Hexagonal α′ martensite exists in two forms: massive martensite (lath or packet marten-
site) and acicular martensite [4][14]. The former only exists in engineering-grade pure tita-
nium or alloys with high martensitic transformation temperature (MS); acicular martensite
exists in alloys that are heavily alloyed [4]. When increasing the solute content, the hcp α′
1.3. Metastable phases in metastable β titanium alloys 5
Figure 1.2: Generalized titanium-β-stabilizing-elements phase diagram with highlighted regions of various
alloy categories and β phase decomposition products, valid for isomorphic β-stabilizers that forms no chem-
ical compound with titanium.
martensite will be distorted. From a crystallographic perspective, the α′ martensite will
lose its hexagonal symmetry and transform into orthorhombic martensite that is referred
to as α′′ martensite [15][16][17].
The α′ phase is not an equilibrium phase, and can be oversaturated by alloying ele-
ments [8][9]. In other words, more alloying elements can be maintained in α′ than those in
α phase.
1.3.2. α′′ martensite
The orthorhombicα′′ phase can be regarded as an intermediate stage in between the trans-
formation from bcc to hcp. The α′′ phase is acicular/needle-like martensitic structure [8].
In titanium alloys, different from the situation in carbon-containing steels, martensite is
softer than the β phase [13]. Apart from β → α′′ one-step transformation, β+ωath →α′′ two-step stress-assisted transformation has also been observed in metastable β alloys
such as Ti-1023 [18]. On the other hand, the stress-induced martensite is generally the or-
thorhombic α′′ martensite [5][18][19].
6 1. Introduction
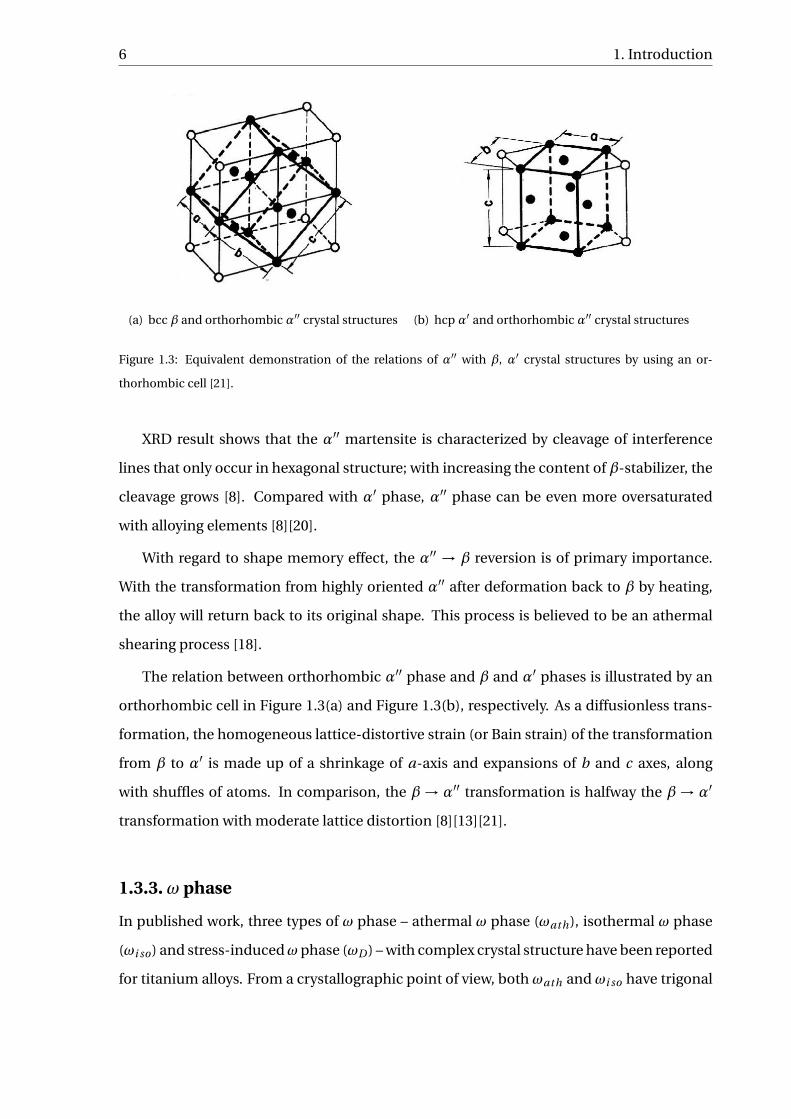
(a) bcc β and orthorhombic α′′ crystal structures (b) hcp α′ and orthorhombic α′′ crystal structures
Figure 1.3: Equivalent demonstration of the relations of α′′ with β, α′ crystal structures by using an or-
thorhombic cell [21].
XRD result shows that the α′′ martensite is characterized by cleavage of interference
lines that only occur in hexagonal structure; with increasing the content of β-stabilizer, the
cleavage grows [8]. Compared with α′ phase, α′′ phase can be even more oversaturated
with alloying elements [8][20].
With regard to shape memory effect, the α′′ → β reversion is of primary importance.
With the transformation from highly oriented α′′ after deformation back to β by heating,
the alloy will return back to its original shape. This process is believed to be an athermal
shearing process [18].
The relation between orthorhombic α′′ phase and β and α′ phases is illustrated by an
orthorhombic cell in Figure 1.3(a) and Figure 1.3(b), respectively. As a diffusionless trans-
formation, the homogeneous lattice-distortive strain (or Bain strain) of the transformation
from β to α′ is made up of a shrinkage of a-axis and expansions of b and c axes, along
with shuffles of atoms. In comparison, the β→ α′′ transformation is halfway the β→ α′
transformation with moderate lattice distortion [8][13][21].
1.3.3.ω phase
In published work, three types of ω phase – athermal ω phase (ωath), isothermal ω phase
(ωi so) and stress-inducedωphase (ωD ) – with complex crystal structure have been reported
for titanium alloys. From a crystallographic point of view, both ωath and ωi so have trigonal

1.4. Nucleation and diffusional growth process in metastable β titanium alloys 7
symmetry in heavily β-stabilized alloys and have a hexagonal crystal structure in solute-
leaner alloys [4][22]. It is difficult to avoid ωath and ωi so during quenching or during initial
stage of aging or reheating [9][18]; and the transformation between hexagonal and trigonal
structures is continuous with the variation of solute content.
On the other hand, reported in recent work [23][24], stress-induced ω phase (ωD ) has
been observed in Ti-9Mo-6W alloy that shows combined TRIP and TWIP effects. At the
same time, it has been found that in Ti-10V-3Fe-3Al alloy, stress-induced ωD phase exist,
leading to the stress plateau phenomena [25]. The crystal structure of ωD is hexagonal,
which has been proved for alloys having stress-induced bcc matrix to ωD phase trans-
formation not only in metastable β titanium alloys but also in metals such as tantalum
[24][26][27][28].
1.4. Nucleation and diffusional growth process in metastable
β titanium alloys
As can be seen from Figure 1.2, the phase transformation from β phase (bcc) to α phase
(hcp) while cooling through β-transus may take place martensitically or by conventional
diffusion-controlled nucleation and growth process. Which mechanism will prevail mainly
depends on applied cooling rate and alloy composition.
If the cooling rate from β single-phase field to α+β two-phase field through β-transus
is sufficiently low, α (also α′ [5]) phase will preferentially nucleate at the grain boundary
of β phase, microscopically resulting in α layers/feather-like structure along the β grain
boundary, mainly because of the fact that the hcpα phase is incoherent to the parent bcc β
phase. During continuous cooling, theα phase will grow into the β grains as parallel plates
that form an α colony [4][29].
1.5. Stability of the β phase and its relation to the MS temper-
ature
One of the most important characteristics of metastable β titanium alloys is the β phase
stability. It is the dominating factor in determining if the martensitic transformation will
8 1. Introduction
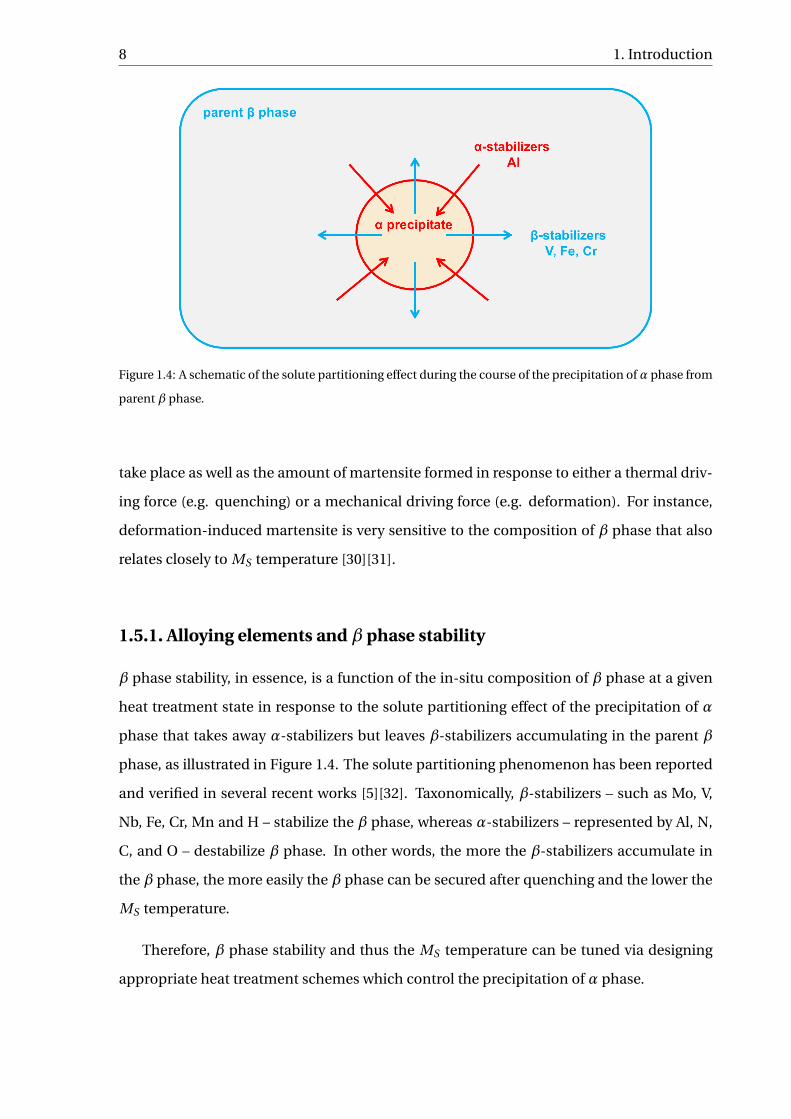
Figure 1.4: A schematic of the solute partitioning effect during the course of the precipitation ofα phase from
parent β phase.
take place as well as the amount of martensite formed in response to either a thermal driv-
ing force (e.g. quenching) or a mechanical driving force (e.g. deformation). For instance,
deformation-induced martensite is very sensitive to the composition of β phase that also
relates closely to MS temperature [30][31].
1.5.1. Alloying elements and β phase stability
β phase stability, in essence, is a function of the in-situ composition of β phase at a given
heat treatment state in response to the solute partitioning effect of the precipitation of α
phase that takes away α-stabilizers but leaves β-stabilizers accumulating in the parent β
phase, as illustrated in Figure 1.4. The solute partitioning phenomenon has been reported
and verified in several recent works [5][32]. Taxonomically, β-stabilizers – such as Mo, V,
Nb, Fe, Cr, Mn and H – stabilize the β phase, whereas α-stabilizers – represented by Al, N,
C, and O – destabilize β phase. In other words, the more the β-stabilizers accumulate in
the β phase, the more easily the β phase can be secured after quenching and the lower the
MS temperature.
Therefore, β phase stability and thus the MS temperature can be tuned via designing
appropriate heat treatment schemes which control the precipitation of α phase.
1.6. Martensitic transformation in metastable β titanium alloys 9
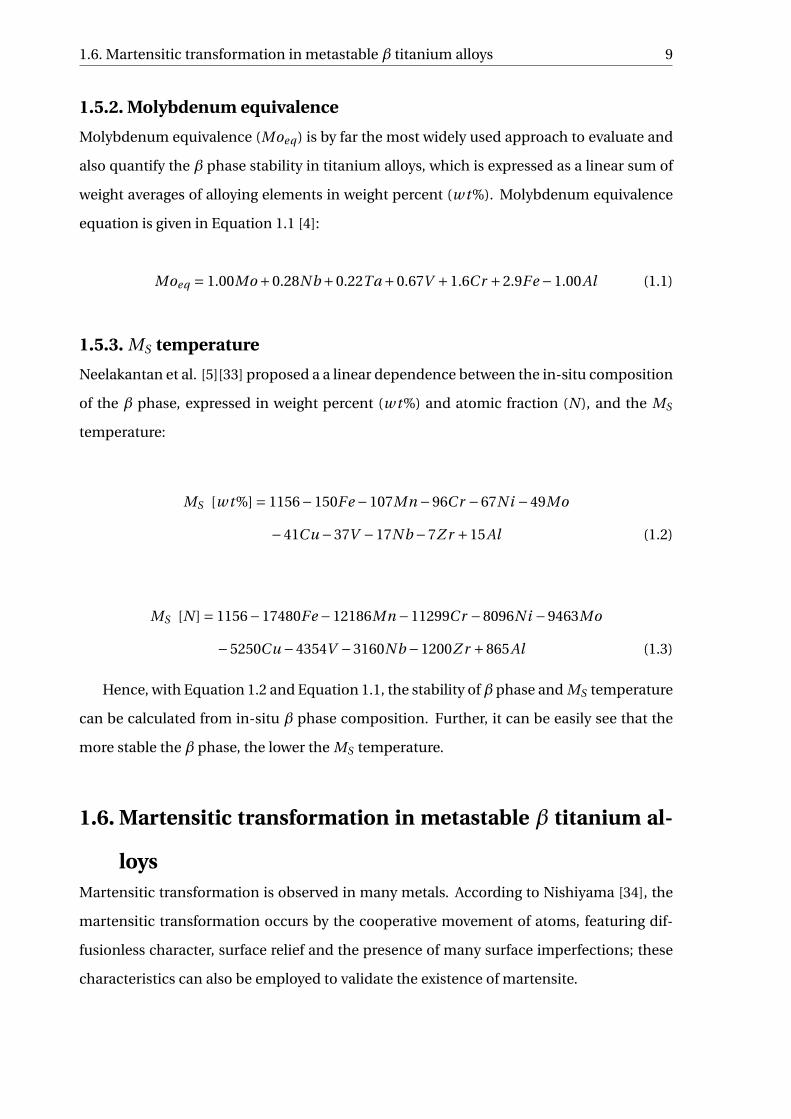
1.5.2. Molybdenum equivalence
Molybdenum equivalence (Moeq ) is by far the most widely used approach to evaluate and
also quantify the β phase stability in titanium alloys, which is expressed as a linear sum of
weight averages of alloying elements in weight percent (w t%). Molybdenum equivalence
equation is given in Equation 1.1 [4]:
Moeq = 1.00Mo +0.28N b +0.22Ta +0.67V +1.6Cr +2.9Fe −1.00Al (1.1)
1.5.3. MS temperature
Neelakantan et al. [5][33] proposed a a linear dependence between the in-situ composition
of the β phase, expressed in weight percent (w t%) and atomic fraction (N ), and the MS
temperature:
MS [w t%] = 1156−150Fe −107Mn −96Cr −67Ni −49Mo
−41Cu −37V −17N b −7Z r +15Al (1.2)
MS [N ] = 1156−17480Fe −12186Mn −11299Cr −8096Ni −9463Mo
−5250Cu −4354V −3160N b −1200Z r +865Al (1.3)
Hence, with Equation 1.2 and Equation 1.1, the stability ofβ phase and MS temperature
can be calculated from in-situ β phase composition. Further, it can be easily see that the
more stable the β phase, the lower the MS temperature.
1.6. Martensitic transformation in metastable β titanium al-
loysMartensitic transformation is observed in many metals. According to Nishiyama [34], the
martensitic transformation occurs by the cooperative movement of atoms, featuring dif-
fusionless character, surface relief and the presence of many surface imperfections; these
characteristics can also be employed to validate the existence of martensite.
10 1. Introduction
1.6.1. Martensite formed during quenching
Martensite, first observed in steel by A. Martens, is a metastable non-equilibrium phase
that is not present in an equilibrium phase diagram. It can exist indefinitely at ambient
temperatures, but will transform back into equilibrium phases upon annealing at an el-
evated temperature. Martensite forms very rapidly if the required cooling rate (thermal
driving force) is applied. Each atom only displaces a small (sub-atomic) distance during
the transformation, along with a sudden reorientation at the same time.
Martensitic transformation in titanium alloys comprises the cooperative movement of
atoms by shearing, resulting in a microscopically homogeneous transformation from body-
centered cubic β phase into the hexagonal α′ phase [13]. With increasing solute element
content, the hexagonal α′ martensite becomes distorted and, from the prospective of crys-
tallography,α′ martensite loses its hexagonal symmetry and then changes into orthorhom-
bic crystal structure which is designated as α′′ martensite [4][14].
The extent of martensitic transformation under a fixed thermal driving force in the
metastable β alloys can be engineered by tuning the stability of β phase and thus be em-
bodied by tailored MS temperature.
Martensites in titanium (both α′ and α′′) are much softer than their counterpart in
steels, because interstitial oxygen atoms can only induce a small elastic distortion of the
titanium martensite with hexagonal lattice in bcc β matrix [4]; at the same time, substi-
tutional alloying elements also contribute to martensitic transformation in titanium al-
loys [34]. Therefore, the hcp α′ martensite does not possess high hardness and strength,
and the mechanical properties of orthorhombic α′′ martensite are close to that of stable
α and β solid solution with similar chemical composition [8]. Although at the first sight
the strengthening effect of martensite in titanium alloys is not that obvious compared with
steels, its complexity and heat-treatability still leaves physical metallurgists a lot of space
for strength enhancement.
1.6.2. Athermal and isothermal martensitic transformation
Athermal and isothermal martensitic transformation may take place in titanium alloys.
Generally speaking, as for isothermal martensitic transformation, the fraction of marten-
1.7. Objectives of this work 11
site increases with time at fixed transition temperature, whereas the fraction remains con-
stant at fixed temperature in the case of athermal martensitic transformation [35].
Athermal martensitic transformation is clearly recognized as a transformation with no
thermal activation needed. The isothermal martensitic transformation is mentioned more
frequently in fields related to shape memory effect such as in Ti-Ni alloys [36]. However, a
satisfactory explanation of the nature of isothermal and athermal martensitic transforma-
tion does not yet exist [36][37][38].
1.6.3. Low-temperature martensitic transformation
In theory, by appropriate heat treatment design, retained β phase in metastable β titanium
alloys can be obtained at room temperature, which means the alloy still possesses the ca-
pability for martensitic transformation. A martensitic transformation can be initiated by
further quenching – i.e. providing an additional thermal driving force.
In the case of steels, the kinetics of martensitic transformation at temperature below
room temperature points at an isothermal process [39][40].
1.6.4. Stress-induced martensitic transformation
Deformation mechanisms, in general, are classified into four basic categories: dislocation
glide, twinning, plasticity derived from phase transformation, and thermally activated glide
by diffusion (for instance, creep and grain boundary sliding). The deformation mecha-
nisms of metastable β alloys mainly include slip, Stress-Induced Martensitic transforma-
tion (SIM), deformation twinning or any combination of them [41]. As a means to provide
energy for martensitic transformation, mechanical driving force can also initiate the trans-
formation process in retained β phase. The SIM effect in metastable β alloys features the
β→α′′ martensitic transformation [5][18][19].
1.7. Objectives of this work
As an important category of aerospace engineering materials, metastable β titanium al-
loys have been increasingly used on, for instance, aircraft in which the structural mate-
rial may experience low-temperature work environment. Therefore, investigating the low-
12 1. Introduction
temperature martensitic transformation phenomenon of metastable β alloys is of practical
significance to evaluate the alloy’s performance for aerospace applications.
However, to the best of the author’s knowledge from the available published work, this
phenomenon with regard to metastable β titanium alloys has not been effectively inves-
tigated. Therefore, this exploratory study is devoted to investigate the phenomenon in
metastable β titanium alloys as a function of the effectiveness of thermal driving force in
activating further martensitic transformation in this category of titanium alloys.
A variety of experimental methods was employed in this work. Starting from computer-
aided thermodynamic equilibrium simulations, Thermo-Calc® was utilized for finding out
the appropriate heat treatment scheme in order to better tune the β phase stability. Experi-
mental work was carried out subsequently by virtue of a combination of Thermo-Calc® sim-
ulation and previous experimental experience. Then, the phenomenon of low-temperature
martensitic transformation was systematically investigated both in in-situ and ex-situ man-
ners by performing DSC testing and further-quenching experiments in selected cooling
baths, respectively. XRD testing was performed to examine the experiment results. EPMA
testing was conducted to study the formation of Martensite-Free Zone. Metallographic
specimen preparation and metallographic image processing were conducted throughout
this work.
2Materials
Three novel metastable β titanium alloys designed by the NovAM group at TU Delft were
employed in this work – they are, Ti-10V-1Fe-3Al (T i −1013), Ti-10V-2Cr-3Al (T i −102Cr 3)
and Ti-10V-2Fe-3Al-B (T i −1023B), of which T i −1013 and T i −102Cr 3 were fabricated by
the Institute of Metal Research, Chinese Academy of Science, Shenyang, China, while the
manufacturer of T i −1023B was GfE Gesellschaft für Elektrometallurgie mbH, Nuremberg,
Germany.
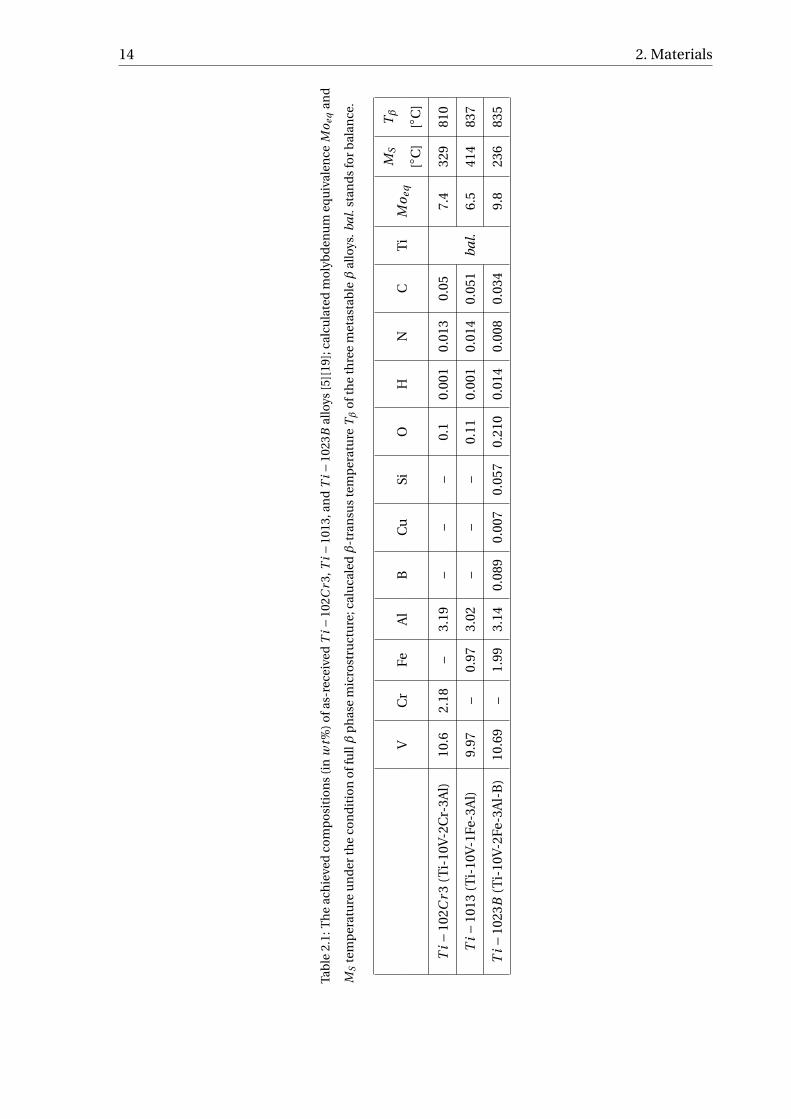
2.1. Composition of as-received materials
Presented in Table 2.1 are the nominal and the achieved compositions (in w t%) of the
three alloys, and calculated molybdenum equivalence Moeq and MS temperature (◦C) from
Equation 1.1 and Equation 1.2, respectively, at fully β phase solution-treated condition; β-
transus temperature Tβ (◦C) of the three metastable β alloys derived from the calculation
results of Thermo-Calc® TCW™ v.5 with TTTI3 Thermotech Ti-based Alloys Database.
In addition, as far as T i −1023B was concerned, a minor amount of TiB intermetallic
compound exists at room temperature irrespective of the solution treatment [5], to control
prior β grain size by Zener pinning, which is properly predicted by Thermo-Calc®.
13
14 2. Materials
Tab
le2.
1:T
he
ach
ieve
dco
mp
osi
tio
ns
(in
wt%
)o
fas-
rece
ived
Ti−
102C
r3,T
i−10
13,a
nd
Ti−
1023
Bal
loys
[5][
19];
calc
ula
ted
mo
lyb
den
um
equ
ival
ence
Mo e
qan
d
MS
tem
per
atu
reu
nd
erth
eco
nd
itio
no
ffu
llβ
ph
ase
mic
rost
ruct
ure
;cal
uca
ledβ
-tra
nsu
ste
mp
erat
ure
Tβ
oft
he
thre
em
etas
tab
leβ
allo
ys.b
al.s
tan
ds
for
bal
ance
.
VC
rFe
Al
BC
uSi
OH
NC
Ti
Mo e
q
MS
Tβ
[◦C
][◦
C]
Ti−1
02C
r3(T
i-10
V-2
Cr-
3Al)
10.6
2.18
–3.
19–
––
0.1
0.00
10.
013
0.05
bal.
7.4
329
810
Ti−1
013
(Ti-
10V
-1Fe
-3A
l)9.
97–
0.97
3.02
––
–0.
110.
001
0.01
40.
051
6.5
414
837
Ti−1
023B
(Ti-
10V
-2Fe
-3A
l-B
)10
.69
–1.
993.
140.
089
0.00
70.
057
0.21
00.
014
0.00
80.
034
9.8
236
835
2.2. Initial heat treatment state and resulting microstructure 15
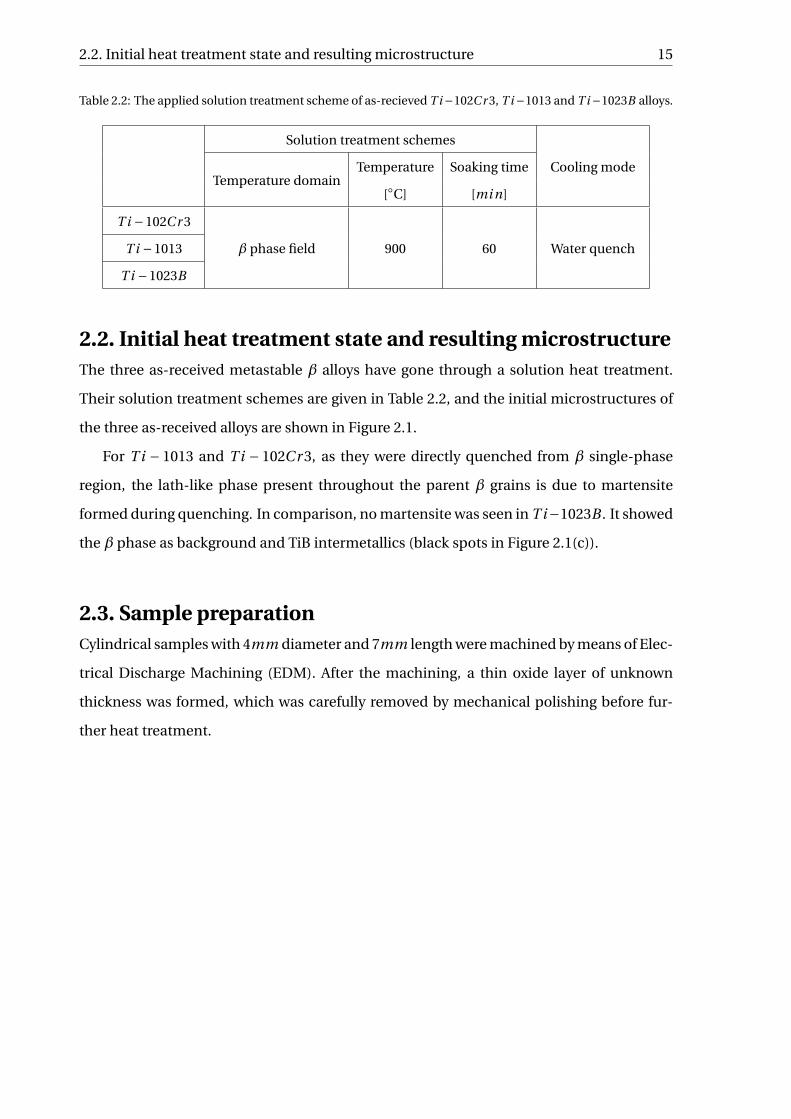
Table 2.2: The applied solution treatment scheme of as-recieved T i−102Cr 3, T i−1013 and T i−1023B alloys.
Solution treatment schemes
Cooling modeTemperature domain
Temperature Soaking time
[◦C] [mi n]
T i −102Cr 3
β phase field 900 60 Water quenchT i −1013
T i −1023B
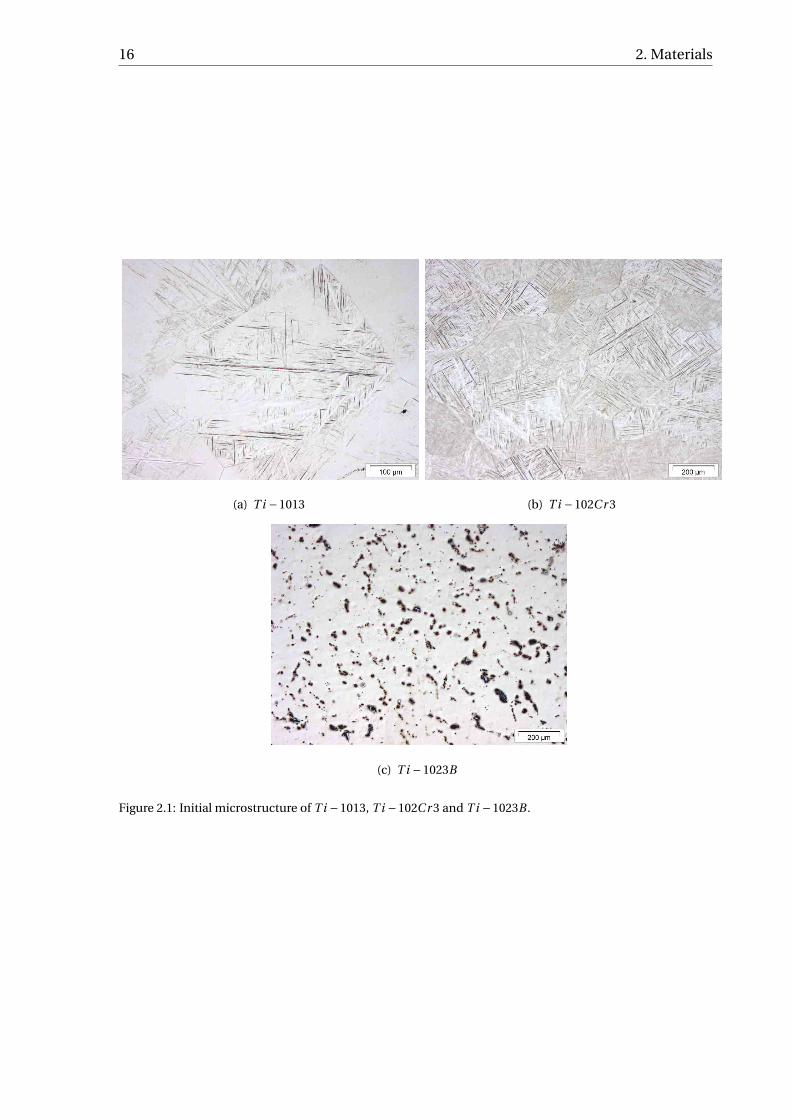
2.2. Initial heat treatment state and resulting microstructureThe three as-received metastable β alloys have gone through a solution heat treatment.
Their solution treatment schemes are given in Table 2.2, and the initial microstructures of
the three as-received alloys are shown in Figure 2.1.
For T i − 1013 and T i − 102Cr 3, as they were directly quenched from β single-phase
region, the lath-like phase present throughout the parent β grains is due to martensite
formed during quenching. In comparison, no martensite was seen in T i−1023B . It showed
the β phase as background and TiB intermetallics (black spots in Figure 2.1(c)).
2.3. Sample preparationCylindrical samples with 4mm diameter and 7mm length were machined by means of Elec-
trical Discharge Machining (EDM). After the machining, a thin oxide layer of unknown
thickness was formed, which was carefully removed by mechanical polishing before fur-
ther heat treatment.
16 2. Materials
(a) T i −1013 (b) T i −102Cr 3
(c) T i −1023B
Figure 2.1: Initial microstructure of T i −1013, T i −102Cr 3 and T i −1023B .
3Thermo-Calc® Simulation
Thermo-Calc® is the most powerful and widely used computer-aided simulation software
for thermodynamic calculations. It is capable of calculating the amounts of phases and
their compositions at different temperatures under the equilibrium condition, liquidus and
solidus, and calculating phase diagrams (be it binary, ternary and multi-component), as
long as the composition of the alloy and conditions, such as temperature, pressure and
system size, are given.
Using the composition of the three metastable β alloys (given in Table 2.1), Thermo-
Calc® simulations were carried out to simulate which β phase compositions can be ob-
tained when annealing at theα+β two-phase region. In this work, two versions of Thermo-
Calc® database were used – i.e. Thermo-Calc® TCW™ v.5 and Thermo-Calc® v.3.1.
3.1. Objectives of the simulation workThe main goal of performing computer-aided simulation is to find out the optimal anneal-
ing temperature of the three metastable β titanium alloys in the α+β two-phase region in
order to better tune the β phase composition and hence stability and to secure enough β
phase at room temperature after quenching for the purpose of realizing further martensitic
transformation.
17
18 3. Thermo-Calc® Simulation
As stated in Section 1.5.1, β phase will become more stable because of the accumu-
lation of β-stabilizers (e.g. Mo, V, Nb, Fe, Cr and Mn) in the β phase, because of the so-
lute partitioning effect owing to precipitation of α phase. The idea of conducting Thermo-
Calc® simulation is to design the heat treatment scheme that could effectively control the
α precipitation in practice.
In addition, it is worthwhile to note that the simulation is only effective provided the
equilibrium state is reached for a given heat treatment.
3.2. Simulation results
The most important data expected from the simulation results are the in-situ composition
of the β phase and the volume fraction of α precipitate. Furthermore, β phase stability and
MS temperature can be calculated from Equation 1.1 and Equation 1.2.
Thermo-Calc® TCW™ v.5
From the outset, Thermo-Calc® TCW™ v.5 was employed to perform the simulation with
TTTI3 Thermotech Ti-based Alloys Database. The simulation is mainly performed within
the promising temperature range between β-transus and 200◦C lower than it. A summary
of the simulation results is given in Table 3.1.
Thermo-Calc® v.3.1
Afterward, the simulation work was conducted on Thermo-Calc® v.3.1 again for further
sifting out appropriate intercritical annealing temperature, based on the experience and
results from Thermo-Calc® TCW™ v.5. The results are summarized in Table 3.2.
3.3. Analysis and discussion of simulation results
From Table 3.2 and Table 3.1, four major alloying elements – vanadium, chromium , iron
and aluminum – can be identified that have the major influence upon the stability of β
phase in response to heat treatment, of which vanadium, iron and chromium are the β-
stabilizers, whereas aluminum is α-stabilizer.

3.3. Analysis and discussion of simulation results 19
Table 3.1: Simulation results from Thermo-Calc® TCW™ v.5 with TTTI3 Thermotech Ti-based Alloys
Database of β phase compositions (in w t%) and α phase fraction in equilibrium condition for T i −102Cr 3,
T i −1013 and T i −1023B alloys at selected annealing temperatures (Tanne.) within α+β two-phase region
to obtain different β phase stability (Moeq ) and MS temperature by tuning α phase precipitation; alloying
elements presented are those directly related to the calculations of Moeq and MS given in Equation 1.1 and
Equation 1.2, respectively.
Tanne.V Cr Fe Al Cu Moeq
MS α phase fraction
[◦C] [◦C] [%]
T i −102Cr 3
750 11.8 2.4
0
5.3
0
6.5 291 20.5
700 14.6 3.1 5.1 9.6 123 37.5
680 16.0 3.4 5.1 11.0 45 43.7
670 16.8 3.5 5.0 12.0 -5 46.8
660 17.7 3.7 5.0 12.8 -53 49.5
650 18.6 3.9 4.9 13.9 -108 52.3
630 20.5 4.4 4.8 16.0 -228 57.2
T i −1013
750 12.1
0
1.1 4.9
0
6.4 341 28.1
700 15.1 1.5 4.7 9.6 177 44.6
680 16.6 1.6 4.7 11.2 93 50.3
670 17.4 1.7 4.6 12.0 50 52.6
650 19.0 1.9 4.5 13.7 -35 57.2
630 20.8 2.1 4.5 15.6 -137 61.2
T i −1023B
750 11.6
0
2.0 5.3
≈ 0
8.3 231 18.2
700 13.7 2.5 5.0 11.3 79 31.7
680 14.7 2.7 5.0 12.5 17 36.8
670 15.2 2.8 4.9 13.3 -22 39.3
660 15.8 2.9 4.8 14.1 -61 41.8
630 17.7 3.3 4.7 16.6 -189 48.3
20 3. Thermo-Calc® Simulation
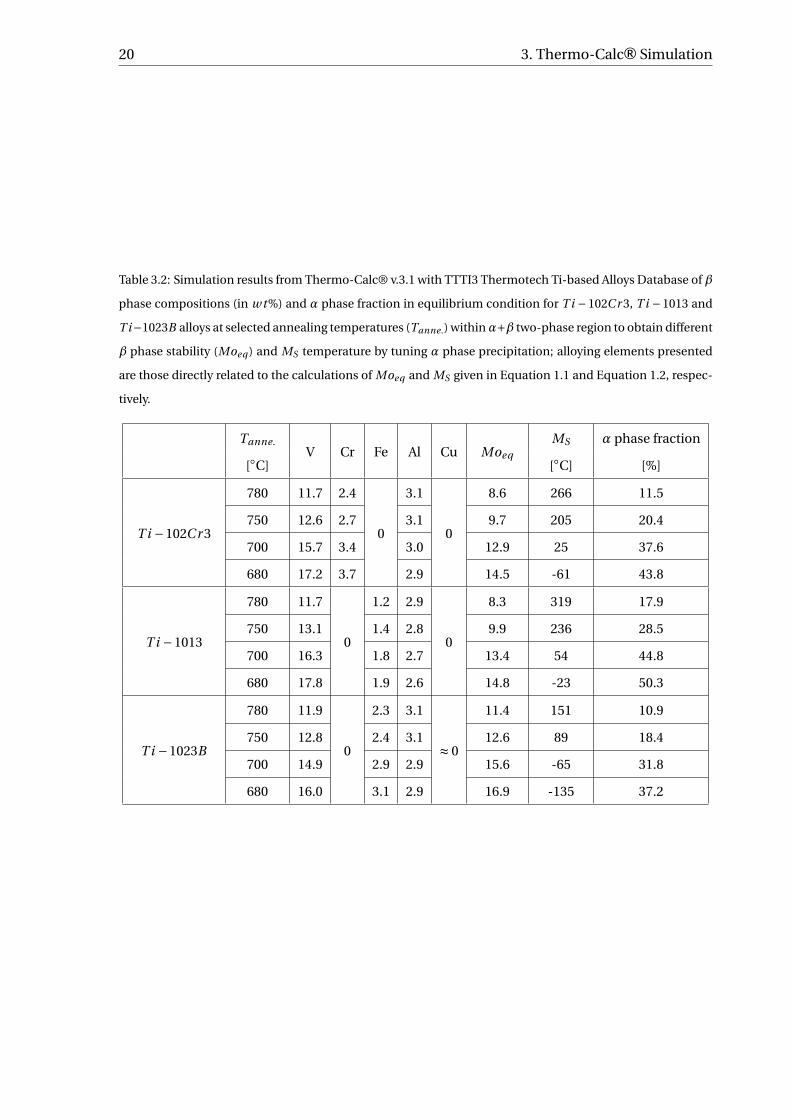
Table 3.2: Simulation results from Thermo-Calc® v.3.1 with TTTI3 Thermotech Ti-based Alloys Database of β
phase compositions (in w t%) and α phase fraction in equilibrium condition for T i −102Cr 3, T i −1013 and
T i−1023B alloys at selected annealing temperatures (Tanne.) withinα+β two-phase region to obtain different
β phase stability (Moeq ) and MS temperature by tuning α phase precipitation; alloying elements presented
are those directly related to the calculations of Moeq and MS given in Equation 1.1 and Equation 1.2, respec-
tively.
Tanne.V Cr Fe Al Cu Moeq
MS α phase fraction
[◦C] [◦C] [%]
T i −102Cr 3
780 11.7 2.4
0
3.1
0
8.6 266 11.5
750 12.6 2.7 3.1 9.7 205 20.4
700 15.7 3.4 3.0 12.9 25 37.6
680 17.2 3.7 2.9 14.5 -61 43.8
T i −1013
780 11.7
0
1.2 2.9
0
8.3 319 17.9
750 13.1 1.4 2.8 9.9 236 28.5
700 16.3 1.8 2.7 13.4 54 44.8
680 17.8 1.9 2.6 14.8 -23 50.3
T i −1023B
780 11.9
0
2.3 3.1
≈ 0
11.4 151 10.9
750 12.8 2.4 3.1 12.6 89 18.4
700 14.9 2.9 2.9 15.6 -65 31.8
680 16.0 3.1 2.9 16.9 -135 37.2
3.3. Analysis and discussion of simulation results 21
3.3.1. Comparison of the simulation results
Comparing the simulation results from Thermo-Calc® TCW™ v.5 with the results from
Thermo-Calc® v.3.1, it is obvious that the two versions have different interpretation of the
accumulation and also the dissipation of β- and α-stabilizers.
Specifically, as for the in-situ composition of the β phase, in Thermo-Calc® v.3.1, ap-
proximately 1w t% more vanadium can be found in β phase for the three metastable β
alloys at the same annealing temperature in comparison with Thermo-Calc® TCW™ v.5.
Around 0.3w t% less chromium is shown in v.3.1 than TCW™ v.5 in the case of T i −102Cr 3,
whereas roughly 0.25w t% and 0.45w t% more iron are presented in v.3.1 than TCW™ v.5 in
the cases of T i −1013 and T i −1023B , respectively. On the other hand, for the α-stabilizer,
an approximately 2w t% more aluminum can be found in v.3.1 than TCW™ v.5.
3.3.2. Effects of the redistribution of solute elements
Furthermore, it can be seen from both Table 3.2 and Table 3.1 that the lower the anneal-
ing temperature in α+β two-phase region, the more the vanadium, iron and chromium
– β-stabilizers – accumulated in the β phase, and the more the aluminum – α-stabilizer –
dissipated from the β phase as a result of the solute partitioning effect. This corresponds
well with the EPMA results of Neelakantan et al. [5] and Li et al. [32].
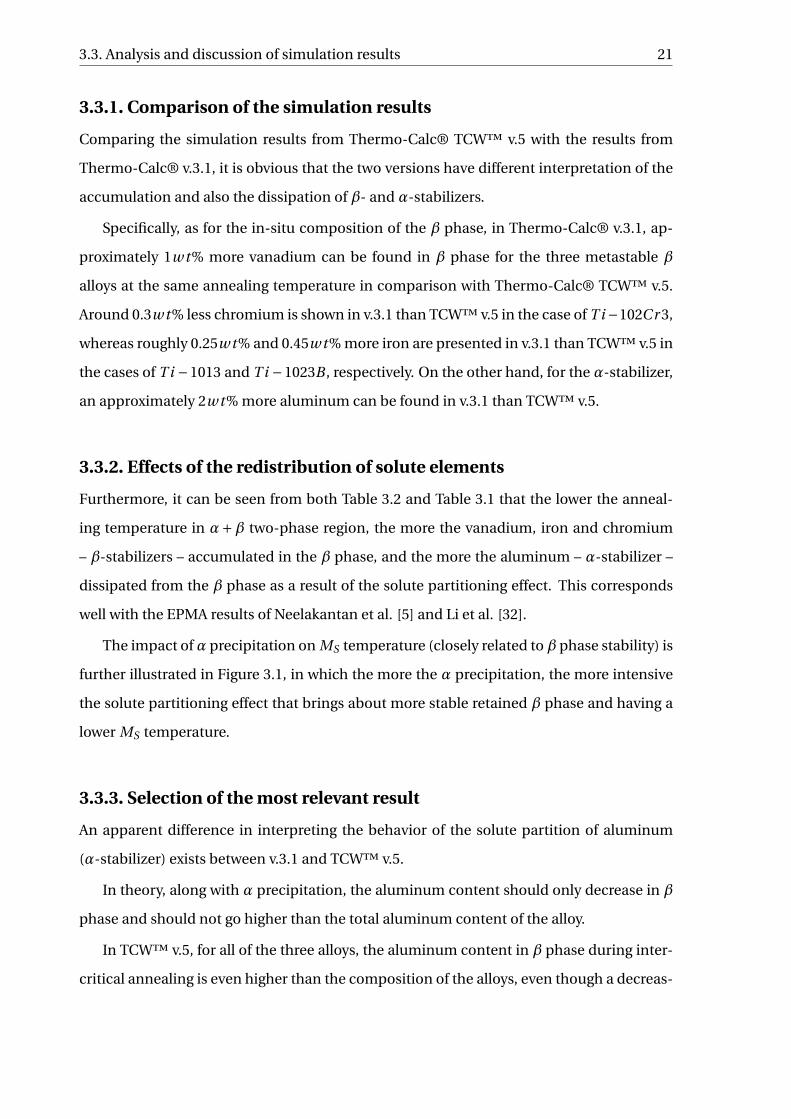
The impact ofα precipitation on MS temperature (closely related to β phase stability) is
further illustrated in Figure 3.1, in which the more the α precipitation, the more intensive
the solute partitioning effect that brings about more stable retained β phase and having a
lower MS temperature.
3.3.3. Selection of the most relevant result
An apparent difference in interpreting the behavior of the solute partition of aluminum
(α-stabilizer) exists between v.3.1 and TCW™ v.5.
In theory, along with α precipitation, the aluminum content should only decrease in β
phase and should not go higher than the total aluminum content of the alloy.
In TCW™ v.5, for all of the three alloys, the aluminum content in β phase during inter-
critical annealing is even higher than the composition of the alloys, even though a decreas-
22 3. Thermo-Calc® Simulation
Figure 3.1: Comparison between α volume fraction and calculated MS temperature from the in-situ β phase
composition, on the basis of the simulation results from Thermo-Calc® v.3.1.
ing trend of aluminum content can be seen along with the lowering intercritical annealing
temperature.
In contrast, the aluminum content in β phase from v.3.1 is lower than the composition
of the alloys; and the increasingly intensifying aluminum dissipation fromβ phase with the
lowering intercritical annealing temperature is also embodied.
Therefore, the simulation done by Thermo-Calc® v.3.1 is more convincing, and the sub-
sequent work regarding heat treatment scheme design is constructed upon the results of
Thermo-Calc® v.3.1.

4Heat Treatment and Metallography
In this chapter, heat treatment schemes are designed and carried out to tune the stability
of β phase for the three metastable β alloys; metallographic preparation and examination
are performed to examine the effectiveness of designed heat treatment schemes.
4.1. Heat treatment design processThe main objective of heat treatment is to tune the microstructure of the alloys to such an
extent that enough β phase can be secured at room temperature. Meanwhile, the β phase
stability and also the MS temperature of the alloys can be effectively tailored.
4.1.1. Selection of heat treatment scheme
In this work, β+ (α+β) heat treatment is selected as the initial solution treatment in the
β single-phase region is able to remove the original α precipitates and martensites com-
pletely. Therefore, the influence of original microstructure and previous heat treatment
can be effectively offset or minimized. Further, 15 minutes holding time in the β single
phase is found to be enough to solutionize the alloy according to previous work [19][32].
when annealing in α+β two-phase region, acicular α phase is expected to precipitate,
and acicular α′ and/or α′′ martensite is also expected to form during quenching [19]. Suf-
23
24 4. Heat Treatment and Metallography
ficiently long annealing in the two-phase region should ensure a completed solute parti-
tioning process (i.e. the accumulation of β-stabilizers and the dissipation of α-stabilizers)
and thus a stabilized β phase.
4.1.2. Selection of annealing temperature
Stated in Section 3.3, the simulation results of Thermo-Calc® v.3.1 is chosen to be referred
to. As it is practically unavoidable that martensite will form during quenching to room tem-
perature from the two-phase region [5][42], it would be more advisable to select annealing
temperatures that will lead to not too muchαphase precipitation in order to secure enough
β phase for further transformation.
On the other hand, both α′ and α′′ martensites in β titanium alloys are supersaturated
with solute elements [8]. This can be easily understood that kinetically, there is no time for
martensitic transformation to proceed with solute partitioning process during quenching.
As a consequence, the martensitic transformation will not affect the stability of retained β
phase, but it will consume the total amount of retained β phase. Therefore, higher anneal-
ing temperatures are preferred because of less α precipitation (shown in Table 3.2).
However, from previous work, a discrepancy is found between experiment and the sim-
ulation. Specifically, as for T i −102Cr 3, reported by Li et al. [19], holding at 700◦C for an
hour leads to α phase of 78% volume fraction. In comparison with the simulation results
in Table 3.2, regardless of the big difference between α volume fractions and suppose the
prediction of MS temperature is close to the real case, quenching to room temperature will
only lead to a small amount of retained β phase left, which would not be appropriate for
further transformation. Likewise, for T i−1013, annealing 30 minutes at 750◦C leads to 42%
α phase, let alone such an annealing time falling far short of what is required by reaching
the equilibrium state where more α phase is expected to precipitate. Last but not least,
according to the work done by S. Neelakantan [5], only 29.7% β phase was retained, even
though the alloy was annealed at 700◦C for mere 15 minutes after solution treatment in β
single-phase region.
A higher annealing temperature in the two-phase region implies less stable β phase
because of less α precipitation. As a result, it becomes a crucial task to choose an effective
annealing temperature that is optimal for further martensitic transformation.
4.2. Heat treatment experiments 25
Given the β-transus of the three alloys in Table 2.1 and having considered the trade-
off mentioned above, 780◦C was selected as the annealing temperature in the two-phase
region in order to securing enough β phase at room temperature for further transforma-
tion.
4.2. Heat treatment experiments
Table 4.1 summarizes the heat treatment schemes applied to the three novel metastable β
titanium alloys. Experiments were done in a Nabertherm burn-Off furnace (model LV5).
A special air intake and exhaust system is present that allows the application of inert at-
mosphere or shielding gas. Moreover, the incoming gas is preheated before entering the
interior of the furnace. Thus, a good temperature uniformity is ensured.
Argon gas is applied in this work as inert atmosphere to mitigate the issue of oxidation.
The heating rate from room temperature to 900◦C was approximately 15◦C mi n−1. The
cooling mode between 900◦C and 780◦C is natural furnace cooling. When the annealing
treatment in α+β two-phase region was done, samples were immediately quenched in
water at room temperature with very fast cooling rates (order of magnitude: 102 ◦C s−1
[43]).
Despite the application of inert atmosphere, oxidation cannot be absolutely avoided.
Yet the situation of oxidation is still much better than applying no shielding gas. For in-
stance, on average, a 0.458µm oxide layer is formed for the case of T i − 102Cr 3 going
through 900◦C/15mi n + 780◦C/2.5h followed by water quenching.
4.3. Methods for metallographic specimen preparation and ex-
amination
Being aware of the existence of SIM effect, the methodologies designed specifically in order
to examine the microstructure of the samples was applied.
26 4. Heat Treatment and Metallography
Table 4.1: The applied heat treatment schemes for T i −102Cr 3, T i −1013 and T i −1023B alloys; WQ stands
for water quenching.
Metastable β alloys Heat treatment schemes
Ti-10V-1Fe-3Al (T i −1013)
900◦C/15mi n + WQ
900◦C/15mi n + 780◦C/15mi n + WQ
900◦C/15mi n + 780◦C/30mi n + WQ
900◦C/15mi n + 780◦C/2h + WQ
780◦C/2h + WQ
Ti-10V-2Cr-3Al (T i −102Cr 3)
900◦C/15mi n + WQ
900◦C/15mi n + 780◦C/15mi n + WQ
900◦C/15mi n + 780◦C/30mi n + WQ
900◦C/15mi n + 780◦C/2.5h + WQ
900◦C/15mi n + 780◦C/8h + WQ
900◦C/15mi n + 780◦C/24h + WQ
780◦C/2.5h + WQ
Ti-10V-2Fe-3Al-B (T i −1023B)
900◦C/15mi n + WQ
900◦C/15mi n + 780◦C/15mi n + WQ
900◦C/15mi n + 780◦C/30mi n + WQ
900◦C/15mi n + 780◦C/2h + WQ
4.3.1. Electropolishing
To avoid retainedβ phase transforming to martensite during normal mechanical polishing,
electropolishing was utilized instead. The electropolishing solution is made up of 36mL
perchloric acid, 390mL methanol, 350mL ethylene glycol and 24mL distilled water. The
instrument used was the Struers electropol setup. Samples were electropolished for 30s at
a voltage of 45V with flow rate of 16 by using the mask of 0.5cm2 at a constant temperature
of 5◦C.
4.3.2. Etching
To better reveal microstructural features, the Standard Kroll’s reagent – 3mL HF, 6mL HNO3
and 100mL distilled water – was used as etchant.

4.4. Results and discussion 27
4.3.3. Optical microscopy
Olympus® BX60M microscope was used to observe the microstructure of heat-treated sam-
ples, which was also used to take metallographic images for further analysis.
4.3.4. Metallographic image processing
Metallographic images were processes by using Adobe Photoshop in combination with Im-
ageJ software for the purpose of calculating the volume fraction of different phases. The
results to be presented were determined by taking the average of processing five metallo-
graphic images (different areas of the same sample) for each sample.
4.4. Results and discussion
4.4.1. Quenching from β single-phase region
Theoretically, the most unstable β phase is obtained when quenching the alloy directly
from the β single-phase region. At the single-phase region, the composition of β phase is
the same as the composition of the alloy, so that, without the β-stabilizers’ accumulation
and the α-stabilizers’ dissipation, the least stable β is obtained.
From Figure 4.1, it is obvious that a huge amount of acicular martensite forms inside
the β grains for both T i −1013 and T i −102Cr 3, and the high density of martensite can be
more clearly seen from Figure 4.1(b).
However, as can be seen from Figure 4.1(d), for T i −1023B , no martensite in any mor-
phology is observed. This implies that even at the most unstable situation, β phase is still
stable enough to refrain from martensitic transformation upon quenching to room tem-
perature. In other words, the β phase of T i − 1023B is stable enough that makes the MS
temperature below room temperature. This also indicates that no matter how this alloy
is annealed in α+β two-phase region, martensite will not form upon quenching to room
temperature, as annealing in two-phase region will only make β phase more stable.

28 4. Heat Treatment and Metallography
(a) T i −102Cr 3 (b) T i −102Cr 3
(c) T i −1013 (d) T i −1023B
Figure 4.1: The microstructure of 900◦C/15mi n followed by water quenching to room temperature for T i −1013, T i −102Cr 3 and T i −1023B .
4.4.2. Annealing for reaching equilibrium state
Stated in Section 4.1.2, the annealing temperature in α+β two-phase region has been cho-
sen as 780◦C. Several annealing times in the two-phase region of β+ (α+β) heat treatment
were applied as specified in Table 4.1. The results are shown in Figure 4.2, 4.3 and 4.4.
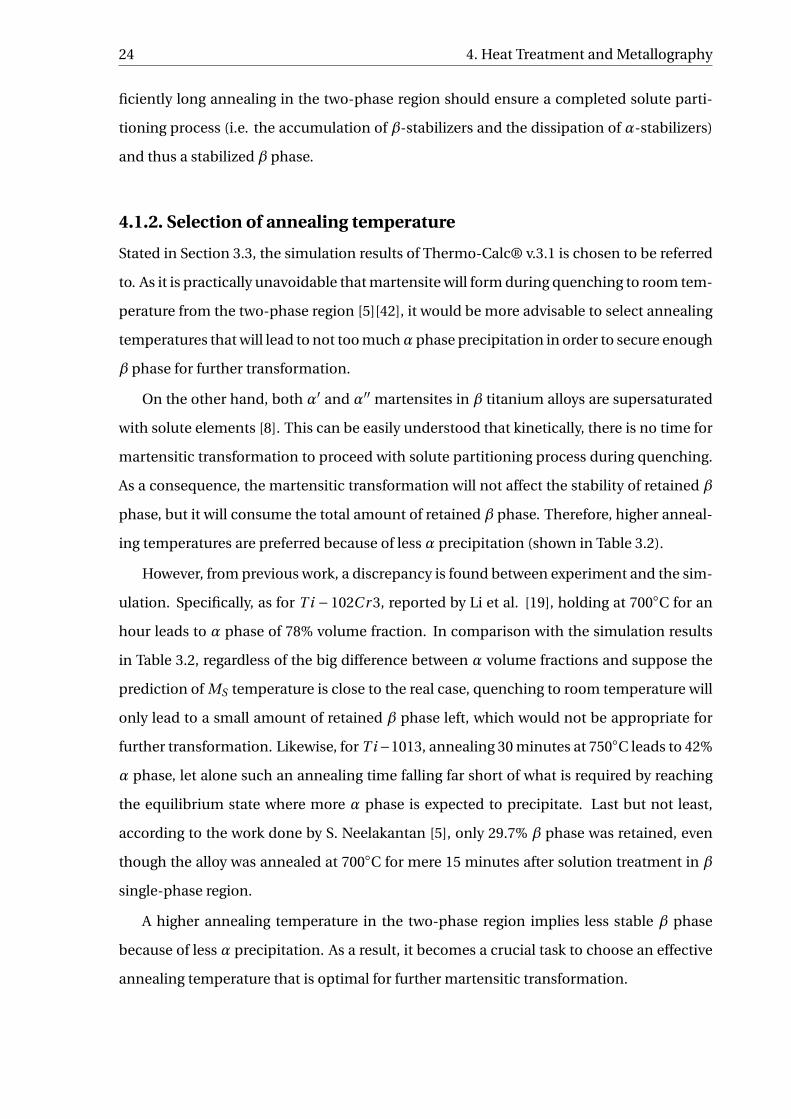
It is clear from the result of T i − 1013 in Figure 4.2 that with increasing holding time
in the α+β two-phase region, less acicular phase was obtained after quenching to room
temperature, and apparently more β phase was retained (shown in Figure 4.2(d)). The ex-
cessive amount of acicular phase is believed to be martensite (α′ and/or α′′), as the max-
imum amount of α phase precipitated while holding 15 minutes at 780◦C must be lower
4.4. Results and discussion 29
(a) 900◦C/15mi n + 780◦C/15mi n + WQ (b) 900◦C/15mi n + 780◦C/15mi n + WQ
(c) 900◦C/15mi n + 780◦C/30mi n + WQ (d) 900◦C/15mi n + 780◦C/2h + WQ
Figure 4.2: The microstructure of T i −1013 going through β+ (α+β) heat treatment with different annealing
time in the α+β two-phase region.
than the case of annealing 2 hours at the same temperature, which is formed instantly dur-
ing quenching but the α phase, in comparison, needs a lot more time to precipitate. This
phenomenon, in effect, verifies the importance of realizing the equilibrium state.
Otherwise, with shorter annealing in the two-phase region, the α phase precipitation
process is far from complete. As a result, less α phase is formed, and the expected solute
partitioning process for β-stabilizers and α-stabilizers is halted at a primary stage. There-
fore, a shorter annealing does not stabilize theβphase, and more acicular martensite forms
during quenching from retained β phase. The amount of retained β phase after quenching
is minor, which can indeed be observed in Figure 4.2(a).
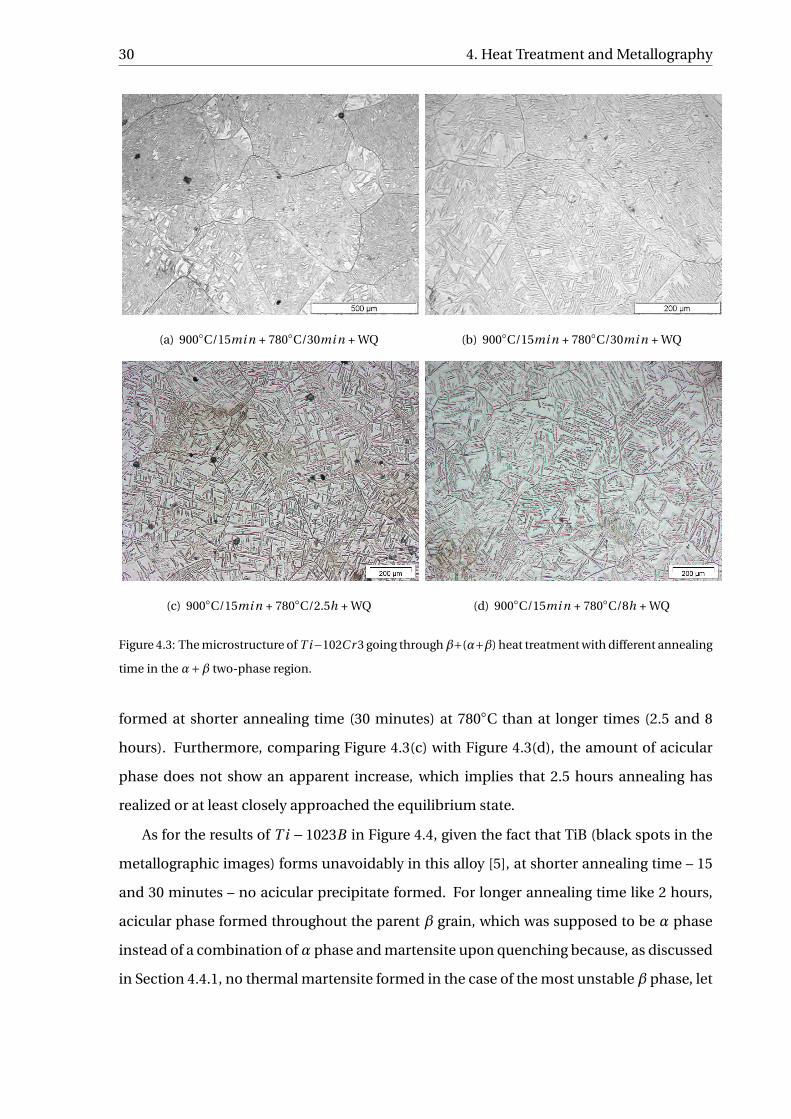
Likewise, in the case of T i −102Cr 3 given in Figure 4.3, obviously more acicular phase
30 4. Heat Treatment and Metallography
(a) 900◦C/15mi n + 780◦C/30mi n + WQ (b) 900◦C/15mi n + 780◦C/30mi n + WQ
(c) 900◦C/15mi n + 780◦C/2.5h + WQ (d) 900◦C/15mi n + 780◦C/8h + WQ
Figure 4.3: The microstructure of T i−102Cr 3 going throughβ+(α+β) heat treatment with different annealing
time in the α+β two-phase region.
formed at shorter annealing time (30 minutes) at 780◦C than at longer times (2.5 and 8
hours). Furthermore, comparing Figure 4.3(c) with Figure 4.3(d), the amount of acicular
phase does not show an apparent increase, which implies that 2.5 hours annealing has
realized or at least closely approached the equilibrium state.
As for the results of T i −1023B in Figure 4.4, given the fact that TiB (black spots in the
metallographic images) forms unavoidably in this alloy [5], at shorter annealing time – 15
and 30 minutes – no acicular precipitate formed. For longer annealing time like 2 hours,
acicular phase formed throughout the parent β grain, which was supposed to be α phase
instead of a combination ofα phase and martensite upon quenching because, as discussed
in Section 4.4.1, no thermal martensite formed in the case of the most unstable β phase, let
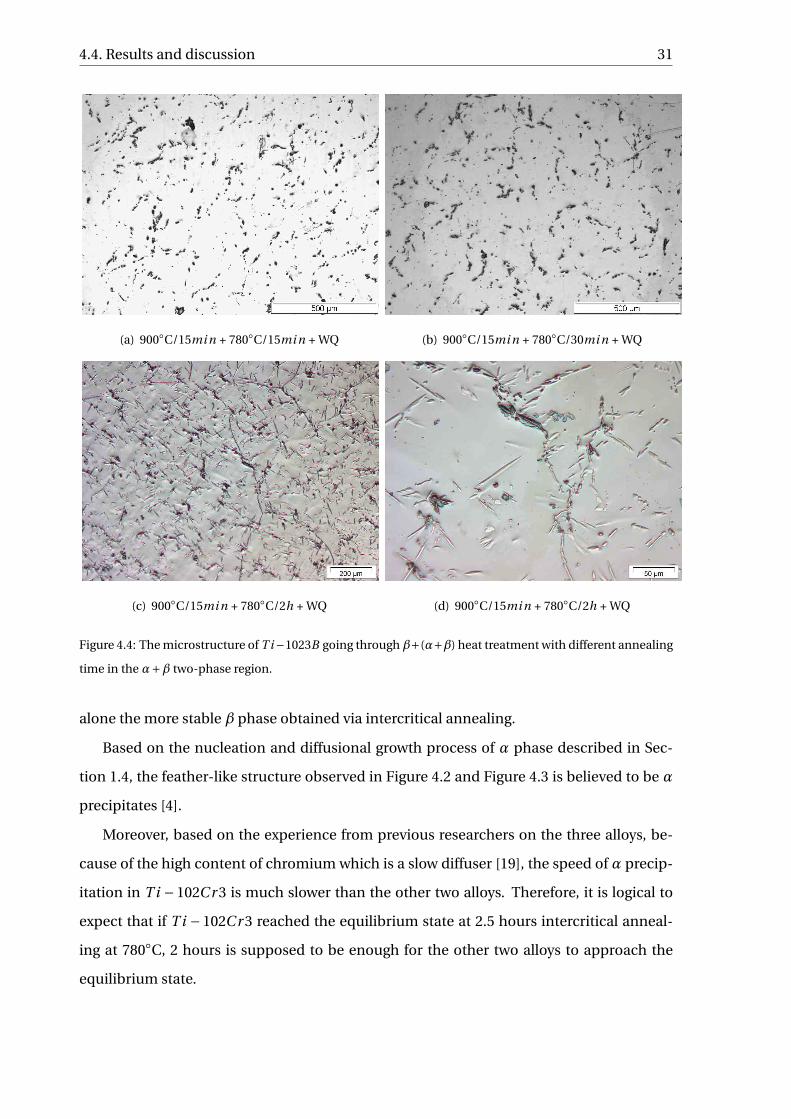
4.4. Results and discussion 31
(a) 900◦C/15mi n + 780◦C/15mi n + WQ (b) 900◦C/15mi n + 780◦C/30mi n + WQ
(c) 900◦C/15mi n + 780◦C/2h + WQ (d) 900◦C/15mi n + 780◦C/2h + WQ
Figure 4.4: The microstructure of T i−1023B going throughβ+(α+β) heat treatment with different annealing
time in the α+β two-phase region.
alone the more stable β phase obtained via intercritical annealing.
Based on the nucleation and diffusional growth process of α phase described in Sec-
tion 1.4, the feather-like structure observed in Figure 4.2 and Figure 4.3 is believed to be α
precipitates [4].
Moreover, based on the experience from previous researchers on the three alloys, be-
cause of the high content of chromium which is a slow diffuser [19], the speed of α precip-
itation in T i −102Cr 3 is much slower than the other two alloys. Therefore, it is logical to
expect that if T i −102Cr 3 reached the equilibrium state at 2.5 hours intercritical anneal-
ing at 780◦C, 2 hours is supposed to be enough for the other two alloys to approach the
equilibrium state.
32 4. Heat Treatment and Metallography
On the other hand, Van Bohemen et al. [44] reported a delayed solute partition dur-
ing the course of α precipitation exists in β titanium alloys. Taking this phenomenon into
account, there could be a difference in the amount of martensite (represented by the total
amount of acicular phase formed after quenching) between 2 and 8 hours annealing. How-
ever, from Figure 4.3(c) and 4.3(d), no obvious difference was observed. Thus, the delayed
solute partition issue does not apply to the current alloys.
Further, as reported by Li et al. [32], solute partitioning was observed in Ti-10V-2Fe-3Al
alloy both at heat treatment 750◦C/60mi n and 900◦C/15mi n + 700◦C/20mi n by means
of EPMA. Neelakantan observed similar effect on the same alloy under heat treatment
700◦C/15mi n and 900◦C/15mi n + 650◦C/15mi n [5]. Kinetically, the speed of solute parti-
tion while annealing at 780◦C is faster than 750◦C and 650◦C. Therefore, one can conclude
that the designed heat treatment condition leads to effective solute partition.
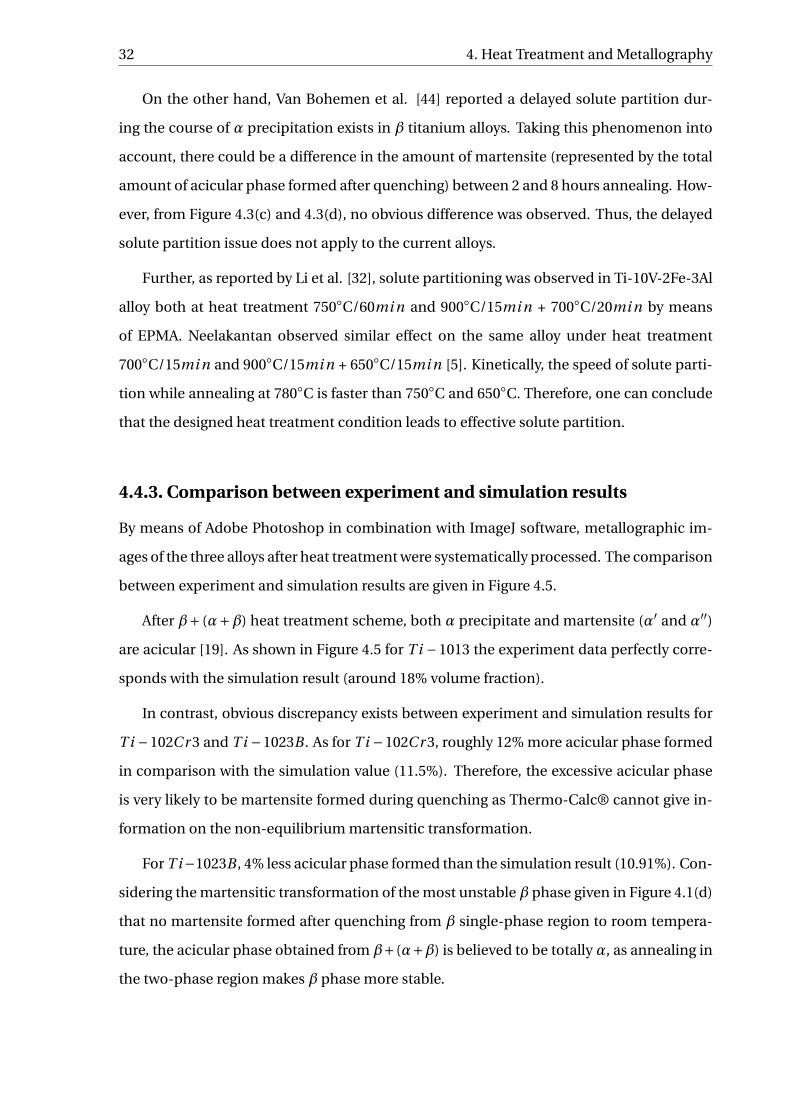
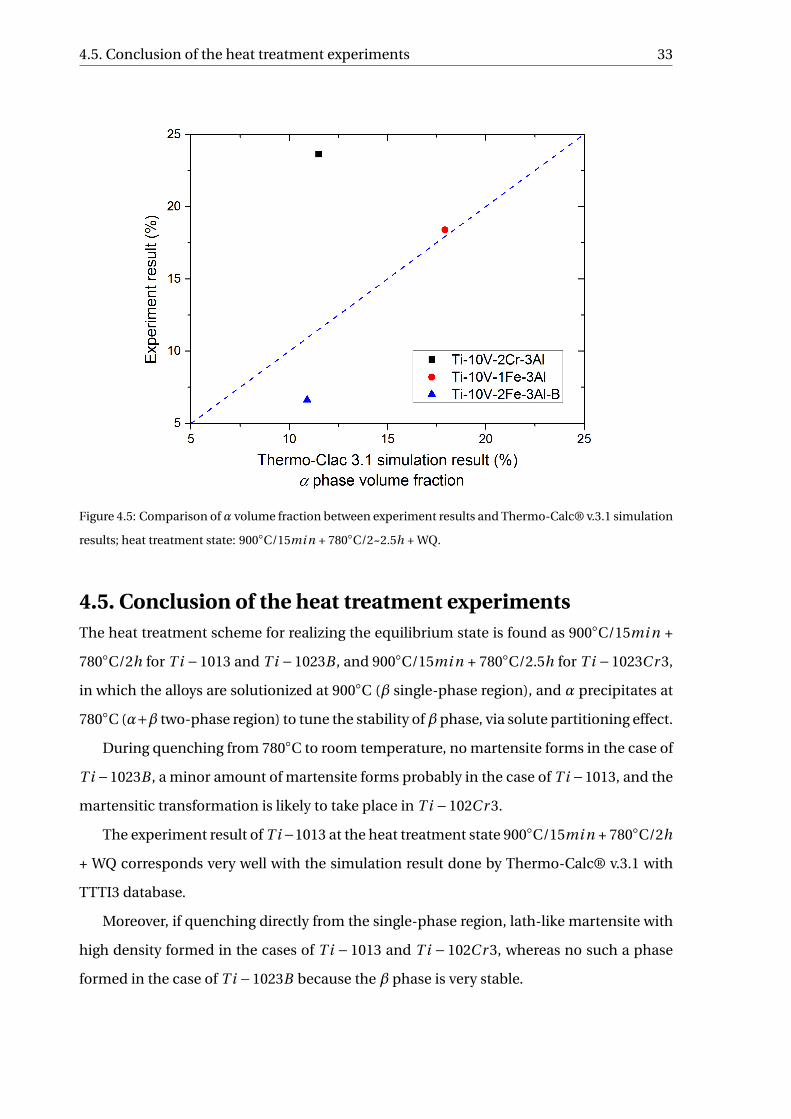
4.4.3. Comparison between experiment and simulation results
By means of Adobe Photoshop in combination with ImageJ software, metallographic im-
ages of the three alloys after heat treatment were systematically processed. The comparison
between experiment and simulation results are given in Figure 4.5.
After β+ (α+β) heat treatment scheme, both α precipitate and martensite (α′ and α′′)
are acicular [19]. As shown in Figure 4.5 for T i −1013 the experiment data perfectly corre-
sponds with the simulation result (around 18% volume fraction).
In contrast, obvious discrepancy exists between experiment and simulation results for
T i −102Cr 3 and T i −1023B . As for T i −102Cr 3, roughly 12% more acicular phase formed
in comparison with the simulation value (11.5%). Therefore, the excessive acicular phase
is very likely to be martensite formed during quenching as Thermo-Calc® cannot give in-
formation on the non-equilibrium martensitic transformation.
For T i−1023B , 4% less acicular phase formed than the simulation result (10.91%). Con-
sidering the martensitic transformation of the most unstable β phase given in Figure 4.1(d)
that no martensite formed after quenching from β single-phase region to room tempera-
ture, the acicular phase obtained from β+(α+β) is believed to be totally α, as annealing in
the two-phase region makes β phase more stable.
4.5. Conclusion of the heat treatment experiments 33
Figure 4.5: Comparison ofα volume fraction between experiment results and Thermo-Calc® v.3.1 simulation
results; heat treatment state: 900◦C/15mi n + 780◦C/2~2.5h + WQ.
4.5. Conclusion of the heat treatment experimentsThe heat treatment scheme for realizing the equilibrium state is found as 900◦C/15mi n +
780◦C/2h for T i −1013 and T i −1023B , and 900◦C/15mi n + 780◦C/2.5h for T i −1023Cr 3,
in which the alloys are solutionized at 900◦C (β single-phase region), and α precipitates at
780◦C (α+β two-phase region) to tune the stability ofβ phase, via solute partitioning effect.
During quenching from 780◦C to room temperature, no martensite forms in the case of
T i −1023B , a minor amount of martensite forms probably in the case of T i −1013, and the
martensitic transformation is likely to take place in T i −102Cr 3.
The experiment result of T i−1013 at the heat treatment state 900◦C/15mi n + 780◦C/2h
+ WQ corresponds very well with the simulation result done by Thermo-Calc® v.3.1 with
TTTI3 database.
Moreover, if quenching directly from the single-phase region, lath-like martensite with
high density formed in the cases of T i −1013 and T i −102Cr 3, whereas no such a phase
formed in the case of T i −1023B because the β phase is very stable.

5Low-Temperature Martensitic
Transformation
The phenomenon of low-temperature martensitic transformation for the three alloys – T i−1013, T i −102Cr 3 and T i −1023B – is systematically studied by using linear cooling (in a
DSC) and isothermal cooling.
5.1. In-situ method via Differential Scanning CalorimetryDifferential Scanning Calorimetry (DSC) was employed in this study to try to follow and
monitor the low-temperature martensitic transformation in the three alloys during contin-
uous cooling condition.
5.1.1. Reason of choosing DSC
To detect and thus investigate the behavior of low-temperature martensitic transforma-
tion of the three alloys in an in-situ way – i.e. where the transformation of the alloys going
through designed heat-treatment starts taking place – DSC and dilatometry are the two
potential candidates. Dilatometry is to measure the volume change during phase transfor-
mation, while DSC is to detect the change of the amount of heat required to increase the
temperature of the alloy and the reference.
35
36 5. Low-Temperature Martensitic Transformation
Previous research showed that dilatometry could not catch the signal of martensitic
transformation during quenching [5][19], whereas DSC has been explored to induce and
investigate the martensitic transformation in an in-situ manner [45][46].
5.1.2. Sample preparation for DSC
Required by the DSC sample pan and the instrument itself, the heat-treated samples of
the three alloys were machined into thin disk with 4mm diameter and 0.3mm thickness
through Electrical Discharge Machining (EDM). The EDM was applied after the heat treat-
ment processes was done and the oxide layer was carefully removed mechanically.
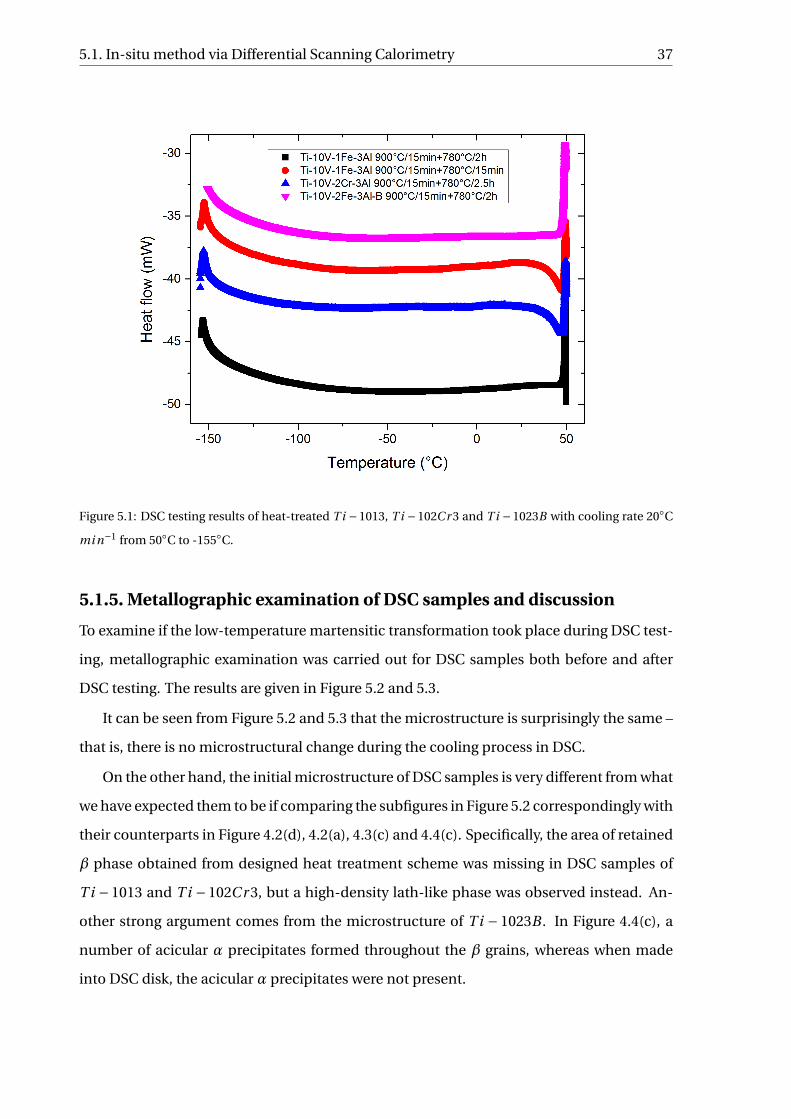
5.1.3. DSC testing and results
PerkinElmer® DSC 8000 Advanced Double-Furnace Differential Scanning Calorimeter was
utilized. The results is summarized in Figure 5.1. The programming of DSC cooling is:
firstly heating the sample to 50◦C and then cooling it to -155◦C with a cooling rate of 20◦C
mi n−1. This cooling rate is chosen because the instrument may not be able to catch up
with the phase transformation signal at very fast cooling rate, and the disturbance of noise
– e.g. moisture – may be intensive at very slow cooling rate that would cover up the possible
peak of low-temperature martensitic transformation.
The heat treatment states of DSC samples of the three metastableβ alloys is the equilib-
rium state of β+ (α+β) heat treatment – i.e. 900◦C/15mi n + 780◦C/2h~2.5h + WQ. More-
over, to examine the low-temperature behavior of the sample at non-equilibrium state, the
T i −1013 sample going through 900◦C/15mi n + 780◦C/15mi n + WQ was also tested.
5.1.4. Discussion of DSC results
From Figure 5.1, the region between 50◦C and -155◦C is rather smooth, except the two un-
expected peaks near inverse peak the starting point for T i −1013 at non-equilibrium heat
treatment state and T i−102Cr 3 at equilibrium heat treatment state which is because of the
programming of the instrument itself. In other words, no peak regarding low-temperature
martensitic transformation was observed.
5.1. In-situ method via Differential Scanning Calorimetry 37
Figure 5.1: DSC testing results of heat-treated T i −1013, T i −102Cr 3 and T i −1023B with cooling rate 20◦C
mi n−1 from 50◦C to -155◦C.
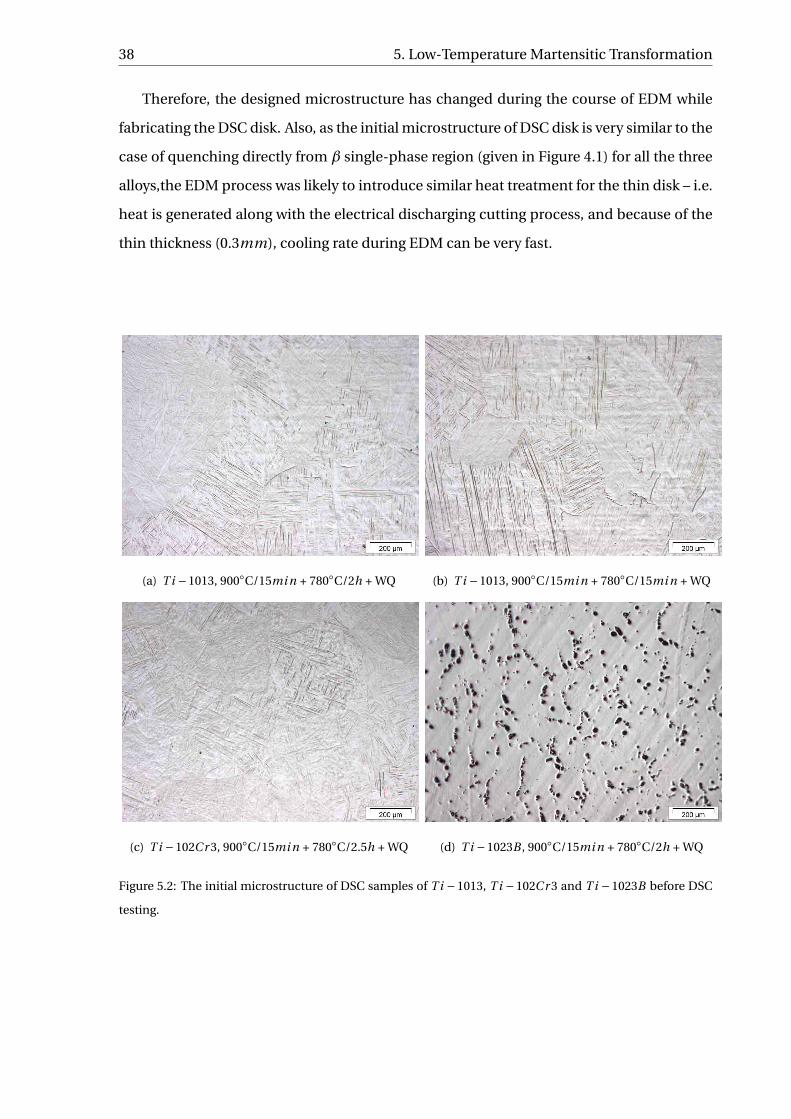
5.1.5. Metallographic examination of DSC samples and discussion
To examine if the low-temperature martensitic transformation took place during DSC test-
ing, metallographic examination was carried out for DSC samples both before and after
DSC testing. The results are given in Figure 5.2 and 5.3.
It can be seen from Figure 5.2 and 5.3 that the microstructure is surprisingly the same –
that is, there is no microstructural change during the cooling process in DSC.
On the other hand, the initial microstructure of DSC samples is very different from what
we have expected them to be if comparing the subfigures in Figure 5.2 correspondingly with
their counterparts in Figure 4.2(d), 4.2(a), 4.3(c) and 4.4(c). Specifically, the area of retained
β phase obtained from designed heat treatment scheme was missing in DSC samples of
T i −1013 and T i −102Cr 3, but a high-density lath-like phase was observed instead. An-
other strong argument comes from the microstructure of T i − 1023B . In Figure 4.4(c), a
number of acicular α precipitates formed throughout the β grains, whereas when made
into DSC disk, the acicular α precipitates were not present.
38 5. Low-Temperature Martensitic Transformation
Therefore, the designed microstructure has changed during the course of EDM while
fabricating the DSC disk. Also, as the initial microstructure of DSC disk is very similar to the
case of quenching directly from β single-phase region (given in Figure 4.1) for all the three
alloys,the EDM process was likely to introduce similar heat treatment for the thin disk – i.e.
heat is generated along with the electrical discharging cutting process, and because of the
thin thickness (0.3mm), cooling rate during EDM can be very fast.
(a) T i −1013, 900◦C/15mi n + 780◦C/2h + WQ (b) T i −1013, 900◦C/15mi n + 780◦C/15mi n + WQ
(c) T i −102Cr 3, 900◦C/15mi n + 780◦C/2.5h + WQ (d) T i −1023B , 900◦C/15mi n + 780◦C/2h + WQ
Figure 5.2: The initial microstructure of DSC samples of T i −1013, T i −102Cr 3 and T i −1023B before DSC
testing.
5.1. In-situ method via Differential Scanning Calorimetry 39
(a) T i −1013, 900◦C/15mi n + 780◦C/2h + WQ (b) T i −1013, 900◦C/15mi n + 780◦C/15mi n + WQ
(c) T i −102Cr 3, 900◦C/15mi n + 780◦C/2.5h + WQ (d) T i −1023B , 900◦C/15mi n + 780◦C/2h + WQ
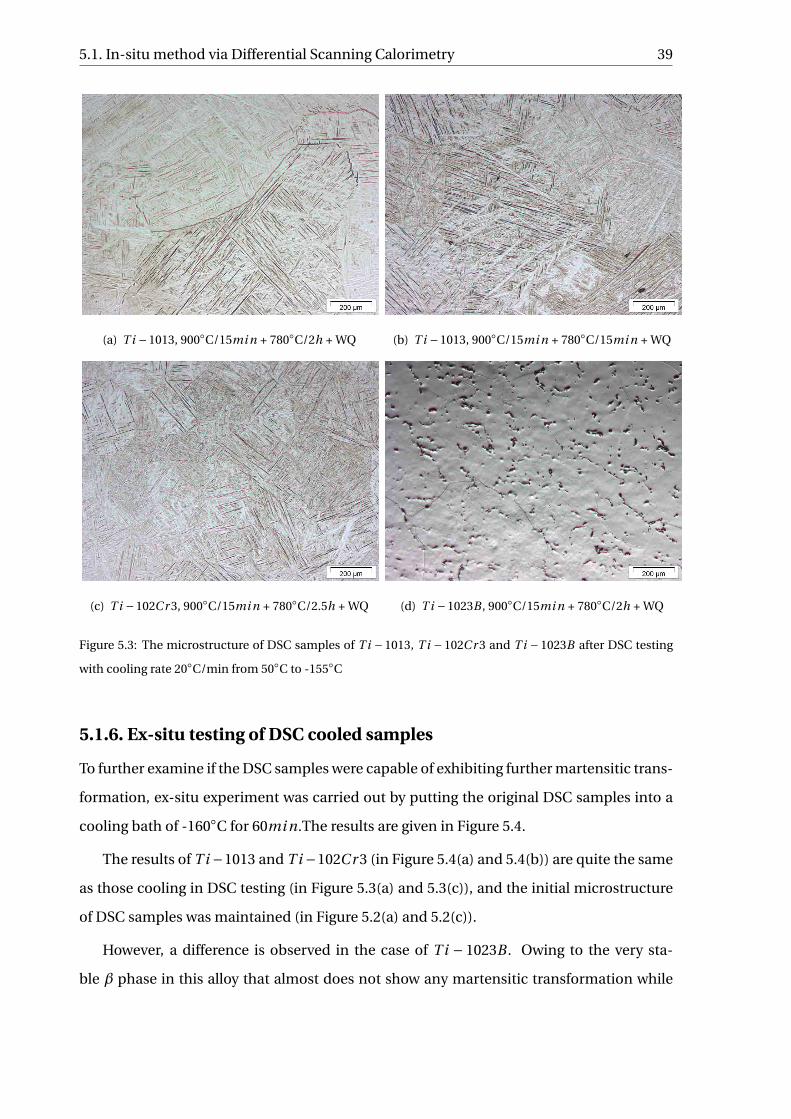
Figure 5.3: The microstructure of DSC samples of T i −1013, T i −102Cr 3 and T i −1023B after DSC testing
with cooling rate 20◦C/min from 50◦C to -155◦C
5.1.6. Ex-situ testing of DSC cooled samples
To further examine if the DSC samples were capable of exhibiting further martensitic trans-
formation, ex-situ experiment was carried out by putting the original DSC samples into a
cooling bath of -160◦C for 60mi n.The results are given in Figure 5.4.
The results of T i −1013 and T i −102Cr 3 (in Figure 5.4(a) and 5.4(b)) are quite the same
as those cooling in DSC testing (in Figure 5.3(a) and 5.3(c)), and the initial microstructure
of DSC samples was maintained (in Figure 5.2(a) and 5.2(c)).
However, a difference is observed in the case of T i − 1023B . Owing to the very sta-
ble β phase in this alloy that almost does not show any martensitic transformation while
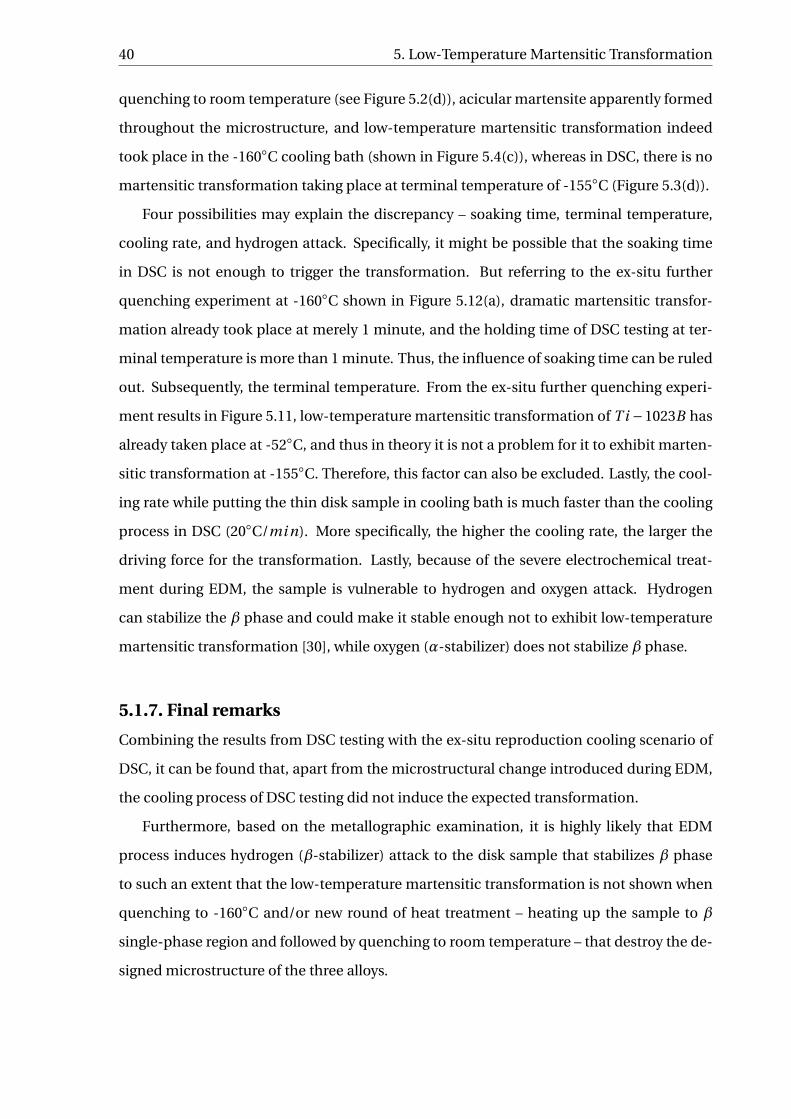
40 5. Low-Temperature Martensitic Transformation
quenching to room temperature (see Figure 5.2(d)), acicular martensite apparently formed
throughout the microstructure, and low-temperature martensitic transformation indeed
took place in the -160◦C cooling bath (shown in Figure 5.4(c)), whereas in DSC, there is no
martensitic transformation taking place at terminal temperature of -155◦C (Figure 5.3(d)).
Four possibilities may explain the discrepancy – soaking time, terminal temperature,
cooling rate, and hydrogen attack. Specifically, it might be possible that the soaking time
in DSC is not enough to trigger the transformation. But referring to the ex-situ further
quenching experiment at -160◦C shown in Figure 5.12(a), dramatic martensitic transfor-
mation already took place at merely 1 minute, and the holding time of DSC testing at ter-
minal temperature is more than 1 minute. Thus, the influence of soaking time can be ruled
out. Subsequently, the terminal temperature. From the ex-situ further quenching experi-
ment results in Figure 5.11, low-temperature martensitic transformation of T i −1023B has
already taken place at -52◦C, and thus in theory it is not a problem for it to exhibit marten-
sitic transformation at -155◦C. Therefore, this factor can also be excluded. Lastly, the cool-
ing rate while putting the thin disk sample in cooling bath is much faster than the cooling
process in DSC (20◦C/mi n). More specifically, the higher the cooling rate, the larger the
driving force for the transformation. Lastly, because of the severe electrochemical treat-
ment during EDM, the sample is vulnerable to hydrogen and oxygen attack. Hydrogen
can stabilize the β phase and could make it stable enough not to exhibit low-temperature
martensitic transformation [30], while oxygen (α-stabilizer) does not stabilize β phase.
5.1.7. Final remarks
Combining the results from DSC testing with the ex-situ reproduction cooling scenario of
DSC, it can be found that, apart from the microstructural change introduced during EDM,
the cooling process of DSC testing did not induce the expected transformation.
Furthermore, based on the metallographic examination, it is highly likely that EDM
process induces hydrogen (β-stabilizer) attack to the disk sample that stabilizes β phase
to such an extent that the low-temperature martensitic transformation is not shown when
quenching to -160◦C and/or new round of heat treatment – heating up the sample to β
single-phase region and followed by quenching to room temperature – that destroy the de-
signed microstructure of the three alloys.
5.1. In-situ method via Differential Scanning Calorimetry 41
(a) T i −1013, 900◦C/15mi n + 780◦C/2h + WQ (b) T i −102Cr 3, 900◦C/15mi n + 780◦C/2.5h + WQ
(c) T i −1023B , 900◦C/15mi n + 780◦C/2h + WQ (d) T i −1023B , 900◦C/15mi n + 780◦C/2h + WQ
Figure 5.4: The microstructure of DSC samples of T i − 1013, T i − 102Cr 3 and T i − 1023B after soaking in
-160◦C cooling bath for 60mi n.
42 5. Low-Temperature Martensitic Transformation
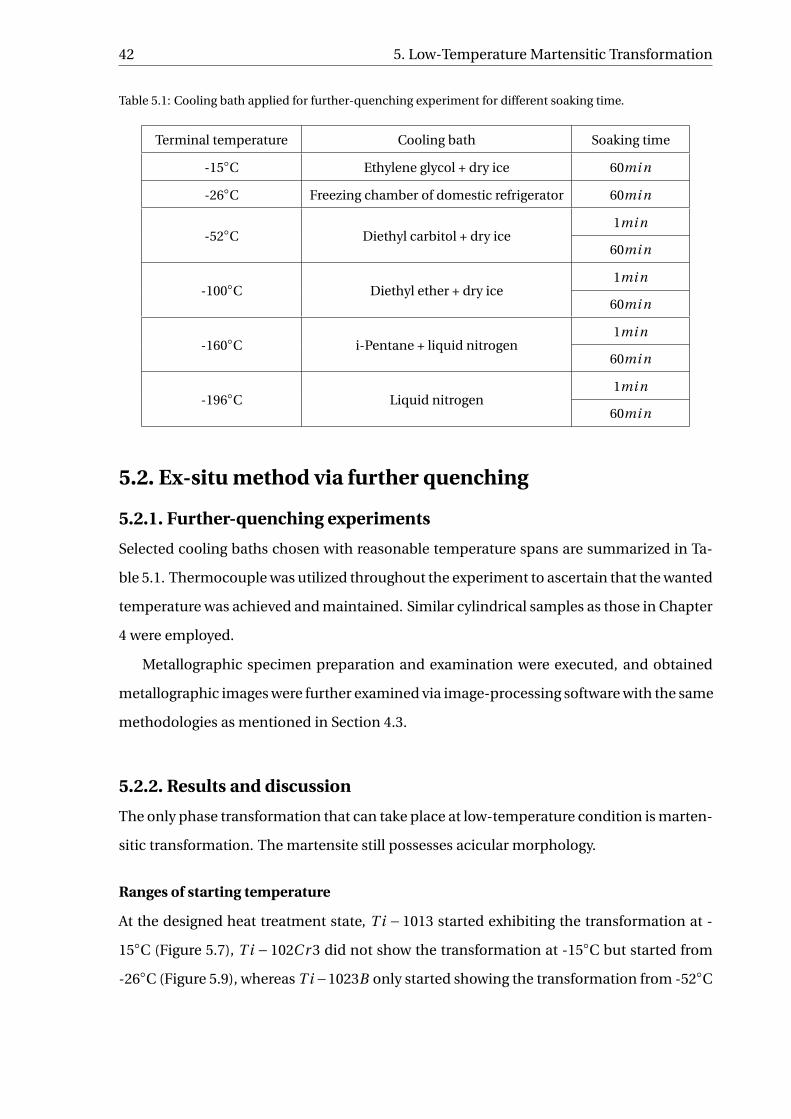
Table 5.1: Cooling bath applied for further-quenching experiment for different soaking time.
Terminal temperature Cooling bath Soaking time
-15◦C Ethylene glycol + dry ice 60mi n
-26◦C Freezing chamber of domestic refrigerator 60mi n
-52◦C Diethyl carbitol + dry ice1mi n
60mi n
-100◦C Diethyl ether + dry ice1mi n
60mi n
-160◦C i-Pentane + liquid nitrogen1mi n
60mi n
-196◦C Liquid nitrogen1mi n
60mi n
5.2. Ex-situ method via further quenching
5.2.1. Further-quenching experiments
Selected cooling baths chosen with reasonable temperature spans are summarized in Ta-
ble 5.1. Thermocouple was utilized throughout the experiment to ascertain that the wanted
temperature was achieved and maintained. Similar cylindrical samples as those in Chapter
4 were employed.
Metallographic specimen preparation and examination were executed, and obtained
metallographic images were further examined via image-processing software with the same
methodologies as mentioned in Section 4.3.
5.2.2. Results and discussion
The only phase transformation that can take place at low-temperature condition is marten-
sitic transformation. The martensite still possesses acicular morphology.
Ranges of starting temperature
At the designed heat treatment state, T i − 1013 started exhibiting the transformation at -
15◦C (Figure 5.7), T i −102Cr 3 did not show the transformation at -15◦C but started from
-26◦C (Figure 5.9), whereas T i −1023B only started showing the transformation from -52◦C
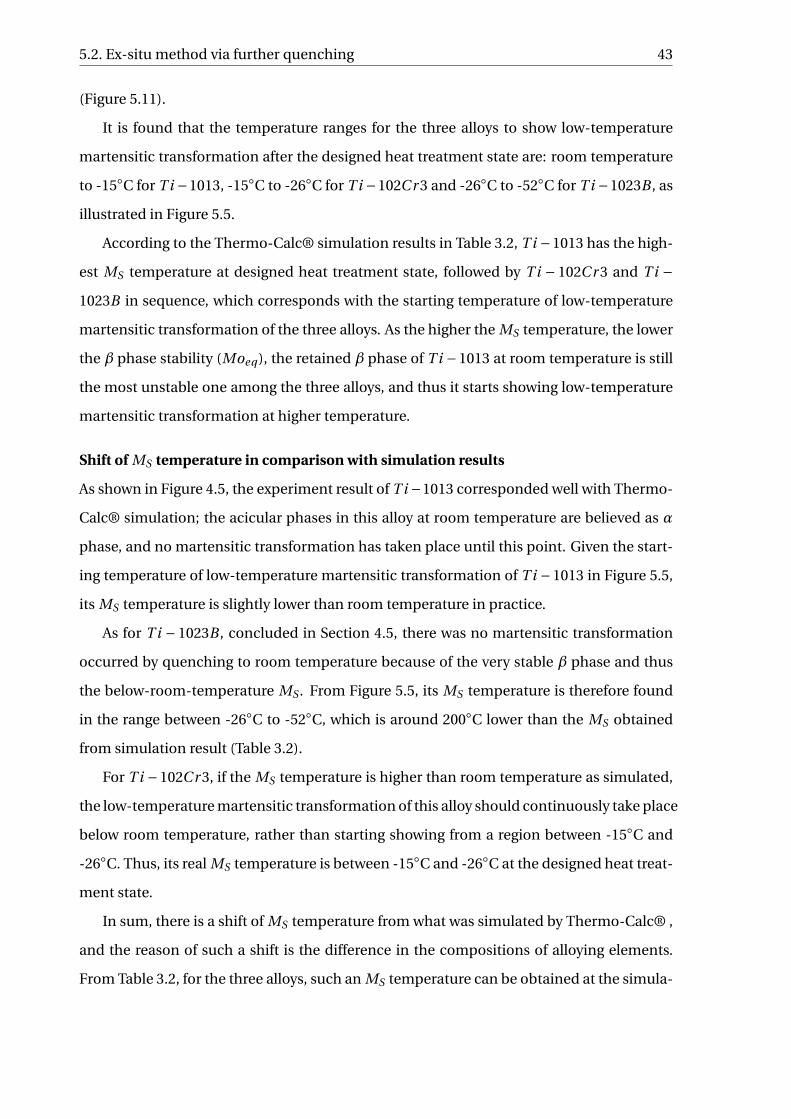
5.2. Ex-situ method via further quenching 43
(Figure 5.11).
It is found that the temperature ranges for the three alloys to show low-temperature
martensitic transformation after the designed heat treatment state are: room temperature
to -15◦C for T i −1013, -15◦C to -26◦C for T i −102Cr 3 and -26◦C to -52◦C for T i −1023B , as
illustrated in Figure 5.5.
According to the Thermo-Calc® simulation results in Table 3.2, T i −1013 has the high-
est MS temperature at designed heat treatment state, followed by T i − 102Cr 3 and T i −1023B in sequence, which corresponds with the starting temperature of low-temperature
martensitic transformation of the three alloys. As the higher the MS temperature, the lower
the β phase stability (Moeq ), the retained β phase of T i −1013 at room temperature is still
the most unstable one among the three alloys, and thus it starts showing low-temperature
martensitic transformation at higher temperature.
Shift of MS temperature in comparison with simulation results
As shown in Figure 4.5, the experiment result of T i −1013 corresponded well with Thermo-
Calc® simulation; the acicular phases in this alloy at room temperature are believed as α
phase, and no martensitic transformation has taken place until this point. Given the start-
ing temperature of low-temperature martensitic transformation of T i −1013 in Figure 5.5,
its MS temperature is slightly lower than room temperature in practice.
As for T i − 1023B , concluded in Section 4.5, there was no martensitic transformation
occurred by quenching to room temperature because of the very stable β phase and thus
the below-room-temperature MS . From Figure 5.5, its MS temperature is therefore found
in the range between -26◦C to -52◦C, which is around 200◦C lower than the MS obtained
from simulation result (Table 3.2).
For T i −102Cr 3, if the MS temperature is higher than room temperature as simulated,
the low-temperature martensitic transformation of this alloy should continuously take place
below room temperature, rather than starting showing from a region between -15◦C and
-26◦C. Thus, its real MS temperature is between -15◦C and -26◦C at the designed heat treat-
ment state.
In sum, there is a shift of MS temperature from what was simulated by Thermo-Calc® ,
and the reason of such a shift is the difference in the compositions of alloying elements.
From Table 3.2, for the three alloys, such an MS temperature can be obtained at the simula-
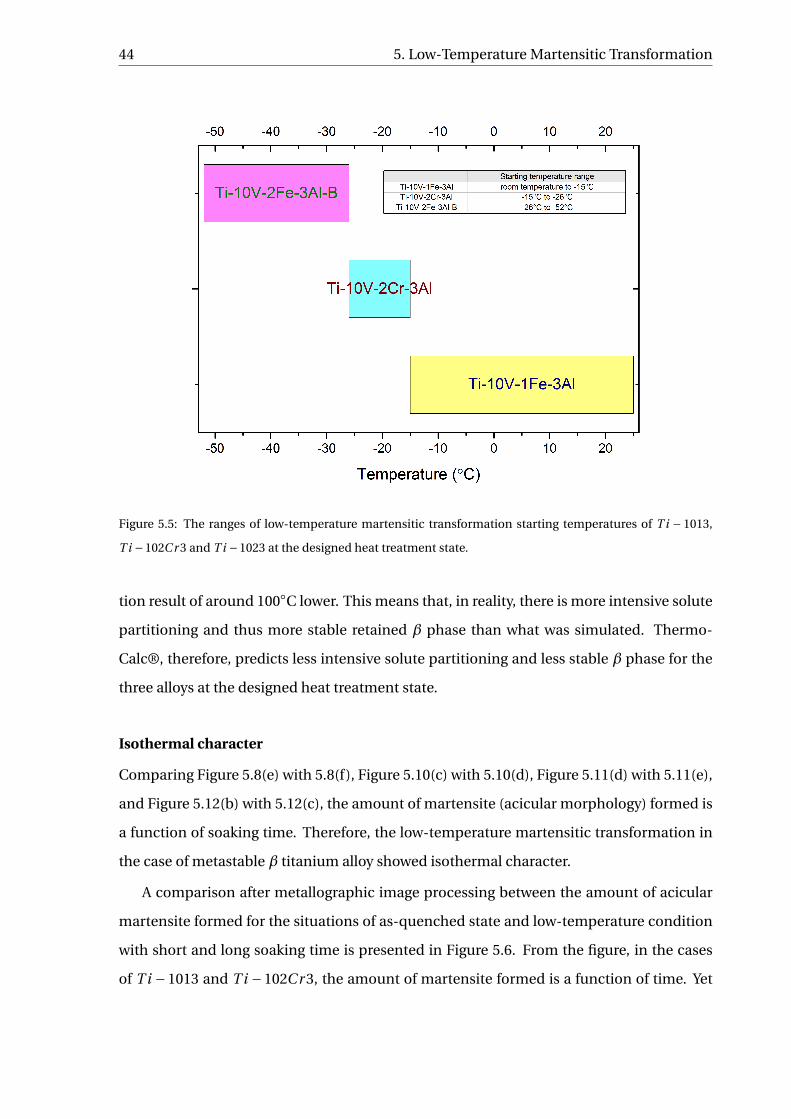
44 5. Low-Temperature Martensitic Transformation
Figure 5.5: The ranges of low-temperature martensitic transformation starting temperatures of T i − 1013,
T i −102Cr 3 and T i −1023 at the designed heat treatment state.
tion result of around 100◦C lower. This means that, in reality, there is more intensive solute
partitioning and thus more stable retained β phase than what was simulated. Thermo-
Calc®, therefore, predicts less intensive solute partitioning and less stable β phase for the
three alloys at the designed heat treatment state.
Isothermal character
Comparing Figure 5.8(e) with 5.8(f), Figure 5.10(c) with 5.10(d), Figure 5.11(d) with 5.11(e),
and Figure 5.12(b) with 5.12(c), the amount of martensite (acicular morphology) formed is
a function of soaking time. Therefore, the low-temperature martensitic transformation in
the case of metastable β titanium alloy showed isothermal character.
A comparison after metallographic image processing between the amount of acicular
martensite formed for the situations of as-quenched state and low-temperature condition
with short and long soaking time is presented in Figure 5.6. From the figure, in the cases
of T i −1013 and T i −102Cr 3, the amount of martensite formed is a function of time. Yet
5.2. Ex-situ method via further quenching 45
Figure 5.6: The amount of martensite formed after further quenching in liquid nitrogen for 1 and 60 minutes
in comparison with the as-quenched state (initial state).
for T i −1023B , the amount of martensite formed is roughly the same at 1 minute and 60
minutes soaking time, which means the speed of low-temperature martensitic transforma-
tion occurred in T i −1023B is faster than the speeds of the other two alloys at -196◦C. But
the isothermal character of T i − 1023B showed at higher terminal temperatures, such as
further quenching to -52◦C (see Figure 5.11(d) and 5.11(e)).
However, in some cases such as T i −1013, when soaking in the -52◦C cooling bath for 1
and 60 minutes (shown in Figure 5.7(d) and 5.7(e), respectively), the amount of martensite
does not increase obviously with longer soaking time under optical examination.
Martensite-Free Zone
The Martensite-Free Zone (MFZ) was observed at grain boundaries in the cases of further
quenching T i −102Cr 3 to -26◦C and -52◦C. No MFZ observed at lower further-quenching
temperatures in the case of T i −102Cr 3 (see Figure 5.10). The microstructure is shown in
Figure 5.9(c), 5.9(d) and 5.9(e), of which blank/white areas can be observed near the grain
boundary. This region is optically similar to the Precipitate-Free Zone (PFZ) found in heat-
46 5. Low-Temperature Martensitic Transformation
treatable aluminum alloys [47].
Nevertheless, in T i −1013 and T i −1023B , no MFZ was observed. Li et al. [19] has sug-
gested a possible reason of the formation of MFZ only in T i −102Cr 3 could be the limited
diffusion distance of chromium, the β stabilizer. Specifically, β-stabilizer will be expelled
from newly-precipitated α phase to the parent β phase. The diffusion distance of iron in
T i − 1013 and T i − 1023B is longer than chromium in T i − 102Cr 3, so that iron is more
likely to be more evenly distributed in β phase than chromium that is likely to accumulate
more in the region of parent β phase near α precipitates and, as a consequence, stabilize
this region. As a result, the region of β phase near α precipitates that is oversaturated with
chromium will be too stable to exhibit martensitic transformation during further quench-
ing.
To validate this assumption, Electron Probe Micro-Analysis (EPMA) was performed re-
garding the MFZ. Results and discussion is presented in Section 5.4.
Specialty of T i −1023B
Comparing Figure 5.11(a) with 5.11(d), 5.11(e), 5.12(b) and 5.12(c), it can be conspicuously
seen that the capacity of T i −1023B of exhibiting low-temperature martensitic transforma-
tion is tremendous. At as-quenched state, no martensite formed (Section 4.5), the amount
ofα precipitate is minor, and thereby more retain β phase. Under further quenching to low
temperature, a huge amount of acicular martensite formed throughout the grains. There-
fore, T i −1023B is the one with the largest capacity of exhibiting low-temperature marten-
sitic transformation among the three alloys.
SIM capability
The designed microstructure of the three alloys are believed to be capable of exhibiting the
SIM behavior – i.e. further martensitic transformation driven by mechanical driving force
– resulting in an improvement of ductility. From the work by Li et al. [19] and Neelakantan
et al. [5], the three alloys going through β+(α+β) heat treatment schemes can successfully
show SIM effect as long as there is enough retained β phase available for the transforma-
tion. T i −1023B is likely to exhibit the SIM behavior with a greater extent in comparison
with T i −1013 and T i −102Cr 3, because of the huge amount of retained β in this alloy.
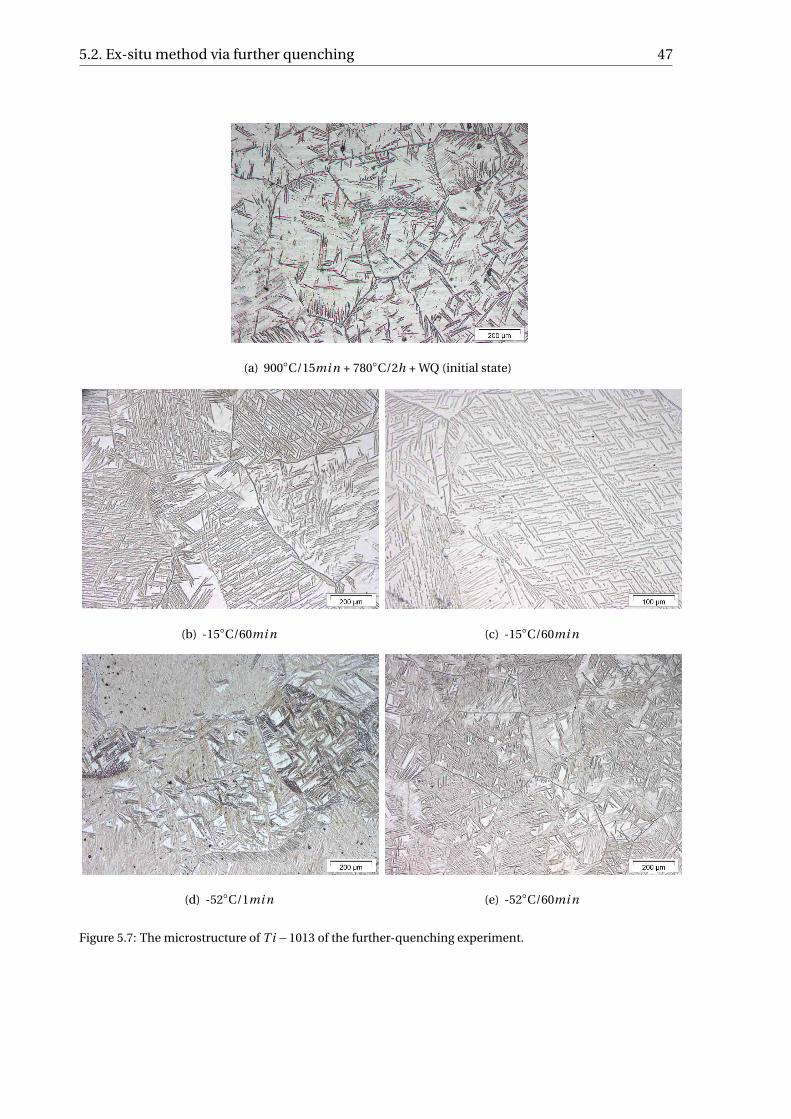
5.2. Ex-situ method via further quenching 47
(a) 900◦C/15mi n + 780◦C/2h + WQ (initial state)
(b) -15◦C/60mi n (c) -15◦C/60mi n
(d) -52◦C/1mi n (e) -52◦C/60mi n
Figure 5.7: The microstructure of T i −1013 of the further-quenching experiment.
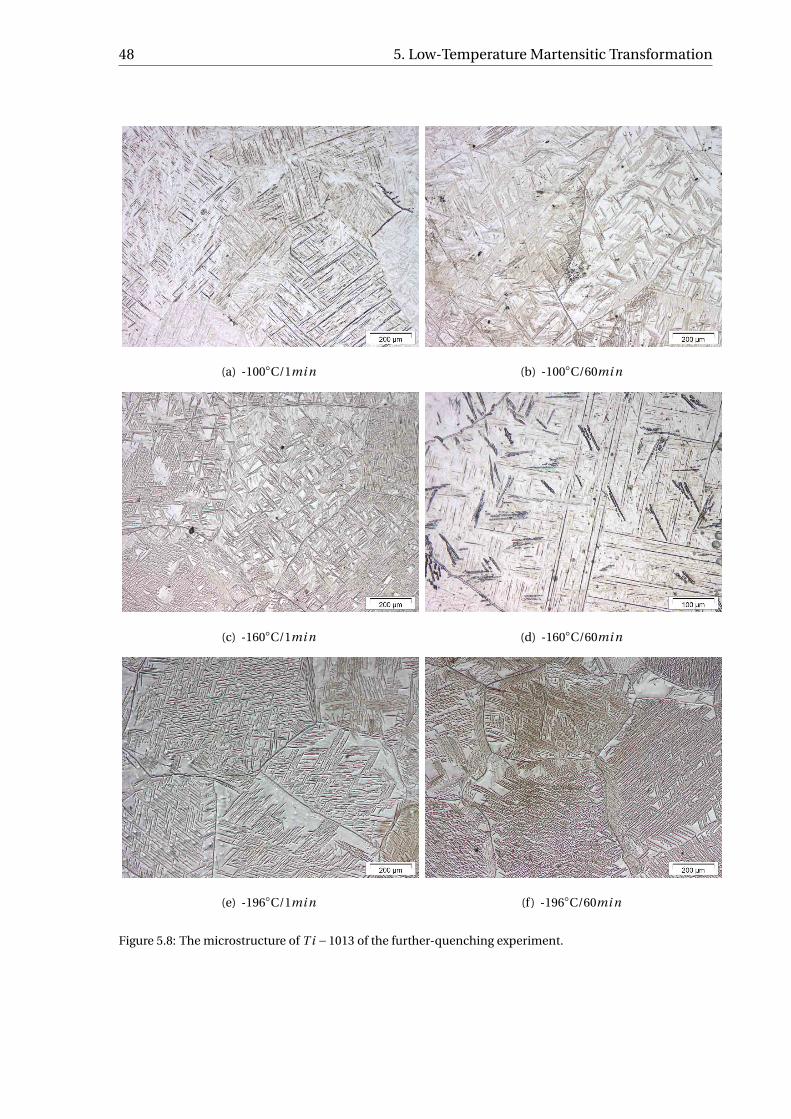
48 5. Low-Temperature Martensitic Transformation
(a) -100◦C/1mi n (b) -100◦C/60mi n
(c) -160◦C/1mi n (d) -160◦C/60mi n
(e) -196◦C/1mi n (f) -196◦C/60mi n
Figure 5.8: The microstructure of T i −1013 of the further-quenching experiment.
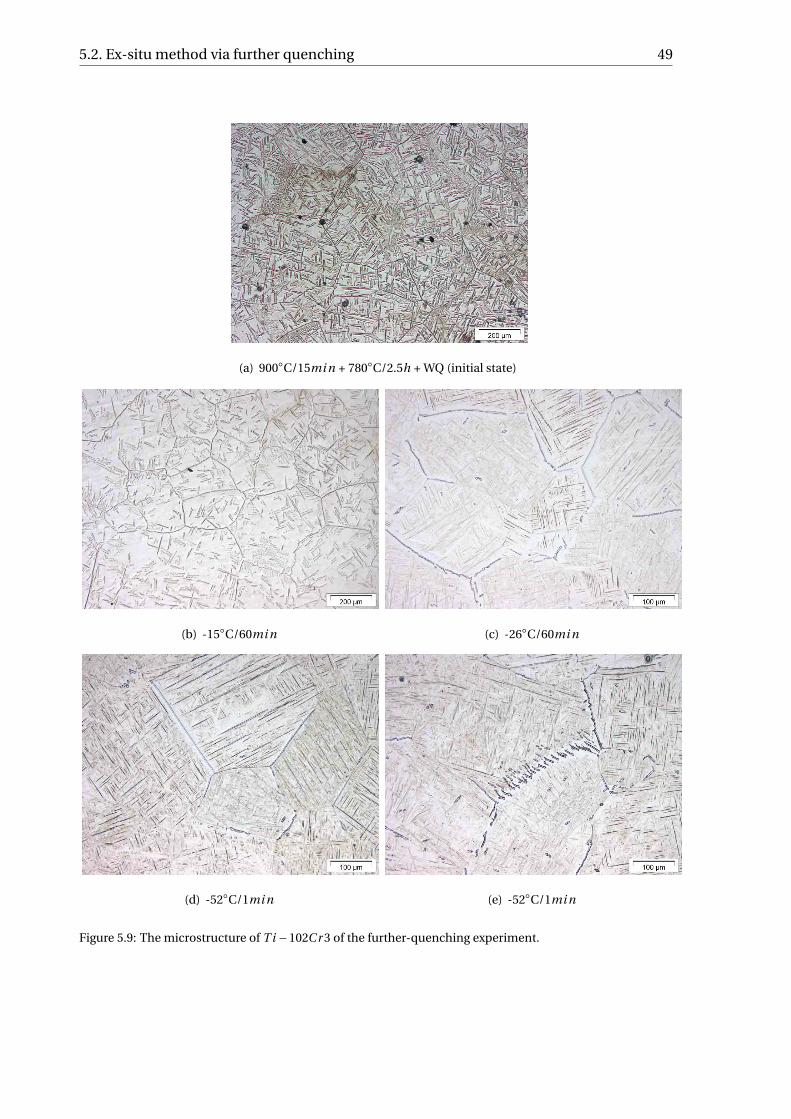
5.2. Ex-situ method via further quenching 49
(a) 900◦C/15mi n + 780◦C/2.5h + WQ (initial state)
(b) -15◦C/60mi n (c) -26◦C/60mi n
(d) -52◦C/1mi n (e) -52◦C/1mi n
Figure 5.9: The microstructure of T i −102Cr 3 of the further-quenching experiment.
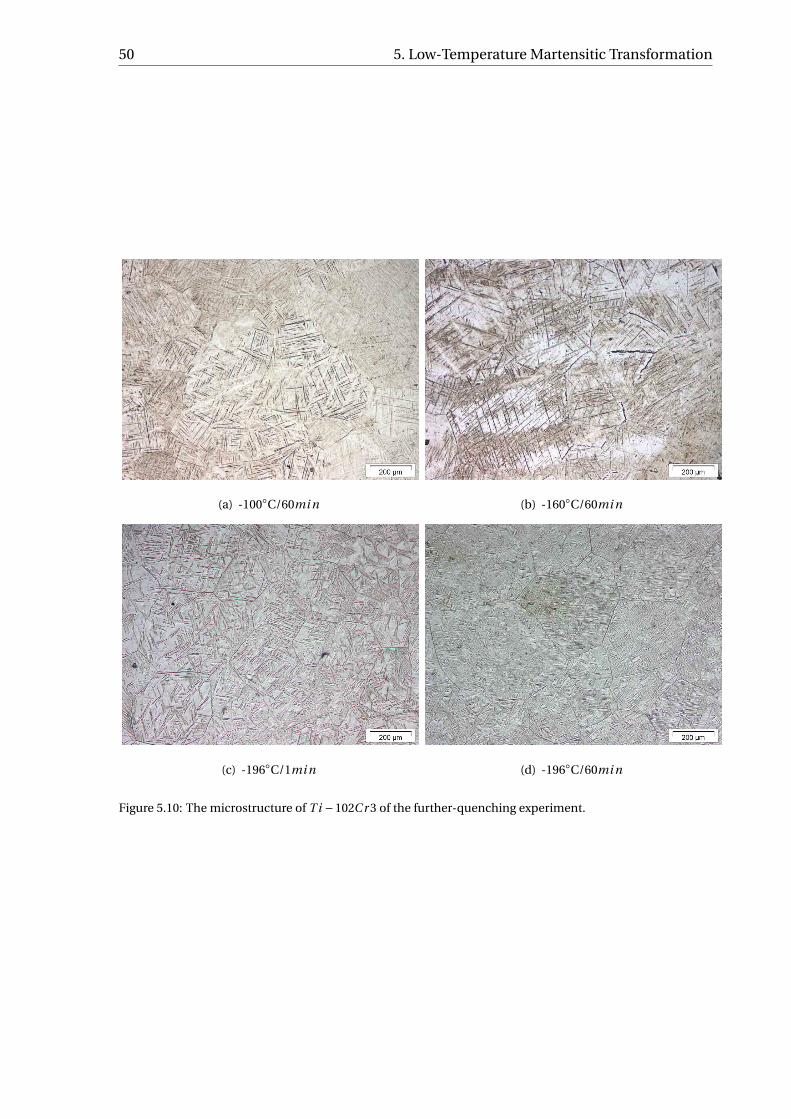
50 5. Low-Temperature Martensitic Transformation
(a) -100◦C/60mi n (b) -160◦C/60mi n
(c) -196◦C/1mi n (d) -196◦C/60mi n
Figure 5.10: The microstructure of T i −102Cr 3 of the further-quenching experiment.
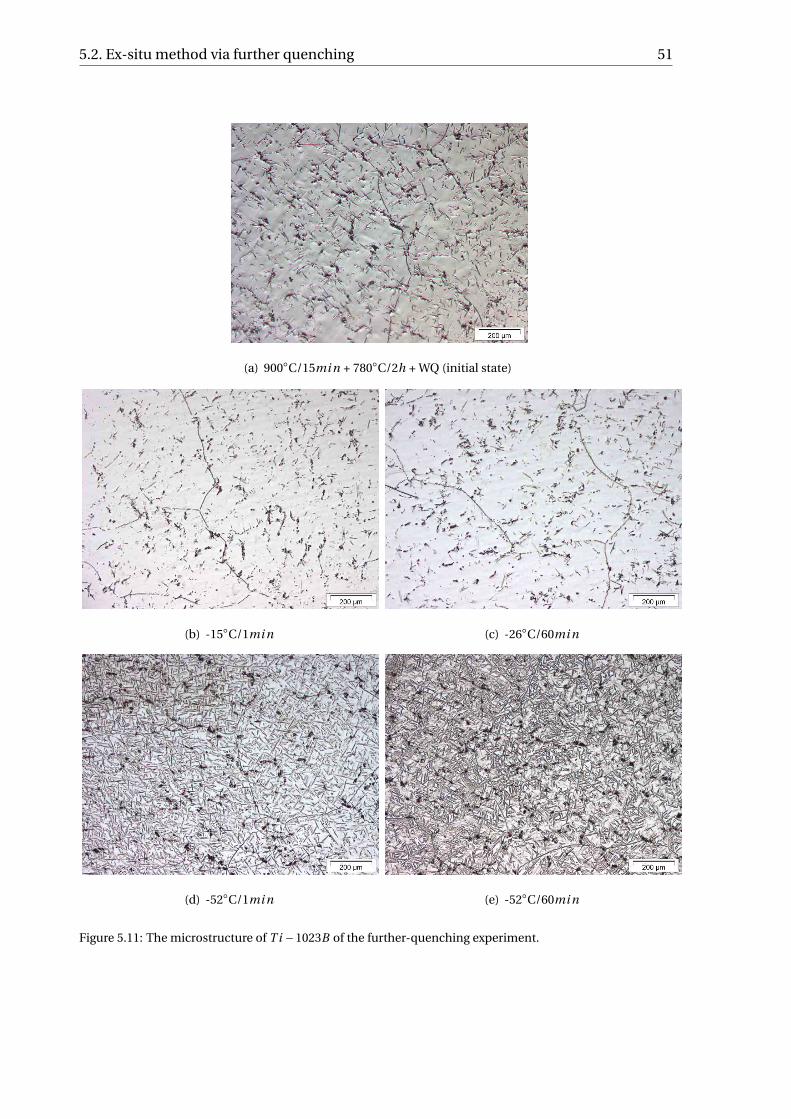
5.2. Ex-situ method via further quenching 51
(a) 900◦C/15mi n + 780◦C/2h + WQ (initial state)
(b) -15◦C/1mi n (c) -26◦C/60mi n
(d) -52◦C/1mi n (e) -52◦C/60mi n
Figure 5.11: The microstructure of T i −1023B of the further-quenching experiment.
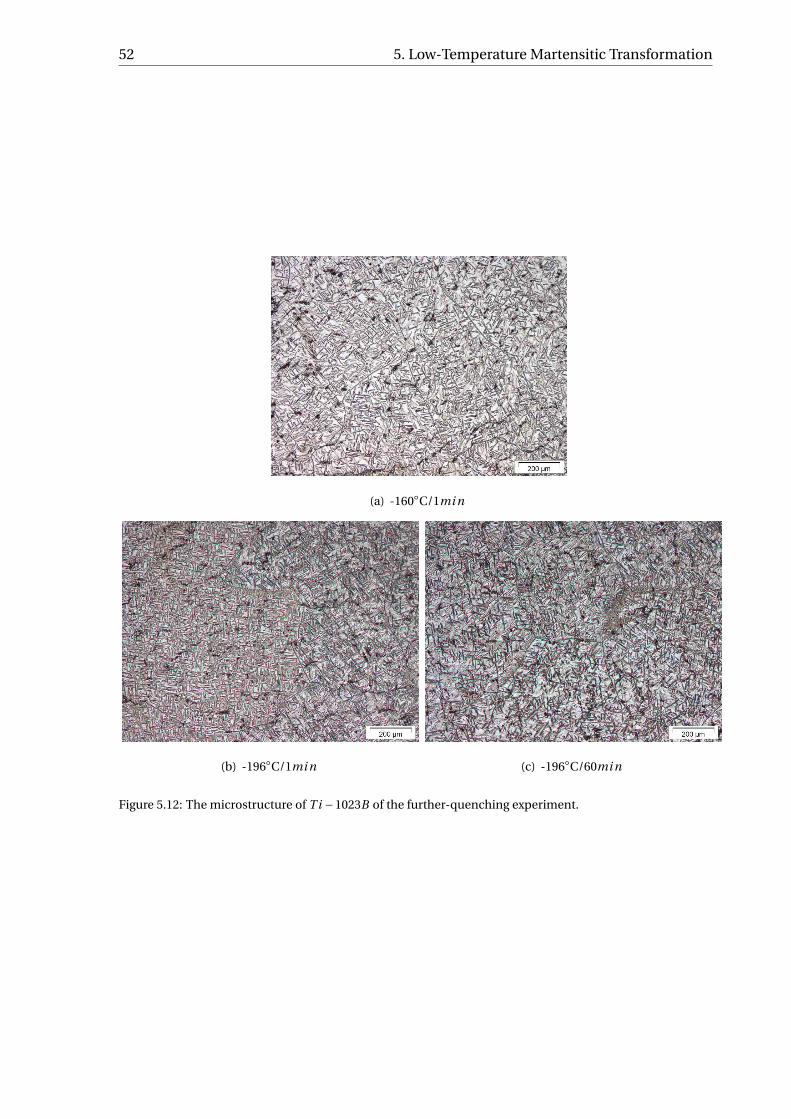
52 5. Low-Temperature Martensitic Transformation
(a) -160◦C/1mi n
(b) -196◦C/1mi n (c) -196◦C/60mi n
Figure 5.12: The microstructure of T i −1023B of the further-quenching experiment.
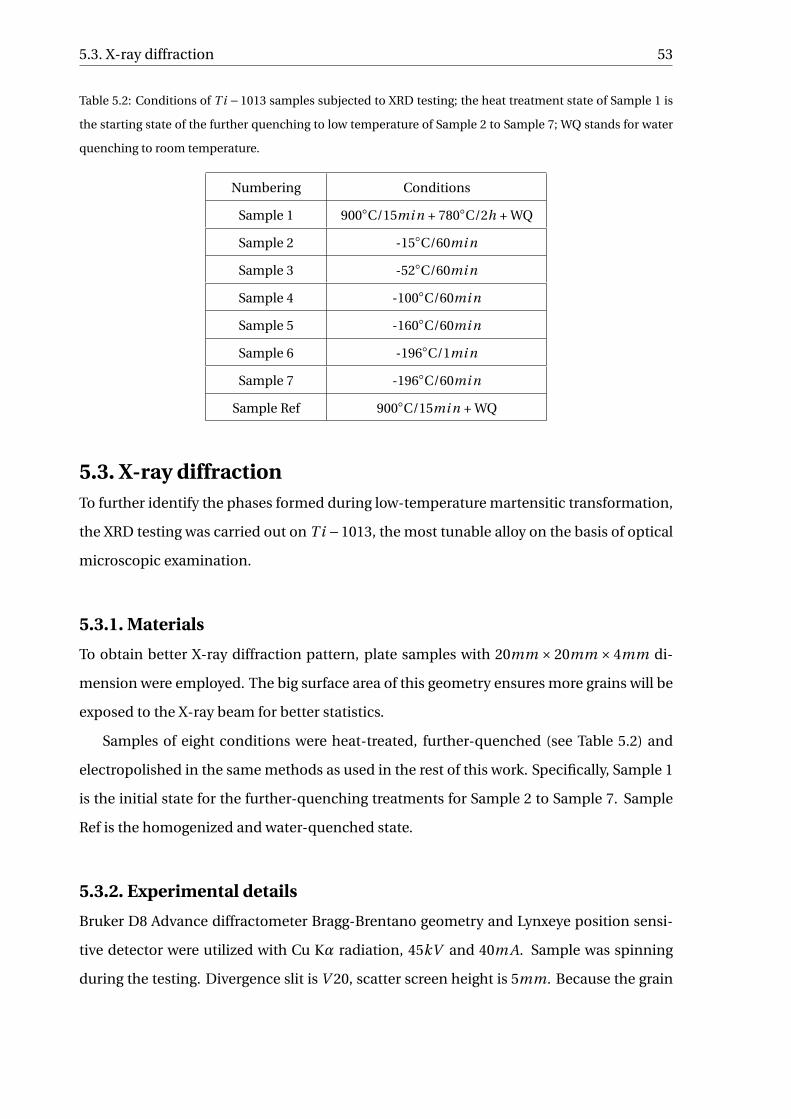
5.3. X-ray diffraction 53
Table 5.2: Conditions of T i −1013 samples subjected to XRD testing; the heat treatment state of Sample 1 is
the starting state of the further quenching to low temperature of Sample 2 to Sample 7; WQ stands for water
quenching to room temperature.
Numbering Conditions
Sample 1 900◦C/15mi n + 780◦C/2h + WQ
Sample 2 -15◦C/60mi n
Sample 3 -52◦C/60mi n
Sample 4 -100◦C/60mi n
Sample 5 -160◦C/60mi n
Sample 6 -196◦C/1mi n
Sample 7 -196◦C/60mi n
Sample Ref 900◦C/15mi n + WQ
5.3. X-ray diffractionTo further identify the phases formed during low-temperature martensitic transformation,
the XRD testing was carried out on T i −1013, the most tunable alloy on the basis of optical
microscopic examination.
5.3.1. Materials
To obtain better X-ray diffraction pattern, plate samples with 20mm × 20mm × 4mm di-
mension were employed. The big surface area of this geometry ensures more grains will be
exposed to the X-ray beam for better statistics.
Samples of eight conditions were heat-treated, further-quenched (see Table 5.2) and
electropolished in the same methods as used in the rest of this work. Specifically, Sample 1
is the initial state for the further-quenching treatments for Sample 2 to Sample 7. Sample
Ref is the homogenized and water-quenched state.
5.3.2. Experimental details
Bruker D8 Advance diffractometer Bragg-Brentano geometry and Lynxeye position sensi-
tive detector were utilized with Cu Kα radiation, 45kV and 40m A. Sample was spinning
during the testing. Divergence slit is V 20, scatter screen height is 5mm. Because the grain
54 5. Low-Temperature Martensitic Transformation
size of the samples is relatively large, approximately in the order of 200 to 600µm, large
sample and large beam sizes were chosen. The V 20 setting (= 20mm irradiated length)
was chosen to maximize the beam size in order to get as many grains as possible in the
beam. For 2θ higher than 70◦, the optics cannot maintain this 20mm setting, and it grad-
ually reduces till approximately 12mm at 135◦. The range of coupled 2θ scan was between
25◦ to 135◦, step size 0.0348◦; counting time per step is 0.5s. Furthermore, X-ray diffraction
data was analyzed and evaluated by Bruker software Diffrac.EVA v4.1.
5.3.3. XRD results and discussions
The X-ray diffraction pattern of the samples are given in Figure 5.13. In order to make the
weak peaks in the pattern more visible, a portrait XRD pattern is also given in Figure 5.14.
The obtained pattern were compared with ICDD (International Center for Diffraction Data)
pattern to identify phases, and the lattice parameters of phases were tuned (by using the
tuning-cell function) to match the diffraction peaks, as listed in Table 5.3 together with the
ICDD patterns used.
It can be clearly seen from the XRD pattern that three phases formed in the samples: β
phase, α phase and α′′ martensite. There is no extra peak left for α′ martensite. Given that
both α and α′ are of hcp structure, while analyzing the pattern, the hcp phase from PDF
04-004-8449 was regarded as α phase because, on one hand, α phase exists in the samples
due to annealing in α+β two-phase region for sure, and on the other hand the Sample Ref,
which was directly quenched from β single-phase region and thus is not supposed to have
α phase precipitated, does not show obvious peaks on the regions of α peaks of Sample 1
to Sample 7.
However, from the work on the same alloy by Li. et al. [42], the martensite formed if
quenching directly after solution treatment was verified as α′ via X-ray diffraction.
The possible reason of the different kinds of martensite could be the extent of oversatu-
ration of martensite. Specifically, with increasing solute content, the hcp α′ martensite will
lose its hexagonal symmetry and transform into orthorhombic α′′ martensite [15][16][17].
The solute partition owing to intercritical annealing will make β phase oversaturated with
β-stabilizers, which may in turn induce the oversaturation of martensite that causes the
martensite formed when quenching from two-phase region at equilibrium heat treatment
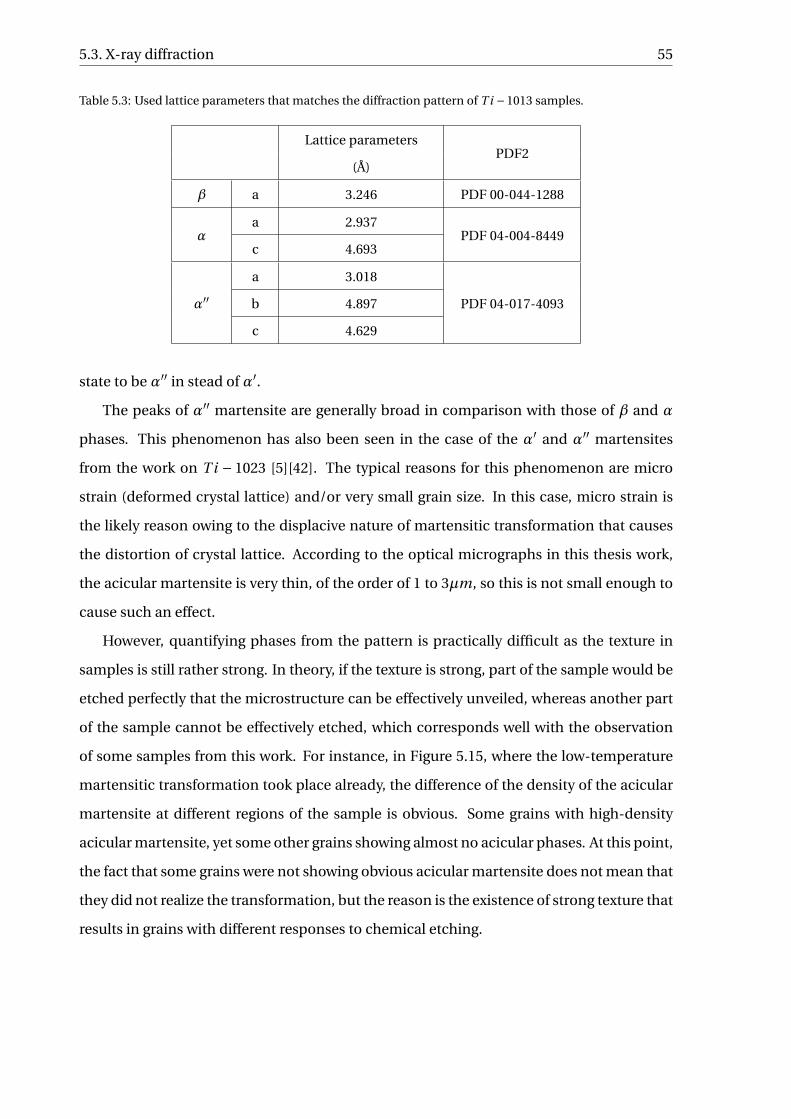
5.3. X-ray diffraction 55
Table 5.3: Used lattice parameters that matches the diffraction pattern of T i −1013 samples.
Lattice parametersPDF2
(Å)
β a 3.246 PDF 00-044-1288
αa 2.937
PDF 04-004-8449c 4.693
α′′a 3.018
PDF 04-017-4093b 4.897
c 4.629
state to be α′′ in stead of α′.
The peaks of α′′ martensite are generally broad in comparison with those of β and α
phases. This phenomenon has also been seen in the case of the α′ and α′′ martensites
from the work on T i − 1023 [5][42]. The typical reasons for this phenomenon are micro
strain (deformed crystal lattice) and/or very small grain size. In this case, micro strain is
the likely reason owing to the displacive nature of martensitic transformation that causes
the distortion of crystal lattice. According to the optical micrographs in this thesis work,
the acicular martensite is very thin, of the order of 1 to 3µm, so this is not small enough to
cause such an effect.
However, quantifying phases from the pattern is practically difficult as the texture in
samples is still rather strong. In theory, if the texture is strong, part of the sample would be
etched perfectly that the microstructure can be effectively unveiled, whereas another part
of the sample cannot be effectively etched, which corresponds well with the observation
of some samples from this work. For instance, in Figure 5.15, where the low-temperature
martensitic transformation took place already, the difference of the density of the acicular
martensite at different regions of the sample is obvious. Some grains with high-density
acicular martensite, yet some other grains showing almost no acicular phases. At this point,
the fact that some grains were not showing obvious acicular martensite does not mean that
they did not realize the transformation, but the reason is the existence of strong texture that
results in grains with different responses to chemical etching.

56 5. Low-Temperature Martensitic Transformation
Fig
ure
5.13
:X-r
ayd
iffr
acti
on
pat
tern
ofT
i−10
13(T
i-10
V-1
Fe-3
Al)
furt
her
qu
ench
ing
inse
lect
edco
oli
ng
bat
hs,
wit
hC
uKα
rad
iati
on
atro
om
tem
per
atu
re;2θ
ran
ge:
25◦ to
135◦
;wav
elen
gth
:1.5
4060
;ste
psi
ze:0
.034
8◦2θ
,co
un
tin
gti
me
per
step
:0.5
s.
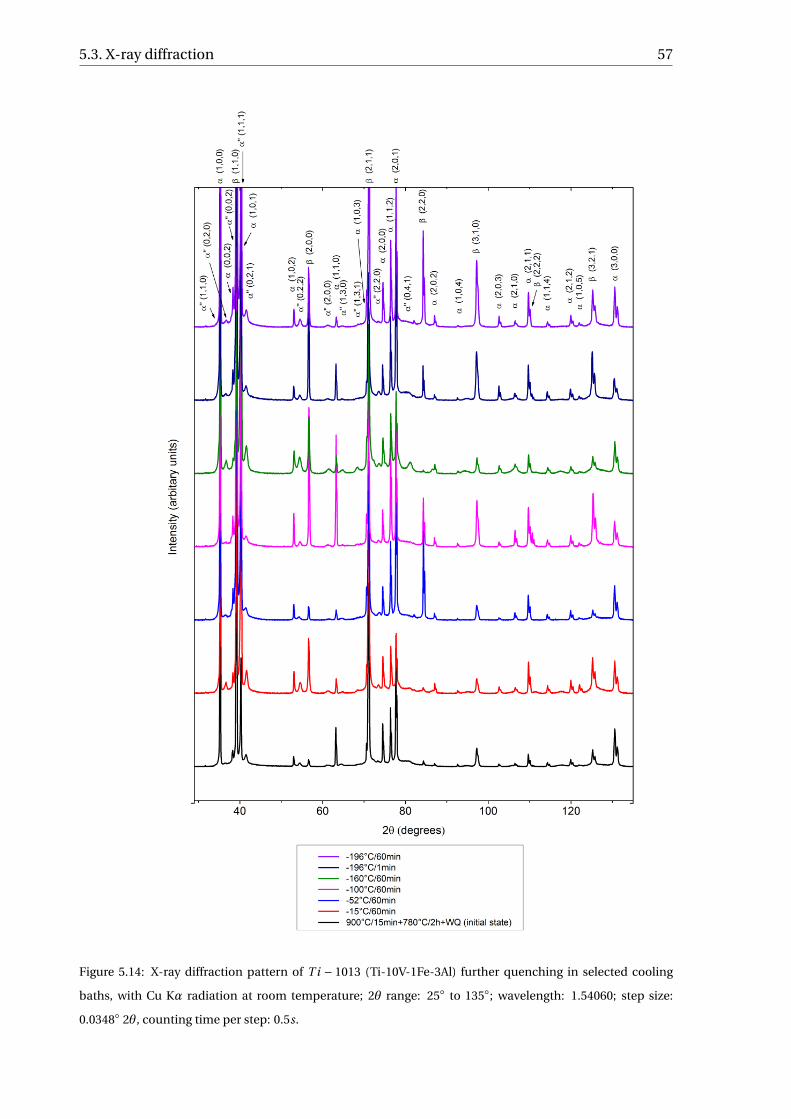
5.3. X-ray diffraction 57
Figure 5.14: X-ray diffraction pattern of T i − 1013 (Ti-10V-1Fe-3Al) further quenching in selected cooling
baths, with Cu Kα radiation at room temperature; 2θ range: 25◦ to 135◦; wavelength: 1.54060; step size:
0.0348◦ 2θ, counting time per step: 0.5s.
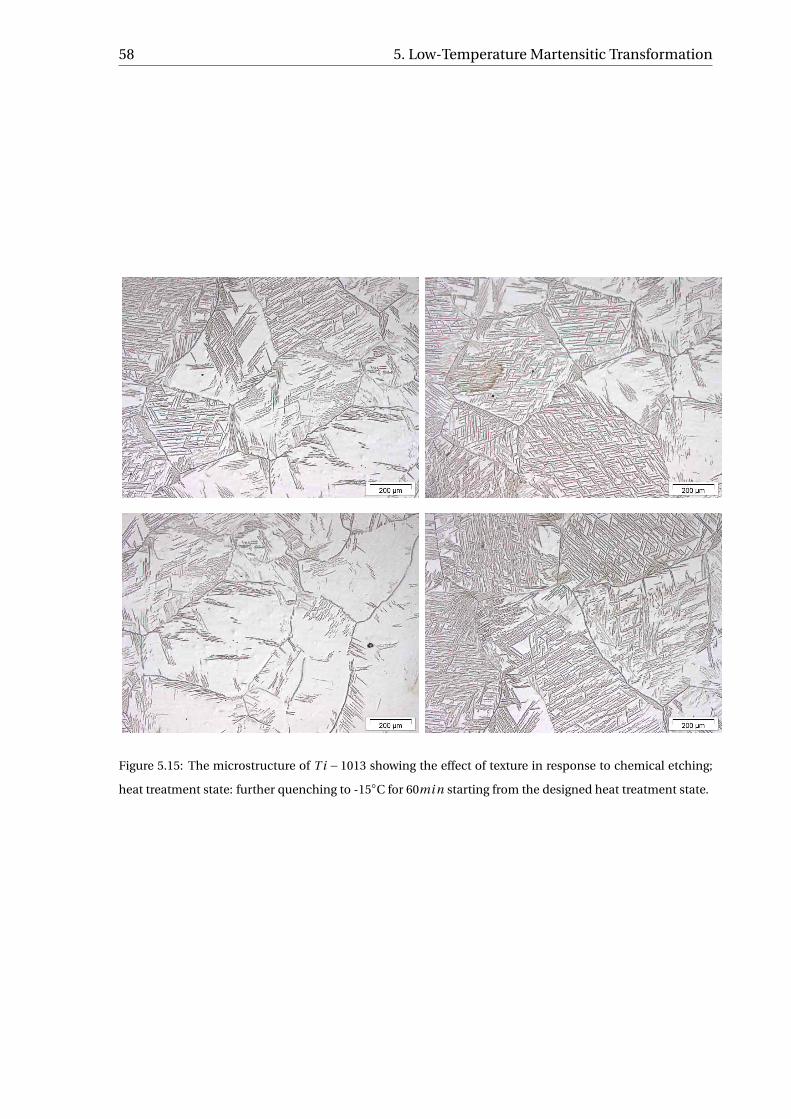
58 5. Low-Temperature Martensitic Transformation
Figure 5.15: The microstructure of T i −1013 showing the effect of texture in response to chemical etching;
heat treatment state: further quenching to -15◦C for 60mi n starting from the designed heat treatment state.
5.4. Electron probe micro-analysis 59
5.4. Electron probe micro-analysisIn order to study the formation of Martensite-Free Zone (MFZ) formed in T i − 102Cr 3,
Electron Probe Micro-Analysis (EPMA) was conducted to investigate the relation between
MFZ and the accumulation of β-stabilizers.
5.4.1. Experimental details
T i −102Cr 3 sample at designed heat treatment state and being further quenched to -26◦C
for 60mi n (Figure 5.9(c)) was selected.
The measurements were performed with a JEOL JXA 8900R microprobe using an elec-
tron beam with energy of 15keV and 20n A beam current by means of Wavelength Dis-
persive Spectrometry (WDS). The composition at each analysis location of the sample was
determined by using the X-ray intensities of the constituent elements after background
correction in relation to the corresponding intensities of reference materials. The inten-
sity ratios of elements were processed with a matrix correction program CITZAF [48]. The
points of analysis were located along line, about 108µm long with increments of 1µm. Ele-
ments under analysis were aluminum, vanadium, chromium and titanium.
5.4.2. EPMA results and discussions
The result of EPMA measurement is given in Figure 5.16. The line scan was performed as
indicated in Figure 5.16(a).
From the aluminum, vanadium, and chromium line scan profile in Figure 5.16, no obvi-
ous gradient of alloying elements can be observed across the MFZ region, except a sudden
variation of the concentrations of elements at the grain boundary. Thus, the formation of
MFZ is not due to the limited diffusion distance of chromium that stabilizes the region of
retained β phase near α precipitates as suggested in previous work [19].
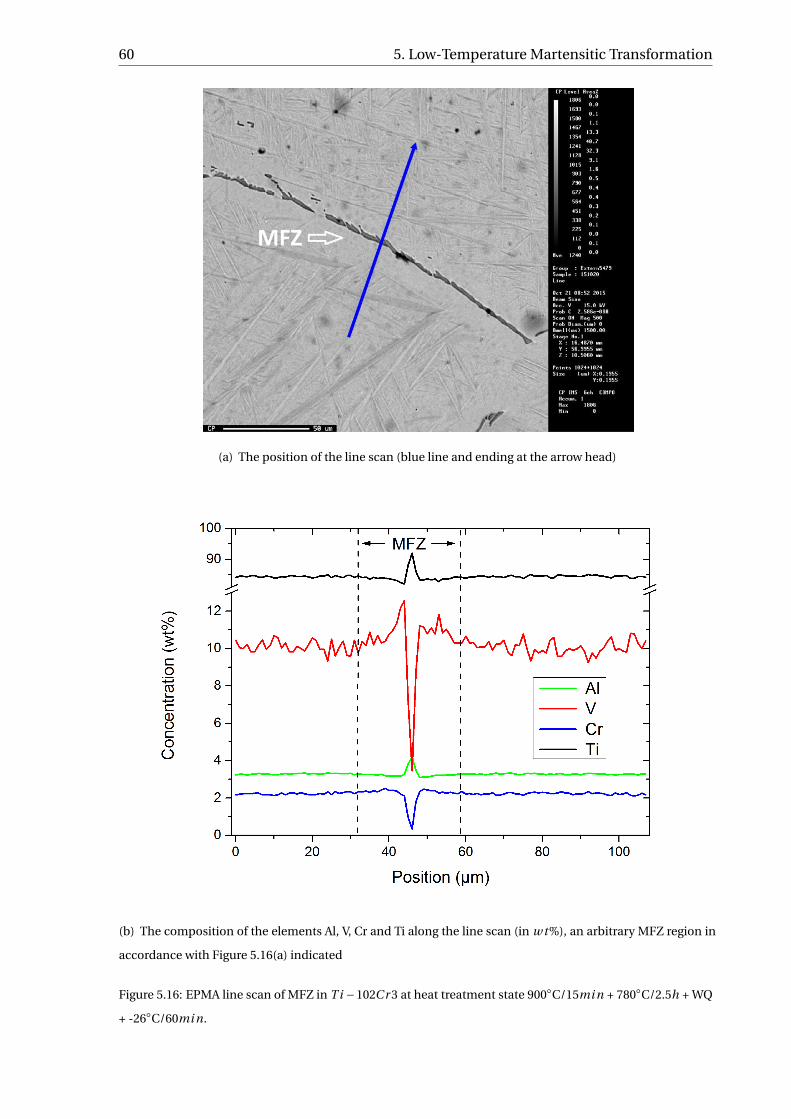
60 5. Low-Temperature Martensitic Transformation
(a) The position of the line scan (blue line and ending at the arrow head)
(b) The composition of the elements Al, V, Cr and Ti along the line scan (in w t%), an arbitrary MFZ region in
accordance with Figure 5.16(a) indicated
Figure 5.16: EPMA line scan of MFZ in T i −102Cr 3 at heat treatment state 900◦C/15mi n + 780◦C/2.5h + WQ
+ -26◦C/60mi n.
5.5. Conclusion of low-temperature experiments 61
5.5. Conclusion of low-temperature experimentsThe designed heat treatment scheme for tuning the β phase stability of T i − 1013, T i −102Cr 3 and T i−1023B was tuned out to be effective in terms of exhibiting low-temperature
martensitic transformation.
The ranges of low-temperature martensitic transformation starting temperature for the
three given metastable β titanium alloys at the designed heat treatment state are: room
temperature to -15◦C for T i −1013, -15◦C to -26◦C for T i −102Cr 3, and -26◦C to -52◦C for
T i −1023B . Further, the transformation is isothermal martensitic transformation.
Meanwhile, Martensite-Free Zone (MFZ) was found in certain further quenching con-
ditions just below the starting temperature in the case of T i −102Cr 3. As experimentally
verified via EPMA, the limited diffusion distance of chromium is not the reason of the for-
mation of MFZ.
On the basis of previous work, the three alloys with designed microstructure are ex-
pected to exhibit the SIM behavior at room temperature under mechanical driving force.
The capacity of T i −1023B to exhibit low-temperature martensitic transformation is high,
in comparison with the other two alloys, because conspicuously more retainedβphase was
obtained from designed heat treatment scheme. In other words, the stability of retained β
phase of T i −1023B is higher than the other two alloys.
In the case of T i − 1013, three major phases – β, α and α′′ – were identified by X-ray
diffraction. Because of the effect of strong texture in the samples, the expected trend ac-
cording with the extent of low-temperature martensitic transformation was not visible in
the XRD pattern. The martensite formed in response to quenching from two-phase re-
gion is verified as α′′ martensite. This may mainly be because of the high solute content in
martensite.
In comparison with the behaviors simulated by Thermo-Calc®, at designed heat treat-
ment state for the three alloys, in practice, the extent of solute partitioning during α phase
precipitation is more intensive, and the retained β phase is more stable.
EDM process for machining the heat-treated samples into disk required by DSC instru-
ment was found to be counterproductive as the process seems to alter the designed mi-
crostructure. As a consequence, the effectiveness of DSC in terms of following and moni-
toring the transformation process is yet to be verified.

6Conclusion
This work effectively designed the microstructure of three metastable β titanium alloys –
T i −1013, T i −102Cr 3 and T i −1023B – via β+ (α+β) heat treatment (i.e. 900◦C/15mi n +
780◦C/2h~2.5h + WQ) and had the stability of β phase tuned for further martensitic trans-
formation under thermal driving force (low-temperature martensitic transformation).
As for β+ (α+β) heat treatment, 2 to 2.5 hours annealing at α+β two-phase region
(780◦C) is concluded to be effective in realizing the equilirbium state, stabilizing β phase,
and securing enough retained β phase at room temperature.
The ranges of starting temperatures of low-temperature martensitic transformation of
the three metastable β alloys at the designed heat treatment state were found – i.e. room
temperature to -15◦C for T i − 1013, -15◦C to -26◦C for T i − 102Cr 3, and -26◦C to -52◦C
for T i − 1023B , and the transformation of the three alloys was found to be of isothermal
character.
The three alloys with designed microstructures are expected to exhibit SIM behavior
that can improve the alloys’ ductility. Among the three alloys, T i −1023B showed the most
dramatic capacity to exhibit the low-temperature martensitic transformation owing to the
higher stability of the β phase and more retained β phase at room temperature in compar-
ison with the other two alloys.
Through X-ray diffraction, the martensite of T i−1013 formed in response to quenching
63
64 6. Conclusion
from two-phase region at equilibrium heat treatment state is the orthorhombicα′′ marten-
site. In theory, the occurrence of α′′ martensite is closely related to oversaturated marten-
site with the high solute content. Meanwhile, the effect of heavy alloying is likely to also
contribute to large MS −M f interval.
Martensite-Free Zone (MFZ) was found in the case of T i − 102Cr 3 if the alloy is fur-
ther quenched to a temperature just below the starting temperature of low-temperature
martensitic transformation. EPMA testing proved that this phenomenon does not relate to
the diffusion behavior of alloying elements.
Thermo-Calc® predicts less intensive solute partitioning during α phase precipitation
and therefore less stable retained β phase for the three alloys.
Electrical Discharge Machining (EDM) was found detrimental to the three heat-treated
metastable titanium β alloys as the designed microstructure was altered during the ma-
chining. EDM is likely to induce such a heat treatment process that heats up the sample to
β single-phase region and then quenches to room temperature.
7Recommendations for Future Work
As for the future work, the effectiveness of DSC in terms of detecting and following the low-
temperature martensitic transformation in metastable β titanium alloys is worthwhile to
be further investigated. The main obstacle is the preparation of DSC sample (small disk).
An effective technique/machining that will not change the designed microstructure is rec-
ommended.
Having investigated the effect of thermal driving force by means of low-temperature
martensitic transformation, the mechanical properties of further-quenched samples could
be examined in comparison with their initial as-quenched state at room temperature. It
would be valuable to see if the low-temperature martensitic transformation could bring
about effective strengthening effect. Furthermore, the formation of MFZ in T i −102Cr 3 at
low-temperature condition is worth to be further investigated.
The idea of making titanium metallic composite by combining the SIM effect with Hall-
Petch relation, as a new route to strengthen titanium alloy, is proposed in Appendix A,
which requires further effort to bring the idea into reality.
65


AFabricating Novel Titanium Metallic
Composites by SPS
In this proposal, general characteristics and merits of Additive Manufacturing (AM) by Se-
lective Laser Melting (SLM) and Spark Plasma Sintering (SPS) to fabricate titanium prod-
ucts from titanium powder are discussed in Section A.1.
Subsequently in Section A.2, the project idea is proposed, theoretical background of
why metastable titanium alloy is used is given, influence of using metal powder (smaller
grain size) instead of traditional casting metal is analyzed, and an in-situ heat treatment
scheme during the course of SPS are suggested.
The outcomes of this research are anticipated in Section A.3.
A.1. IntroductionFeatured by relatively low density, good corrosion resistance, high yield strength, satisfac-
tory high-temperature strength and good creep behavior, titanium and its alloys are impor-
tant structure materials widespread utilized in aerospace, medical implantation, chemical,
marine, offshore and other industries.
Nevertheless, the overhead and direct costs of smelting and processing titanium and its
alloys, due to their inherent chemical properties and crystallographic structures, still hover
67

68 A. Fabricating Novel Titanium Metallic Composites by SPS
at high level and thus considerably impede the development and widespread application
of titanium alloys, a far cry from their steel or aluminum counterparts.
The awkward situation of titanium industry, on the other hand, makes exploring new
processing route to manufacture titanium alloys a worthy endeavor, i.e. techniques that
could lower feed stock materials cost and achieve near net shape [49].
Given the considerations above, powder-based Additive Manufacturing (AM) by Selec-
tive Laser Melting (SLM) has recently been regarded as a promising near-net-shape fabrica-
tion technology. Based on Computer-Aided Design (CAD) models, metal powders on plat-
form are directly melted by high-energy laser beam, ending up with the geometry buildup
in a layer-by-layer manner [50][51].
Previous experience has shown that, as far as the most widely used T i −6Al −4V was
concerned, the products built by SLM could be able to achieve a fully dense state. Mean-
while, they exhibit comparable strength and ductility in comparison with their wrought
counterparts [52][53].
Unlike conventional way of metal making, several parameters play significant role in
AM techniques in determining the final properties of products – specifically, powder mor-
phology, particle size distribution, purity, flowability, powder bed condition, laser spot size,
scanning speed, preheat temperature, the formation and development of melt pool, and
homogeneity [52][54][55][56][57][58].
Nevertheless, more importantly, most published scientific works to date are focusing on
additively manufacturing titanium alloys by selective laser melting single type of titanium
alloy powder, whereas the possibility and effectiveness of doing this by mixing different
titanium alloy powders have not been extensively investigated and studied yet.
Therefore, inspired by the work done by using SLM, a novel idea of fabricating metallic
composite from two different alloy categories of titanium powder by Spark Plasma Sinter-
ing (SPS) is going to be proposed in this work. The idea of utilizing SPS technique is to try
out the idea of mixing two different titanium alloy powders for better mechanical proper-
ties on SPS first, and then further realize it on AM techniques represented by SLM.
A.2. Research work 69
A.2. Research work
A.2.1. Project idea
The main goal of employing SPS to fabricate two different titanium powders – Ti-10V-2Fe-
3Al (transformable grade) and the most widely used Ti-6Al-4V (matrix) – together is to re-
alize the novel idea of composite microscopically in traditional metal alloys. Specifically,
the Stress-Induced Martensitic transformation effect (abbreviated as SIM effect) of Ti-10V-
2Fe-3Al is going to be employed as the reinforcement of this "metallic composite". And
the matrix is Ti-6Al-4V that does not exhibit SIM effect but provide homogeneity for the
metallic composite.
Meanwhile, granted the inherent features of powder metallurgy, finer grain size (deriv-
ing from the minimal size of metal powders) is expected to be realized to such an extent
that, in the light of Hall–Petch relation [59], the resulting products are expected to end up
with high strength.
Furthermore, one of the biggest advantages of SPS is that the density of the product will
be near the theoretical density at lower sintering temperature compared to conventional
sintering techniques, as the heat generation is internal, different from conventional hot
pressing, because of Joule heating.
Given that SPS and also SLM can be performed at elevated temperature, heat treatment
can be carried out simultaneously during the course of production. More imperatively,
heat treatment is an important means to tune and control SIM effect for the powder of
transformable grade, such that by preheating powder bed, practitioners are spared the core
of doing heat treatment separately. In the meantime the coarsening effect is anticipated to
be not very serious and obvious.
On the other hand, the cooling rate in SPS is estimated to be up to 103K mi n−1, much
lower than the critical cooling rate for martensitic transformation in Ti-6Al-4V (410K s−1)
[60][61]. However, the cooling rate of SLM is 103 to 105K s−1, which is orders of magnitude
higher than 410K s−1. Therefore, as a consequence, the product built by SPS is expected to
have equilibriumα+βmicrostructure, whereas acicular martensite (α′ and/orα′′) together
with α phase for that built by SLM.
70 A. Fabricating Novel Titanium Metallic Composites by SPS
A.2.2. Theoretical basis of applying SIM effect as reinforcement
β phase, comparable to austenite in steels, is the most predominant phase while looking at
martensitic transformation in titanium alloys. Inspired by previous works upon T i −1023
[5][18][21][32][62][63][64], metastable β titanium alloys have the potential to exhibit both
normal martensitic transformation and SIM (or TRIP) transformation (β→ α′/α′′) under
different conditions by careful alloy design and treatments.
Theoretically, martensitic transformation requires energy input to overcome the activa-
tion barrier and to be triggered by means of either quenching or mechanical deformation.
In other words, the more stable the β phase, the lower the MS temperature, and the more
the energy (either thermal or mechanical) is required to initiate and trigger martensitic
transformation. Therefore, the phase transformation and mechanical behavior of metastable
β alloy can be tuned by tailoring the stability of β phase.
Influencing factors for SIM effects
From previous works done by varied researchers, seven main factors affecting SIM effects
have been recognized as following:
• Stability of β phase (molybdenum equivalence Moeq )
• MS temperature
• Volume fraction of α phase
• Grain size of β phase
• Morphology of α phase
• Deformation temperature
• Strain and strain rate
Of these factors, the primary criteria supposed to be taken into account while designing
are β phase stability (Moeq ) and MS temperature. The rest of influencing factors, such as
volume fraction ofα phase, have direct but complicated relation with β phase stability and
MS temperature owing to solute partitioning effect.
A.2. Research work 71
Impacts of small grain size deriving from using metal powders
Grain size, as one of the most important parameters in metals science, is well-known by
its potent impact on mechanical properties of metals based on Hall-Petch relation. It also
has significant influence on the triggering stress to initiate TRIP effect. In titanium alloys,
linear relations between grain size and triggering stress have been reported in many works
– i.e. the larger the grain size, the higher the triggering stress [32][65]. Liu and Yang [66]
proposed a thermodynamic expression for the transformation from metastable β phase to
orthorhombic martensite:
∆G =∆H −T∆S +∆Eel +δEi r r −εtr − 1
2[ fσ2
EM− (1− f )
σ2
Eβ] (A.1)
In Equation A.1, enthalpy ∆H and entropy ∆S are not dependent upon grain size [67].
εtr has to do with texture and is the force displacement work because of lattice distortion
during martensitic transformation; the complex term 12 [ f σ2
EM− (1− f )σ
2
Eβ] is elastic energy
due to deformation, which is related to the difference in Young’s modulus between α′′ and
β during elastic deformation [68]. They are independent on grain size as well.
However, stored internal elastic energy ∆Eel and irreversible energy for the work done
in undergoing internal friction δEi r r depend on β grain size [32][68]. Since β grain size
directly relates to mean length and width of martensite plates, and martensite plate length
has a predominant influence on the magnitude of internal stress field in β matrix during
SIM transformation, it can be proposed that the smaller the grain size, the lower the stored
internal elastic energy ∆Eel [69].
Friction resistance δEi r r is in direct proportion to the total volume the interface sweeps.
Therefore, provided given volume of martensite, the smaller the plate size, the larger the
volume swept by interfaces and the higher the δEi r r [68][70].
A positive linear tendency was found between β grain size and SIM effect triggering
stress in Ti-1023 [32][65]. Implied is that as far as the overall effect was concerned, with
decreasing β grain size, the SIM triggering stress decreases, and ∆G in Equation A.1 (driv-
ing force) therefore decreases as well. Thus, the contribution of term (∆Eel +δEi r r ) shows
positive response with regard to changing β grain size.
Therefore, if other variables remain the same, a simplified relation is proposed in this
literature review between β phase grain size, molybdenum equivalence value of β phase
72 A. Fabricating Novel Titanium Metallic Composites by SPS
Moβeq (or α phase volume fraction), free energy change ∆G , SIM triggering stress σSI M and
MS temperature (in which " ⇑ " means changing positively and " ⇓ " means changing nega-
tively):
• β grain size ⇑ ∆G ⇑ σSI M ⇑ MS ⇓
• Moβeq ⇑ ∆G ⇑ σSI M ⇑ MS ⇓
As a result, the smaller the β grain size, the smaller the ∆G , the lower the σSI M , and
the higher the MS – ending up with less stable β phase. And thus smaller β phase grain
size resulting from additive manufacturing will render martensitic transformation easier to
occur.
Tailoring MS temperature
β phase stability is quantified by Molybdenum equivalence Moeq ; and Moeq is directly re-
lated with MS (in Kelvin) by β phase composition according to Equation A.2 [4] and Equa-
tion A.3 [5][33]:
Moeq = 1.00Mo +0.28N b +0.22Ta +0.67V +1.6Cr +2.9Fe −1.00Al (A.2)
MS [w t%] = 1156−150Fe −107Mn −96Cr −67Ni −49Mo
−41Cu −37V −17N b −7Z r +15Al (A.3)
Heat treatments are supposed to be designed in such a way that β phase is tuned to a
stability (indicated by the value of Moeq ) that the martensitic transformation will take place
in predicted ways, and enough retained β phase must be secured at room temperature for
SIM transformation.
The intercritical annealing temperature is recommended to be set at the level where the
MS of metastable titanium alloy can be lowered to around room temperature. Alternatively,
in SPS, at least should enough retained β phase be secured for the SIM effect.

A.2. Research work 73
A.2.3. Selection of powder bed preheating temperature
The selection of preheating temperature mainly zeros in on tuning the metastable titanium
alloy powders for SIM effect, since it is practically and theoretically difficult to simultane-
ously tailor two different categories of titanium alloys.
The preheating treatment scheme (for both SLM and SPS) suggested here strives to
strike a balance of impacts of heat between matrix and reinforcement titanium alloy pow-
ders.
Influence of preheating on matrix Ti-6Al-4V
The MS of Ti-6Al-4V in full β condition is calculated as 825◦C. Since the preheating tem-
perature will be selected between 700 and 800◦C for tuning the stability of β phase in
transformable grade Ti-10V-2Fe-3Al, martensitic transformation is unavoidable in matrix,
whereas according to the data given in [60], SLM-manufactured Ti-6Al-4V is still able to
retain a yield strength of 900 to 1000MPa with elongation 8.5 to 9%.
Influence of preheating on reinforcement Ti-10V-2Fe-3Al
In comparison, the metastable titanium alloy Ti-10V-1Fe-3Al is unlikely to exhibit marten-
sitic transformation immediately at a temperature above 700◦C; and by means of annealing
and thus α participation owing to powder bed preheating, we would be able to tailor the β
phase composition and thus β stability and MS through controlling the precipitation of α
phase.
A.2.4. Controlled parameters
During real experimentation, several technical parameters are worthwhile to be consid-
ered.
Volume fraction of the transformable grade
The volume fraction of the Ti-10V-2Fe-3Al powder (transformable grade) would be well-
advised to be less than 50%. The optimal range of the volume fraction for transformable
grade powder is recommended to be between 10% to 40%, as enough volume fraction
should be given to the matrix powder that ensures the structural stability and homogene-
ity for the designed metallic composite. The anticipitation, of course, needs to be further
74 A. Fabricating Novel Titanium Metallic Composites by SPS
examined by laboratory work.
Powder particle size
Secondly, the original particle size is of primary importance in determining the final me-
chanical properties of the metallic composite. The powder size of transformable grade is
recommended to be at least two times bigger than the matrix powder, because SIM effect is
expected to take place in the transformable grade and this would not be obviously effective
if the powder size, and thus the room available for SIM effect, of transformable grade is too
small.
As for the powder size of matrix alloy, to obtain high product strength on the basis of
Hall-Petch relation [59], small particle size is preferred. Considering the commercial avail-
ability in the market, a mesh size range between 100 and 325 (opening: 44 to 150µm) is
recommended.
Furthermore, in real experimentation, the size of particle utilized is supposed to be
stringently controlled, because the over-irregular powder particle size will have severe ad-
verse effect on the formation of voids, surface finish, the achieved mechanical property of
the product, etc. [49]. Thus, the applied particle size range should be controlled to be as
narrow as possible.
Effects of changing composition during sintering
Lastly, it can be anticipated that, during the course of consolidating the two alloys together
at high temperature, the local composition of powders may change. However, we cannot
predict the extent at current stage, and therefore, we cannot take this effect into account.
A.3. Expected research outcomesEventually, the Ti-10V-2Fe-3Al-plus-Ti-6Al-4V metallic composite made by SPS, as a trial
examination of the idea of mixing two different titanium alloy powders, is expected to have
continuous Ti-6Al-4V matrix in combination with Ti-10V-2Fe-3Al reinforcement exhibiting
SIM effect during deformation.
The final product’s ductility is expected to be better than additive-manufactured Ti-6Al-
4V product owing to the SIM behavior of the transformable grade Ti-10V-2Fe-3Al, while at
the same time high strength of the product would be ensured. The SIM martensite is ex-
A.4. Supplier information of titanium powders 75
pected to occur in the product in a dispersed and isotropic manner with acicular morphol-
ogy, as the transformable grade powder is thoroughly mixed with matrix powder.
Furthermore, some new interesting phenomenon are expected, for instance the inter-
action (e.g. stress field) between martensites from two Ti alloys.
A.4. Supplier information of titanium powders
Matrix Ti-6Al-4V
The commercial Ti-6Al-4V powder is globally available on the market. Taking the supplier
TIMET in the U.S. for instance, their quote is US$3,700.00 for 201b (approx. 9kg ); mesh
range can be chosen between -100 to +325 (minimum particle size achievable: 44µm).
Transformable grade Ti-10V-2Fe-3Al
Ti-10V-2Fe-3Al powder is not available on the market. The most viable solution so far is to
buy the alloy bar from suppliers, such as TIMET, and request company with toll atomization
technique to make the bar into powder.
The author has found TLS Technik GmbH & Co. Spezialpulver KG in Germany (contact
person: Norbert Ludwig; Email: [email protected]) who is willing to offer toll
atomization if the alloy as bar feedstock is provided. The average particle size from their
atomization is 80µm, 90% in the range between 0 to 150µm. The pricing for a quantity up
to 10kg is d1,550.00.

Bibliography
[1] C. Leyens and M. Peters, Titanium and Titanium Alloys: Fundamentals and Applications (John
Wiley & Sons, 2006).
[2] G. Welsch, R. Boyer, and E. Collings, Materials properties handbook: titanium alloys (ASM
international, 1993).
[3] D. R. Lide, Handbook of chemistry and physics, 87th edition (CRC press, 2006).
[4] G. Lütjering and J. C. Williams, Titanium, Engineering Materials and Processes (Springer-
Verlag Berlin Heidelberg, 2007).
[5] S. Neelakantan, Tailoring the mechanical properties of titanium alloys via plasticity induced
transformations (Ph.D. Dissertation, Delft University of Technology, Delft, The Netherlands,
2010).
[6] M. J. Donachie, Titanium: a technical guide (ASM International, 1988).
[7] W. Sha and S. Malinov, Titanium alloys: Modelling of microstructure, properties and applica-
tions (Elsevier, 2009).
[8] V. N. Moiseyev, Titanium alloys: Russian aircraft and aerospace applications (CRC press, 2005).
[9] F. F. Schmidt and R. A. Wood, Heat treatmen of titanium and titanium alloys (George C. Murs-
bdll Space Flight Center, NASA, 1966).
[10] W. Burgers, On the process of transition of the cubic-body-centered modification into the
hexagonal-close-packed modification of zirconium, Physica 1, 561 (1934).
[11] J. Newkirk and A. Geisler, Crystallographic aspects of the beta to alpha transformation in tita-
nium, Acta Metallurgica 1, 370 (1953).
[12] R. I. Jaffee and N. E. Promisel, The science, technology, and application of titanium: proceedings
(Pergamon, Oxford, UK, 1970).
77
78 Bibliography
[13] J. Yan, TRIP Titanium Alloy Design (Ph.D. Dissertation, Northwestern University, Evanston, Illi-
nois, USA, 2014).
[14] J. C. Williams, Titanium Science and Technology (Plenum Press, New York, USA, 1973).
[15] O. Ivasishin, A. Ustinov, V. Skorodzievskii, M. Kosenko, Y. V. Matviychuk, and F. Azamatova,
Structural and compositional changes during isothermal annealing of α"-martensite in ti-8
wt.% mo alloy, Scripta materialia 37, 883 (1997).
[16] E. Kumar Menon and R. Krishnan, Phase transformations in ti-v alloys, Journal of Materials
Science 18, 365 (1983).
[17] C. Baker, The shape-memory effect in a titanium-35 wt.-% niobium alloy, Metal Science 5, 92
(1971).
[18] T. Duerig, J. Albrecht, D. Richter, and P. Fischer, Formation and reversion of stress induced
martensite in ti-10v-2fe-3al, Acta Metallurgica 30, 2161 (1982).
[19] C. Li, J. H. Chen, X. Wu, W. Wang, and S. van der Zwaag, Tuning the stress induced martensitic
formation in titanium alloys by alloy design, Journal of materials science 47, 4093 (2012).
[20] V. Moiseev, E. Polyak, and A. Y. Sokolova, Martensite strengthening of titanium alloys, Metal
Science and Heat Treatment 17, 687 (1975).
[21] T. Duerig, R. Middleton, G. Terlinde, and J. Williams, Stress assisted transformation in ti-10v-
2fe-3al, in Titanium ’80 Science and Technology, Proceedings of the 4th Int’l Conference on Tita-
nium, Vol. 2, edited by H. Kimura and O. Izuma (1980).
[22] J. Murray, Phase diagrams of binary titanium alloys (ASM International, 1987).
[23] F. Sun, J. Zhang, M. Marteleur, C. Brozek, E. Rauch, M. Veron, P. Vermaut, P. Jacques, and
F. Prima, A new titanium alloy with a combination of high strength, high strain hardening and
improved ductility, Scripta Materialia 94, 17 (2015).
[24] L. Li, W. Mei, H. Xing, X. Wang, and J. Sun, Zigzag configuration of mechanical twin and stress-
induced omega phase in metastable β ti-34nb (at.%) alloy, Journal of Alloys and Compounds
(2014).
Bibliography 79
[25] M. Ahmed, D. Wexler, G. Casillas, O. M. Ivasishin, and E. V. Pereloma, The influence of β phase
stability on deformation mode and compressive mechanical properties of ti–10v–3fe–3al alloy,
Acta Materialia 84, 124 (2015).
[26] L. Hsiung and D. Lassila, Shock-induced omega phase in tantalum, Scripta materialia 38, 1371
(1998).
[27] S. Sikka, Y. Vohra, and R. Chidambaram, Omega phase in materials, Progress in Materials Sci-
ence 27, 245 (1982).
[28] P. Lazar, M. Jahnátek, J. Hafner, N. Nagasako, R. Asahi, C. Blaas-Schenner, M. Stöhr, and R. Pod-
loucky, Temperature-induced martensitic phase transitions in gum-metal approximants: First-
principles investigations for ti 3 nb, Physical Review B 84, 054202 (2011).
[29] M. Peters, G. Ziegler, and G. Lütjering, Control of microstructures of α+β-titanium alloys,
Zeitschrift für Metallkunde 74, 274 (1983).
[30] R. P. Kolli, W. J. Joost, and S. Ankem, Phase stability and stress-induced transformations in beta
titanium alloys, JOM , 1 (2015).
[31] H.-S. Kim, S.-H. Lim, I.-D. Yeo, and W.-Y. Kim, Stress-induced martensitic transformation of
metastable β-titanium alloy, Materials Science and Engineering: A 449, 322 (2007).
[32] C. Li, X. Wu, J. H. Chen, and S. van der Zwaag, Influence of α morphology and volume frac-
tion on the stress-induced martensitic transformation in ti–10v–2fe–3al, Materials Science and
Engineering: A 528, 5854 (2011).
[33] S. Neelakantan, P. Rivera-Díaz-del Castillo, and S. van der Zwaag, Prediction of the martensite
start temperature for β titanium alloys as a function of composition, Scripta Materialia 60, 611
(2009).
[34] Z. Nishiyama, Martensitic Transformation (Elsevier, 2012).
[35] N. N. Thadhani and M. A. Meyers, Kinetics of isothermal martensitic transformation, Progress
in Materials Science 30, 1 (1986).
[36] S. Kustov, D. Salas, E. Cesari, R. Santamarta, and J. Van Humbeeck, Isothermal and athermal
martensitic transformations in ni–ti shape memory alloys, Acta Materialia 60, 2578 (2012).
80 Bibliography
[37] K. Otsuka, X. Ren, and T. Takeda, Experimental test for a possible isothermal martensitic trans-
formation in a ti–ni alloy, Scripta materialia 45, 145 (2001).
[38] T. B. Massalski, Comments concerning some features of phase diagrams and phase transforma-
tions, Materials transactions 51, 583 (2010).
[39] G. Kurdyumov and L. Khandros, On the “thermoelastic” equilibrium on martensitic transfor-
mations, in Dokl. Akad. Nauk SSSR, Vol. 66 (1949) pp. 211–214.
[40] A. Tyshchenko, W. Theisen, A. Oppenkowski, S. Siebert, O. Razumov, A. Skoblik, V. Sirosh, Y. N.
Petrov, and V. Gavriljuk, Low-temperature martensitic transformation and deep cryogenic treat-
ment of a tool steel, Materials Science and Engineering: A 527, 7027 (2010).
[41] Y. Zhang, D. Kent, G. Wang, D. St John, and M. Dargusch, Evolution of the microstructure and
mechanical properties during fabrication of mini-tubes from a biomedical β-titanium alloy,
Journal of the mechanical behavior of biomedical materials 42, 207 (2015).
[42] C. Li, J. H. Chen, X. Wu, and S. van der Zwaag, Effect of strain rate on stress-induced marten-
sitic formation and the compressive properties of ti–v–(cr, fe)–al alloys, Materials Science and
Engineering: A 573, 111 (2013).
[43] Z. Xu and Y. Zhang, Quench rates in air, water, and liquid nitrogen, and inference of temperature
in volcanic eruption columns, Earth and Planetary Science Letters 200, 315 (2002).
[44] S. M. C. Van Bohemen, J. Sietsma, and S. Van der Zwaag, Experimental observations elucidat-
ing the mechanisms of structural bcc-hcp transformations in β-ti alloys, Physical Review B 74,
134114 (2006).
[45] T. G. Bradley, W. A. Brantley, and B. M. Culbertson, Differential scanning calorimetry (dsc) anal-
yses of superelastic and nonsuperelastic nickel-titanium orthodontic wires, American Journal of
Orthodontics and Dentofacial Orthopedics 109, 589 (1996).
[46] W. A. Brantley, M. Iijima, and T. H. Grentzer, Temperature-modulated dsc provides new insight
about nickel-titanium wire transformations, American journal of orthodontics and dentofacial
orthopedics 124, 387 (2003).
[47] P. Unwin, G. Lorimer, and R. Nicholson, The origin of the grain boundary precipitate free zone,
Acta Metallurgica 17, 1363 (1969).
Bibliography 81
[48] J. T. Armstrong, Quantitative elemental analysis of individual microparticles with electron
beam instruments, in Electron probe quantitation (Springer, 1991) pp. 261–315.
[49] Y. Sun, S. Gulizia, C. Oh, C. Doblin, Y. Yang, and M. Qian, Manipulation and characterization
of a novel titanium powder precursor for additive manufacturing applications, JOM 67, 564
(2015).
[50] M. J. Donachie, Titanium: a technical guide (ASM international, 2000).
[51] L. Thijs, F. Verhaeghe, T. Craeghs, J. Van Humbeeck, and J.-P. Kruth, A study of the microstruc-
tural evolution during selective laser melting of ti–6al–4v, Acta Materialia 58, 3303 (2010).
[52] L. Murr, S. Quinones, S. Gaytan, M. Lopez, A. Rodela, E. Martinez, D. Hernandez, E. Martinez,
F. Medina, and R. Wicker, Microstructure and mechanical behavior of ti–6al–4v produced by
rapid-layer manufacturing, for biomedical applications, Journal of the Mechanical Behavior of
Biomedical Materials 2, 20 (2009).
[53] L. Murr, E. Esquivel, S. Quinones, S. Gaytan, M. Lopez, E. Martinez, F. Medina, D. Hernandez,
E. Martinez, J. Martinez, et al., Microstructures and mechanical properties of electron beam-
rapid manufactured ti–6al–4v biomedical prototypes compared to wrought ti–6al–4v, Materials
Characterization 60, 96 (2009).
[54] P. Kobryn, E. Moore, and S. Semiatin, The effect of laser power and traverse speed on microstruc-
ture, porosity, and build height in laser-deposited ti-6al-4v, Scripta Materialia 43, 299 (2000).
[55] P. Kobryn and S. Semiatin, Microstructure and texture evolution during solidification processing
of ti–6al–4v, Journal of Materials Processing Technology 135, 330 (2003).
[56] S. Bontha, N. W. Klingbeil, P. A. Kobryn, and H. L. Fraser, Effects of process variables and size-
scale on solidification microstructure in beam-based fabrication of bulky 3d structures, Materi-
als Science and Engineering: A 513, 311 (2009).
[57] N. A. Pohlman, J. A. Roberts, and M. J. Gonser, Characterization of titanium powder: Micro-
scopic views and macroscopic flow, Powder Technology 228, 141 (2012).
[58] A. Bauereiß, T. Scharowsky, and C. Körner, Defect generation and propagation mechanism dur-
ing additive manufacturing by selective beam melting, Journal of Materials Processing Technol-
ogy 214, 2522 (2014).
82 Bibliography
[59] E. Hall, The deformation and ageing of mild steel: Iii discussion of results, Proceedings of the
Physical Society. Section B 64, 747 (1951).
[60] W. Xu, S. Sun, J. Elambasseril, Q. Liu, M. Brandt, and M. Qian, Ti-6al-4v additively manufac-
tured by selective laser melting with superior mechanical properties, JOM 67, 668 (2015).
[61] T. Ahmed and H. Rack, Phase transformations during cooling inα+β titanium alloys, Materials
Science and Engineering: A 243, 206 (1998).
[62] T. Duerig, G. Terlinde, and J. Williams, Phase transformations and tensile properties of ti-10v-
2fe-3ai, Metallurgical Transactions A 11, 1987 (1980).
[63] T. Duerig, D. Richter, and J. Albrecht, Shape memory in ti-10v-2fe-3al, Scripta Metallurgica 16,
957 (1982).
[64] P. Barriobero-Vila, G. Requena, F. Warchomicka, A. Stark, N. Schell, and T. Buslaps, Phase trans-
formation kinetics during continuous heating of a β-quenched ti–10v–2fe–3al alloy, Journal of
Materials Science 50, 1412 (2015).
[65] F. Gil and J. Planell, Behaviour of normal grain growth kinetics in single phase titanium and
titanium alloys, Materials Science and Engineering: A 283, 17 (2000).
[66] Y. Liu and H. Yang, The concern of elasticity in stress-induced martensitic transformation in niti,
Materials Science and Engineering: A 260, 240 (1999).
[67] B. Appolaire, L. Héricher, and E. Aeby-Gautier, Modelling of phase transformation kinetics in ti
alloys–isothermal treatments, Acta materialia 53, 3001 (2005).
[68] A. Bhattacharjee, S. Bhargava, V. Varma, S. Kamat, and A. Gogia, Effect of β grain size on stress
induced martensitic transformation in β solution treated ti–10v–2fe–3al alloy, Scripta materi-
alia 53, 195 (2005).
[69] H. Sakamoto, Distinction between thermal and stress-induced martensitic transformations and
inhomogeneity in internal stress, Materials Transactions 43, 2249 (2002).
[70] G. Olson and M. Cohen, Thermoelastic behavior in martensitic transformations, Scripta Metal-
lurgica 9, 1247 (1975).