Embed Size (px)
Citation preview

Metaview: A Tool for Learning About Viewing in 3D
James R. Miller Electrical Engineering and Computer Science
1520 W. 15 Street; 2001 Eaton Hall Lawrence, KS 66045
1-785-864-7384
ABSTRACT Metaview is an interactive tool that helps to teach concepts related to nested 3D coordinate systems, especially in the context of defining and establishing views of 3D scenes in common graphics APIs like OpenGL and Direct3D. We describe the context in which nested coordinate systems arise in the study of graphics programming, then we relate the common conceptual difficulties students typically experience when studying and trying to put this material into practice. We then describe the role that metaview plays in helping to overcome these problems. Space allows us only to describe its core uses in these areas; several of its additional features are briefly listed at the end. Metaview is packaged with a set of built-in 3D models used to demonstrate major concepts. In addition, external and/or student-programmed models are easily imported into the tool. Metaview can be run anywhere, anytime using Java Web Start. The latest released version of the tool can be executed from http://people.eecs.ku.edu/~miller/JOGL/metaview.jnlp. We are currently working on a port to OpenGL ES targeted for portable smart devices such as tablet computers.
Categories and Subject Descriptors K.3.1 [Computers and Education]: Computer Uses in Education – distance learning
K.3.2 [Computers and Education]: Computer and Information Science and Education – computer science education; self-assessment
General Terms Design, Experimentation, Human Factors.
Keywords Computer-aided Learning; Educational Technology; Computer-Graphics; Self-paced learning.
1. INTRODUCTION Learning how to employ a 3D graphics API like OpenGL [10] or Direct3D [8] to generate specific desired views of 3D models
seems to be a difficult skill for typical upper level undergraduates to master. Users of turnkey 3D modeling systems frequently experience analogous challenges when trying to understand how to build, view, and animate a 3D model. Especially problematic is the case when a 3D model (or the piece of it in which we are currently interested) has unequal dimensions with respect to the coordinate axes and/or is not near the origin of the coordinate system. In such cases, the graphics programmer must understand and bring to bear a solid understanding of how the various coordinate systems used by the graphics engine (most notably, the world and eye systems whose definitions are reviewed below) are specified as well as how they relate to one another and to the coordinate system of the display device.
Our Introduction to Computer Graphics course is targeted towards senior undergraduates, although there will typically be some beginning graduate students as well. No prior knowledge of computer graphics is assumed. There is no formal laboratory associated with the course, however students complete about four programming projects that require increasingly sophisticated uses of OpenGL. After quite a few years teaching this course, a number of conceptual problems related to viewing in 3D have been observed to cause high levels of frustration for students. This paper describes the design and use of metaview, an interactive graphics tool designed to help students achieve a deeper understanding of viewing in 3D in the context of a conventional graphics API.
Before they begin using the metaview tool described here, students learn about basic 2D graphics concepts including defining geometry, using window-viewport transformations, modeling transformations, handling events, creating animations, and so forth. The first two projects allow them to use these concepts in practice, and they generally do very well. However, the transition to 3D is a significant one. Lectures and assigned readings from the text (currently [1]; formerly [6]) describe the major concepts, but experience has shown that, even when warned about the quantum jump in difficulty they will see with their first 3D project, many students ignore this, only to achieve high levels of frustration as they labor late into the night a day or so before the due date.
Of course an enormous amount of related information and examples can be easily located on the internet, but as noted in [5], this more often than not simply serves to confuse them even more because the examples often include certain advanced features not yet discussed in class that have non-obvious side effects and/or additional requirements that students don’t notice or don’t understand.
Spending meaningful time learning concepts and completing projects is vitally important to mastering the material [11]. The
Permission to make digital or hard copies of all or part of this work for personal or classroom use is granted without fee provided that copies are not made or distributed for profit or commercial advantage and that copies bear this notice and the full citation on the first page. To copy otherwise, or republish, to post on servers or to redistribute to lists, requires prior specific permission and/or a fee.SIGCSE’12, February 29–March 3, 2012, Raleigh, North Carolina, USA.Copyright 2012 ACM 978-1-4503-1098-7/12/02...$10.00.
135

goal of this effort was therefore to provide an easy-to-use interactive learning tool that is accessible whenever and wherever students find themselves working that can help them over some of the major stumbling blocks in 3D modeling and viewing, for example, achieving expected views of 3D objects, both when generating still images as well as animated sequences such as 3D walk-throughs.
When helping the student make the connection between the viewing abstraction and a programming construct, a specific graphics API had to be chosen. Two obvious candidates were OpenGL [10] and Direct3D [8]. Moreover, two styles are common in OpenGL: classical v2.1 with routines like gluLookAt, and the more modern v3.3 and later in which gluLookAt and many other routines have been deprecated along with the fixed function pipeline. There is a 1-1 mapping between the viewing-related functions in OpenGL 2.1 and their counterparts in Direct3D. Moreover, even in OpenGL 3.3, it is common for programmers to use their own versions of analogous routines. In the end, we chose to use generic names and formal parameter calling sequences, based loosely on the OpenGL 2.1 conventions since we use OpenGL in classes here. Obviously it is trivial to alter these mappings for other environments.
2. RELATED WORK Significant real estate is allocated in common textbooks to the development of an intuition for viewing in 3D (e.g., [1, 6, 10]). A typical textbook starting point for this intuition is to introduce and develop a camera analogy. Figures illustrate moving the camera around, sometimes with attached depictions of coordinate system axes, and snapping pictures. Sometimes the development of the intuition is intermixed with the mathematics and/or computer code representing one way to carry out the operations.
Since the presentation is static in the textbook, students are of course unable to try different viewing orientations or incorporate their own models. Experience with metaview has shown that the ability to interact with the viewing abstraction seems to enhance the ability to master the relationships among the coordinate systems. Coupled with a small set of key text displays that are kept in sync as the student directly manipulates key graphical abstractions, this knowledge is then more quickly transferred to an understanding of how to use a given graphics API to achieve desired views.
An early inspiration for the tool described here came from illustrations in [6] in which photographs of hands holding tinker toys were used in an attempt to make the relationship among the various coordinate systems concrete. After trying that exact technique once in class here, it was obvious that it was helpful to have a physical abstraction that was not restricted to the pages of the textbook. At the same time, it was also obvious that so much more could be done if the abstraction were a bit more flexible and embedded in a more powerful interactive framework.
The birth and evolution of metaview began shortly thereafter, now just over a decade ago. It started as a simple C++-based OpenGL program with a single object (the “XYZCube” that is now a part of the startup screens), using the GLUI [9] for interactive controls. The initial goal was to make the tinker toy idea a bit more interactive as well as to make some visuals for lectures and handouts. After the first couple of years, I noticed students being more engaged in those lectures and asking better questions. Some of the feedback I received was that they wanted to be able to run the program themselves outside of class and incorporate their own
(or at least other) models. Unfortunately, it had never been designed for use by anyone other than the instructor, and it was incomplete and idiosyncratic in operation.
After spending some time making the tool a bit more robust and intuitive, I made it available on the machines allocated to the course. This proved useful, but was not nearly as effective as had been hoped, largely because by that time students were increasingly using their own machines and resisted trips to the lab just to use this tool. The answer seemed to be to make it available on their machines, but that immediately led to innumerable problems related to different operating systems and a host of configuration issues.
The emergence of Java, Java OpenGL (JOGL), and Java Web Start led to what ultimately proved to be a viable solution. The original tool was completely redesigned and redeveloped in Java/JOGL, using Swing for the GUI. Many additional features were added (and continue to be added) as well, and the result is the version described in this paper.
While this evolution of metaview was occurring, other interactive tools appeared. Three-dimensional modeling toolkits including Maya [2] and Blender [3] had appeared, providing the ability to create and animate elaborate 3D models. Instructors at a few universities had started to use these and similar tools to present, teach, and explore these concepts in an interactive setting.
We learned more recently of two other comprehensive interactive educational systems that were evolving over the same period of time. The Brown University Computer Graphics Research Group is actively developing the Exploratory Project [4]. The long-term goal is to develop a rich set of learning modules for a variety of topics. Their current products include tools for teaching 3D graphics concepts such as those presented here.
The system described by Hunkins [7] consists of a set of interactive OpenGL-based programs used to illustrate and teach 3D graphics concepts such as those targeted by metaview. The version described in [7] is written in C++ using the C binding to OpenGL 2.1 and is supported on Windows machines. Hunkins referred to development of a Java-JOGL version as well [7].
3. MAIN CONTRIBUTIONS OF THIS EFFORT As noted in the previous section, there are many books, articles, and online tutorials that include static pictures and descriptions of this process. There are also some interactive tools that have been employed. Unique aspects of metaview include:
• It can be used as a platform independent and completely turnkey system. The application downloads and launches automatically via Java web start following, for example, clicking on a link in a web page. This avoids platform-specific installation issues and involvement of system administrators. It also makes it readily accessible to non-programmer users. Access to the metaview system is freely available to anyone.
• In addition to using numerical spinner controls, students can directly manipulate the graphical abstractions of the viewing parameters. They can click and drag the eye, the center of attention, and all the other parameters reviewed and discussed below. Regardless of whether students type new values or directly manipulate the graphical abstractions, both are kept in sync by the system. Direct manipulation of certain quantities (e.g., the view frustum) is correctly constrained to maintain its
136
proper orientation with respect to the eye coordinate system. Other quantities are unconstrained, but they are allowed to be constrained. Constraining how the eye point can be dragged, for example, allows it to be moved around without altering the direction of the reference line of sight.
• In addition to normal orthogonal and perspective viewing, metaview helps students learn the mechanics of stereoscopic viewing by presenting a pair of eye points, each with its own view frustum along with the two resulting left and right eye images.
• The projection plane position is unrestricted. Metaview allows the plane to be positioned anywhere inside the view volume. This helps students understand and control phenomena like motion parallax in animations.
• In addition to the models that come bundled with metaview, users can import their own models into the metaview framework, either by importing a Wavefront obj file or by writing a simple pair of classes whose structure is documented along with a complete example in the greeting page that appears when the application starts. The latter is especially helpful for students when trying to understand how to focus on arbitrary portions of their own models.
• While originally developed to illustrate how viewing in standard interactive 3D APIs worked, the tool can also be used for a variety of other purposes such as visualizing issues related to aliasing and antialiasing and understanding how the ray tracing rendering paradigm works.
4. COORDINATE SYSTEMS AND TRANSFORMATIONS Before presenting the educational aspects of the metaview tool and describing its use in class, some basic concepts must be established so that the features of metaview will make sense to the reader. Virtually all modern graphics APIs utilize multiple coordinate systems. During rendering, vertices of primitives are transformed from one coordinate system to the next until pixels on the display covered by the primitives are determined. The typical progression of coordinate systems through which each vertex passes is, in order: modeling coordinates, world coordinates, eye coordinates, normalized projection coordinates, and device (pixel) coordinates. The names used by specific graphics APIs vary somewhat, but conceptually they all use this same sequence. The
definition and use of the systems of primary interest to us here is briefly reviewed below.
Modeling coordinate systems employ application-defined units (e.g., centimeters, angstroms) and provide a basic reference frame in which subcomponents of a model can be defined by assuming a simple placement and orientation with respect to the modeling system axes. A complete model can be assembled by creating a hierarchy of modeling coordinate systems by successively placing one or more systems inside of a parent system. The highest level modeling coordinate system is called the world coordinate system. Note that the geometry of this model is view-independent.
Once this view-independent model geometry has been defined, creating a view of the model can be imagined as representing it in a different coordinate system whose axes have specific relationships with respect to the view and display device. This is typically accomplished in two stages using two successive coordinate systems. The first is called the eye coordinate system and is defined so that a reference line of sight is along the negative z-axis; the x- and y-axes are parallel to the horizontal and vertical display device directions, respectively. The transformation from world coordinates to eye coordinates is a rigid one that simply re-orients and translates the model while preserving the basic application units (e.g., centimeters). A subsequent transformation accounts for the field of view, a desired 3D to 2D projection method (e.g., orthogonal or perspective), and a mapping to a logical device coordinate viewport region.
For a variety of reasons, the field of view is defined in the eye coordinate system; not in world coordinates. This seemingly simple fact is one of the major sources of confusion experienced by students, and it is therefore one of the more important intuitions that metaview seeks to solidify.
When defining the view-independent structure of the model, a graphics programmer is typically concerned only with modeling and world coordinates, including how the various component modeling systems are placed inside of one another. Students generally have relatively little conceptual difficulty with this step. On the other hand, significant conceptual difficulties often arise in the next step as the programmer tries to generate desired views by creating an appropriate world coordinate to eye coordinate transformation and then using the resulting eye coordinate system to define an appropriate projection system. It was to help with the intuition and development of these two transformations that metaview was originally designed.
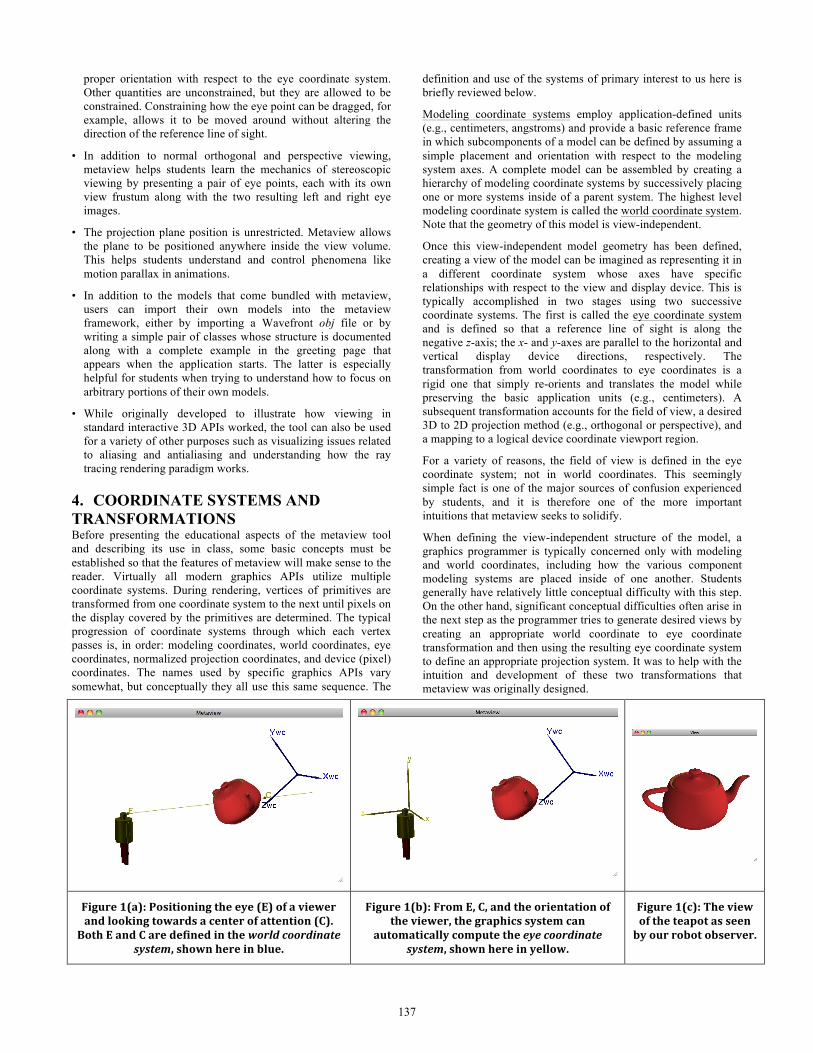
Figure 1(a): Positioning the eye (E) of a viewer and looking towards a center of attention (C). Both E and C are defined in the world coordinate
system, shown here in blue.
Figure 1(b): From E, C, and the orientation of the viewer, the graphics system can
automatically compute the eye coordinate system, shown here in yellow.
Figure 1(c): The view of the teapot as seen by our robot observer.
137

4.1 Defining the World to Eye Coordinate System Transformation The physical analogy involves someone standing at some position in the world coordinate space, looking towards another point in the same space. This defines the reference line of sight mentioned above. See Figure 1(a) in which we use a robot model as an abstraction of our viewer or observer.
The reference line of sight is directed from the eye point towards the center of attention and becomes the negative z-axis of the eye coordinate system, and the position of the observer (more precisely, the position of the observer’s eye) becomes the origin of the eye coordinate system as shown in Figure 1(b). What the robot viewer will see is shown in Figure 1(c).
For monoscopic views, the eye can be imagined as either the left or the right eye; for stereoscopic views, we generate two eye coordinate systems and two views, one for each eye. With this background on coordinate systems and transformations between them, we can begin our description of how metaview contributes to the educational experience of students in graphics classes.
5. STUDENT LEARNING OBJECTIVES Generating desired views of a 3D model is surprisingly hard for beginning graphics programmers. It is even harder if the desired view represents some arbitrary subset of their model. Oftentimes it is straightforward for students to create basic views of simple models because they can arrange to have the world and eye coordinate systems being very similar to one another. When this happens, it is almost irrelevant whether certain information is given in one frame or the other, and in any event, simple trial and error parameter tweaking quickly yields a reasonable view. Unfortunately the students are left at this point without a real understanding of what they have done or why it worked. Worse yet, they often create such nearly identical systems without realizing it. Then when they need to make a change – for example, to focus on some detail in some remote location of their model – they are totally baffled when the result is a blank screen. They then revert to trial and error parameter tweaking using their intuition, usually just making things worse. These problems are often exacerbated if their model happens to have quite different dimensions along the three world coordinate axes as illustrated in some of the examples below.
The primary learning objective, then, was to help students more quickly and efficiently master these concepts. The approach was to provide an interactive tool with a variety of built-in self-test features with built-in checks for correctness so that students could access and learn anytime and anywhere. More specifically, the learning objectives included:
• Develop the intuition surrounding how an observer relates to a world coordinate system, how this relationship determines the relationship between the world and eye coordinate systems, and the significance of the fact that the view frustum is defined in eye, not world, coordinates. It is over this latter point that students especially stumble.
• Understand how to apply knowledge of the relationships mentioned in the previous objective to an actual graphics API (in our case, OpenGL [10]) so that desired views can be easily and naturally generated.
• Understand how several other important imaging concepts relate. Included are: parallel versus perspective projections,
controlling the amount of perspective distortion, impact of placement of the projection plane on effects like motion parallax in animations, image generation by projection versus by ray tracing, aliasing and antialiasing.
• Encourage students to engage in meaningful self-assessment of their understanding of these concepts in a variety of ways:
° Find and generate specific views of objects hidden in the metaview program.
° Directly insert their own arbitrarily complex model (either implemented in code or imported from a file) into the metaview framework to explore how to create desired views of all or parts of it.
6. TOOLS, METHODS, AND EXERCISES DEVELOPED When the program starts, the user sees the three windows shown in Figure 2. The window on the bottom is a tabbed Control Panel with several exploration, annotation, and self-test features. The tab initially shown is a general greeting that begins with an explanation of the motivation and context for the metaview tool. This greeting explains that the window on the left (labeled “View”) always contains a rendering of a 3D scene with some assumed line of sight, field of view, and projection type. The window on the right (labeled “Metaview”) is a visual abstraction of how the view on the left was determined. It goes on to explain that the robot is an abstraction of the viewer, and the “View” image on the left is what the robot “sees” when viewing the model as indicated. The “Metaview” window contains a static text label at the bottom explaining to the user that the world coordinate axes are shown in blue, while the eye coordinate system axes are in yellow. This text will be suppressed in the rest of the figures in the paper. There are also dynamic text labels on the bottom of the “View” window that will be discussed later.
Figure 2: The three windows of the metaview program when
the program launches.
The basic interactive controls are also described in the greeting tab. Included is a description of how the mouse works in the metaview window and what controls are to be found in the other tabs of the control panel.
138

6.1 Tools for Visualizing Relationships among World and Eye Systems and the Frustum In their initial study of 2D graphics, students learn about the world coordinate window, a rectangular subset of the xy-plane such that only that portion of a model inside the window will actually appear on the display. The analog in 3D is the view frustum, drawn as a yellow truncated pyramid in Figure 3(a). While the basic role is the same (i.e., only that part of our 3D scene lying inside the frustum will appear on the display), the important difference is that the frustum is defined in the eye coordinate system in 3D. (It actually is defined in eye coordinates in 2D as well, but the default 3D-related view parameters are such that the typical 2D programmer is not aware of the fact.) As mentioned earlier, internalizing and truly understanding this fact is often difficult for students. The metaview approach to conveying this idea is discussed next.
Three quantities uniquely define the eye coordinate system: the eye point (E), the center of attention (C), and an orientation determined by a so-called “up” vector. The component of the “up” vector perpendicular to the reference line of sight determines the positive y direction of the eye coordinate system. Once the programmer provides E, C, and up (e.g., as shown in Figure 3(a)) the graphics system computes the x, y, and z eye system axis directions – also shown in Figure 3(a) – which determine the orientation of the “View” image shown in Figure 3(b).
One exercise students perform is to modify the viewing parameters by direct manipulation. For example, starting with the configuration in Figure 3(a), the student can grab the observer and
drag it around in world coordinate space (Figure 3(c)). What is observed while doing so is that (i) the xyz eye coordinate axes move rigidly along with the observer, and (ii) the frustum also rigidly moves with the observer and eye coordinate system. Meanwhile, the “View” image in the “View” window always shows what the observer currently sees (Figure 3(d)). Continuously updated text labels at the bottom of the View window show “lookAt” and projection function parameters corresponding to the current position of the observer. Even though the frustum moves with the observer, the students see that only the numeric values for “lookAt” actually change while dragging the observer around. The combination of these observations clarifies the meaning of and cements the idea that the view frustum is defined in eye coordinates.
The role of the up vector is also sometimes hard for students to grasp. For example, the fact that it is just a reference direction used to determine the actual eye coordinate system y axis – i.e., up is not necessarily equal to y – is confusing. Its role is to fix the degree of freedom corresponding to a rotation of the viewer about the eye coordinate system z-axis. Starting with the situation depicted in Figure 4(a), for example, the student observes that certain types of changes to the up vector have no effect on the eye coordinate system (and hence the view frustum) whatsoever. Specifically, any changes to the up vector that do not change the plane containing E, C, and up, and that leave the up vector on the same side of the line of sight in that plane will have no effect. Compare Figure 4(a) to Figure 4(b). The up vectors differ, but the resulting eye coordinate systems are the same, hence the resulting image (Figure 4(c)) is the same in either case. Changes that do not alter the plane, but lead to the up vector being in the opposite half of the plane turn the observer on its head (Figure 4(d)), producing the view of Figure 4(e).
7. DISCUSSION Space constraints limit the features of metaview we can discuss. In addition to the core features described, metaview facilitates an understanding of different projection types; what influences and how to control the amount of perspective distortion; stereoscopic viewing in which two frustums and two View images are presented; aliasing and antialiasing techniques; ray tracing; and issues related to parallax. Moreover, students can easily add their own models to metaview, either programmatically or via Wavefront obj files.
In addition, there are several exploration, self-test, and self-assessment features in the Control Panel tabs that could not be completely described here. For example, several models are
Figure 3(a); E, C, up define the Eye Coordinate System
Figure 3(b): The “View” from 3(a) Figure 3(c): Interactively dragging the observer to another location
Figure 3(d): The “View” after the direct manipulation in (c).
139

“hidden” in the environment. Students can query the world coordinate bounding box for such objects and then test their understanding by manually setting viewing and projection parameters to try to obtain specified views of the hidden objects. For example, “generate a view of the rear of the castle, using an approximate line of sight from the red turret towards the flag”.
While no formal user study has been performed, we have solicited anonymous feedback from students from the past few offerings of the course. The feedback has generally been positive, exposed some bugs that have been corrected, and led to some useful usability improvements, both to the metaview program itself as well as to a web site often used in conjunction with the program.
8. FUTURE DIRECTIONS While the Java Web Start mechanism used for launching the program has proven to be very effective, the emergence of portable smart devices like tablets has made it clear that an OpenGL ES version should be developed. Such devices do not currently support (and may never support) Java Web Start, hence design for an OpenGL ES port is underway.
Also underway is design and development for functionality that will allow interactive placement of light sources of various types. Among other things, goals include understanding the implications of light source placement in various coordinate systems, most notably world versus eye.
9. ACKNOWLEDGMENTS The work described here was supported in part by the National Science Foundation under Grant No. 0633016. Any opinions, findings, and conclusions or recommendations expressed in this material are those of the author and do not necessarily reflect the views of the National Science Foundation. I would also like to thank the creative and mostly anonymous designers that make their models freely available for use without restriction. The saloon and stagecoach models used here were obtained from www.sharecg.com. Other such models are packaged with various
versions of metaview, and the “Info” display for those models acknowledges their source.
REFERENCES [1] Angel, E. 2012. Interactive Computer Graphics: A Top-
Down Approach With Shader-Based OpenGL. Addison-Wesley, Boston, MA. (6th edition).
[2] Autodesk. 2011. Autodesk Maya. Retrieved October 16, 2011 from http://usa.autodesk.com/maya.
[3] Blender. 2011. Blender. Retrieved October 16, 2011 from http://www.blender.org.
[4] Brown. 2011. Exploratories. Retrieved October 16, 2011 from http://www.cs.brown.edu/exploratories.
[5] Colace, F. and De Santo, M. 2010. Ontology for E-Learning: A Bayesian Approach. IEEE Transactions on Education 53 (May 2010), 223-233.
[6] Foley, J. D., van Dam, A., Feiner, S. K., and Hughes, J. F. 1990. Computer Graphics: Principles and Practice. Addison-Wesley, Reading, MA, (2nd edition).
[7] Hunkins, D. 2011. Computer Graphics: An Interactive Introduction with OpenGL. Retrieved October 16, 2011 from http://cgems.inesc.pt/ModuleInfo.aspx?id=79.
[8] Luna, D. 2008. Introduction to 3D Game Programming with DirectX 10. Wordware Publishing, Inc., Plano, Texas.
[9] Rademacher, P. 2011. GLUI User Interface Library. Retrieved October 16. 2011 from http://www.cs.unc.edu/~rademach/glui/.
[10] Schreiner, D., Woo, M., Neider, J., and Davis, T. 2008. OpenGL Programming Guide. Addison-Wesley, Boston, MA. (6th ed.).
[11] Wolf, T. 2010. Assessing Student Learning in a Virtual Laboratory Environment. IEEE Transactions on Education 53 (May 2010), 216-222.
Figure 4(a): The original viewing parameters.
Figure 4(b): (TOP) An up vector change that has no effect
Figure 4(c): (BOTTOM) “View” for settings shown in both 4(a) and 4(b)
Figure 4(d): An up vector setting that flips the viewer upside down.
Figure 4(e): (BOTTOM) “View” for settings shown in Figure 4(d)
140