Embed Size (px)
Citation preview
Ple
ase
note
that
this
is a
n au
thor
-pro
duce
d P
DF
of a
n ar
ticle
acc
epte
d fo
r pub
licat
ion
follo
win
g pe
er re
view
. The
def
initi
ve p
ublis
her-a
uthe
ntic
ated
ver
sion
is a
vaila
ble
on th
e pu
blis
her W
eb s
ite
1
Earth and Planetary Science Letters March 2006; 243(3-4) : 354-365 http://dx.doi.org/10.1016/j.epsl.2006.01.041© 2006 Elsevier B.V. All rights reserved
Archimer, archive institutionnelle de l’Ifremerhttp://www.ifremer.fr/docelec/
Methane discharge from a deep-sea submarine mud volcano into the upper water column by gas hydrate-coated methane bubbles
Eberhard J. Sautera*, Sergey I. Muyakshinb, Jean-Luc Charlouc, Michael Schlütera,
Antje Boetiusd, Kerstin Jeroscha, Ellen Damma, Jean-Paul Foucherc and Michael Klagesa
aAlfred Wegener Institute for Polar and Marine Research, Am Handelshafen 12, 27570 Bremerhaven, Germany bInstitute of Applied Physics of the Russian Academy of Sciences, 46 Uljanov Str., 603950 Nizhnii Novgorod, Russian Federation cDepartment of Marine Geosciences, IFREMER Centre de Brest, DRO/GM, BP 70, Plouzane Cedex 29280, France dMax Planck Institute for Marine Microbiology, 28359 Bremen, Germany *: Corresponding author : Tel.: +49 471 4831 1517; fax: +49 471 4831 1425. [email protected]
Abstract: The assessment of climate change factors includes a constraint of methane sources and sinks. Although marine geological sources are recognized as significant, unfortunately, most submarine sources remain poorly quantified. Beside cold vents and coastal anoxic sediments, the large number of submarine mud volcanoes (SMV) may contribute significantly to the oceanic methane pool. Recent research suggests that methane primarily released diffusively from deep-sea SMVs is immediately oxidized and, thus, has little climatic impact. New hydro-acoustic, visual, and geochemical observations performed at the deep-sea mud volcano Håkon Mosby reveal the discharge of gas hydrate-coated methane bubbles and gas hydrate flakes forming huge methane plumes extending from the seabed in 1250 m depth up to 750 m high into the water column. This depth coincides with the upper limit of the temperature–pressure field of gas hydrate stability. Hydrographic evidence suggests bubble-induced upwelling within the plume and extending above the hydrate stability zone. Thus, we propose that a significant portion of the methane from discharged methane bubbles can reach the upper water column, which may be explained due to the formation of hydrate skins. As the water mass of the plume rises to shallow water depths, methane dissolved from hydrated bubbles may be transported towards the surface and released to the atmosphere. Repeated acoustic surveys performed in 2002 and 2003 suggest continuous methane emission to the ocean. From seafloor visual observations we estimated a gas flux of 0.2 (0.08–0.36) mol s−1 which translates to several hundred tons yr−1 under the assumption of a steady discharge. Besides, methane was observed to be released by diffusion from sediments as well as by focused outflow of methane-rich water. In contrast to the bubble discharge, emission rates of these two pathways are estimated to be in the range of several tons yr−1 and, thus, to be of minor importance. Very low water column methane oxidation rates derived from incubation experiments with tritiated methane suggest that methane is distributed by currents rather than oxidized rapidly. Keywords: methane sources; plume; methane budget; submarine mud volcanoes; gas bubbles; gas hydrates; hydro-acoustics
Sauter et al., Methane discharge from a deep-sea submarine mud volcano
4
1. Introduction
The contribution of methane to current global warming is estimated to be about 15% [1].
Thus, constraining the sources and sinks of this important greenhouse gas whose
atmospheric concentration is still increasing, is critical to improve climate predictions. As
part of the global carbon cycle, enormous quantities of methane occur in marine sediments.
One mechanism to release methane from the sediment to the ocean is through submarine
mud volcanism. However, the mechanisms and fate of this discharge as well as its
quantification are poorly constrained. Worldwide, 103-105 submarine mud volcanoes
(SMVs) are believed to store 1010-1012 m3 of methane (54-5400 Mt of carbon; 1 Mt = 106
million metric tons) in associated gas hydrates [2]. Although, this is of minor importance
compared to the estimated 104 Gt of methane-carbon world-wide in gas hydrates, which
primarily occurs at continental margins [3], SMVs are estimated to release about 27 Mt
methane yr-1 to the ocean [4]. Many approaches have been undertaken to study methane
discharge from SMVs and other cold seeps such as decomposing gas hydrates. Depending
on ambient biogeochemical conditions, methane can rapidly dissolve and oxidize close
above the seafloor [5, 6, 7]. This supports the conclusion, that methane from oceanic
sources contributes little to atmospheric methane budgets, i.e. 5-15 Gt yr-1 compared to a
total emission of ~600 Gt yr-1 [8, 9].
However, there is also evidence that methane may not oxidize in the higher water column
for time scales of several years to decades [5, 10]. Oxidation rates are linked to parameters
such as temperature, pressure, and substrate availability in the water column [11]. In
addition, bubble discharge is a mechanism that can efficiently transfer methane not only
Sauter et al., Methane discharge from a deep-sea submarine mud volcano
5
from shallower hydrocarbon seep sites [e.g. 12] but also from water depths greater than
2000 m to upper water layers [13, 14, 15, 16]. Evidence also exists for deep seep sites. Gas
plumes were surveyed by acoustic means using transducer frequencies between 4 and 110
kHz [13-16]. There are also approaches to quantify the amount of gas release from hydro-
acoustic records [17, 18] as well as from visual bubble observations [19]. Rising bubbles
were observed to be protected against rapid dissolution by gas hydrate coating if released
within the temperature-pressure field of gas hydrate stability [20, 21]. Rising bubble plumes
induce an upwelling flow which further increases the vertical velocity of the bubbles and
also accelerates the surrounding water [12, 19, 22].
Here we present results from a multi-method approach obtained at the Håkon Mosby Mud
Volcano (HMMV) suggesting that considerable gaseous methane is released at 1250 m
water depth and rises to the upper water column as hydrate-coated bubbles. Although
subsequent to its discovery in 1989/1990 [23], various visual observations were performed
by manned and unmanned underwater vehicles [24, 25], no bubble gas emissions had been
observed [26, 27]. Instead it was assumed, that the methane released predominantly is
dissolved in vent fluids and rapidly oxidized in the lower water column [26]. However,
based on the results of our hydroacoustic, hydrographic, geochemical, and visual
observations, we further propose that bubble emissions occur and generate an upwelling
flow that may vertically transport plume water enhanced with dissolved methane above the
gas hydrate stability zone. Accordingly, methane dissolved from the plume may transfer to
surface waters and thus, potentially be released to the atmosphere. Data presented here
suggest the need to reassess the contribution of deep-sea gas seeps such as submarine mud
Sauter et al., Methane discharge from a deep-sea submarine mud volcano
6
volcanoes and gas hydrate deposits to atmospheric methane budget and the global climate
cycle.
2. Regional setting
The Håkon Mosby Mud Volcano (HMMV) is a structure ~1.5 km in diameter, situated in
1250 m water depth at the Norwegian-Barents-Spitzbergen continental margin (Fig. 1). The
HMMV is relatively well known due to numerous investigations [e.g. 26, 27, 28] and has
been proposed as characteristic of other deep-sea SMVs [4, 26] with respect to methane
seepage. The formation of the HMMV presumably happened concomitant with an earth
quake-triggered submarine land slide during the Late Pleistocene, 330-200 ka before
present [29, 30]. Today, fluidized sediments are expelled from HMMV’s interior to the
seafloor along with large amounts of methane [26]. The central area is characterized by
high thermal gradients and outcropping of fresh gray muds. In contrast, the outer regions
are covered by chemosynthetic communities dependent on diffusive methane and sulfide
fluxes from below [4, 31]. Diffusive discharge to the deep-sea occurs where methane is not
completely oxidized by microbial methanotrophs [32, 33, 34]. High methane oxidation
rates were found at the sediment surface [35].
The hydrographic regime above the HMMV is determined by the Norwegian Atlantic
Current which carries Atlantic Water along the Norwegian-Barents-Spitzbergen continental
margin to the north in the upper 600 m of the water column. Arctic Intermediate Water
flows beneath this water body. A more detailed description of the geologic and
oceanographic setting of HMMV is given in Refs. [26] and [33], respectively.
Sauter et al., Methane discharge from a deep-sea submarine mud volcano
7
3. Methods and materials
Field campaigns
Field data were acquired during the two expeditions ARK XVIII/1b (30.7.-24.8.2002,
Longyearbyen-Tromsø), and ARK XIX/3b (20.6.-19.7.2003, Tromsø- Tromsø) with RV
“Polarstern”. During the ARK XIX/3b in situ observations and sampling were performed
with the ROV “Victor 6000”.
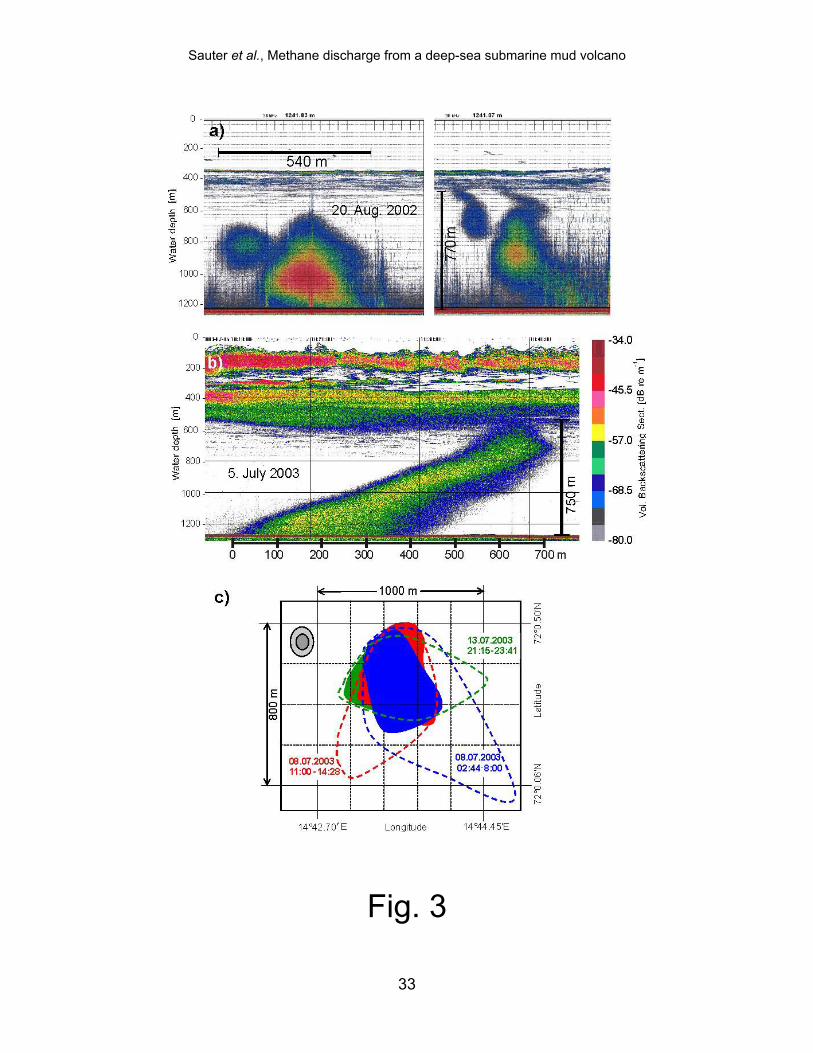
Acoustic images of water column methane plumes: Echograms were obtained by a
shipborn SimradTM EK60 echo sounder in 2002 (Fig. 3a), and 2003 (Fig 3b). The relevant
echo sounder frequency was 38 kHz. The system was characterized by a beam width of
7.1°, a pulse duration of 4 msec, and a spatial resolution of ~3 m. The repetition period was
selected to be 3 sec and the electrical power output was 2000 W. Echograms show the
volume backscattering section in the range of -80 to –34 dB re m-1 whereat the unit
represents the volume backscattering coefficient measured in decibels referenced to 1
steradian (= 1 m2 m-3 = 1 m-1). The ship’s speed during acoustic surveys was 1.5 to 2 knots
equivalent to 0.8-1.0 m s-1.
Visual observations of bubble discharge: At the sea floor the ROV “Victor 6000” was
navigated by up to 7 video cameras, of which 4 were recorded to DVD. The best quality
sequences were obtained by a 3-CCD TV camera (SonyTM DXC 990 P), which could be
maneuvered by an electric motor. Still photographs were taken with a Sony CybershotTM
digital still camera mounted above the ROV’s main video camera.
Image analysis was performed with the software package AnalySIS Pro version 3.0 (Soft
Imaging System GmbH). Contrast and background optimized digital still images were
Sauter et al., Methane discharge from a deep-sea submarine mud volcano
8
converted to binary format for determination of bubble size distribution. Size calibration
was done by comparison with objects of known dimensions in the field of view, e.g.
sampling tools or parts of the ROV. Although high quality images were obtained from the
video and still cameras with a field of view size on a meter scale, bubbles, one to several
millimeters in diameter were depicted close to the pixelation size limit. Therefore, there is
considerable uncertainty in bubble size, which we estimate was ± 1 mm in diameter.
Correspondingly, this introduces a large uncertainty into the bubble volume, especially for
small bubbles, since it varies as the radius cubed. Additional uncertainty arises from the
observation angle which was not perpendicular to the bubble stream since the ROV had to
be positioned on a hummocky, uneven seafloor close to the bubble seep. Therefore, an
average calibration scale was estimated from comparison with objects of known size. Due
to these uncertainties, we simplified the calculation of the bubble volume to spherical
instead of ellipsoidal shaped bubbles [22, 36]. To account for the uncertainties in the
volume determination, the bubble volume was calculated for bubble size distributions as
obtained by image analysis but also for the bubble radii ± 0.5 mm as lower and upper
limits, respectively.
Similar uncertainties affect the determination of bubble rise velocities. Beside the angled
view of the plume tilted by the bottom current, the bubble discharge appeared to be pulsed.
Thus it was difficult to derive exact values. A mean bubble rise velocity was estimated
from a number of individual measurements. Rise velocity strongly depends on bubble size
[19] and density, which are affected by surface state, the presence and thickness of a gas
hydrate skin as well as by possible sediment inclusions.
Sauter et al., Methane discharge from a deep-sea submarine mud volcano
9
Hydrographic measurements: A Sea-Bird ElectronicsTM CTD1 (SBE911plus) was used
together with a rosette water sampler (SBE-32) for hydrographic measurements.
Temperature was cross calibrated against a high-precision thermometer (SBE35) during
bottle closure while remaining ~2-3 minutes at constant depth. Salinity was inter-calibrated
against salinity measurements of water samples with a lab salinometer (Guildline 8400B).
Calibration is further described in ref. [37]. For transmission and optical backscatter
measurements a C-Star Wet LabTM transmissiometer and a SeaTechTM nephelometer were
attached to the CTD probe.
Methane analyses: Methane concentrations were analyzed onboard by headspace
technique from unpoisoned water samples immediately after retrieval. Analyses were
performed according to [38] using a Trace GC (ThermoFinnigan) equipped with a Porapak-
Q column and a flame ionization detector. In addition, methane was analyzed by a purge
and trap technique from NaN3 poisoned subsamples immediately after the cruise according
to Refs. [39] and [40]. Gas loss due to decompression during sample retrieval was
negligible since even the highest methane concentrations (126 µmol L-1) were one order of
magnitude below the seawater methane solubility under surface conditions (~1.5 mmol L-1,
calculated according to [41]). Correspondingly, bubble degassing was not observed in
bottom water samples (up to 15 µmol L-1), which were retrieved with a special bottom
water sampler equipped with transparent bottles [34, 42] (data not shown).
1 Oceanographic conductivity , temperature, depth profiler
Sauter et al., Methane discharge from a deep-sea submarine mud volcano
10
Methane oxidation rates:
Potential microbial methane oxidation rates in the water column above the HMMV were
determined by incubating replicate water samples with tritiated methane (5 µM end
concentration) according to a method adapted from Ref. [5]. Water samples were retrieved
by ROV, or bottom water sampler from bottom waters (0.1-1m), or by rosette water
sampler from 4 m above the seabed to the surface. Samples were incubated for 4 days
following the addition of tritiated methane. At the end of the incubation any microbially
mediated methane oxidation was stopped by formalin addition (to a final concentration of
2% v/v). Un-reacted tritiated methane was removed by purging the samples with water-
saturated methane and the remaining oxidation product, tritiated water, was quantified by
liquid scintillation counting. A set of controls was prepared by adding formalin before
incubation and treated in the same manner.
Flow measurements: Advective fluid discharge was estimated by ROV-based vertical
flow measurements using an acoustic 3-axis travel-time flow meter (Nobska, MAVS3). The
measurement principle and a description of the device is presented in Ref. [43]. The method
allows measurement of very low flow velocities (range 0.3-200 cm s-1) with an accuracy of
0.3 cm s-1 and a resolution of 0.03 cm s-1. Since gas bubbles strongly affected the
measurements acoustically and by gas hydrate precipitation on the device, only data
obtained from gas bubble-free fluid discharge sites were considered.
Sauter et al., Methane discharge from a deep-sea submarine mud volcano
11
4. Results and discussion
Several locations with active methane and mud seepage were video recorded at the northern
part of the HMMV’s center during video surveys in 2003 with the ROV “Victor 6000”
(Fig. 2a). Here, a steady but pulsing bubble discharge was observed escaping from open
faults. This area was hummocky and partly covered by patches of bacterial mats and
populated by pogonophorans. The seabed was also partially exposed. High geothermal
gradients with temperatures of up to 25°C at 20 cm below the seafloor [44] cause rapid
changes in the methane stability field within the sediment surface. As a result, bubbles in
the warm geofluids rapidly become covered by hydrate upon release to the cold bottom
water (-0.9° C). This was visually supported be trapping some bubbles in a transparent tube
(push core) which instantly formed porous gas hydrate. Gas bubbles were more ellipsoidal
than lenticular in shape (Fig. 2b) which also suggests a hydrate coating [13, 15, 21]. The
bubble seeps discovered during the cruise originated from different vents situated some
hundred meters apart from each other.
Based on image analysis of still photographs of emitted bubbles (Fig. 2a) the mean bubble
diameter was 5.2 mm (range of 1-10 mm) at the seafloor. Since this size determination was
affected by image resolution limitations and the angled observation view, we used the mean
bubble diameter of 5.2 ± 1 mm for further volume calculation.
A 2 m thick bottom section of a bubble plume contained ~3600 bubbles with a total volume
of 200 ml (140 – 300 ml). The bubble volume is equivalent to ~1.5 (1.0-2.2) moles of
methane on a 2 m bottom section of the plume (Fig. 2a), including compressibility. The
compressibility modulus of methane is 0.75 at in situ conditions [45], i.e. the volume of
Sauter et al., Methane discharge from a deep-sea submarine mud volcano
12
methane per mole is decreased to 75% of the ideal gas volume under in situ conditions.
This is a conservative estimate of the number of bubbles and the total volume since bubbles
in the front hide those in the background. The volume error caused by a gas hydrate coating
should be negligible since the volumetric gas to hydrate ratio changes from about 164:1 at
surface conditions [46] to 0.98:1 at 125 bar (including methane compressibility). From
video observations a mean bubble vertical velocity of about 31 cm s-1 (25-35 cm s-1) was
estimated for the core stream of three different bubble plumes. From one plume, a branch
of small bubbles (<3 mm) was observed to separate from the downstream edge of the
plume by turbulences and bottom currents. Rise velocities of those bubbles were
considerably lower with values below 12 cm s-1. In addition, a small number of non-
ellipsoid objects drifted around with a low vertical velocity (apparently close to neutral
buoyancy). We suspect that those objects were primarily gas hydrate particles (flakes),
possibly containing inclusions of gaseous methane and/or sediment particles. The latter
could have functioned as crystallization nuclei for the precipitation of gaseous methane into
flakes.
Although observations were scaled by comparison with objects of known dimensions (e.g.
manipulator of the ROV), the rice velocity estimates were affected by uncertainty from the
angled point of view relative to the core bubble stream. Thus, we also used bubbles which
were observed to break apart as an “internal scale” basing on more detailed studies showing
that bubbles ≥ 2cm in diameter start to disintegrate into smaller bubbles [19]. On the basis
of these observations we estimate a methane flux of ~200 (80-360) mmol s-1 at a single
vent, about an order of magnitude greater than the values obtained by optical means at
Sauter et al., Methane discharge from a deep-sea submarine mud volcano
13
bubble seeps at the upper edge of the hydrate stability zone in the Gulf of Mexico [19].
Assuming steady flow, an emission rate of 108 (42-182) tons methane yr-1 would be
emitted by this vent. On the basis of the three observed vents, where similar bubble
emission rates were observed, we suggest a discharge of gaseous methane to the water
column of several hundred tons per year.
Our experience working with ROVs at the seafloor shows that the plumes easily can be
missed: Bubble plumes were observed to expand with increasing altitude from a narrow
stream of ~20 cm diameter at the seabed. Bubble density decreased from ~45 bubbles L-1 at
the outlet to approximately 1 and 0.2 bubbles L-1 at 18.5 m and 25.4 m altitude, respectively
(Figs. 2 d, e). Further, the plume sometimes was slightly bent by the bottom current profile.
At 50 m above the seafloor and higher, it was hard to track the bubbles visually using the
ROV. It is possible, that the ROV thrusters disrupted the bubble stream or that bubbles
froze-out as hydrate at the bottom of the ROV. From the acoustic observations (see below)
one may infer additional sites, which, given the difficulties of ROV-based bubble plume
observations, is not precluded by a lack of visual information.
Beside the discovery of focused gas emission, large areas of perforated sediments were
observed at different locations (Fig. 2c). We interpret these structures to be indicative of
additional episodic gas release since organisms able to create those structures were not
found in sediment samples [47], although, no bubble release was observed visually.
Methane bubbles should dissolve rapidly in the ambient sea water which is highly under-
saturated with respect to the methane bubble pressure [12, 21,48]. Instead, the plume
extended to at least 750 m into the water column (to 550 m water depth) as shown by the
echo sounder both during the expeditions in 2002 and 2003 (Fig. 3a-c). The echograms
Sauter et al., Methane discharge from a deep-sea submarine mud volcano
14
revealed extensive acoustic anomalies in the water column above HMMV. In accordance to
previous studies [13, 14, 15], we interpret this as plume structures consisting primarily of
gas bubbles which most likely were covered by gas hydrate [20, 21]. Their survival in the
water column coincided with the temperature-depth field of gas hydrate stability at the
ambient sea water temperature (field below the green line in Fig. 4 a) [49]. Although
different in shape, the plumes were found to be of similar size and height in 2002 and 2003,
suggesting continuous emissions. In addition, passing the HMMV during the cruise ARK
XX/1 with RV “Polarstern” in summer 2004 allowed a quick acoustic survey by the 38 kHz
echo sounder. The plume size and heights of up to 750 m (plume top: 500 m water depth)
were similar to previous observations. Due to technical reasons these data [50] only could
be recorded from the sea surface to 1000 m depth and, thus, are not included here.
The plume orientation is determined by the rise velocity and the current profile. Currents
vary on an hourly time scale from tides and passing eddies [51]. Almost independent of the
current regime, the acoustic footprint of the plume at the seabed extended 600 and almost
400 m in latitudinal and longitudinal direction, respectively, (Fig. 3c). Within this area,
bubble seeps were visually observed in a region of ~200 m diameter (Fig. 1). Taking the
echo sounder’s beam width of 7.1° and a corresponding swath width at the seafloor of ~150
m (Fig. 3c, upper left) into account, additional bubble sites not detected by ROV surveys
are likely. However, there are no additional data such as high resolution side scan sonar
surveys to confirm this.
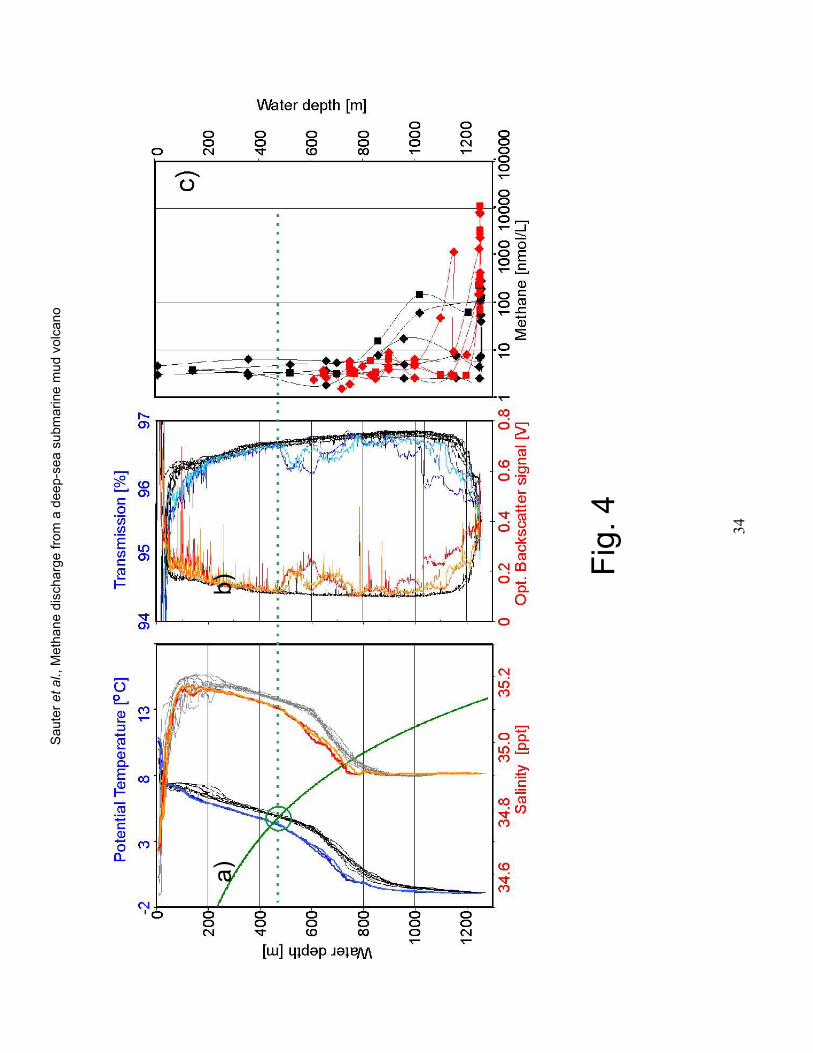
Optical transmission measurements and nephelometry (optical backscatter, complementary
to transmission) during the hydro casts confirmed the existence of a plume of light
scatterers higher in the upper water column (Fig. 4b). Three stations (PS64/380, 384, and
Sauter et al., Methane discharge from a deep-sea submarine mud volcano
15
386) within the plume and close to the bubble locations showed distinct hydrographic
(temperature and salinity) and optical anomalies in water depths between 490 and 800 m as
well as between 900 m depth and the seafloor. In contrast, no anomalies (black and gray
graphs) were observed outside the plume. Similar to the height of the acoustically imaged
plume, the optical signals (transmission and nephelometer) showed good coincidence of the
plume’s top with the calculated minimum depth of gas hydrate stability (dotted line in Fig.
4). Salinity (S) and temperature (T) depth profiles of the three stations within the plume,
i.e., above the center of the HMMV differ significantly from the outer stations (Fig. 4a).
From the seafloor to depths of ~900 m, T and S values within the plume were almost
constant, particularly in comparison to outside the plume. This indicates locally enhanced
vertical water exchange which we interpret to be most likely explained by bubble-induced
up-welling previously described for shallower sites [12, 19]. This upwelling both increases
the bubble rise velocity and entrains bulk water [52]. In this context it is important to
notice, that the rising water mass develops considerable upward momentum. Above 900 m
depth, T and S profiles show a distinct offset within the plume compared to the outer
stations. All CTD casts (both in and out of the plume) were performed within a circle of 1.5
km diameter above HMMV. Because the area around HMMV has little vertical relief (less
than 20 m), we exclude a topographic explanation. If the hydrographic differences inside
and outside of the plume were caused either by seafloor topography or eddy-related current
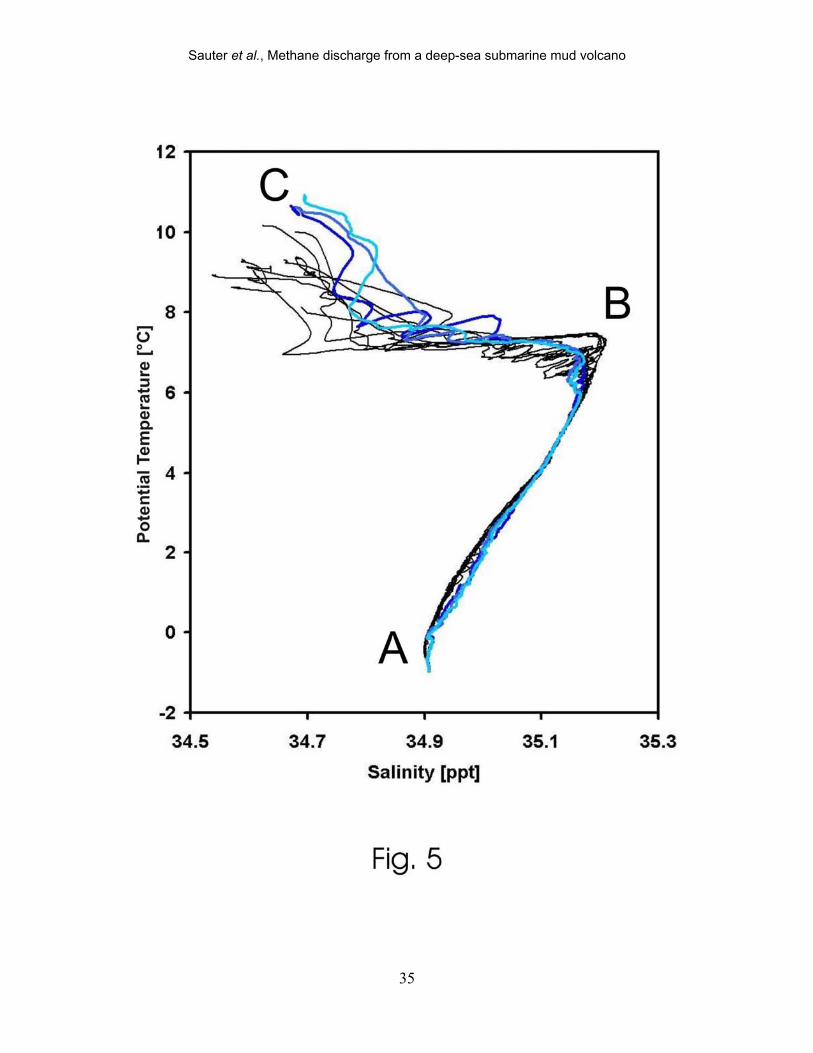
changes, the T-S relation of the individual water masses would not change. In contrast, the
relationship between potential temperature and salinity (Fig. 5) shows significant anomalies
for the in-plume profiles. Again we argue these are best explained by enhanced vertical
mixing due to bubble-induced up-welling. The water column basically consists of Atlantic
Sauter et al., Methane discharge from a deep-sea submarine mud volcano
16
Water above 600 m depth and a branch of Arctic Intermediate Water below [33, 53]
represented by the lower “linear” section (labeled AB on Fig. 5) of the T-S plot (salinity
increased with temperature). Section (BC) above is characterized by salinities decreasing
upwards with temperature due to “freshening” of surface water by precipitation and melt
water from sea ice. Whereas different water masses plot well apart from each other in the
T-S diagram, the admixture of neighboring waters connects those end-members. In
accordance with [33], some of the T-S graphs measured outside the plume (black) showed a
sharp discontinuity in the area of the salinity maximum (B) indicating stable water column
stratification. In contrast, the rounded angle of all graphs obtained within the plume area
(blue graphs) suggests an enhanced admixture in the zone around the salinity maximum at
water depths as shallow as 100 and 300 m. Accordingly, the temperature anomaly reaches
up to ~100 m water depth (Fig. 4a). Thus we propose that the rising bubbles enhance the
vertical water exchange within and above the plume. Above the gas hydrate stability field
bubbles dissolve but the vertically accelerated water masses continue to rise according to
momentum conservation. Furthermore, the shallow T-S anomalies coincide with
transmission and backscatter anomalies only recorded within the plume area and most
pronounced in depths between 50 and 150 m (Fig. 4b). It is highly unlikely that bubble
ebullition occurs from the dissolved methane plume because methane concentrations were
well below saturation. Thus, we hypothize this effect reflects the extension of the bubble-
induced upwelling to shallow water depths and propose that this mechanism can allow
dissolved methane originating from HMMV to escape to the atmosphere. This process
would be further enhanced by storm-induced deep mixing as occurs frequently during
autumn and winter in the North Atlantic [54].
Sauter et al., Methane discharge from a deep-sea submarine mud volcano
17
Gas analysis revealed that the gas released from the HMMV was almost pure methane
(>99.9%). Conspicuously high bottom water methane concentrations of up to >104 nmol L-1
were measured in the central part of HMMV (Fig. 4c). Towards the upper water column
(above 800 m depth), concentrations declined to about double background level (5-6 nmol
L-1) showing a highly diluted, but significant methane anomaly. Bottom water methane
concentrations of up to several hundred nmol L-1 southwest and southeast of the bubble
sites indicate that dissolved methane from the plume diffused and was advected within the
lower water by currents.
Stable carbon isotope measurements by Damm and Budéus [33] confirm that methane
released from HMMV is distributed over a large area by currents rather than being
microbially oxidized locally, i.e., advection time is short compared to the time scale of
microbial oxidation. The isotopic signature δ13C of methane at the oceanic background
level outside of the plume typically lies between –45 ‰ and –34 ‰ VPDB (referenced
against Vienna Pee Dee Belemnite) [55]. Dissolved pore water methane and gas extracted
from subsurface hydrate samples showed very low δ13C values of -60.6 ‰ and -59.2 ‰
VPDB, respectively [56]. The bottom water of HMMV’s center showed mean methane
isotopic signatures of –61.6 ‰ (range of -63.8 to –57.8 ‰ δ13C) [33]. Surprisingly, the
mean δ13C values obtained from the lower and upper water column (above 800 m depth)
were as low as the value of the hydrate methane with values of –59.3 ‰ VPDB and -58.9
‰ VPDB, respectively. If significant microbial oxidation of methane had occurred within
the plume, higher methane isotope values would have been expected due to enzymatic
isotope fractionation.
Sauter et al., Methane discharge from a deep-sea submarine mud volcano
18
Furthermore, according to the isotopic signatures, potential rates of aerobic microbial
methane oxidation measured by turnover of tritiated methane tracer were low in the bottom
water above the central mud volcano with <1% turnover of the methane inventory per day.
Potential rates further decreased to <0.1% per year in the deep water column. Potential rates
generally were undetectable in the upper water column except for the surface sample. This
suggests that the majority of the methane escapes the deep-sea and is mixed into the upper
water column and that microbial methane turnover plays only a minor role, even in the
bottom waters. Probably, the very low bottom water temperatures (–1°C) suppressed
microbial activity [11]. In other more temperate and stratified methane-rich waters like in
the Black Sea, substantially higher microbial methane turnover rates have been detected
[6].
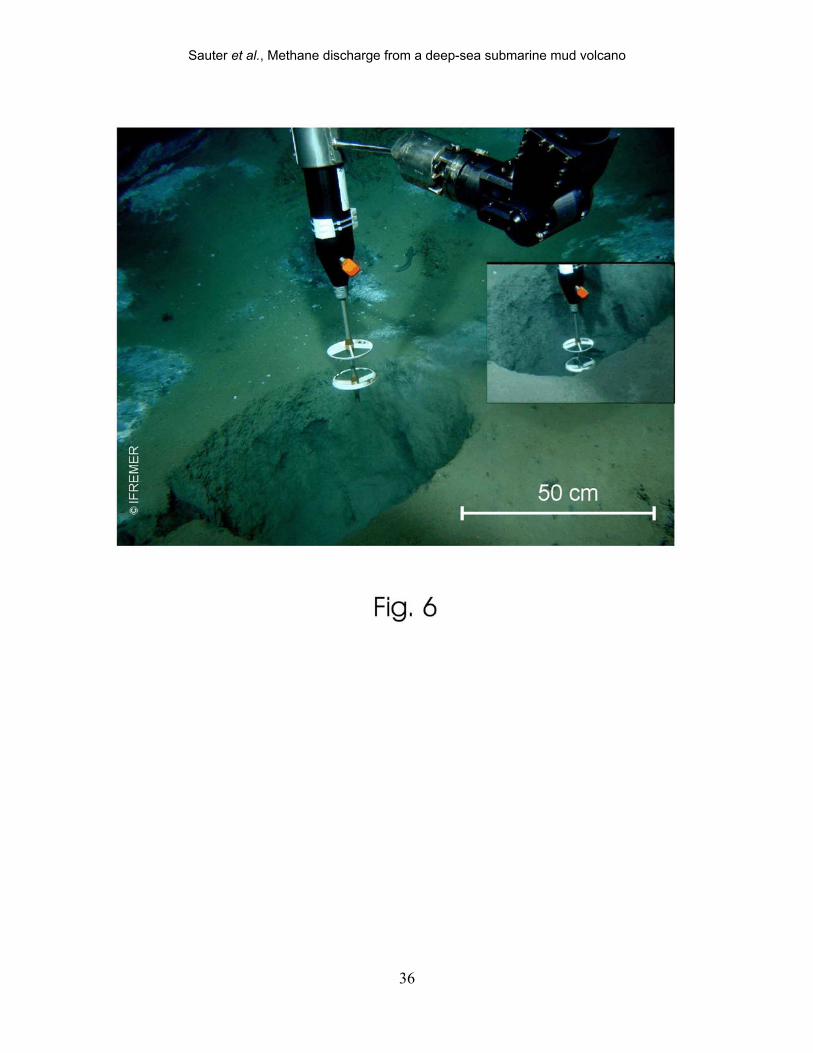
In addition to bubble plume emission and diffusive flux of dissolved methane, advective
discharge of methane-rich fluids from holes in the seafloor was observed at several sites
(Fig. 6). To estimate this kind of methane flux, an acoustic flow meter, capable of
measuring very low flow velocities was lowered into two vents. The vertical component of
the flow within the holes was 1.2 (± 0.3) cm s-1 in both vents. Based on methane
concentrations of the fluids sampled by the ROV (32 and 126 µmol l-1), methane fluxes
were estimated at 10 and 18 moles per day, respectively assuming continuous outflow from
the vents (diameter ~60 and ~40 cm, respectively, estimates from image analysis).
Assuming the presence of 10 to 100 similar structures in the central area based on detailed
bathymetric and video surveys (not shown), the annual methane flux arising from
channeled outflow of dissolved methane could amount to several tons of methane, which is
Sauter et al., Methane discharge from a deep-sea submarine mud volcano
19
of comparable order of magnitude as the diffusive flux of dissolved methane released from
the sediments of HMMV [34]. Thus, with discharge rates of up to several hundred tons of
methane, bubble discharge is much more important than diffusive and focused fluid
discharge to the ocean, and especially with respect to its contribution to the atmosphere.
There are individual hydrocarbon sources of greater importance, such as the Coal Oil Point
seeps in the Santa Barbara Channel [17] emitting vastly greater amounts of methane. On
the other hand, the HMMV was estimated to release up to one order of magnitude more
methane than the sources quantified in the Gulf of Mexico [19]. Due to the efficient
methane transfer from the deep to the mixed layer and the sea surface by hydrate skin
protected bubble plumes and bubble-induced upwelling we propose that the estimated 103-
105 SMVs [2] and other deep methane sources may contribute significantly to the
atmospheric methane budget.
5. Conclusions and outlook
Acoustic techniques allow the efficient location and identification of submarine gas
emission, providing an appropriate tool for plume detection. In this study, acoustic surveys
were confirmed by hydrographic and optical information, which showed that methane can
be transferred from a deep-sea source into the upper water column by means of ascending
methane bubbles. Bubble-induced upwelling creates an upward momentum of rising water
enriched in methane that extends above the shallowest depth of the bubble plume and
transporting dissolved methane into surface waters. Therefore, this mechanism suggests
there is greater importance with respect to vertical methane flux from deep submarine
Sauter et al., Methane discharge from a deep-sea submarine mud volcano
20
sources than previously assumed. A large number of deep submarine methane sources like
cold seeps and mud volcanoes likely exists also in temperate and high latitude regions,
where favorable pressure and temperature conditions allow methane bubbles to be coated
by a gas hydrate skin upon release. Our observations suggest that for the HMMV, gas
bubble emission dominates over both diffusive discharge and the focused outflow of
dissolved methane. Furthermore, the transfer of methane from deep sources to upper waters
may allow some of the methane to reach the atmosphere, particularly during deep winter
mixing of the surface ocean. Because, unlike gas bubbles and hydrate flakes, dissolved
methane is more accessible for microbial oxidation, we assume that a portion of the
diffusively released methane is oxidized close to the seafloor. Nevertheless, the un-oxidized
portion is significant and is spread out by currents as suggested by the measured oxidation
rates and by isotope data obtained from the target area.
Beside a more systematic effort to acoustically detect methane plumes, the development of
algorithms and procedures for the acoustic quantification of methane plumes are needed.
Previous approaches performed in shallow areas such as the Santa Barbara Channel [17] as
well as recent efforts for acoustic plume quantification [18] need adapting for deep water
conditions. Exchange and dissolution processes as well as the upwelling flow must be
considered to estimate realistically the amount of methane transported to the surface ocean.
Acknowledgements
The Authors thank captain and crew of RV “Polarstern” and the Genavir team of ROV
“Victor 6000” for their unremitting assistance. We are grateful to J. Rogenhagen (Fielax
GmbH) for help with acoustics, H. Rohr (Optimare GmbH) for CTD and hydrographic
Sauter et al., Methane discharge from a deep-sea submarine mud volcano
21
measurements. We express our thanks to the Alfred Wegener Institute colleagues L.
Baumann and M. Gensheimer for laboratory work, J. Wegner for technical assistance and
G. Krause and G. Budéus for oceanographic consultancy. Furthermore, we greatly
appreciate methane analyses performed by J.P. Donval (IFREMER) and the fruitful
comments of B.B. Jørgensen on an earlier version of the manuscript. We thank I. Leifer and
the other reviewer for constructive and valuable comments. This study was performed in
the frame work of the AWI-IFREMER bilateral collaboration program and the UK-France-
Germany Tripartite Agreement for the Exchange of Major Marine Facilities. This is AWI
publication No 15117.
Sauter et al., Methane discharge from a deep-sea submarine mud volcano
22
References
[1] O. Badr, S.D. Probert, P.W. O'Callaghan, Atmospheric methane: Its contribution to
global warming, Appl. Energy 40 (1991) 273-313.
[2]. A.V. Milkov, Worldwide distribution of submarine mud volcanoes and associated gas
hydrates, Mar. Geol. 167 (2000) 29-42.
[3] K.A. Kvenvolden, T.D. Lorenson, The global occurrence of natural gas hydrate, in:
C.K. Paull, W.P. Dillon (Eds.), Natural gas hydrates: occurrence, distribution, and
detection, Geophys. Monogr. Ser. 124 (2001) 3-18.
[4] A.V. Milkov, R. Sassen, T.V. Apanasovich, F.G. Dadashev, Global gas flux from mud
volcanoes: A significant source of fossil methane in the atmosphere and the ocean,
Geophys. Res. Lett. 30 (2003) 1037, DOI:10.1029/2002GL016358.
[5] D.L. Valentine, D. C. Blanton, W. S. Reeburgh, M. Kastner, Water column methane
oxidation adjacent to an area of active hydrate dissociation, Eel River Basin, Geochim.
Cosmochim. Acta 65 (2001) 2633-2640.
[6] W.S. Reeburgh, B. Ward, S.C. Whalen, K.A. Sandbeck, K.A. Kilpatrick, L.J. Kerkhof,
Black Sea methane geochemistry, Deep-Sea Res. 38 (1991) S1189-S1210.
[7] A.G. Judd, M. Hovland, L.I. Dimitrov, S. Garća Gil, V. Jukes, The geological methane
budget at continental margins and its influence on climate change, Geofluids, 2 (2002) 109-
126.
[8] J. Lelieveld, P.J. Crutzen, F.J. Dentener, Changing concentration, lifetime and climatic
forcing of atmospheric methane, Tellus, 50B (1998) 128-150.
Sauter et al., Methane discharge from a deep-sea submarine mud volcano
23
[9] Intergovernmental Panel on Climate Change (IPCC), Climate change 2001: The
scientific basis. Contribution of Working Group I to the Third Assessment Report of the
IPCC, J.T. Houghton, Y. Ding, D.J. Griggs, M. Noguer, P.J. van der Linden, X. Dai, K.
Maskell, C.A. Johnson (Eds.), Cambridge University Press, Cambridge (2001) 881pp.
[10] G. Rehder, R.S. Keir, E. Suess, M. Rhein, Methane in the northern Atlantic controlled
by microbial oxidation and atmospheric history, Geophys. Res. Lett. 26 (1999) 587-590.
[11] M.I. Scranton, P.G. Brewer, Consumption of dissolved methane in the dep ocean,
Limnol. Oceanogr. 23 (1978) 1207-1213.
[12] I. Leifer, R. K. Patro, The bubble mechanism for methane transport from the shallow
sea bed to the surface: A review and sensitivity study, Cont. Shelf Res. 22 (2002) 2409-
2428.
[13] R. Merewether, M.S. Olsson, P. Lonsdale, Acoustically detected hydrocarbon plumes
rising from 2-km depth in Guaymas Basin, Gulf of California, J. Geophys. Res. 90 (1985)
3075-3085.
[14] C.K. Paull, W. Ussler III, W.S. Borowski, F.N. Spiess, Methane-rich plumes on the
Carolina continental rise: Associations with gas hydrates, Geology 23 (1995) 89-92.
[15] K.U. Heeschen, A.M. Tréhu, R.W. Collier, Distribution and height of methane bubble
plumes on the Cascadia Margin characterized by acoustic imaging, Geophys. Res. Lett. 30
(2003) 1643, doi:10.1029/2003GL016974.
[16] V.N. Egorov, Yu.G. Artemov, G.G. Polikarpov, S.B. Gulin, Evaluation of vertical
extension of methane gas bubble streams from the bottom of the Black Sea by
hydroacoustic method, Geophys. Res. Abstr. 7 (2005) 03791.
Sauter et al., Methane discharge from a deep-sea submarine mud volcano
24
[17] J.S. Hornafius, D. Quigley, B.P. Luyendyk, The world’s most spectacular marine
hydrocarbon seeps (Coal Oil Point, Santa Barbara Channel, California): Quantification of
emissions, J. Geophys. Res. 104 C (1999) 20703-20711.
[18] J. Greinert, B. Nützel, Hydroacoustic experiments to establish a method for the
determination of methane bubble fluxes at cold seeps, Geo-Mar. Lett. 24 (2002) 75-85.
[19] I. Leifer, I. MacDonald, Dynamics of the gas flux from shallow gas hydrate deposits:
Interaction between oily hydrate bubbles and the oceanic environment, Earth Plan. Sci.
Lett. 210 (2003) 411-424.
[20] D.R. Topham, The formation of gas hydrates on bubbles of hydrocarbon gases rising
in seawater, Chem. Engin. Sci. 39 (1984) 821-828.
[21] G. Rehder, P.W. Brewer, E.T. Peltzer, G. Friedrich, Enhanced lifetime of methane
bubble streams within the deep ocean, Geophys. Res. Lett. 29 (2002)
10.1029/2001GL013966.
[22] I. Leifer, J.F. Clark, R.F. Chen, Modifications of the local environment by natural
marine hydrocarbon seeps, Geophys. Res. Lett. 27 (2000) 3711-3714.
[23] P.R. Vogt, H. Fleming, E. Sundvor, K. Crane, S. Pfirman, A. Shor, SeaMarc II and
associated geophysical investigation of the Knipovich Ridge, Molloy Ridge fracture zone,
Spitsbergen/Barents/Norwegian continental margin and extinct Aegir Ridge (Norway
Basin); Part III, Synthesis of sedimentary processes, EOS 72 (1991) 232.
[24] Y.A. Bogdanov, A.M. Sagalevich, P.R. Vogt, J. Mienert, E. Sundvor, K. Crane, A.Y.
Lein, A.V. Egorov, V.I. Peresypkin, G.A. Cherkashev, A.V. Gebruk, G.D. Ginsburg, D.V.
Sauter et al., Methane discharge from a deep-sea submarine mud volcano
25
Voitov, The Haakon Mosby mud volcano in the Norwegian Sea; results of
multidisciplinary studies with manned submersibles, Oceanology 39 (1999) 374-380.
[25] M. Klages, B. Mesnil, T. Soltwedel, A. Christophe, The Expedition "AWI" of RV
"L'Atalante" in 2001, Rep. Pol. Mar. Res. 422 (2002) 1-65.
[26] A.V. Milkov, P.R. Vogt, K. Crane, A.Y. Lein, R. Sassen, G.A. Cherkashev,
Geological, geochemical, and microbial processes at the hydrate-bearing Håkon Mosby
mud volcano: a review, Chem. Geol. 205 (2004) 347-366.
[27] P.R. Vogt, J. Gardner, K. Crane, The Norwegian-Barents-Svalbard (NBS) continental
margin: Introducing a natural laboratory of mass wasting, hydrates, and ascent of sediment,
pore water, and methane, Geo-Mar. Lett. 19 (1999) 2-21.
[28] G. D. Ginsburg, A.V. Milkov, V.A. Soloviev, A.V. Egorov, G.A. Cherkashev, P.R.
Vogt, K. Crane, T.D. Lorenson, M.D. Khutorskoy, Gas hydrate accumulation at the Håkon
Mosby Mud Volcano Geo-Mar. Lett. 19 (1999) 57-67.
[29] P.R. Vogt, K. Crane, E. Sundvor, B. O. Hjelstuen, J. Gardner, F. Bowles, G.
Cherkashev, Ground-Truthing 11- to 12-kHz side-scan sonar imagery in the Norwegian-
Greenland Sea: Part II: Probable diapirs on the Bear Island fan slide valley margins and the
Vøring Plateau, Geo Mar. Lett. 19 (1999) 111-130.
[30] J.S. Laberg, T.O. Vorren, A late Pleistocene submarine slide on the Bear Island trough
mouth fan, Geo Mar. Lett. 13 (1993) 227-234.
[31] A. Milkov, P. Vogt, G. Cherkashev, G. Ginsburg, N. Chernova, A. Andriashev, Geo-
Mar. Lett. 19 (1999) 38-47.
Sauter et al., Methane discharge from a deep-sea submarine mud volcano
26
[32] A. Boetius, K. Ravenschlag, C. Schubert, D. Rickert, F. Widdel, A. Gieseke, R.
Amann, B.B. Jørgensen, U. Witte, O. Pfannkuche, A marine microbial consortium
apparently mediating anaerobic oxidation of methane, Nature 407 (2000) 623-626.
[33] E. Damm, G. Budéus, Fate of vent-derived methane in seawater above the Håkon
Mosby mud volcano (Norwegian Sea), Mar. Chem. 82 (2003) 1-11.
[34] E.J. Sauter, M. Schlüter, J.-L. Charlou, S.I. Muyakshin, A. Boetius, E. Damm, M.
Klages, J.-P. Foucher, Estimating the importance of different pathways of methane
discharge from deep-sea submarine sources, Geophys. Res. Abstr. 7 (2005) 04559.
[35] A.Y. Lein, N.V. Pimenov, A.S. Savvichev, G.A. Pavlova, P.R. Vogt, Y.A. Bogdanov,
A.M. Sagalevich, M.V. Ivanov, Methane as a source of organic matter and carbon dioxide
of carbonates at a cold seep in the Norway Sea, Geochem. Intern. 38 (2000) 232-245.
[36] A. Sam, C.O. Gomez, J.A. Finch, Axial velocity profiles of single bubbles in water /
frother solutions, Int. J. Miner. Process. 47 (1996) 177-196.
[37] G. Budéus, W. Schneider, In-situ temperature calibration: remark on instruments and
methods, WOCE Newslett. 30 (1998) 16-18.
[38] M. Schlüter, E.J. Sauter, C.E. Andersen, H. Dahlgaard, P. Dando, Spatial Distribution
and Budget for Submarine Groundwater Discharge in Eckernförde Bay (W-Baltic Sea),
Limnol. Oceanogr. 49 (2004) 157-167.
[39] J.L. Charlou, J.P. Donval, Hydrothermal methane venting between 12 degrees N and
26 degrees N along the Mid-Atlantic Ridge, J. Geophys. Res. 98 (1993) 9625-9642.
[40] J. L. Charlou, Y. Fouquet, H. Bougault, J.P. Donval, J. Etoubleau, P. Jean-Baptiste, A.
Dapoigny, P. Appriou, P.A. Rona, Intense CH4 plumes generated by serpentinization of
Sauter et al., Methane discharge from a deep-sea submarine mud volcano
27
ultramafic rocks at the intersection of the 15 degrees 20'N fracture zone and the Mid-
Atlantic Ridge, Geochim. Cosmochim. Acta 62 (1998) 2323-2333.
[41] Z. Duan, N. Møller, J. Greenberg, J.H. Weare, The prediction of methane solubility in
natural waters to high ionic strength from 0 to 250°C and from 0 to 1600 bar, Geochim.
Cosmochim. Acta 56 (1992) 1451-1460.
[42] E.J. Sauter, M. Schlüter, J. Wegner, E. Labahn, A routine device for high resolution
bottom water sampling, J. Sea Res., in press.
[43] F.T. Thwaites, A.J. Williams 3rd, Development of a Modular Acoustic Velocity
Sensor, Oceans 96 (1996) 607-612.
[44] J.-P. Foucher, unpublished data.
[45] K. Schaefer, G. Beggerow, J. d’Ans, J. Bartels, H. Landolt, R. Börnstein, Zahlenwerte
und Funktionen aus Physik, Chemie, Astronomie, Geophysik und Technik (Numbers and
functions from physics, chemistry, astronomy, geophysics, and technics, in german), Vol.
2, Part 1, Springer, Berlin, 1971, 944 pp.
[46] D.W. Davidson, M.D. El-Defrawy, M.O. Fulgem, A.S. Judge, Natural gas hydrates in
northern Canada, 3rd Int. Conf. on Permafrost, Proc., 1978, pp. 938-943.
[47] A. Gebruk, personal communication.
[48] I.R. MacDonald, I. Leifer, R. Sassen, P. Stine, R. Mitchell, N. Guinasso Jr., Transfer
of hydrocarbons from natural seeps to the water column and atmosphere, Geofluids 2
(2002) 95-107.
Sauter et al., Methane discharge from a deep-sea submarine mud volcano
28
[49] E.T. Peltzer, P.G. Brewer, Practical physical chemistry and empirical predictions of
methane hydrate stability, in: M.D. Max (Ed.), Natural Gas Hydrate in Oceanic and
Permafrost Environments, Kluwer, Dordrecht, 2000, pp. 17-28.
[50] E.J. Sauter, T. Soltwedel, unpublished data.
[51] H. M. van Aken, G. Budéus, M. Hähnel, The anatomy of the Frontal Zone in the
Greenland Sea, J. Geophys. Res. 100 (1995) 15999-16014.
[52] T.J. McDougal, Bubble plumes in stratified environments, J. Fluid Mech. 4 (1978)
655-672.
[53] J. Blindheim, Arctic intermediate water in the Norwegian sea, Deep-Sea Res. 37
(1990) 1475-1489.
[54] J. Pailet, M. Arhan, Ocean ventilation in the eastern North Atlantic, J. Phys. Oceanogr.
26 (1996) 2036-2052.
[55] M. J. Whiticar, Carbon and hydrogen isotope systematics of bacterial formation and
oxidation of methane, Chem. Geol. 161 (1999) 291-314.
[56] A. Lein, P. Vogt, K. Crane, A. Egorov, M. Ivanov, Chemical and isotopic evidence for
the nature of the fluid in CH4-containing sediments of the Haakon Mosby Mud Volcano,
Geo-Mar. Lett. 19 (1999) 76-83.
[57] C. Edy, H. Bisquay, J.-P. Foucher, J. Opderbecke, P. Simeoni, A.-G. Allais, A. Beyer,
K. Jerosch, R. Rathlau, Microbathymetry of the Håkon Mosby Mud Volcano off northern
Norway: Results of a ROV-born multibeam survey, Geophys. Res. Abstr. 6 (2004) 04619.
Sauter et al., Methane discharge from a deep-sea submarine mud volcano
29
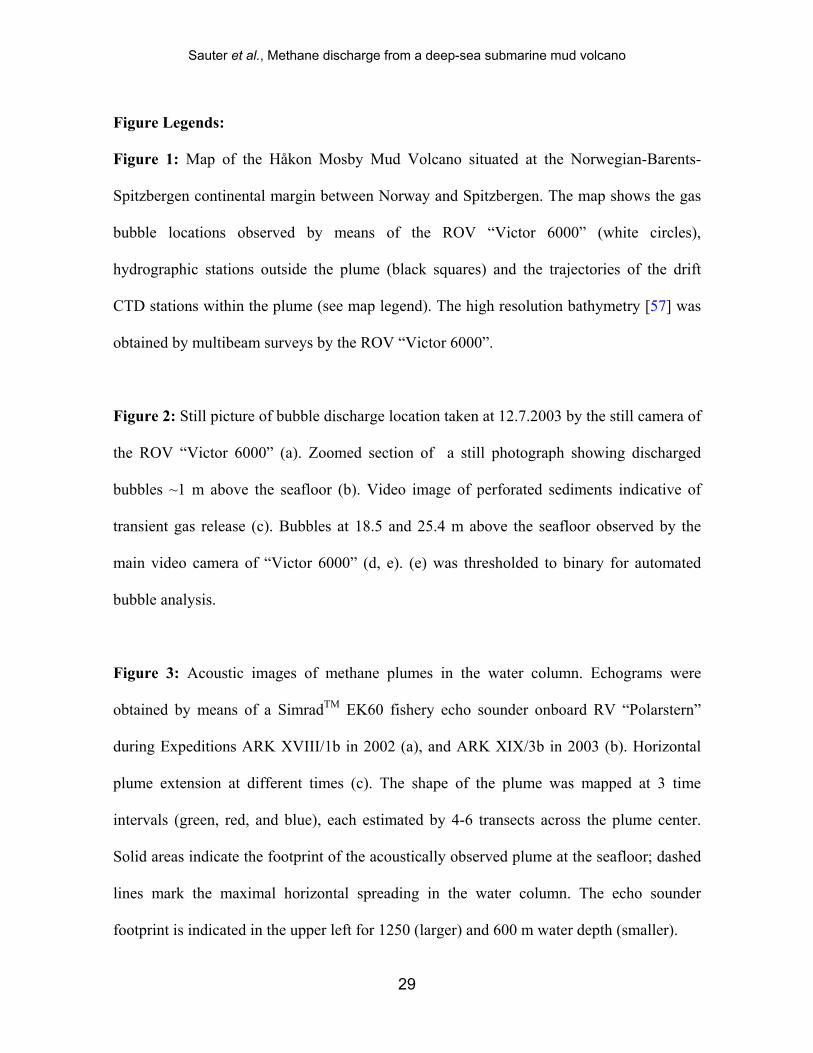
Figure Legends:
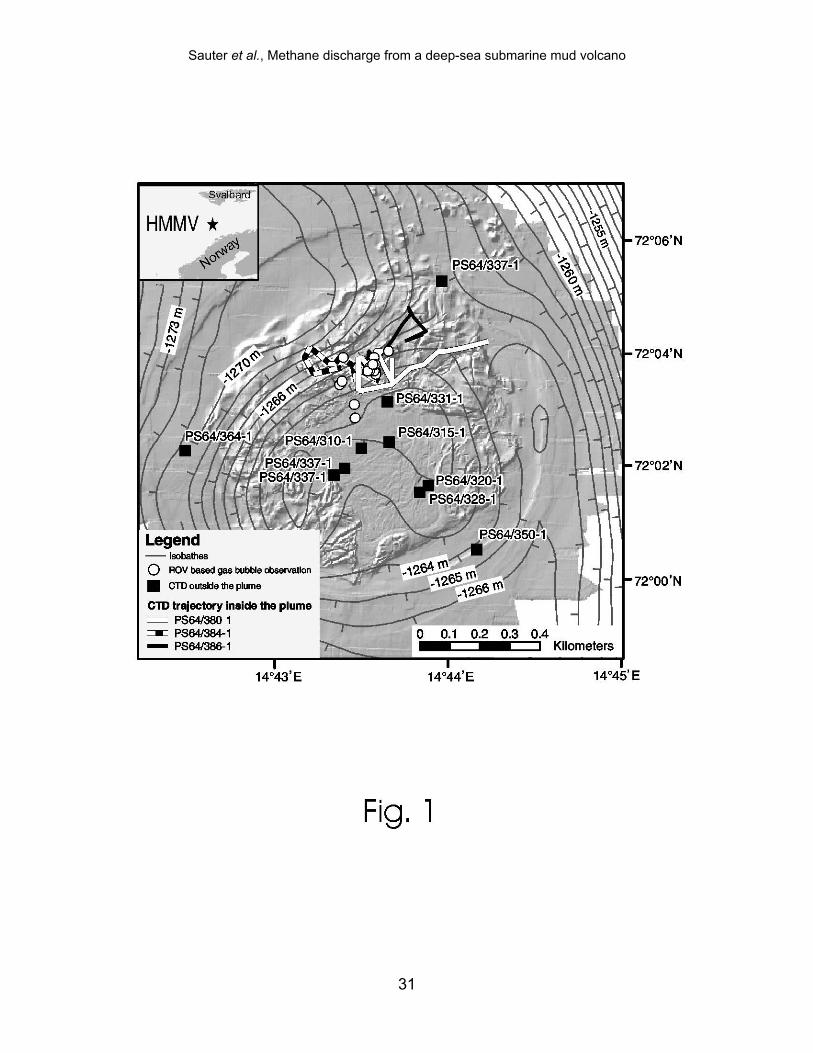
Figure 1: Map of the Håkon Mosby Mud Volcano situated at the Norwegian-Barents-
Spitzbergen continental margin between Norway and Spitzbergen. The map shows the gas
bubble locations observed by means of the ROV “Victor 6000” (white circles),
hydrographic stations outside the plume (black squares) and the trajectories of the drift
CTD stations within the plume (see map legend). The high resolution bathymetry [57] was
obtained by multibeam surveys by the ROV “Victor 6000”.
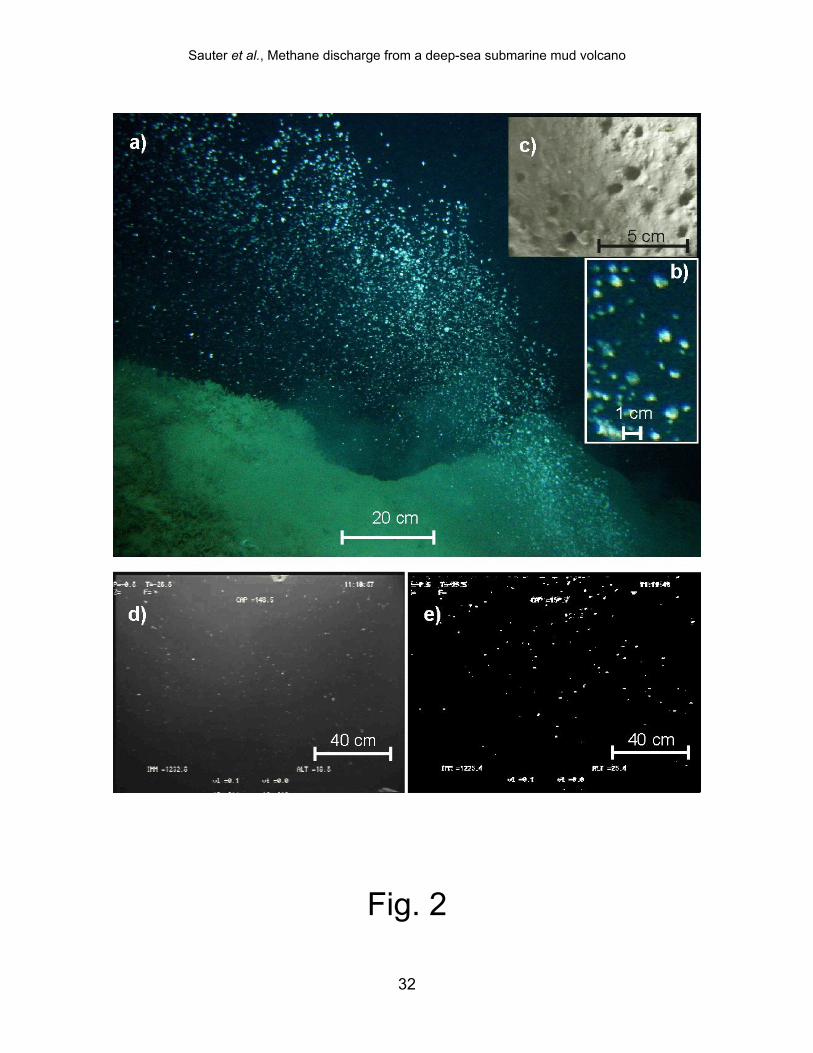
Figure 2: Still picture of bubble discharge location taken at 12.7.2003 by the still camera of
the ROV “Victor 6000” (a). Zoomed section of a still photograph showing discharged
bubbles ~1 m above the seafloor (b). Video image of perforated sediments indicative of
transient gas release (c). Bubbles at 18.5 and 25.4 m above the seafloor observed by the
main video camera of “Victor 6000” (d, e). (e) was thresholded to binary for automated
bubble analysis.
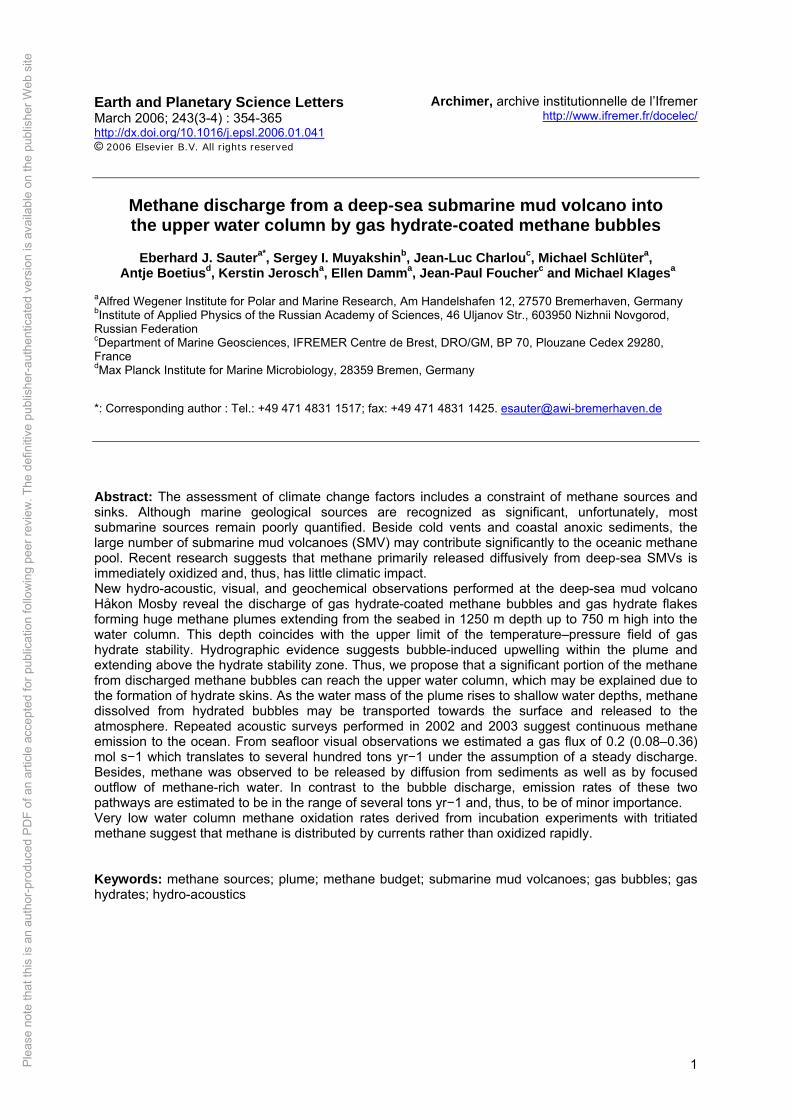
Figure 3: Acoustic images of methane plumes in the water column. Echograms were
obtained by means of a SimradTM EK60 fishery echo sounder onboard RV “Polarstern”
during Expeditions ARK XVIII/1b in 2002 (a), and ARK XIX/3b in 2003 (b). Horizontal
plume extension at different times (c). The shape of the plume was mapped at 3 time
intervals (green, red, and blue), each estimated by 4-6 transects across the plume center.
Solid areas indicate the footprint of the acoustically observed plume at the seafloor; dashed
lines mark the maximal horizontal spreading in the water column. The echo sounder
footprint is indicated in the upper left for 1250 (larger) and 600 m water depth (smaller).
Sauter et al., Methane discharge from a deep-sea submarine mud volcano
30
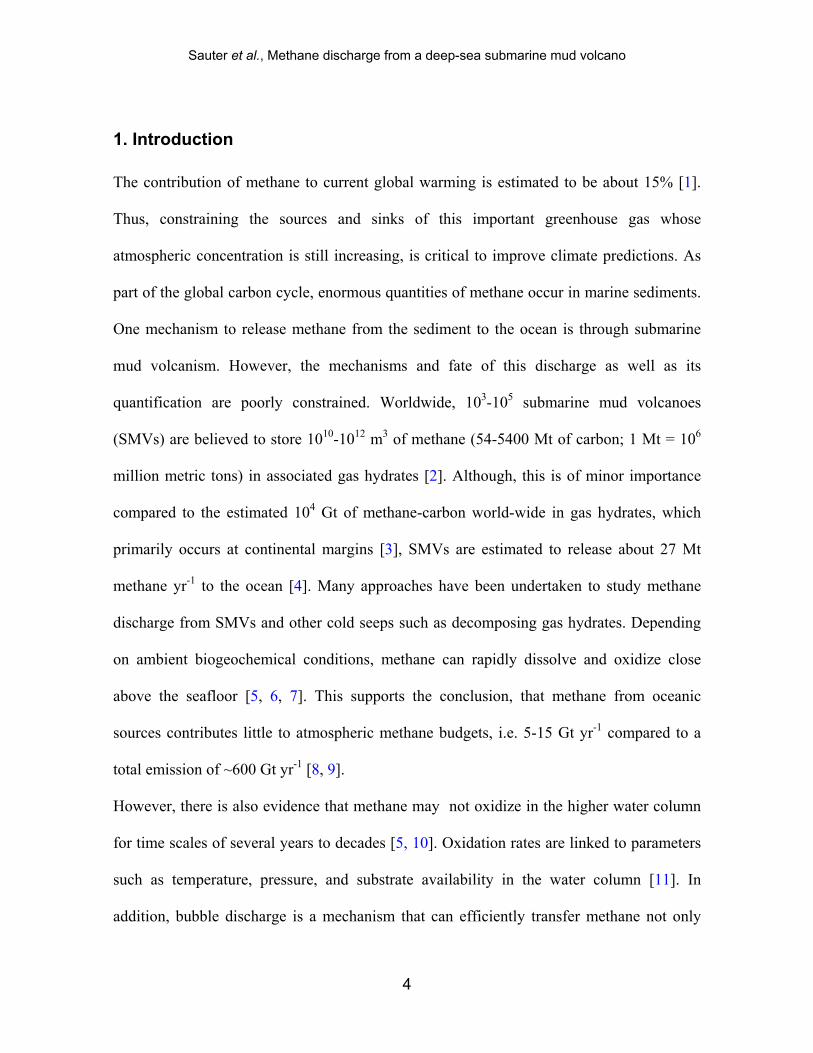
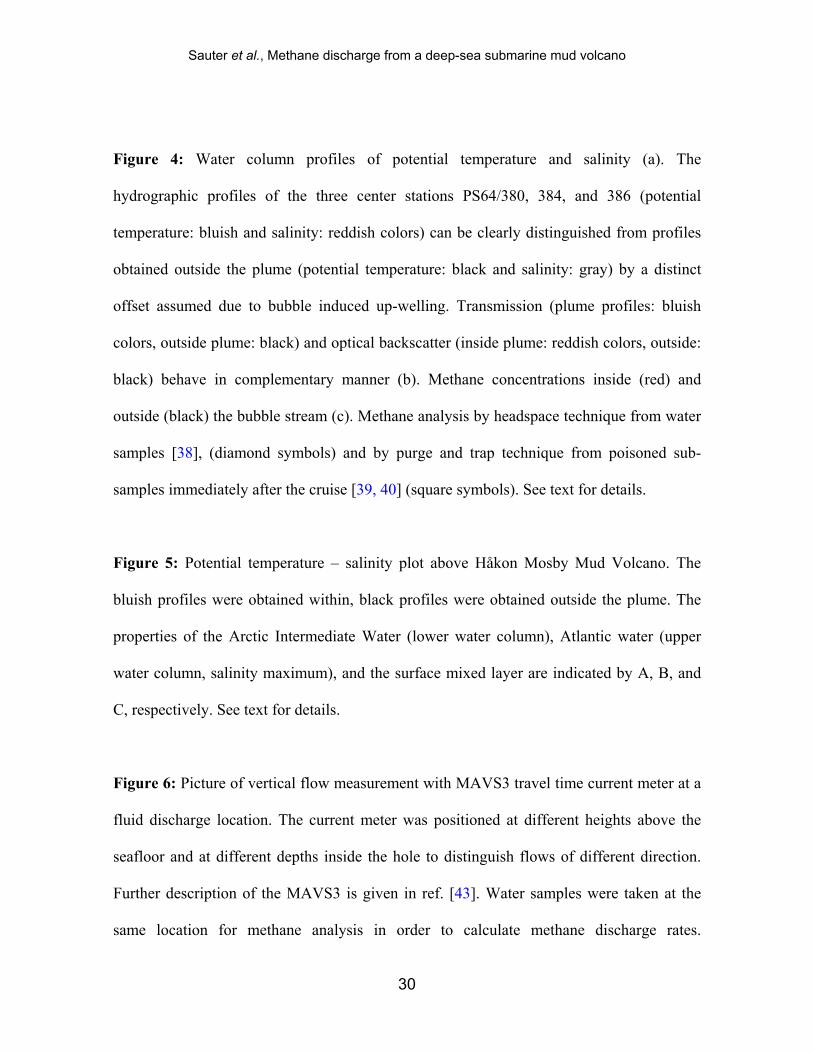
Figure 4: Water column profiles of potential temperature and salinity (a). The
hydrographic profiles of the three center stations PS64/380, 384, and 386 (potential
temperature: bluish and salinity: reddish colors) can be clearly distinguished from profiles
obtained outside the plume (potential temperature: black and salinity: gray) by a distinct
offset assumed due to bubble induced up-welling. Transmission (plume profiles: bluish
colors, outside plume: black) and optical backscatter (inside plume: reddish colors, outside:
black) behave in complementary manner (b). Methane concentrations inside (red) and
outside (black) the bubble stream (c). Methane analysis by headspace technique from water
samples [38], (diamond symbols) and by purge and trap technique from poisoned sub-
samples immediately after the cruise [39, 40] (square symbols). See text for details.
Figure 5: Potential temperature – salinity plot above Håkon Mosby Mud Volcano. The
bluish profiles were obtained within, black profiles were obtained outside the plume. The
properties of the Arctic Intermediate Water (lower water column), Atlantic water (upper
water column, salinity maximum), and the surface mixed layer are indicated by A, B, and
C, respectively. See text for details.
Figure 6: Picture of vertical flow measurement with MAVS3 travel time current meter at a
fluid discharge location. The current meter was positioned at different heights above the
seafloor and at different depths inside the hole to distinguish flows of different direction.
Further description of the MAVS3 is given in ref. [43]. Water samples were taken at the
same location for methane analysis in order to calculate methane discharge rates.
Sauter et al., Methane discharge from a deep-sea submarine mud volcano
31
Sauter et al., Methane discharge from a deep-sea submarine mud volcano
32
Fig. 2
Sauter et al., Methane discharge from a deep-sea submarine mud volcano
33
Fig. 3
Sau
ter e
t al.,
Met
hane
dis
char
ge fr
om a
dee
p-se
a su
bmar
ine
mud
vol
cano
Fig.
4
a)
b)
34
Sauter et al., Methane discharge from a deep-sea submarine mud volcano
35
Sauter et al., Methane discharge from a deep-sea submarine mud volcano
36