Embed Size (px)
Citation preview
Solar Energy 80 (2006) 1072–1088
www.elsevier.com/locate/solener
Methodology for optimal sizing of stand-alonephotovoltaic/wind-generator systems using genetic algorithms
Eftichios Koutroulis a,*, Dionissia Kolokotsa b,Antonis Potirakis a, Kostas Kalaitzakis a
a Department of Electronic and Computer Engineering, Technical University of Crete, GR-73100 Chania, Greeceb Department of Natural Resources and Environment, Technological Educational Institute of Crete, GR-73133 Chania, Greece
Received 25 May 2005; received in revised form 4 November 2005; accepted 17 November 2005Available online 27 December 2005
Communicated by: Associate Editor Mukund Patel
Abstract
A methodology for optimal sizing of stand-alone PV/WG systems is presented. The purpose of the proposed method-ology is to suggest, among a list of commercially available system devices, the optimal number and type of units ensuringthat the 20-year round total system cost is minimized subject to the constraint that the load energy requirements are com-pletely covered, resulting in zero load rejection. The 20-year round total system cost is equal to the sum of the respectivecomponents capital and maintenance costs. The cost (objective) function minimization is implemented using genetic algo-rithms, which, compared to conventional optimization methods such as dynamic programming and gradient techniques,have the ability to attain the global optimum with relative computational simplicity. The proposed method has beenapplied for the design of a power generation system which supplies a residential household. The simulation results verifythat hybrid PV/WG systems feature lower system cost compared to the cases where either exclusively WG or exclusivelyPV sources are used.� 2005 Elsevier Ltd. All rights reserved.
Keywords: Photovoltaic power systems; Wind power generation; Genetic algorithms
1. Introduction
Photovoltaic (PV) and Wind Generator (WG)power sources are widely used in order to supplypower to consumers in remote areas. Due to theiralmost complementary power production character-
0038-092X/$ - see front matter � 2005 Elsevier Ltd. All rights reserve
doi:10.1016/j.solener.2005.11.002
* Corresponding author. Tel.: +30 28210 37233; fax: +30 2821037542.
E-mail address: [email protected] (E. Koutroulis).
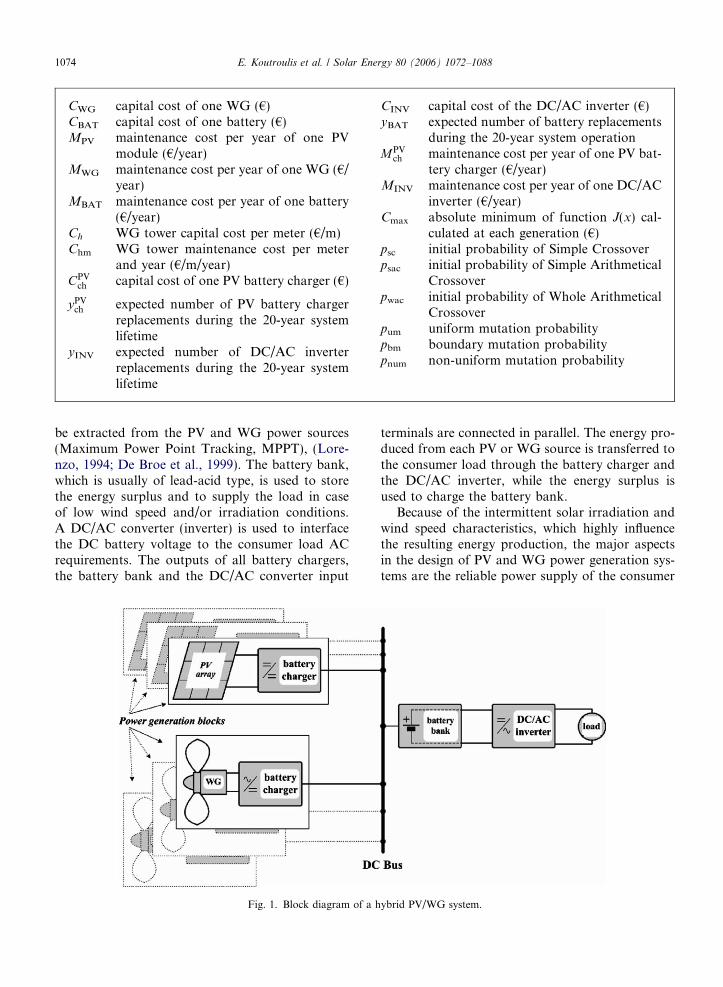
istics, they are usually used in hybrid system config-urations. The block diagram of a stand-alone hybridPV/WG system is shown in Fig. 1. Battery chargers,connected to a common DC bus, are used to chargethe battery bank from the respective PV and WGinput power sources, which are usually configuredin multiple power generation blocks according tothe devices nominal power ratings and the redun-dancy requirements. Depending on the battery char-ger technology, the maximum available power can
d.
Nomenclature
aw WG size (m2)as PV size (m2)cw WG cost per unit area ($/m2)cs PV cost per unit area ($/m2)d(t) average daily demand at day t (kW h)W(t) WG energy production at day t per unit
area (kW h/m2)S(t) PV energy production at day t per unit
area (kW h/m2)N number of PV modulesNb number of batteriesa PV module cost ($)b battery cost ($)NP number of PV modules connected in par-
allelNS number of PV modules connected in seriesP i
Mðt; bÞ maximum output power of the PVarray on day i (1 6 i 6 365) and at hourt (1 6 t 6 24) (W)
I iSCðt; bÞ PV module short-circuit current (A)
ISC,STC PV module short-circuit current underSTC (A)
b PV module tilt angle (�)Gi(t,b) global irradiance incident on the PV
module placed at tilt angle b (W/m2)KI short-circuit current temperature coeffi-
cient (A/�C)V i
OCðtÞ PV module open-circuit voltage (V)VOC,STC open-circuit voltage under STC (V)KV open-circuit voltage temperature coeffi-
cient (V/�C)T i
AðtÞ ambient temperature (�C)NCOT Nominal Cell Operating Temperature
(�C)FFi(t) Fill Factorb1 PV module tilt angle from January until
April and September until December (�)b2 PV module tilt angle for the rest of the
year (�)V m
DC battery charger maximum input voltage(V)
V mOC PV modules maximum open-circuit volt-
age (V)P i
PVðt;bÞ PV power transferred to the batterybank on day i (W)
ns battery charger conversion factorn1 battery charger power electronic inter-
face efficiency (%)
n2 conversion factor (%)NPV
ch number of PV battery chargersNPV total number of PV modulesP m
ch power rating of the selected battery char-ger (W)
P mPV maximum power of one PV module un-
der STC (W)h WG installation height (m)href reference WG height (m)P i
WGðt; hÞ power transferred to the battery bankat hour t of day i, from a WG installedat height h (W)
vi(t,h) wind speed at height h (m/s)vi
refðtÞ reference wind speed measured at heighthref (m/s)
a power law exponentCn battery bank total nominal capacity
(A h)DOD maximum permissible depth of discharge
(%)Cmin minimum permissible battery capacity
during discharging (A h)Ci(t) available battery capacity at hour t of
day i (A h)nB battery efficiency (%)VBUS DC bus voltage (V)P i
BðtÞ battery input/output power (W)Dt simulation time step (h)nS
B number of batteries connected in seriesVB nominal voltage of each individual bat-
tery (V)NBAT total number of batteriesCB nominal capacity of each battery (A h)P i
reðtÞ total power transferred to the batterybank during day i and hour t (W)
NWG total number of WGsP i
LðtÞ DC/AC inverter input power (W)P i
loadðtÞ power consumed by the load at hour t ofday i (W)
ni DC/AC converter efficiency (%)J(x) 20-year round total system cost function
(€)Cc(x) total capital cost function (€)Cm(x) maintenance cost function (€)x vector of the decision variableshlow WG tower lower height limit (m)hhigh WG tower upper height limit (m)CPV capital cost of one PV module (€)
E. Koutroulis et al. / Solar Energy 80 (2006) 1072–1088 1073
CWG capital cost of one WG (€)CBAT capital cost of one battery (€)MPV maintenance cost per year of one PV
module (€/year)MWG maintenance cost per year of one WG (€/
year)MBAT maintenance cost per year of one battery
(€/year)Ch WG tower capital cost per meter (€/m)Chm WG tower maintenance cost per meter
and year (€/m/year)CPV
ch capital cost of one PV battery charger (€)
yPVch expected number of PV battery charger
replacements during the 20-year systemlifetime
yINV expected number of DC/AC inverterreplacements during the 20-year systemlifetime
CINV capital cost of the DC/AC inverter (€)yBAT expected number of battery replacements
during the 20-year system operationMPV
ch maintenance cost per year of one PV bat-tery charger (€/year)
MINV maintenance cost per year of one DC/ACinverter (€/year)
Cmax absolute minimum of function J(x) cal-culated at each generation (€)
psc initial probability of Simple Crossoverpsac initial probability of Simple Arithmetical
Crossoverpwac initial probability of Whole Arithmetical
Crossoverpum uniform mutation probabilitypbm boundary mutation probabilitypnum non-uniform mutation probability
1074 E. Koutroulis et al. / Solar Energy 80 (2006) 1072–1088
be extracted from the PV and WG power sources(Maximum Power Point Tracking, MPPT), (Lore-nzo, 1994; De Broe et al., 1999). The battery bank,which is usually of lead-acid type, is used to storethe energy surplus and to supply the load in caseof low wind speed and/or irradiation conditions.A DC/AC converter (inverter) is used to interfacethe DC battery voltage to the consumer load ACrequirements. The outputs of all battery chargers,the battery bank and the DC/AC converter input
Fig. 1. Block diagram of a h
terminals are connected in parallel. The energy pro-duced from each PV or WG source is transferred tothe consumer load through the battery charger andthe DC/AC inverter, while the energy surplus isused to charge the battery bank.
Because of the intermittent solar irradiation andwind speed characteristics, which highly influencethe resulting energy production, the major aspectsin the design of PV and WG power generation sys-tems are the reliable power supply of the consumer
ybrid PV/WG system.
E. Koutroulis et al. / Solar Energy 80 (2006) 1072–1088 1075
under varying atmospheric conditions and the cor-responding total system cost. Considering the widerange of commercially available device types, it isessential to select the number and type of PV mod-ules, WGs and batteries, and their installationdetails such that power is uninterruptedly suppliedto the load and simultaneously the minimum systemcost is achieved.
A sizing method of stand-alone PV systems hasbeen presented by Shrestha and Goel (1998), whichis based on energy generation simulation for variousnumbers of PVs and batteries using suitable modelsfor the system devices (PVs, batteries, etc.). Theselection of the numbers of PVs and batteriesensures that reliability indices such as the Loss ofLoad Hours (LOLH), the lost energy and the sys-tem cost are satisfied. In a similar method, Markovchain modeling is used for the solar radiation. Inthis case, the number of PVs and batteries areselected according to the desired System Perfor-mance Level (SPL) requirement, which is definedas the number of days that the load cannot be satis-fied and it is expressed in terms of probability(Maghraby et al., 2002).
A design method for hybrid PV/WG systems,based on energy balance, has been proposed by Kel-logg et al. (1998). Using the hourly average data ofwind speed, solar radiation and consumer powerdemand, the difference of generated and demandedpower (DP) is calculated over a 24-h period. Thenumbers of PV modules and WGs are finallyselected, using an iterative procedure where the sys-tem operation is simulated for various numbers ofPVs and WGs, such that DP has an average valueof zero. The total annual cost for each configurationis calculated and the combination with the lowestcost is selected to represent the optimal mixture.
The seasonal variation of PV and WG powergeneration is taken into account in the method pro-posed by Markvart (1996), where the problem ofoptimal sizing the PV and WG power sources in ahybrid generation system is formulated as follows:
minimize : system cost ¼ cs � as þ cw � aw ð1Þ
subject to : dðtÞ 6 W ðtÞ � aw þ SðtÞ � as ð2Þ
where aw and as are the WG and PV sizes (m2), cw
and cs represent the corresponding costs per unitarea ($/m2), d(t) is the average daily demand atday t (kW h) and W(t), S(t) are the WG and PV en-ergy productions at day t per unit area (kW h/m2),respectively.
Using the values of d(t), W(t) and S(t) during theyear, a plot of aw versus as is obtained and the opti-mal configuration is defined on this curve as thepoint where
das
daw
¼ � cw
cs
ð3Þ
However, using this method the battery size is notincluded in the optimization process.
A method for the selection of the optimum com-bination of battery and PV array in a hybrid PV/WG system has been presented by Borowy and Sal-ameh (1996). The system operation is simulated forvarious combinations of PV array and battery sizesand the Loss of Power Supply Probability (LPSP) iscalculated for each combination. Then, for thedesired LPSP, the PV array versus battery size areplotted and the optimal solution, which minimizesthe total system cost, is defined as the point on thesizing curve where
dNdN b
¼ � ba
ð4Þ
where N, Nb are the number of PV modules and bat-teries and a, b are the costs ($) of a PV module and abattery, respectively.
In a similar method (Bagul et al., 1996), the N
versus Nb curve is plotted using a probabilistic anal-ysis of the daily energy surplus. In both methods,the WG size is not included in the optimizationprocess.
According to the methods proposed by Chedidand Rahman (1997) and Yokoyama et al. (1994)the optimal sizes of the PV and WG power sourcesand the batteries are determined by minimizing thesystem total cost function using linear programmingtechniques. The total system cost consists of boththe initial cost and yearly operation and mainte-nance costs.
Common disadvantage of the methods describedabove is that the proposed sizing methodologies donot take into account system design characteristicssuch as the number of battery chargers, the PVmodules tilt angle and the WG installation height,which highly affect both, the resulting energy pro-duction and the installation and maintenance costs.Also, the minimization of the system cost functionhas been implemented either by linearly changingthe values of the corresponding decision variablesor employing linear programming techniques,resulting in suboptimal solutions and increasedcomputational effort requirements.
1076 E. Koutroulis et al. / Solar Energy 80 (2006) 1072–1088
In this paper, an alternative methodology for theoptimal sizing of stand-alone PV/WG systems isproposed. The purpose of the proposed methodol-ogy is to suggest, among a list of commerciallyavailable system devices, the optimal number andtype of units ensuring that the 20-year round totalsystem cost is minimized subject to the constraintthat the load energy requirements are completelycovered, resulting in zero load rejection. The 20-year round total system cost is equal to the sum ofthe respective components capital and maintenancecosts. The decision variables included in the optimi-zation process are the number and type of PV mod-ules, WGs and battery chargers, the PV modules tiltangle, the installation height of the WGs and thebattery type and nominal capacity. The minimiza-tion of the cost (objective) function is implementedemploying a genetic algorithms (GA) approach,
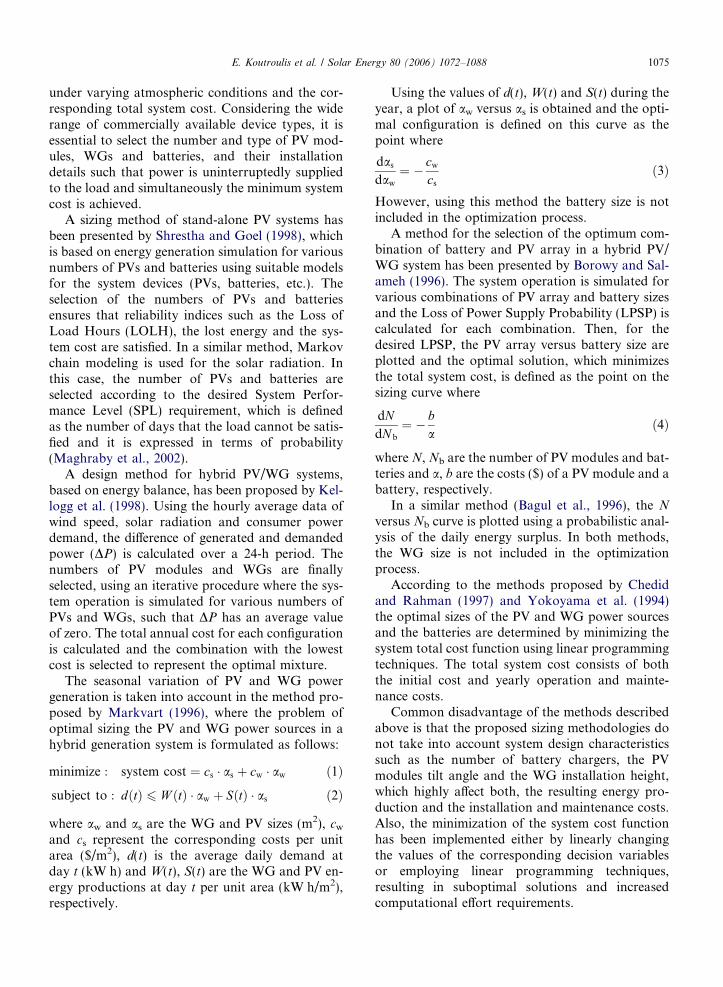
Fig. 2. Flowchart of the proposed
which compared to conventional optimizationmethods, such as dynamic programming and gradi-ent techniques, has the ability to attain the globaloptimum with relative computational simplicity.GAs have been applied to the design of large powerdistribution systems (Ramirez-Rosado and Bernal-Agustin, 1998) and the solution of power economicdispatch problems (Li, 1998) because of their abilityto handle complex problems with linear or non-lin-ear cost functions both, accurately and efficiently. Inthe proposed method, GAs are selected becausethey have shown to be highly applicable to casesof large non-linear systems, where the location ofthe global optimum is a difficult task. Due to theprobabilistic development of solutions, GAs arenot restricted by local optima. Thus, given the num-ber of non-linearities that exist in similar problems,GAs appear to be a useful approach.
optimization methodology.
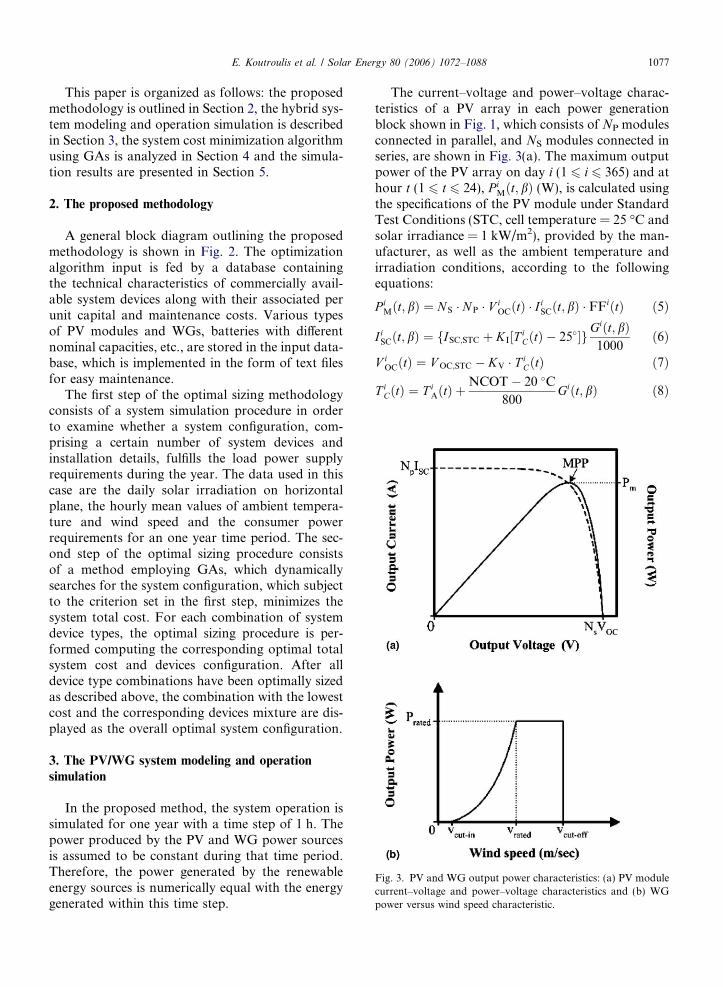
Fig. 3. PV and WG output power characteristics: (a) PV modulecurrent–voltage and power–voltage characteristics and (b) WGpower versus wind speed characteristic.
E. Koutroulis et al. / Solar Energy 80 (2006) 1072–1088 1077
This paper is organized as follows: the proposedmethodology is outlined in Section 2, the hybrid sys-tem modeling and operation simulation is describedin Section 3, the system cost minimization algorithmusing GAs is analyzed in Section 4 and the simula-tion results are presented in Section 5.
2. The proposed methodology
A general block diagram outlining the proposedmethodology is shown in Fig. 2. The optimizationalgorithm input is fed by a database containingthe technical characteristics of commercially avail-able system devices along with their associated perunit capital and maintenance costs. Various typesof PV modules and WGs, batteries with differentnominal capacities, etc., are stored in the input data-base, which is implemented in the form of text filesfor easy maintenance.
The first step of the optimal sizing methodologyconsists of a system simulation procedure in orderto examine whether a system configuration, com-prising a certain number of system devices andinstallation details, fulfills the load power supplyrequirements during the year. The data used in thiscase are the daily solar irradiation on horizontalplane, the hourly mean values of ambient tempera-ture and wind speed and the consumer powerrequirements for an one year time period. The sec-ond step of the optimal sizing procedure consistsof a method employing GAs, which dynamicallysearches for the system configuration, which subjectto the criterion set in the first step, minimizes thesystem total cost. For each combination of systemdevice types, the optimal sizing procedure is per-formed computing the corresponding optimal totalsystem cost and devices configuration. After alldevice type combinations have been optimally sizedas described above, the combination with the lowestcost and the corresponding devices mixture are dis-played as the overall optimal system configuration.
3. The PV/WG system modeling and operation
simulation
In the proposed method, the system operation issimulated for one year with a time step of 1 h. Thepower produced by the PV and WG power sourcesis assumed to be constant during that time period.Therefore, the power generated by the renewableenergy sources is numerically equal with the energygenerated within this time step.
The current–voltage and power–voltage charac-teristics of a PV array in each power generationblock shown in Fig. 1, which consists of NP modulesconnected in parallel, and NS modules connected inseries, are shown in Fig. 3(a). The maximum outputpower of the PV array on day i (1 6 i 6 365) and athour t (1 6 t 6 24), P i
Mðt; bÞ (W), is calculated usingthe specifications of the PV module under StandardTest Conditions (STC, cell temperature = 25 �C andsolar irradiance = 1 kW/m2), provided by the man-ufacturer, as well as the ambient temperature andirradiation conditions, according to the followingequations:
P iMðt; bÞ ¼ N S � N P � V i
OCðtÞ � I iSCðt; bÞ � FFiðtÞ ð5Þ
I iSCðt; bÞ ¼ fISC;STC þ KI½T i
CðtÞ � 25��gGiðt; bÞ1000
ð6Þ
V iOCðtÞ ¼ V OC;STC � KV � T i
CðtÞ ð7Þ
T iCðtÞ ¼ T i
AðtÞ þNCOT � 20 �C
800Giðt; bÞ ð8Þ
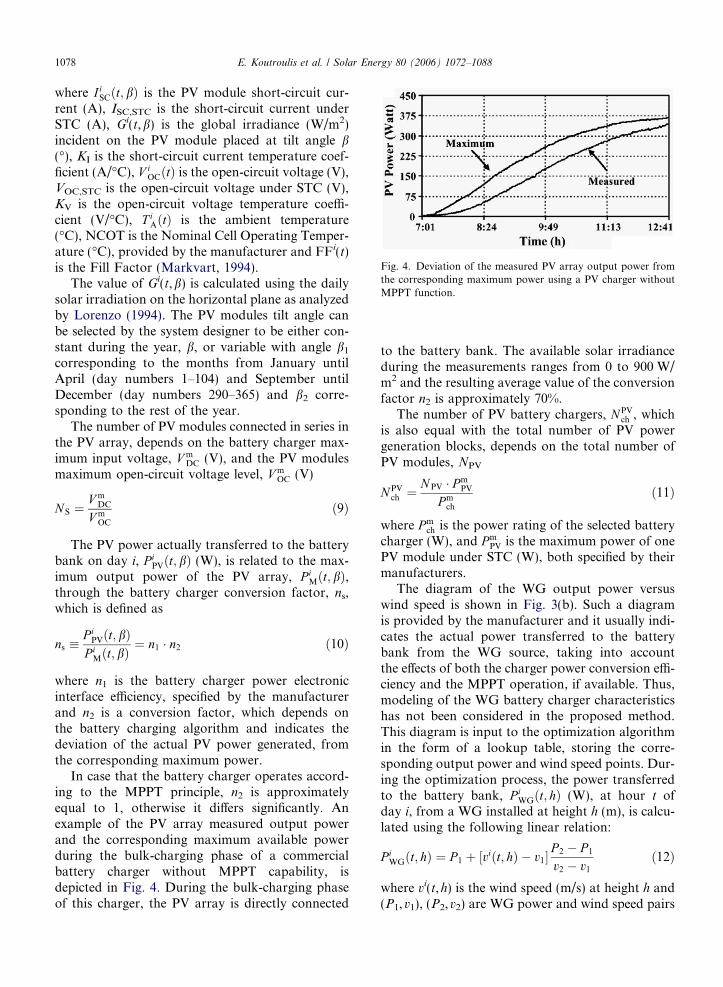
Fig. 4. Deviation of the measured PV array output power fromthe corresponding maximum power using a PV charger withoutMPPT function.
1078 E. Koutroulis et al. / Solar Energy 80 (2006) 1072–1088
where I iSCðt; bÞ is the PV module short-circuit cur-
rent (A), ISC,STC is the short-circuit current underSTC (A), Gi(t,b) is the global irradiance (W/m2)incident on the PV module placed at tilt angle b(�), KI is the short-circuit current temperature coef-ficient (A/�C), V i
OCðtÞ is the open-circuit voltage (V),VOC,STC is the open-circuit voltage under STC (V),KV is the open-circuit voltage temperature coeffi-cient (V/�C), T i
AðtÞ is the ambient temperature(�C), NCOT is the Nominal Cell Operating Temper-ature (�C), provided by the manufacturer and FFi(t)is the Fill Factor (Markvart, 1994).
The value of Gi(t,b) is calculated using the dailysolar irradiation on the horizontal plane as analyzedby Lorenzo (1994). The PV modules tilt angle canbe selected by the system designer to be either con-stant during the year, b, or variable with angle b1
corresponding to the months from January untilApril (day numbers 1–104) and September untilDecember (day numbers 290–365) and b2 corre-sponding to the rest of the year.
The number of PV modules connected in series inthe PV array, depends on the battery charger max-imum input voltage, V m
DC (V), and the PV modulesmaximum open-circuit voltage level, V m
OC (V)
NS ¼V m
DC
V mOC
ð9Þ
The PV power actually transferred to the batterybank on day i, P i
PVðt; bÞ (W), is related to the max-imum output power of the PV array, P i
Mðt; bÞ,through the battery charger conversion factor, ns,which is defined as
ns �P i
PVðt; bÞP i
Mðt; bÞ¼ n1 � n2 ð10Þ
where n1 is the battery charger power electronicinterface efficiency, specified by the manufacturerand n2 is a conversion factor, which depends onthe battery charging algorithm and indicates thedeviation of the actual PV power generated, fromthe corresponding maximum power.
In case that the battery charger operates accord-ing to the MPPT principle, n2 is approximatelyequal to 1, otherwise it differs significantly. Anexample of the PV array measured output powerand the corresponding maximum available powerduring the bulk-charging phase of a commercialbattery charger without MPPT capability, isdepicted in Fig. 4. During the bulk-charging phaseof this charger, the PV array is directly connected
to the battery bank. The available solar irradianceduring the measurements ranges from 0 to 900 W/m2 and the resulting average value of the conversionfactor n2 is approximately 70%.
The number of PV battery chargers, NPVch , which
is also equal with the total number of PV powergeneration blocks, depends on the total number ofPV modules, NPV
N PVch ¼
N PV � P mPV
P mch
ð11Þ
where P mch is the power rating of the selected battery
charger (W), and P mPV is the maximum power of one
PV module under STC (W), both specified by theirmanufacturers.
The diagram of the WG output power versuswind speed is shown in Fig. 3(b). Such a diagramis provided by the manufacturer and it usually indi-cates the actual power transferred to the batterybank from the WG source, taking into accountthe effects of both the charger power conversion effi-ciency and the MPPT operation, if available. Thus,modeling of the WG battery charger characteristicshas not been considered in the proposed method.This diagram is input to the optimization algorithmin the form of a lookup table, storing the corre-sponding output power and wind speed points. Dur-ing the optimization process, the power transferredto the battery bank, P i
WGðt; hÞ (W), at hour t ofday i, from a WG installed at height h (m), is calcu-lated using the following linear relation:
P iWGðt; hÞ ¼ P 1 þ ½viðt; hÞ � v1�
P 2 � P 1
v2 � v1
ð12Þ
where vi(t,h) is the wind speed (m/s) at height h and(P1,v1), (P2,v2) are WG power and wind speed pairs
E. Koutroulis et al. / Solar Energy 80 (2006) 1072–1088 1079
stored in the lookup table, such thatv1 < vi(t,h) < v2.
In order to calculate the wind speed, vi(t,h), atthe desired WG installation height, h, which is usu-ally different from the height corresponding to thewind speed input data, the exponential law is used
viðt; hÞ ¼ virefðtÞ �
hhref
� �a
ð13Þ
where virefðtÞ is the reference (input) wind speed
(m/s) measured at height href (m) and a is the powerlaw exponent, ranging from 1/7 to 1/4.
The battery bank, with total nominal capacity Cn
(A h), is permitted to discharge up to a limit definedby the maximum permissible depth of dischargeDOD (%), which is specified by the system designerat the beginning of the optimal sizing process, i.e.
Cmin ¼ DOD � Cn ð14Þwhere Cmin is the minimum permissible batterycapacity during discharging (A h).
Depending on the PV and WG energy produc-tion and the load power requirements, the batterystate of charge is accumulated during the simulationperiod as follows:
CiðtÞ ¼ Ciðt � 1Þ þ nB
P iBðtÞ
V BUS
Dt ð15Þ
Cið24Þ ¼ Ciþ1ð0Þ ð16Þ
where Ci(t), Ci(t � 1) is the available battery capac-ity (A h) at hour t and t � 1, respectively, of day i,nB = 80% is the battery round-trip efficiency duringcharging and nB = 100% during discharging(Borowy and Salameh, 1996), VBUS is the DC busvoltage (V), P i
BðtÞ is the battery input/output power(W) [P i
BðtÞ < 0 during discharging and P iBðtÞ > 0
during charging] and Dt is the simulation time step,set to Dt = 1 h.
The number of batteries connected in series, nSB,
depends on the nominal DC bus voltage and thenominal voltage of each individual battery, VB
(V), and it is calculated as follows:
nSB ¼
V BUS
V B
ð17Þ
The battery bank nominal capacity is relatedwith the total number of batteries, NBAT, the num-ber of series connected batteries and the nominalcapacity of each battery, CB (A h), as follows:
Cn ¼NBAT
nSB
CB ð18Þ
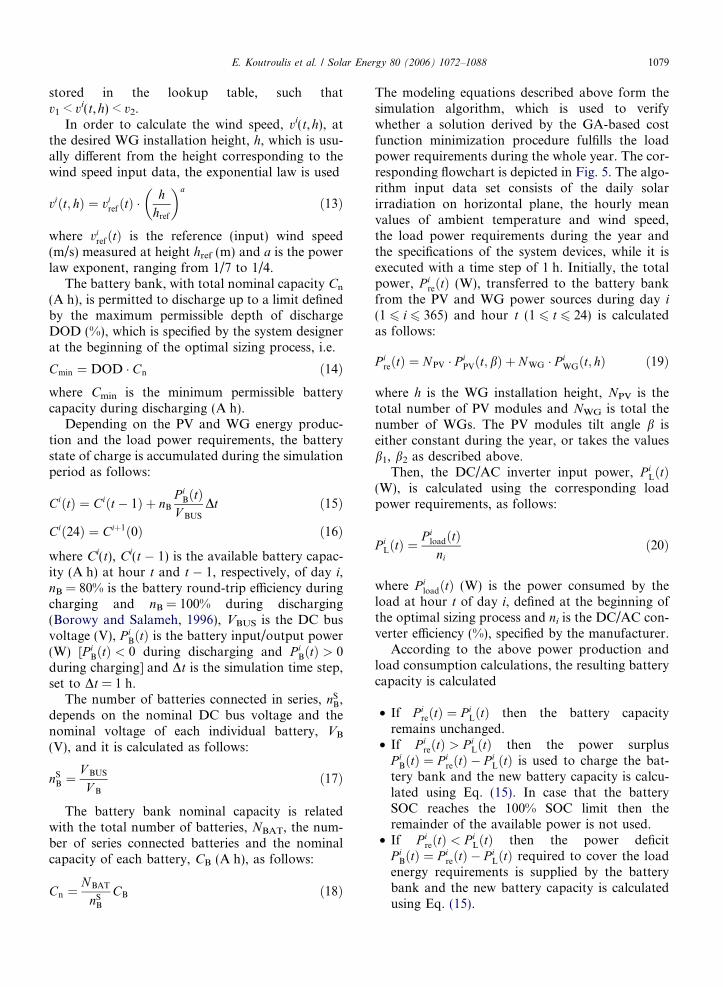
The modeling equations described above form thesimulation algorithm, which is used to verifywhether a solution derived by the GA-based costfunction minimization procedure fulfills the loadpower requirements during the whole year. The cor-responding flowchart is depicted in Fig. 5. The algo-rithm input data set consists of the daily solarirradiation on horizontal plane, the hourly meanvalues of ambient temperature and wind speed,the load power requirements during the year andthe specifications of the system devices, while it isexecuted with a time step of 1 h. Initially, the totalpower, P i
reðtÞ (W), transferred to the battery bankfrom the PV and WG power sources during day i
(1 6 i 6 365) and hour t (1 6 t 6 24) is calculatedas follows:
P ireðtÞ ¼ NPV � P i
PVðt; bÞ þ NWG � P iWGðt; hÞ ð19Þ
where h is the WG installation height, NPV is thetotal number of PV modules and NWG is total thenumber of WGs. The PV modules tilt angle b iseither constant during the year, or takes the valuesb1, b2 as described above.
Then, the DC/AC inverter input power, P iLðtÞ
(W), is calculated using the corresponding loadpower requirements, as follows:
P iLðtÞ ¼
P iloadðtÞni
ð20Þ
where P iloadðtÞ (W) is the power consumed by the
load at hour t of day i, defined at the beginning ofthe optimal sizing process and ni is the DC/AC con-verter efficiency (%), specified by the manufacturer.
According to the above power production andload consumption calculations, the resulting batterycapacity is calculated
• If P ireðtÞ ¼ P i
LðtÞ then the battery capacityremains unchanged.
• If P ireðtÞ > P i
LðtÞ then the power surplusP i
BðtÞ ¼ P ireðtÞ � P i
LðtÞ is used to charge the bat-tery bank and the new battery capacity is calcu-lated using Eq. (15). In case that the batterySOC reaches the 100% SOC limit then theremainder of the available power is not used.
• If P ireðtÞ < P i
LðtÞ then the power deficitP i
BðtÞ ¼ P ireðtÞ � P i
LðtÞ required to cover the loadenergy requirements is supplied by the batterybank and the new battery capacity is calculatedusing Eq. (15).
Fig. 5. Flowchart of the algorithm simulating the system operation.
1080 E. Koutroulis et al. / Solar Energy 80 (2006) 1072–1088
The above steps are repeated until either the simula-tion time period finishes, at day number 365 and the24th hour, indicating successful system operation,or the battery bank is discharged below the lowestpermissible limit defined by Eq. (14). In such case,the system operation is considered to fail and thecorresponding configuration is rejected, since it doesnot guarantee reliable power supply of the load.
4. System cost minimization algorithm using GAs
Genetic algorithms are adaptive search and opti-mization approaches that work mimicking the prin-
ciples of natural genetics. GAs are very differentfrom traditional search and optimization methodsused in engineering design problems. Fundamentalideas of genetics in biology are borrowed and usedartificially to construct search algorithms that arerobust and require minimal problem information.
A typical constrained, single variable optimiza-tion problem can be outlined as follows:
Maximisex f ðxÞsubject to the constraint : xmin 6 x 6 xmax
ð21Þ
For the solution of such a problem with GAs thevariable x is typically coded in some string struc-

E. Koutroulis et al. / Solar Energy 80 (2006) 1072–1088 1081
tures. Binary-coded or floating point strings canalso be used, while the length of the string is usuallydetermined according to the accuracy of the solu-tion desired. The GA, as any evolution procedurefor a particular problem, must have the followingcomponents (Michalewicz, 1994):
• A generic representation for potential solutionsto the problem, similar to the system modelingpresented in the previous section.
• A way to create an initial population of potentialsolutions.
• An evaluation function that plays the role of theenvironment, rating solutions in terms of their‘‘fitness’’ and
• Genetic operators (such as crossover and muta-tion) that alter the composition of children.
In the proposed method, the GA optimal sizingmethodology outputs the optimum number ofWGs, PV modules, batteries and PV battery charg-ers, along with the optimum PV modules tilt angleand WGs installation height, comprising the set ofdecision variables, such that the 20-year round totalsystem cost function, J(x) (€), is minimized. Thetotal system cost function is equal to the sum ofthe total capital, Cc(x) (€), and maintenance cost,Cm(x) (€), functions
minxfJðxÞg ¼ min
xfCcðxÞ þ CmðxÞg ð22Þ
where x is the vector of the decision variables listedabove.
Thus, multi-objective optimization is achieved byminimizing the total cost function consisting of thesum of the individual system devices capital and20-year round maintenance costs
JðNPV;NWG;NBAT;N PVch ; h;bÞ
¼ N PV � ðCPV þ 20 �MPVÞ þNWG � ðCWG
þ 20 �MWG þ h �Ch þ 20 � h �ChmÞ
þNBAT � ½CBAT þ yBAT �CBAT
þ ð20� yBAT � 1Þ �MBAT� þN PVch �CPV
ch � ðyPVch þ 1Þ
þNPVch �MPV
ch � ð20� yPVch � 1Þ þCINV � ðyINV þ 1Þ
þM INV � ð20� yINV � 1Þ ð23Þ
or, equivalently, by maximizing the GA fitnessfunction
F ðNPV;N WG;NBAT;N PVch ; h;bÞ
¼Cmax � JðNPV;N WG;NBAT;NPV
ch ; h;bÞ;if Cmax � JðNPV;NWG;N BAT;N PV
ch ; h;bÞ > 0
0; otherwise
8><>:
ð24Þ
subject to the constraints
N PV P 0 ð25ÞN WG P 0 ð26ÞN BAT P 0 ð27ÞN PV
ch P 0 ð28Þhlow 6 h6 hhigh ð29Þ
0� 6 b6 90� or
0� 6 b1 6 90� and 0� 6 b2 6 90�
" #ð30Þ
Simulation ðN PV;N WG;N BAT;N PVch ;h;bÞ ¼ Successful or
Simulation ðN PV;N WG;N BAT;N PVch ;h;b1;b2Þ ¼ Successful
" #
ð31Þ
where hlow, hhigh are the WG tower lower and upperheight limits (m), respectively, specified by the WGmanufacturer, CPV, CWG, and CBAT are the capitalcosts (€) of one PV module, WG and battery,respectively, MPV, MWG, and MBAT are the mainte-nance costs per year (€/year) of one PV module,WG and battery, respectively, Ch is the WG towercapital cost per meter (€/m), Chm is the WG towermaintenance cost per meter and year (€/m/year),CPV
ch is the capital cost of one PV battery charger(€), yPV
ch , yINV are the expected numbers of PV bat-tery charger and DC/AC inverter replacements dur-ing the 20-year system lifetime and it is equal to thesystem lifetime (20 years) divided by the Mean TimeBetween Failures (MTBF) of power electronic con-verters (Holtz et al., 1994), CINV is the capital costof the DC/AC inverter, (€), yBAT is the expectednumber of battery replacements during the 20-yearsystem operation, because of limited battery life-time, MPV
ch , MINV maintenance costs per year (€/year) of one PV battery charger and DC/AC inver-ter, respectively and Cmax is the absolute minimumof function J(x) calculated at each generation, (€).
The Simulation(Æ) function performs the systemsimulation described in Section 3, in order to verifythat the examined system configuration fulfils theuninterrupted power supply requirement of the loadduring the whole year.
Real-Coded GA techniques are introduced for thesolution of the optimization problem based on the

1082 E. Koutroulis et al. / Solar Energy 80 (2006) 1072–1088
mechanism of natural selection and natural genetics.Each chromosome consists of five genes in the form:[NPVjNWGjNBATjhjb]. In case that the PV modulesinclination changes seasonally, then six genes areused in the optimization algorithm and each chromo-some is of the form: [NPVjNWGjNBATjhjb1jb2]. Thenumber of PV battery chargers has not been incorpo-rated into the chromosome configuration in order toreduce the algorithm complexity, since, as expressedin Eq. (11), it depends on the PV array power rating,which in turn depends on the number of PV modules,NPV. However, the number of PV battery chargersaffects the total system cost, thus the associated costhas been included in the GA fitness function, asexpressed in Eq. (24).
The flowchart of the GA optimization process isdepicted in Fig. 6. An initial population of 30 chro-mosomes, comprising the 1st generation, is gener-ated randomly and the constraints described byinequalities (25)–(31) are evaluated for each chro-mosome. If any of the initial population chromo-somes violates the problem constraints then it isreplaced by a new chromosome, which is generatedrandomly and fulfils these constraints.
Fig. 6. The GA optim
The first step of the algorithm iteration is the fit-ness function evaluation for each chromosome ofthe corresponding population. If any of the result-ing fitness function values is lower than the lowestvalue obtained at the previous iterations then thisvalue is considered to be the optimal solution ofthe minimization problem and the correspondingchromosome consists of the hybrid system optimaloperational parameter values. This optimal solutionis replaced by better solutions, if any, produced insubsequent GA generations during the programevolution.
In order to select the chromosomes, which will besubject to the crossover and mutation operations inorder to produce the next generation population, aselection operation is applied based on the roulettewheel method (Michalewicz, 1994).
The crossover mechanism uses the followingthree operators:
Simple Crossover, (SC) with initial probabilitypsc = 10%.Simple Arithmetical Crossover, (SAC) with ini-tial probability psac = 10%.
ization process.

E. Koutroulis et al. / Solar Energy 80 (2006) 1072–1088 1083
Whole Arithmetical Crossover (WAC) with ini-tial probability pwac = 10%. If the chromosomesc1 = [u1 . . .um] and c2 = [w1 . . .wm] are to be crossedthen the resulting offspring consists ofc01 ¼ awac � c1 þ ð1� awacÞ � c2 and c02 ¼ ð1� awacÞ�c1 þ awac � c2. The parameter awac is set equal to0.75.
For each chromosome selected for crossover, arandom number r (0 6 r 6 1) is generated. Depend-ing on the value of r, one of the previous crossoveroperators is applied
• r < psc then this chromosome is selected for SC,• psc 6 r < (psc + psac) then the SAC operator is
applied,• (psc + psac) 6 r < (psc + psac + pwac) then the
chromosome is selected for WAC and finally,• r P (psc + psac + pwac) then none of the three
crossover operators is applied.
Next, the selected chromosomes are subject tothe mutation mechanism, which is performed usingthe following three operators:
Uniform Mutation, (UM). During UM a gene israndomly selected and it is assigned a new value,randomly selected from the corresponding rangeof values which fulfill the optimization problemconstraints. This range of values is calculated forthe selected gene, considering the values of the othergenes within the chromosome constant. The muta-tion probability, pum, is 10%.
Boundary mutation, (BM). The boundary muta-tion probability, pbm, is 3%.
Non-uniform mutation, (NUM). The non-uni-form mutation probability, pnum, is 35%, in order
Fig. 7. Distribution of the consumer po
to enhance the fine local tuning capability duringthe optimization process.
For each chromosome a random number, r,(0 6 r 6 1) is generated
• r < pum then this chromosome is selected for UM,• pum 6 r < (pbm + pum) then the BM operator is
applied,• (pbm + pum) 6 r < (pbm + pum + pnum) then the
chromosome is selected for NUM and finally,• r P (pbm + pum + pnum) then none of the three
mutation operators is applied.
In case that the application of any of the cross-over or mutation operators described above, resultsin a chromosome which does not satisfy the optimi-zation problem constraints, then a ‘‘repair’’ proce-dure is performed and that chromosome isreplaced by the corresponding parent. In case ofSC operation, where each new chromosome is gen-erated by two parents, then the chromosome isreplaced by the parent with the best fitness functionvalue.
The GA optimization process described above isrepeated until a predefined number of populationgenerations have been evaluated.
5. Simulation results
The proposed method has been applied to thedesign of a stand-alone hybrid PV/WG system inorder to power supply a residential householdlocated in the area of the Technical University ofCrete (TUC) with geographical coordinates definedas
wer requirements during the day.

1084 E. Koutroulis et al. / Solar Energy 80 (2006) 1072–1088
Latitude: 35.53� (35�31 04800N),Longitude: 24.06� (24�03 03500E) andAltitude: 150 m (approx.) above sea level.
The distribution of the consumer power require-ments during a day (Lazou and Papatsoris, 2000) isshown in Fig. 7. It is assumed that the user appli-ances are energy efficient and energy saving loadmanagement strategies are applied, which are com-mon practices in renewable energy applications.The daily solar irradiation on horizontal plane, aswell as the hourly mean values of ambient tempera-ture and wind speed, plotted in Fig. 8 during the
Fig. 8. Hourly mean values during the year 2003 of meteorolog-ical conditions: (a) ambient temperature, (b) wind speed and (c)daily irradiation on horizontal plane.
year 2003, were recorded using a properly developeddata-acquisition system installed at the TUCcampus.
The technical characteristics and the related cap-ital and maintenance costs of the hybrid systemdevices, which are input to the optimal sizing proce-dure, are shown in Tables 1–5. The installation costhas been included in the capital cost of the devices,while the maintenance cost of each unit per year hasbeen set at 1% of the corresponding capital cost.The MTBF of the battery chargers and DC/ACinverter has been set equal to 40,000 h. The expectedbattery lifetime has been set at 3 years resulting inyBAT = 6.
The optimal sizing results, consisting of both thedevices type and their number, for each combina-tion of system devices included in Tables 1–5, areshown in Table 6. The overall optimal solution iscombination #5, resulting in a 20-year round systemcost of 37,524 €. It is noteworthy that a PV chargerwith MPPT capability has been selected in the opti-mal solution, although of higher per unit cost com-pared to the other PV charger option as shown inTable 5, since it achieves better exploitation of theavailable PV power. The corresponding batterybank has an optimal total nominal capacity of920 A h and the available capacity variation duringthe year is depicted in Fig. 9. The maximum depthof discharge is approximately 63.7%, thus indicatingthe system capability to supply reliably the con-sumer load. Also, the variation of the system totalcost (fitness function) during the GA optimizationprocedure of Combination #5 is shown in Fig. 10.It can be noted that a near optimal solution wasderived during the early stages of the GA genera-tions evolution. The CPU time required for the evo-lution of the 721 generations in the diagram ofFig. 10 is approximately 3 min (Pentium IV,2.6 GHz).
The optimal sizing results, for each combinationof system devices included in Tables 1–5, in casethat the power source consists either only ofWGs or only of PV modules are tabulated inTables 7 and 8, respectively. It is observed thatin both cases the overall optimal solutions, i.e.combinations #1 and #5, respectively, result insubstantially higher total system cost compared tothe hybrid PV/WG system design. Also the PV-only system results in approximately double totalcost compared to the WG-only system because ofthe much higher per unit capital cost of PVmodules.

Table 1Batteries specifications
Type Nominal capacity (A h) Voltage (V) DOD (%) Capital cost (€) Maintenance cost per year (€/year)
1 230 12 80 264 2.642 100 12 80 126 1.26
Table 2WGs specifications
Type Powerrating (W)
hlow (m) hhigh (m) Capitalcost (€)
Maintenance costper year (€/year)
Tower capitalcost per meter (€/m)
Tower maintenance cost per yearand per meter (€/year/m)
1 1000 8 15 1681 16.81 55 0.552 400 8 15 512 11.9 11 0.11
Table 3PV modules specifications
Type Voc (V) Isc (A) Vmax (V) Imax (A) Pmax (W) NCOT (�C) Capital cost (€) Maintenance cost per year (€/year)
1 21.6 3.48 17.3 3.18 55 43 265.81 2.662 21 7.22 17 6.47 110 43 519.14 5.19
Table 4DC/AC inverter specifications
Type Efficiency (%) Power rating (W) Capital cost (€) Maintenance cost per year (€/year)
1 80 1500 1942.0 19.42
Table 5PV battery chargers specifications
Type n1 (%) n2 (%) Power rating (W) Capital cost (€) Maintenance cost per year (€/year)
1 95 100 300 200.0 2.02 95 70 240 94.0 0.94
E. Koutroulis et al. / Solar Energy 80 (2006) 1072–1088 1085
A remark concerning the tilt angles b1 and b2
tabulated in Tables 6 and 8, is that the tilt angle val-ues corresponding to the winter period, b1, aresometimes lower than the relevant ones for the sum-mer period, b2. This is due to the solar irradiationprofile of the site under consideration, exhibitingprolonged cloudy intervals during the winter, result-ing in low optimal b1 tilt angle values, since themain component of the global irradiation undercloudy conditions is the diffused radiation, whichis maximized at low tilt angles. Also, the tilt angleb2 values are sometimes higher compared to the typ-ical angle values calculated using the latitude of theinstallation site. For example, b2 = 73� in the com-bination of row #5 in Table 6 and b2 = 79� in thecombination of row #3 in Table 8, etc., while typical
installation procedures impose tilt angles less than60� for the site under consideration. These b2 tiltangle values, which minimize the system cost, resultin case that the system components optimal mixtureis such that PV energy surplus is produced duringthe summer period, thus the zero load rejection con-straint is satisfied without requiring further reduc-tion of the b2 angle value.
In all preceding cases, the proposed algorithmconvergence to the global optimum solution hasbeen verified, using a properly developed simulationprogram, by linearly changing the values of all deci-sion variables included in the optimization processand calculating the corresponding 20-year roundsystem cost. This procedure is repeated for eachcombination of system components types. The
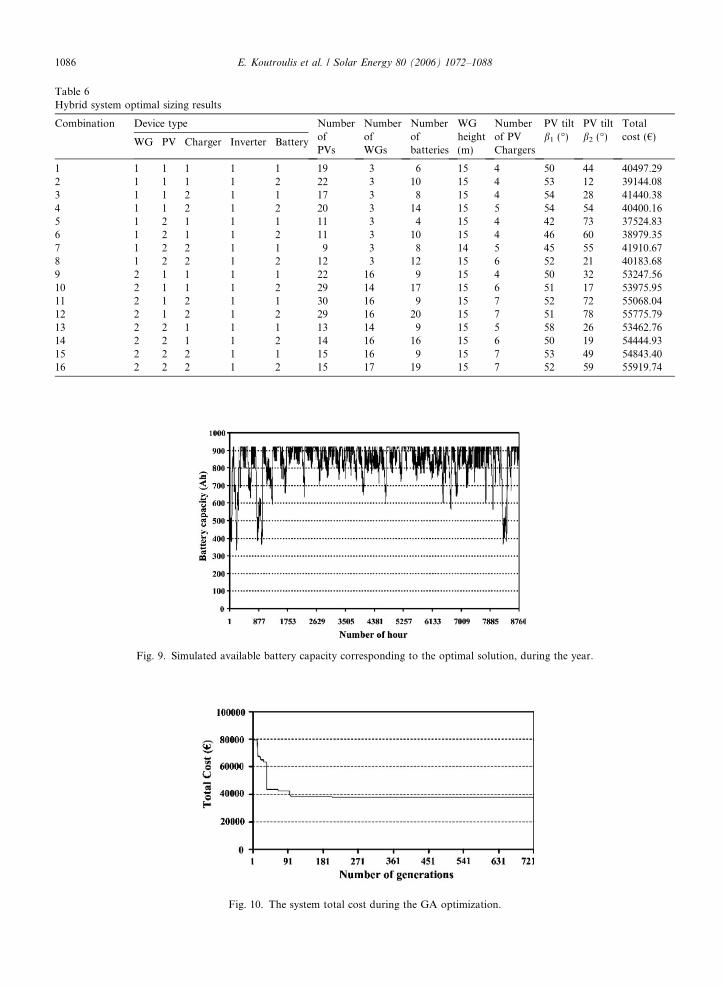
Table 6Hybrid system optimal sizing results
Combination Device type NumberofPVs
NumberofWGs
Numberofbatteries
WGheight(m)
Numberof PVChargers
PV tiltb1 (�)
PV tiltb2 (�)
Totalcost (€)WG PV Charger Inverter Battery
1 1 1 1 1 1 19 3 6 15 4 50 44 40497.292 1 1 1 1 2 22 3 10 15 4 53 12 39144.083 1 1 2 1 1 17 3 8 15 4 54 28 41440.384 1 1 2 1 2 20 3 14 15 5 54 54 40400.165 1 2 1 1 1 11 3 4 15 4 42 73 37524.836 1 2 1 1 2 11 3 10 15 4 46 60 38979.357 1 2 2 1 1 9 3 8 14 5 45 55 41910.678 1 2 2 1 2 12 3 12 15 6 52 21 40183.689 2 1 1 1 1 22 16 9 15 4 50 32 53247.5610 2 1 1 1 2 29 14 17 15 6 51 17 53975.9511 2 1 2 1 1 30 16 9 15 7 52 72 55068.0412 2 1 2 1 2 29 16 20 15 7 51 78 55775.7913 2 2 1 1 1 13 14 9 15 5 58 26 53462.7614 2 2 1 1 2 14 16 16 15 6 50 19 54444.9315 2 2 2 1 1 15 16 9 15 7 53 49 54843.4016 2 2 2 1 2 15 17 19 15 7 52 59 55919.74
Fig. 9. Simulated available battery capacity corresponding to the optimal solution, during the year.
Fig. 10. The system total cost during the GA optimization.
1086 E. Koutroulis et al. / Solar Energy 80 (2006) 1072–1088
Table 7Optimal sizing results for WG-only power source
Combination Device type Number of WGs Number of batteries WG height (m) Total cost (€)
WG Inverter Battery
1 1 1 1 5 10 15 43860.502 1 1 2 5 24 15 46598.423 2 1 1 31 21 15 142753.224 2 1 2 31 48 15 146346.74
Table 8Optimal sizing results for PV-only power source
Combination Device type NumberofPVs
Numberofbatteries
NumberofPV chargers
PV tiltb1 (�)
PV tiltb2 (�)
Totalcost (€)PV Chargers Inverter Battery
1 1 1 1 1 57 26 11 15 11 88453.022 1 1 1 2 58 59 11 12 20 92836.103 1 2 1 1 73 28 17 31 79 94220.924 1 2 1 2 75 62 18 24 49 98337.565 2 1 1 1 29 26 11 12 54 88337.696 2 1 1 2 31 57 12 6 64 92880.977 2 2 1 1 36 28 17 30 47 93362.818 2 2 1 2 39 61 18 19 21 97812.03
E. Koutroulis et al. / Solar Energy 80 (2006) 1072–1088 1087
resulting optimal solution, for each combination ofsystem components types, is equal to the solutionderived using the proposed GA optimizationmethod, in terms of both the total system cost andthe values of the decision variables, thus provingthe GA optimization procedure convergence to theglobal optimum solution. However, the CPU timerequired by the simulation program to derive theoptimal solution for each combination of systemcomponents types is approximately 20 h, whileusing the proposed method the corresponding timerequired is approximately 3 min.
6. Conclusions
The major aspects in the design of PV and/orWG power generation systems are (a) the reliablepower supply of the consumer under varying atmo-spheric conditions and (b) the corresponding totalsystem cost. Past proposed PV/WG system sizingmethods suffer the disadvantage of not taking intoaccount system design characteristics such as thenumber of battery chargers, the PV modules tiltangle and the WG installation height, which highlyaffect both the resulting energy production and theinstallation and maintenance costs. Also, in theexisting literature, the minimization of the systemcost function is implemented either by linearlychanging the number of the corresponding decision
variables or employing linear programming tech-niques, resulting in suboptimal solutions andincreased computational effort requirements.
In this paper, a methodology for the optimal siz-ing of hybrid, stand-alone PV/WG systems, hasbeen presented. The purpose of the proposed meth-odology is to support the selection, among a list ofcommercially available system devices, the optimalnumber and type of PV modules, WGs and PV bat-tery chargers, the PV modules tilt angle, the instal-lation height of the WGs and the battery type andnominal capacity. The optimal number and typeof each system component is calculated such thatthe 20-year round total system cost is minimizedsubject to the constraint that the load powerrequirements are completely covered, thus resultingin zero load rejection. The 20-year round total sys-tem cost is equal to the sum of the respective com-ponents capital and maintenance costs. The cost(objective) function minimization is implementedusing genetic algorithms, which compared to con-ventional optimization methods, such as dynamicprogramming and gradient techniques, have theability to attain the global optimum with relativecomputational simplicity. The proposed methodhas been applied to the design of a power generationsystem in order to supply a residential household.The simulation results verify that hybrid PV/WGsystems result in lower system cost compared to

1088 E. Koutroulis et al. / Solar Energy 80 (2006) 1072–1088
cases where either exclusively WG or exclusively PVsources are used.
References
Bagul, A.D., Salameh, Z.M., Borowy, B., 1996. Sizing of a stand-alone hybrid wind-photovoltaic system using a three-eventprobability density approximation. Solar Energy 56 (4), 323–335.
Borowy, B.S., Salameh, Z.M., 1996. Methodology for optimallysizing the combination of a battery bank and PV array in awind/PV hybrid system. IEEE Transactions on EnergyConversion 11 (2), 367–373.
Chedid, R., Rahman, S., 1997. Unit sizing and control of hybridwind-solar power systems. IEEE Transactions on EnergyConversion 12 (1), 79–85.
De Broe, A.M., Drouilhet, S., Gevorgian, V., 1999. A peak powertracker for small wind turbines in battery charging applica-tions. IEEE Transactions on Energy Conversion 14 (4), 1630–1635.
Holtz, J., Lotzkat, W., Stadtfeld, S., 1994. Controlled ACdrives with ride-through capability at power interruption.IEEE Transactions on Industry Applications 30 (5), 1275–1283.
Kellogg, W.D., Nehrir, M.H., Venkataramanan, G., Gerez, V.,1998. Generation unit sizing and cost analysis for stand-alonewind, photovoltaic and hybrid wind/PV systems. IEEETransactions on Energy Conversion 13 (1), 70–75.
Lazou, A., Papatsoris, A., 2000. The economics of photovoltaicstand-alone residential households: a case study for variousEuropean and Mediterranean locations. Solar Energy Mate-rials & Solar Cells 62, 411–427.
Li, F., 1998. A comparison of genetic algorithms with conven-tional techniques on a spectrum of power economic dispatchproblems. Expert Systems with Applications 15, 133–142.
Lorenzo, E., 1994. Solar Electricity: Engineering of PhotovoltaicSystems, first ed. Progensa.
Maghraby, H.A.M., Shwehdi, M.H., Al-Bassam, G.K., 2002.Probabilistic assessment of photovoltaic (PV) generationsystems. IEEE Transactions on Power Systems 17 (1), 205–208.
Markvart, T., 1994. Solar Electricity, first ed. Wiley.Markvart, T., 1996. Sizing of hybrid photovoltaic-wind energy
systems. Solar Energy 57 (4), 277–281.Michalewicz, Z., 1994. Genetic algorithms + data struc-
tures = evolution programs, second ed. Springer-Verlag.Ramirez-Rosado, I.J., Bernal-Agustin, J.L., 1998. Genetic algo-
rithms applied to the design of large power distributionsystems. IEEE Transactions on Power Systems 13 (2), 696–703.
Shrestha, G.B., Goel, L., 1998. A study on optimal sizing ofstand-alone photovoltaic stations. IEEE Transactions onEnergy Conversion 13 (4), 373–378.
Yokoyama, R., Ito, K., Yuasa, Y., 1994. Multiobjective optimalunit sizing hybrid power generation systems utilizing photo-voltaic and wind energy. Transactions of the ASME: Journalof Solar Energy Engineering 116, 167–173.
![Solar Photovoltaic Electric System Protection Prof. Brian Norton … · 2018. 8. 15. · • [2] Sizing fuses for Photovoltaic Systems per the National Electrical Code, 2012, Mersen](https://img.pdfslide.net/doc/110x75/60e4108c721af6303603ad47/solar-photovoltaic-electric-system-protection-prof-brian-norton-2018-8-15.jpg)