Embed Size (px)
Citation preview

Methodology of polymer/metal interface characterization by adapted
EDX profiling in a pressure controlled SEM
C. Arnoult1, C. Sperandio
1, A. Laachachi
1, D. Ruch
1 and J. Di Martino
1
1 AMS, Department of Advanced Materials and Structures, CRP Henri Tudor, 66 rue de Luxembourg, BP 144, L-4002
Esch sur Alzette, Luxembourg
The aim of this paper is to present an innovative approach to study polymer/metal composite interface by EDX profiling in
a PC-FEG-SEM, applied to the case of epoxy/aluminum joint. It is divided into two parts. The first part focuses on general
considerations on the EDX profile in a PC-SEM. It begins with presenting the impact of technique artifacts on the shape of
the profile such as the „pear effect“ contribution. Then the influence of the introduced gas in the PC-SEM on the profile
analysis is discussed. The second part presents the experimental approach that has been specifically developed for our kind
of samples. It presents the preliminary study dedicated to the characterization of the impact of the polymer degradation on
the analysis and how the optimum acquisition parameters are consequently defined. Then the data accuracy in term of
statistical precision is verified. An original experimental strategy is proposed to improve accuracy or at least to circumvent
a lack of accuracy. Finally, the presence of (inter) diffusion profile and the diffusion lengths are estimated. This innovative
methodology promotes the use of the PC-SEM in the field of polymer/metal interfaces investigation, allowing obtaining an
optimized EDX profile and thus a more accurate characterization of modern composite materials.
Keywords Pressure controlled scanning electron microscopy, profiling, Energy dispersive X rays spectrometry, Interface,
Diffusion, Adhesive joint, Polymer/metal
1. Introduction
Macroscopic properties of multi-composites materials are, to a large extent, directly linked to the microscopic
characteristics of the interfacial regions. In numerous cases, a third material, also called interphase, appears at the
interface because of (inter) diffusion phenomena. The properties of this interphase determine all the interface properties
and consequently the whole system behavior. The accurate characterization of this specific area has a great importance
for applications such as structural adhesive, joining, composite manufacturing... Electron microprobe technique such as
energy dispersive X-rays spectrometry profiling (EDX profiling) in scanning electron microscopy (SEM) is a well know
and widely used method of interface characterization for metal and ceramic composites [1-2]. It allows to characterize
the variation of the chemical composition at the interface, and thus the diffusion phenomenon, at very large scale with a
good accuracy and reproducibility.
However EDX in SEM is rarely used for the characterization of interface in the field of polymer composite for many
reasons. First, technique artifact such as the “pear” effect has to be taken into account [3]. This pear effect induces a
deformation of the profile that can be very limiting for the diffusion phenomenon characterization. It can’t be ignored,
especially for the very small diffusion lengths and when the pear is large (as it is for polymers). In addition, the
insulating nature of the polymers imposes a pre treatment with a conductive coating on its surface to avoid the charging
effect. But each conductive coating, even carbon coating, induces artifacts such as mask effect by absorption of the low
energetic X rays and/or modulation of the signal when a perfect thickness homogeneity of the coating is not respected.
At low voltage i.e. when the incident electron range is smaller, coating artifacts can be very critical. In addition,
polymers are electron irradiation sensitive materials. Thus, during SEM analysis, degradation can occur and
dramatically modify the results. This strongly limits the time of analysis and the possibility to use high energy and high
current probe [4-6].
Currently, novel possibilities of analysis and characterization are offered by two recent innovations in the field of the
scanning electron microscopy: Field emission gun (FEG)-SEM and pressure controlled SEM (PC-SEM). The FEG-
SEM allows to work at low energy and low current with good emission stability and smaller probe size [7-8]. This
particularity of the FEG gun enables consequently to make EDX analysis with a sufficient stability of signal at low
voltage which was not the case with previous SEM generations. As for, the PC-SEM, finds a great advantage on the
elimination of the charge accumulation at the sample surface thanks to partial ionization of a gas introduced inside the
chamber. It is then possible to analyze an insulating sample directly without conductive coating. Unfortunately the gas
affects the incident beam. Several studies relate the electron beam scattering, also called “skirt”, and its effect on the
SEM and EDX analysis [9-11].
The aim of this paper is to present the innovative approach developed for the study of polymer/metal composite
interface by EDX profiling in a PC-FEG-SEM applied to epoxy resin/aluminum joint [12]. It is composed of two parts.
The first part is focused on general considerations on the EDX profile in a PC-SEM. It begins with the impact on the
shape of the profile of the technique artifacts such as the pear effect contribution. Then the influence of the introduced
gas in the PC-SEM is discussed. The second part deals with the experimental approach, specifically developed for
Microscopy: Science, Technology, Applications and Education A. Méndez-Vilas and J. Díaz (Eds.)
©FORMATEX 2010 1211
______________________________________________

polymer/metal composite studies. It presents the preliminary study dedicated to the characterization of the impact of the
polymer degradation on the analysis and how the optimum acquisition parameters are consequently defined. Then the
data accuracy in term of statistical precision is verified. An original experimental strategy is proposed to improve
accuracy or at least to circumvent a lack of accuracy. Finally, the presence of (inter) diffusion profile and the diffusion
lengths are estimated. This methodology promotes the use of EDX profiling in a PC-SEM in the field of the
polymer/metal interfaces characterization for modern composite materials.
2. General consideration on the EDX profiles in PC-SEM applied to the case of
epoxy/Al interface analysis
2.1 Impact of the pear effect on the EDX profile
The pear effect takes place for every SEM analysis. Most of the time it is not taken into account because it’s impact on
EDX profiles analysis is negligible. But in the case of polymer composites study and/or in the case of small diffusion
length, the “pear effect” can have a strong impact on the EDX profile analysis and precautions on the interpretation
have to be taken.
When the incident electron beam reaches the sample surface, electrons interact with the atoms of the material and
diffuse inside a volume called “pear of diffusion”. To evaluate the pear dimension and consequently the volume of
emission of a given signal, several softwares are available to model the electron trajectories inside the materials. Fig 1a
presents the pear shape at different location during the aluminum/resin interface crossing (in the case of interface
without diffusion phenomenon).
Fig.1: a) Casino V2.42 simulation of the trajectories of the incident electron (blue) and backscattered electrons (red).
b) Casino V2.42 simulated AlK profile.
During EDX profile, it is clear that just before the interface crossing, a part of the pear of diffusion begins to probe
the epoxy resin whereas the incident beam is still located on the Al. Inversely, after crossing the interface, the pear is
still probing the Al side whereas the beam is fully located on the resin. Close to the interface, this volume effect directly
impacts on the EDX profile.
The Fig. 1b presents the corresponding simulated profile. Instead of having a perfect step shape profile at the
interface, the EDX real profile presents a deformed shape which is an asymmetric sigmoid like shape. It induces
uncertainty on the localization of the interface. This uncertainty is 1.2 µm in the example given in Fig. 1a. This distance
of uncertainty is directly linked to the size of the pears and consequently depends on the materials and the incident
beam energy. It should be evaluated routinely as it can attain some micrometers for such polymer composite system.
Furthermore, for the case of diffusion phenomenon study, this sigmoid shape brings a contribution that is
superimposed to the diffusion profile. It is especially critical in cases of short diffusion length are involved i.e. diffusion
length of the same order of magnitude than the deformation induced by the pear effect.
Before profile interpretation, it is thus necessary to:
- Evaluate the pear profile either by simulation or by acquiring an experimental profile with a reference sample,
i.e. sample that present an interface without diffusion.
b) a)
Microscopy: Science, Technology, Applications and Education A. Méndez-Vilas and J. Díaz (Eds.)
1212 ©FORMATEX 2010
______________________________________________

- Compare it to the experimental profiles to discriminate the contribution of the pear profile to the diffusion
profile.
4.2 Impact of the low vacuum mode
The great interest of the PC-SEM is to work with a gas inside the chamber. Thanks to partial ionization of this gas by
interactions with the incident electron beam, all charges (electron) that are accumulating on the insulating sample
surface are neutralized. No pre treatment of the surface with conductive coating is anymore necessary to get ride of the
charging effect.
But unfortunately, these gas interactions also trigger a modification of the probe characteristic. Indeed, a part of the
incident electron undergoes scattering interactions. The incident beam in pressure-controlled mode is then composed of
two parts, the non-scattered electrons and the scattered part, also called skirt:
- The non-scattered part keeps the geometric and energetic characteristics of the initial incident beam. The only
modification is a decrease of its current (compared to classical high vacuum mode).
- Concerning the skirt, many studies are in progress to characterize its geometry, its current density and energy
distribution. Nowadays no general description of the skirt distributions exists. It is usually considered more or
less as a cone centered on the non-scattered beam with its own current density and energy repartition [9-11].
One can easily consider that, as proposed on the Fig. 2, the skirt induces a modification of the EDX profile. It
induces a supplementary contribution to the profile with a sigmoid type shape that is superimposed to the diffusion
profile and the pear effect profile.
This contribution, called the “skirt” profile, is quite important as show in previous studies [9-12] and cannot be
neglected. But currently, no specific method is available to simulate the impact of the low vacuum effect on the EDX
profile. It is necessary to evaluate it experimentally by means of a reference sample i.e. sample with an interface
without diffusion.
In summary, to study diffusion phenomenon at a composite polymer/metal interface by EDX profiling in a PC-SEM,
it is necessary to:
- Evaluate the contribution of the pear effect and the skirt on the profile shape. This can only be done
experimentally by acquiring a profile from a reference sample (interface without diffusion) with exactly the
same experimental condition of the samples to be evaluated.
- Use this profile as the reference before any conclusion.
3. Experimental procedure
3.1 Materials
The epoxy resin is composed of diglycidyl ether of bisphenol A type (DGEBA) with diethylentriamine (DETA) as
curing agent. Aluminum substrate is a commercial 1024 alloy sheet of 1.5 mm thickness with a purity of 99.5%. Before
use, aluminum was systematically degreased by acetone in an ultrasonic bath.
Two specimens are considered for the present study. The first one is made of an interface Al/Epoxy resin without any
diffusion phenomena. It is composed of two rectangular pieces, one of Al and the other of epoxy resin that has been
crosslinked separately. The lateral sides of each piece are then mirror polished and assembled to form the “pure”
interface. It will be called sample 1. The second sample, sample 2, is obtained by crosslinking the epoxy resin at the
surface of an Al sheet, in order to show an interphase i.e. Al diffusion within resin.
The cross sections of each sample are then mirror polished to allow proper EDX analysis of their resin/aluminum
interface.
Incident beam
Al resin
Fig.2: Schema of the skirt effect on the EDX profile
Microscopy: Science, Technology, Applications and Education A. Méndez-Vilas and J. Díaz (Eds.)
©FORMATEX 2010 1213
______________________________________________
Analyses are done with an EDAX GENESIS XM 4i Energy Dispersive X-ray Spectrometer (EDX) mounted on a FEI
QUANTA FEG 200 Environmental Scanning Electron Microscope (ESEM). The gas in chamber is water vapor. A
pressure limiting aperture (PLA) cone is used to reduce the widening of the electron beam induced by the incident
electron-gas molecule interaction (skirt effect).
3.2 Preliminary choice of the experimental parameters
As the final objective is to characterize Al diffusion inside epoxy resin at the interface, parameters are chosen in order
to optimize the AlK signal:
The incident electron energy is fixed at 6 keV. At this energy, the aluminum X-rays emission efficiency is maximal:
the ratio between the AlK characteristic X rays and the background (Bremsstralung) is at its maximal value.
To avoid charging effects due to the insulating nature of the epoxy resin, two strategies are considered: either
conductive coating deposition or the use of the environmental mode of the PC-SEM. A conductive coating, even carbon
coating, can induce artifacts especially in low voltage conditions used for polymer studies. The use of the environmental
mode is then preferred. Water vapor pressure is fixed to 150 Pa, which is here the minimal value that efficiently
eliminates the charging effects.
Profiles are acquired along a line of 250 µm starting in the Al at 50 µm before the interface, and finishing on the
epoxy resin. The amplification should be as high as possible in order to enable the analysis of a maximal number of X
rays photon in a minimal time. (Note that this is usually recommended for profile or mapping analyses.) Here, as the
AlK line is free of other X-rays lines superposition, an amplification time of 6.4 µs is used.
The maximal beam current value is deduced experimentally in order to have a maximum number of count per second
without saturating the EDX detector (dead time of 30%).
The last two parameters are the acquisition time per point and the distance between two consecutive points of the
profile. Their optimization is the core of the methodology and is detailed hereafter.
3.3 Polymer degradation investigation: EDX parameter optimization
Polymer degradation under electronic irradiation is a phenomenon that occurs during SEM analysis. It can greatly
modify the results of the analysis. If its impact is not taken into account, measurement and interpretation can be
completely wrong. Here the epoxy resin is sensitive to electron irradiation. Therefore, its degradation during the
profiling can affect the X ray signal of aluminum at the interface. The objective here is to define the upper limit where
the epoxy resin degradation begins to induce a modification of the EDX signal.
Polymer degradation is directly linked to absorbed energy. Consequently it is proportional to the electron irradiation
and the volume inside which the incident electrons diffuse. The incident electron diffusion volume and absorbed energy
distribution can be evaluated by using a Monte Carlo simulation (e.g. Casino V2.42 software). In the case of epoxy
resin, with an incident beam of 6 keV, the diffusion volume is around 1.8 µm of diameter. The distance between two
points of analysis should then be superior to 1.8 µm to avoid multiple irradiation of a same volume. However the spatial
resolution would then be too limited. Fortunately, the diffusion volume corresponding to 90% of the incident energy is
only around 900 nm of diameter. It is then acceptable to define a step size of 1 µm as the better compromise between
profile resolution and multiple irradiations.
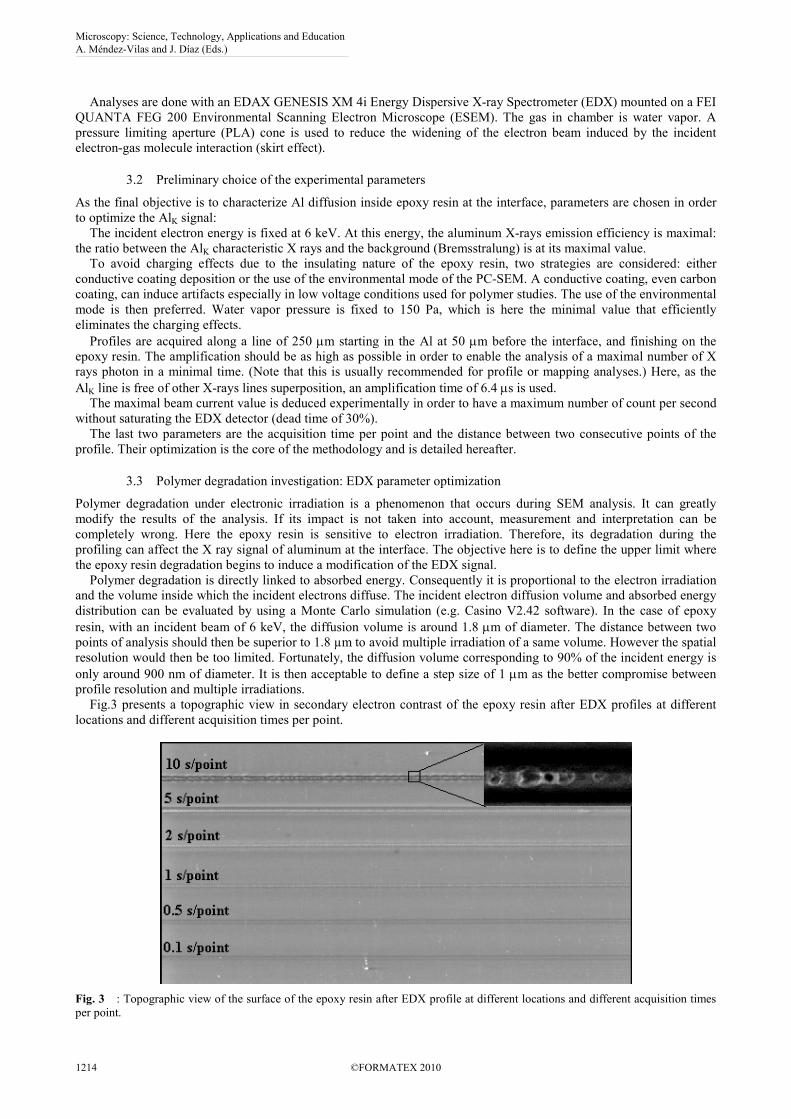
Fig.3 presents a topographic view in secondary electron contrast of the epoxy resin after EDX profiles at different
locations and different acquisition times per point.
Fig. 3 : Topographic view of the surface of the epoxy resin after EDX profile at different locations and different acquisition times
per point.
Microscopy: Science, Technology, Applications and Education A. Méndez-Vilas and J. Díaz (Eds.)
1214 ©FORMATEX 2010
______________________________________________

A trace is observable for each acquisition time. For the longest time (10 s/point), this trace is quite deep. Resin
degradation is important. On the zoom on the top right corner of the picture, holes are observed showing that the
degradation of the resin is so important that it induces sample destruction. For acquisition time shorter than 2s per
point,. But a trace is still observed even if neither hole nor visible topographic modification of the surface is observed.
Electronic irradiation damage does inevitably accompany the EDX profiles measurements. It is then necessary to
quantify the impact of the resin degradation on the EDX profiles results. To this aim, the evolution of the X rays signals
for each acquisition time is investigated. Theoretically, the number of X-ray photons of a given element is proportional
to the acquisition time. Consequently, if no damage occurs, this has to be verified for the CK number of counts.
In the Fig. 4, the experimental average CK number of counts per point versus the acquisition time is reported (square
points). The plain line is the proportional theoretical evolution in the case where no degradation occurs.
This proportionality condition is not respected for acquisition times longer than 1 s/point: the experimental number of
counts is lower than expected. The X rays signal loss is the consequence of some degradation of the epoxy resin. For the
following part of the study, the acquisition time is then fixed at 1 s/point.
The experimental conditions of the profile acquisition are now defined. One has now to focus on the verification of
the accuracy of the EDX results. Indeed, even if this is usually neglected, it is of great interest to work on data precision
by the means of some statistical precision considerations.
3.3 Statistical precision investigation: verification of the data accuracy
The X-rays number of counts, N, have a natural uncertainty that comes from the X-rays photons counting. This
uncertainty is assimilated to the statistic precision ± N , as the X-rays photons’ counting follows a Poisson law. This
is true for each kind of analysis, i.e. mapping, profiling or quantitative analysis. To determine if a signal variation
between two points arises from a significant variation of the composition instead of the natural variation of counting,
the signal variation must be superior to sum of the uncertainties [13].
In our case, as each profile is acquired under exactly the same experimental conditions, it is possible to compare
point to point the profiles obtained for different samples. For two samples, A and B, at a point i located exactly at the
same distance from the interface, iAN and
iBN are the experimental number of count respectively for the sample A and
B, and AiN ,
iBN their respective uncertainty.
If Ai
Bi
Ai
Bi NNNN +≥− (1)
then the variation of the signal between the points A and B corresponds to a variation of composition.
As variation of count and variation of composition can be directly linked, variation can be simply evaluated (in %)
as:
( ) iA
iA
iB N*NN(%) 100−=∆ (2)
This enables to define the minimal variation of composition that can be detected between two points. In this case, the
eq. (1) is
Ai
Bi
Ai
Bi NNNN +≈−
with iA
iA
iB NNN ≈+= ε
and the eq. (3) gives an good approximation of the minimal variation of composition that is detectable:
Fig. 4: CK average value versus acquisition time (square),
The plain line is the proportional theoretical evolution in
the case where no degradation occurs.
Microscopy: Science, Technology, Applications and Education A. Méndez-Vilas and J. Díaz (Eds.)
©FORMATEX 2010 1215
______________________________________________
iA
iA
min N*N*(%) 1002
≅∆ (3)
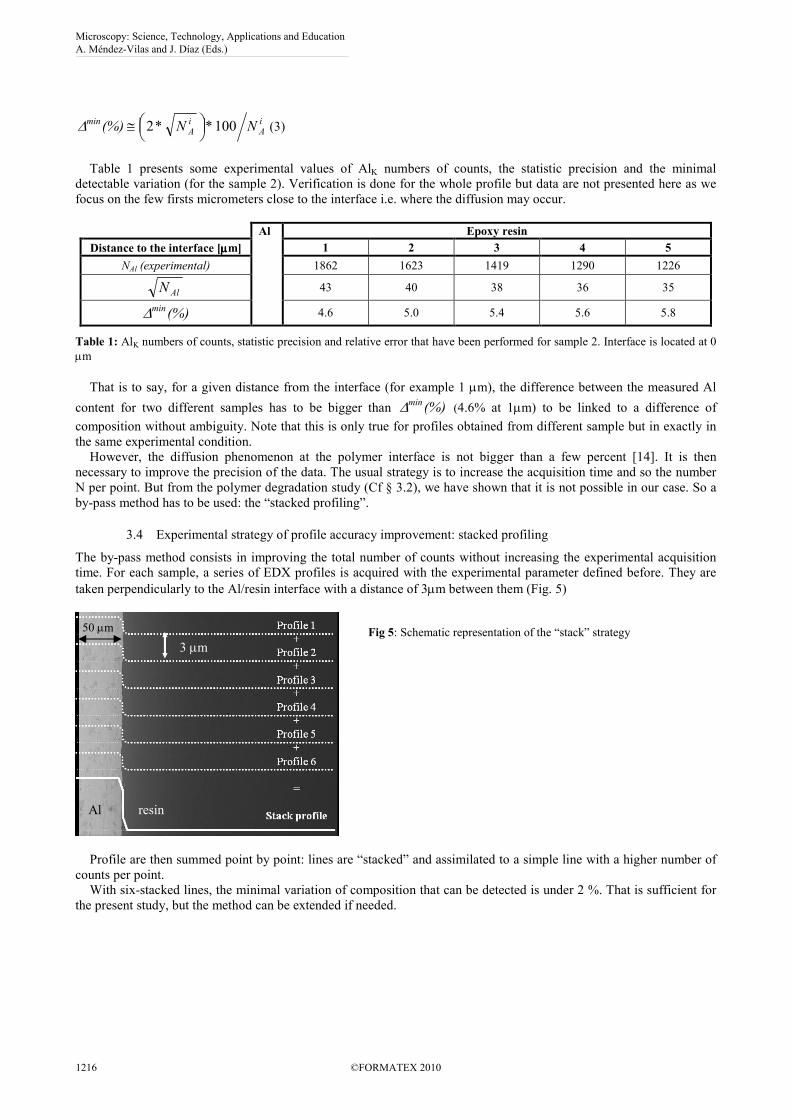
Table 1 presents some experimental values of AlK numbers of counts, the statistic precision and the minimal
detectable variation (for the sample 2). Verification is done for the whole profile but data are not presented here as we
focus on the few firsts micrometers close to the interface i.e. where the diffusion may occur.
Al Epoxy resin
Distance to the interface [µµµµm] 1 2 3 4 5
NAl (experimental) 1862 1623 1419 1290 1226
AlN 43 40 38 36 35
(%)min∆ 4.6 5.0 5.4 5.6 5.8
Table 1: AlK numbers of counts, statistic precision and relative error that have been performed for sample 2. Interface is located at 0
µm
That is to say, for a given distance from the interface (for example 1 µm), the difference between the measured Al
content for two different samples has to be bigger than (%)min∆ (4.6% at 1µm) to be linked to a difference of
composition without ambiguity. Note that this is only true for profiles obtained from different sample but in exactly in
the same experimental condition.
However, the diffusion phenomenon at the polymer interface is not bigger than a few percent [14]. It is then
necessary to improve the precision of the data. The usual strategy is to increase the acquisition time and so the number
N per point. But from the polymer degradation study (Cf § 3.2), we have shown that it is not possible in our case. So a
by-pass method has to be used: the “stacked profiling”.
3.4 Experimental strategy of profile accuracy improvement: stacked profiling
The by-pass method consists in improving the total number of counts without increasing the experimental acquisition
time. For each sample, a series of EDX profiles is acquired with the experimental parameter defined before. They are
taken perpendicularly to the Al/resin interface with a distance of 3µm between them (Fig. 5)
Profile are then summed point by point: lines are “stacked” and assimilated to a simple line with a higher number of
counts per point.
With six-stacked lines, the minimal variation of composition that can be detected is under 2 %. That is sufficient for
the present study, but the method can be extended if needed.
Al resin
50 µm
3 µm
Fig 5: Schematic representation of the “stack” strategy
Microscopy: Science, Technology, Applications and Education A. Méndez-Vilas and J. Díaz (Eds.)
1216 ©FORMATEX 2010
______________________________________________
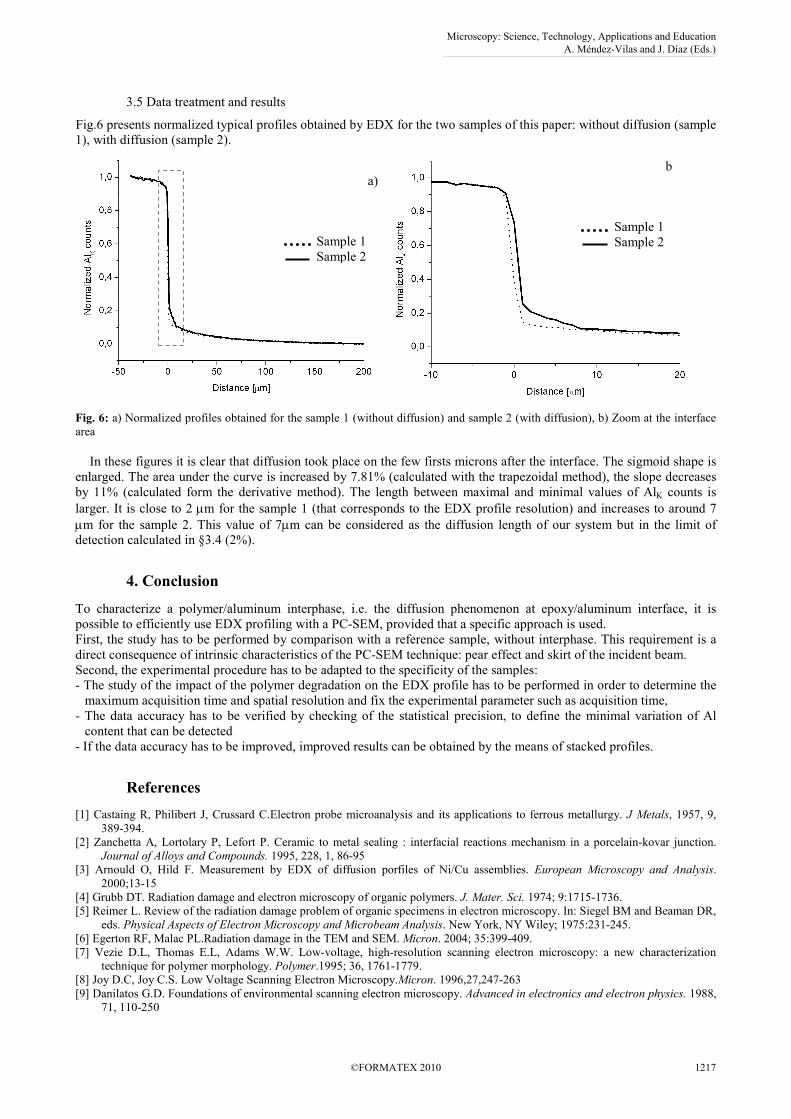
3.5 Data treatment and results
Fig.6 presents normalized typical profiles obtained by EDX for the two samples of this paper: without diffusion (sample
1), with diffusion (sample 2).
Fig. 6: a) Normalized profiles obtained for the sample 1 (without diffusion) and sample 2 (with diffusion), b) Zoom at the interface
area
In these figures it is clear that diffusion took place on the few firsts microns after the interface. The sigmoid shape is
enlarged. The area under the curve is increased by 7.81% (calculated with the trapezoidal method), the slope decreases
by 11% (calculated form the derivative method). The length between maximal and minimal values of AlK counts is
larger. It is close to 2 µm for the sample 1 (that corresponds to the EDX profile resolution) and increases to around 7
µm for the sample 2. This value of 7µm can be considered as the diffusion length of our system but in the limit of
detection calculated in §3.4 (2%).
4. Conclusion
To characterize a polymer/aluminum interphase, i.e. the diffusion phenomenon at epoxy/aluminum interface, it is
possible to efficiently use EDX profiling with a PC-SEM, provided that a specific approach is used.
First, the study has to be performed by comparison with a reference sample, without interphase. This requirement is a
direct consequence of intrinsic characteristics of the PC-SEM technique: pear effect and skirt of the incident beam.
Second, the experimental procedure has to be adapted to the specificity of the samples:
- The study of the impact of the polymer degradation on the EDX profile has to be performed in order to determine the
maximum acquisition time and spatial resolution and fix the experimental parameter such as acquisition time,
- The data accuracy has to be verified by checking of the statistical precision, to define the minimal variation of Al
content that can be detected
- If the data accuracy has to be improved, improved results can be obtained by the means of stacked profiles.
References
[1] Castaing R, Philibert J, Crussard C.Electron probe microanalysis and its applications to ferrous metallurgy. J Metals, 1957, 9,
389-394.
[2] Zanchetta A, Lortolary P, Lefort P. Ceramic to metal sealing : interfacial reactions mechanism in a porcelain-kovar junction.
Journal of Alloys and Compounds. 1995, 228, 1, 86-95
[3] Arnould O, Hild F. Measurement by EDX of diffusion porfiles of Ni/Cu assemblies. European Microscopy and Analysis.
2000;13-15
[4] Grubb DT. Radiation damage and electron microscopy of organic polymers. J. Mater. Sci. 1974; 9:1715-1736.
[5] Reimer L. Review of the radiation damage problem of organic specimens in electron microscopy. In: Siegel BM and Beaman DR,
eds. Physical Aspects of Electron Microscopy and Microbeam Analysis. New York, NY Wiley; 1975:231-245.
[6] Egerton RF, Malac PL.Radiation damage in the TEM and SEM. Micron. 2004; 35:399-409.
[7] Vezie D.L, Thomas E.L, Adams W.W. Low-voltage, high-resolution scanning electron microscopy: a new characterization
technique for polymer morphology. Polymer.1995; 36, 1761-1779.
[8] Joy D.C, Joy C.S. Low Voltage Scanning Electron Microscopy.Micron. 1996,27,247-263
[9] Danilatos G.D. Foundations of environmental scanning electron microscopy. Advanced in electronics and electron physics. 1988,
71, 110-250
Sample 1
Sample 2
a)
Sample 1
Sample 2
b
Microscopy: Science, Technology, Applications and Education A. Méndez-Vilas and J. Díaz (Eds.)
©FORMATEX 2010 1217
______________________________________________

[10] Sigee D.C, Gilpin C. X-ray microanalysis with the environmentale scannong electron microscope: interpretation of data
obtained under different atmospheric conditions. Scanning Microscopy. 1994, 8, 219-229
[11] Mathieu c, Khouchaf L, Kadoun A. Exploring the high pressure SEM. In: Mendez-Vilaz A and Diaz J, eds. Modern Reseach
and educational topics in microscopy. Formatex. 2007, 779-786
[12] Sperandio C, Arnoult C, Laachachi A, Di Martino J, Ruch D. Characterization of the interphase in an aluminium /epoxy joint
using controlled pressure scanning electron microscopy coupled with an energy dispersive X-rays spectrometer. Micron. 2010,
41, 105-111
[13] Robaut F. Les statistiques: precision et limites de detection en microanalyses. In: GNMEBA, Brisset F, Repoux M., Ruste J,
Grillon F, Robaut F eds. Microscopie électronique à balayage et microanalyses X. EDP Sciences. 2008, chap XIII
[14] Oyama H.T, Solberg T.N, Wightman J.P. electron microprobe analysis as a novel technique to study the interface between
thermoset and thermoplastic polymers. Polymer. 1999, 40, 3001-3011
Microscopy: Science, Technology, Applications and Education A. Méndez-Vilas and J. Díaz (Eds.)
1218 ©FORMATEX 2010
______________________________________________