Embed Size (px)
Citation preview

Chapter 6
Methods for Soil Characterization
Unless otherwise specified, all chemicals referred toin this chapter, as well as in chapters 7 and 8, are“reagent” grade and conform to standards establishedby the American Chemical Society.
The following concentrated reagents are used.
Reagents :Specific
Percent NormaEit2/ g r a v i t y
Acetic acid_____________ 99.5 18Hydrochloric acid-----__ 35-38 12 1. 19Nitric acid__-___________ 70 1.42Sulfuric acid____________ 95-96 :z 1. 84Ammonium hydroxide__ __ 28 (NHI) 15 .90
Dilutions are indicated by (1+.2), ( l+ lo), and otherproportions. The first figure indicates the volume ofconcentrated reagent and the second the volume ofwater.
Several methods involve centrifugation processesthat are specified in terms of time and relative centrif-ugal force (RCF) , which is the ratio of the accelera-tion in the centrifuge to the acceleration of gravity, i. e.,RCI;=0.0000112 X r X (r. p. m.) 2 where r. p. m. iscentrifuge speed in revolutions per minute and r is theradius in centimeters from the axis of the centrifuge tothe bottom of the centrifuge vessel when in the rotatingposition.
Sampling, Soil Extracts, and SalinityAppraisal
( 1) Soil Sample Collecting, Handling, andSubsampling
A round-nose trenching spade is a convenient tool forsampling surface soil. A soil tube is useful for smallsubsurface samples, whereas a barrel-type auger canbe used when larger subsurface samples are required.Canvas bags are generally used as containers for soilsamples, especially for samples of 100 to 200 pounds.For small samples, metal boxes or cardboard cartonscan be used. Samples for salinity measurements re-quire special handling, because at field-moisture con-tent the salt in the soil is relatively mobile and moveswith the soil water. It has been found that kraft papernail bags are satisfactory for handling samples ofsaline soil, providing the bags are first waterproofed bysoaking in a 5 or 10 percent solution of paraffin in
gasoline or other wax solvent.Soil should be air-dried before shipping or storing
for any extended length of time. Air-dry soils that con-
tain deliquescent salts may accumulate enough mois-ture during a short shipping or storage period to de-compose a canvas bag. A container impervious towater vapor should be used for such soils. Wax-treatedbags, as mentioned above, or various types of water-proofed bags used for merchandising foodstuff or otherhygroscopic material can be used. Samples in paperbags will withstand usual transportation handling ifthey are tightly packed in wooden boxes. To guardagainst accidental confusion of samples, it is desirableto place an identification tag inside the bag, in addi-tion to using an external marking or tag.
The following recommendations will aid in deter-mining the size of sample required :
Soil requiredMeasurements to he made : ;n gram8
1. Electrical conductivity of the saturation extract,saturation percentage, and pH of soil paste__ 250
2. Soluble ion analysis (semimicro methods) for-Low salinity____________--__--____--_______ 500High salinity---__--_--_____-______-________ 250
3. Exchangeable-cation analysis __________________4. Hydraulic conductivity (disturbed) ____________ 4;:5. Gypsum and alkaline-earth carbonates_____-____ 50
The total amount of soil to be obtained for the samplecan be determined by adding up the amounts indicatedfor the individual tests to be made. If measurement2 is to be made, then no extra soil will be required formeasurement 1. Samples twice as large as those indi-cated above are desirable, if handling facilities permit.
Care must be taken to obtain representative sub-samples of a granular material such as soil. Bulksamples at the Laboratory are air-dried before or afterpassing through a screen with 6-mm. square openings,are mixed, and are stored in galvanized iron containers.An attempt is made to maintain a level surface of soilin a container so that a minimum of segregation ofparticles or aggregates occurs from rolling. A sub-sample of the main sample is taken by means of sev-eral partial loadings of a hand scoop from differentlocations on the surface of the soil. The subsampleis then screened to the desired size. For exchangeable-cation analysis and other determinations requiringsamples of about 5 gm. or less, the soil is ground topass a 0.5-mm. sieve. For a number of tests relatingto moisture retention and moisture transmission, thesoil is passed through a 2-mm. round-hole sieve withthe aid of a rubber stopper. One purpose of such siev-ing is to remove rocks larger than 2 mm.; another is toreduce all aggregates to less than 2 mm. In the removalof rocks between 2 mm. and 6 mm., they may be
83

AGRICULTURE HANDBOOK 60, U. S. DEPT. OF AGRICULTURE
returned to the screened sample if desired. The entiresubsample is then placed on a mixing cloth and pulledin such a way as to produce mixing. Some pullingoperations will produce segregation instead of mixing,and special care must be exercised to obtain a well-mixed sample. The soil sample is then flattened untilthe pile is 2 to 4 cm. deep.
For moisture retentivity, hydraulic conductivity, andmodulus of rupture tests, 2 to 6 subsamples, each hav-ing a fairly definite volume, are required. Use papercups to hold the individual subsamples. Mark witha pencil line around the inside of the cup the height towhich the cup is to be filled to give the correct amountof subsample. Then, using a thin teaspoon or a smallscoop, lift small amounts of soil from the pile, placingeach in successive cups and progressing around the pileuntil the cups are filled to the desired level. It is diffi-cult with some soils, especially if they have been passedthrough a 2-mm. round-hole sieve, to take samples fromthe pile without allowing the larger particles to roll offthe spoon or scoop. This rollback should be avoidedbecause it makes the extracted subsample nonrepre-sentative. The rollback problem is practically absentfrom some soils, especially if all the sample has beenpassed through an 0.5-mm. sieve.
Three data forms, or work sheets, used at the Labora-tory are shown herewith. The field data sheet shouldbe at hand during sampling as an aid in recordingpertinent information. The other two forms serve aswork sheets for recording and calculating laboratorydeterminations.
(2) Saturated Soil Paste
Apparatus
Container of 250-ml. capacity or greater, such as acup or moisture box.
Procedure
Prepare the saturated soil paste by adding distilledwater to a sample of soil while stirring with a spatula.The soil-water mixture is consolidated from time totime during the stirring process by tapping the con-tainer on the workbench. At saturation the soil pasteglistens as it reflects light, flows slightly when the con-tainer is tipped, and the paste slides freely and cleanlyoff the spatula for all soils but those with a high claycontent. After mixing, the sample should be allowedto stand for an hour or more, and then the criteria forsaturation should be rechecked. Free water should notcollect on the soil surface nor should the paste stiffenmarkedly or lose its glistening appearance on standing.If the paste does stiffen or lose its glisten, remix withmore water.
Because soils puddle most readily when worked atmoisture contents near field capacity, sufficient watershould be added immediately to bring the sample nearlyto saturation. If the paste is too wet, additional drysoil may be added.
The amount of soil required depends on the measure-ments to be made, i. e., on the volume of extract de-sired. A 250-gm. sample is convenient to handle andprovides sufficient extract for most purposes. Initially,the sample can be air-dry or at the field-moisture con-tent, but the mixing process is generally easier if the soilis first air-dried and passed through a 2-mm. sieve.
If saturation pastes are to be made from a group ofsamples of uniform texture, considerable time can besaved by carefully determining the saturation percent-age of a representative sample in the usual way. Subse-quent samples can be brought to saturation by addingappropriate volumes of water to known weights of soil.
Special precautions must be taken with peat andmuck soils and with soils of very fine and very coarsetexture.
PEAT AND MUCK soILs.-Dry peat and muck soils,especially if coarse or woody in texture, require anovernight wetting period to obtain a definite endpointfor the saturated paste. After the first wetting, pastesof these soils usually stiffen and lose the glisten onstanding. Adding water and remixing then gives a mix-ture that usually retains the characteristics of a satu-rated paste.
FINE-TEXTURED SOILS.-To minimize puddling andthus obtain a more definite endpoint with fine-texturedsoils, the water should be added to the soils with a mini-mum of stirring, especially in the earlier stages ofwetting.
C OARSE-TEXTURED soILs.-The saturated paste forcoarse-textured soils can be prepared in the same man-ner as for fine-textured soils; however, a different mois-ture content is recommended for the salinity appraisalof such soils (Method 3b).
Method 27 gives procedures for determining themoisture content of saturated paste, i. e., the saturationpercentage.
(3) Soil-Water Extracts
(3a) Saturation Extract
Apparatus
Richards or Buechner funnels, filter rack or flask,filter paper, vacuum pump, extract containers such astest tubes or 1-0~. bottles.
Procedure
Transfer the saturated soil paste, Method 2, to thefilter funnel with a filter paper in place and applyvacuum. Collect the extract in a bottle or test tube.Pyrex should not be used if boron is to be determined.If the initial filtrate is turbid, it can be refilteredthrough the soil or discarded. Vacuum extractionshould be terminated when air begins to pass throughthe filter. If carbonate and bicarbonate determinationsare to be made on the extract, a solution containing1,000 p. p. m. of sodium hexametaphosphate should beadded at the rate of one drop per 25 ml. of extract prior

SALINE AND ALKALI SOILS 85
Soil Act. No. _
Temporary No. _
UNITED STATES
FIELD DATA
SALINITY LABORATORY
FOR SOIL SAMPLES
Sampled by Mail address Date
NearestState County settlement
S i t e l o c a t i o n %9 - ‘//4, Sec. - ; T ;R
Station or farm District or valley
Directions for finding site: (Use reverse side for a sketch of roads showing nearest settlement and distance from local landmarks.)
References (Soil Survey Bul., other publications, or correspondence):
Profile description (color, texture, structure, horizons, hardpan, origin, parent material, water table, drainage, and soil series ifknown) :
Topography Surface slope _ Percent topsoil erosion
Microrelief at the sampling site, furrow, ridge, etc.
Disturbance from land preparation, leveling, filling, etc.
S a m p l e : D e p t h N o . s a c k s Approx. total wt. (lb.)
Composite sample: Depth ~ N o . h o l e s Sampling method and pattern
Approx. total wt. (lb.)
Undisturbed structure sample: Depth _ No. of replicates
Yrs. of cultivation _ Yrs. o f i r r i g a t i o n Source of water
Crop data (rotation, yield history, detailed description of plant condition at time of sampling):
Management practices:
(It is expected that not all the above blanks can be filled for every sample but the usefulness of laboratory determinations depend6on the completeness and accuracy of the field data.)

86 AGRICULTURE HANDBOOK 60, U. S. DEPT. OF AGRICULTURE
Soil sample No. . Description:
Moisture in air-dry Soil Saturation Percentage
Can No. From Water Added By Drying
Air-dry Oven-dry Can No. Can No.
Sross Wet Oven-dry
Tare Air-dry soil, gm. GrossNet Oven-dry soil, gm, Tare
OD
I H20*m1*( + )
NetAD
Pw(Oven-dry basis))Ip~O%%~ basis)jIp~~n~Bdtr; basis) LI
pH of Saturated Soil Paste Electrical Conductivity Alkaline-earth Carbonates
Saturation Extract (Lime)
TOC, (Scale: low,
pH of Saturation Extract k Lime
R Boron ml.
~-7% popem, BpH of Suspension
Soil Millimhos/cm.
Waterat 2S" C.
Calcium plus Maanesium Sodium Potassium(Versenate titration)
Standard meq ./I l Standard meq./l.
r= I meq./l. r =_ -=- - meq./l.
Ca+Mg, sat. ext.meq ./lo
Ca+Mg, dry soilmeq./lOO gm.
Na, sat. ext.meq./l. .
Na, dry soilmeq./lOO gm*
K, sat. ext.meq./l.
K, dry soilmeqJ100 gm.

SALINE AND ALKALI SOILS 87
Soil Sample No.-_--
olution diluted to
8 Sodium, from graph meq./l.
9 Cation-exchange-capacity (OD basis) meq./lOO 5.
EXCHANGEABLE SODIUM
10 Extracting solution (HQAc) diluted to ml.
11 Dilution: Solution 10 dilution ratio .
21 Flame photometer standard K meq./l.
22 Flame photometer reading
23 Potassium, from graph meq, 1.
24 Total potassium (OD basis) meq&OO 5,
25 Potassium in sat. extract (OD basis) meq./lOO 5,
26 Exchangeable potassium (OD basis) meq./lOO gml
27 Exchangeable-potassium-percentage .

88 AGRICULTURE HANDBOOK 60, U. S. DEPT. OF AGRICULTURE
to stoppering and storing. This prevents the precipita-tion of calcium carbonate on standing.
For appraising soil salinity for most purposes, theextraction can be made a few minutes after preparingthe saturated paste. If the soil contains gypsum, theconductivity of the saturation extract can increase asmuch as 1 or 2 mmhos/cm. upon standing. There-fore, if gypsum is present, allow the saturated paste tostand several hours before extracting the solution.
If the solution is to be analyzed for its chemicalconstituents, the saturated paste should stand 4 to 16hours before extraction.
References
Richards (1949a), Reitemeier and Fireman (1944).
(3b) Twice-Saturation Extract for Coarse-Textured Soils (Tentative)
The following procedure gives a moisture contentthat is approximately 8 times the 15atmosphere per-centage instead of 4 times, which is a usual factor forthe saturation percentage of finer textured soils. Theconductivity of the “twice-saturation” extract, there-fore, is doubled before using the standard saturation-extract scale for salinity evaluation.
Apparatus
Soil container of 10 to 12 cm. diam. (i. e., l-lb. cof-fee can) with a loosely fitting basket formed fromgalvanized screen with openings approximately 6 mm.square.
Pipet, 2-ml. capacity. Other items are the same asfor Method 3a.
Procedure
Place the wire basket in the can, fill the basket withsoil to a depth of 2 or 3 cm. Level the soil and by useof a pipet add 2 ml. of water dropwise to noncontiguousspots on the soil surface, cover, and allow to stand for15 min. Gently sift the dry soil through the wire basketand weigh the moist pellets of soil retained thereon.Calculate the moisture content of the pellets as follows:
P,= (2X lOO)/(wet weight in grams-2)
Weigh 250 gm. of air-dry soil and add sufficient waterto make the moisture content up to 4 times the valuefound in the pellets. Use a vacuum filter to obtain thesoil extract. For salinity appraisal of coarse-texturedsoil from which this extract was obtained, determine theelectrical conductivity of the extract at 25” C. Multi.ply this conductivity value by 2 before using the stand-ard saturation-extract salinity scale for interpretation(chs. 2 and 4).
(3~) Soil-Water Extracts at 1:l and 1: 5
Apparatus
Filter funnels, fluted filter paper, and bottles for soilsuspensions and filtrates.
Procedure
Place a soil sample of convenient size in a bottle, addthe required amount of distilled water, stopper, andagitate in a mechanical shaker for 15 min. Allow thecontents to stand at least an hour, agitate again for5 min., and filter. If shaken by hand, invert and shakebottle vigorously for 30 sec. at least 4 times at 30-min.intervals before filtering.
At a 1: 1 soil-water ratio, it may be desirable to cor-rect for hygroscopic moisture. Unless high precisionis required, this is done by grouping the air-dried andscreened soils roughly according to texture, and deter-mining the percent moisture in 2 or 3 samples from eachtextural group. It is then possible to weigh out soilsamples from the various groups and add sufficientwater to bring the samples to approximately 100 per-cent moisture by weight. For example, an air-dry soilcontaining 3 percent moisture on an oven-dry basis canbe brought to a 1: 1 soil-water ratio by adding 97 ml.water to 103 gm. of air-dried soil.
At a soil-water ratio of 1: 5 or greater, no allowanceis ordinarily made for moisture in the air-dried sample.
(3d) Soil Extract in the Field-MoistureRange
,A displacement method such as used by White and
Ross (1937) does not require complicated apparatus;however, the pressure-membrane method describedhere can be used for a wider range of soil textures anda wider range of moisture contents.
Apparatus
Pressure-membrane cell with a cylinder 5 or 10 cm.high, tank of commercial water-pumped nitrogen, canswith watertight lids, plain transparent cellophane No.600.
Procedure
Prior to use, the sheets of No. 600 cellophane aresoaked in distilled water with daily changes of water inorder to reduce the electrolyte content of the membrane.Electrical conductivity measurements on the water willindicate when the bulk of these impurities has been re-moved. Since washed and dried membranes may besomewhat brittle, they are stored wet until ready foruse. They should be partially dried before mounting inthe pressure-membrane apparatus,
The soil should be brought from the field at themoisture condition desired for the extraction and im-mediately packed in the pressure-membrane apparatus.If the soil has been air-dried, it may be passed througha 6-mm. screen and wetted to the desired water contentwith a fine spray of distilled water while tumbling in amixing can or on a waterproofed mixing cloth. Thiswetted soil is stored in an airtight container, preferablyin a constant-temperature room for 2 weeks and ismixed occasionally during this time. The pressure-membrane apparatus is then assembled, using No. 600

SALINE AND ALKALI SOILS 89
plain transparent cellophane for the membrane. Thesoil is firmly packed by hand on the membrane in theextraction chamber to a depth of 2 or 4 in., dependingupon the height of cylinder available. The chamber isthen closed and the extraction process started at 225lb. per sq. in. (15 atm.) of nitrogen gas.
The extract should be collected in fractions of approximately equal volume. The first fraction is usuallydiscarded to avoid contamination from the membrane.Electrical conductivity measurements can be made onsubsequent fractions to determine the degree of uni-formity of the extract. The extraction process mayrequire 1 to 4 days.
References
Reitemeier (1946) , Reitemeier and Richards (1944))Richards (1947)‘) and White and Ross (1937).
(4) Electrical Conductivity of Solutions
(Pa) Standard Wheatstone Bridge
Remarks
Electrical conductivity is commonly used for indicat-ing the total concentration of the ionized constituentsof solutions. It is closely related to the sum of thecations (or anions) as determined chemically andusually correlates closely with the total dissolved solids.It is a rapid and reasonably precise determination thatdoes not alter or consume any of the sample.
Reagents
Potassium chloride solution, 0.01 N. Dissolve 0.7456gm. of dry potassium chloride in water and make to 1liter at 25” C. This is the standard reference solutionand at 25” C. has an electrical conductivity of 1411.8X 10~~ (0.0014118) mhos/cm.
Procedure
Fill the conductivity cell with the reagent, havingknown conductivity J??C,,. Most cells c&y a markindicating the level to which they should be filled orimmersed. Follow the manufacturers’ instructions inbalancing the bridge. Read the cell resistance, R,, at25” C. and calculate the cell constant (Ic), from therelation,
k= EC,, x Rz5The cell constant will change if the platinization fails,but it is determined mainly by the geometry of thecell, and so is substantially independent of temperature.
Rinse the cell with the solution to be measured. Theadequacy of rinsing is indicated by the absence o fresistance change with successive rinsings. If only asmall amount oj the sample is available, the cell maybe rinsed with acetone and ventilated until it is dry.Record the resistance of the cell (R,) and the temper-ature of the solution (t) at which the bridge is -bal-anced. Keep the cell filled with distilled water when.not in use.
Calculations
Apparatus
Wheatstone bridge, alternating current, suitable forconductivity measurements. This may be a l,OOO-cyclea. c. bridge with telephone receivers, a 60.cycle a. C.bridge with an a. c. galvanometer, or one of the newerbridges employing a cathode ray tube as the nullindicator.
Conductivity cell, either pipet or immersion type,with platinized platinum electrodes. The cell constant
The electrical conductivity (EC,) of the solution atthe temperature of measurement (t) is calculated fromthe relation
EC, = k/R,where
k = EC,, x R,,For soil extracts and solutions, a temperature con-version factor (ft), obtained from table 15, can beused for converting conductivity values to 25” C. Thus,.
should be approximately 1.0 reciprocal centimeter.New cells should be cleaned with chromic-sulfuric acid
ECzs=ECt xft=kf,JR,
cleaning solution, and the electrodes platinized beforeuse. Subsequently, they should be cleaned and replat-inized whenever the readings become erratic or when aninspection shows that any of the platinum black hasflaked off. The platinizing solution contains platinumchloride, 1 gm., lead acetate, 0.012 gm., in 100 ml.water. To platinize, immerse the electrodes in theabove solution and pass a current from a 1.5.volt drybattery through the cell. The current should be suchthat only a small quantity of gas is evolved, and the di-rection of current flow should be reversed occasionally.
A thermostat is required for precise measurements,but for many purposes it is satisfactory to measure thetemperature of the solution and make appropriatetemperature corrections.
References
Campbell and others (1948), National ResearchCouncil International Critical Tables (1929).
(Pb) Direct Indicating Bridge
Apparatus
Conductivity sets are available that have a bridgescale and cell design features suggested by the Labora-tory especially for use with saturation extracts (fig. 26) .This set is convenient to use and has sufficient accuracyfor diagnostic purposes. The conductivity ceil sup-plied with this bridge has a constant of 0.5 cm.-l and acapacity of 2 to 3 ml. of solution. With this cell the
259525 0 - 54 - 7

90 AGRICULTURE HANDBOOK 60, U. S. DEPT. OF AGRICULTURE
TABLE 15.-Temperature factors (ft) for correcting resistance and conductivity data on soil extracts to thestandard temperature of 25’ C.
EG=EG x ft; EC&=(klRt) X ft; &=Rtlft
O c.
3. 04.0
t”o7:o
37.4 1.709 22. 039.2 1.660 22.241.0 1.613 22.442. 8 1.569 22.644.6 1.528 22.8
71.672. 072.372. 773.0
1.064 29. 0 84.2 0.9251.060 29.2 84.6 .9211.055 29.4 84.9 .9181.051 29.6 85. 3 .9141.047 29.8 85.6 .911
i-x10: 011.012.0
46. 4 1.488 23.0 73.4 1.043 30. 0 86.0 -90748. 2 1.448 23.2 73.8 1.038 30. 2 86.4 .90450. 0 1.411 23. 4 74. 1 1.034 30. 4 86. 7 .90151. 8 1.375 23.6 74. 5 1.029 30.6 87. 1 .89753.6 1.341 23.8 74. 8 1.025 30. 8 87. 4 .894
13. 014.015.016.017. 0
55.457.259. 0
%:Z
18. 0 64.418. 2 64. 818.4 65. 118.6 65. 518. 8 65. 8
1.3092.2771.247+% 1;;
.
1.1631.1571.1521.1471.142
24. 0 75. 2 1.020 31. 0 87.8 .89024.2 75.6 1.016 31. 2 88.2 ,88724.4 75.9 1.012 31.4 88.5 .88424.6 76.3 1.008 31.6 88.9 .88024. 8 76. 6 1.004 31. 8 89.2 .877
25. 0 77.025. 2 77. 425.4 77. 725.6 78. 125. 8 78. 5
1.000.996.992.988
32.0 89.6 .87332.2 90. 0 .87032.4 90.3 .86732.6 90. 7 ,86432.8 91. 0 .861
19.0 66.2 1.136 26.0 78.819.2 66. 6 1.131 26. 2 79. 219.4 66.9 1.127 26. 4 79.519.6 67.3 1.122 26.6 79.919.8 67. 6 1.117 26. 8 80.2
. 983
.979
.975
.971
.967
.964
33.0 91.4 ,85834. 0 93.2 .84335. 0 95.0 ,82936.0 96. 8 .81537.0 98.6 .801
20. 0 68.0 1.112 27. 0 80.620.2 68. 4 1.107 27. 2 81.020. 4 68. 7 1.102 27. 4 81.320.6 69. 1 1.097 27.6 81. 720. 8 69.4 1.092 27. 8 82.0
1%.953-950-947
38.0 100.239.0 102.240. 0 104.041. 0 105.842.0 107.6
21. 0 69. 8 1.087 28. 0 82.4 .943 43.0 109.421. 2 70.2 1.082 28. 2 82. 8 .940 44. 0 111.221.4 70.5 1.078 28. 4 83. 1 .936 45. 0 113.021.6 70. 9 1.073 28. 6 83.5 .932 46.0 114.821. 8 71. 2 1.068 28. 8 83.8 .929 47. 0 116.6
7
_
O F. ft O c.-
a_
O F. ft O c. O F.
bridge scale reads directly from 0.15 to 15 mmhos/cm.The bridge is operated by alternating current and makesuse of a cathode ray tube null indicator. When thetemperature of the solution is set on the temperature-compensating dial, the main dial, at balance, indicateselectrical conductivity at 25” C.
The accuracy of calibration of the bridge scale shouldbe checked with a saturated solution of calcium sulfatedihydrate. With the temperature-compensation dialcorrectly set, the bridge should read 2.2 mmhos/cm.with this solution.
Procedure
Obtain the saturation extract in accordance withMethod 3a. Read the temperature of the extract. Rinseand fill the conductivity cell. Set the temperature com-
ft
: it:.763
750: 739
pensation dial. Close the contact switch on the cellbriefly while balancing the bridge with the main dial.Read and record the electrical conductivity in milli-mhos per centimeter at 25” C.
If the bridge will not balance, the conductivity of theextract may be below 0.15 or above 15 mmhos/cm. Ifabove, estimate conductivity by adding 9 parts of dis-tilled water to 1 part of extract, by volume, and balanc-ing the bridge with the diluted extract in the cell. Theconductivity of the undiluted extract will be approxi-mately 10 times the conductivity reading obtained onthe diluted extract.
Alternatively, for concentrated extracts, a cell with aconstant higher than 0.5 may be used. If, for example,the value of the cell constant is 5.0, then the scale read-ing of the bridge must be multiplied by 10.

SALINE AND ALKALI SOILS 91
FIGURE 26.-Bridge and cell for measuring the conductivity of saturation extracts and irrigation waters.
(5) Resistance of Soil Paste and PercentSalt in Soil
Apparatus
Bureau of Soils electrode cup, alternating currentWheatstone bridge, and thermometer.
Procedure
Fill the electrode cup with saturated soil paste pre-pared in accordance with Method 2. Tap the soil cupon the workbench to remove air bubbles and strike offthe soil paste level with the upper surface of the cup.Measure the resistance and the temperature of the soilpaste in the cup. Use table 16 to convert the resistancereading to the temperature of 60” F. Then, by meansof table 17, convert the paste resistance at 60” to ap-proximate percent salt. Inasmuch as the saturation per-centage varies with soil texture, it is necessary to esti-mate the textural class of the sample and to select theappropriate column in the table for making the con-version from resistance to percent salt.
References
Davis and Bryan (1910)) Soil Survey Manual(1951).
(6) Freezing-Point Depression
(6a) Freezing-Point Depression of Solu-tions
Apparatus
Wheatstone bridge with approximately the followingcharacteristics: 1,000 ohms equal arm ratio, lO,OOO-ohm decade balancing resistance adjustable to 1 ohm;galvanometer : type E, Leeds and Northrup DM-2430-c,or equivalent. Use a a-volt lead cell for the bridgevoltage supply. Thermistor: type 14B, Western Elec-tric. Freezing b.ath: with either refrigerating coil orsalt-ice mixture. Freezing tube: test tube 1.5 cm. in-side diameter X 15 cm. long with rubber stopper. Air-jacket: test tube 2.9 cm. outside diameter X 20 cm.long. Use cork bushings cut by means of a grinding

92 AGRICULTURE HANDBOOK 60, U. S. DEPT. OF AGRICULTURE
TABLE 16.-Bureau of Soils data for reducing soil paste resistance readings to values at 60° F. (Whitney andMe&s, 1897)’
O F. -
ii............
4 4 : : : : : : : : : : : :46............48............
k:::::::::.g..:.........
sa~~.~~~~~~~~~~
g..,..........
64:::::::::::::
:k:::::::::
70.............
E::::::::::::it::::::::::::
E::::::::::::ii::::::::::::::aa.............
E::::::::::::2:::::::::::::98.............
--
-
1,000
735763788814a43
1,470 2,205 2,9401,526 2,289 3,0521,576 2,364 3,1521,628 2,442 3,2561,686 2,529 3,372
867a93917947974
1,734 2,601 3,4681,786 2,679 3,5721, a34 2,751 3,6681, a94 2, a41 3,7801,948 2,922 3,896
1,000 2,000 3,000 4,0001,027 2,054 3,081 4,1081,054 2,108 3,162 4,2161,081 2,162 3,243 4,3241,110 2,220 3,330 4,440
1,140 2,280 3,420 4,5601,170 2,340 3.510 4,6801,201 2, $02 3,603 4, a041,230 2,460 3,690 4,9201,261 2,522 3,783 5,044
1,294 2,598 3, a82 5,1761,327 2,654 3,981 5,3081,359 2,718 4,077 5,4361,393 2,786 4,179 5,5721,427 2, a54 4,281 5,708
1,460 2,920 4,380 5, a401,495 2,990 4,485 5,9801,532 3,064 4,596 6,1281,570 3,140 4,710 6,2801,611 3,222 4{, a33 6,444
--
-
2,000 3,000 4,000
Ohms
3,6753, al53,9404,0704,215
4,3354,4654,5854,7354, a70
5,0005,1355,2705,4055,550
5,7005,8506,0056,1506,305
6,4706,6356,7956,9657,135
7,3007,4757,6607,850a, 055
-
7,000
4,4104,5784,7284, a845,058
5,145 5,880 6,6155,341 6,104 6, a675,516 6,304 7,0925,698 6,512 7,3265,901 6,744 7,587
5,2025,3585,5025,6825, a44
6,069 6,936 7,8036,251 7,114 a, 0376,419 7,336 a, 2536,629 7,576 a, 5236, ala 7,792 a, 766
6,0006,1626,3246,4866,660
7,000 a, 000 9,0007,la9 a, 216 9,2437,378 a, 432 9,4867,567 a, 648 9,7297,770 a, 880 9,990
6, a407,0207,2067,3807,566
7,980 9,120a, 190 9,360a, 407 9,608a, 610 9, a40a, a27 lo, 088
10,26010,530lo, 80911,07011,349
7,7647,962a, I54a, 358a, 562
9,058 10,352 11,6469,289 10,616 11,9439,513 lo, a72 12,2319,751 11,144 12,5379,989 11,416 12, a43
a, 760a, 9709,1929,4209,666
10,220 11,68010,465 11,96010,724 12,25610,990 12,56011,277 12,888
13,14013,45513,78814,13014,499
l Example: Suppose the observed resistance is 2,568 ohms at 50’ F. In the table at that temperature, we find that 2,000ohms is equal to 1,734 ohms at 60’ F., 5,000 ohms is equal to 4,335 ohms at 60’ F., hence 500 ohms would he equal to 434 ohms.Similarly, 60 ohms would he one-hundredth of 6,000 ohms in the table and therefore equal to approximately 52 ohms at 60’ F.,while a ohms would he equal to about 7 ohms. These separate values are added together thus,
2,000 1,734500 43460 52a 7
2,568 ohms at 50 ‘=2,227 ohms at 60’
machine to center and suspend the freezing tubes inthe air-jackets. Mount the thermistor on a glass tubewith plastic spacers so as to hold the thermosensitivebead at the center of a 5ml. sample of the solution tobe frozen. Plot a resistance-temperature calibrationcurve for the thermistor over the range from 1 to - 5”C., using a standard thermometer or other source ofreference temperature.
Procedure
Place S-ml. samples of solutions in the freezing tubesand mount the tubes in the air-jacket in the freezingbath. An undercooling of approximately 2” C. hasbeen found convenient for soil extracts and plant saps.
6,000 a, 000 9,000
Place the thermistor in one of the samples when thesample has attained the bath temperature as indicatedby the bridge resistance reading. Induce freezing bytouching the solution with a metal probe cooled withsolid carbon dioxide. Follow the course of the freez-ing by keeping the bridge approximately balanced un-til the minimum resistance (maximum temperature)is attained. With an undercooling of 2” C., a time ofabout 2 min. is required to attain the maximum ob-served freezing temperature. The minimum resistancevalue is recorded as the freezing resistance. The ther-mistor can then be transferred rapidly to the nextsample so that ice crystals carried over in the processmay initiate freezing. Include a tube of distilled

SALINE AND
T ABLE I?.-Bureau of Soils data for relating theresistance of soil paste at 60’ F. to percentage of“mixed neutral salts” in soil (Davis and Bryan,1910)
Resistanceat 60” F.(ohms)
i f : : : : : : : : : :;; ..........
30:: : : : : : : : :35. .........
ii::::::::::
E::::::::::60 ..........65 ..........
;i!: :::::::::2:::::::::90 ..........95 ..........100. ........105 . . . . . . . . .110. ........115. ........120. ........125. ........130 .........135 .........140 .........145 .........150 . . . . . . . . .155 . . . . . . . . .
160. ........165. ........170. ........
-
Salts in-
Sand
Percent3.00
i-E1:501.241.04
Percent3.002.642.421. 701.341. 14
Percent. . . . . . . .
3.002.801.94
E
.86
::;
:%-51
.94
.78
.71
.64-58.54
1.04.88
:G.63f 57
.48 .50
.45 .47a 42 .44.39 .42.37 .39.35 .37
-53* 50.4744
: 41.39
-33 .35 f 37.31 .33 .35.30 .32 .33-28 .29 .31.27 -28 -29.25 .26 .28.24-23.22-21.21. 20
.20
::;
.25
.24-23-22-21-21
* 20-20
.26-25-24-23-22.21
. 19
.21
.20
.20
Loam Clay loam Clay
Percent. . . . . . . .. . . . . . . . .
3.002.201.581.32
1.14.98.86-77.70.63
.59
.55
.51
.4845
: 42
.39
.37
.35
.33
.32
.30
.28-27.26-25.24.23.22.21.20
water with each batch of samples to provide a check onthe resistance thermometer.
Calculations
By means of the standard curve constructed for theparticular thermistor in use, convert the freezing re-sistance to degrees centigrade. Correct for under-cooling, using the following relationship:
AT= AT, (l-0.0125rc)
where AT is the corrected freezing-point depression,AT, is the observed freezing-point depression, and ZLis the undercooling in degrees centigrade. A tableof factors for correction for undercooling is given b*yHarris (1925). Calculate osmotic pressure from theequation :
OP- 12.06nT -0.021nT2
ALKALI SOILS 93
where OP is the osmotic pressure in atmospheres andAT is the freezing-point depression in degrees centi-grade. Harris and Gortner (1914) present a tableof osmotic pressures in atmospheres covering the rangeof 0 to 2.999” C. freezing-point depression.
References
Richards and Campbell (1948,1949).
(6b) Freezing-Point Depression of Waterin Soil Cores
Apparatus
Use the same resistance thermometer as in Method6a, except the thermistor must be enclosed in a thin-walled metal tube sealed at the lower end and fastenedat the upper end to the glass mounting tube. Thecalibration curve should be plotted for this thermistorafter mounting in the protective metal jacket.
Soil sampling tube to deliver soil cores 1.7 cm. indiameter. Freezing tubes-glass test tube 2.0 cm. in-side diameter (2.2 cm. outside diameter) X 17.0 cm.long with rubber stoppers. Soil core holders of rigidtubular material (hard rubber), 1.7 cm. inside diam.(1.9 cm. outside diameter) X 5.1 cm. long. Coversfor soil core holders are disks of hard plastic material(Lucite), 1.9 cm. diam. X 3 mm. thick. One-half ofthe peripheral surface is turned to a smaller diameter
%Ee soil core holdersroximately 1.7 cm.) to give a snug fit in the ends
. A tapered hole large enoughto accommodate the jacketed thermistor is drilled inone-half of the covers just described.
The Wheatstone bridge, galvanometer, freezingbath, and air-jacket tubes are as described in Method6a. It is convenient to construct wooden racks to holdabout 30 freezing tubes each.
Procedure
Soil cores are pushed from the sampling tube intothe soil core holders and cut to length. A solid diskcover is placed on the bottom and a disk with a holeis placed on the top of the soil core holder. The disksare then pressed into position and are held there by theshoulder machined for that purpose. The cores areplaced in the freezing tubes that are closed with rub-ber stoppers bearing the sample numbers. If the sam-ples are to be stored for some time before freezing,both ends of the core holder may be dipped into meltedparaffin to prevent moisture loss.
Prior to freezing the sample, a hole is drilled in thecenter of the soil core. The diameter of this holeshould be slightly smaller than the thermistor jacket.The disturbance caused by insertion of the thermistorin an undercooled sample will then initiate freezing.The hole is drilled by hand with a twist drill mountedin a plastic rod having a free fit in the freezing tube.
The freezing tubes containing the samples to befrozen are centered and suspended in the air-jacket

94 AGRICULTURE HANDBOOK 60, U. S. DEPT. OF AGRICULTURE
tubes by means of a cork bushing. The thermistor isinserted into a soil core when the freezing bath isinitially loaded so that the approach of the tempera-ture of the cores to the bath temperature can be fol-lowed. The bath temperature should be held constant-+O.l” C. at approximately 1.5” below the expectedfreezing points for the batch of cores. When thesamples attain the bath temperature, freezing of thefirst core is induced by a twist of the thermistor. SUC-ceeding samples usually start to freeze at the time thethermistor is inserted into the sample. Frozensamples can be replaced in the bath with unfrozensamples, so that for a bath with capacity for 30 samplesthere is no waiting for undercooling of samples afterthe initial batch. An interval of about 1 hour isusually sufficient for samples at room temperature tocome to bath temperature.
As with the solutions, the change in resistance (tem-perature) is followed by means of the galvanometer,and the minimum resistance (maximum temperature)recorded as the freezing resistance.
Calculations
The freezing resistance is converted to observedfreezing-point depression in degrees centigrade bymeans of the calibration curve of the thermistor. Noconvenient method seems to be available at present formaking an undercooling correction for water in soil.There is experimental indication that the undercoolingcorrection is small for undercooling of 1.5” C. or less.Freezing-point depression is related to the sum of thetension (suction) and osmotic pressure of water insoil. Calculate the total soil-moisture stress (S;IMS)in atmospheres from the observed freezing-point de-pression ( AT,) fo water in soil cores by the relation,
SMS=12AT,References
Ayers and Campbell (1951), Campbell (1952),Richards and Campbell (1949), and Schofield andBothelho da Costa (1938).
Soluble Cations and Anions
(7) Calcium and Magnesium by Titration
With Ethylenediaminetetraacetate
(Versenate)
Reagents
A. Ammonium chloride-ammonium hydroxide buffersolution. Dissolve 47.5 gm. of ammonium chloridein 570 ml. of concentrated ammonium hydroxide andmake to 1 liter.
B. Sodium hydroxide, approximately 4 N. Dis-solve 160 gm. of sodium hydroxide in 1 liter of water.
C. Standard calcium chloride solution, 0.01 N. Dis-solve 0.500 gm. of pure calcium carbonate (calcitecrystals) in 10 ml. of approximately 3 N (1+3)
hydrochloric acid and dilute to a volume of exactly1 liter.
D. Eriochrome black T indicator. Dissolve 0.5 gm.of Eriochrome black T (F 241) and 4.5 gm. ofhydroxylamine hydrochloride in 100 ml. of 95 percentethanol. This indicator is available under severaldifferent trade names.
E. Ammonium purpurate indicator. Thoroughlymix 0.5 gm. of ammonium purpurate with 100 gm. ofpowdered potassium sulfate.
F. Ethylenediaminetetraacetate (Versenate) solu-tion, approximately 0.01 N. Dissolve 2.00 gm. ofdisodium dihydrogen ethylenediaminetetraacetate and0.05 gm. of magnesium chloride hexahydrate in waterand dilute to a volume of 1 liter. Standardize thesolution against reagent C, using the titration pro-cedures given below. The solution is standardized,using each of the indicators D and E, as the normalitywith E is 3 to 5 percent higher than with D.
Procedure
PRETREATMENT OF SOIL EXTRACTS.-Ammoniumacetate and dispersed organic matter, when present inappreciable amounts, must be almost entirely removedfrom soil extracts prior to titration with Versenate.Evaporation of an aliquot of the soil extract to drynessfollowed by treatment with aqua regia (3 parts cont.hydrochloric acid + 1 part cont. nitric acid), and asecond evaporation to dryness usually suffices for theremoval of ammonium acetate and organic matter.Very dark colored soil extracts may require additionaltreatment with aqua regia. Dissolve the residue in aquantity of water equal to the original volume of thealiquot taken for treatment.
CALCIUM.-Pipet a 5- to 25-ml. aliquot containingnot more than 0.1 meq. of calcium into a 3- or 4-inchdiameter porcelain casserole. Dilute to a volume ofapproximately 25 ml. Add 0.25 ml. (5 drops) ofreagent B and approximately 50 mg. of E. Titrate withF, using a lo-ml. microburet. The color change isfrom orange red to lavender or purple. When closeto the end point, F should be added at the rate of abouta drop every 5 to 10 seconds, as the color change is notinstantaneous. A blank containing B, E, and a dropor two of F aids in distinguishing the end point. If thesample is overtitrated with F, it may be back-titratedwith C.
CALCIUM PLUS MAGNESIUM.-Pipet a 5- to 25-ml.aliquot containing not more than 0.1 meq. of calciumplus magnesium into a 125-ml. Erlenmeyer flask.Dilute to a volume of approximately 25 ml. Add 0.5ml. (10 drops) of reagent A and 3 or 4 drops of D.Titrate with F, using a lo-ml. microburet. The colorchange is from wine red to blue or green. No tinge ofthe wine-red color should remain at the end point.
Calculations
Milliequivalents per liter of Ca or Ca+Mg= (ml. ofVersenate solution used X normality of Versenate solu-tion as determined by appropriate indicator X 1,000) /(ml. in aliquot) .

SALINE AND ALKALI SOILS 95
Remarks
Iron, aluminum, and manganese, when present inconcentrations greater than 20 p. p. m., and copper,when present in concentrations greater than severaltenths of a p, p. m., interfere with the performance ofthe Eriochrome black T indicator. Usually the con-centrations of these metals in water and ammoniumacetate extracts of soils of arid regions are insufficientto cause interference. If interference is encountered, itmay be overcome as described by Cheng and Bray(1951) *
References
Cheng and Bray (1951), Diehl and coworkers(1950).
(8) Calcium by Precipitation as CalciumOxalate
Apparatus
Centrifuge and I2-ml. conical tubes.
Reagents
(Keep reagents B, C, D, and E in Pyrex bottles.)A. Methyl orange, 0.01 percent in water.B. Hydrochloric acid, approximately 6 N (1+ 1).C. Oxalic acid, approximately 0.2 N. Dissolve 12.6
gm. of oxalic acid dihydrate in water and make to 1liter.
D. Ammonium hydroxide, approximately 7 N(l+l).
E. Ammonium hydroxide in ethanol and ether. Mix20 ml. of cont. ammonium hydroxide with 980 ml. of amixture of equal volumes of ethanol, ether, and water.
F. Perchloric acid, 4 N. Dilute 340 ml. of 70 percentperchloric acid or 430 ml. of 60 percent perchloric acidto 1 liter.
G. Nitro-ferroin indicator (5-nitro-l,lO-phenanthro-line ferrous sulfate solution, 0.001 M).
H. Ammonium hexanitrate cerate, 0.01 N in per-chloric acid, 1 N. Dissolve 5.76 gm. of ammoniumhexanitrate cerate in 250 ml. of 4 N perchloric acid anddilute to 1 liter. The reagent should be standardizedin the following manner: Pipet 5 or 10 ml. of freshstandard 0.01 N sodium oxalate into a small beakercontaining 5 ml. of reagent F, add 0.2 ml. of G, andtitrate with the cerate solution to the pale-blue endpoint. Determine a blank titration correction on asimilar sample minus the oxalate solution. The milli-liters of oxalate used multiplied by 0.01 and dividedby the corrected milliliters of cerate provide the nor-mality of the cerate. Do not attempt to adjust the solu-tion to exactly 0.01 N. Restandardize each time thereagent is used if more than 2 days have elapsed sincethe last standardization.from light.
Keep in a dark bottle away
Procedure
Pipet an aliquot containing 0.005 to 0.08 meq. ofcalcium into a K&ml. conical centrifuge tube, dilute orevaporate l4 to 5 ml., and add 1 drop of reagent A, 2drops of B, and 1 ml. of C. Heat to the boiling pointin a water bath. While twirling the tube, add D dropwise until the solution just turns yellow. Replace inthe bath, and, after 30 min., cool the tube in air or inwater. If necessary, add more D to keep the solutionjust yellow.
Centrifuge at RCF= 1,000 for 10 min. Carefully de-cant the supernatant liquid into another 12-ml. conicalcentrifuge tube and save for the magnesium determina-tion. Stir the precipitate and rinse the sides of thetube with a stream of 5 ml. of reagent E blown from apipet. Centrifuge at RCF = 1,000 for 10 min. Decantand drain the tube by inversion on filter paper for 10min. Wipe the mouth of the tube with a clean towelor lintless filter paper.
Blow into the tube 3 ml. of reagent F from a pipet.When the precipitate is dissolved, add 0.1 ml. of G.Titrate with H from a lo-ml. microburet to the pale-blue end point. If more than 5 ml. of H is required,transfer the sample to a small beaker and completethe titration. Determine the blank correction in thesame manner ; it is usually about 0.03 ml.
Calculations
Milliequivalents per liter of Ca= (corrected ml. ofcerate solution X normality of cerate X 1,000) /(ml. inaliquot) .
Reference
Reitemeier (1943) .
( 9 ) Magnesium by Precipitation as Magne-sium Ammonium Phosphate
Apparatus
Centrifuge, 12-ml. conical tubes, and photoelectriccalorimeter.
Reagents
A. Ammonium chloride, 3 percent solution. Dis-solve 3 gm. of ammonium chloride in water and diluteto 100 ml. Filter before use.
B. Ammonium dihydrogen phosphate, 5 percent solu-tion. Dissolve 5 gm. of ammonium dihydrogen phos-phate in water and dilute to 100 ml. Filter before use.
C. Phenolphthalein, 1 percent in 60 percent ethanol.
*’ Evaporation operations carried on with centrifuge tubes ina water bath may be speeded up by the use of an air blower.For this, a bank of glass nozzle-tubes in an array to matchpositions in the centrifuge tube rack is supplied with air froma compressed air system. A stream of air is thus introducedinto each drying tube.

96 AGRICULTURE HANDBOOK 60, U. S. DEPT. OF AGRICULTURE
D. Ammonium hydroxide, cont.E. Ammonium hydroxide in ethanol and ether. Mix
20 ml. of cont. ammonium hydroxide with 980 ml. ofa mixture of equal volumes of ethanol, ether, and water.
F. Magnesium sulfate solution, approximately 0.01N, standardized. This is best prepared by dilution of amore concentrated solution of magnesium sulfate thathas been standardized by gravimetric determination ofmagnesium (Method 78).
G. Sulfuric acid. Approximately 5 N (l-l-6).H. Ammonium vanadate, 0.25 percent solution.
Dissolve 2.5 gm. of ammonium vanadate in 500 ml. ofboiling water, cool somewhat, and then add 60 ml. ofreagent G. Cool to room temperature and dilute to 1liter. Store in a brown bottle.
I. Ammonium molybdate, 5 percent solution. Dis-solve 50 gm. of ammonium molybdate in 1 liter of water.Store in a brown bottle.
Procedure
To the 12-ml. conical centrifuge tube containing thecalcium-free sample from Method 8, add 1 ml. each ofreagents A and B and 1 drop of C. Heat to 90” C. ina water bath and then add D until permanently pink.After 15 min., add an additional 2 ml. of D. Stopperand let stand overnight.
Centrifuge at RClr=l,OOO for 10 min., decant care-fully, drain on filter paper for 10 min., and wipe themouth of the tube with a clean towel or lintless filterpaper. Wash the precipitate and sides of the tube witha stream of 5 ml. of reagent E from a pipet equippedwith a rubber bulb or by a similar arrangement. Cen-trifuge at RCF=l,OOO for 5 min., decant, drain for 5min., and wipe the mouth of the tube. Repeat thiswashing procedure once.
Pipet 10 ml. of reagent G into the tube and twirl fora few seconds. After 5 min. wash the contents into aloo-ml. volumetric flask. Dilute to about 60 ml. andpipet 10 ml. each of H and I into the flask while twirl-ing rapidly. Dilute to the mark and mix. After 10min. measure the difference in light transmission of thesample and water, using optical cells and a 460.rnpfilter.
Starting at the beginning of the Procedure above,prepare a photometer calibration curve on semiloga-rithmic graph paper, for 0, 0.5, 1, 2, 3, 4, and 5 ml. ofreagent F. One ml. of 0.2 N oxalic acid should be addedto each tube of standard before precipitating the mag-nesium. The amount of magnesium in the aliquot isobtained by simple interpolation on the curve.
Calculations
Milliequivalents per liter of Mg= (meq. of Mg foundby interpolation X 1,000) / (ml. in Ca aliquot X 0.98) .The factor of 0.98 corrects for magnesium lost in thewashings from the calcium precipitate.
References
Kitson and Mellon (1944)) Reitemeier (1943).
(10) Sodium
(lOa) Sodium by Flame Photometer
Apparatus
Perkin-Elmer model 52 flame photometer with acety-lene or propane burner.
Reagents
A. Ammonium acetate, approximately 1 N. To 700or 800 ml. of water add 57 ml. of cont. acetic acid andthen 68 ml. of cont. ammonium hydroxide. Dilute toa volume of 1 liter and adjust to pH 7.0 by the additionof more ammonium hydroxide or acetic acid.
B. Sodium chloride, 0.04 N. Dissolve 2.338 gm.of dry sodium chloride in water and dilute to exactly1 liter.
C. Sodium chloride, 0.04 N in 1 N ammonium ace-tate. Dissolve 2.338 gm. of dry sodium chloride in re-agent A. Dilute to exactly 1 liter with additional A.
D. Lithium chloride, 0.05 N. Dissolve 2.12 gm. ofdry lithium chloride in water and dilute to exactly1 liter.
Procedure
Using reagents B and D prepare a series of standardsodium chloride solutions, each containing the sameconcentration of lithium chloride. Prepare a similarseries of standard sodium chloride solutions, usingreagents C and D, and use A for dilution. Recom-mended concentrations of sodium chloride are 0, 0.2,0.4, 0.6, 0.8, 1, 2, 3, and 4 meq./l. The optimum con-centration of lithium chloride varies with individualflame photometers but is usually 5 to 10 meq./l.Standard solutions made up with water are employedfor the analysis of waters and water extracts of soils;whereas, standard solutions made up in ammoniumacetate solutions are used for the analysis of ammoniumacetate extracts of soils. Calibrate the flame photom-eter for operation over the concentration range 0 to 1meq./l. of sodium, using the first 6 standard solutionsof the appropriate series. Use the first and the last 4solutions of the appropriate series to calibrate the in-strument for operation over the concentration range0 to 4 meq./l. of sodium.
Pipet an aliquot of the solution to be analyzed, con-taining less than 0.2 meq. of sodium, into a 50-ml.volumetric flask. Add an amount of reagent D that,when diluted to a volume of 50 ml., will give a concen-tration of lithium chloride exactly equal to that in thestandard sodium chloride solutions. Dilute to volumewith water, or with A, if ammonium acetate extractsare being analyzed. Mix and determine the sodiumconcentration by use of the flame photometer and theappropriate calibration curve.
Calculations
Milliequivalents per liter of Na in water or extract=(meq./l. of Na as found by interpolation on calibra-tion curve X 50) /(ml. in aliquot) .

SALINE AND ALKALI SOILS 97
( 1 Ob > Sodium by Precipitation as SodiumUranyl Zinc Acetate
Apparatus
Centrifuge and 12-ml. conical tubes.
Reagents
A. Uranyl zinc acetate. Weigh 300 gm. of uraniumacetate dihydrate, 900 gm. of zinc acetate dihydrate,and 10 mg. of sodium chloride into a large flask. Add82 ml. of glacial acetic acid and 2,618 ml. of water.Stir or shake until the salts are dissolved, leaving onlya small amount of sodium uranyl zinc acetate precipi-tate. Filter before use.
B. Acetic acid-ethanol. Mix 150 ml. of glacial aceticacid with 850 ml. of 95 percent ethanol. Shake withan excess of sodium uranyl zinc acetate crystals. Filterbefore use. S d0 ium uranyl zinc acetate crystals maybe prepared as follows : Add 125 ml. of reagent A to5 ml. of 2 percent sodium chloride solution, stir, andafter 15 min. collect the precipitate in a porous-bot-tomed porcelain crucible. Wash several times withglacial acetic acid, then several times with ether, andfinally dry in a desiccator.
C. Ether, anhydrous.
Procedure
Pipet an aliquot containing 0.003 to 0.07 meq. ofsodium into a 12-ml. conical centrifuge tube. Evapo-rate on a water bath to 0.5 ml. Cool, add 8 ml. ofreagent A, and mix by stirring with an aluminum wirebent into a loop. Let stand 1 hour. Centrifuge atRCF- 1,000 for 10 min. Decant and drain on filterpaper for 10 min. Wipe the mouth of the tube with aclean towel or lintless filter paper. Suspend the pre-cipitate and wash the sides of the tube, using 5 ml. ofB blown from a pipet equipped with a rubber bulb.Centrifuge for 10 min., decant, and drain for 1 min.Wipe the mouth of the tube. Wash with 5 ml. of C,but centrifuge for only 5 min. Decant carefully with-out draining. Repeat washing and centrifuging once.Clean the outside of tube with chamois, dry for anhour or more at 60” C., cool in a desiccator, and weigh.Add 10 ml. of water, stir with the wire until the sodiumprecipitate is dissolved, centrifuge for 5 min., decantcarefully, and drain for 5 min. on filter paper. Suspendthe insoluble precipitate and wash the sides of the tubewith 5 ml. of B blown from a pipet. Centrifuge for 5min., and decant. Wash with 5 ml. of C, centrifuge for5 min., clean tube with chamois, dry for an hour at 60”,cool in a desiccator, and weigh. The difference betweenthe two weights is the weight of the sodium precipitate.
Calculations
Milliequivalents per liter of Na = (gm. of Na precipi-tate X 650.2) /(ml. in aliquot) .
Reference
Reitemeier (1943) .
( 11) Potassium
(11 a) Potassium by Flame Photometer
Apparatus
Perkin-Elmer model 52 flame photometer with acety-lene or propane burner.
Reagents
A. Ammonium acetate, approximately 1 N. To 700or 800 ml. of water add 57 ml. of cont. acetic acid andthen 68 ml. of cont. .ammonium hydroxide. Dilute toa volume of 1 liter and adjust to pH 7.0 by the additionof more ammonium hydroxide or acetic acid.
B. Potassium chloride, 0.02 N. Dissolve 1.491 gm.of dry potassium chloride in water and dilute to avolume of exactly 1 liter.
C. Potassium chloride, 0.02 N in 1 N ammoniumacetate. Dissolve 1.491 gm. of dry potassium chloridein reagent A. Dilute to a volume of exactly 1 literwith additional A.
D. Lithium chloride, 0.05 N. Dissolve 2.12 gm. ofdry lithium chloride in water and dilute to 1 liter.
Procedure
Using reagents B and D, prepare a series of stand-ard potassium chloride solutions, each containing thesame concentration of lithium chloride. Prepare asimilar series of standard potassium solutions usingreagents C and D, and use A for dilution. The concen-trations of potassium chloride are 0, 0.1, 0.2, 0.3, 0.4,0.5, 1, 1.5, and 2 meq./l. The optimum concentrationof lithium chloride varies with individual flame photo-meters but is usually 5 to 10 meq./l. Standard solu-tions made up in water are employed for the analysisof waters and water extracts of soils; whereas, thosemade up in ammonium acetate solution are used for theanalysis of ammonium acetate extracts of soils. Cali-brate the flame photometer for operation over the con-centration range 0 to 0.5 meq./l. of potassium, usingthe first 6 standard solutions of the appropriate series.Use the first and the last 4 solutions of the appropriateseries to calibrate the instrument for operation over theconcentration range 0 to 2 meq./l. of potassium.
Pipet an ahquot of the solution to be analyzed con-taining less than 0.1 meq. of potassium into a 50-ml.volumetric flask. Add an amount of reagent D which,when diluted to a volume of 50 ml., will give a concen-tration of lithium chloride exactly equal to that in thestandard potassium chloride solutions. Dilute tovolume with water or with A, if ammonium acetate ex-tracts are being analyzed, mix, and determine the potas-sium concentration by use of the flame photometer andthe appropriate calibration curve.
Calculations
Milliequivalents per liter of K in water or extract=(meg./. of K as found by interpolation on calibrationcurve X 50) J (ml. in aliquot) .

AGRICULTURE HANDBOOK 60, 0. S. DEPT. OF AGRICULTURE
( 11 b) Potassium by Precipitation as Po-tassium Dipicrylaminate
Apparatus
Photoelectric calorimeter, centrifuge, and Z&ml.conical tubes.
Reagents
A. Lithium dipicrylaminate solution. Dissolve 1.65gm. of lithium carbonate in 250 ml. of water. Warmto 50” C. and then add 9 gm. of dipicrylamine. Afterthe dipicrylamine has dissolved, filter and dilute 200 ml.of this solution to 1 liter. To the remaining portion ofapproximately 50 ml., add 0.25 gm. of potassiumchloride. S pe arate and wash the resulting potassiumdipicrylaminate precipitate with a few milliliters ofwater by means of a centrifuge. Add the potassium saltto the warm solution of lithium dipicrylaminate andshake for 30 min. Filter the solution before use.
B. Potassium chloride, 0.010 N. Dissolve 0.7456gm. of dry potassium chloride in water and dilute toexactly 1 liter.
C. Phenolphthalein, 1 percent in 60 percent ethanol.D. Sodium hydroxide, approximately 1 N. Dissolve
40 gm. of sodium hydroxide in water and dilute to 1liter.
Procedure
Pipet an aliquot containing 0.005-0.035 meq. ofpotassium into a 22-ml. conical centrifuge tube. Add 1drop of reagent C and then D until pink. Evaporate todryness. Th is insures removal of ammonium. Cooland then add exactly 2 ml. of A. Grind the salt residuein the bottom of the tube by means of a glass rod andallow 1 hour for precipitation. Centrifuge the tube atRCI;- 1,000 for 1 min. Remove a 0.2-ml. aliquot fromthe supernatant liquid by means of a blood pipet anddilute to a volume of 50 ml. Compare the light trans-mission in an optical cell through a 510-rnp filter withthat of water in similar cell. Prepare a calibration curvefor each set of samples by carrying a series of 0.5, 1,1.5, 2, 2.5, 3, 3.5 ml. of B through the same operations.The amount of potassium in the sample is found byinterpolation on this curve, When plotted on a linearscale the curve should be slightly S-shaped. The tem-perature at which the calibration curve is preparedshould be within 2” C. of that at which the unknowndeterminations are made.
Calculations
Milliequivalents per liter of K= (meq. of K in ali-quot as found by interpolation X 1,000) /(ml. inaliquot) .
Reference
Williams (1941).
( 1 2 ) Carbonate and Bicarbonate by Titra-tion With Acid
Reagents
A. Phenolphthalein, 1 percent in 60 percent ethanol.B. Methyl orange, 0.01 percent in water.C. Sulfuric acid, approximately 0.010 N, standard-
ized.
Procedure
Pipet an aliquot containing 0.005 to 0.04 meq. ofchloride into a 15-ml. wide-mouthed porcelain crucibleor a small porcelain casserole. Chloride is specifiedhere because the same sample is subsequently used forthe chloride determination in Method 13. Add 1 dropof reagent A. If the solution turns pink, add C from alo-ml. microburet dropwise at 5-second intervals untilthe color just disappears. Designate this buret readingas y. Add 2 drops of B and titrate to the first orangecolor. Designate the new buret reading as z. Save thetitrated sample for the chloride determination.
An indicator correction blank using boiled watershould be determined and applied if it is not negligible.The lighting should be adequate for the recognition ofthe various colors. The use of comparison color stand-ards at the correct end points is helpful.
Calculations
1. Milliequivalents per liter of COs= (2y X nor-mality of H,SO, X 1,000) /(ml. in aliquot) .
2. Milliequivalents per liter of HCOB= (2-2~) X nor-mality of H,SO, X l,OOO/( ml. in aliquot) .
Reference
Reitemeier (1943) .
(13) Chloride by Titration With SilverNitrate
Reagents
A. Potassium chromate, 5 percent solution. Dis-solve 5 gm. of potassium chromate in 50 ml. of waterand add 1 N silver nitrate dropwise until a slight per-manent red precipitate is produced. Filter and diluteto 100 ml.
B. Silver nitrate, 0.005 N. Dissolve 0.8495 gm. ofsilver nitrate in water and dilute to exactly 1 liter.Keep in a brown bottle away from light.
Procedure
To the sample preserved from the carbonate-bicarbo-nate determination, add 4 drops of reagent A. Whilestirring, titrate under a bright light with B from a lo-ml. microburet to the first permanent reddish-browncolor. The titration blank correction varies with thevolume of the sample at the end point, and usually in-creases regularly from about 0.03 to 0.20 ml. as thevolume increases from 2 to 12 ml.
--___ -. - .- __.----__ --- -__ I_
SALINE AND ALKALI SOILS 99
Calculations
Milliequivalents per liter of Cl = (ml. of AgNO,- ml.of AgNO, for blank) X 0.005 X l,OOO/( ml. in aliquot) .
Reference
Reitemeier (1943).
( 14) Sulfate
(14a) Sulfate by Precipitation as BariumSulfate
Apparatus
Centrifuge and 12-ml. conical tubes.
Reagents
A. Methyl orange, 0.01 percent in water.B. Hydrochloric acid, approximately 1 N.C. Barium chloride, approximately 1 N. Dissolve
122 gm. of barium chloride dihydrate in water anddilute to 1 liter.
D. Ethanol, 50 percent by volume.
Procedure
Pipet an aliquot containing 0.05 to 0.5 meq. ofsulfate into a clean 12-ml. conical centrifuge tube ofknown weight. Dilute or evaporate to about 5 ml. Add2 drops of reagent A, then B dropwise until pink, andthen 1 ml. of B in excess. Heat to boiling in water bath.While twirling the tube add 1 ml. of C dropwise. Re-turn to the hot water bath for 30 min. and then cool atleast an hour in air.
Centrifuge at RCI;=l,OOO for 5 min. Carefullydecant and let drain by inversion on filter paper for 10min. Wipe the mouth of the tube with a clean towelor lintless filter paper.
Stir the precipitate and rinse the sides of the tubewith a stream of 5 ml. of reagent D blown from a pipet.If necessary, loosen precipitate from bottom of tube bymeans of a wire bent in appropriate shape. Centrifugefor 5 min. and decant, but do not drain. Repeat thiswashing and decanting operation once. Wipe the out-side of tube carefully with chamois and do not subse-quently touch with fingers. Dry overnight in an ovenat 105” C. Cool in a desiccator and weigh.
Calculations
Milliequivalents per liter of S04= (mg. of BaSO,precipitate X 8.568) / (ml. in aliquot) .
(Note. Care must be taken in the preparation orconcentration of the unknowns so as not to precipitateforeign material which might be weighed as bariumsulfate. )
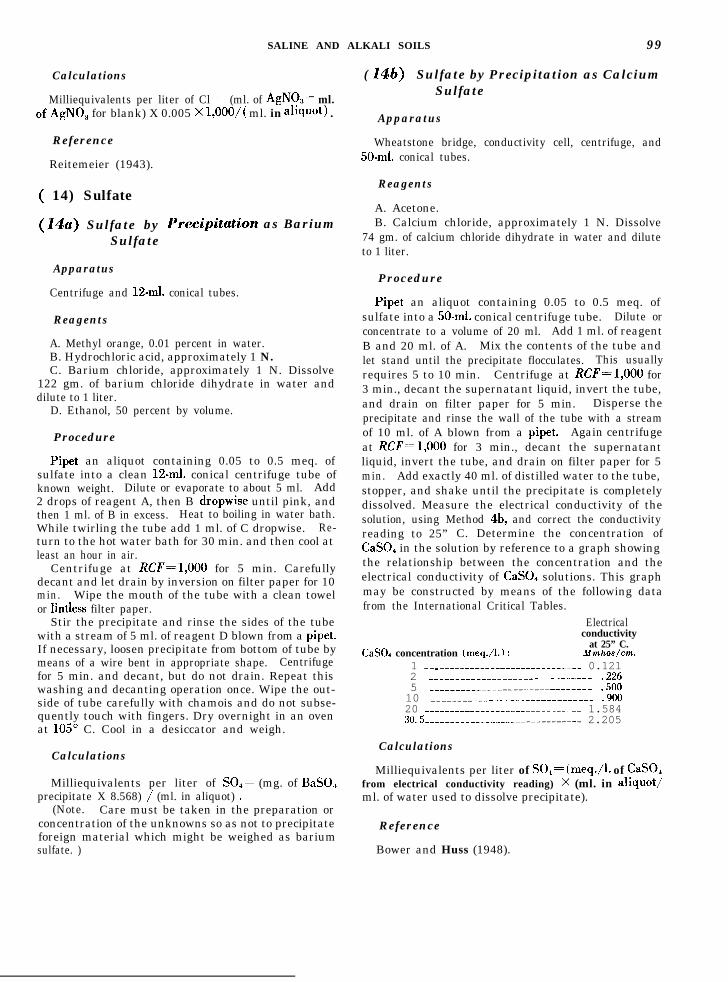
( 14b) Sulfate by Precipitation as CalciumSulfate
Apparatus
Wheatstone bridge, conductivity cell, centrifuge, and50-ml. conical tubes.
Reagents
A. Acetone.B. Calcium chloride, approximately 1 N. Dissolve
74 gm. of calcium chloride dihydrate in water and diluteto 1 liter.
Procedure
Pipet an aliquot containing 0.05 to 0.5 meq. ofsulfate into a 50-ml. conical centrifuge tube. Dilute orconcentrate to a volume of 20 ml. Add 1 ml. of reagentB and 20 ml. of A. Mix the contents of the tube andlet stand until the precipitate flocculates. This usuallyrequires 5 to 10 min. Centrifuge at RCF=l,OOO for3 min., decant the supernatant liquid, invert the tube,and drain on filter paper for 5 min. Disperse theprecipitate and rinse the wall of the tube with a streamof 10 ml. of A blown from a pipet. Again centrifugeat RCF=l,OOO for 3 min., decant the supernatantliquid, invert the tube, and drain on filter paper for 5min. Add exactly 40 ml. of distilled water to the tube,stopper, and shake until the precipitate is completelydissolved. Measure the electrical conductivity of thesolution, using Method 4b, and correct the conductivityreading to 25” C. Determine the concentration ofCaSO, in the solution by reference to a graph showingthe relationship between the concentration and theelectrical conductivity of CaSO, solutions. This graphmay be constructed by means of the following datafrom the International Critical Tables.
Electricalconductivity
at 25” C.CaS04 concentration (meq./l.) : Mmhos/cm.
1 ______________________--____-__ 0.1212 ________________________------- .2265 --__--_---____-----_-___--_-_-- .50010 __-_________________----_______ .90020 ____________________----_______ 1.5843O.5___________________-----____--_ 2.205
Calculations
Milliequivalents per liter of S04= (meq./l. of CaSO,from electrical conductivity reading) X (ml. in aliquot/ml. of water used to dissolve precipitate).
Reference
Bower and Huss (1948).

100 AGRICULTURE HANDBOOK 60? U. S. DEPT. OF AGRICULTiJRE
( 15) Nitrate by Phenoldisulfonic Acid
Apparatus
Photoelectric calorimeter.
Reagents
A. Phenoldisulfonic acid. Dissolve 25 gm. of phe-nol in 150 ml. of cont. sulfuric acid, add 75 ml. of fum-ing sulfuric acid (13 to 15 percent SO,), and heat at100” C. for 2 hours.
B. Potassium nitrate, 0.010 N. Dissolve 1.011 gm.of dry potassium nitrate in water and dilute to exactly1 liter.
C. Silver sulfate, 0.020 N. Dissolve 3.12 gm. silversulfate in 1 liter of water.
D. Ammonium hydroxide, approximately 7 N(l+l).
E. Calcium oxide.
Procedure
First determine the concentration of chloride in analiquot as directed under Method 13. Pipet anotheraliquot containing 0.004 to 0.04 meq. of nitrate into a25-ml. volumetric flask. Add an amount of reagentC equivalent to the amount of chloride present. Diluteto volume and mix. Transfer most of the suspensionto a SO-ml. centrifuge tube and separate the precipi-tate by centrifuging. After transferring the solution toanother centrifuge tube, flocculate any suspended or-ganic matter by adding about 0.1 gm. of E and clear byagain centrifuging. Pipet a lo-ml. aliquot represent-ing 2/5 of the sample into an &cm. evaporating dish.Evaporate the aliquot to dryness, cool, and dissolve theresidue in 2 ml. of A. After 10 min., add 10 ml. ofwater and transfer to a loo-ml. volumetric flask. Makealkaline by the addition of D, dilute to volume, andmix. Measure the light transmission through a 460-rnpfilter in an optical cell against that of water in asimilar cell.
Prepare a calibration curve by pipeting 0, 0.2, 0.4,0.8, 1.2, and 1.6 ml. portions of reagent B into evapo-rating dishes and treating as above omitting the addi-tions of C and E, and the clarifying procedure.
Calculations
Milliequivalents per liter of N09= (meq. of NO, inaliquot as found by interpolation on NO, curve) Xl,OOO/( ml. in aliquot) .
( 16) Silicate as Silicomolybdate
Apparatus
Photoelectric calorimeter.
Reagents
A. Ammonium molybdate, 10 percent solution.Dissolve 10 gm. of ammonium molybdate in water anddilute to 100 ml.
B. Sulfuric acid, approximately 5 N (1 + 6) .C. Sodium silicate, 0.01 N. Dissolve 1.5 gm. of
Na,SiO,*9H,O in 1 liter of water. Determine the silicate(SiO,) concentration of this solution, using a loo-ml.aliquot and Method 76a (ch. 8). Adjust the remainingsolution to exactly 0.01 N by the addition of a calcu-lated amount of water. Store in a plastic bottle.
Procedure
Pipet an aliquot containing 0.005 to 0.05 meq. ofsilicate into a SO-ml. volumetric flask. Dilute to avolume of 40 to 45 ml. with water. Add 2 ml. ofreagent A and then 1 ml. of B. Dilute to 50 ml., mix,and after 15 min. measure the light transmissionthrough a 420-rnp filter in an optical cell against waterin a similar cell. Prepare a calibration curve by carry-ing a series of 0, 1, 2, 3, 4, and 5 ml. of C through thesame operations.
Calculations
Milliequivalents per liter of SiO,= (meq. of SiO, inaliquot as found by interpolation X 1,000) /(ml. inaliquot) .
Reference
Snell and Snell (1936).
(17) Boron
Determine boron as directed in Method 73b. If thesolution is colored, transfer an aliquot to a platinumdish, make alkaline with NaOH, reagent A, and evapo-rate to dryness in an oven at 95” C. Ignite over anopen flame until the residue fuses. Cool, add 5 ml.dilute HCl, reagent C, and complete as suggested inMethod 73b under paragraph, Boron ConcentrationToo Low.
Exchangeable Cations
(18) Exchangeable Cations
Apparatus
Centrifuge, 50-ml. round-bottom, narrow-neckcentrifuge tubes, and reciprocating shaker.
Reagents
A. Ammonium acetate solution, 1.0 N. To 700 or800 ml. of water add 57 ml. of cont. acetic acid andthen 68 ml. of cont. ammonium hydroxide. Dilute toa volume of 1 liter and adjust to pH 7.0 by the additionof more ammonium hydroxide or acetic acid.
B. Nitric acid, cont.C. Hydrochloric acid, cont.D. Acetic acid, approximately 0.1 N.
Procedure
Ammonium acetate extractable cations : Samples forthis determination should be approximately 4 gm. for

SALINE AND ALKALI SOILS 101
medium- and fine-textured soils and 6 gm. for coarse-textured soils. Weigh samples to an accuracy of 1percent and correct for the air-dry moisture content.Place the sample in a centrifuge tube. Add 33 ml. ofreagent A to the tube, stopper, and shake for 5 min.Remove the stopper and centrifuge at RCF- 1,000 untilthe supernatant liquid is clear. This usually requires5 min. Decant the supernatant liquid as completely aspossible into a lOO-ml. volumetric flask. Extract withA a total of 3 times by this procedure, decanting intothe same flask. Dilute to volume, mix, and determinethe amounts of the various extracted cations by flamephotometric or chemical methods. Flame photometricanalyses may be made directly upon aliquots of theextract. If chemical methods are to be employed forthe determination of cations, pretreat the extract in thefollowing manner: Transfer to a 250-ml. beaker andevaporate to dryness on a hot plate or steam bath.Wash down the walls of the beaker with a small quantityof water and again evaporate to dryness. Add 1 ml.of B and 3 ml. of C, evaporate, and dissolve the residuein 20 ml. of D. Filter through low-ash content filterpaper into a 5O-ml. volumetric flask, using water towash the beaker and filter paper. Dilute to volume.
Soluble cations: Prepare a saturated soil paste asdescribed in Method 2, using a 200- to l,OOO-gm. sam-ple of soil. The weight of soil will depend upon thenumber of cations to be determined, the analyticalmethods employed, and the salt content of the soil.Determine the saturation percentage by Method 27.Obtain the saturation extract as described underMethod 3a and determine the soluble cation concentra-tions by flame photometric or chemical methods.
Calculations
Ammonium acetate extractable cations in meq./100gm.= (cation cont. of extract in meq./l. X lO)l(wt. ofsample in gm.) .
Soluble cations in meq./lOO gm.= (cation cont. ofsaturation extract in meq./l.) X (saturation percent-age) Jl,OOO.
Exchangeable cations in meq./lOO gm. = (extractablecations in meq./lOO gm.) - (soluble cations in meq./100 gm.) .
Reference
Bower and others (1952).
( 19) Cation-Exchange-Capacity
to a volume of 1 liter. The pH value of the solutionshould be approximately 8.2.
B. Ethanol, 95 percent.C. Ammonium acetate solution, 1.0 N. To 700 or
800 ml. of water add 57 ml. of cont. acetic acid and then68 ml. of cont. ammonium hydroxide. Dilute to avolume of 1 liter and adjust to pH 7.0 by the additionof more ammonium hydroxide or acetic acid.
Procedure
Samples for this determination should be approxi-mately 4 gm. for medium- and fine-textured soils and 6gm. for coarse-textured soils. Weigh samples to anaccuracy of 1 percent and correct for the air-drymoisture content. Pl ace the sample in a centrifugetube. Add 33 ml. of reagent A, stopper the tube, andshake for 5 min. Unstopper and centrifuge atRCI’= 1,000 until the supernatant liquid is clear. Thisusually requires 5 min. Decant the supernatant liquidas completely as possible and discard. Treat thesample in this manner with 33-ml. portions of A a totalof 4 times, discarding the supernatant liquid each time.Add 33 ml. of B to the tube, stopper, shake for 5 min.,unstopper, and centrifuge until the supernatant liquidis clear. Decant and discard the supernatant liquid.Wash the sample with 33-m]. portions of B a total of 3times. The electrical conductivity of the supernatantliquid from the third washing should be less than 40micromhos/cm. Replace the adsorbed sodium fromthe sample by extraction with three 33-ml. portions ofC and determine the sodium concentration of the com-bined extracts after dilution to 100 ml. as describedunder Method 18.
Calculations
Cation-exchange-capacity in meq./lOO gm.= (Nacont. of extract in meq./l. X 10) /(wt. of sample ingm.) l
Reference
Bower and others ( 1952).
(20) Exchangeable-Cation Percentages
(20a) Exchangeable - Cation Percentagesby Direct Determination
Procedure
Apparatus Determine the exchangeable-cation contents and the
Centrifuge, 50-ml. round-bottom, narrow-neck cen- cation-exchange-capacity, using Methods 18 and 19.trifuge tub&, and reciprocating shaker.
CalculationsReagents
A. Sodium acetate solution, 1.0 N. Dissolve 136gm. of sodium acetate trihydrate in water and dilute
Exchangeable-cation percentage= (exchangeable-cat-ion content in meq./lOO gm. X 100) / (cation-exchange-capacity in meq./lOO gm.) .

102 AGRICULTURE HANDBOOK 60, U. S. DEPT. OF AGRICULTURE
(20b) Estimation of Exchangeable-Sodi-um-Percentage and Exchange-able-Potassium-Percentage FromSoluble Cations
Procedure
Prepare a saturation extract of the soil as describedunder Methods 2 and 3a. Determine the calcium pltismagnesium, sodium, and potassium concentrations ofthe saturation extract, using Methods 7, 10, and 11,respectively.
Calculations
Exchangeable-sodium-percentage100 ( - 0.0126 + 0.01475x)-1 + ( - 0.0126 + 0.01475x)
where x is equal to the sodium-adsorption-ratio.
Exchangeable-potassium-percentage= 100 (0.0360 + 0.1051~)
1 + (0.0360 +0.1051x)
where x is equal to the potassium-adsorption-ratio.The sodium-adsorption-ratio and the potassium-adsorp-tion-ratio are calculated as follows:
Sodium-adsorption-ratio= Na+/ 4 (Ca++ + Mg”) /2and
Potassium-adsorption-ratio = K’/ 4 (Ca++ + Mg++) /2
where Na+, K’, Ca++, and Mg++ refer to the concentra-tions of designated cations expressed in milliequivalentsper liter.
A nomogram, which relates soluble sodium andsoluble calcium plus magnesium concentrations to thesodium-adsorption-ratio,-’is given in figure 27. Alsoincluded in the nomogram is a scale for estimating thecorresponding exchangeable-sodium-percentage, Kasedon the linear equation given in connection with figure 9(ch. 2) . To use this nomogram, lay a straightedgeacross the figure so that the line coincides with thesodium concentration on scale A and with the calciumplus magnesium concentration on scale B. The sodium-gdsorpt&-ratio and the estimated exchangeable-so-dium-percentage are then read on scales C and D,respectively.
Supplementary Measurements
(21) pH Determinations
(21a) pH Reading of Saturated Soil Paste
Apparatus
pH meter with glass electrode.
Procedure
Prepare a saturated soil paste with distilled wateras directed in Method 2 and allow paste to stand at least
1 hour. Insert the electrodes into the paste and raiseand lower repeatedly until a representative pH readingis obtained.
(21b) pH Reading of Soil Suspension
Procedure
Prepare a soil suspension, using distilled water, shakeintermittently for an hour, and determine pH reading.
(21~) pH Reading of Waters, Solutions,Soil Extracts
Procedure
Determine pH reading by means of a glass electrodeassembly with the solution in equilibrium with a knownCO, atmosphere.
Remarks
Opinion varies as to the proper method for makingpH readings. It is desirable to select a definite pro-cedure and follow it closely, so that the readings willbe consistent and have maximum diagnostic value. Themethod used should be described accurately so as to aidothers in the interpretation of results.
The CO, status influences pH readings, and shouldbe controlled or specified. Ordinarily, readings aremade at the CO, pressure of the atmosphere. A specialhigh-pH glass electrode should be used for pH valuesappreciably above 9.0.
(22) G y p s u m
(22a) Gypsum by Precipitation With Ace-tone (Qualitative)
Reagent
Acetone.
Procedure
Weigh 10 to 20 gm. of air-dried soil into an 8-0~.bottle and add a measured volume of water sufficientto dissolve the gypsum present. Stopper the bottleand shake by hand 6 times at 15-min. intervals or agi-tate for 15 min. in a mechanical shaker. Filter theextract through paper of medium porosity. Place about5 ml. of the extract in a test tube, add an approximatelyequal volume of acetone, and mix. The formation of aprecipitate indicates the presence of gypsum in the soil.
Remarks
The soil should not be oven-dried, because heat-ing promotes the convers ion of CaSO,*2H,O toCaSO,-O.SH,O. The latter hydrate has a highersolubility in water for an indefinite period followingits solution.

SALINE AND ALKALI SOILS 103
No+M eq./l.
250‘
200-
150-
IOO-
50-
Ca+++Mg++
Meq*t*- 0.2
- 0.6
-I
0cA
- 2
-3'
- 4
- 5
- 6
- 8
- IO
- 20
-30
-40
-'50
BFIGURE 27.-Nomogram for determining the SAR value of a saturation extract and for estimating the corresponding
ESP value of soil at equilibrium with the extract.

104 AGRICULTURE HANDBOOK 60, U. S. DEPT. OF AGRICULTURE
(22b) Gypsum by Precipitation With Ace-tone (Quantitative)
Apparatus
Centrifuge, 50-ml. conical centrifuge tubes, conduc-tivity cell, and Wheatstone bridge.
Reagent
Acetone.
Procedure
Transfer a 20-ml. aliquot of the filtered extract ob-tained as described in Method 22a into a 50-ml. conicalcentrifuge tube. Add 20 ml. of acetone and mix. Letstand until the precipitate flocculates. This usually re-quires 5 to 10 min. Centrifuge at RCF= 1,000 for 3min., decant the supernatant liquid, invert the tube, anddrain on filter paper for 5 min. Disperse the precipi-tate and rinse the wall of the tube with a stream of 10ml. of acetone blown from a pipet. Again, centrifugefor 3 min., decant the supernatant liquid, invert thetube, and drain on filter paper for 5 min. Add exactly40 ml. of distilled water to the tube, stopper, and shakeuntil the precipitate is completely dissolved. Measurethe electrical conductivity of the sclution, using Method4b, and correct the conductivity reading to 25” C.Determine the concentration of gypsum in the solutionby reference to a graph showing the relationship be-tween the concentration and the electrical conductivityof gypsum solutions. This graph may be constructedby means of the following data from the InternationalCritical Tables.
Electrical conductivityat 25” C.
CaS04 concentration (meq./l.) : Mmhos/cm.1 ____________________~~~~~~~~___ 0.1212 ___________ ____ ________________ .2265 -_--___-_-- ________ --__- ______ _ -500
10 -- _______ - ________ -- ___________ .90020 ____-__--________--_~~~~~~~~~~~ 1.58430.5_________________________--____ 2.205
Calculations
Milliequivalents o f CaSO, i n aliquot= (meq./l.of CaSO, from conductivity reading) X (ml. of waterused to dissolve precipitate) /l,OUO.
Milliequivalents of gypsum per 100 gm. of soil=100 Y (meq. of CaSO, in aliquot) /(soil: water ratio Xml. of soil-water extract used) .
Remarks
Sodium and potassium sulfates when present in suf-ficiently high concentrations are also precipitated byacetone. The maximum concentrations of sodium sul-fate and of potassium sulfate that may be tolerated are50 and 10 meq./l., respectively.
At a 1: 5 soil-water ratio, water will dissolve ap-proximately 15 meq. of gypsum per 100 gm. of soil.If it is found that the gypsum content of the soil ap-
proaches 15 meq./lOO gm. by use of a 1: 5 soil-waterextract, the determination should be repeated, using amore dilute extract.
Reference
Bower and Huss (1948).
(22~) Gypsum by Increase in Soluble Cal-cium Plus Magnesium ContentUpon Dilution
Procedure
Determine the saturation percentage and obtain asaturation extract of the soil using Methods 27 and 3a.Prepare another water extract of the soil, using a mois-ture content sufficient to dissolve the gypsum presentas described under Method 22a. Determine the cal-cium plus magnesium concentrations of the two ex-tracts by Method 7.
Calculations
Soluble Ca+Mg at the saturation percentage inmeq./lOO gm. = (Ca+ Mg cont. of saturation extractin meq./l.) X (saturation percentage) /l,OOO.
Soluble Ca+Mg at the high moisture percentage inmeq./lOO gm. = (Ca + Mg cont. of dilute extract inmeq./l.) X (moisture percentage) /l,OOO.
Gypsum in meq./lOO gm. of soil= (soluble Ca+Mgat the high moisture percentage in meq./lOO gm.) -(soluble Ca+Mg at the saturation percentage inmeq./lOO gm.) .
(22d) Gypsum Requirement l5
Reagent
A. Approximately saturated gypsum solution ofknown calcium concentration. Place about 5 gm. ofCaSO,-2H,O and 1 liter of water in a flask, stopper, andshake by hand several times during a period of 1 hr.,or for 10 min. in a mechanical shaker. Filter and de-termine the calcium concentration of a 5-ml. aliquotof the solution by Method 7. The calcium concentra-tion should be at least 28 meq./l.
Procedure
Weigh 5 gm. of air-dried soil into a 4-0~. bottle.A d d 100 ml. of reagent A by means of a pipet.Stopper the bottle and shake by hand several times dur-ing a period of 30 min. or for 5 min. in a mechanicalshaker. Filter part of the suspension and determine thecalcium plus magnesium concentration of a suitablevolume of the clear filtrate using Method 7.
l6 SC H O O N O V E R, W. R. EXAMINATION OF SOILS FOR ALKALI.UniversTty of California Extension Service, Berkeley, California.1952. (Mimeographed.)

SALINE AND ALKALI SOILS 105
Calculations
Gypsum requirement, meq./lOO gm.= (Ca cont. ofadded gypsum solution in meq./l.- Cai-Mg cont. offiltrate in meq./l.) X 2.
(23) Alkaline-Earth Carbonates (Lime)
(23a) Alkaline-Earth Carbonates by Efer-vescence With Acid
Reagent ’
A. Hydrochloric acid, 3N ( 1 + 3).
Procedure
Place several grams of soil on a small watchglass.By means of a pipet add sufficient water to saturate thesoil. This displaces most of the soil air so that its lossupon the addition of acid will not be confused witheffervescence of lime. Add a few drops of reagent A tothe soil and note any effervescence that occurs. Thesoil may be termed slightly, moderately, or highlycalcareous in accordance with the degree of efferves-cence obtained.
(23b) Alkaline-Earth Carbonates by Grav-imetric Loss of Carbon Dioxide
Reagent
A. Hydrochloric acid, 3 N (1 + 3).
Procedure
Pipet 10 ml. of reagent A into a SO-ml. Erlenmeyerflask, stopper with a cork, and weigh. Transfer a l-to lo-gm. sample of soil containing 0.1 to 0.3 gm. ofcalcium carbonate to the flask, a little at a time, so asto prevent excessive frothing. After effervescence haslargely subsided, replace the stopper loosely and swirlthe flask. Let stand with occasional swirling until theweight of the flask and contents does not change morethan 2 or 3 mg. during a 30-min. period. The reactionis usually complete within 2 hours. Prior to weighing,displace any accumulated carbon dioxide gas in theflask with air. This is important and may be done byswirling with the stopper removed for 10 to 20 sec.
Calculations
Weight of CO, lost= (initial wt. of flask+ acid +soil) - (final wt. of flask + acid + soil).
CaCO, equivalent in percent= (wt. of CO, lost X227.4) /wt. of soil sample.
Remarks
The accuracy of this method depends to a large ex-tent upon the sensitivity of the balance used for weigh-ing. Using a torsion-type balance capable of detectingweight differences of 2 to 3 mg., the relative error isabout + 10 percent.
i59525 0 - 54 - 8
(23~) Alkaline-Earth Carbonates FromAcid Neutralization
Reagents
A. Hvdrochloric acid, 0.5 N, standardized.B. Sodium hydroxide, 0.25 N, standardized.C. Phenolphthalein, 1 percent in 60 percent ethanol.
Procedure
Place 5 to 25 gm. of soil in a 150-ml. beaker, add 50ml. of reagent A by means of a pipet, cover with awatchglass, and boil gently for 5 min. Cool, filter,and wash all the acid from the soil with water. Deter-mine the amount of unused acid by adding 2 drops of Cand back-titrating with B.
Calculations
CaCO, equivalent in percent= (meq. HCl added -meq. NaOH used) X S/weight of sample in gm.
Remarks
The calculation gives the CaCO, equivalent. Thisis the amount of CaCO, required to react with the acid.This value usually is somewhat high, because soil con-stituents other than lime may react with the acid.
(24) Organic Matter
Apparatus
Erlenmeyer flasks, SOO-ml., thermometer, 200” C.
Reagents
A. Potassium dichromate, 1 N. Dissolve 49.04 gm.of potassium dichromate in water and dilute to 1 liter.
B. Sulfuric acid, cont., containing silver sulfate.Dissolve 25 gm. silver sulfate in a liter of acid.
C. Ferroin indicator (ortho-phenanthroline ferroussulfate, 0.025 M) . Dissolve 14.85 gm. o-phenanthro-line monohydrate and 6.95 gm. ferrous sulfate in waterand dilute to 1 liter.
D. Ferrous sulfate, 0.5 N. Dissolve 140 gm. ofFeSO,*7H,O in water, add 15 ml. of cont. sulfuric acid,cool, and dilute to 1 liter. Standardize this solutiondaily against 10 ml. of reagent A, as directed in theprocedure below.
Procedure
Grind the soil to pass 0.5-mm. screen, avoiding con-tact with iron or steel. Transfer a weighed sample, notexceeding 1.0 gm. and containing from 10 to 25 mg. oforganic carbon, to a SOO-ml. Erlenmeyer flask. Add 10ml. of reagent A followed by 20 ml. of B. Swirl theflask, insert thermometer, and heat gently so as toattain a temperature of 150” C. in a heating period ofabout 1 min. Keep contents of flask in motion in order

106 AGRICULTURE HANDBOOK 60, U. S. DEPT. OF AGRICULTURE
to prevent local overheating, which results in errorcaused by thermal decomposition of dichromate. Afterthe 1.50" temperature is reached, place the flask on anasbestos pad, and allow to cool. Add 200 ml. of waterand 4 or 5 drops of C. Titrate with D until the colorchanges from green to red.
Since some soils adsorb o-phenanthroline indicator,the titration may be improved by a prior filtration,using a rapid filter paper on a Buechner funnel. Ifmore than 80 percent of the dichromate solution isreduced, the determination should be repeated withless soil.
Calculations
Organic carbon in percent= (meq. of K,Cr,O,added- meq. of FeSO, used) X 0.336/wt. of samplein gm.
Organic matter in percent=organic carbon in per-cent X 1.72.
Remarks
This modification of Walkley’s rapid method (1935,1947) for the determination of organic carbon in soilshas been found to give approximately 89 percent re-covery of carbon, as compared to the dry-combustionmethod. The conversion factor 0.336 was obtained bydividing 0.003, the milliequivalent weight of carbon, by89 and multiplying by 100 to convert to percent.Chloride interference is eliminated by the addition ofthe silver sulfate to the digesting acid as indicated.Nitrates up to 5 percent and carbonates up to 50 percentdo not interfere.
References
Walkley (1935,1947).
(25) Total and External Ethylene GlycolRetention
Apparatus
Vacuum pump, Central Scientific Company Hyvacor equivalent.
Vacuum desiccators, inside diameter 250 mm., withexternal sleeve or glass stopcock and porcelain plates.
Muffle furnace with automatic temperature control.Aluminum moisture boxes, 2?/2 in. in diameter and
aj in. high, with lids.
Reagents
A. Hydrogen peroxide, 10 percent solution.B. Anhydrous calcium chloride, 8 or 12 mesh,
technical.C. Phosphorus pentoxide.D. Ethylene glycol (Eastman). Redistill under re-
duced pressure, discarding the first and last 10 percentof the distillate.
Procedure
Soil preparation. Grind the soil sample to pass a60-mesh sieve. The increase in surface area broughtabout by this degree of grinding is negligible. Treatapproximately 10 gm. of the sieved soil with reagent Afor the removal of organic matter (see Method 41).Transfer the treated soil to a 5- to 8-cm. diameter Buech-ner funnel fitted with filter paper and leach with severalsmall portions of distilled water, using suction. Allowthe soil to air-dry, then pass through a 60-mesh sieve.
Total ethylene glycol retention. Weigh 2.10 gm. ofthe 60-mesh soil into an aluminum moisture box. Thetare weight of the box and its lid should be known.Spread the soil evenly over the bottom of the box.Place the box in vacuum desiccator over about 250 gm.of reagent C, apply vacuum by means of a Hyvac orequivalent pump, and dry the soil to constant weight.This usually requires 5 to 6 hours. Determine theweight of vacuum-dried soil. By means of a pipet,having a tip drawn to a fine point, distribute 1 ml. of Ddropwise over the soil surface. Place the box in asecond vacuum desiccator over 250 gm. of B and allowto stand overnight to obtain uniform wetting of the soil.Connect the desiccator to a Hyvac pump and evacuateat a temperature of 25t2” C. until excess ethyleneglycol is removed from the soil. Depending upon thetemperature and vacuum conditions attained, thisusually requires from 5 to 7 hours when 8 samples arepresent in a desiccator. In practice, the box is weighedafter 5 hours in the vacuum desiccator and at intervalsof 1 hour thereafter until the loss of weight per hourinterval is less than 3 or 4 percent of the weight ofethylene glycol remaining on the soil. The next to thelast weight taken is used to calculate ethylene glycolretained.
External ethylene glycol retention. Weigh exactly2.10 gm. of the 60-mesh soil into an aluminum moisturebox. Spread the soil evenly over the bottom of thebox and heat at a temperature of 600+ 15” C. for 2hours in a muffle furnace having automatic temperaturecontrol. Remove the box, cover, cool in a desiccatorcontaining reagent B, and weigh. Apply 1 ml. of Dto the soil, let stand overnight, and remove the excessethylene glycol by evaporation in vacuum as describedpreviously for the determination of total ethyleneglycol retention.
Calculations
Assuming that 3.1 X 1O-4 gm. of ethylene glycol arerequired for the formation of a monolayer on 1 sq. m.of surface, as indicated by Dyal and Hendricks (1950))the formulas for calculation of total, external, andinternal surface areas are as follows:
Total surface area, m.‘/gm.=wt. of ethylene glycolretained by unheated soil, gm./(wt. of vacuum-driedunheated soil, gm. X 0.00031).
External surface area, m.2/gm.=wt. of ethyleneglycol retained by heated soil, gm./( wt. of vacuum-dried unheated soil, gm. X 0.00031).

SALINE AND ALKALI SOILS
Internal surface area= (total surface area) - (ex-ternal surface area).
Remarks
The Hyvac pump and desiccators are connected bymeans of tight-fitting vacuum rubber tubing. A glasstube filled with reagent B is inserted in the vacuum lineto prevent undesirable vapors from entering thepump. The tube also permits the introduction of dryair into the desiccators to release the vacuum. High-vacuum stopcock lubricant should be used to seal theglass joints.
The adequacy of the vacuum system for removingexcess ethylene glycol can be checked by determiningthe rate of evaporation of this liquid from a free sur-face. The average rate of evaporation over a 5-hourperiod from an aluminum moisture box of the sizespecified above and containing ethylene glycol shouldbe at least 1 gm. per hour.
For greatest accuracy in the determination of internalsurface area, removal of excess ethylene glycol fromheated and unheated soil should be performed concur-rently. Four unheated and the corresponding 4 heatedsamples are ordinarily placed together in a desiccator.The occasional inclusion of a standard sample havinga known retention value serves as a useful control onprocedure.
The anhydrous calcium chloride placed in the desic-cator to absorb ethylene glycol should be renewed aftereach set of 8 determinations. The phosphorus pent-oxide used for drying under vacuum may be used untilit absorbs sufficient water to develop a syrupyconsistency.
References
Bower and Gschwend (1952)) Dyal and Hendricks(1950,1952).
Soil Water
(26) Soil-Moisture Content
Procedure
Transfer a representative subsample of the soil to atared can with lid. For accuracy, it is desirable wherepossible to use at least a 25-gm. sample. Weigh, dryto constant weight at 105” C., and weigh again.
Calculations
Moisture content in percent, P, = (loss in weight ondrying) X 100,’ (weight of the oven-dry soil).
(27) Saturation Percentage
107
Percentage From Oven-(27a) SaturationDrying
Procedure
Transfer a portion of the saturated soil paste, pre-pared according to Method 2, to a tared soil can withlid. Determine the moisture content by Method 26.
Calculations
Saturation percentage (SP) = (loss in weight on dry-ing) X lOO/( weight of the oven-dry soil).
(27b) Saturation Percentage From Vol-ume of Water Added
Remarks
When the air-dry moisture content of the sample isknown, as it usually is when exchangeable-cation analy-ses are made, the saturation percentage can be de-termined as follows:
Procedure
Transfer a known weight of air-dry soil to a mixingcup. Add distilled water from a buret or graduatedcylinder with stirring until the soil is saturated asdescribed in Method 2. Record the volume of wateradded.
Calculations
Weight of oven-dry soil= (weight of air-dry soil) X100,’ (100 + air-dry moisture percentage).
Total water = (water added) -t- (water in air-dry soil)= (weight of water added) + (weight of air-dry soil) -(weight of oven-dry soil).
SF’= 100 X (total weight of water) /(weight of oven-dry soil).
(27~) Saturation Percentage From theWeight of a Known Volume ofPaste
Remarks
By this method, the saturation percentage is calcu-lated from the weight of a known volume of saturatedsoil paste. It is assumed that the soil particles have adensity of 2.65 gm./cm.“, and that the liquid phase hasa denscity of 1.00 gm./cm.“.
Apparatus
Balance, accurate to 0.1 gm.A cup of known volume. This measurement can be
combined with the soil-paste resistance measurement

108 AGRICULTURE HANDBOOK 60, U. S. DEPT. OF AGRICULTURE
using the same loading of the Bureau of Soils electrodecup.
Procedure
Determine the volume and weight of the cup. Fillthe cup with saturated soil paste, jarring it during fillingto exclude air, and strike off level with the top. Weighand subtract the cup weight to get the net weight of thepaste.
Calculations
Sp= 100 (2.65Y-- FY)2.65( V- V)
where SP=saturation percentage ; Y = volume ofsaturated soil paste, in cm. 3, = a constant; and W= netweight of V cm.3 of saturated soil paste, gm. Calcula-tions are simplified by the use of a table or graph relat-ing values of W and SP for a given value of V.
Reference
Wilcox (1951).
(28) Infiltration Rate
Remarks
Infiltration rate (infiltration capacity) is the rateof water entry into the soil where water covers thesurface at a shallow depth and downward flow intoand through the soil is nondivergent. The latter condi-tion is satisfied by rainfall or if the ponded area isinfinitely large. For practical purposes, the subsidencerate of the free-water surface in a large basin is takenas a measure of the infiltration rate. The effect ofdivergent flow increases as the ponded area decreases.If small basins or cylinders are used, it is difficult todetermine the true infiltration rate. For soils in whichpermeability increases with depth, errors from flowdivergence may be negligible; but, if the permeabilitydecreases with depth, the effect of flow divergence maybe considerable. Flow divergence that occurs withsmall plots or cylinders may be minimized by pondingwater in a guard ring or border area around the plot orcylinder.
If infiltration measurements are made under condi-tions where divergent flow may not be negligible, thewater-intake rate should be reported as infiltrationvelocity and accompanied by a description of themeasuring method.
Under some conditions the evaporation rate may notbe negligible and must be taken into account in infiltra-tion measurements. In small basins or where cylindersare used, evaporation may be minimized by coveringthe water surface with a film of oil.
There is no single method best suited to all field con-ditions. Experience and judgment are required in ob-taining and evaluating infiltration measurements.(See discussion in chapter 2.)
(28a) Basin
Apparatus
Gage for measuring water elevation, and watch.
Procedure
Pond water on an area of soil enclosed by dikes orridges. Measure the rate of subsidence of the watersurface with a staff gage (a linear scale standing in thewater), hook gage, or water-stage recorder.
The infiltration rate will depend on the time anddepth of water that has entered the soil.
Calculations
A curve showing the depth of water that has enteredthe soil as a function of time can be plotted from thewater elevation -and time readings or taken from awater-stage recorder. Average or instantaneous valuesof the infiltration rate can be taken from this curve,depending on the purpose of the measurement. Ex-press infiltration rate in centimeters per hour or ininches per hour.
(28b) Cylinder
Apparatus
Cylinders 11 to 14 in. in diameter and 16 in. long.The cylinders can be rolled from 16.gage sheet iron.Butt-weld and grind the weld smooth. Reinforce theupper end with l/&in. by l-in. iron strip, welded tocylinder. Galvanize cylinders after fabrication. Forease in transportation, cylinders can be made withdifferent diameters so that they will fit, one withinanother.
Circular driving cap and hammer. Torch-cut thedriving cap from l/&in. steel plate and screw in a l/z-in.central rod to serve as the hammer guide. The hammercan consist of a 50- to 80-lb. block of iron. This shouldhave a central pipe to slide on the guide rod of the cap.Attach crosshandles to the pipe.
Hook gage or staff gage, watch, thin metal tamp,splash guard of rubber sheet or burlap, field sourceof water.
Procedure
Drive the cylinders into the soil to a depth of 6 or 8in. Alternatively, the cylinders can be jacked into thesoil, if a heavy tractor or truck is available. Careshould be exercised to keep the sides of the cylindervertical and to avoid disturbance of the s.oil columnwithin the cylinder. Tamp soil into the space betweenthe soil column and the cylinder. If this space is greaterthan l/s in., the cylinder should be reset. Cover thesoil with a splash guard and apply 4 to 6 in. of water.Record the elevation of the water surface and the timeat convenient intervals. A staff gage is often satisfac-

SALINE AND
tory, but a hook gage should be used if the subsidencerate is low. Several adjacent cylinders are usuallyinstalled. These need not be carefully leveled if amark is placed on each cylinder for locating the base ofthe hook gage.
While the wetting front is in the cylinder, the water-subsidence rate corresponds to the infiltration rate.When the wetting front passes below the cylinder, moreor less divergence of flow will occur and the subsidencerate then should be designated as intake rate or infil-tration velocity. Divergent flow is minimized by in-stalling cylinders in plots or within larger diameterrings in which the soil is kept flooded.
Where desired, water-entry rates into subsurface soillayers can be measured by excavating to the desireddepth before setting the cylinders.
Calculations
Express infiltration rate and infiltration velocity incentimeters per hour or in inches per hour, using valuesaveraged over time intervals appropriate to the purposesof the measurement.
(29) l/10-Atmosphere Percentage
Apparatus
Pressure-plate apparatus. Retainer rings approxi-mately 1 cm. high and 6 cm. in diameter to hold at least25-gm. samples. Balance, drying oven, and moistureboxes.
Remarks
Install the pressure plates to be used for the test ina pressure cooker, fill the cooker with water, fastenthe lid on the cooker, and measure the rate of outflowof water from the ceramic plates at a pressure of 15lb. *irK2. This rate should be about 1 cc. per cm.2 perhr. per atm. pressure difference or greater for satis-factory operation of the porous plates. Next checkthe pressure plates for entry value as follows: releasethe air pressure, empty excess water from the cookerpot and the plates, close the cooker pot, and apply apressure of 1/ atm. or other appropriate value. Aftera few minutes, the outflow of water from the plate out-lets will cease and there should be no bubbling of airfrom these outlets, thus indicating that the entry valuesfor the plates are above the value of the pressureapplied to the pressure cooker. At the conclusion ofthe entry-value test, submerge the pressure cooker inwater while the pressure is on or make other equivalenttests to make sure that there are no air leaks at thecooker gasket or attendant connections. Air leaksfrom the cooker cause troubles with air-pressure con-trol and may also cause serious errors in retentivitydeterminations through direct loss of water vapor fromthe soil samples.
ALKALI SOILS
Procedure
109
Prepare duplicate 25-gm. samples that have beenpassed through a 2-mm. round-hole sieve, using thesubsampling procedure outlined in Method 1. Placethe sample retainer rings on the porous plate. In orderto avoid particle-size segregation, dump all of the soilsample from each container into a ring and level.Allow the samples to stand at least 16 hours with anexcess of water on the plate. Close the pressure cookerand apply a pressure of 100 cm. of water. Samples1 cm. high can be removed any time after 48 hours frominitiating the extraction or when readings on a buretindicate that outflow has ceased from all of the sampleson each plate. Some soils will approach equilibriumin 18 to 20 hours. Before releasing the air pressure inthe pressure cooker, put a pinch clamp on the outflowtube for each plate. This prevents backflow of waterto the samples after the pressure is released. To avoidchanges in the moisture content of the samples, trans-fer the samples quickly to moisture boxes. Determinethe moisture content by drying to constant weight at105” C. Express the moisture content as percent, dry-weight basis.
References
Richards and Weaver (1944)) and Richards(1949b).
(30) 1/-Atmosphere Percentage
Apparatus
Same as in Method 29.
Procedure
Same as in Method 29, except that the extractionpressure is 345 cm. of water.
( 3 1) 1SAtmosphere Percentage
Apparatus
Pressure-membrane apparatus with sausage-casingmembrane. Rubber soil-retaining rings 1 cm. high andapproximately 6 cm. in diameter that hold about 25gm. of soil. B 1a ante, drying oven, and moisture boxes.
Procedure
Prepare duplicate 25-gm. samples that have beenpassed through a 2-mm. round-hole sieve, using the sub-sampling procedure outlined in Method 1. Moisten thecellulose membrane, install in the apparatus, and trimthe edge by running a knife around the brass cylinder.Place the soil-retaining rings on the membrane. Inorder to avoid particle-size segregation, dump all ofthe soil sample from each sample container into one

110 AGRICULTURE HANDBOOK 60, U. S. DEPT. OF AGRICULTURE
waxed naner. and allow the samoles to stand at-least 16
ring.in theLevel
Pouring out part of the sample and leaving partcontainer will give a nonrepresentative sample.the sample in the ring, cover with a square of
hours witlh an excess of water &r the membrane. Re-move excess water from the membrane with a pipet orrubber syringe, close the pressure-membrane appara-tus and admit air to the soil chamber at a pressure of 15atm. (220 lbs. in.m2).
After a few hours, there is a marked decrease in therate of water outflow from the soil, the outflow ratethen being limited mainly by the low capillary conduc-tivity of the soil rather than the low membrane per-meability. At this time, the soil samples have sufficientrigidity to resist plastic flow and compaction and so a4 lb. in.w2 pressure differential may be applied to therubber diaphragm at the top of the soil chamber. Thisdiaphragm action holds the sample firmly in contactwith the membrane and considerably hastens moistureextraction for fine-textured soils that shrink appreci-ably. Th d’ he rap ragm is unnecessary for medium- andcoarse-textured soils.
Remove the samples any time after 48 hours from thecommencement of the extraction or when the readingson an outflow buret indicate equilibrium has beenattained. Most soils will approach hydraulic equili-brium with the membrane in 18 to 20 hours, but somesoils may require a considerably longer time. In orderto avoid changes in the moisture content, transfer thesamples to moisture boxes as soon as possible afterreleasing the extraction pressure. Determine the mois-ture content by drying to constant weight at 105” C.Express moisture content as percent, dry-weight basis.
Remarks
Care must be taken to keep soil away from the lowergasket of the cell. Otherwise, gasket flow that occurswhen the cell is closed may press sand particles into themembrane and cause leaks.
References
Richards (1947), Richards and Weaver (1944).
(32) Moisture-Retention Curve
Each sample, with disturbed or undisturbed struc-ture, is contained in a retainer consisting of a brasscylinder, a plastic lid, and a porous ceramic bottomplate, all held together with rubber bands. Variousmoisture equilibria and weighings are thus made pos-sible with a minimum of disturbance to the sample.
Apparatus
Pressure-plate apparatus, pressure-membrane appa-ratus, balance, drying oven, large straight-edged carv-ing knife, and aluminum moisture boxes with lids, 31/zin. diameter by 2 in. high.
Soil sampling tube with retainer cylinders cut frombrass tubing 21/, in. outside diameter by 19-gage wall.The core retainer cylinders are 3 cm. high, and whilein the sampling tube have guard rings 1 cm. high ateach end. (See drawing of apparatus in the Appendix.)
Plastic and ceramic disks serve as lids and bottomsfor the core retainer. The lids are cut from l/g in.transparent plastic sheet and are 21/ in. in diameter.The ceramic disks are 21/k in. in diameter by 3/ls in.thick, with a peripheral groove to attach two hooksformed from twisted wire at points on the disk 180’apart. The porous ceramic body should be like thatused for tensiometer cups. The entry value should begreater than 1 atm., and the hydraulic conductivityshould be equal to or greater than 8 X lo-” cm./hr.
A layer of cheesecloth and sieved soil make capillarycontact between the retainers and the control mem-branes. The ch eesecloth should be treated with a bac-tericide such as Dowicide No. 4. The fraction of a loamsoil that passes a 60-mesh screen makes a good capillarycontact medium.
A complete core-retainer set consists of a moisturebox with lid, a brass cylinder, a plastic lid, two strongrubber bands, and a ceramic plate. All of the parts ina retainer set should bear the same identifying number.The tare weight of each retainer set with the ceramicdisk saturated with water should be determined andrecorded.
Procedure
Take the cores with the sampling tube when the soilis moist. Remove the l-cm. guard rings from eitherend of the 3-cm. retainer cylinder. Roughly trim thecores in the field and transport to the laboratory inthe aluminum moisture boxes. Trim the cores accu-rately in the laboratory with the carving knife. Fastenthe plastic lids and ceramic plates to the brass cylindersby stretching the rubber bands across the lids andattaching the bands to the hooks at the opposite edgesof the ceramic plates.
Place the core retainers on a porous brick with afree water surface 1 or 2 mm. below the surface of thebrick. After 24 hours, wipe the excess water from theretainers, place each in its moisture box, and weigh.Replace the retainers on the brick with the water sur-face set for 10 cm. After 24 hours, weigh again.These two weighings will not represent equilibriumvalues, but high precision is usually not required at0 and 10 cm. of suction. Prepare the pressure-plateapparatus as indicated in Method 29. Spread approx-imately a 3-mm. layer of screened loam soil on thepressure plate and cover with a single layer of treatedcheesecloth. Moisten the soil and cloth with water andset the retainers firmly in contact. Close the pressurecooker and adjust the pressure for the next suctionvalue.
Follow the approach to hydraulic equilibrium ateach pressure by connecting the outflow tube from eachplate or membrane to the lower end of a buret andrecording the buret readings occasionally. When

SALINE AND ALKALI SOILS 111
equilibrium is attained, clamp off the outflow tubesand release the air pressure in the cooker or membranecell. Lift the core retainers from the membrane, brushoff any adhering soil, place each in its numbered mois-ture box, and weigh. For a retention curve, weighingscan be made at tensions of 0, 10,30,100, and 345 cm.of water and 1, 3, and 15 atm. Other suction valuescan be used, depending on the information desired.
The porous-ceramic retainers used at the Laboratoryhave an entry value of 1 atm. and do not change ap-preciably in moisture content at suction values up to3 atm. Therefore, the gross tare for a core-retainerset is the same for all weighings at suction values upto and including 3 atm. At the 15-atmosphere equi-librium, the ceramic retainer is removed before theweighing, and a correspondingly different tare weightis used. Determine the weight of the soil core whenoven-dried at 105” C.
Calculations
Determine the volume of the core retainer and calcu-late the bulk density of the soil in the core. From thegross weights at each suction, the tare weights, andthe known weight of soil, calculate both the mass ofwater and the volume of water (numerically the samewhen c. g. s. units are used) in the core at each suctionvalue. From the foregoing data, calculate the gramsof water per 100 gm. of dry soil and the cubic centi-meters of water per 100 cm.3 of soil at each suctionvalue. The latter may be taken as the depth percentage,i. e., the depth of free water per 100 units of depth ofsoil. Plot these values on linear coordinates withmoisture retention as the dependent variable, andsuction or soil-moisture tension as the independentvariable.
References
Richards (1947, 1948, 1949b, 1952).
(33) Field-Moisture Range
Remarks
Plants can grow in soil over a range of moisturecontents referred to as the available range. The prac-tical upper boundary for this range, sometimes referredto as field capacity, is characteristic of the field situa-tion, and the best method for its determination is basedon field sampling. The determination should be madeafter the soil has been wetted and the rate of down-ward drainage has decreased, but before appreciablemoisture is lost from the profile by evaporation androot extraction. This determination loses significanceor requires special interpretation if drainage is re-stricted or if a water table is close to the soil surface.
Apparatus
Soil tube or soil auger, watertight moisture boxes,balance, and drying oven.
Procedure
One to 3 davs after the soil proIfile is thoroughlywetted with rain or irrigation water, take samples byhorizons, by textural layers, or at l-foot-depth inter-vals throughout the wetted zone. Determine the mois-ture content of the samples by drying to constant weightat 105” C. Express the results as moisture percentage,dry-weight basis, or as depth percentage if the bulkdensity can be determined. The available range forthe soil at any given depth is then found by subtractingthe 15-atm. percentage from the field determination ofthe upper limit of available water. The available rangecan be expressed either as a dry-weight percentage or asa depth percentage.
(34) Hydraulic Conductivity
(34a) Hydraulic Conductivity of SoilCores
Thin-walled cylinders or cans may be pressed intothe soil in the field to obtain samples of soil of sub-stantially undisturbed structure. More often, soil coresare obtained in metal sleeves that fit into a samplingtube, and, after the samples have been taken, the sleevesserve as the core retainers. Power-driven machines areavailable for taking undisturbed cores of 4- and 6-in.diameter. S UCh cores are encas.ed in the field for trans-portation and subsequent water-flow measurements.Various casing methods have been used, such as paint-ing the core with wax or plastic cement before andafter wrapping in cloth.
Procedure
In the laboratory. the cores are mounted verticallyand supported on a porous outflow surface such assand or filter paper and metal screen. A shallow depthof water is usually maintained over the soil surface bya siphon tube from a constant-level reservoir. Flowtests should be conducted with water of the same qualityas that which occurs in the field. If discharge ratesare low, care must be taken to avoid errors arisingfrom evaporation of the percolate. If possible, flowtests should be conducted at or near constant tern- .perature.
Where desirable, especially for long cores, manom-eters can be attached at various points along the core.These should be installed at transition zones betweenhorizons or at textural discontinuities.
Calculations
Water flowtion :
takes place in accordance with the equa-
t .AL
where Q is the volume of water passing through thecore in time (t) , A is the area of the core, and k is theaverage hydraulic conductivity in the soil interval

112 AGRICULTURE HANDBOOK 60, U. S. DEPT. OF AGRICULTURE
(AL), over which there is a hydraulic head differenceof AH. Solving for k gives k=QilL/AtnH. Hy-draulic conductivity (k) will be in centimeters per hourif t is expressed in hours, Q in cm.3, A in cm.2, and AHand AL are both in the same units.
References
Bower and Peterson (1950)) Kelley and coworkers(1948), Marsh and Swarner (1949)) and Richards(1952).
(34b) Hydraulic Conductivity of Dis-turbed Soil
Apparatus
Soil containers are made from 20-gage seamless brasstubing, 3 in. outside diameter, and 4 in. in length.The bottoms of the containers are machined from 20-gage brass sheet and are soldered into a recess orcounterbore in the cylinders. The central outflowtubes are 2 in. long, are cut from l/z in. outside diame-ter by 20-gage brass tubing, and are attached withsolder.
Supports for soil and filter paper consist of circlesof 20-mesh or coarser bronze screen cut so as to fitloosely on the inside of the soil container.
Packing block is made from a heavy wooden blockapproximately 4 by 4 by 8 in. A hole is made in theblock to accommodate the outflow tube of the soil con-tainer, and guide rods are mounted in the block to keepthe cylinder vertical and to insure square impacts.One rod is cut 2.5 cm. above the cylinder so that afinger placed over this rod gives a convenient index ofheight for the packing process.
Sharkskin filter paper, rack for supporting a numberof soil containers, constant-level water supply, siphontubes to connect soil containers to water supply, gradu-ated cylinders, 2-mm. round-hole sieve, soil grinder,and mixing cloth.
Procedure
Air-dry the soil and pass it through a 2mm. round-hole screen. A power grinder may be used for hardsoils, but the grinding process must be standardized,wit.h the plates set to reduce only the larger particles.Obtain representative 200-gm. subsamples in accord-ance with Method 1. Dump the entire subsample in onemotion into the soil container that has’ been fitted witha screen and filter paper. This method of transferringthe soil is used to prevent particle-size segregation.The cylinder containing the soil is dropped 20 timesthrough a distance of 2.5 cm. onto the packing block.Place a filter paper on the soil surface and introducewater into the container with a minimum of soil dis-turbance. Record the time of application of water and,if possible, the time of the initial outflow. Collect thepercolate in a suitable receptacle and measure thevolume at convenient time intervals. Tests ordinarilyare run until the volume of water that has passed
through the soil corresponds to approximately 12 cm.of depth of water on the soil surface. Calculate hy-draulic conductivity and plot against accumulatedequivalent depth of percolate. With soils having ex-tremely low percolation rates, an attempt should bemade to obtain at least one flow measurement, andtime rather than depth of water is used to determinewhen to discontinue tests on such soils.
Remarks
While, according to theory, neither the diameter northe height of the soil column to be tested needs to bewithin prescribed limits, it has been found that withmany soils satisfactory results are not obtained unlessthe height is less than the diameter of the soil column.This is particularly important if the soil swells ap-preciably on wetting. Experience indicates that thecylinder should have at least a 7.5~cm. diameter for a5-cm. depth of soil.
Hydraulic-conductivity measurements should bemade in the temperature range from 65” to 75” F. (18”to 24” C.) . For th e most part, the effect of tempera-ture on hydraulic conductivity in this range is smallcompared with effects arising from such factors asquality of the water and the base status and salinity ofthe soil. The standard temperature for laboratory de-termination of hydraulic conductivity is usually takenas 68” F. (20” C.) . Corrections for viscosity effectson measurements at temperatures other than 68’ F.can readily be calculated, but it has been observed thattemperature has other and not always predictable ef-fects upon the hydraulic conductivity of soils in addi-tion to those arising from viscosity.
The hydraulic gradient is usually set in the rangefrom 1 to 4, although values as high as 10 do not seemto affect the results significantly.
In general the water that will be used on the soil inthe field should be used for the laboratory determina-tions, because small changes in water quality can pro-duce large changes in rate of moisture movement.
Measurements are usually made in triplicate. Thesamples are discarded and the test repeated if the rangeof values is greater than 50 percent of the meanhydraulic-conductivity value. Between soils or treat-ments, average differences in conductivity of less than15 or 20 percent are not considered significant.
Calculations
Water flow takes place in accordance with theequation :
Q__ AHt-kAm
where Q is the volume of water passing through thematerial in time (t) ; A is the area of the soil column,and k is the average hydraulic conductivity in the soilinterval ( AL) over which there is a hydraulic-headdifference ( AH). Solving for hydraulic conductivity:
1 OALkr_-‘---
tAilH

SALINE AND
It should be noted that AH must be measured fromthe surface of water standing on the soil to the eleva-tion at which water will stand during the flow test in ariser or manometer connected at the bottom of the soilcolumn. For experimental setups sometimes used, thiselevation may be quite different from the elevation ofthe bottom of the soil column. The length of the soilcolumn AL should be measured during or after waterflow and not when the soil is dry.
References
Christiansen (1947)) Fireman (1944)) and Richards(1952).
(34~) Hydraulic Conductivity From Pie-zometer Measurements
Equipment
The piezometer pipe may be of any convenient diam-eter. The length will be governed by the depth atwhich measurements are to be made. The wall thick-ness should be as thin as practical to minimize soildisturbance during installation. Thin-walled electricalconduit, 1 to 2 in. inside diameter, has been found suit-able for hydraulic-conductivity measurements at depthsup to 10 ft. Other pieces of equipment needed for thismeasurement are: a screw-type soil auger having afree-fit inside the piezometer pipe; a hammer, such as isused for soil tubes or for steel fence posts, may be usedfor driving the pipe; a pump, such as a hand-operatedpitcher pump, with a flexible hose attached to the inletis needed to remove water and sediment from the pipeand the soil cavity; an electrical sounder is convenientfor measuring the depth to the water surface withinthe pipe (see Method 35a) ; an ordinary watch is satis-factory for measuring time, except, if the rate of riseis rapid, two stop watches may be required to obtaina continuous rate-of-rise record; a soil-tube jack orother tube puller is useful in recovering the piezometerpipe.
Remarks
Hydraulic-conductivity measurements by this methodare limited to soils below a water table. An augerhole is cased with a length of pipe and a cylindricalcavity is formed at the lower end of the pipe. Groundwater flows into the cavity when water is pumped fromthe pipe, and the rate at which the water level rises inthe pipe is a measure of hydraulic conductivity. Al-though the development of the equation is based uponan idealized condition of homogenous isotropic soil,this method may be used for determining the hydraulicconductivity of nonuniform soils and of individual soillayers. I fn ormation regarding water-table level andnature and position of subsoil layers should be availableprior to installation of piezometer pipes to assist indetermining proper placement of pipes and construc-tion of cavities. For most purposes, the extremities
ALKALI SOILS 113
of the cavity should not be closer than one cavity lengthfrom either the top or bottom of the particular soillayer for which the determination is made.
This method is applicable only where a cavity ofknown shape can be maintained throughout the test.In many fine-textured soils, cavities will stand withoutsupport, but in sands and other noncohesive materialsa supporting porous structure may be required.
Procedure
Remove grass sod or debris from the soil surfaceand install the pipe to any desired depth by alternatelyaugering and driving. Auger to a depth of 6 to 12 in.below the end of the pipe from within the pipe, thendrive or push the pipe to the bottom of the drilledhole. This is done to minimize soil disturbance as thepipe is driven. When the pipe has been installed to thedesired depth, auger out a cavity below the pipe. Cavitylengths of 4 to 8 in. have been found convenient,with pipes 1 and 2 in. in diameter. The length of cavitycan be accurately controlled by use of a screw clampon the auger handle. The cavity should be formedwith a minimum of disturbance to the surroundingsoil.
Remove seepage water and sediment from the cavityby pumping several times. Measure the depth to thewater in the pipe after allowing enough time for thewater to rise in the pipe to the equilibrium level. Inhighly permeable soils the equilibrium level may be at-tained in a few minutes; in some fine-textured soilsseveral days may be required. Pump the water fromthe pipe and measure the rate at which ground waterrises in the pipe. The rate of rise should be measuredas soon as practicable after pumping, s.ince, it is as-sumed, in the development of the theory, that the draw-down of the water table is negligible. Rate of rise maybe measured at any point between the water-table leveland the lower end of the pipe, but measurements nearthe equilibrium level should be avoided. The riseincrement should be selected to give convenient andmeasurable time intervals.
If hydraulic-conductivity determinations are desiredat several depths, measurements can be made with thesame pipe by successively augering to a greater depthfollowing each determination. _
Calculations
Hydraulic conductivity iequation given by Kirkham
k=2.30 7r R2A (t2-41)
calculated by use of the(1946) as follows:
where k is hydraulic conductivity; R is the radius oftube ; A is a geometrical factor (the A-function) , whichmay be read from figure 28; h, is the distance from thewater table to the water level in pipe at time tl; h2 isthe distance from the water table to the water level inpipe at time t,; t2- tl is the time interval for water torise from h, to h,. Hydraulic conductivity (k) will be

AGRICULTURE HANDBOOK 60, U. S. DEPT. OF AGRICULTURE114
7 5r’0
850i:
g25IL
fr0 . I I
2.5 5 7.5DIAMETER OF CAVITY - CM.
CAVITY 2.5 CM. DIAMETER
I I 1 I2.5 5 7.5 10
LENGTH OF CAVITY - CM.
FIGURE 28.-Relation of the A-function to the length and diameter of the cavity for the piezometer method of measuring hydraulicconductivity. (R de rawn from Luthin and Kirkham, 1949.)
in centimeters per hour if R and A are in centimeters;h, and h, are both in the same units, and (tz - tl) inhours. However, any consistent system of units may beused. For values of the A-function not shown in theillustrations see Luthin and Kirkham (1949).
The hydraulic conductivity can also be calculatedfrom an approximate equation that eliminates the useof logarithms. The constant inflow-rate equation ofKirkham (1946)) slightly modified, is as follows:
k= rR” +&A @C-G) h,,
where Ah is the increment of rise of the water level inthe pipe in time t2 - tl; h,, is the average head, i. e.,ha,= (h,+h,)/2; and the other terms are as previouslydefined.
This approximate equation is sufficiently accuratefor the usual values of Ah and h,, and may be used tosimplify calculations. The error introduced by usingthis equation is small if the ratio Ah/h, is small, butincreases as the ratio increases. The error in k is lessthan 4 percent for ratios of A h/h, < 0.5 and less than10 percent for ratios as large as 0.7.
References
Johnson, Frever t , and Evans (1952), Kirkham( 1946), Luthin and Kirkham (1949)) and Reeve andKirkham (1951).
(3Pd) Hydraulic Conductivity From Au-ger-Hole Measurements
Equipment
Soil auger; any convenient size may be used, but itshould permit making a hole below the water table witha minimum of soil disturbance. Water-level sounder ;an electrical sounder mounted on a frame or tripodis convenient for measuring depth to water in an augerhole. In large-diameter auger holes, water levels can
.
be measured with a rule or tape. A rule attached to afloat provides a convenient means for measuring therate of rise of water in an auger hole.
A hand-operated pitcher pump with a flexible hoseattached to the inlet may be used to pump water andsediment from the auger hole. In addition, a stopwatch is needed for time measurements.
Remarks
This method is limited to measurements in the soilprofile below a water table and is applicable onlywhere a cavity of known shape can be maintainedthroughout the test.
Procedwe
Drill an auger hole to the desired depth below awater table with as little disturbance to the soil aspossible. Insert the pump intake hose to the bottomof the auger hole and empty the cavity several times.This is done to remove suspended sediment and toreopen soil pores in the wall that may have been ’altered by the auger. Measure the depth to water inthe hole when equilibrium with the surrounding groundwater is attained. In highly permeable soils the equi-librium level may be reached in a few minutes; whereas,in some clays several days may be required. Pump thewater from the hole and measure the rate at which thewater rises in the hole while the water level is nearthe bottom of the auger hole or at the time that theauger hole is half full. The rate of rise should bedetermined as soon as practical after the water level ispumped down, since it is assumed in the developmentof the theory that the drawdown of the water table isnegligible. A small rise increment should be used sincethe A-function varies as the hole fills up. The formulagiven below involves this assumption.
Calculations
Hydraulic conductivity is calculated by use of the

SALINE AND ALKALI SOILS 115
equation given by Van Bavel and Kirkham (1949) as increment of rise of the water level in ‘the hole in thefollows : time interval At.
JE= Taz @Hydraulic conductivity (k) will be in centimeters
A (d--h) Atper hour if a, d, h, and A are in centimeters and t is
whe;e k is the hydraulic conductivity; a is the radius ofin hours. However, any consistent system of unitsmay be used.
the auger hole; A is the A-function, a geometrical fac-tor which may be read from figure 29, for the case
In selecting values of the A-function (fig. 29)) in-
where the auger hole is empty and where it is half full;formation on t.he depth (s) to an impermeable layer
d is the depth of auger hole below the water table;below the bottom of the auger hole is required. When
h is the depth of water in the auger hole ; Ah is thean impermeable layer occurs at a depth in the rangefrom s=O to s=d, the A-function should be selected
2 4 0
2 2 0 I’” ---I H O L E H A L F F U L L (h/d=03
2 0 0
180
io 160
z!ii=
sI40
3Ir.I I20
Q
\;‘\- H O L E E M P T Y ( h / d t 0)
‘\‘\\\\\\ \\ 1
100
8 0
6 0
0 .o 4 .O 8 .12 .I6 -20 .24
R A T I O - a / dFIGURE 29.-Relation of the value of the A-function to the ratio a/d, for the auger-hole method of measuring hydraulic conductivity:
a, radius of the hole; d, depth of the hole below the water table; h, depth of water in the hole; S, depth of an impervious layerbelow the bottom of the hole. The A values in the figure are for auger holes having a radius equal to 5 cm.radius (x), multiply the A value read from the figure x/5.
For any other(Redrawn from Van Bavel and Kirkham, 1949.)

116 AGRICULTURE HANDBOOK 60, U. S. DEPT. OF AGRICULTURE
from the curve for the nearest value of s/d. W h e ns/d > 1, use the curve for s/d= 1. The depth(s) to
. an impermeable layer is not a critical factor for theusual values of u/d. See Van Bavel and Kirkham(1949) for discussion of errors involved when, with-out knowledge of the depth to an impermeable layer,arbitrary values of s/d are used.
References
Diserens (1934)) Hooghoudt (1936)) Johnson, Fre-vert, and Evans (1952)) Kirkham and Van Bavel(1949)) Reeve and Kirkham (1951)) and Van Baveland Kirkham (1949).
(35) Hydraulic-Head Measurements inSaturated Soil
(35a) Piezometers Installed by Driving
Equipment
Iron pipe, 3/g in., galvanized or black, cut in 7, 10.5,14 ft., or other lengths as desired; hand-operated driv-ing hammer (Christiansen, 1943) or pneumatic driv-ing hammer (Donnan and Christiansen, 1944) ; rivets,structural iron, 3/s in. in diameter by 1 in.; rivetpunch-out rods (several lengths of l/ in. in diameteriron .pipe with male and female flush connections, orother rods to fit) ; 25 to 50 ft. of semirigid plastictubing, 5/16 in. in diameter; l6 hand-operated bucketpump; 5-gal. water bucket; and carpenter’s level.
After installation it is necessary to measure the depthto water in the piezometer. This can be done with asteel tape or other sounding device. Tapes with a darkoxidized surface show the water-level mark readily, orchalk can be used to make the water mark more visible.
If many readings are to be made, it is worth while toconstruct an electrical water-level sounder. For this,a length of flexible insulated wire is wound on a reelthat has a socket for mounting on the top of the pie-zometer pipe. A straight segment of the wire slightlylonger than 1 ft. should be exposed to view betweenthe reel and the top of the pipe. The lower end of thewire is weighted with metal tubing to keep the wiretaut, and the upper end is grounded to the reel and pipethrough a battery and high-resistance voltmeter. Theinsulated wire is marked at 1-ft. intervals. Fractionsof a foot can be read to the nearest 0.01 ft. from ascale attached to the reel mount. Readings are takenon the first mark on the wire appearing above the topof the pipe when the voltmeter indicates the lower endof the wire is at the water surface.
gresses until pipe reaches the desired depth. Leave pipeextending approximately 1 ft. above ground surface.If hydraulic-head readings are desired at several depthsat a given location, drive pipes of different lengths intothe soil, spacing the pipes laterally with a separationof about 1 ft. Use the carpenter’s level to set the topsof all pipes to the same elevation. This makes it con-venient to record and interpret hydraulic-head read-ings. Pipe lengths up to 16 ft. long can be installedby driving if a stepladder is used. In some soils, thepipe can be pushed into the ground 5 or 6 ft. beforedriving is required so that 21-ft. lengths can sometimesbe used. Insert punch-out rod in pipe and punch riveta distance of 3 to 6 in. out of the end of the pipe.Push the plastic tubing, previously marked with paintor tape to indicate the pipe length, to the bottom ofthe pipe and by pumping water through the tube withthe hand pump, flush out a cavity 3 to 6 in. long belowthe end of the pipe. Soil material and water will re-turn to the surface in the annular space between thetubing and pipe. After the cavity at the base of thepipe is formed, test the piezometer for response rateby filling with water and observing the rate at whichthe water level drops. If the rate of change in thelevel of the water in the pipe is very low, repeat theflushing operation. In sands and gravels, the rate ofdrop may be so rapid that no overflow can be obtainedduring flushing; whereas, in clays the rate of drop maybe so slow that it is hardly noticeable. In any event,the flushing should be repeated without unduly extend-ing the plastic tube below the end of the pipe untilthe rate of change of the water level in the pipe afterfilling is perceptible. The level of the water in thepiezometer should then be allowed to come to equi-librium with the ground water. It is important to makethis test of the responsiveness of each piezometer be-cause the reliability of readings depends directly uponthe readiness with which the water level in the piperesponds to hydraulic-head changes in the ground waterat the bottom of the pipe. Piezometers should be re-tested for responsiveness periodically and reflushed, ifnecessary.
In some soils, the rivet in the end may not be neces-sary. When the piezometer is driven, a soil plug from3 to 12 in. in length may form in the lower end of thepipe, which can be removed by the flushing operation.In many soils, this soil plug can be flushed out inmuch less time than is required to punch out the rivet.
After the piezometers have been installed, flushed,and allowed to come to equilibrium with the groundwater, the depth to water surface from the top of thepipe is measured and recorded.
Procedure
With an iron rivet in lower end of pipe, drive firstlength of pipe into soil. Additional lengths can beadded with standard pipe couplings as driving pro-
‘* Saran tubing, manufactured by the Dow Chemical Co., issuitable for this use and is often locally available at hardwarestores.
Remarks
The hydraulic head of ground water at any givenpoint, i. e., at the bottom of the pipe, is the equilibriumelevation of the surface of the water in the piezometer.This elevation can be referenced to any standard datum.All hydraulic-head readings in a single ground-watersystem or locality should be referenced to the same

SALINE AND
datum, mean sea level being commonly used. Waterelevations at each site can be recorded as read fromthe top of the pipe. The elevations of the top of thepipe’ and the adjacent soil surface are determined bystandard surveying methods.
The hydraulic gradient is the change in hydraulichead per unit distance in the direction of the maximumrate of decrease in head. The vertical component ofthe hydraulic gradient at a site where piezometers havebeen installed at several depths is equal to the differ-ence in the equilibrium elevation of the water surfacein two pipes divided by the difference in the elevationof the cavities at the bottoms of the pipes. This is anaverage value for the vertical component of the hydrau-lic gradient in the depth interval. (See Method 36 forgraphical procedures that are useful in the interpreta-tion of hydraulic-head readings.)
References
Christiansen (1943)) Donnan and Christiansen(1944)) and Richards (1952).
(35b) Piezometers Installed by Jetting
Equipment
Iron pipe, s/$-in. in diameter, galvanized or black,10.5-ft. lengths, threaded at both ends; power-drivenpump, 300 to 600 lb./in.‘, 10 to 15 gal./min. capacitywith a water tank of 300-gal. capacity, truck- or trailer-mounted (an auxiliary 300-gal. water tank, truck-mounted, is also desirable) ; 25 to 50 ft. high-pressurehose, s/a-in. in diameter, with a swivel coupling forattachment to the pipe; driller’s mud; and steel measur-ing tape or electrical sounder.
Procedure
The installation of piezometers by the jetting tech-nique makes use of the eroding and lubricating proper-ties of a stream of water issuing from the end of thepipe for opening a passage into the soil. Piezometersmay be installed by hand or with simple hoisting andhandling equipment, such as has been used in CoachellaValley, California,sociates (1950). D
and described by Reger and as-uring installation, the pipe is oscil-
lated up and down from 1 to 2 ft. to facilitate thejetting. Water and soil material in suspension returnto the surface around the outside of the pipe. Thereturn flow acts as a lubricant for the upward anddownward movement of the pipe and serves as a meansfor logging materials penetrated. An adjustablemeasuring tape used with the Coachella jetting rigserves to indicate depth of penetration to kO.1 ft. Ifthe jetting is done without a rig, the pipe should bemarked at 1-ft. intervals to facilitate logging.
An estimate of texture and consolidation of the ma-terial is made from (a) the nature of the vibrations inthe pipe that are transmitted to the hands of the oper-ator, (b) the rate of downward progress, (c) exami-nation of sediments carried by the effluent, and (d)
ALKALI SOILS 117
observation of color changes of the effluent. Loggingsubsurface layers by this method requires experiencethat can be gained and checked by jetting in profilesfor which data on stratigraphy are available fromindependent logging procedures.
Return flow may be lost and penetration may stop inpermeable sands and gravels. A commercial prepara-tion, Aquagel, a form of driller’s mud, was found byReger and associates (1950) to be effective for main-taining return flow in coarse materials. Approximately10 lb. per 100 gal. of water was sufficient for jettingconditions encountered in the Coachella Valley. It isnecessary to add this preparation to the water supplyslowly and to agitate thoroughly as it is added.
A record of the depth and nature of material pene-trated is kept as the jetting progresses. Where severalhydraulic-head measurements are desired at differentdepths, the deepest pipe is usually installed first. Thelog from the first pipe serves for selecting depths atwhich additional pipes are to be installed. It is oftendesirable to terminate piezometers in sandy lenses toincrease the rate at which they respond to hydraulic-head changes in the soil. Jetting is stopped immedi-ately as each pipe reaches the desired depth, so thatexcessive washing of material from around the pipewill not occur. The material in suspension settles backaround the pipe aiid usually provides a satisfactory seal.Several pipes that terminate in the soil at differentdepths may be installed as close as 1 ft. apart. Experi-ence has shown that, under most conditions, the effectof leakage along the pipe or from one pipe to another isnegligible.
After the piezometers are installed, they are flushed,reference elevations are set, and readings are made asoutlined in Method 35a. (For details of jetting-equip-ment construction, refer to the article by Reger andothers (1950) .)
References
Pillsbury and Christiansen (1947)) Reeve and Jensen(1949)) and Reger and others (1950).
(35~) Observation Wells, Uncased or WithPerforated Casing
Equipment
Soil auger; perforated tubing or pipe; steel tape, orelectrical sounder.
Procedure
It is desired to measure depth to water table. Anuncased auger hole can often be used to measure depthto water table. Where soils are sandy and will notstand or where a more permanent well is desired, anauger hole may be cased with perforated casing. Some-times it is necessary to install the casing during theaugering process.
Water-table observation wells are usually installedto a depth great enough to reach the minimum ex-

.
118 AGRICULTURE HANDBOOK 60, U. S. DEPT. OF AGRICULTURE
petted position of the water table. As a result, observa-tion wells are sometimes installed to considerabledepths and perforated throughout a portion or all of,the underwater length. IJnder many conditions, water-level readings in such wells coincide with the water-table level, but if there is a vertical flow component ofwater in the soil, either upward or downward, water-level readings in an open or perforated casing well maynot represent the true water-table level. Where vertical-flow conditions occur, the water level in a perforatedcased well represents a steady-state flow conditionwithin the well itself, and may not give useful informa-tion. Such a condition is more likely to occur wherean observation well penetrates layers that differ greatlyin permeability. Where such conditions occur or wherethere is any question about water-table readings, hy-draulic-head determinations should be made at severaldepths in the profile by the use of piezometers.
The elevation of the water table can be determinedby a graphical method as follows. Plot the elevationof the terminal points of the piezometers in the soilas a function of the corresponding pressure heads, i. e.,the lengths of the columns of water standing in the pie-zometers. Extrapolate this curve to zero pressure-headto obtain the water-table elevation. Abrupt changes insoil permeability with depth in the vipinity of the watertable complicate the use of this method and make itnecessary to install piezometers at or near the watertable.
(36) Ground-Water Graphical Methods
(36a) Water-Table Contour Maps
Equipment
Drafting instruments and supplies
Procedure
On a scale map of the area being investigated, writein the water-table elevations at locations at which water-table level measurements have been made. By stand-ard mapping procedures used for ground-surface con-tour plotting, i. e., interpolation and extrapolation,draw in lines of equal water-table elevations. Theprinciples that apply in surface contour mapping alsoapply for water-table contours. Where slopes8 changeabruptly, more points are required to locate the con-tours accurately. Conversely, in areas of little changein slope, measurement points may be farther apart. Inareas of rolling or varied topography where watertables in general follow surface slopes, the number of
.data required to construct water-table contours may beprohibitive. A water-table contour line is the locus ofpoints on the water-table surface for which the hydrau-lic head is constant. In a three-dimensional flow sys-tem, such a line represents the intersection ,of an equalhydraulic-head surface with the surface of the watertable.
Water-table contour maps provide direct visual in-formation on the slope of the water table, and it is tobe expected that generally there is a horizontal move-ment of ground water in the direction of slope of thewater table. In the absence of subsurface artesianconditions and if the area1 application of water to thesoil surface is uniform, a region of steep slope of thewater table would be expected to occur where barriersto the horizontal movement of ground water occur orwhere the hydraulic conductance of the soil stratabelow the water table is low. On the other hand, areasof low slope in the ground-water table may indicatethe presence of aquifers that permit the ready transferof ground water in the horizontal direction. Suchinformation is pertinent to the analysis and solution ofdrainage problems.
(36b) Water-Table lsobath Maps
Equipment
Drafting instruments and supplies.
Procedure
On a scale map of the area, write in depths to watertable from the ground surface at locations at whichwater-table and ground-surface elevations have beenobtained. Construct isobath lines, i.e., lines of equaldepth to water table, by the standard mapping pro-cedures that are used for ground-surface and water-table contour mapping, i. e., interpolation and extrapo-lation, and other procedures. Where either surfacetopography or water-table slopes change abruptly, morepoints of measurement are required for accurate con-struction of equal depth-to-water lines.
Depth to water table may also be shown by circum-scribing areas within which depth to water table is ina specified range. On a scale map, note depths towater table as above. Select a convenient number of-depth ranges, such as 0 to 2, 2 to 4, 4 to 10, 10 to20, > 20, and delineate areas within which depth towater table is in the designated ranges. Distinguishbetween areas with a crosshatch, color, or other con-venient code system. Maps such as the foregoing pro-vide graphic information on the adequacy of drainageand, therefore, aid in showing areas in which artificialdrainage may be needed.
(36~) Profile FLow Patterns for GroundWater
Equipment
Drafting instruments and supplies.
Procedure
On a profile section showing the soil surface andavailable information on subsoil stratigraphy, write inhydraulic-head values at points where hydraulic-head

SALINE AND ALKALI SOILS 119
W A T E R T A B L E0
0 0
L O W E R E N D O F PIEZOMETERS
I
5 0 4 0 3 0 2 0 IO 0 IO 2 0 3 0 4 0W E S T E A S T
D I S T A N C E F R O M D R A I N - F E E T
FIGURE 30.-Equal hydraulic-head lines below a water table on a profile section in the vicinity of an open drain.area, Utah.
Example from DeltaThe direction of the hydraulic gradient is represented by arrows and indicates upward water movement from an
underlying source.
measurements have been made, i. e., points wherepiezometers terminate in the soil (fig. 30). By stand-ard methods, which are used for contour mapping,interpolation, and extrapolation, draw lines to connectpoints of equal hydraulic head. Convenient hydraulic-head intervals may be selected, extending over the rangeof measured values for hydraulic head. Usually aninterval is selected that allows a number of equalhydraulic-head 1’mes to be sketched on the same profile.The component of flow in the plane of the profile isnormal to lines of equal hydraulic head, if the profilesection is plotted to a 1 : 1 scale. With the 1 : 1 scale,flow lines can be sketched in at right angles to theequal hydraulic-head lines, with arrows to show thedirection of flow. If the vertical scale is exaggerated,the relation between stream lines and equal hydraulic-head lines on the plotted profile is no longer orthogonal.Where the vertical and horizontal scales are not equal,therefore, the hydraulic-head distribution may be prop-erly plotted, but flow lines should not be indicated.
For cases where hydraulic head changes in a verticaldirection, indicating a vertical component of flow, theelevation of the water table can be determined by pie-zometers that terminate at the water-table level, or byextrapolation from a series of known points below thewater table, as outlined in Method 35~. Draw equalhydraulic-head lines to intercept the water table at therespective equal hydraulic-head elevations.
An equal hydraulic-head line may intercept the watertable at any angle, depending upon the flow direction.The water table is not necessarily a flow line as is oftenassumed, although it may be. A component of upwardflow that exists below the water table may continueupward through the soil above the water table to thesoil surface by capillarity. Likewise, downward flowmay occur in the unsaturated soil above a water table.
References
Christiansen (1943), Reeves and Jensen (1949).
(36d) Water-Table Isopleths for ShowingTime Variations in the Elevationof the Water Table
Equipment
Drafting instruments and supplies.
Procedure
A large seasonal variation in the water table oftenoccurs in irrigated areas. In such cases it may be use-ful to show graphically the variations, both in spaceand time, by the use of water-table isopleths.17 By this
I’ Private communication from M. Ram, Water UtilizationDivision, Ministry of Agriculture, Tel Aviv, Israel.

c 120 AGRICULTURE HANDBOOK 60, U. S. DEPT. OF AGRICULTURE
method a series of observation wells is established ona straight line across the area under investigation andwater-table elevations are recorded over a period oftime.
Th ’e graphical representation of the data is accom-plished as follows: On a vertical scale at the left marginof a sheet of tracing paper, make a time scale on whichthe dates are shown for the various sets of readings ofthe observation wells. Start the time scale near thetop of the sheet with the initial set of readings. Drawhorizontal constant-time lines across the sheet at thetime values for the various sets of readings. Acrossthe top of the sheet, draw a profile of the elevation ofthe soil surface along the line of observation wells. Useany convenient vertical scale and mark the location ofthe observation wells on the horizontal scale. Draw inhorizontal lines representing convenient elevation inter-vals over the range of variation in the elevation of thewater table and plot the water-table profile for the initialset of readings. Project the points of intersection ofthis profile curve with the elevation scale lines down-ward to the horizontal constant-time line of the initialset of readings. Place elevation numbers above thesepoints on the constant-time line. Repeat this process,locating successive elevation points on successive con-stant-time lines for each set of well readings. Connectconstant water-table elevation points on successive con-stant-time lines with smooth curves. These curves arecalled isopleths and show the variation with time ofthe points of equal water-table elevation along the lineof water-table observation wells.
The sources of ground water as well as subsurfacestratigraphy must be taken into account in the inter-pretation of isopleths. The method provides a con-venient graphical summary of water-table observationsand can be used to advantage in showing the rate ofsubsidence of the water table following an irrigationseason. This information relates directly to the drain-ability of soils.
Physical Measurements
(37) Intrinsic Permeability
(37a) Permeability of Soil to Air
Apparatus
The apparatus for this measurement is shown infigure 31. Compressed air is admitted through a cal-cium chloride drying tube to an airtight tank of con-stant volume. An outflow tube leads to a watermanometer and to the soil sample container. The soilsample container consists of a tinned iron can with anextension made from a 4-cm. section of brass tubingcounter-bored to give a snug fit on the top of the can.Punch an outlet hole, approximately 5/32 in. in diam-eter in the bottom of the can. Use a disk of brassscreen, 20- or 40-mesh, with 2 layers of fiberglass sheet
CALCIUM CHLORIDE AIR STORAGE WATER SOIL SAMPLEDRYING TUBE TANK MANOMETER CONTAINER
ro
..F
F rJ
y yl __- -
FIGURE 31.-Apparatus using air flow to measure the intrinsicpermeability of soil by Method 37a. The manometer read-ings yl and y2 represent successive heights of the free-watersurface above the rest position.
as a filter in. the bottom of each can. The soil-packingmachine, mentioned below: is useful for this measure-ment.
Remarks
This method for measuring air permeability can beused for either disturbed or undisturbed samples. Thefollowing procedure is for disturbed soils. In orderto get consistent results for comparing one soil withanother and to determine the effect of various treat-ments, a standard procedure for preparing and packingthe soil must be followed. Make determinations intriplicate.
Procedure
Pass air-dried soil through a wire-mesh sieve with1 -mm. openings. Obtain representative subsamples asoutlined in Method 1. Attach the brass cylinder to thetop of a can and fill the container about three-fourthsfull of soil. Dump the soil, which has been well mixed,into the container rather than by pouring or scooping.With a spring-load of 3-kg. wt. on top of the soil, dropthe container 200 times on a solid block of wood froma height of 2.5 cm. A cam-operated mechanical drop-per has beeh used for this purpose. Remove the brasscylinder from the can and use a spatula to strike thesoil off level with the top of the can. Cover the soilwith a disk of filter paper, place a lid on the can, andcomplete the seal with a tight rubber band or beeswax.Connection to the air source is made by means of a shortpiece of copper tubing soldered to the lid of the can.Pass compressed air through the drying tube to thetank until a manometer displacement of 40 to 50 cm.of water is attained. Record the air temperature inthe tank and measure the rate of drop of the ma-nometer level as air is allowed to flow from the tankthrough the soil sample. It is desirable to allow aninitial lo-cm. drop of the manometer level beforeheight and time readings are started.
Calculations
The intrinsic permeability of the soil using air isgiven by the equation :

c
SALINE AND ALKALI SOILS 121
in which
k’, = 2.30 LVS T,A Pa
k’,= Intrinsic permeability with air, cm.2L = Length of soil column, cm.V=Volume of tank, cm.3v = Viscosity of air at the temperature at which the
determination was made, dyne sec. cm.-2(poises) .
A = Cross-sectional area of sample, cm.2Pa= Atmospheric pressure, dynes/cm.2S= Slope of log y vs. time curve=
log,& - log,,y,At
y=Displacement of the water surface in one armof the manometer, cm.
At=Time in ervalt in seconds for the water sur-face in the manometer to drop from y1 to y2.
The time for a convenient and measurable drop inmanometer level can be controlled by the volume of thetank used. For most soils prepared as outlined above, a213.liter (55.gal.) drum gives a convenient time inter-val for a measurable manometer change. For soils oflower permeability, a 24.liter tank is used.
While c. g. s. units are suggested above, any con-sistent set of units can be used.
References
Kirkham (1947)) Soil Science Society of America(1952).
(37b) Permeability of Soil to Water
Apparatus
Constant-level water-supply reservoir, glass siphontubes, and rack for supporting samples; soil containersmade from 3-0~. tinned iron soil cans with ?&-inch holepunched in bottom and brass cylinder extensions,4-cm. high; 50. or loo-ml. graduates.
Procedure
The procedure for preparing and packing samples isas outlined in Method 37a. Water-permeability deter-minations may be made on the same samples used forair permeability. Care must be exercised to avoid dis-turbance of the sample in handling.
Following the air-permeability determination, place abrass cylinder extension on top of the can containingthe soil sample and seal in place with an elastic band orbeeswax. Pl ace the soil sample on the rack, cover thesoil surface with filter paper, and admit water to thesample from the supply reservoir with the siphon. Thewater level is adjusted so that the height of soil pluswater column is 2 times the soil column, giving ahydraulic gradient of 2.
Record the water temperature, the time at whichwater is admitted to the container, and the time atwhich water first percolates through the sample. Meas-
259525 0 - 54 - 9
ure the volume of percolate for a number of successivetime intervals. The amount of water passed throughthe soil and the number of volume measurements madewill depend upon the purpose of the determination.Usually 3 to 6 in. is used, a depth corresponding to anirrigation. For comparing one soil with another andfor determining the effect of various treatments on agiven soil, use a value obtained after the hydraulicconductivity has become more or less constant.
Calculations
Intrinsic permeabilitythe equation :
of the soil using water is given
k’, = _.&k=_ ?’ vLw dwg AAhAt
in whichk’, = Intrinsic permeability with water, cm.2k-Hydraulic conductivity, cm./sec.V=Volume of percolate in time, At, cm.”L=Length of soil column, cm.Ah= Difference in hydraulic head between the in-
flow and outflow ends of the soil column,cm.
A= Cross-sectional area of the soil column, cm.2At= Time interval for volume of percolate V to
pass through the soil, sec.r=Viscosity of water at the recorded tempera-
ture, dyne sec. cm.e2 (poises).d, = Density of water, gm./cm.3g= Acceleration of gravity, cm. sec.m2
Intrinsic permeability is related to hydraulic conduc-tivity as indicated by the above equation. If desired,hydraulic conductivity may first be calculated and thenconverted to intrinsic permeability by multiplying bythe ratio q/d,g. While c. g. s. units are suggestedabove, any consistent set of units can be used.
Remarks
Soils may be compared with respect to permeabilityon the basis of values obtained at a fixed time afterwetting or after a specified amount of water has passedthrough the sample. For comparing changes in struc-ture between different soils, the time basis has been
’found to be preferable.
Reference
Soil Science Society of America (1952) .
(38) Bulk Density
Apparatus
Balance, drying oven, moisture, boxes, and core sam-pler. The latter can be anything from an elaboratepower-driven machine to a short section of thin-walledbrass tubing with an internal closely fitting ring ofclock spring soldered in place to form the cutting lip.(See drawing of soil sampler in Appendix.)

.122 AGRICULTURE HANDBOOK 60, U. S. DEPT. OF AGRICULTURE
Procedure
Details of procedure will. depend on the type of coresampler and soil conditions. Usually a flat soil sur-face, either horizontal or vertical, is prepared at thedesired depth, and the core sampler is pressed or driveninto the soil. Care should be taken to see that no com-paction occurs during the process, so that a knownvolume of soil having field structure is obtained. Theoven-dry weight of the sample is then determined.
Calculations
Bulk density (c&) = (wt. of oven-dry soil core) /(fieldvolume of sample). Bulk density is expressed aspounds per cubic foot or grams per cubic centimeter.For practical purposes, the latter is equal numericallyto apparent specific gravity or volume weight.
(39) Particle Density
Apparatus
Balance, vacuum desiccator, and pycnometers.
Procedure
Weigh a pycnometer when filled with air ( va),when filled with water (v,) , when partially filled withan oven-dried sample of soil (W,), and when com-pletely filled with soil and water (v,,). To excludeair, pycnometers containing the soil with enough waterto cover should be subjected to several pressure reduc-tions in a vacuum desiccator and then allowed to standfor a number of hours under reduced pressure beforecompletely filling with water for weighing w,,. Theparticle density (d,) of the soil in gm. cm.e3, is thengiven by the formula :
d,=&v (~,-~,)/(~,+~,-~,-~,,)where d, is the density of the water in gm. cm.e3.
Slightly different and perhaps better vaiues will beobtained for dp if a nonpolar liquid such as kerosene,xylene, or acetylene tetrachloride is used for the dis-placing liquid.
(40) Porosity
The porosity of soil is the fraction of the soil spacenot occupied by soil particles. The porosity (n) maybe calculated from the formula:
n= (G-d,) /d,if the bulk density (db) and the particle density (d,)are known. Solutions of this equation may be foundgraphically by use of the nomograms given at the rightof figure 8 (ch. 2).
(41) Particle-Size Distribution
Remarks
The method as given is essentially that described byKilmer and Alexander ( 1949)) except that the 0.005.
mm. determination has been omitted. The names usedat present by the United States Department of Agricul-ture for the soil separates are as follows: The diameters2.0 to 1.0, 1.0 to 0.5, 0.5 to 0.25, 0.25 to Oil, and 0.1 to0.05 mm., respectively, separate very coarse, coarse,medium, fine, and very fine sands; particles from 0.050to 0.002 mm. are called silt, and particles with effectivediameters less than 0.002 mm. are designated as clay.With the International System, the diameters 2.0, 0.2,and 0.02, respectively, separate the classes representedby the numerals I, II, and III, while particles of diam-eters less than 0.002 mm. are represented by IV.
Apparatus
Set of sieves; size openings, 2., l-, and 0.5.mm. roundhole; 60., SO-, 140., and 300.mesh per in. Pyrex nurs-ing bottles, 8.oz., with rubber stoppers; Lowy 25.ml.automatic pipet; haw pipet rack; Pasteur-Chamberlandfilters, short, “F” fineness. Analytical balance, dryingoven, steam chest, motor stirrer, reciprocating shaker,desiccator, beakers, and evaporating dishes.
Reagents
A. Hydrogen peroxide, 30 percent solution.B. Dispersing agent. Dissolve 35.7 gm. sodium
metaphosphate and 7.94 gm. sodium carbonate in waterand dilute to 1 liter. The sodium metaphosphate isprepared as follows : 125 gm. of monosodium phos-phate (NaH,PO,-H,O) is slowly heated in a platinumdish to 650” C. This temperature is held for 11/2 hr.The platinum dish and its contents are removed fromthe furnace and the sodium metaphosphate is cooledrapidly by pouring it out in narrow strips on a cleanmarble slab. The sodium carbonate is used as analkaline buffer to prevent the hydrolysis of the meta-phosphate back to the orthophosphate which occurs inacidic solutions.
Procedure
GENERAL STATEMENT.-Samples are routinely run insets of eight; the necessary equipment is designedaccordingly. The sample is treated with hydrogenperoxide, washed, filtered, and dispersed. The sand isseparated from the silt and clay by washing the dis-persed sample through a 300.mesh sieve. The varioussand fractions are obtained by sieving, while the20-p and 2-p fract ions are obtained by pipeting.Organic matter is determined on a separate sample bythe dichromate reduction method (Peech and co-workers, 1947).
PREPARATION OF THE SAMPLE.-The air-dried sampleis mixed and quartered. The quarter reserved foranalysis is rolled with a wooden rolling pin to breakup the clods. The sample is then passed through asieve with 2.mm. round holes. Rolling and sieving ofthe coarse material are repeated until only pebbles areretained on the sieve. The material not passing thesieve is weighed and reported as a percentage of theair-dry weight of the whole sample.

4
SALINE AND ALKALI SOILS 123
R EMOVAL OF ORGANIC MATTER.-A lo-gm. sample drying, another sieve is used for the next sample. Theof the air-dry soil containing no particles larger than material on the sieve is then brushed into a platinum2 mm. is weighed on a rough balance and placed in a dish and further dried for about 2 hr. The dish is then25O-ml. electrolytic Pyrex beaker. About 50 ml. of placed in a desiccator, the contents to be sieved andwater is added, followed by a few milliliters of 30 per- weighed when convenient. The silt and clay suspen-cent hydrogen peroxide. The beaker is then covered sion in the cylinder is made up to 1 liter with distilledwith a watch glass. If a violent reaction occurs, the water, covered with a watchglass, and set aside until thecold hydrogen peroxide treatment is repeated period- pipetings are to be made.ically until no-more frothing occurs. The beaker is PIPETING.-Pipetings are made for the 20~ and 2~then heated to about 90” C. on an electric hot plate. particles in the order named. The 20~ particles areI-Iydrogen peroxide is added in 5-ml. quantities at pipeted at a l&cm. depth, the sedimentation time vary-about 45-min. intervals until the organic matter is ing according to the temperature. The 2~ f.raction isessentially removed as determined by visual inspection. pipeted after a predetermined settling time (usuallyHeating is then continued for about 30 min. to remove 6 to 61, hr.), the depth varying according to the timeany excess hydrogen peroxide. and temperature. A Lowy 25-ml. automatic pipet with
R EMOVAL OF DISSOLVED MINERAL M.ATTER.-Follow- a filling time of about 12 sec. is used. Prior to eaching the hydrogen peroxide treatment, the beaker is sedimentation process, the material in the sedimentationplaced in a rack and about 150 ml. of water is a,dded cylinder is stirred for 6 min. with a motor-driven stirrerby means of a jet strong enough to stir the sample (8 min. if the suspension has stood for more than 16well. The suspension is filtered by means of a short hr.). After removal from the stirrer, the sedimenta-Pasteur-Chamberland filter of “F” fineness. Five such tion cylinder is surrounded with insulating materialwashings and filterings are usually sufficient except and the suspension is stirred for 30 to 60 sec. with afor soils containing much coarse gypsum. Soil adher-ing to the filter is removed by applying a gentle back-
hand stirrer, an up-and-down motion being used. Thisstirrer is made by fastening a circular piece of per-
pressure and using the forefinger as a policeman. Thebeaker is then dried on a steam bath, placed overnightin an oven at 110” C., cooled in a desiccator, and thenweighed to the nearest milligram. After the sample istransferred to a nursing bottle for dispersion, the oven-dry weight of the beaker is obtained. Weight ofoven-dry organic-free sample is used as the base weightfor calculating percentages of the various fractions.
D I S P E R S I O N O F T H E S A M P L E. - TO t h e o v e n - d r ysample is added I.0 ml. of sodium hexametaphosphatedispersing reagent B, and the sample is transferred to an8-0~. Pyrex glass nursing bottle by means of a funnel,a rubber policeman, and a jet of water. The volumeis made to 6 oz., and the bottle is stoppered and
forated brass sheeting to one end of a brass rod. Awide rubber band is placed around the edge of the brasssheeting to prevent abrasion. The time is noted at com-pletion of the stirring. About 1 min. before the sedi-mentation is complete, the tip of the 25-ml. pipet islowered slowly into the suspension to the proper depthby means of a Shaw pipet rack. The pipet is then filledand emptied into a 60-ml. weighing bottle having anoutside cover. One rinse from the pipet is added. Avacuum is used to dry the pipet for use on the nextsample. The weighing bottle is dried in an oven at 95”to 98” C. and then further dried for about 4 hr. at110”. The initial drying is done at a lower tempera-ture to prevent spattering of the suspension. The
shaken overnight on a horizontal reciprocating shakerwith 120 oscillations per minute. A similar volume ofdispersing agent is placed in a liter cylinder, the volumemade to 1,000 ml. and well mixed. A sample is takenwith the pipet, dried, and weighed to obtain the weightcorrection referred to in the section on calculations.
weighing bottle is then cooled in a desiccator contain-ing phosphorus pentoxide as a desiccant and weighed.
SIEVING AND WEIGHING THE SAND FRACTIONS.-Thedry sands, including some coarse silt, are weighed andbrushed into a nest of sieves. Sieves and specificationsare as follows:
This weight correction is obtained for each new solu-tion of sodium metaphosphate.
S E P AR ATION OF THE SANDS FROM SILT AND CLAY . -The dispersed sample is washed on a 300-mesh sieve,the silt and clay passing through the sieve into a l-litergraduated cylkler. Th -e sieve is held above thecylinder by means of a clamp and a stand. Jets ofwater should be avoided in washi ng the sample. Thesieve clamp is tapped gently with the side of the handto facilitate the
-_ - _washing procedure. Washing is con-
tinued until the volume in the cylindertotals about 800ml. The sands and some coarse silt remain on thesieve. It is necessary that all particles of less than20~ diam. be washed through the sieve. The sieveis removed from the holder, placed in an aluminumpan, and dried at 110” to 120” C. While the sands are
Sieve Opening Specifications(mm.)l.O______ Perforated brass plate, round holes, No.
3 straight, 0.04-in. diam. holes, 240holes per in.2
0.5______ Perforated brass plate, round holes, No.00 staggered, 0.02-in. diam. holes,714 holes per in.2
0.25_____ 60-mesh, Bureau of Standards (Phos-phor Bronze wire cloth)
0.177____ 80-mesh, Bureau of Standards (Phos-phor Bronze wire cloth)
0.105____ 140-mesh, Bureau of Standards (Phos-phor Bronze wire cloth)
0.047_ - - - 300-mesh (Phosphor Bronze wirecloth), 0.0015-in. wire.

.
124 AGRICULTURE HANDBOOK 60, U. 8. DEPT. OF AGRICULTURE
(An 80-mesh sieve is included in order to obtainInternational Society of Soil Sciences fraction I.) Thesands are then shaken for 3 min. on a shaker havingvertical and lateral movements of l/z in., making 500oscillations per minute. For a different shaker, thetime of shaking would have to be determined bymicroscopic study. The summation method of weigh-ing is used. The first sand fraction is weighed, thesecond fraction added to it, the total weight determined,and so on. If the sum of the weights of the fractionsis equal to the total weight, it is assumed that no weigh-ing error has been made.
Calculations
PIPETED FRACTIONS.-_ A -B) KD=percent of pi-peted fraction where A = weight in gm. of pipeted frac-tion, B-weight correction for dispersing agent in gm.) ,
and
K=1,000
volume contained by pipet
D= 100organic-free oven-dry weight of total sample
(The’ 20~ fraction) - (the 2~ fraction) = Interna-tional Society of Soil Sciences fraction III. UnitedStates Department of Agriculture silt is obtained bysubtracting the sum of the percentages of sand andclay from 100. International Society of Soil Sciencesfraction II is obtained by subtracting the sum of thepercentages of fractions I, III, and IV from 100.
SAND FRACTIONS.-
(Weight in grams of fraction on sieve X 100) +(organic-free oven-dry weight of total sample) =percent of fraction
References
Kilmer and Alexander (1949)) Peech and others(1947)) and Tyner (1940).
(42) Aggregate-Size Distribution
(42a) Wet Sieving
Remarks
This is a modification of the mimeographed tentativemethod that was distributed in August 1951 by theCommittee on Physical Analyses of the Soil ScienceSociety of America. The method in brief consists ofplacing a sample of soil on a nest of sieves that isoscillated vertically under water. The amount of soilremaining on the individual screens is determined, andaggregation is expressed as the mean weight-diameterof the aggregates and primary particles. After weigh-ing, the aggregate separates are combined and dis-persed and washed through the nest of sieves. The
resulting separates make it possible to correct the pre-vious separates of aggregates for primary particles andto calculate the aggregation index. This is a single-value index of the aggregation of a soil.
Apparatus
Yoder-type wet-sieving apparatus, sieve holders, 4sets of 5-inch sieves with 2-, l-, 0.5-, O-25-, and O.lO-mm.openings (corresponding to United States Screens Nos.10, 18, 35, 60, and 140)) drying oven, moisture cans,balance Pyrex watchglasses, and 6-in. diameter porce-lain funnel.
Procedure
Collect the soil sample with spade or garden trowel,preferably when the soil is moist, avoiding excessivecompaction or fragmentation of soil. Dry the sampleslowly and, when sufficiently friable, pass it gentlythrough an S-mm. sieve and air-dry. If the soil isstony, pass the sample through a 4-mm. sieve and dis-card all primary material greater than 4 mm. in size.Mix the soil and take subsamples in accordance withMethod 1. Make determinations in duplicate on 40- to60-gm. subsamples. Weigh the subsamples to theclosest 0.1 gm. and determine the moisture content bydrying a separate subsample at 105” C.
Install the nests of sieves in the water slowly and ata moderate angle to avoid entrapping air bubbles belowthe sieves. Adjust the mechanism so that the top sievemakes contact with the water surface when the oscilla-tion mechanism is at the top of its stroke. Distributethe sample on the top sieve so that wetting occurs bycapillarity and wait 5 to 10 min. after the soil surfaceappears wet to insure saturation of the aggregates.Oscillate the sieves for 30 min. with a stroke of 3.8 cm.and a frequency of 30 cycles per minute, keeping soilsubmerged at all times. Some attention may be re-quired during the first few minutes of operation, inorder to prevent water from spilling over the top sieve,and later, to prevent the top sieve from rising abovewater level.
Remove the sieves from the water and drain for a fewminutes in an inclined position. Remove excess waterfrom the bottom of the screens with absorbent tissueand place the sieves on watchglasses. Dry in a circu-lating oven at not higher than 75” C. because hightemperatures cause some soils to adhere. Then removethe soil from the sieves, dry at 105”, and weigh.
In order to determine how much of the soil retainedon the individual sieves represents aggregates and howmuch is gravel and sand, the oven-dried soil taken fromthe five sieves is dispersed and washed through thesieves with a stream of water. The oven-dry weight ofthe primary particles remaining on each sieve is thendetermined.
Calculations
The amount of soil remaining on each sieve is ex-pressed as percentage of the total sample. Prepare a

SALINE AND ALKALI SOILS 125
graph, plotting the accumulated percentage of soilremaining on each sieve as ordinate against the upperlimit of each fraction in millimeters as the abscissa,and measure the area shown by the curve connectingthese points and by the ordinate and the abscissa. If1 mm. (sieve size) represents 1 unit of the abscissa and10 percent a unit on the ordinate, a square unit willrepresent 0.1 mm. mean weight-diameter of the aggre-gates of the sample. Multiplying the number of squareunits of the area by 0.1 gives the mean weight-diameterof the entire sample, including the material that hasbeen washed through the smallest sieve.
The results from the wet sieving of the dispersedsample are plotted and calculated in the same way.The difference between the mean weight-diameters ofthe original and the dispersed samples gives the aggre-gation index.
Remarks
The water container in which the sieve nest is oscil-lated can be of any desired size or shape, providingits area is at least 1.6 times the area of the sieves. Thetemperature of the water should be in the range 20”to 24” C., and the water should not be excessivelysaline. Fresh water should be used for each set ofdeterminations. Rubber bands cut from old innertubes are convenient for holding loosely fitting sievestogether.
References
Russell (1949), Van Bavel (1950).
(4Zb) Aggregation of Particles Less than50 Microns
Remarks
This procedure measures the degree of aggregationof the silt and clay (less than 50~) fraction for thosesoils that do not contain enough large aggregates to beadequately characterized by wet-sieving. The methodinvolves measuring the concentration of two suspen-sions of the same soil, one of which is dispersed byany standard dispersion procedure to give total siltplus clay. The other suspension, prepared by mild(end-over-end) agitation of the sample in water, givesa measure of the unaggregated silt plus clay. Thedifference in concentration between the two suspensionsprovides a measure of the amount of silt plus clayparticles thzt is bound into water-stable aggregateslarger than 50~ in size.
This procedure may also be used as a rapid ex-ploratory test to determine the effect of various soil-aggregating chemicals in producing water-stableaggregation.
Apparatus
Dispersion apparatus with high-speed stirring motor:metal cup, l-liter hydrometer jars, thermometer, and
Bouyoucos hydrometer or hydrometer-pipet. If thepipet procedure is used, a Lowy automatic pipet, aShaw pipet rack, and tared moisture boxes are needed.
Procedure
Weigh two 50-gm. subsamples of air-dried soilprepared as in Method 42a. Make a moisture de-termination on a separate subsample.
T OTAL SILT PLUS CLAY.-Disperse one of the sub-samples in the dispersion apparatus. Transfer to ahydrometer jar and dilute with distilled water to therequired volume. For procedure a (below) the finalvolume is 1,130 ml., determined with the hydrometerin the suspension; for procedures b and c, the volumeis 1,000 ml. (Note: If either procedure b or c is to beused, stopper and invert the cylinder 2 or 3 times andrecord the temperature. This is necessary in order todetermine in advance the settling time used.)Stopper, invert, and shake the cylinder vigorously sev-eral times and determine the total silt plus clay in thesuspension as directed under procedures a, b, or c, givenbelow.
UNBOUND SILT PLUS CLAY.-Incline the hydrometerjar containing the second subsample to a nearly hori-zontal position and shake lightly to spread the sampleover a distance of 10 or 12 cm. along the side of the jar.Add distilled water slowly and in such manner as tofavor wetting by capillarity rather than by flooding.When soil is completely wetted, dilute to the appropri-ate volume, as given above, but do not allow water tofall directly on soil. Allow the soil to slake for at least15 min. Record the temperature. Stopper the cylinderand gently invert it 20 times (do not shake) within aperiod of about 40 sec., requiring about 1 sec. forinversion with a 1-sec. interval between inversions.After the required settling period, determine the amountof unbound silt plus clay in suspension by the sameprocedure a, b, or c used for the total silt plus claymeasurement.
PROCEDURES FOR MEASURING CONCE NTRATION OF sus-PENSIONS.- (a) HydrOm&T. After final mixing, in-sert the hydrometer and take a reading after 40 sec-onds, as prescribed by Bouyoucos (1936). Immedi-ately record the suspension temperature in degrees F.and apply a temperature correction as follows: Add0.2 to the hydrometer reading for each degree above67” F.; subtract if below.
The corrected hydrometer reading gives the gramsper liter of silt plus clay in suspension.
(b) Hydrometer-pipet. The hydrometer-pipet (Hell-man and McKelvey, 1941) measures the concentrationof soil particles in grams per liter of a suspension thathas. been pipeted from a known depth and that is uni-form throughout when measured by the hydrometercontained within the pipet. The settling time anddepth of sampling are the same as for the pipet pro-
cedure C, and the hydrometer readings require the sametemperature corrections as for the hydrometer pro-cedure a.

126 AGRICULTURE HANDBOOK 60, U. S. DEPT. OF AGRICULTURE
After final mixing and a few seconds prior to timeof sampling, squeeze the bulb and insert the hydrometer-pipet into the suspension to a depth of 12.5 cm. Startfilling the pipet after the prescribed time interval inseconds’, as indicated under procedure c. Care shouldbe taken to keep the suspension well mixed by occa-sionally allowing a bubble to rise through the suspen-sion in the pipet. Read the hydrometer at the topof the meniscus and apply the proper temperature cor-rection as prescribed for the Buoyoucos hydrometer.
The corrected hydrometer-pipet reading gives thegrams per liter of silt plus clay in suspension.
(c) Pipet. After final mixing, insert the Lowy orother suitable pipet into the suspension to a depth of12.5 cm. Start filling the pipet after the time-intervalin seconds indicated by the accompanying data. Otherdepth-time-temperature relationships may be obtainedfrom the nomograms of Tanner and Jackson (1948).
Temperature :
Time to sample at12.5~cm. depth
(seconds)
self-alining to accommodate to any slight lack of paral-lelism in the line of bearing on the sample. The barsare coated with a strip of soft rubber with a cross sec-tion 0.16 cm. square. The breaking machine is mountedon the platform of a beam balance. The briquet sampleis broken by upward motion of the two lower bars,which are supported by the platform of the balance.Upward motion of the upper bar is constrained by across frame above the balance. The breaking force issupplied by water accumulating in a vessel hung fromthe end of the balance beam. The breaking force isapplied at the rate of 2,000 gm.-wt.,/min., and-the beammotion that occurs when the sample breaks can be usedto automatically stop the accum;lation of water in thexvessels.
The briquet molds are precision made from 3$&-irt.brass strip-with inside dimensions of 31/z cm. by ‘?“cm.by 0.952 cm. high. Rectangles of hard white photo-graphic blotting paper are cut to the size 5 cm. by81/y cm. A screen-bottomed tray, 50 cm. square, ismade by pulling brass window scieen taut and solder-ing it to a rigid l/g-in. galvanized pipe frame. A panor other water container slightly larger than 50 cm.square. Graduated cylinder. Tremie funnel withstraight cylindrical tube 2 cm. diam. and 10 cm. high.(See drawing of apparatus in Appendix.)
“C. or “F.20 ~68)____________________-----_--_---__--
f:(71.5) ------- _______ ---__---_---_- ____ -- z:(75) -___--________-_-_____--__--___-__-- 51
;:(79)_________________--___----__---_____ 49(82.5) ____________________-__-__--_--_-- 46
30 (86) _____________________----____---_--- 44
The weight in grams of oven-dry (105” C.) materialin the 25.ml. aliquot is multiplied by 40 to give gramsper liter of silt plus clay in suspension.
Calculations
Percent aggregation = (wt. of total silt plus clay indispersed suspension, gm., minus wt. of silt plus clay inundispersed suspension, gm.) X lOO/( wt. of total siltplus clay in dispersed suspension, gm.) .
References
Bouyoucos (1936)) Hellman and McKelvey (1941))and Tanner and Jackson (1948).
(43) Modulus of Rupture
Remarks
In the following procedure, the maximum force re-quired to break a small specially molded briquet ofsoil is measured, and from this breaking force the maxi-mum fiber stress in the standard sample is calculated.
Shrinkage of soil material on drying is a pertinentproperty and can be determined from the dimensionsbefore and after drying of the briquet samples usedin this test.
Apparatus
The machine for breaking the sample makes use of 2parallel bars 5 cm. apart for supporting the sample.The breaking force is supplied from a third overlyingbar centrally located and parallel with respect to thesupporting bars. The bar above and one bar below are
Procedure
Make the determination on 6 replicate samples ofsoil that have been passed through a 2-mm. round-holesieve, using the subsampling procedure outlined inMethod 1. Samples should be just slightly larger thanwill fill the briquet molds. Cover the inside of themolds with a thin layer of Vaseline so that the soil willnot stick to the mold. Place the screen-bottomed trayin the pan. Pl ace the molds on the blotting paper onthe screen. Rest the tremie on the blotting paper at oneend of the mold. Dump all of a soil subsample into thetremie. Move the funnel around inside the mold whileraising continuously so as to give a uniform smoothfilling of the mold.
Strike off excess soil level with the upper surface ofthe mold. Add water to the pan until free water sur-rounds every mold. Allow samples to stand for 1 hourafter all the,soil samples become wet. Raise the screenvery carefully so as not to jar the samples and transferto a forced-draft oven at 50” C. After drying thebriquets to constant weight, remove from the molds anddetermine the breaking strength.
Calculations
Use the formula s= (3FL) / ( 2bd2), where s is themodulus of rupture (in dynes per sq. cm.), I; is thebreaking force in dynes (the breaking force ingm.-wt. X 980) ; L is the distance between the lower twosupporting bars, b is the width of the briquet, and d isthe depth or thickness of the briquet, all expressedin cm.