Embed Size (px)
Citation preview
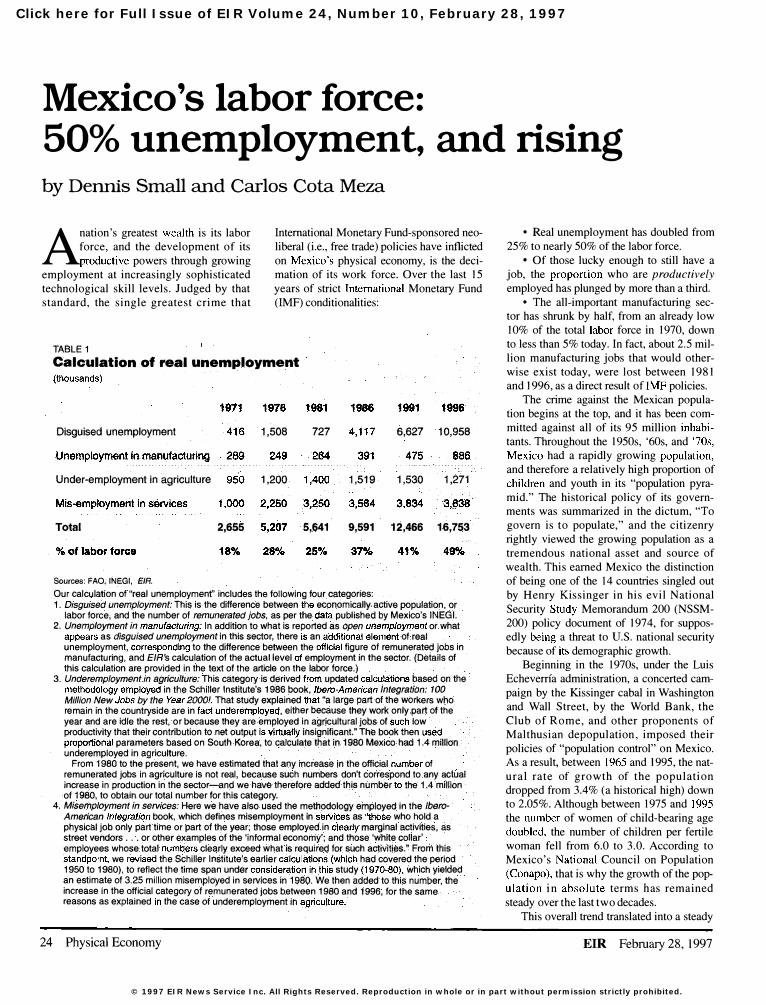
Click here for Full Issue of EIR Volume 24, Number 10, February 28, 1997
© 1997 EIR News Service Inc. All Rights Reserved. Reproduction in whole or in part without permission strictly prohibited.
Mexico's labor force: 50% unemployment, and rising by Dermis Small and Carlos Cota Meza
Anation's greatest wealth is its labor force, and the development of its productive powers through growing
employment at increasingly sophisticated technological skill levels. Judged by that standard, the single greatest crime that
TABLE 1
International Monetary Fund-sponsored neoliberal (i.e., free trade) policies have inflicted on Mexico's physical economy, is the decimation of its work force. Over the last 15 years of strict International Monetary Fund (IMF) conditionalities:
Calculation of real unemployment (thousands)
1911 1991 1"996 Disguised unemployment 416 1,508 727 4,117 6,627 10,958
Unempk'l" ;:: r:: ;n':H;uf;-tciuring , 289 249 475 886.
Under-employment in agriculture 950 1,200 1,400 1,519 1,530 1,271
1,000 3,834 3,638"
Total 2,655 5,207 5,641 9,591 12,466 16,753
%of 1 8% 28% 41% 49%
Sources: FAO; INEGI, . EIR. Our calculation of ''r�1 unemployment" includes the following four categories: 1. Disguised unemployment: This is the difference between the economically active population, or
labor torce, and the number of remunerated jObs, as per the data published by Mexico's INEGI. 2. Unemployment in manufacturing: In addition to what is reported as open unemployment or what
appears as disguised unemployment in this sector, there is an additional element of real unemployment, corresponding to the difference between the official figure of remunerated jobs in manufacturing, and EIR's calculation of the actual level of employment in the sector. (Details of this calCUlation are provided in the text of the article on the labor force.)
3. Underemployment in agriculture: This category is derived from updated calculations based on the methodology employed in the Schiller Institute's 1986 book, Ibero-American Integration: 100 Mil/ion New Jobs by the Year 20001. That study explained that "a large part of the workers who remain in the countryside are in fact underemployed, either because they work on ly part of the year and are idle the rest, or because they are employed in agricultural jobs of such low productivity that their contribution to net output is virtually insignificant." The book then used proportional parameters based on South Korea, to calculate that in. 1980 MexiCO had 1.4 million underemployed in agriculture. . '.
From 1980 to the present, we have estimated thaI any Increase in the official number of remunerated jobs in agriculture is not real, because such numbers don't correspond to any actual increase in production in the sector-and we have therefore added this number to the 1.4 million of 1980, to obtain our total number for this category.
4. Misemployment in services: Here we have also used the methodology employed in the {bercAmerican Integration book, which defines misemployment in services as ''those who hold a physical job only part time or part of the year; those employed in clearly marginal activities, as street vendors .. . or other examples of the 'informal economy'; and those 'white collar' employees whose total numbers clearly exceed what is required for such activities." From this standpoint, we revised the Schiller Institute's earlier calculations (which had covered the period 1950 to 1980), to reflect the time span under consideration in this study (1970-80), which yielded an estimate of 3.25 million misemployed in services in 1980. We then added to this number, the increase in the official category of remunerated jobs between 1980 and 1996, for the same reasons as explained in the case of underemployment in agriculture.
24 Physical Economy
• Real unemployment has doubled from 25% to nearly 50% of the labor force.
• Of those lucky enough to still have a job, the proportion who are productively
employed has plunged by more than a third. • The all-important manufacturing sec
tor has shrunk by half, from an already low 10% of the total labor force in 1970, down to less than 5% today. In fact, about 2.5 million manufacturing jobs that would otherwise exist today, were lost between 1981 and 1996, as a direct result of IMF policies.
The crime against the Mexican population begins at the top, and it has been committed against all of its 95 million inhabitants. Throughout the 1950s, '60s, and '70s, Mexico had a rapidly growing population, and therefore a relatively high proportion of children and youth in its "population pyramid." The historical policy of its governments was summarized in the dictum, "To govern is to populate," and the citizenry rightly viewed the growing population as a tremendous national asset and source of wealth. This earned Mexico the distinction of being one of the 14 countries singled out by Henry Kissinger in his evil National Security Study Memorandum 200 (NSSM-2(0) policy document of 1974, for supposedly being a threat to U.S. national security because of its demographic growth.
Beginning in the 1970s, under the Luis Echeverria administration, a concerted campaign by the Kissinger cabal in Washington and Wall Street, by the World Bank, the Club o f Rome, and other proponents of Malthusian depopulation, imposed their policies of "population control" on Mexico. As a result, between 1965 and 1995, the natural rate of growth of the population dropped from 3.4% (a historical high) down to 2.05%. Although between 1975 and 1995 the number of women of child-bearing age doubled, the number of children per fertile woman fell from 6.0 to 3.0. According to Mexico's National Council on Population (Conapo), that is why the growth of the pop
ulation in absolute terms has remained steady over the last two decades.
This overall trend translated into a steady
EIR February 28, 1997
growth of the "economically active population," or labor force, from about 14.8 million in 1971, to an estimated 34.4 million in 1996, which is about 36% of the total population today. In other words, somewhere between 750,000 and 1 million young Mexicans have been joining the labor force every year.
(The economically active populati on, according to standard International Labor Organization [ILO] definitions, "comprises all persons of either sex who furnish the supply of labor for the production of economic goods and services"-that is, it is the labor force, including both those currently employed and those currently unemployed. It typically excludes children under the age of 10, as well as "students, women occupied solely in domestic duties, retired persons, persons living entirely on their own means, and persons wholly dependent upon others.")
Until 1981, a fairly typical situation prevailed in Mexico. In that year, the economically active population was 22.407 million, and the category of "remunerated jobs" (presumably all paid job-holders in the domestic economy) was at 21.549 million. The difference of 858,000 between the two categories, was accounted for by about 131,000 people
FIGURE 1
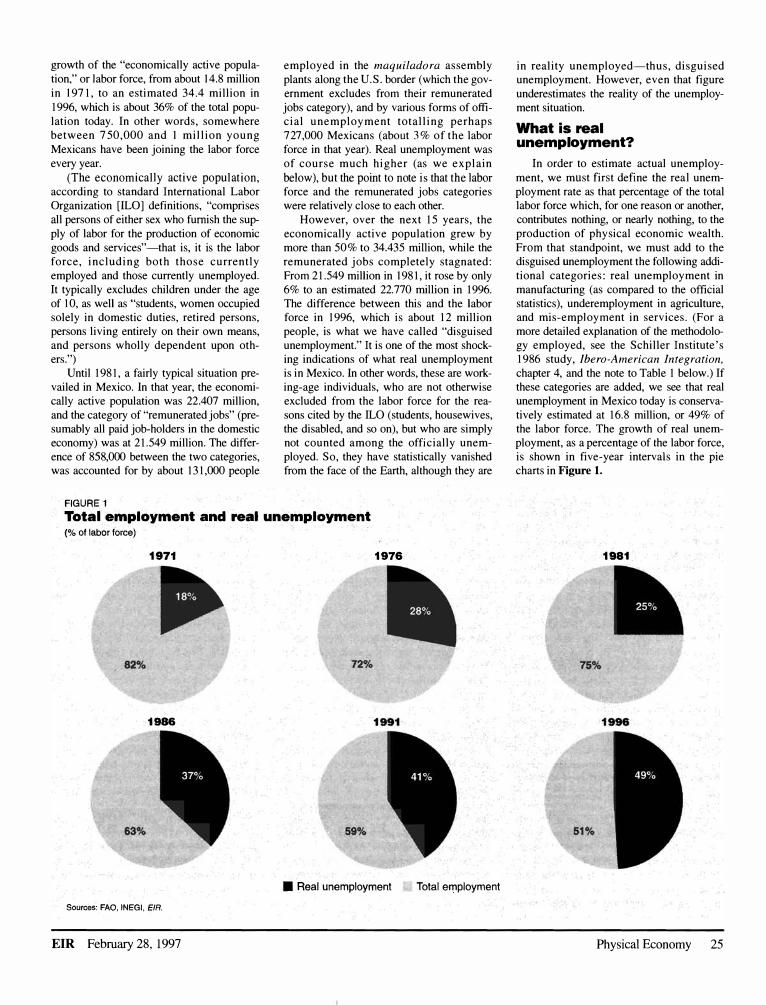
employed in the maquiladora assembly plants along the U.S. border (which the government excludes from their remunerated jobs category), and by various forms of official unemployment totalling perhaps 727,000 Mexicans (about 3% of the labor force in that year). Real unemployment was of course much higher (as we explain below), but the point to note is that the labor force and the remunerated jobs categories were relatively close to each other.
However, over the next 15 years, the economically active population grew by more than 50% to 34.435 million, while the remunerated jobs completely stagnated: From 21.549 million in 1981, it rose by only 6% to an estimated 22.770 million in 1996. The difference between this and the labor force in 1996, which is about 12 million people, is what we have called "disguised unemployment." It is one of the most shocking indications of what real unemployment is in Mexico. In other words, these are working-age individuals, who are not otherwise excluded from the labor force for the reasons cited by the ILO (students, housewives, the disabled, and so on), but who are simply not counted among the officially unemployed. So, they have statistically vanished from the face of the Earth, although they are
Tatalemploy .... ent· and real unemployment (% of labor force)
1971 1976
1986
• Real unemployment Total employment
Sources: FAO, INEGI, EIR.
EIR February 28, 1997
in reality unemployed-thus, disguised unemployment. However, even that figure underestimates the reality of the unemployment situation.
What is real unemployment?
In order to estimate actual unemployment, we must first define the real unemployment rate as that percentage of the total labor force which, for one reason or another, contributes nothing, or nearly nothing, to the production of physical economic wealth. From that standpoint, we must add to the disguised unemployment the following additional categories: real unemployment in manufacturing (as compared to the official statistics), underemployment in agriculture, and mis-employment in services. (For a more detailed explanation of the methodology employed, see the Schiller Institute's 1986 study, Ibero-American Integration, chapter 4, and the note to Table 1 below.) If these categories are added, we see that real unemployment in Mexico today is conservatively estimated at 16.8 million, or 49% of the labor force. The growth of real unemployment, as a percentage of the labor force, is shown in five-year intervals in the pie charts in Figure 1.
1981
Physical Economy 25
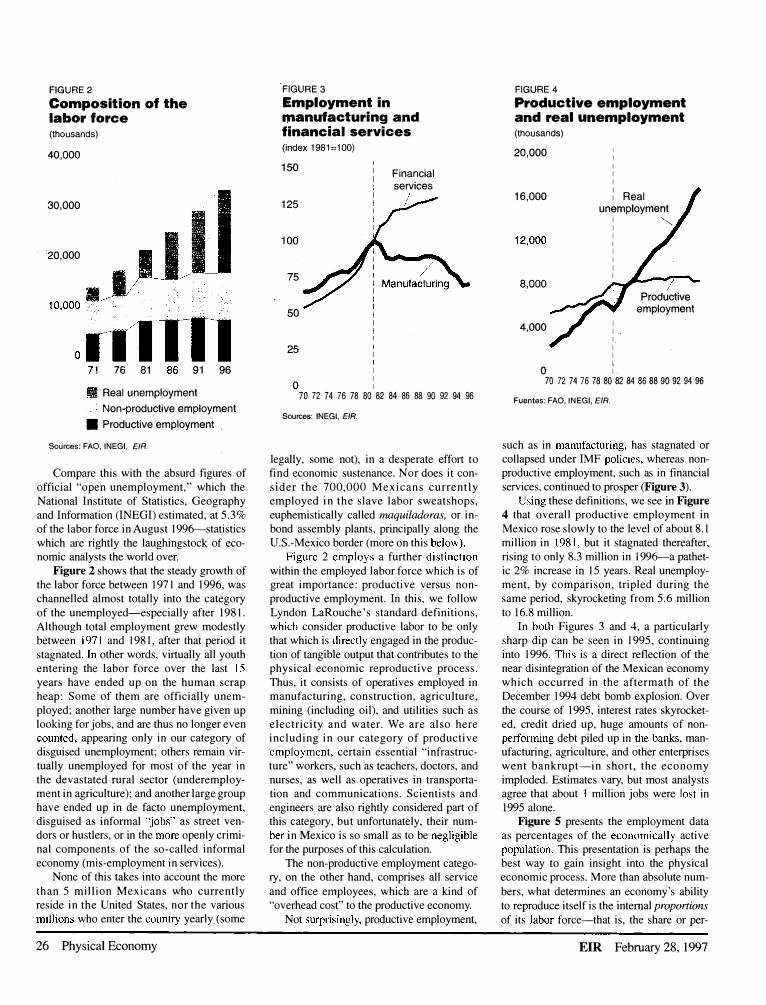
FIGURE 2
Composition of the labor force (thousands)
40,000
30,000
-
20,000
.) 10'�
I�
76 81 86 91
• Real unemployment
I 96
• Non-productive employment
• Productive employment
Sources: FAO, INEGI, EtR.
Compare this with the absurd figures of
official "open unemployment," which the
National Institute of Statistics, Geography
and Information (INEGI) estimated, at 5.3% of the labor force in August 1996---statistics
which are rightly the laughingstock of economic analysts the world over.
Figure 2 shows that the steady growth of
the labor force between 1971 and 1996, was
channelled almost totally into the category
of the unemployed--especially after 1981.
Although total employment grew modestly
between 1971 and 1981, after that period it
stagnated. In other words, viltually all youth entering the labor force over the last 15
years have ended up on the human scrap
heap: Some of them are officially unem
ployed; another large number have given up
looking for jobs, and are thus no longer even counted, appearing only in our category of
disguised unemployment; others remain vir
tually unemployed for most of the year in
the devastated rural sector (underemployment in agriculture); and another large group have ended up in de facto unemployment,
disguised as informal "jobs" as street ven
dors or hustlers, or in the more openly crimi
nal components of the so-called informal
economy (mis-employment in services).
None of this takes into account the more
than 5 million Mexicans who currently reside in the United States, nor the various
millions who enter the country yearly (some
26 Physical Economy
FIGURE 3 Employment in manufacturing and financial services (index 1981=100)
150
125
100
75
50
25 I
I I
o I
Financial services
70 72 74 76 78 80 82 84 86 88 90 92 94 96
Sources: INEGI, EtR.
legally, some not), in a desperate effort to find economic sustenance. Nor does it con
sider the 700,000 Mexicans currently employed in the slave labor sweatshops,
euphemistically called maquiladoras, or in
bond assembly plants, principally along the
U.S.-Mexico border (more on this below).
Figure 2 employs a further distinction
within the employed labor force which is of great importance: productive versus non
productive employment. In this, we follow
Lyndon LaRouche's standard definitions,
which consider productive labor to be only
that which is directly engaged in the produc
tion of tangible output that contributes to the physical economic reproductive process.
Thus, it consists of operatives employed in manufacturing, construction, agricUlture,
mining (including oil), and utilities such as
electricity and water. We are also here including in our category of productive employment, certain essential "infrastruc
ture" workers, such as teachers, doctors, and nurses, as well as operatives in transporta
tion and communications. Scientists and engineers are also rightly considered part of this category, but unfortunately, their num
ber in Mexico is so small as to be negligible
for the purposes of this calculation.
The non-productive employment category, on the other hand, comprises all service
and office employees, which are a kind of "overhead cost" to the productive economy.
Not surprisingly, productive employment,
FIGURE 4 Productive employment and real unemployment (thousands)
20,000
16,000
12,000
8,000
4,000
I I I I
I
: Real unemployment
: " I I I I I I
I I I I I I
I
/ /
Productive employment
o I
70 72 74 76 78 80 82 84 86 88 90 92 94 96
Fuentes: FAO, INEGI, EIR.
such as in manufacturing, has stagnated or
collapsed under IMF policies, whereas nonproductive employment, such as in financial
services, continued to prosper (Figure 3). Using these definitions, we see in Figure
4 that overall productive employment in
Mexico rose slowly to the level of about 8.1
million in 1981, but it stagnated thereafter,
rising to only 8.3 million in I 996---a pathet
ic 2% increase in 15 years. Real unemploy
ment, by comparison, tripled during the
same period, skyrocketing from 5.6 million
to 16.8 million.
In both Figures 3 and 4, a particularly
sharp dip can be seen in 1995, continuing
into 1996. This is a direct reflection of the
near disintegration of the Mexican economy
which occurred in the aftermath of the
December 1994 debt bomb explosion. Over
the course of 1995, interest rates skyrocket
ed, credit dried up, huge amounts of nonperforming debt piled up in the banks, manufacturing, agriculture, and other enterprises
went bankrupt-in short, the economy
imploded. Estimates vary, but most analysts agree that about I million jobs were lost in
1995 alone. Figure 5 presents the employment data
as percentages of the economically active
population. This presentation is perhaps the best way to gain insight into the physical
economic process. More than absolute num
bers, what determines an economy's ability
to reproduce itself is the internal proportions of its labor force-that is, the share or per-
EIR February 28, 1997
FIGURE 5 Composition of the labor force (% of the total) 100%
80
60
40
20
o 71 76 81 86 91 96 • Real unemployment
Non-productive employment • Productive employment
Sources:l<AO, INEGI, £/R.
centage of the total available manpower which is dedicated to each economic task. Thus, in measuring an economy's trajectory, we are well-served to use this shifting met-
FIGURE 6 Productive employment (% of the labor force)
50%
40
30
20
10
o
Infrastructure Sources: FAO, INEGI, £/R.
EIR February 28, 1997
ric, rather than any fixed yardstick. Looked at this way, we see the shocking
growth of the cancer of unemployment, to the point where it has taken over about half of the labor force. Meanwhile, productive employment remained constant throughout the 1970s at the (far too low) level of about 36% of the labor force, but then plummeted to a mere 24% today-a decline of more than one-third. Remember, it is this portion of the labor force which must produce all of the physical economic output required to sustain the entire population; it is they who, so to speak, carry the nation on their shoulders. Fifteen years ago, about one-third of the labor force did that; today, less than onequarter does so.
Ironically, this trend in Mexico almost exactly parallels what happened in the United States during the same time period. U.S. productive employment was 36% of the labor force in 1970, and by 1996 had shrunk to 26% of the total. The only difference is that the United States showed a steady decline over this period, while Mexico was stable from 1970 until about 1981, and then fell apart rapidly.
When we look at the internal composition of Mexico's (shrinking) productive labor force (see Figure 6), we see that almost half of it is engaged in agriculture-a proportionally large share, which is a sign of Mexico's chronic underdevelopment. Thus, industrial operatives and essential infrastructure workers today make up only 6% and 7%, respectively, of the total labor force.
.Industry • Agriculture
Manufacturing vs. maquiladoras
But the true dimensions of the labor force catastrophe brought about in Mexico by IMF policies, only appear when we focus in on the situation in the manufacturing sectOf. Manufacturing is the direct transformation of nature to produce the market basket of consumer and producer goods which an economy requires to progress. Growing employment in manufacturing, reaching perhaps 35 to 40% of the labor force, at rising skill levels, is the sign of a healthy economy. Of that, a rising proportion must be employed in the all-important machine tool sector, which is the principal means whereby technological advances are introduced and spread throughout the economy by the rising skill level of the labor there employed.
Mexico's manufacturing sector is clearly moribund. As Figure 7 shows, employment in manufacturing (including both operatives and administrative employees) remained relatively stable throughout the 1970s, at about 10% of the total labor force. This was not a particularly healthy level: For example, even Spain, a relatively undeveloped European nation, had about 20% of its labor force in manufacturing during this same period. But, with the imposition of IMF policies in 1982, things in Mexico rapidly went from bad to wor se: Employment i n manufacturing dropped off sharply, plunging to under 5% of the labor force in 1996.
In this and subsequent figures on manu-
FIGURE 1 Total employment in manufacturing (% of the labor force) 15%
1 0
5
o 70 72 74 76 78 80 82 84 86 88 90 92 94 96
Sources: FAO, INEGI, £/R.
Physical Economy 27
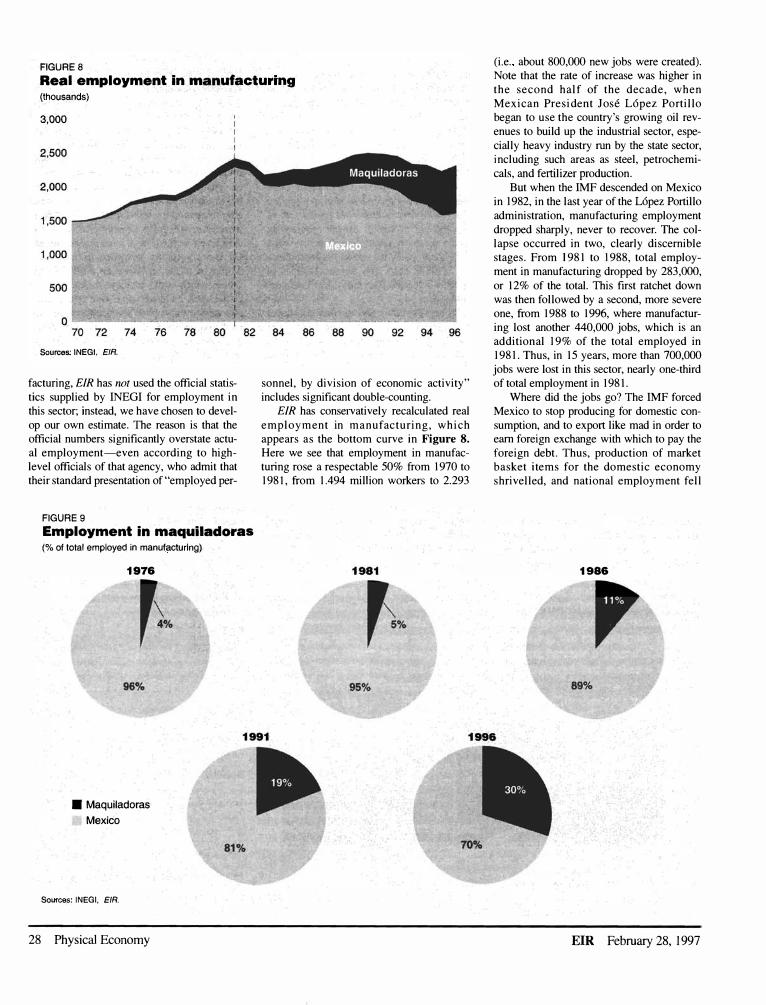
FIGURE 8 Real employmentJ"rn ..... ufa.cturi"g (thousands)
3,000
Sources: INEGI, EIR,
facturing, EIR has not used the official statistics supplied by INEGI for employment in this sector; instead, we have chosen to develop our own estimate. The reason is that the official numbers significantly overstate actual employment-even according to highlevel officials of that agency, who admit that their standard presentation of "employed per-
FIGURE 9 Employment in maquiladoras ('Yo of lolal employed in manufacturing)
1976
� , .,.
96%
• Maquiladoras
Mexico
So�rces: INEGI, £IR.
28 Physical Economy
sonnel, by division of economic activity" includes significant double-counting.
EIR has conservatively recalculated real employment in manufacturing, which appears as the bottom curve in Figure S. Here we see that employment in manufacturing rose a respectable 50% from 1970 to 1981, from 1.494 million workers to 2.293
95%
(i.e" about 800,000 new jobs were created), Note that the rate of increase was higher in the second half of the decade, when Mexican President Jose L6pez Portillo began to use the country's growing oil revenues to build up the industrial sector, especially heavy industry run by the state sector, including such areas as steel, petrochemicals, and fertilizer production.
But when the IMF descended on Mexico in 1982, in the last year of the L6pez Portillo administration, manufacturing employment dropped sharply, never to recover, The collapse occurred in two, clearly discernible stages. From 1981 to 1988, total employment in manufacturing dropped by 283,000, or 12% of the total. This first ratchet down was then followed by a second, more severe one, from 1988 to 1996, where manufacturing lost another 440,000 jobs, which is an additional 19% of the total employed in 1981. Thus, in 15 years, more than 700,000 jobs were lost in this sector, nearly one-third of total employment in 1981.
Where did the jobs go? The IMF forced Mexico to stop producing for domestic consumption, and to export like mad in order to earn foreign exchange with which to pay the foreign debt. Thus, production of market basket i tems for the domestic economy shrivelled, and national employment fell
1986
, 89".4.
EIR February 28, 1997
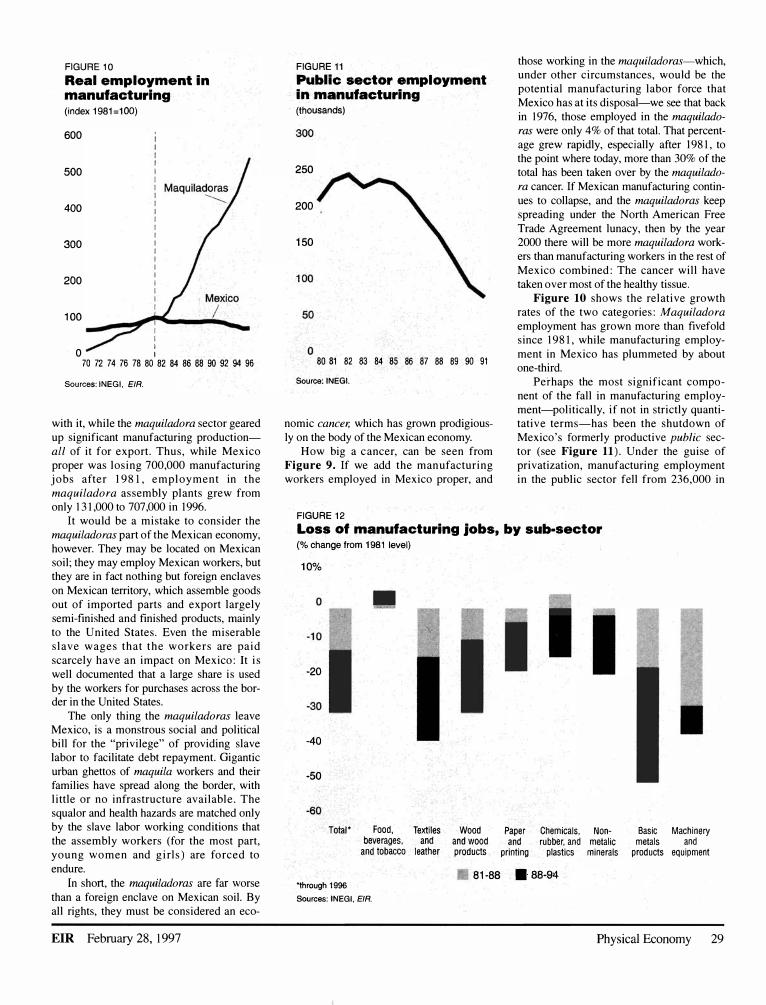
FIGURE 10 Real employment in manufacturing (index 1981=100)
600
500
400
300
200
100 ___ �.....-:� ___ ........... I I
o : 70 72 74 76 78 80 82 84 86 8890 9294 96
Sources: INEGI, EIR.
with it, while the maquiladora sector geared up significant manufacturing productional/ of it for export. Thus, while Mexico proper was losing 700,000 manufacturing jobs after 1981, employment in the maquiladora assembly plants grew from only 13 1,000 to 707,000 in 1996.
It would be a mistake to consider the maquiladoras part of the Mexican economy, however. They may be located on Mexican soil; they may employ Mexican workers, but they are in fact nothing but foreign enclaves on Mexican territory, which assemble goods out of imported parts and export largely semi-finished and finished products, mainly to the United States. Even the miserable slave wages that the workers are paid scarcely have an impact on Mexico: It is well documented that a large share is used by the workers for purchases across the border in the United States.
The only thing the maquiladoras leave Mexico, is a monstrous social and political bill for the "privilege" of providing slave labor to facilitate debt repayment. Gigantic urban ghettos of maquila workers and their families have spread along the border, with little or no infrastructure available . The squalor and health hazards are matched only by the slave labor working conditions that the assembly workers (for the most part, young women and girls) are forced to endure.
In short, the maquiladoras are far worse than a foreign enclave on Mexican soil. By all rights, they must be considered an eco-
EIR February 28, 1997
FIGURE 11 Public sector employment in rnanufacturlng (thousands)
300
250
200
150
100
50
o 80 81 82 83 848� 86 87 88 89.90 91
Source' INEG!.
nomic cancer, which has grown prodigiously on the body of the Mexican economy.
How big a cancer, can be seen from Figure 9. If we add the manufacturing workers employed in Mexico proper, and
FIGURE 12
those working in the maquiladoras-which, under other circumstances, would be the potential manufacturing labor force that Mexico has at its disposal-we see that back in 1976, those employed in the maquilado
ras were only 4% of that total. That percentage grew rapidly, especially after 198 1, to the point where today, more than 30% of the total has been taken over by the maquilado
ra cancer. If Mexican manufacturing continues to collapse, and the maquiladoras keep spreading under the North American Free Trade Agreement lunacy, then by the year 2000 there will be more maquiladora workers than manufacturing workers in the rest of Mexico combined: The cancer will have taken over most of the healthy tissue.
Figure 10 shows the relative growth rates of the two categories: Maquiladora
employment has grown more than fivefold since 198 1, while manufacturing employment in Mexico has plummeted by about one-third.
Perhaps the most significant component of the fall in manufacturing employment-politically, if not in strictly quantitati ve terms-has been the shutdown of Mexico's formerly productive public sector (see Figure 11). Under the guise of privatization, manufacturing employment in the public sector fell from 236,000 in
Loss of manufacturing jobs, by sub-sector (% change from 1981 level) 10%
o
-10
-20
-30
-40
-50
TOlal' Food, TextileS beve rages, and
and tobacco leather
'through 1996 Sources: INEGI, EIR.
Wood and wood products
81-88
Paper and
printing Chemicals, Non-rubber, .and melalic
plastiCS minerals
.88-94
•
Basic Machinery metals and
products equipment
Physical Economy 29
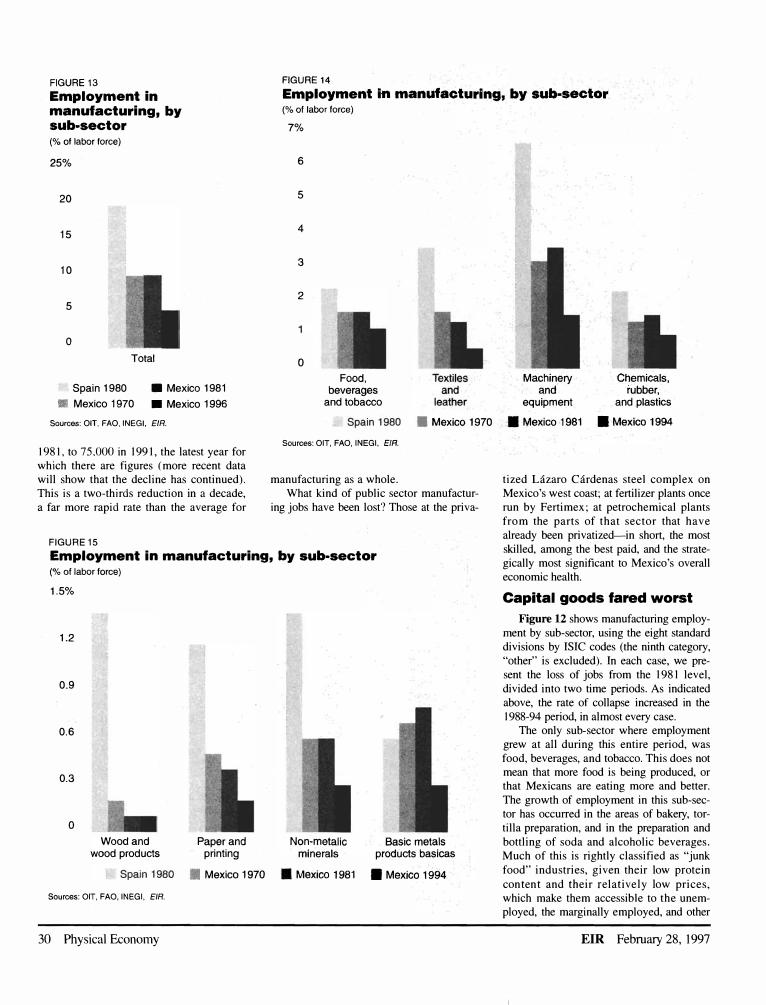
FIGURE 13 Employment in manufacturing, by sub-sector (% of labor force)
25%
20
15
10
5
o
Total
Spain 1980 • Mexico 1981
III Mexico 1970 • Mexico 1996
Sources: OIT, FAO, INEGI, EIR.
1981, to 75,000 in 199 1, the latest year for which there are figures (more recent data will show that the decline has continued). This is a two-thirds reduction in a decade, a far more rapid rate than the average for
FIGURE 15
FIGURE 14
Employment In manufacturihg,·bY sub-sector (%of labor force)
7%
6
5
4
3
2
o
Food, beverages
and tobacco
MachinefY and
equipment
Chemicals, rubber,
and plastics
Spain 1980 • MexicO 1970 • Mexico 1981 •. Mexico 1994
Sources: OIT, FAO, INEGI, EIR.
manufacturing as a whole. What kind of public sector manufactur
ing jobs have been lost? Those at the priva-
Employment in manufacturing, by sub-sector ('Yo of labor force)
tized Lazaro Cardenas steel complex on Mexico's west coast; at fertilizer plants once run by Fertimex; at petrochemical plants from the parts of that sector that have already been privatized-in short, the most skilled, among the best paid, and the strategically most significant to Mexico's overall economic health.
1.5%
1.2
0.9
0.6
0.3
o
Wood and wood products
Spain 1980
Sources: OIT, FAO, INEGI, EIR.
30 Physical Economy
Paper and printing
Mexico 1970
Non-metalic Basic metals minerals products basicas
• Mexico 1981 • Mexico 1994
Capital goods fared worst
Figure 12 shows manufacturing employment by sub-sector, using the eight standard divisions by ISIC codes (the ninth category, "other" is excluded). In each case, we present the loss of jobs from the 198 1 level, divided into two time periods. As indicated above, the rate of collapse increased in the 1988-94 period, in almost every case.
The only sub-sector where employment grew at all during this entire period, was food, beverages, and tobacco. This does not mean that more food is being produced, or that Mexicans are eating more and better. The growth of employment in this sub-sector has occurred in the areas of bakery, tortilla preparation, and in the preparation and bottling of soda and alcoholic beverages. Much of this is rightly classified as "junk food" industries, given their low protein content and their relativel y low prices, which make them accessible to the unemployed, the marginally employed, and other
EIR February 28, 1997
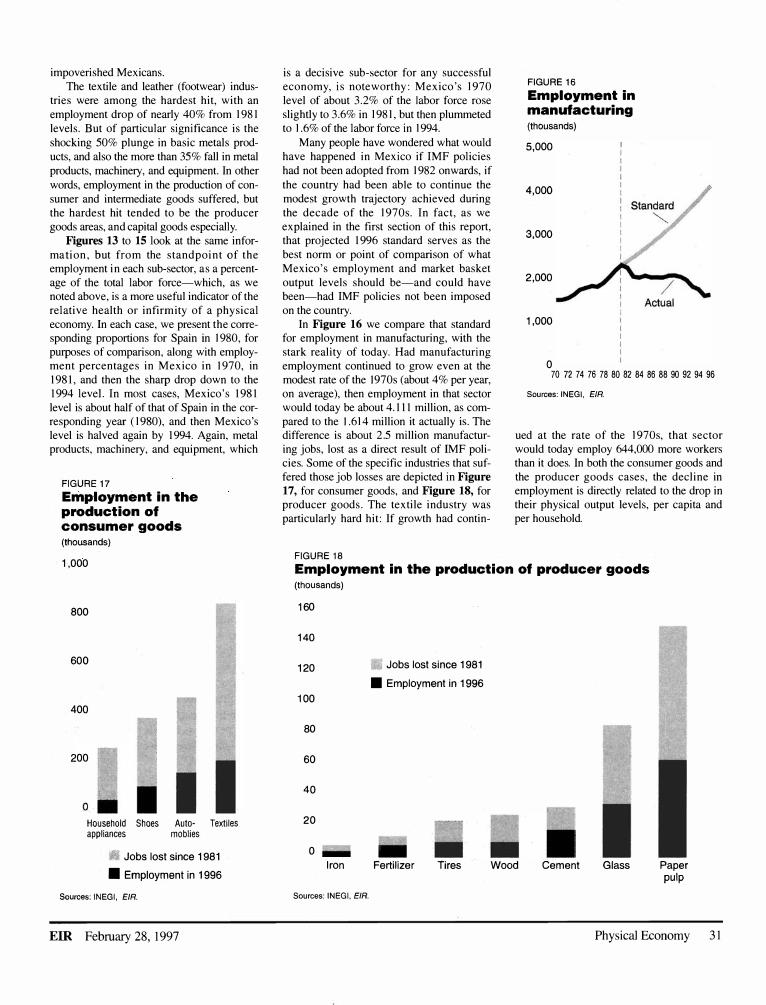
impoverished Mexicans.
The textile and leather (footwear) indus
tries were among the hardest hit, with an
employment drop of nearly 40% from 1981
levels. But of particular significance is the
shocking 50% plunge in basic metals prod
ucts, and also the more than 35% fall in metal
products, machinery, and equipment. In other
words, employment in the production of con
sumer and intermediate goods suffered, but
the hardest hit tended to be the producer
goods areas, and capital goods especially.
Figures 13 to 15 look at the same infor
mation, but from the standpoint of the employment in each sub-sector, as a percent
age of the total labor force-which, as we noted above, is a more useful indicator of the
relative health or infirmity of a physical
economy. In each case, we present the corresponding proportions for Spain in 1980, for
purposes of comparison, along with employment percentages in Mexico in 1970, in
1981, and then the sharp drop down to the
1994 level. In most cases, Mexico's 1981
level is about half of that of Spain in the corresponding year ( 1980), and then Mexico's
level is halved again by 1994. Again, metal products, machinery, and equipment, which
FIGURE 17 Employment in the production of consumer goods (thousands)
1,000
800
600
400
200
!
o I Household Shoes Auto- Textiles appliances moblies
• Jobs lost since 1981
• Employment in 1996
Sources: INEGI. EIR.
EIR February 28, 1997
is a decisive sub-sector for any successful
economy, is noteworthy: Mexico's 1970
level of about 3. 2% of the labor force rose
slightly to 3.6% in 1981, but then plummeted to 1.6% of the labor force in 1994.
Many people have wondered what would
have happened in Mexico if IMF policies
had not been adopted from 1982 onwards, if
the country had been able to continue the
modest growth trajectory achieved during
the decade of the 1970s. In fact, as we
explained in the first section of this report, that projected 1996 standard serves as the
best norm or point of comparison of what
Mexico's employment and market basket
output levels should be-and could have been-had IMF policies not been imposed
on the country.
]n Figure 16 we compare that standard for employment in manufacturing, with the
stark reality of today. Had manufacturing
employment continued to grow even at the modest rate of the I 970s (about 4% per year,
on average), then employment in that sector would today be about 4./11 million, as com
pared to the 1.614 million it actually is. The difference is about 2 .5 million manufactur
ing jobs, lost as a direct result of IMF policies. Some of the specific industries that suf
fered those job losses are depicted in Figure 17, for consumer goods, and Figure 18, for producer goods . The textile industry was
particularly hard hit: If growth had contin-
FIGURE 18
FIGURE 16 Employment in manufacturing (thousands)
5,000
4,000
3,000
2,000
1,000
o 70 72 74 76 78 80 82 84 86 88 90 92 94 96
Sources: INEGI, EIR.
ued at the rate of the 1970s, that sector would today employ 644,000 more workers than it does. In both the consumer goods and
the producer goods cases, the decline in employment is directly related to the drop in
their physical output levels, per capita and per household.
Employment in the production of producer goods (thousands)
160
140
120
100
80
60
40
20
0
Iron
Sources: INEGI, EIR.
Jobs lost since 1981
• Employment in 1996
Fertilizer Tires Wood Cement Glass Paper pulp
Physical Economy 31