Embed Size (px)
Citation preview
1University of Wisconsin and Georgia Institute of Technology
PSERC
Robert H. LasseterUniversity of Wisconsin
Giri VenkataramananUniversity of Wisconsin
A. P. Sakis MeliopoulosGeorgia Institute of Technology© 2001 University of Wisconsin Board of Regents
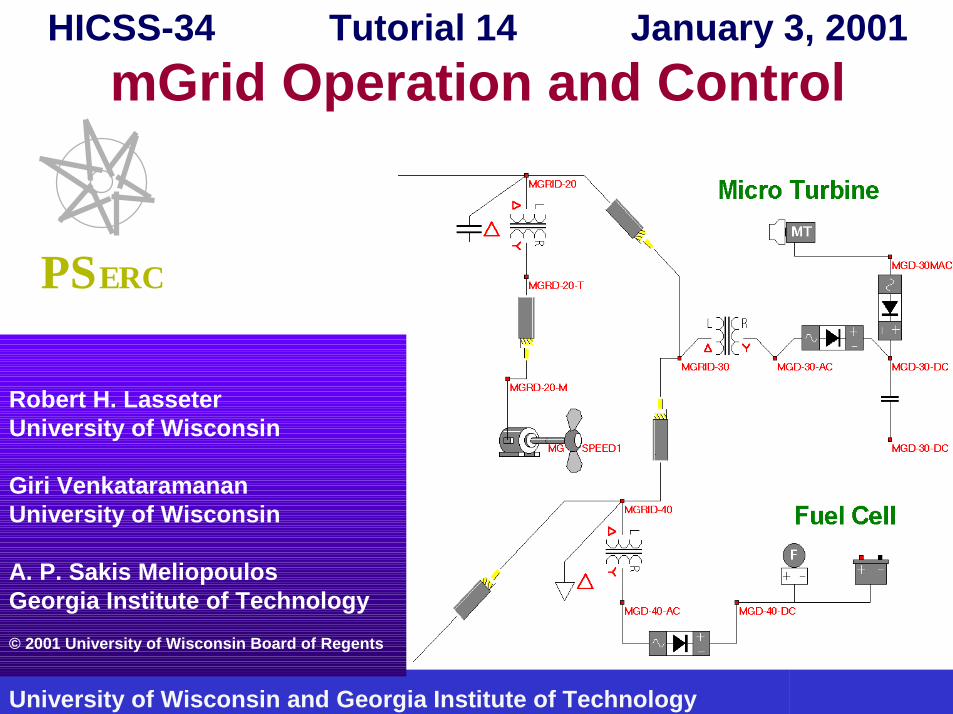
HICSS-34 Tutorial 14 January 3, 2001mGrid Operation and Control
PSERCR.H.Lasseter University-of-Wisconsin
HICSSHICSS--34 34 Tutorial 14Tutorial 14
MicroMicro--Grid Operation and ControlGrid Operation and Control
Robert H. Lasseter University of Robert H. Lasseter University of WisconsinWisconsin
A.P.Sakis Meliopoulos Georgia Institute of A.P.Sakis Meliopoulos Georgia Institute of TechnologyTechnology
Giri Venkataramanan Giri Venkataramanan University of University of WisconsinWisconsin
PSERCR.H.Lasseter University-of-Wisconsin
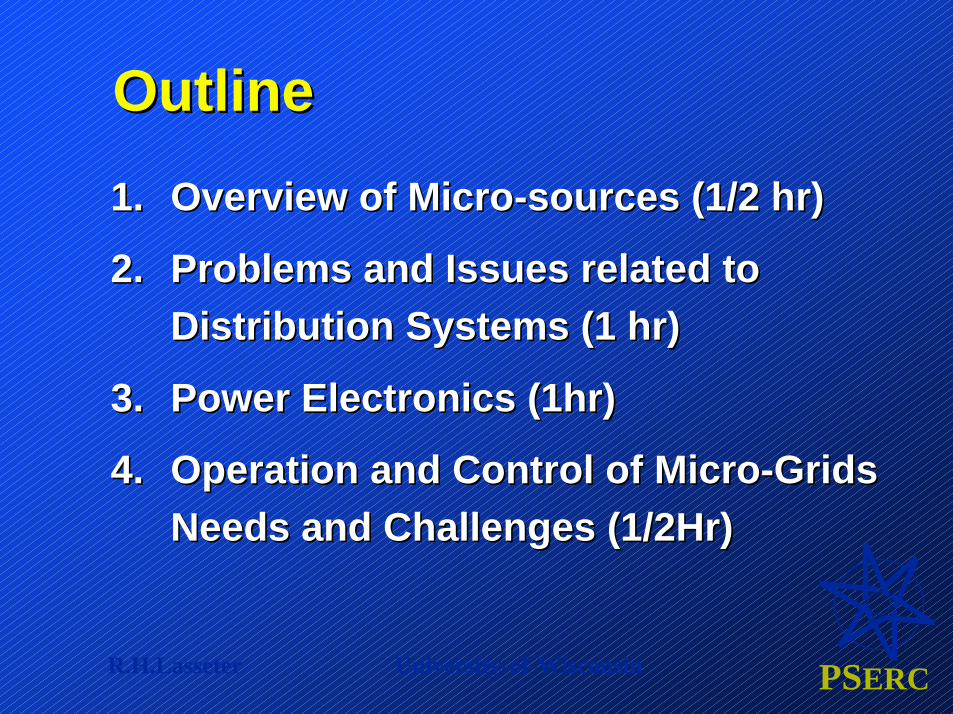
OutlineOutline1.1. Overview of MicroOverview of Micro--sources (1/2 hr)sources (1/2 hr)
2.2. Problems and Issues related to Problems and Issues related to Distribution Systems (1 hr)Distribution Systems (1 hr)
3.3. Power Electronics (1hr)Power Electronics (1hr)
4.4. Operation and Control of MicroOperation and Control of Micro--Grids Grids Needs and Challenges (1/2Hr)Needs and Challenges (1/2Hr)
PSERCR.H.Lasseter University-of-Wisconsin
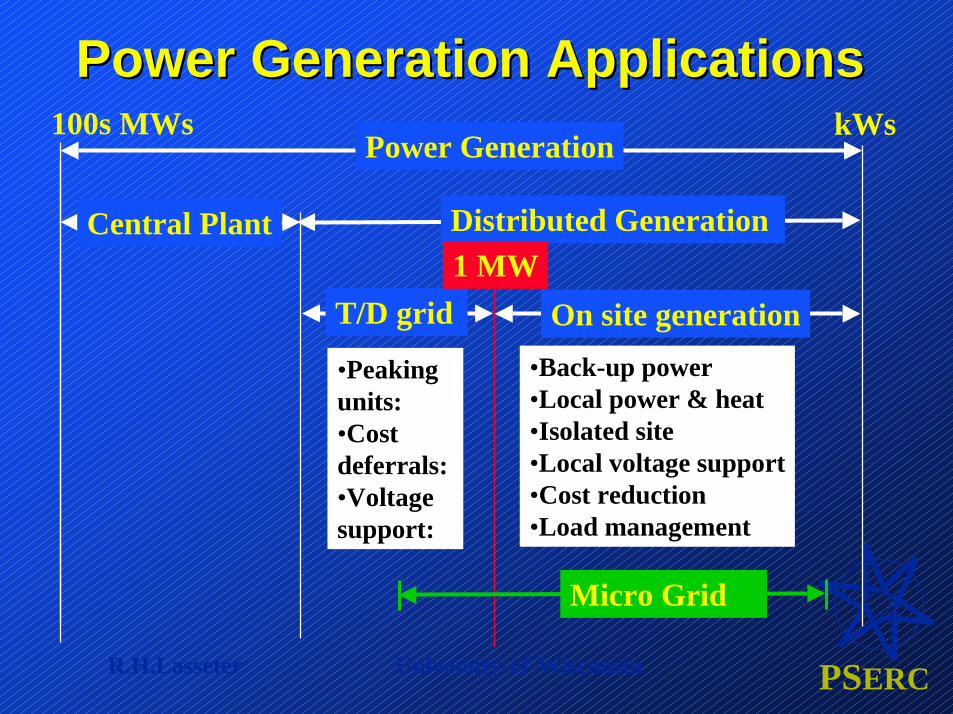
Power Generation ApplicationsPower Generation ApplicationsPower Generation
Central Plant Distributed Generation
•Peaking units:•Cost deferrals:•Voltage support:
On site generationT/D grid•Back-up power •Local power & heat•Isolated site•Local voltage support•Cost reduction•Load management
100s MWs kWs
1 MW
Micro Grid
PSERCR.H.Lasseter University-of-Wisconsin
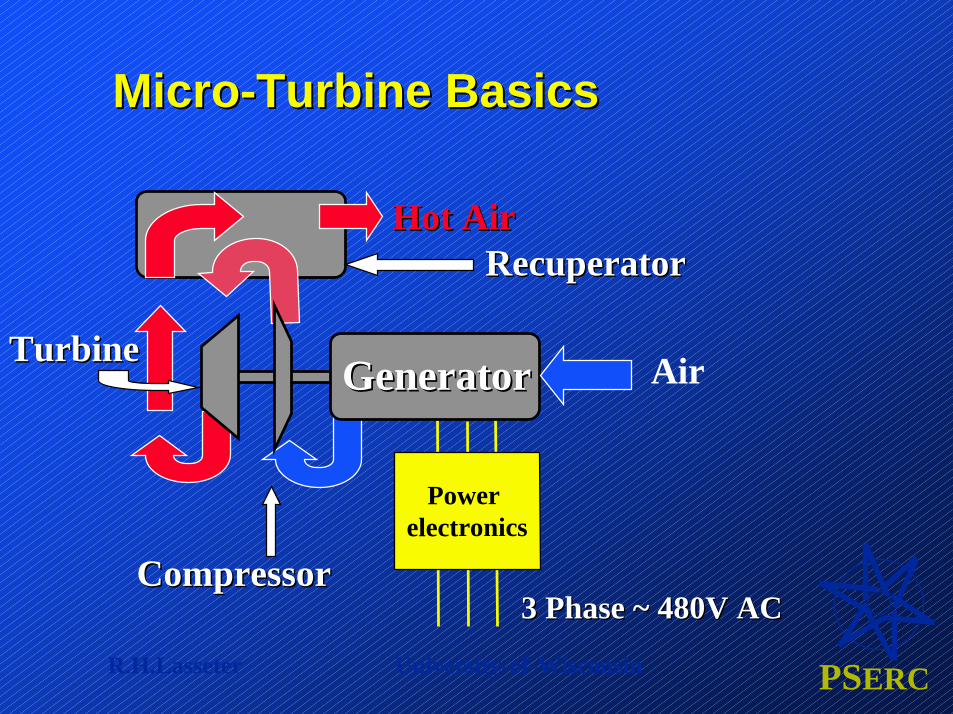
Power electronics
MicroMicro--Turbine Basics Turbine Basics
GeneratorGenerator Air
CompressorCompressor
TurbineTurbine
RecuperatorRecuperator
3 Phase ~ 480V AC3 Phase ~ 480V AC
HotHot AirAir
PSERCR.H.Lasseter University-of-Wisconsin
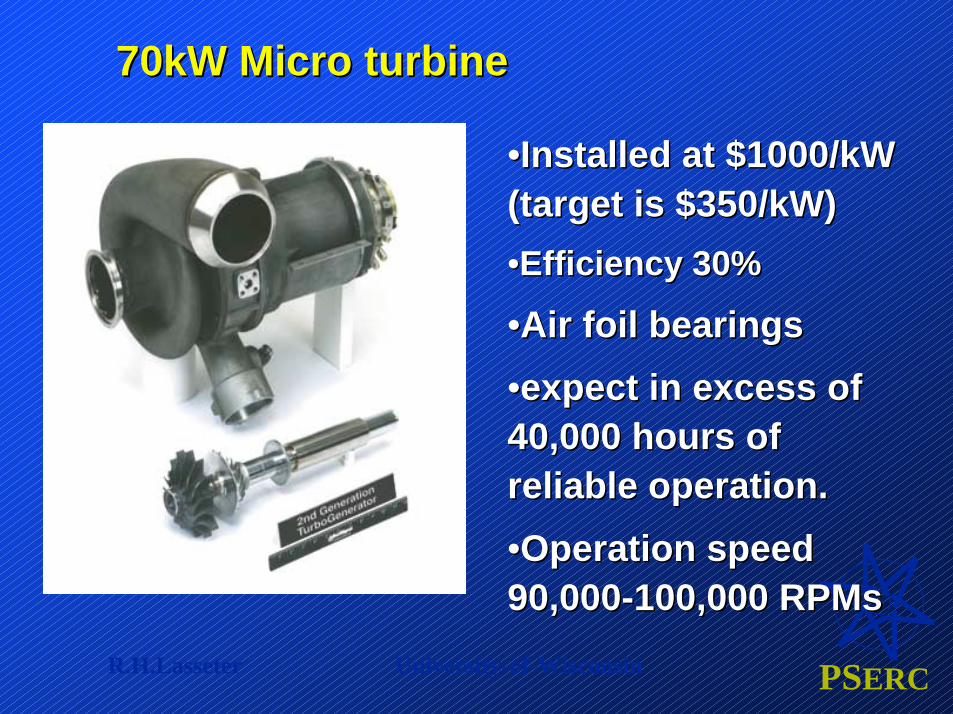
70kW Micro turbine70kW Micro turbine
••Installed at $1000/kW Installed at $1000/kW (target is $350/kW)(target is $350/kW)••Efficiency 30%Efficiency 30%
••Air foil bearingsAir foil bearings••expect in excess of expect in excess of 40,000 hours of 40,000 hours of reliable operation.reliable operation.••Operation speed Operation speed 90,00090,000--100,000 RPMs100,000 RPMs
PSERCR.H.Lasseter University-of-Wisconsin
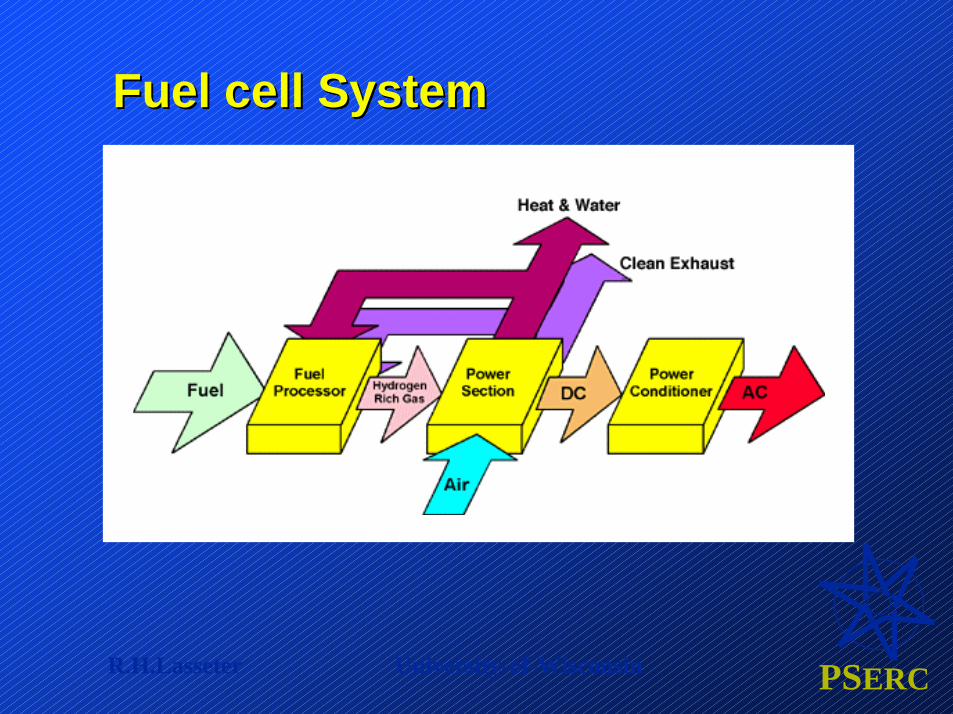
Fuel cell SystemFuel cell System
PSERCR.H.Lasseter University-of-Wisconsin
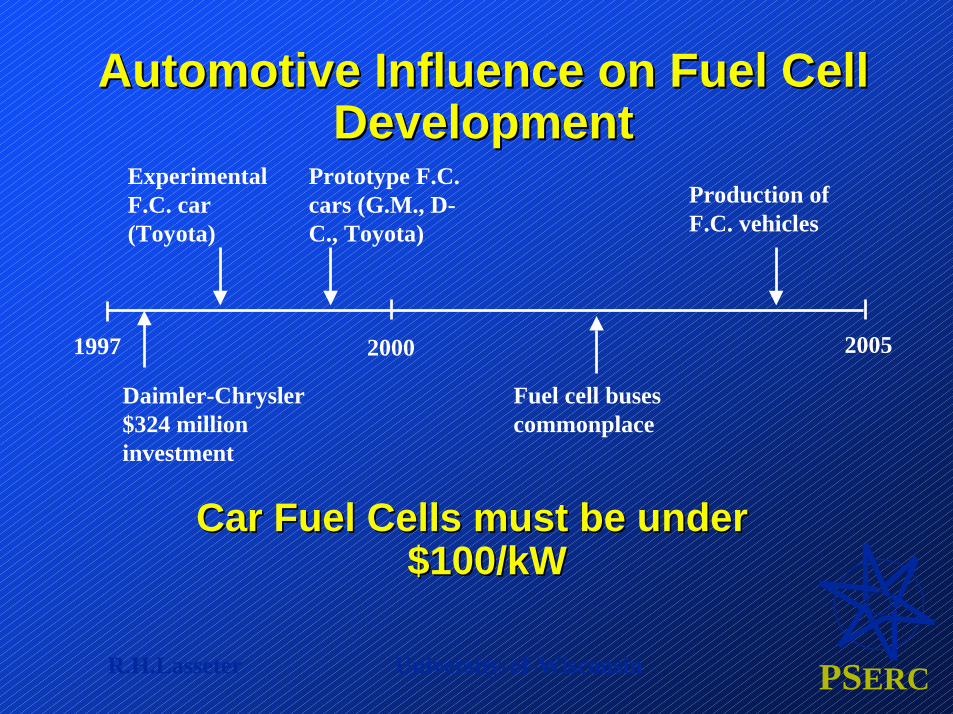
Automotive Influence on Fuel Cell Automotive Influence on Fuel Cell DevelopmentDevelopment
Car Fuel Cells must be under Car Fuel Cells must be under $100/kW$100/kW
Experimental F.C. car (Toyota)
Prototype F.C. cars (G.M., D-C., Toyota)
20001997 2005
Production of F.C. vehicles
Daimler-Chrysler $324 million investment
Fuel cell buses commonplace
PSERCR.H.Lasseter University-of-Wisconsin
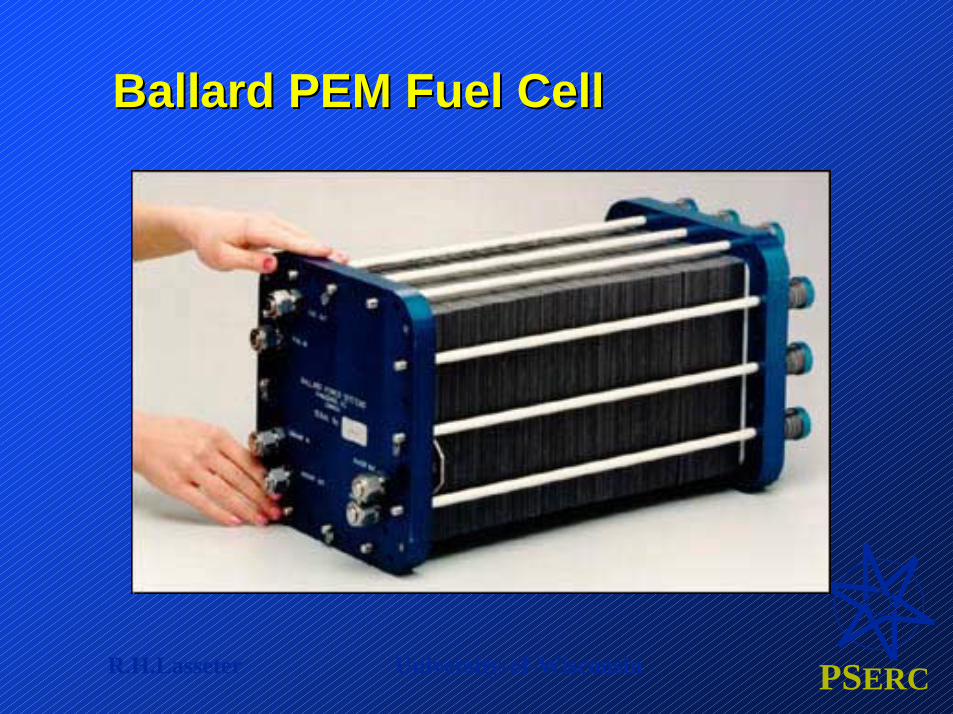
Ballard PEM Fuel CellBallard PEM Fuel Cell
PSERCR.H.Lasseter University-of-Wisconsin
7 kW Plug Power System7 kW Plug Power SystemPEM Fuel Cell/water heaterPEM Fuel Cell/water heater
QuickTime™ and aPhoto - JPEG decompressor
are needed to see this picture.
PSERCR.H.Lasseter University-of-Wisconsin
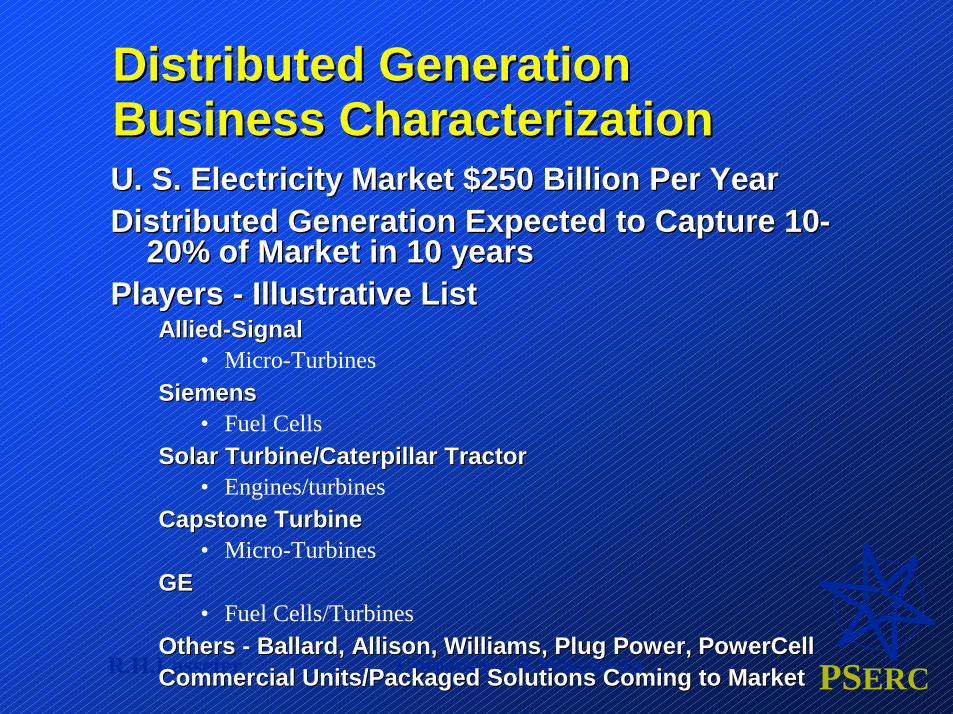
Distributed Generation Distributed Generation Business CharacterizationBusiness CharacterizationU. S. Electricity Market $250 Billion Per YearU. S. Electricity Market $250 Billion Per YearDistributed Generation Expected to Capture 10Distributed Generation Expected to Capture 10--
20% of Market in 10 years20% of Market in 10 yearsPlayers Players -- Illustrative ListIllustrative List
AlliedAllied--SignalSignal• Micro-Turbines
SiemensSiemens• Fuel Cells
Solar Turbine/Caterpillar TractorSolar Turbine/Caterpillar Tractor• Engines/turbines
Capstone TurbineCapstone Turbine• Micro-Turbines
GEGE• Fuel Cells/Turbines
Others Others -- Ballard, Allison, Williams, Plug Power, Ballard, Allison, Williams, Plug Power, PowerCellPowerCellCommercial Units/Packaged Solutions Coming to MarketCommercial Units/Packaged Solutions Coming to Market
PSERCR.H.Lasseter University-of-Wisconsin
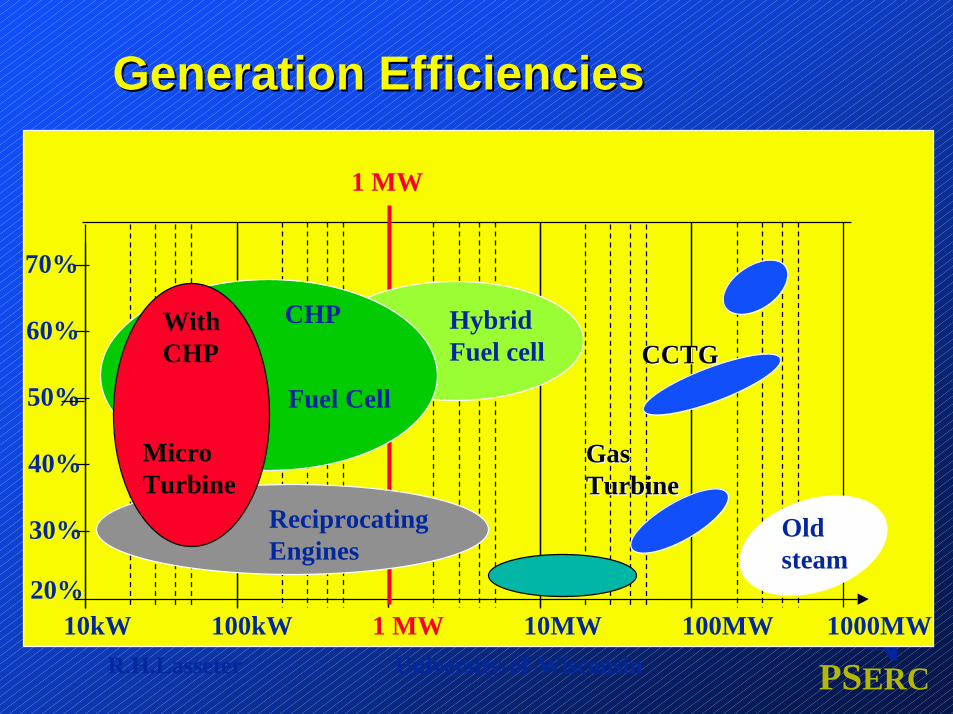
Generation EfficienciesGeneration Efficiencies
10kW 100kW 1 MW 10MW 100MW 1000MW 20%
30%
40%
50%
60%
70%
Micro Turbine
CHP
Fuel Cell
WithCHP
HybridFuel cell
ReciprocatingEngines
CCTGCCTG
GasGasTurbineTurbine
Oldsteam
1 MW
PSERCR.H.Lasseter University-of-Wisconsin
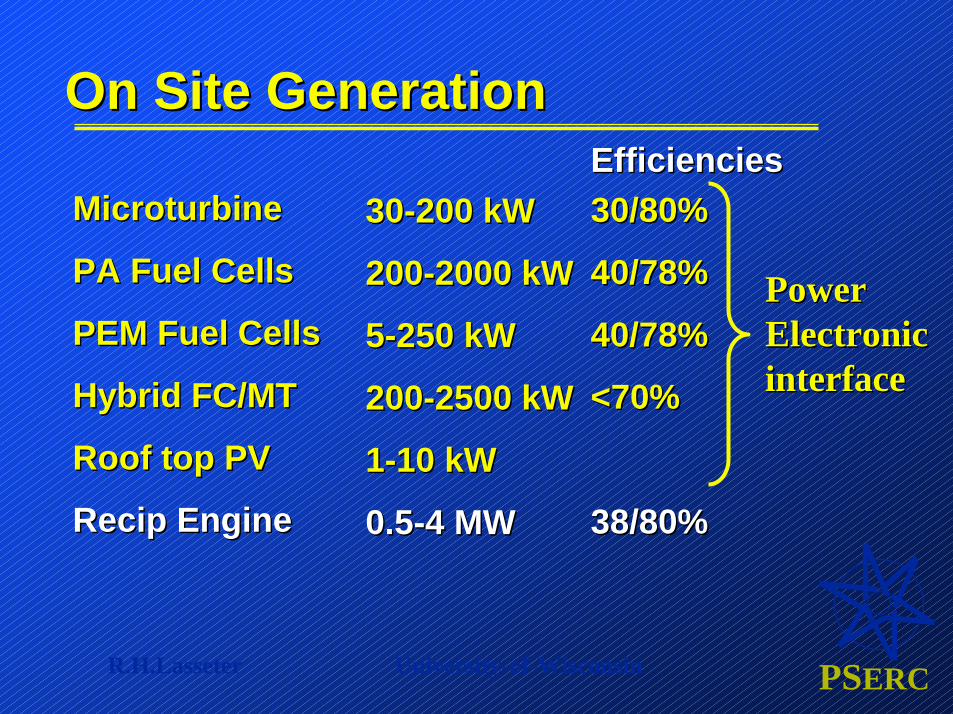
MicroturbineMicroturbine
PA Fuel CellsPA Fuel Cells
PEM Fuel CellsPEM Fuel Cells
Hybrid FC/MTHybrid FC/MT
Roof top PVRoof top PV
Recip EngineRecip Engine
On Site GenerationOn Site Generation
3030--200 kW200 kW
200200--2000 kW2000 kW
55--250 kW250 kW
200200--2500 kW2500 kW
11--10 kW10 kW
0.50.5--4 MW4 MW
EfficienciesEfficiencies30/80%30/80%
40/78%40/78%
40/78%40/78%
<70%<70%
38/80%38/80%
Power Power Electronic Electronic interfaceinterface
PSERCR.H.Lasseter University-of-Wisconsin
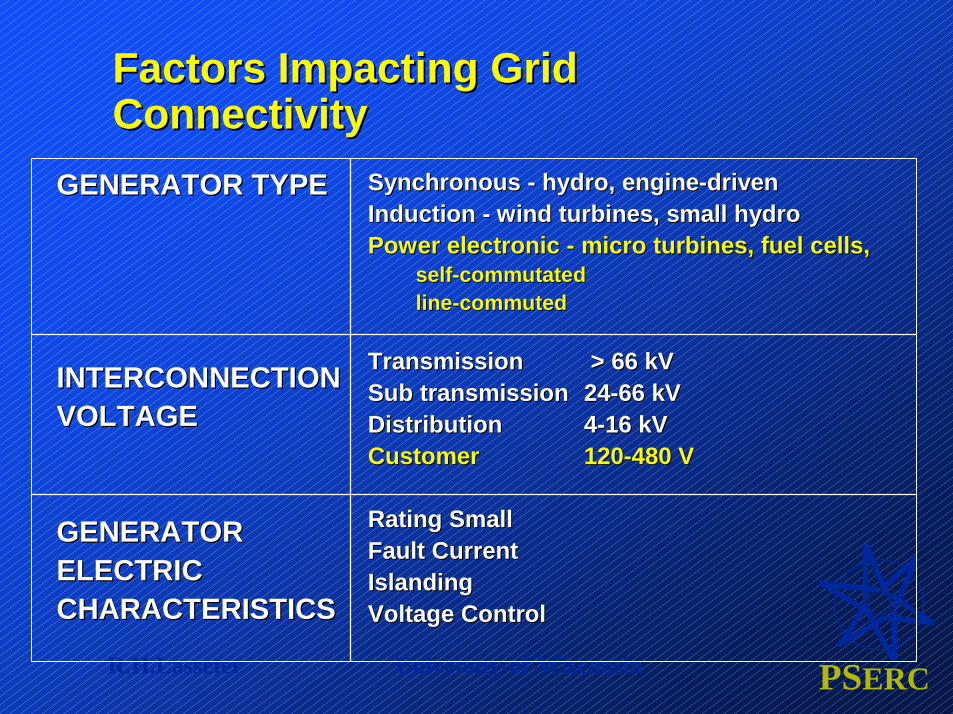
Factors Impacting Grid Factors Impacting Grid ConnectivityConnectivity
GENERATOR TYPEGENERATOR TYPE
INTERCONNECTIONINTERCONNECTIONVOLTAGEVOLTAGE
GENERATORGENERATORELECTRICELECTRICCHARACTERISTICSCHARACTERISTICS
Synchronous Synchronous -- hydro, enginehydro, engine--drivendrivenInduction Induction -- wind turbines, small hydrowind turbines, small hydroPower electronic Power electronic -- micro turbines, fuel cells, micro turbines, fuel cells,
selfself--commutatedcommutatedlineline--commutedcommuted
TransmissionTransmission > 66 kV> 66 kVSub transmissionSub transmission 2424--66 kV66 kVDistributionDistribution 44--16 kV16 kVCustomerCustomer 120120--480 V480 V
Rating SmallRating SmallFault CurrentFault CurrentIslandingIslandingVoltage ControlVoltage Control
PSERCR.H.Lasseter University-of-Wisconsin
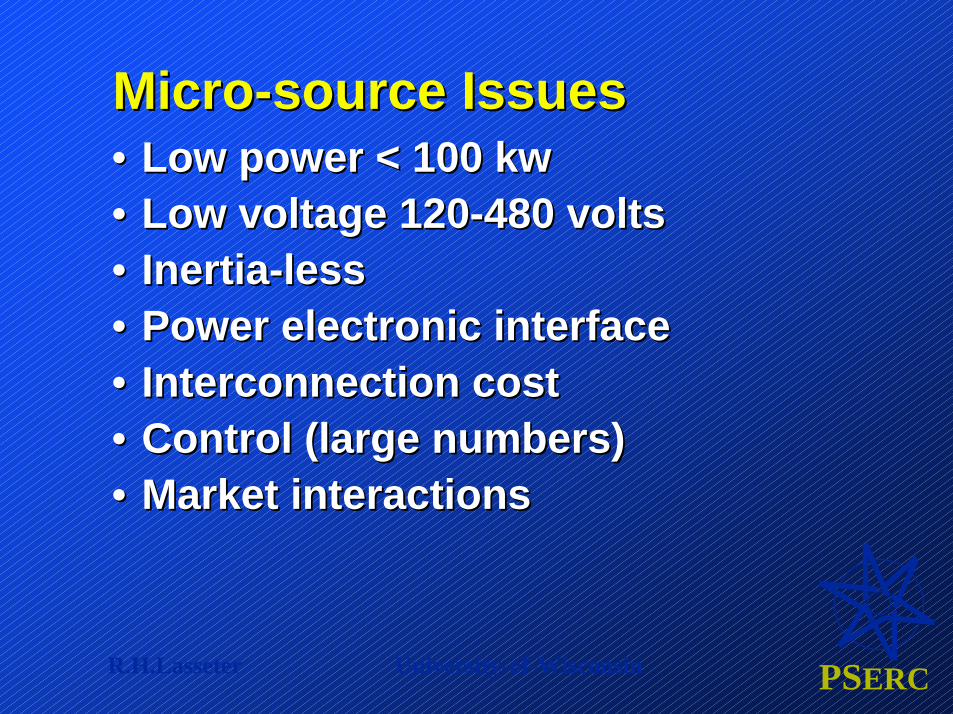
MicroMicro--source Issuessource Issues•• Low power < 100Low power < 100 kwkw•• Low voltage 120Low voltage 120--480 volts480 volts•• InertiaInertia--lessless•• Power electronic interfacePower electronic interface•• Interconnection costInterconnection cost•• Control (large numbers)Control (large numbers)•• Market interactionsMarket interactions
PSERCR.H.Lasseter University-of-Wisconsin
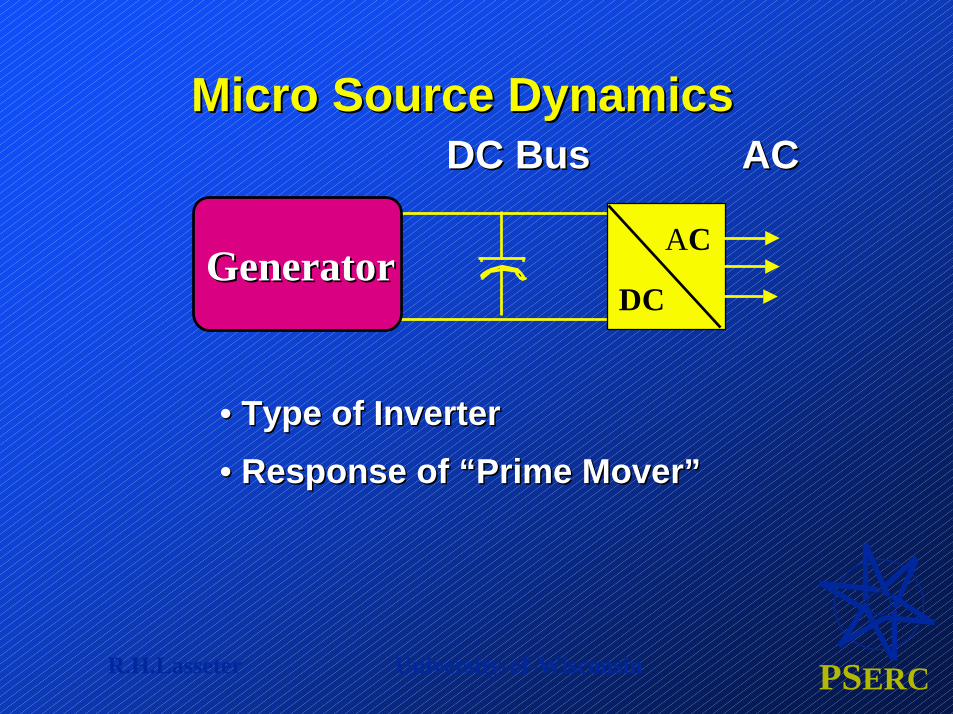
Micro Source Dynamics Micro Source Dynamics
•• Type of InverterType of Inverter•• Response of “Prime Mover”Response of “Prime Mover”
AC
DC
DC BusDC Bus ACAC
GeneratorGenerator
PSERCR.H.Lasseter University-of-Wisconsin
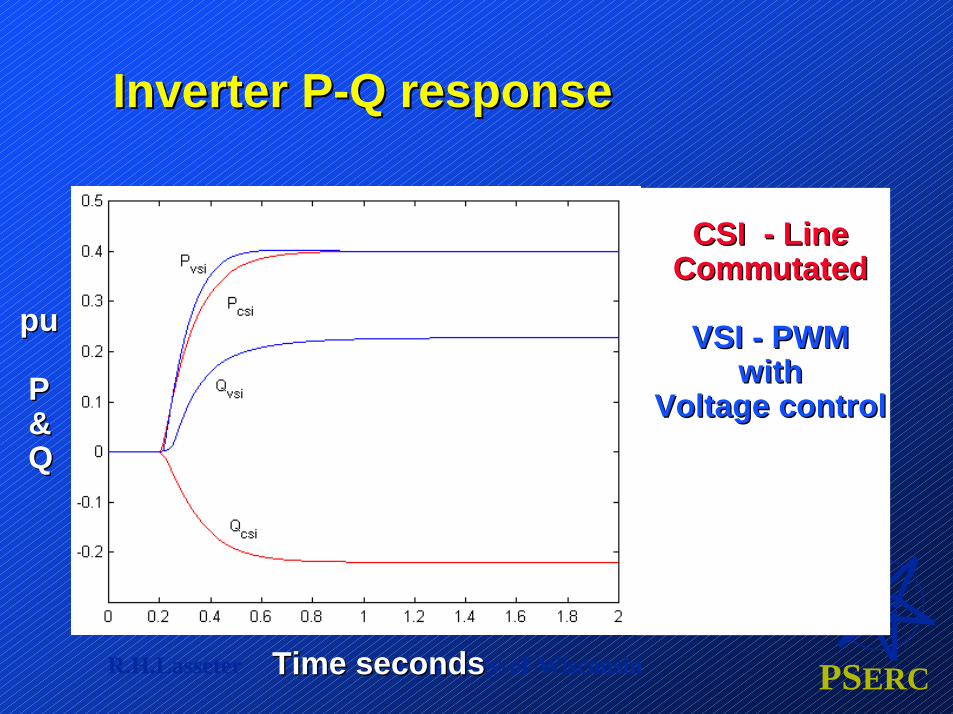
Inverter PInverter P--Q response Q response
Line
CSI CSI -- LineLineCommutatedCommutated
VSI VSI -- PWMPWMwithwith
Voltage controlVoltage control
Line Commutated
Time secondsTime seconds
pupu
PP&&QQ
PSERCR.H.Lasseter University-of-Wisconsin
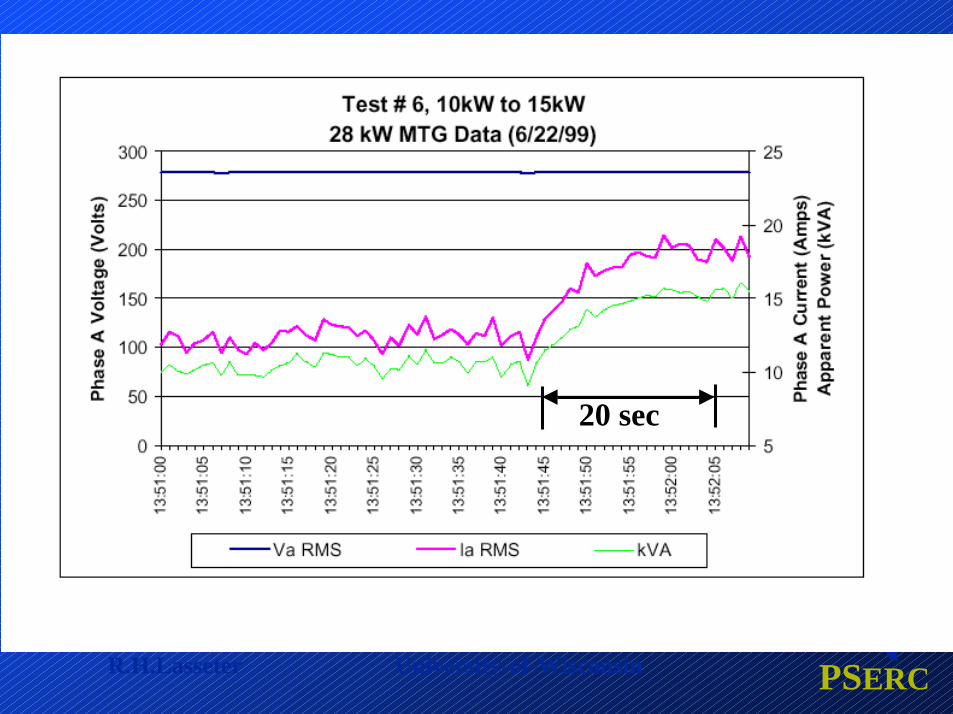
20 sec
PSERCR.H.Lasseter University-of-Wisconsin
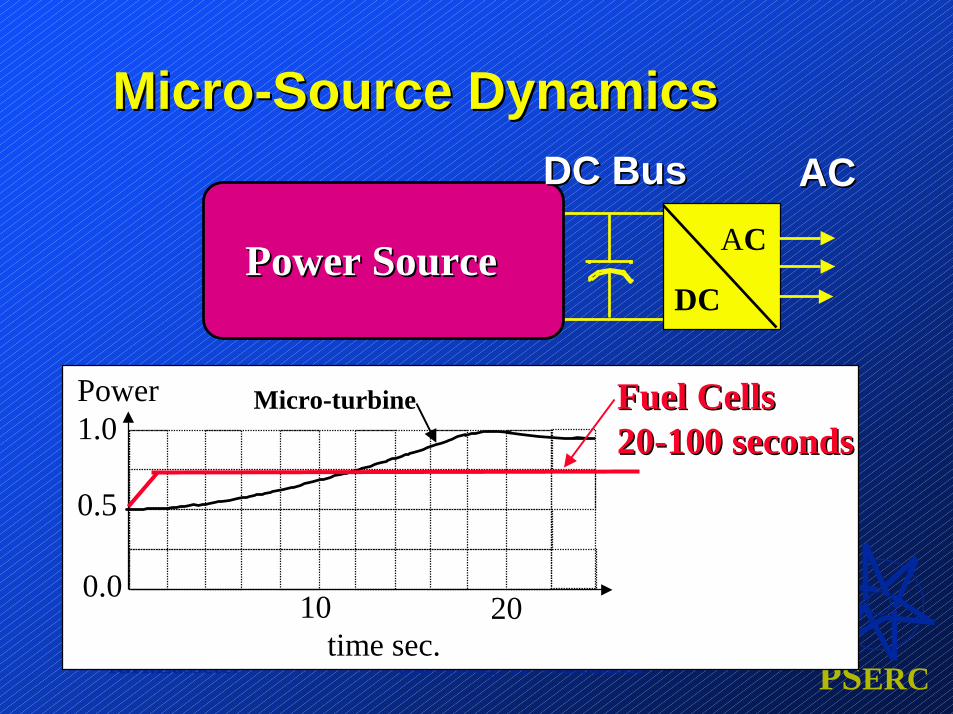
MicroMicro--Source DynamicsSource Dynamics
ACPower SourcePower SourceDC
DC BusDC Bus ACAC
Power 1.0
0.5
10time sec.
0.020
Fuel Cells Fuel Cells 2020--100 seconds100 seconds
Micro-turbine
PSERCR.H.Lasseter University-of-Wisconsin
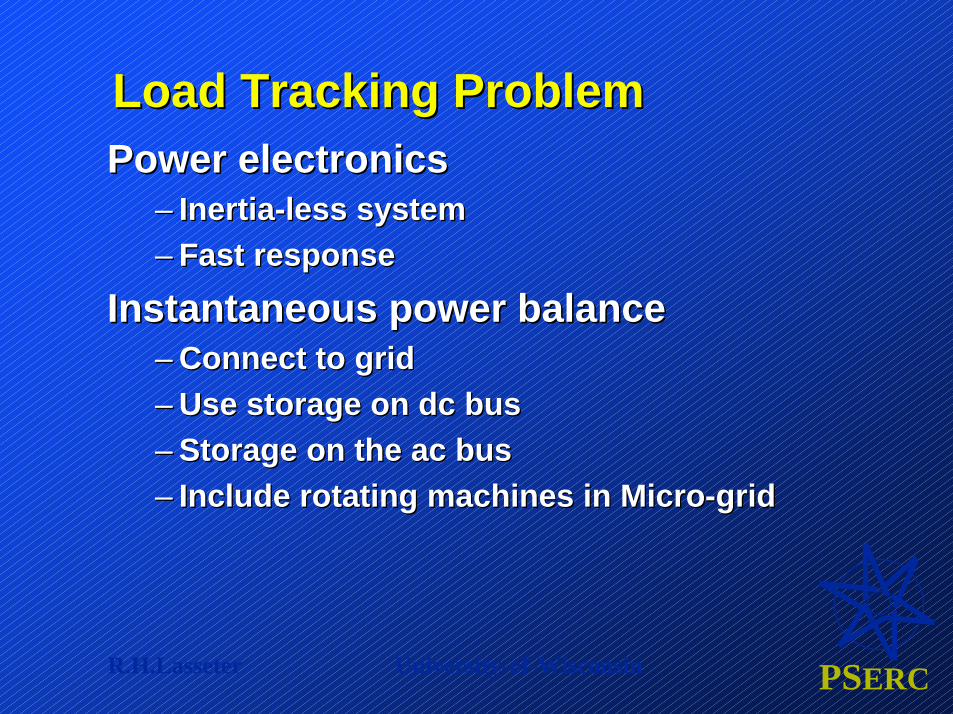
Load Tracking ProblemLoad Tracking ProblemPower electronicsPower electronics
–– InertiaInertia--less systemless system–– Fast responseFast response
Instantaneous power balanceInstantaneous power balance–– Connect to gridConnect to grid–– Use storage on dc busUse storage on dc bus–– Storage on the ac busStorage on the ac bus–– Include rotating machines in MicroInclude rotating machines in Micro--gridgrid
PSERCR.H.Lasseter University-of-Wisconsin
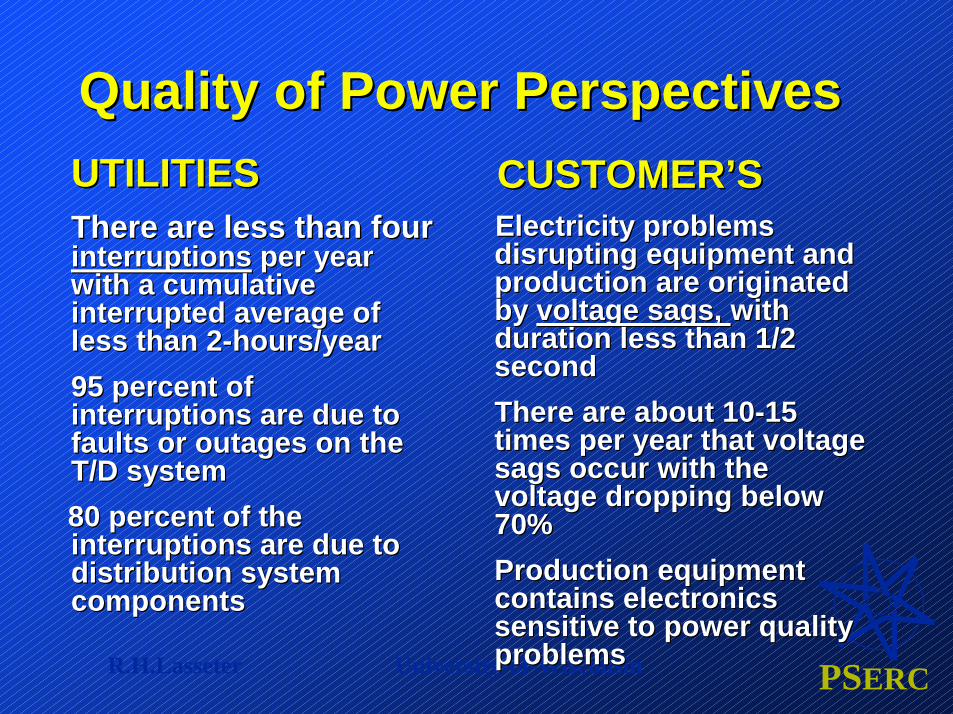
Quality of Power PerspectivesQuality of Power PerspectivesUTILITIESUTILITIESThere are less than four There are less than four interruptionsinterruptions per year per year with a cumulative with a cumulative interrupted average of interrupted average of less than 2less than 2--hours/yearhours/year95 percent of 95 percent of interruptions are due to interruptions are due to faults or outages on the faults or outages on the T/D systemT/D system80 percent of the 80 percent of the interruptions are due to interruptions are due to distribution system distribution system componentscomponents
CUSTOMER’SCUSTOMER’SElectricity problems Electricity problems disrupting equipment and disrupting equipment and production are originated production are originated by by voltage sags, voltage sags, with with duration less than 1/2 duration less than 1/2 secondsecondThere are about 10There are about 10--15 15 times per year that voltage times per year that voltage sags occur with the sags occur with the voltage dropping below voltage dropping below 70%70%Production equipment Production equipment contains electronics contains electronics sensitive to power quality sensitive to power quality problemsproblems
PSERCR.H.Lasseter University-of-Wisconsin
MicroMicro--grid concept assumes:grid concept assumes:•• Large clusters of microLarge clusters of micro--sources and sources and
storage systemsstorage systems•• Close to loads with possible CHP Close to loads with possible CHP
applicationsapplications•• Provide Quality of Power required by Provide Quality of Power required by
CustomerCustomer•• Presented to the grid as a single Presented to the grid as a single
controllable unit (load & source)controllable unit (load & source)
PSERCR.H.Lasseter University-of-Wisconsin
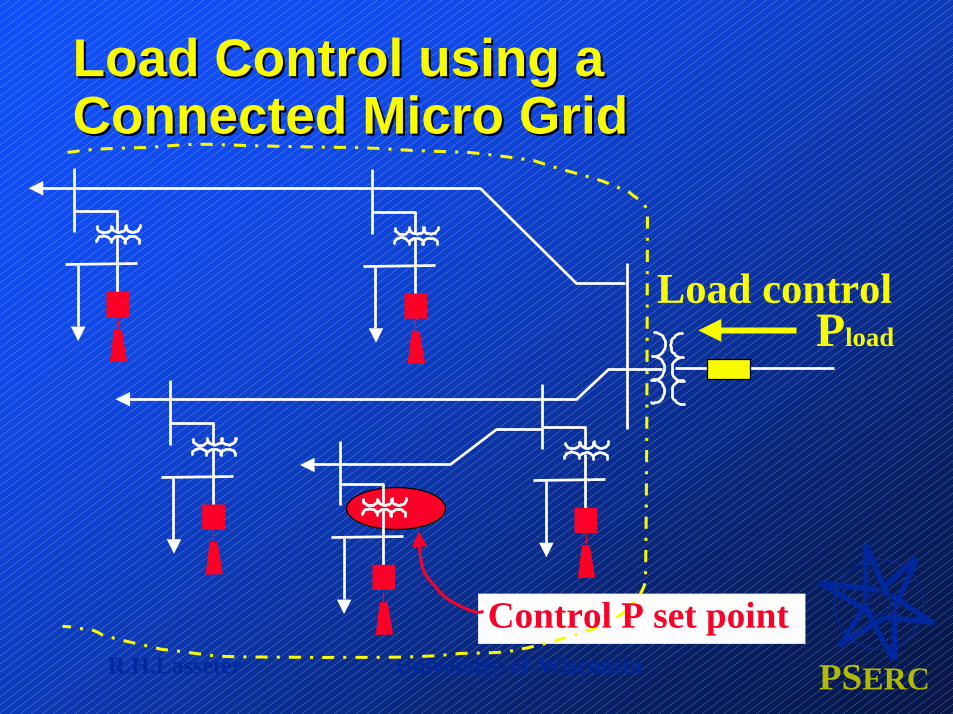
Load Control using a Load Control using a Connected Micro GridConnected Micro Grid
Load control
Control P set point
Pload
PSERCR.H.Lasseter University-of-Wisconsin
NextNext
1.1. Problems and Issues related to Problems and Issues related to Distribution Systems Power Distribution Systems Power
2.2. Power Electronics SourcesPower Electronics Sources
1Georgia TechPSERC
Problems and IssuesRelated toDistribution Systems
A. P. Sakis MeliopoulosGeorgia Institute of Technology
mGrid Operation and Control
Tutorial 14HICSS-34Jan 3, 2001
2Georgia TechPSERC
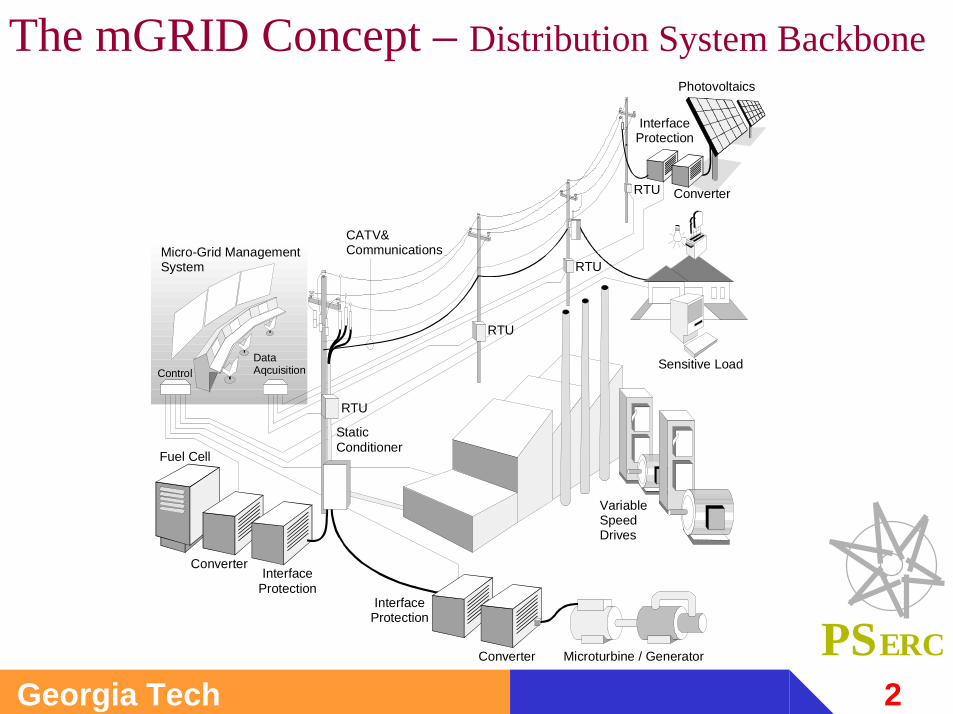
Converter
InterfaceProtection
Photovoltaics
Micro-Grid ManagementSystem
CATV&Communications
VariableSpeedDrives
Sensitive Load
StaticConditioner
InterfaceProtection
Converter
Fuel Cell
InterfaceProtection
Converter Microturbine / Generator
RTU
RTU
RTU
RTU
DataAqcuisitionControl
The mGRID Concept – Distribution System Backbone
3Georgia TechPSERC
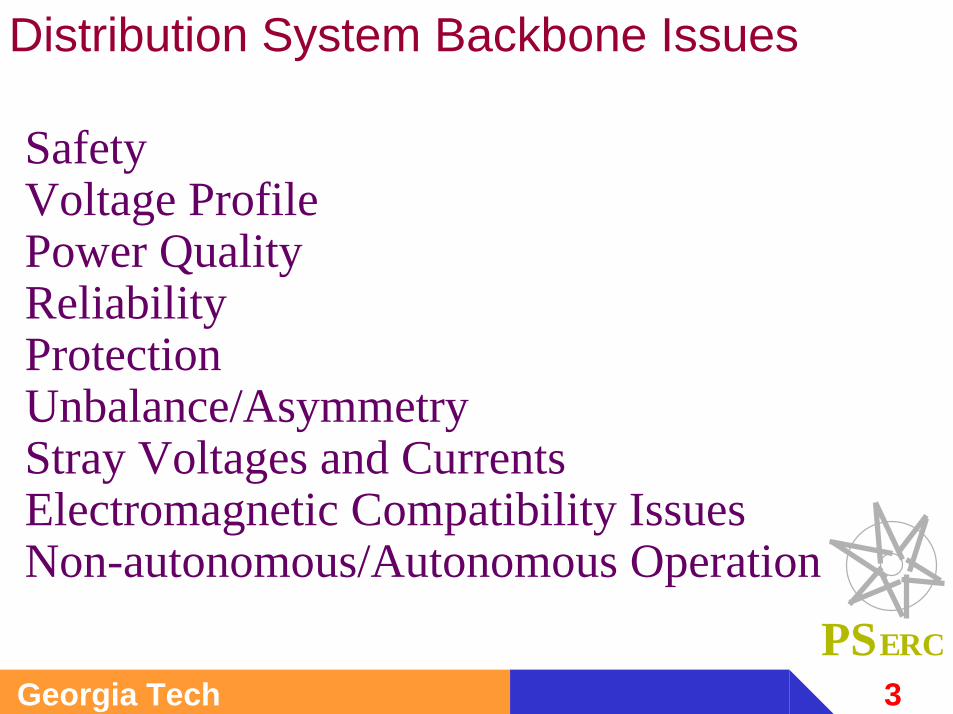
Distribution System Backbone Issues
SafetyVoltage ProfilePower QualityReliabilityProtectionUnbalance/AsymmetryStray Voltages and CurrentsElectromagnetic Compatibility IssuesNon-autonomous/Autonomous Operation
4Georgia TechPSERC
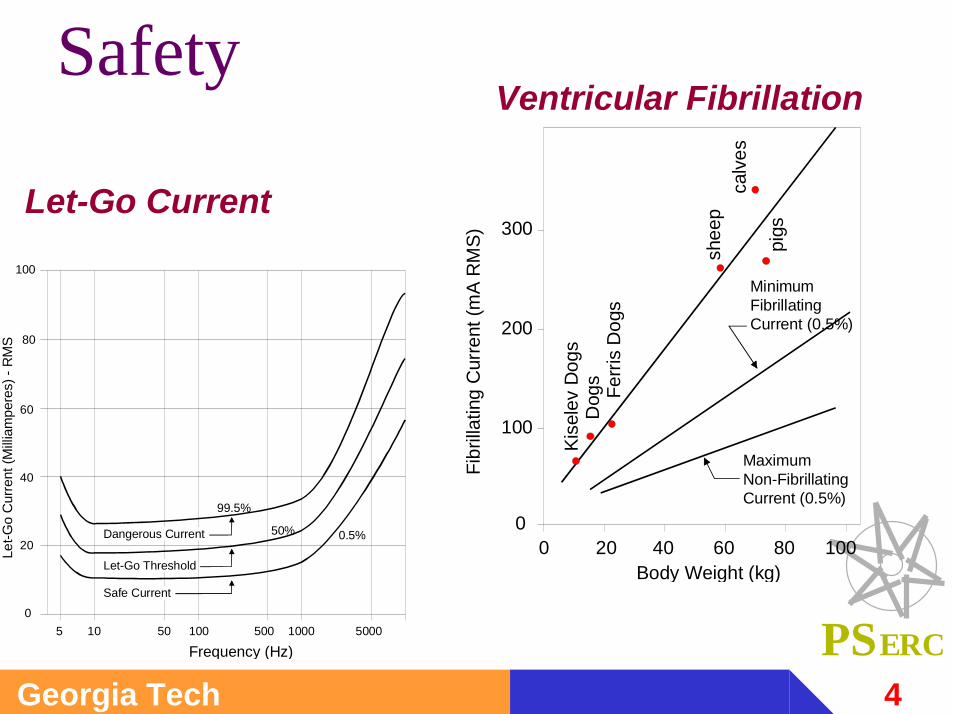
Let-Go Current
Ventricular Fibrillation
5 10 50 100 500 1000 50000
20
40
60
80
100
Dangerous Current
Let-Go Threshold
Safe Current
Frequency (Hz)
Let-G
o C
urre
nt (M
illiam
pere
s) -
RM
S
99.5%
50% 0.5%
Body Weight (kg)
Fibr
illatin
g C
urre
nt (m
A R
MS)
0
100
200
300
0 10020 40 60 80
MaximumNon-FibrillatingCurrent (0.5%)
MinimumFibrillatingCurrent (0.5%)
Dog
s
shee
pca
lves
pigs
Kise
lev
Dog
s
Ferri
s D
ogs
Safety
5Georgia TechPSERC
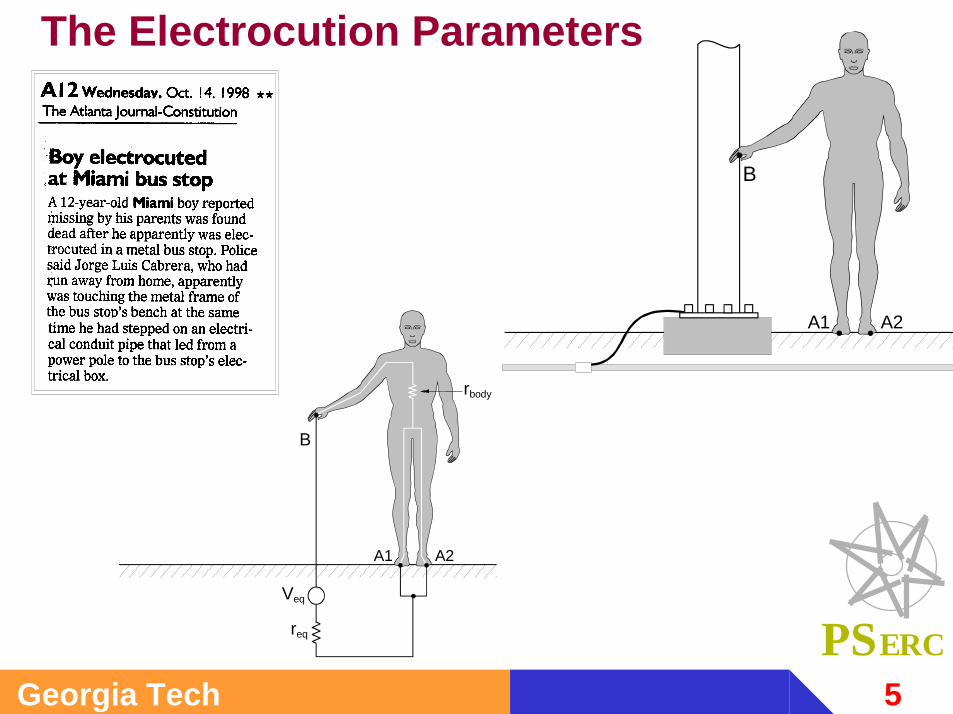
A2A1
B
The Electrocution Parameters
A2A1
Veq
req
B
rbody
6Georgia TechPSERC
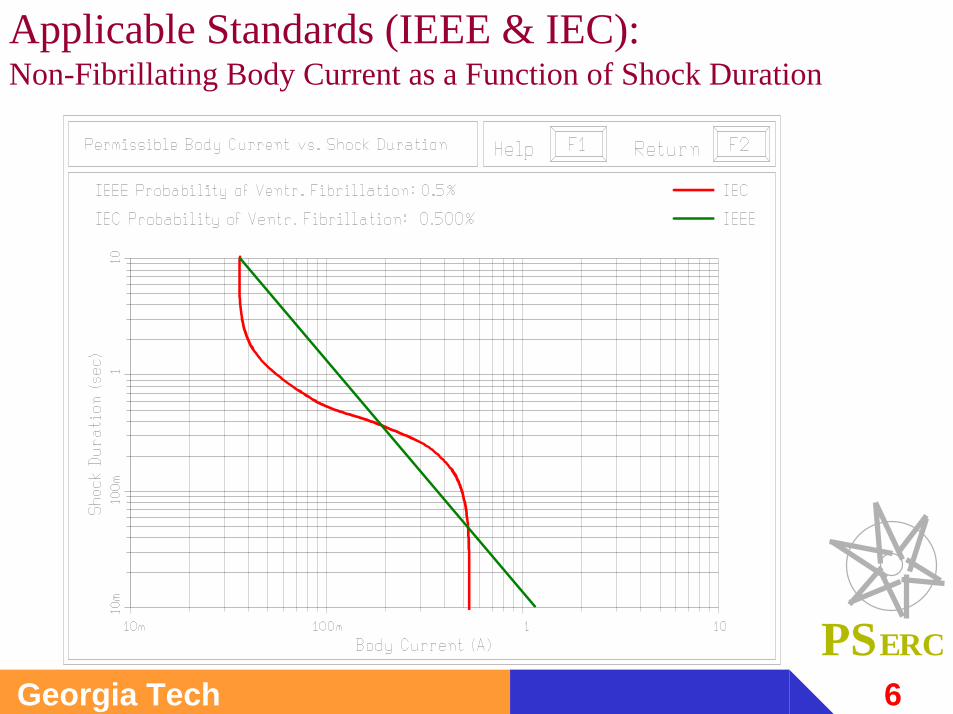
Applicable Standards (IEEE & IEC):Non-Fibrillating Body Current as a Function of Shock Duration
7Georgia TechPSERC
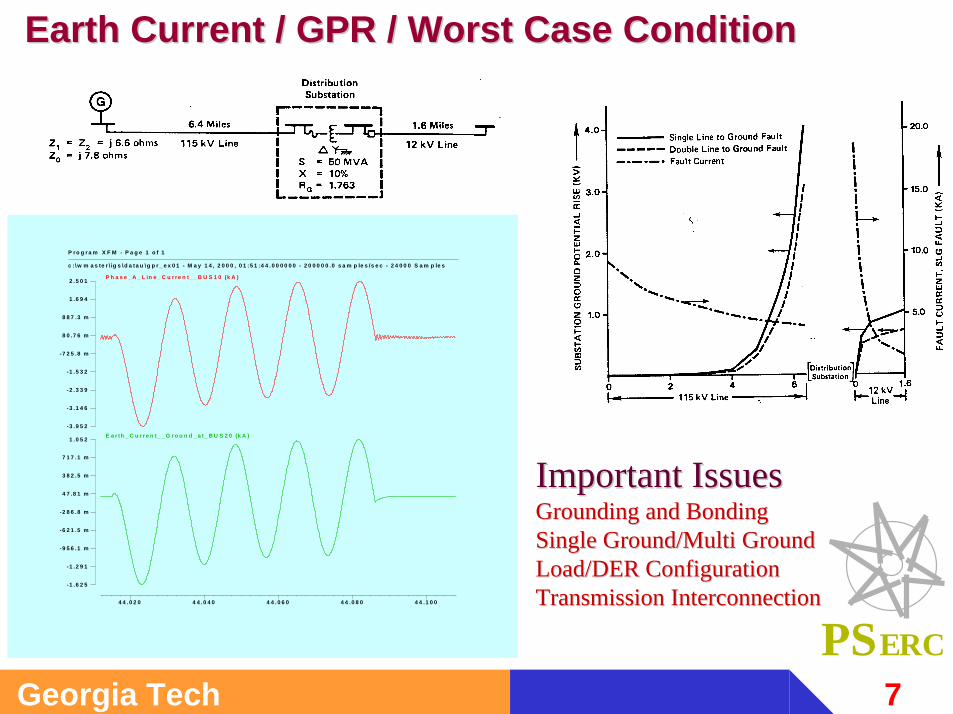
P ro g r a m X F M - P a g e 1 o f 1
c : \w m a s te r \ ig s \d a ta u \g p r _ e x 0 1 - M a y 1 4 , 2 0 0 0 , 0 1 :5 1 :4 4 . 0 0 0 0 0 0 - 2 0 0 0 0 0 .0 s a m p le s /s e c - 2 4 0 0 0 S a m p le s
4 4 .0 2 0 4 4 .0 4 0 4 4 . 0 6 0 4 4 .0 8 0 4 4 .1 0 0
-3 .9 5 2
-3 .1 4 6
-2 .3 3 9
-1 .5 3 2
-7 2 5 .8 m
8 0 .7 6 m
8 8 7 .3 m
1 .6 9 4
2 .5 0 1 P h a s e _ A _ L in e _ C u r re n t_ _ B U S 1 0 (k A )
-1 .6 2 5
-1 .2 9 1
-9 5 6 .1 m
-6 2 1 .5 m
-2 8 6 .8 m
4 7 .8 1 m
3 8 2 .5 m
7 1 7 .1 m
1 .0 5 2 E a r th _ C u r r e n t_ _ G r o u n d _ a t_ B U S 2 0 (k A )
Earth Current / GPR / Worst Case ConditionEarth Current / GPR / Worst Case Condition
Important IssuesImportant IssuesGrounding and BondingGrounding and BondingSingle Ground/Multi GroundSingle Ground/Multi GroundLoad/DER ConfigurationLoad/DER ConfigurationTransmission InterconnectionTransmission Interconnection

8Georgia TechPSERC
Power Quality
Design OptionsDesign OptionsConfigurationConfigurationGroundingGroundingOvervoltageOvervoltage Protection (arresters), Fault ProtectionProtection (arresters), Fault ProtectionUse of Steel/Aluminum conduit, Etc.Use of Steel/Aluminum conduit, Etc.
DisturbancesDisturbancesLightningLightningSwitchingSwitchingPower FaultsPower FaultsFeeder Feeder Energization Energization inrush currents, Motor Startinrush currents, Motor StartLoading imbalanceLoading imbalanceHarmonics, ResonanceHarmonics, ResonanceEMIEMI
Impact on End UserImpact on End UserVoltage Distortion, Sags, Swells, Outages and ImbalancesVoltage Distortion, Sags, Swells, Outages and Imbalances
9Georgia TechPSERC
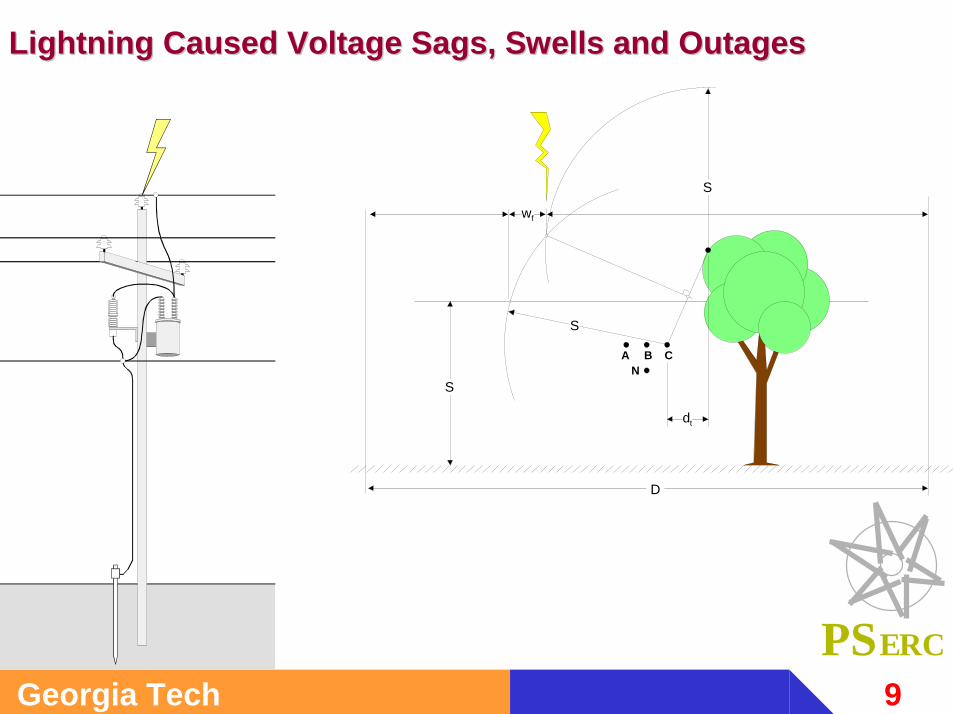
NA B C
S
wf
D
S
S
dt
Lightning Caused Voltage Sags, Swells and OutagesLightning Caused Voltage Sags, Swells and Outages
10Georgia TechPSERC
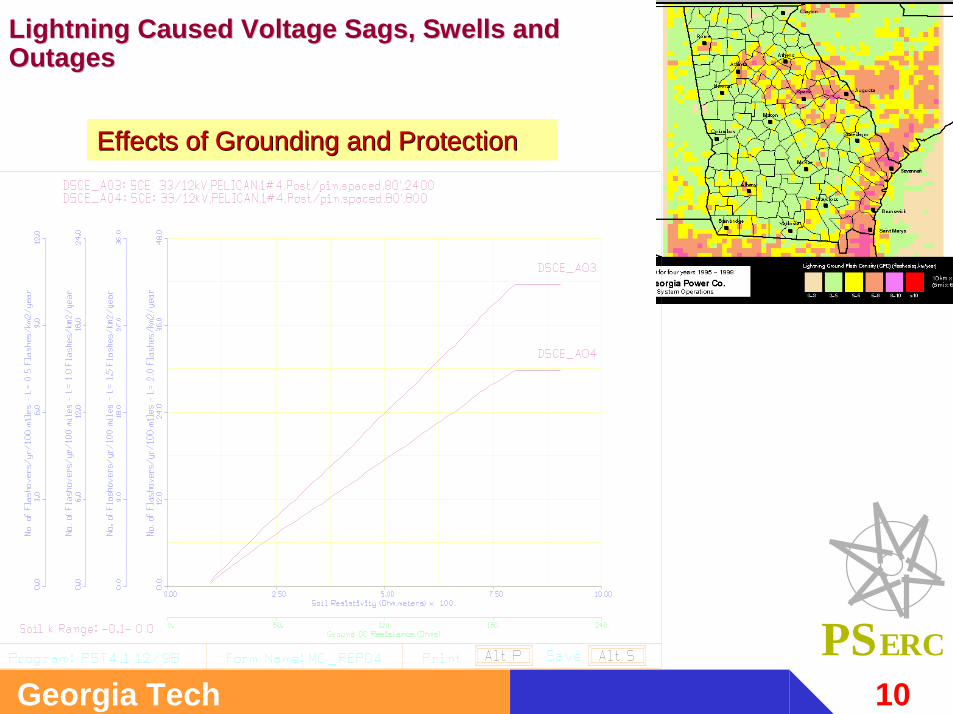
Lightning Caused Voltage Sags, Swells and Lightning Caused Voltage Sags, Swells and OutagesOutages
Effects of Grounding and ProtectionEffects of Grounding and Protection
11Georgia TechPSERC
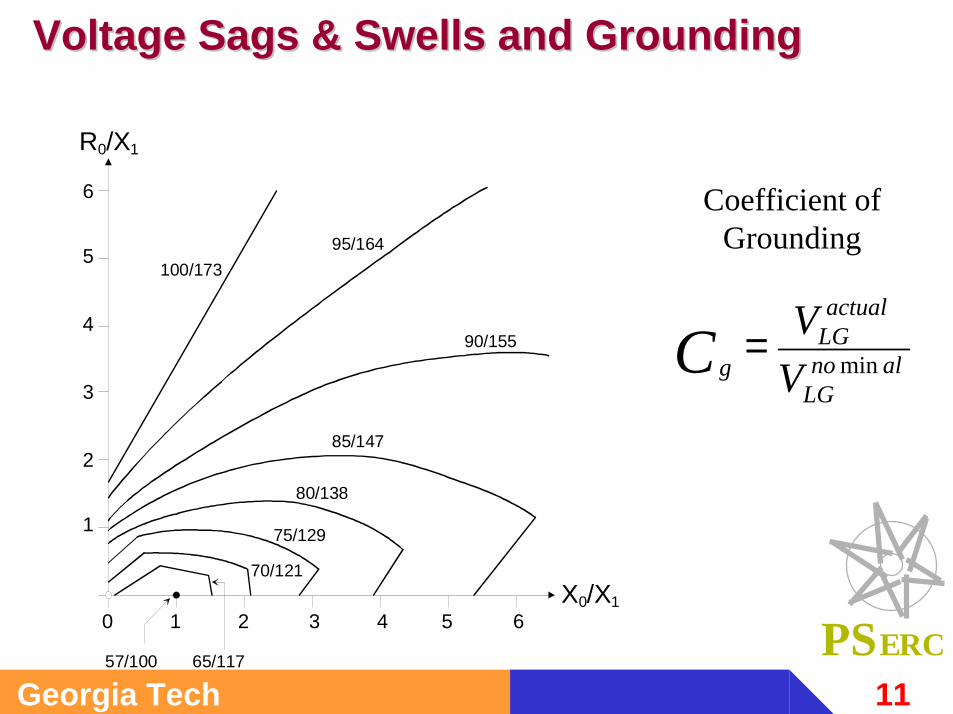
Voltage Sags & Swells and GroundingVoltage Sags & Swells and Grounding
0 2 3 4 5 6
6
5
4
3
2
1
100/17395/164
90/155
85/147
80/138
75/129
70/121
65/11757/100
X0/X1
R0/X1
1
alnoLG
actualLG
g VVC min=
Coefficient ofGrounding
12Georgia TechPSERC
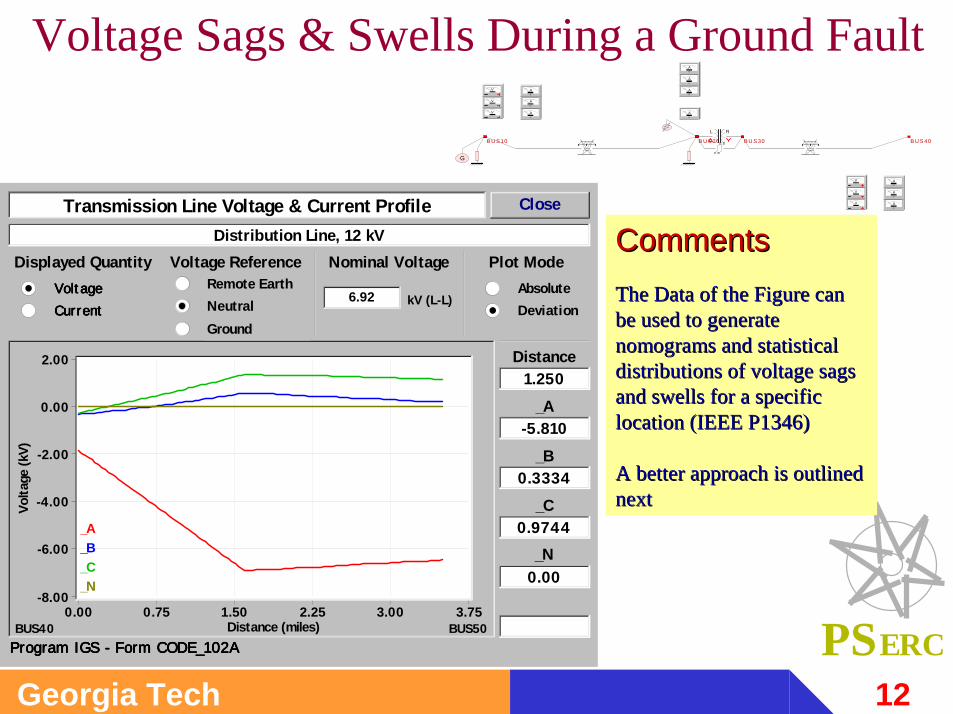
Voltage Sags & Swells During a Ground Fault
Transmission Line Voltage & Current Profile Close
0.00 0.75 1.50 2.25 3.00 3.75Distance (miles)
-8.00
-6.00
-4.00
-2.00
0.00
2.00
Volta
ge (k
V)
_A_B_C_N
Absolute Deviation
Remote Earth Neutral Ground
Voltage Reference
6.92 Volt age Volt age Volt age Volt age Current Current Current Current
Displayed Quantity Nominal Voltage
kV (L-L)
Plot ModeDistribution Line, 12 kV
1.250
-5.810
Distance
_A
0.3334
0.9744
_B
_C
0.00_N
BUS40 BUS50Program IGS - Form CODE_102AProgram IGS - Form CODE_102AProgram IGS - Form CODE_102AProgram IGS - Form CODE_102A
B U S 10 B U S 20 B U S 30 B U S 40
G
V
V
V
A
A
A
V
V
V
A
A
A
A
A
A
A
L R
CommentsCommentsThe Data of the Figure can The Data of the Figure can be used to generate be used to generate nomogramsnomograms and statistical and statistical distributions of voltage sags distributions of voltage sags and swells for a specific and swells for a specific location (IEEE P1346)location (IEEE P1346)
A better approach is outlined A better approach is outlined nextnext
13Georgia TechPSERCFrequency (Hz)
Volta
ge (k
V)
106 105 103104 10102 0.11 0.01
1.0
2.0
3.0
4.0
Transformer
Arrester Fuse
Ground Rods
L1
L2N
G
Ground Loop
SensitiveElectronicEquipment
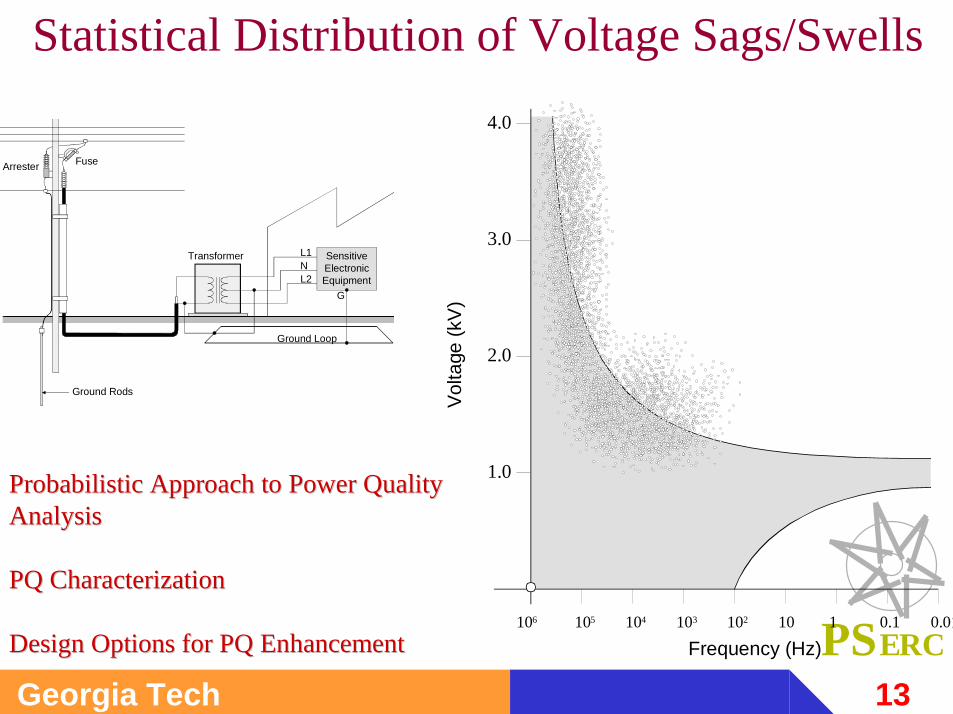
Probabilistic Approach to Power Quality Probabilistic Approach to Power Quality AnalysisAnalysis
PQ CharacterizationPQ Characterization
Design Options for PQ EnhancementDesign Options for PQ Enhancement
Statistical Distribution of Voltage Sags/Swells
14Georgia TechPSERC
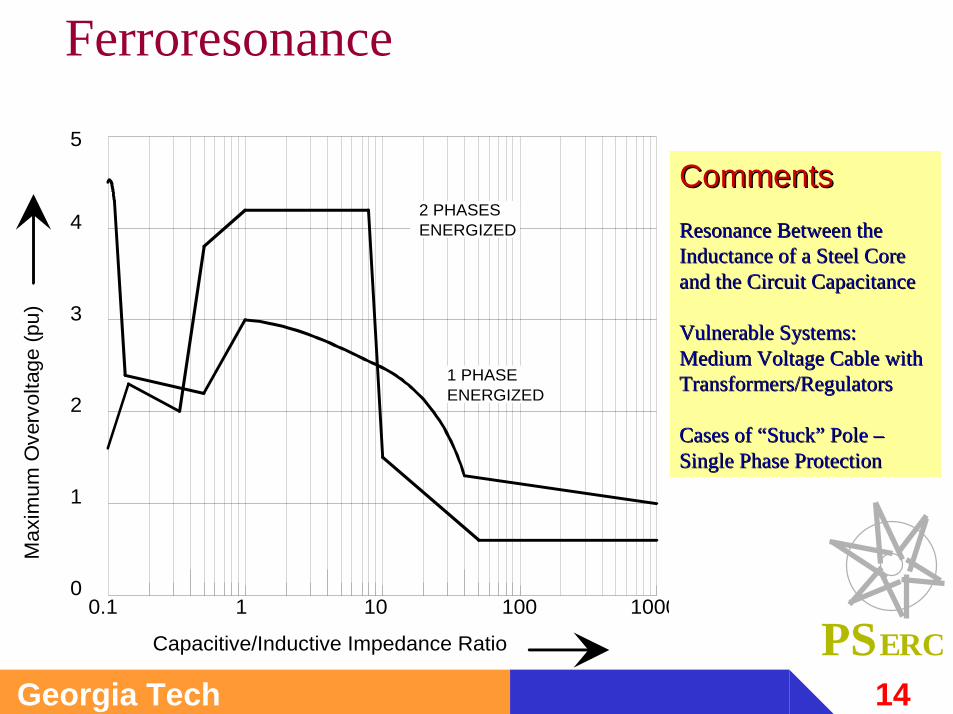
0.1 1 10 100 10000
1
2
3
4
5
2 PHASESENERGIZED
Capacitive/Inductive Impedance Ratio
Max
imum
Ove
rvol
tage
(pu)
1 PHASEENERGIZED
Ferroresonance
CommentsCommentsResonance Between the Resonance Between the Inductance of a Steel Core Inductance of a Steel Core and the Circuit Capacitanceand the Circuit Capacitance
Vulnerable Systems: Vulnerable Systems: Medium Voltage Cable with Medium Voltage Cable with Transformers/RegulatorsTransformers/Regulators
Cases of “Stuck” Pole Cases of “Stuck” Pole ––Single Phase ProtectionSingle Phase Protection
15Georgia TechPSERC
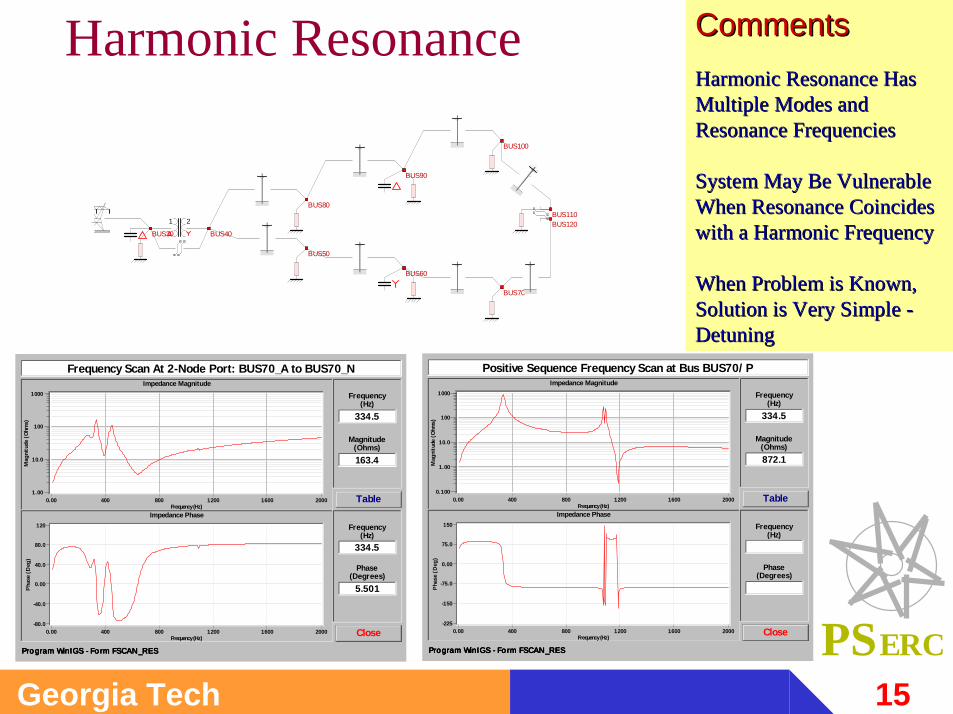
Harmonic Resonance CommentsCommentsHarmonic Resonance Has Harmonic Resonance Has Multiple Modes and Multiple Modes and Resonance FrequenciesResonance Frequencies
System May Be Vulnerable System May Be Vulnerable When Resonance Coincides When Resonance Coincides with a Harmonic Frequencywith a Harmonic Frequency
When Problem is Known, When Problem is Known, Solution is Very Simple Solution is Very Simple --DetuningDetuning
Close
0.00 400 800 1200 1600 2000Frequency (Hz)
0.100
1.00
10.0
100
1000
Mag
nitu
de (O
hms)
Impedance Magnitude
Positive Sequence Frequency Scan at Bus BUS70/ P
0.00 400 800 1200 1600 2000Frequency (Hz)
-225
-150
-75.0
0.00
75.0
150
Phas
e (D
eg)
Impedance Phase
Table
872.1
Magnitude(Ohms)
Phase(Degrees)
Frequency(Hz)
334.5
Frequency(Hz)
Program WinIGS - Fo rm FSCAN_RESProgram WinIGS - Fo rm FSCAN_RESProgram WinIGS - Fo rm FSCAN_RESProgram WinIGS - Fo rm FSCAN_RES
Close
0.00 400 800 1200 1600 2000Frequency (Hz)
1.00
10.0
100
1000
Mag
nitu
de (O
hms)
Impedance Magnitude
Frequency Scan At 2-Node Port: BUS70_A to BUS70_N
0.00 400 800 1200 1600 2000Frequency (Hz)
-80.0
-40.0
0.00
40.0
80.0
120
Phas
e (D
eg)
Impedance Phase
Table
163.4
Magnitude(Ohms)
Phase(Degrees)
Frequency(Hz)
334.5
Frequency(Hz)
5.501
334.5
Program WinIGS - Fo rm FSCAN_RESProgram WinIGS - Fo rm FSCAN_RESProgram WinIGS - Fo rm FSCAN_RESProgram WinIGS - Fo rm FSCAN_RES
BUS30 BUS40
BUS50
BUS60
BUS70
BUS80
BUS90
BUS100
BUS110BUS1201 2
16Georgia TechPSERC
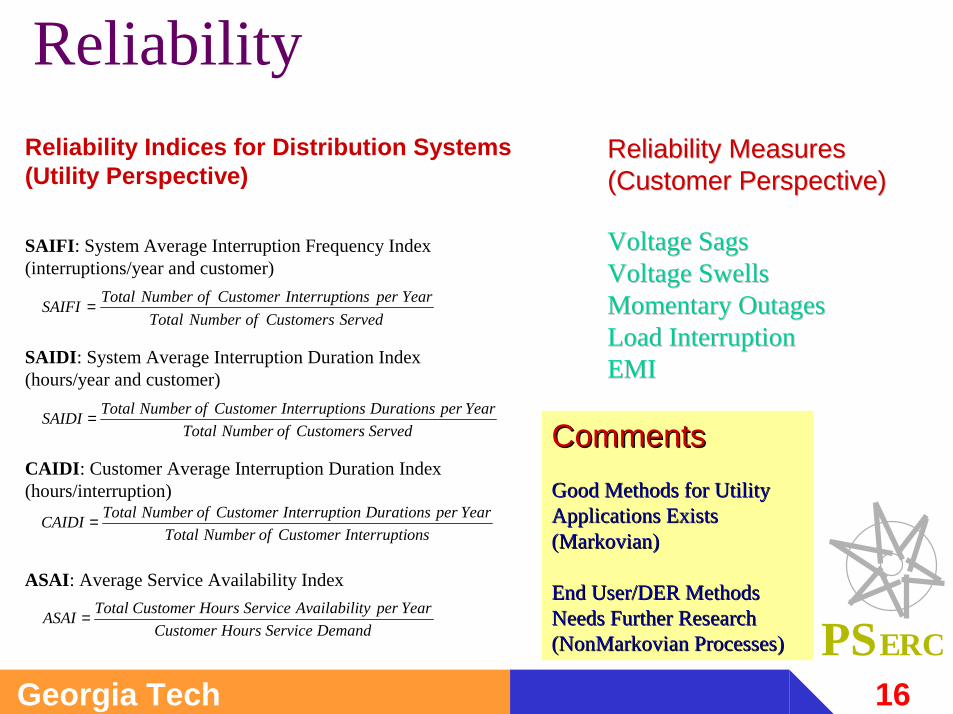
ReliabilityReliability Indices for Distribution Systems(Utility Perspective)
SAIFI: System Average Interruption Frequency Index (interruptions/year and customer)
SAIDI: System Average Interruption Duration Index (hours/year and customer)
CAIDI: Customer Average Interruption Duration Index (hours/interruption)
ASAI: Average Service Availability Index
ServedCustomersofNumberTotalYearperonsInterruptiCustomerofNumberTotalSAIFI =
ServedCustomersofNumberTotalYearperDurationsonsInterruptiCustomerofNumberTotalSAIDI =
onsInterruptiCustomerofNumberTotalYearperDurationsonInterruptiCustomerofNumberTotalCAIDI =
DemandServiceHoursCustomerYearpertyAvailabiliServiceHoursCustomerTotalASAI =
Reliability Measures Reliability Measures (Customer Perspective)(Customer Perspective)
Voltage SagsVoltage SagsVoltage SwellsVoltage SwellsMomentary OutagesMomentary OutagesLoad InterruptionLoad InterruptionEMIEMI
CommentsCommentsGood Methods for UtilityGood Methods for UtilityApplications Exists Applications Exists ((MarkovianMarkovian))
End User/DER Methods End User/DER Methods Needs Further ResearchNeeds Further Research((NonMarkovian NonMarkovian Processes)Processes)
17Georgia TechPSERC
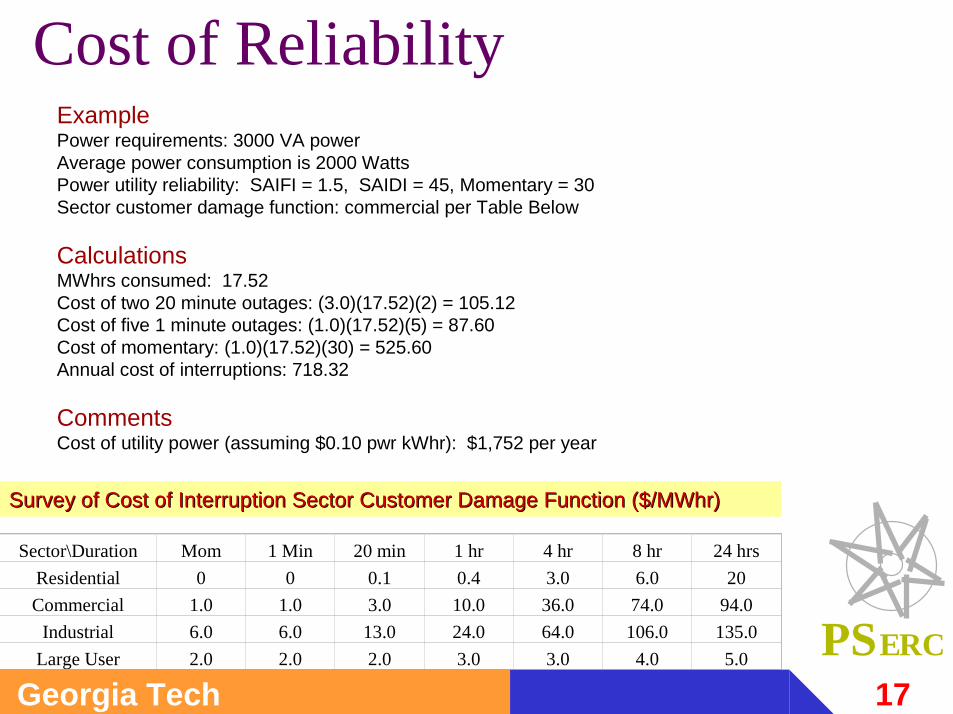
Sector\Duration Mom 1 Min 20 min 1 hr 4 hr 8 hr 24 hrsResidential 0 0 0.1 0.4 3.0 6.0 20Commercial 1.0 1.0 3.0 10.0 36.0 74.0 94.0
Industrial 6.0 6.0 13.0 24.0 64.0 106.0 135.0Large User 2.0 2.0 2.0 3.0 3.0 4.0 5.0
Cost of Reliability
Survey of Cost of Interruption Sector Customer Damage Function (Survey of Cost of Interruption Sector Customer Damage Function ($/$/MWhrMWhr))
ExamplePower requirements: 3000 VA powerAverage power consumption is 2000 WattsPower utility reliability: SAIFI = 1.5, SAIDI = 45, Momentary = 30Sector customer damage function: commercial per Table Below
CalculationsMWhrs consumed: 17.52Cost of two 20 minute outages: (3.0)(17.52)(2) = 105.12Cost of five 1 minute outages: (1.0)(17.52)(5) = 87.60Cost of momentary: (1.0)(17.52)(30) = 525.60Annual cost of interruptions: 718.32
CommentsCost of utility power (assuming $0.10 pwr kWhr): $1,752 per year
18Georgia TechPSERC
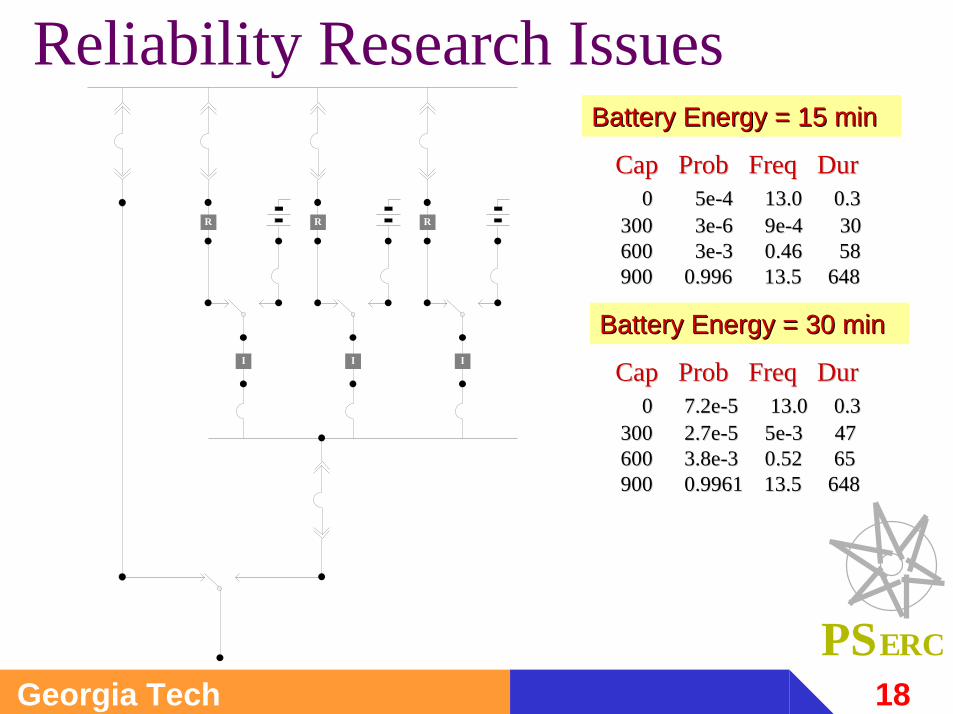
Reliability Research Issues
Cap Cap Prob Prob Freq Freq DurDur0 5e0 5e--4 13.0 0.34 13.0 0.3
300 3e300 3e--6 9e6 9e--4 304 30600 3e600 3e--3 0.46 583 0.46 58900 0.996 13.5 648900 0.996 13.5 648
Cap Cap Prob Prob Freq Freq DurDur0 7.2e0 7.2e--5 13.0 0.35 13.0 0.3
300 2.7e300 2.7e--5 5e5 5e--3 473 47600 3.8e600 3.8e--3 0.52 653 0.52 65900 0.9961 13.5 648900 0.9961 13.5 648
Battery Energy = 15 minBattery Energy = 15 min
Battery Energy = 30 minBattery Energy = 30 min
R
I
R
I
R
I
19Georgia TechPSERC
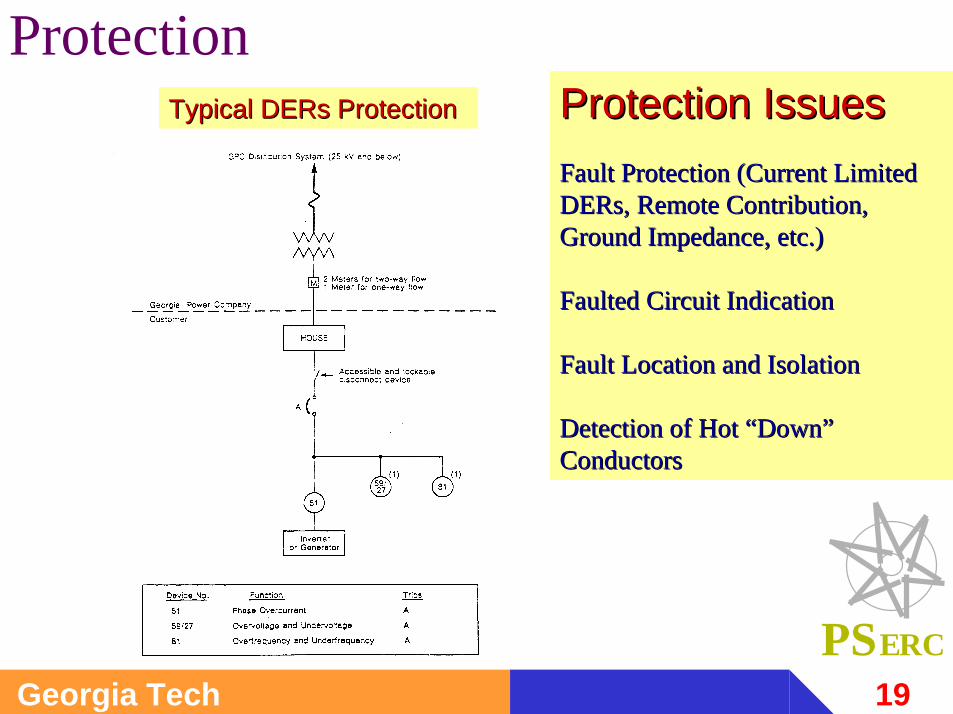
ProtectionProtection IssuesProtection IssuesFault Protection (Current Limited Fault Protection (Current Limited DERsDERs, Remote Contribution, , Remote Contribution, Ground Impedance, etc.)Ground Impedance, etc.)
Faulted Circuit IndicationFaulted Circuit Indication
Fault Location and IsolationFault Location and Isolation
Detection of Hot “Down” Detection of Hot “Down” ConductorsConductors
Typical Typical DERsDERs ProtectionProtection
20Georgia TechPSERC
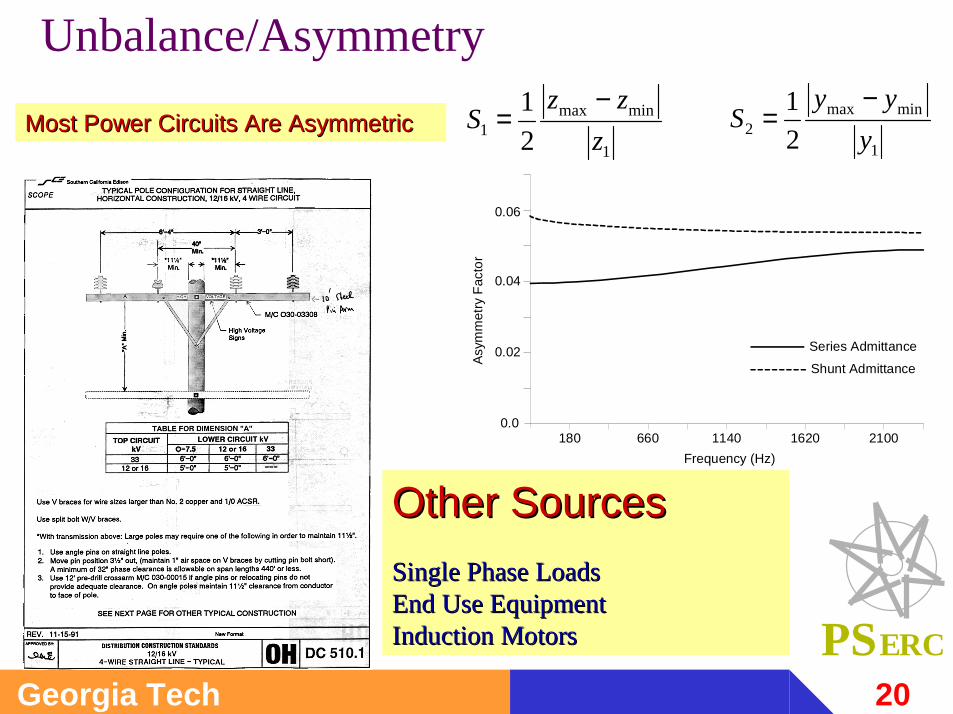
Unbalance/Asymmetry
180 660 1140 1620 2100
0.06
0.04
0.02
0.0
Series AdmittanceShunt Admittance
Frequency (Hz)As
ymm
etry
Fac
tor
1
minmax1 2
1z
zzS
−=
1
minmax2 2
1y
yyS
−=Most Power Circuits Are AsymmetricMost Power Circuits Are Asymmetric
Other SourcesOther SourcesSingle Phase LoadsSingle Phase LoadsEnd Use EquipmentEnd Use EquipmentInduction MotorsInduction Motors

21Georgia TechPSERC
Induction Motor Response to Unbalance/Asymmetry
Close
System Asymmetry and Imbalance Example
P 367.6 kW, Q 178.3 kVarS = 408.5 kVA, PF = 89.97 %
S
Pa 120.2 kW, Qa 69.04 kVarPb 114 .8 kW, Qb 50.20 kVarPc 132.5 kW, Qc 59.09 kVarSa
SbSc Va = 255.2 V, 55.34 DegVb = 245.3 V, -63.85 DegVc = 249.0 V, 175.7 Deg
Va
Vb
VcIa = 543.0 A, 25.47 DegIb = 510.9 A, -87.46 DegIc = 582.9 A, 151.6 Deg
Ia
Ib
Ic
Induction MotorCase:
Device:
MCLOAD1_A VaMCLOAD1_B VbMCLOAD1_C Vc
MCLOAD1_A IaMCLOAD1_B IbMCLOAD1_C
Voltages
Currents
Total Power Voltage Current Per Phase Power
Ic
Phase Quantities Symmetric Comp
RGROUND Ref
Device Terminal Multimeter
L-G L-L
Program WinIGS - Form FDR_M ULTIM ETERProgram WinIGS - Form FDR_M ULTIM ETERProgram WinIGS - Form FDR_M ULTIM ETERProgram WinIGS - Form FDR_M ULTIM ETER
BUS30 BUS40
BUS50
BUS60
BUS70
BUS80
BUS90
BUS100
BUS110BUS120
MCBUS1
MCLOAD1
ANGSPEED1
MCLOAD2
ANGSPEED2
1 2
1 2
IM
IM
Typical Distribution System ExampleTypical Distribution System Example
CommentsCommentsCombined Effects of System Combined Effects of System Component Asymmetry and Component Asymmetry and Imbalanced LoadsImbalanced Loads
Important Factors:Important Factors:ConfigurationConfigurationTransformersTransformersLoad Balancing Load Balancing
22Georgia TechPSERC
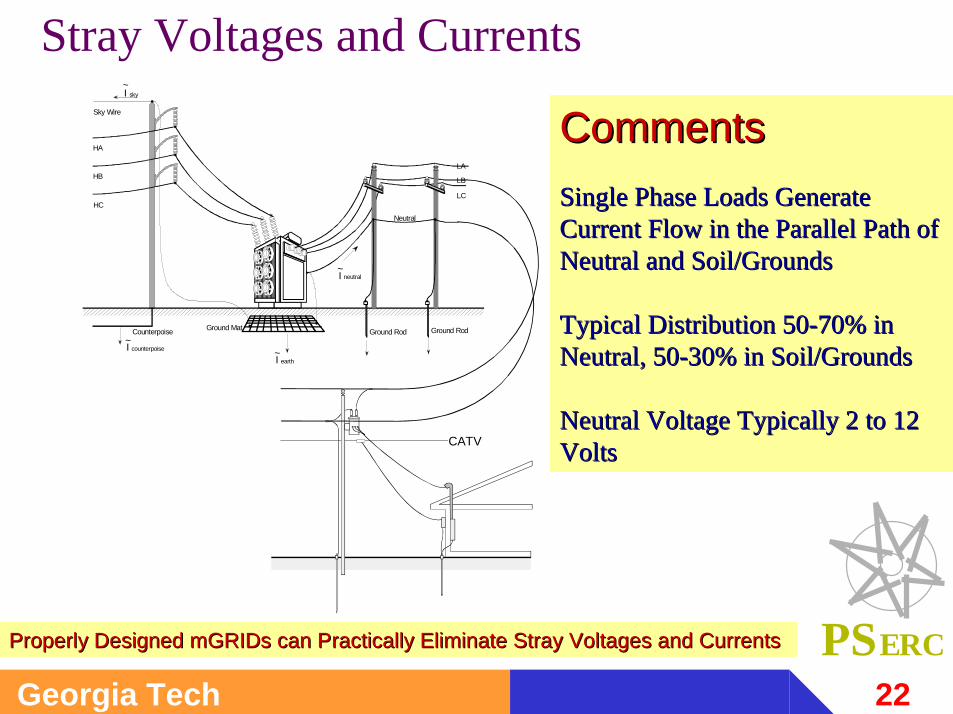
Stray Voltages and CurrentsSky Wire
HA
HB
HC
I sky
neutralI
Neutral
Counterpoise Ground Rod Ground Rod
I earth~
LA
LB
LC
Ground Mat
~
~
counterpoiseI~
CATV
CommentsCommentsSingle Phase Loads Generate Single Phase Loads Generate Current Flow in the Parallel Path of Current Flow in the Parallel Path of Neutral and Soil/GroundsNeutral and Soil/Grounds
Typical Distribution 50Typical Distribution 50--70% in 70% in Neutral, 50Neutral, 50--30% in Soil/Grounds30% in Soil/Grounds
Neutral Voltage Typically 2 to 12 Neutral Voltage Typically 2 to 12 Volts Volts
Properly Designed Properly Designed mGRIDsmGRIDs can Practically Eliminate Stray Voltages and Currentscan Practically Eliminate Stray Voltages and Currents
23Georgia TechPSERC
SOURCEBUS10
BUS200
BUS400
BUS100G
1Ph
Return
Update
0.00 90.0 180 270 360Angle (Degrees)
0.00
75.0
150
225
300
375
Mill
iGau
ss
Magnetic Field
0.500Plot Circle Radius
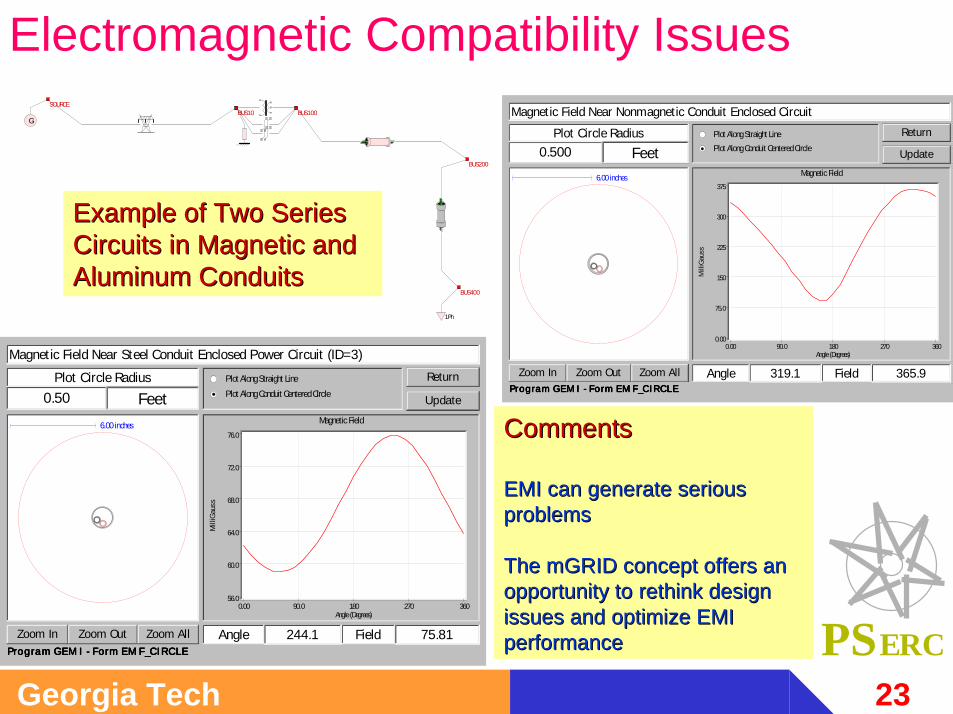
Magnetic Field Near Nonmagnetic Conduit Enclosed Circuit
6.00 inches
Plot Along Straight Line Plot Along Conduit Centered Circle Feet
Zoom In Zoom Out Zoom All 365.9Field319.1AngleProgram GEM I - Form EM F_CI RCLEProgram GEM I - Form EM F_CI RCLEProgram GEM I - Form EM F_CI RCLEProgram GEM I - Form EM F_CI RCLE
Return
Update
0.00 90.0 180 270 360Angle (Degrees)
56.0
60.0
64.0
68.0
72.0
76.0
Mill
iGau
ss
Magnetic Field
0.50Plot Circle Radius
Magnetic Field Near Steel Conduit Enclosed Power Circuit (ID=3)
6.00 inches
Plot Along Straight Line Plot Along Conduit Centered Circle Feet
Zoom In Zoom Out Zoom All 75.81Field244.1AngleProgram GEM I - Form EM F_CI RCLEProgram GEM I - Form EM F_CI RCLEProgram GEM I - Form EM F_CI RCLEProgram GEM I - Form EM F_CI RCLE
Electromagnetic Compatibility Issues
Example of Two Series Example of Two Series Circuits in Magnetic and Circuits in Magnetic and Aluminum ConduitsAluminum Conduits
CommentsComments
EMI can generate serious EMI can generate serious problemsproblems
The The mGRIDmGRID concept offers an concept offers an opportunity to rethink design opportunity to rethink design issues and optimize EMI issues and optimize EMI performanceperformance
3 Jan 2001
WEMPEC
GV 1Microgrids Short Course
Inverters in Microgrids
Giri VenkataramananDepartment of Electrical and Computer Engineering
University of Wisconsin-Madison
3 Jan 2001
3 Jan 2001
WEMPEC
GV 2Microgrids Short Course
Outline
• Description of inverter types and characteristics
• Inverter control objectives• Inverter dynamic modeling• Summary
3 Jan 2001
WEMPEC
GV 3Microgrids Short Course
Inverter types
PWM inverterMultilevel inverterNaturally commutated current source inverter
3 Jan 2001
WEMPEC
GV 4Microgrids Short Course
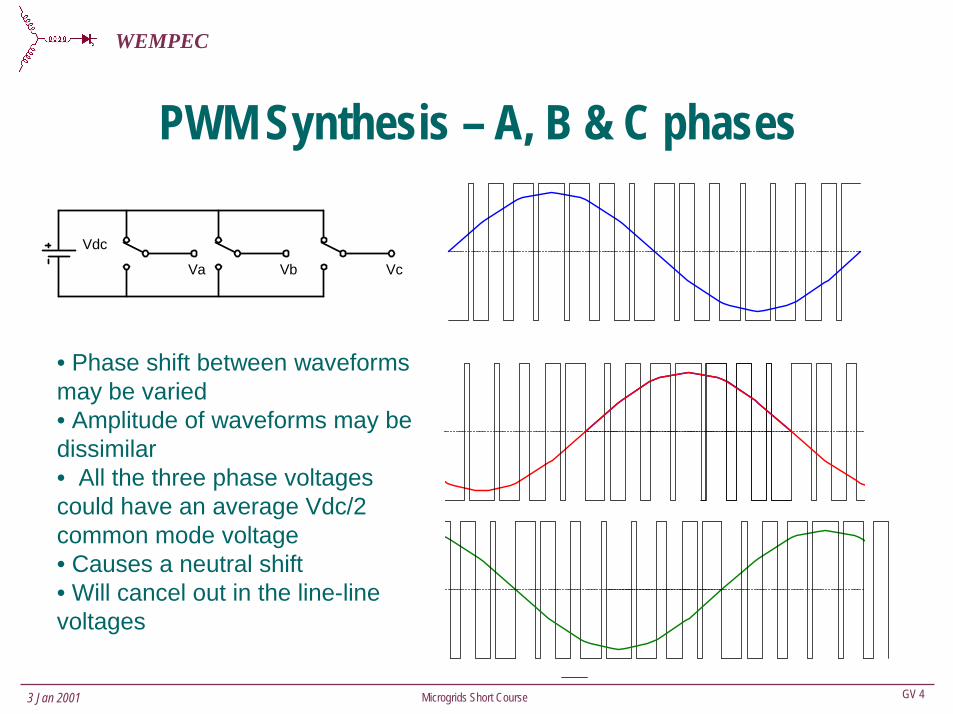
PWM Synthesis – A, B & C phases
Vdc
Va Vb Vc
• Phase shift between waveforms may be varied• Amplitude of waveforms may be dissimilar• All the three phase voltages could have an average Vdc/2 common mode voltage• Causes a neutral shift• Will cancel out in the line-line voltages
3 Jan 2001
WEMPEC
GV 5Microgrids Short Course
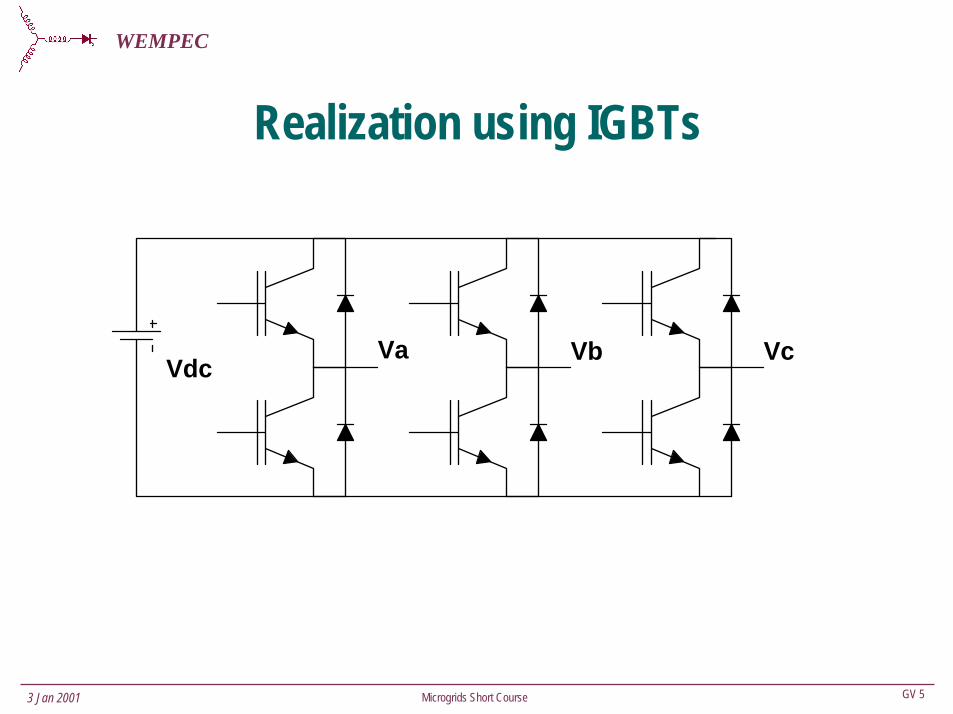
Realization using IGBTs
Va Vb VcVdc
3 Jan 2001
WEMPEC
GV 6Microgrids Short Course
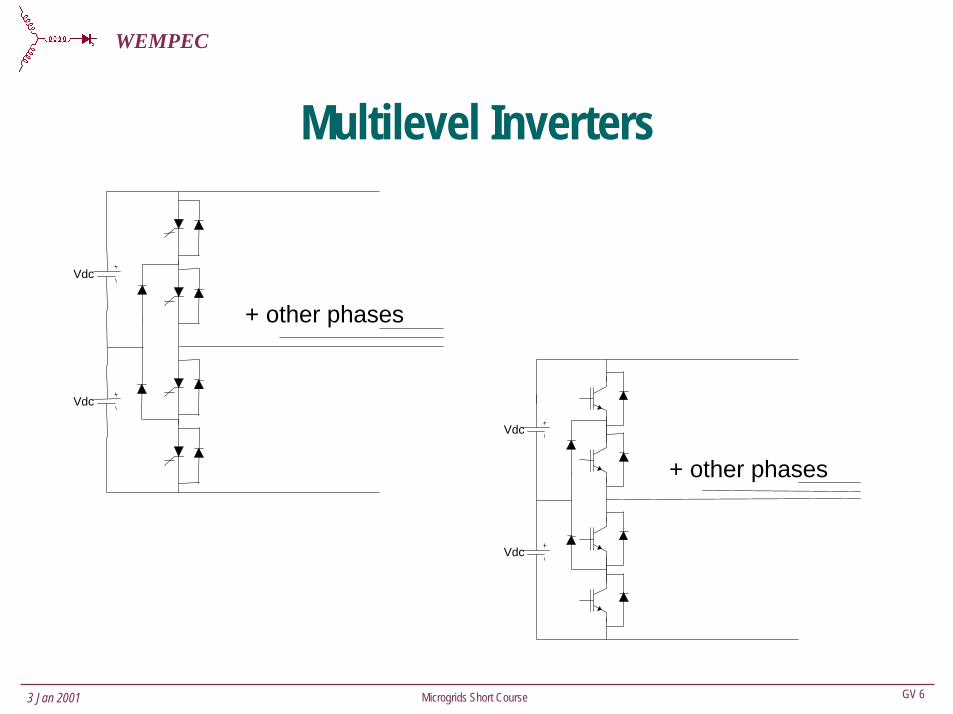
Multilevel Inverters
Vdc
Vdc
+ other phases
Vdc
Vdc
+ other phases
3 Jan 2001
WEMPEC
GV 7Microgrids Short Course
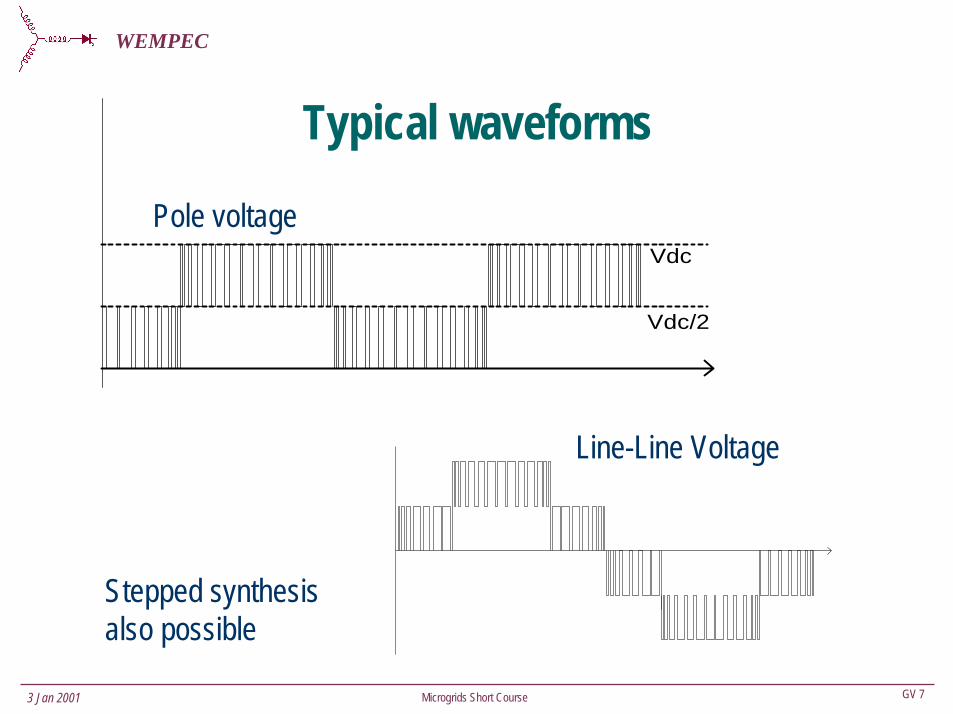
Typical waveforms
Vdc
Vdc/2
Pole voltage
Line-Line Voltage
Stepped synthesis also possible
3 Jan 2001
WEMPEC
GV 8Microgrids Short Course
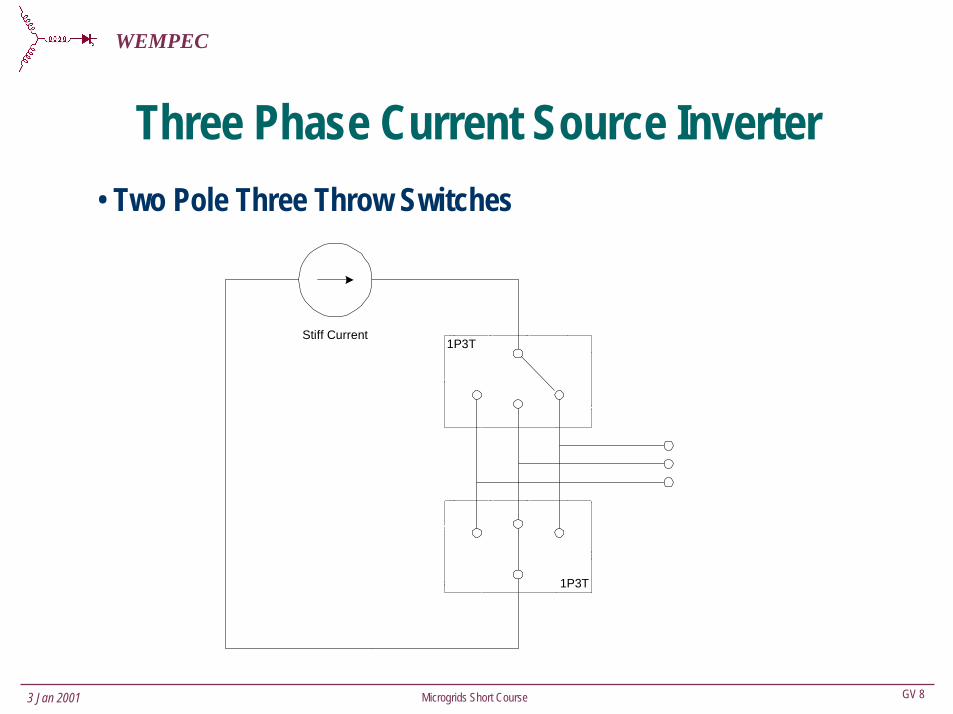
Three Phase Current Source Inverter• Two Pole Three Throw Switches
1P3T
1P3TStiff Current
3 Jan 2001
WEMPEC
GV 9Microgrids Short Course
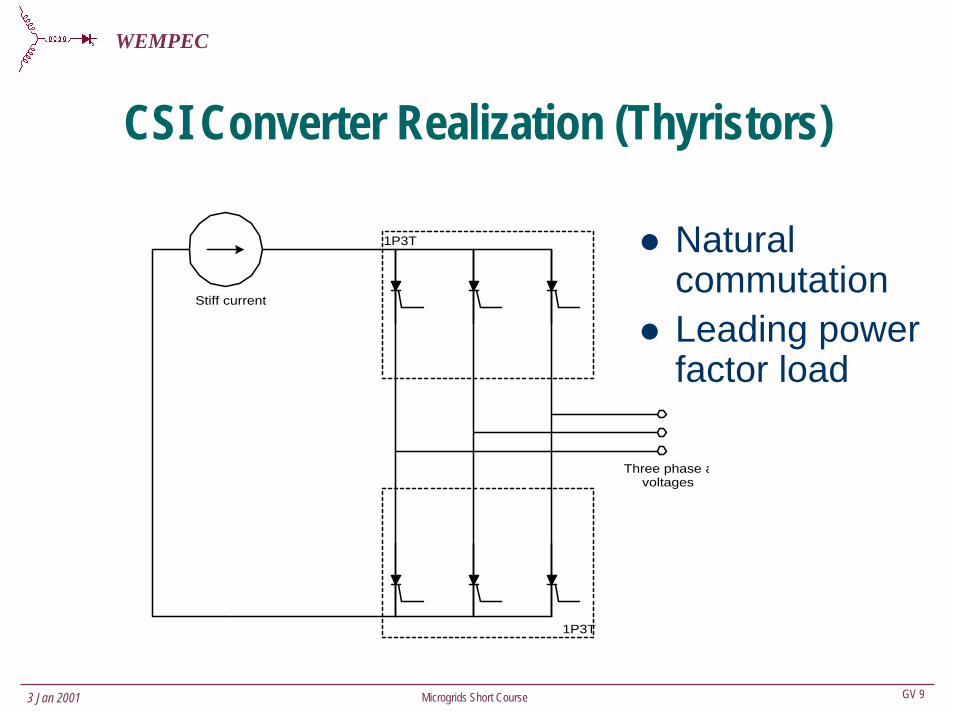
CSI Converter Realization (Thyristors)
1P3T
1P3T
Stiff current
Three phase avoltages
Natural commutationLeading power factor load
3 Jan 2001
WEMPEC
GV 10Microgrids Short Course
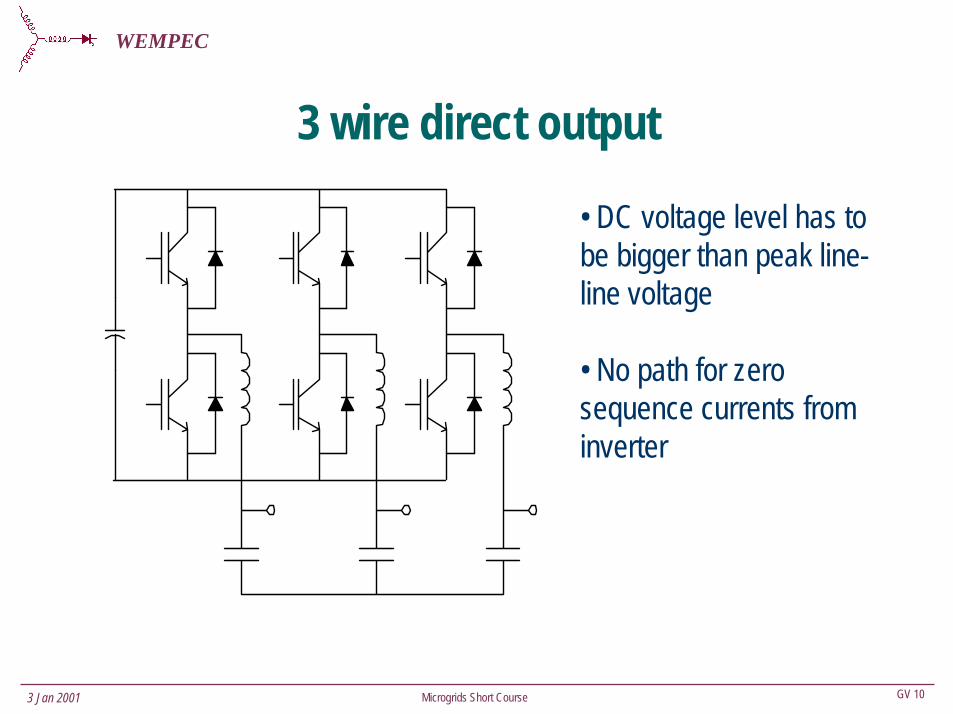
3 wire direct output
• DC voltage level has to be bigger than peak line-line voltage
• No path for zero sequence currents from inverter
3 Jan 2001
WEMPEC
GV 11Microgrids Short Course
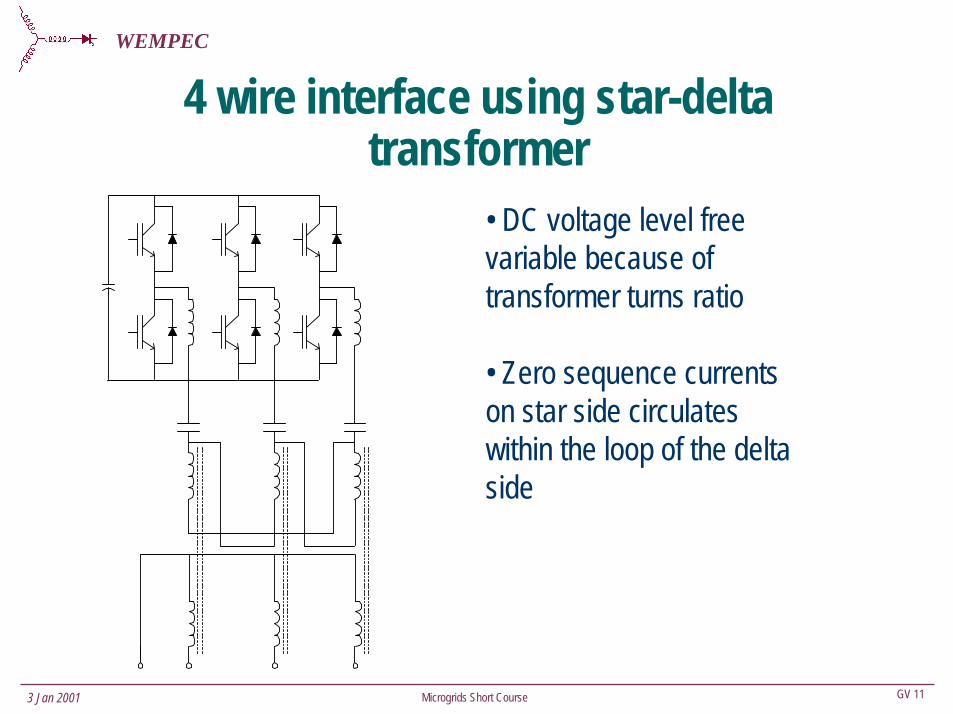
4 wire interface using star-delta transformer
• DC voltage level free variable because of transformer turns ratio
• Zero sequence currents on star side circulates within the loop of the delta side
3 Jan 2001
WEMPEC
GV 12Microgrids Short Course
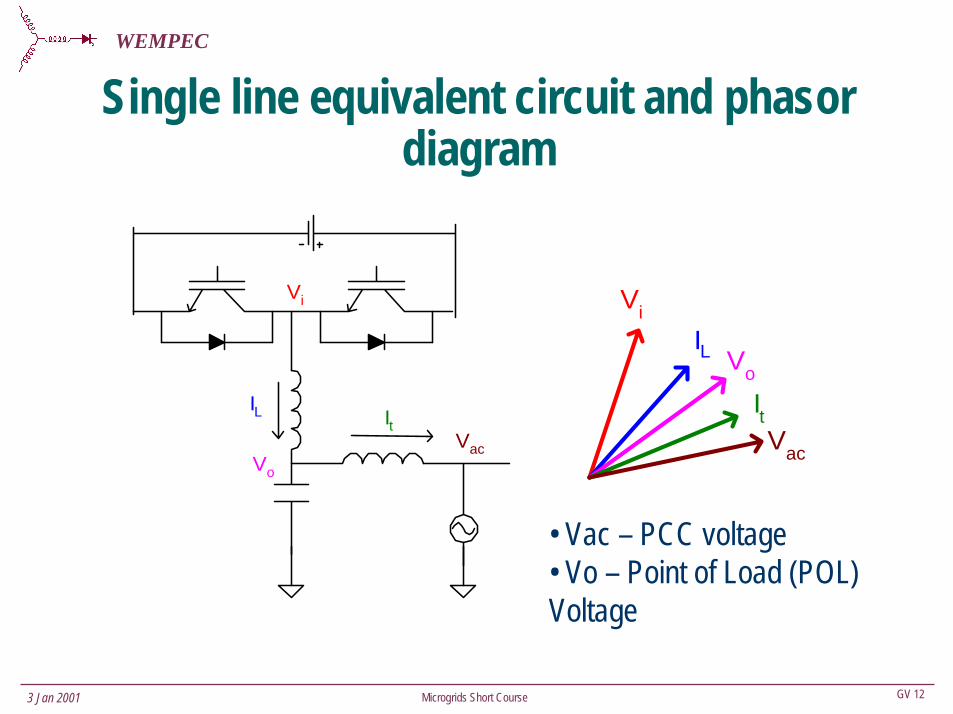
Single line equivalent circuit and phasor diagram
ViIL Vo
ItVac
Vi
IL
Vo
ItVac
• Vac – PCC voltage• Vo – Point of Load (POL) Voltage
3 Jan 2001
WEMPEC
GV 13Microgrids Short Course
Microgrid Energy and Power Quality Management Functions
• Load profile control• Source utilization• Peak-shaving• Reactive power injection
• POL voltage control• Voltage imbalance correction
3 Jan 2001
WEMPEC
GV 14Microgrids Short Course
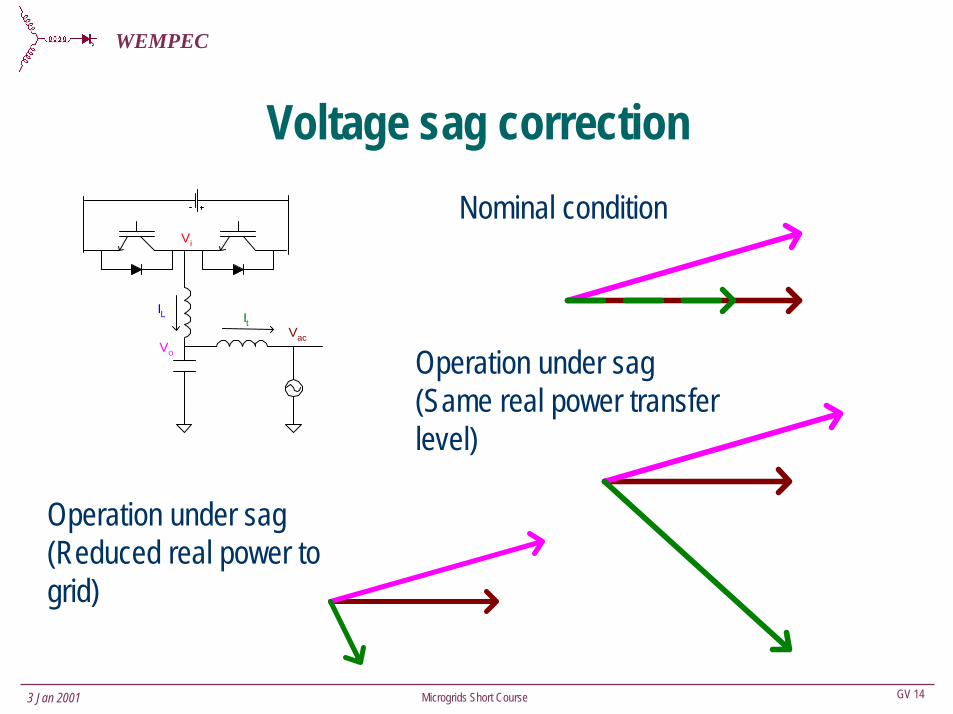
Voltage sag correction
Vi
IL
Vo
ItVac
Nominal condition
Operation under sag (Same real power transfer level)
Operation under sag (Reduced real power to grid)
3 Jan 2001
WEMPEC
GV 15Microgrids Short Course
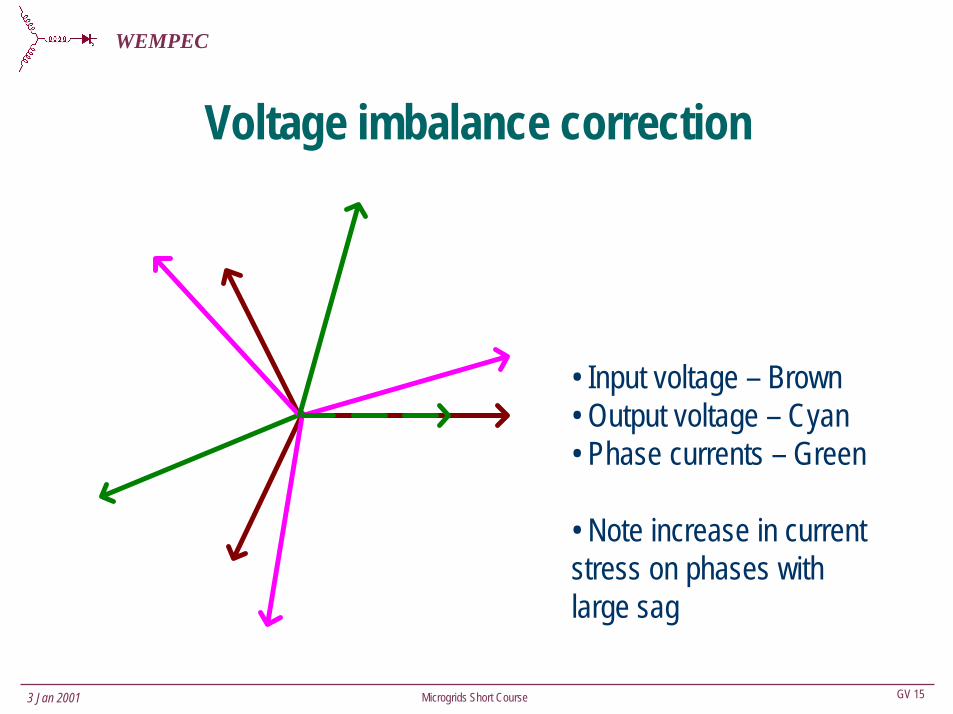
Voltage imbalance correction
• Input voltage – Brown• Output voltage – Cyan• Phase currents – Green
• Note increase in current stress on phases with large sag
3 Jan 2001
WEMPEC
GV 16Microgrids Short Course
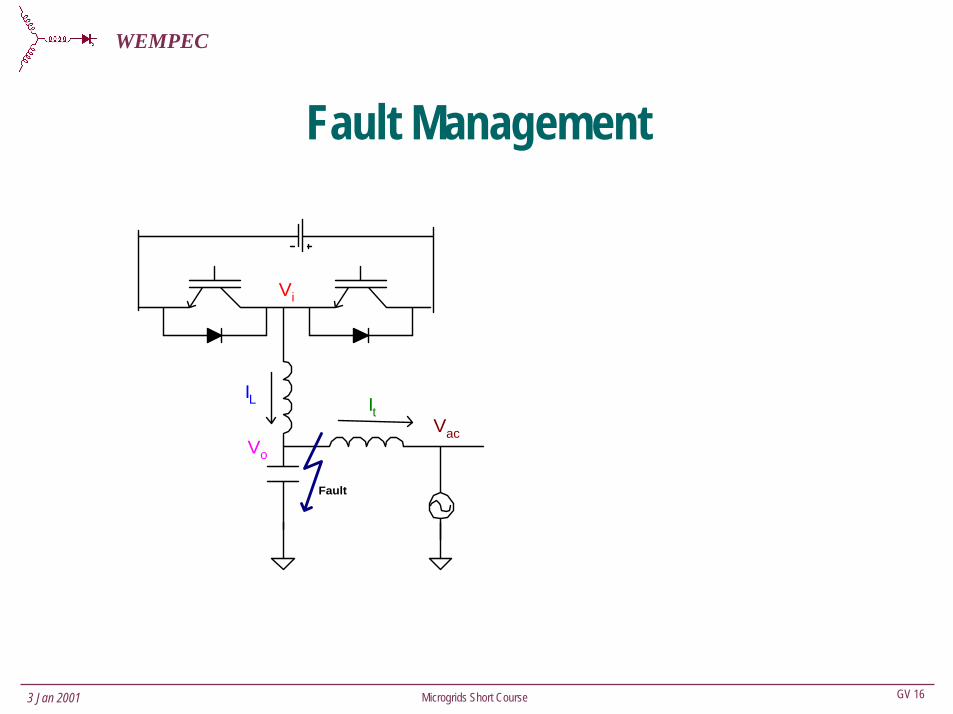
Fault Management
Vi
IL
Vo
ItVac
Fault
3 Jan 2001
WEMPEC
GV 17Microgrids Short Course
Operation under transients
Load transientsSystem transients – Capacitor switching– Power quality events
Delayed source responseIslandingReconnection
3 Jan 2001
WEMPEC
GV 18Microgrids Short Course
Key Control Issues
Power flow controlFrequency controlLocal voltage controlReactive power control
Power sharingFrequency matching
3 Jan 2001
WEMPEC
GV 19Microgrids Short Course
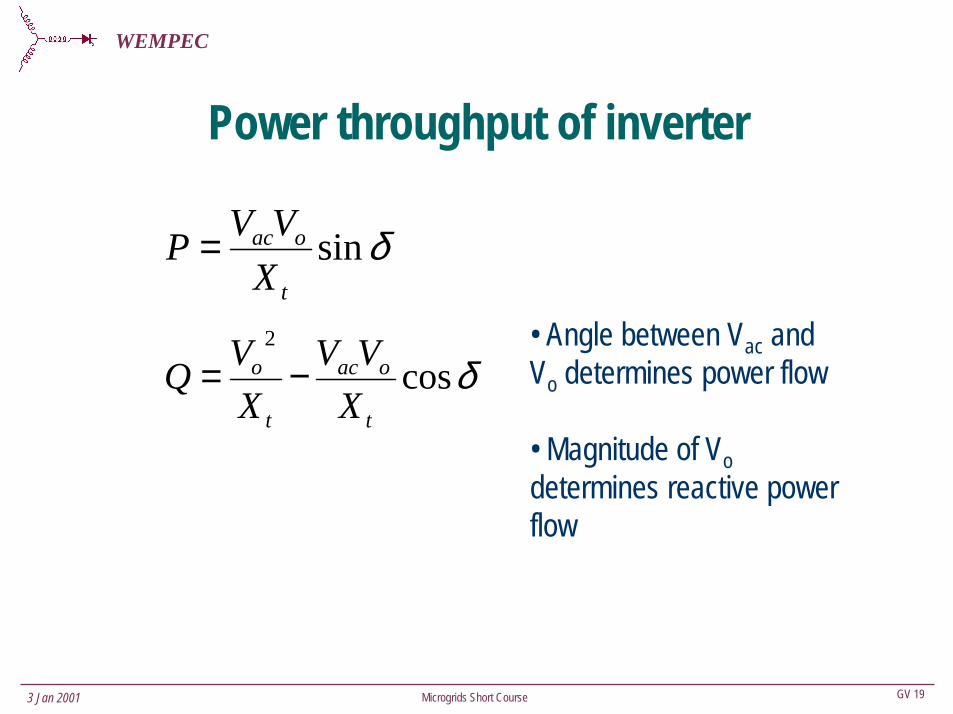
Power throughput of inverter
δsint
oac
XVVP =
δcos2
t
oac
t
o
XVV
XVQ −=
• Angle between Vac and Vo determines power flow
• Magnitude of Vodetermines reactive power flow
3 Jan 2001
WEMPEC
GV 20Microgrids Short Course
Modeling objectives
• Need to model dynamic properties • Control input and real power flow or power angle• Control input and reactive power flow or voltage magnitude
3 Jan 2001
WEMPEC
GV 21Microgrids Short Course
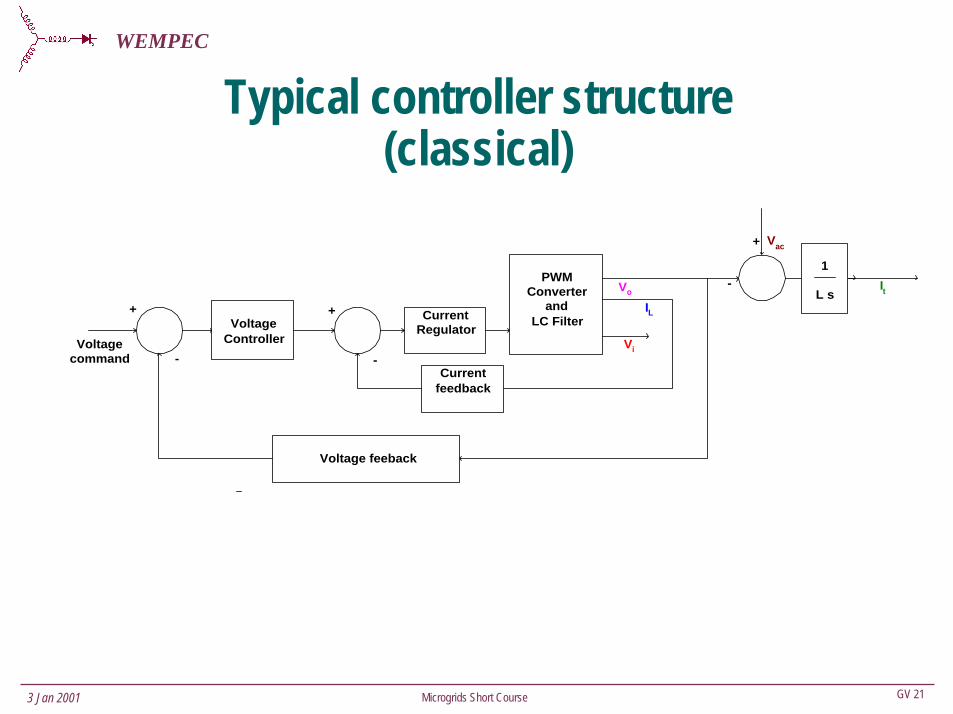
Typical controller structure(classical)
Voltagecommand
PWMConverter
andLC Filter
Vo
Voltage feeback
+
-
VoltageController
Currentfeedback
CurrentRegulator
+
-
Vac
It
1
L s
+
-
Vi
IL
3 Jan 2001
WEMPEC
GV 22Microgrids Short Course
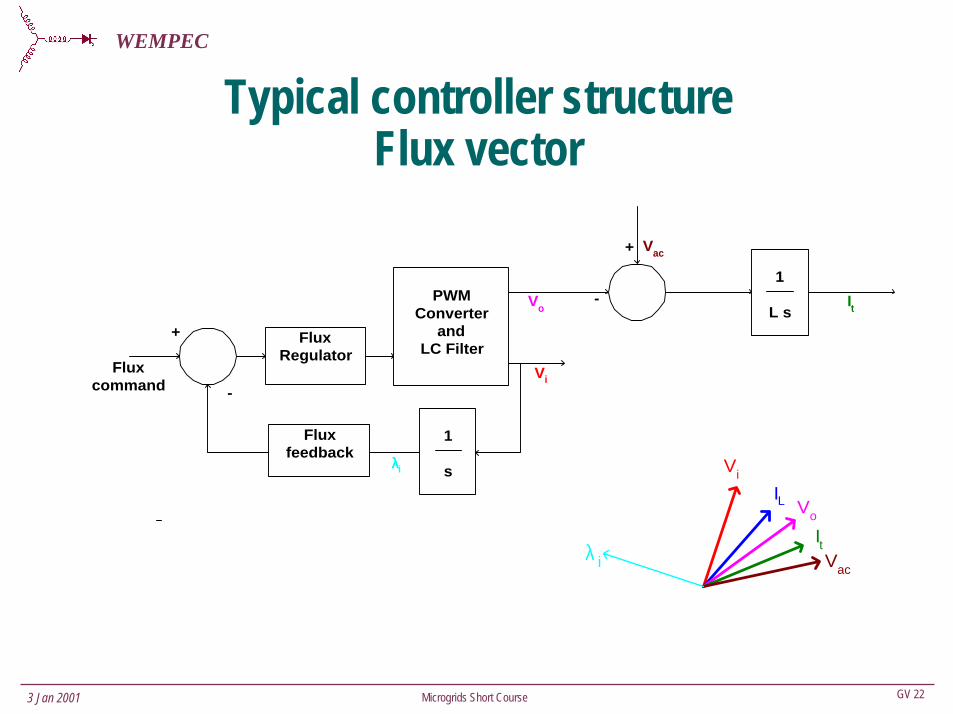
Typical controller structureFlux vector
ViIL Vo
ItVac
λ i
Fluxcommand
PWMConverter
andLC Filter
Vo
Fluxfeedback
FluxRegulator
+
-
Vac
It
1
L s
+
-
Vi
1
sλλλλi
3 Jan 2001
WEMPEC
GV 23Microgrids Short Course
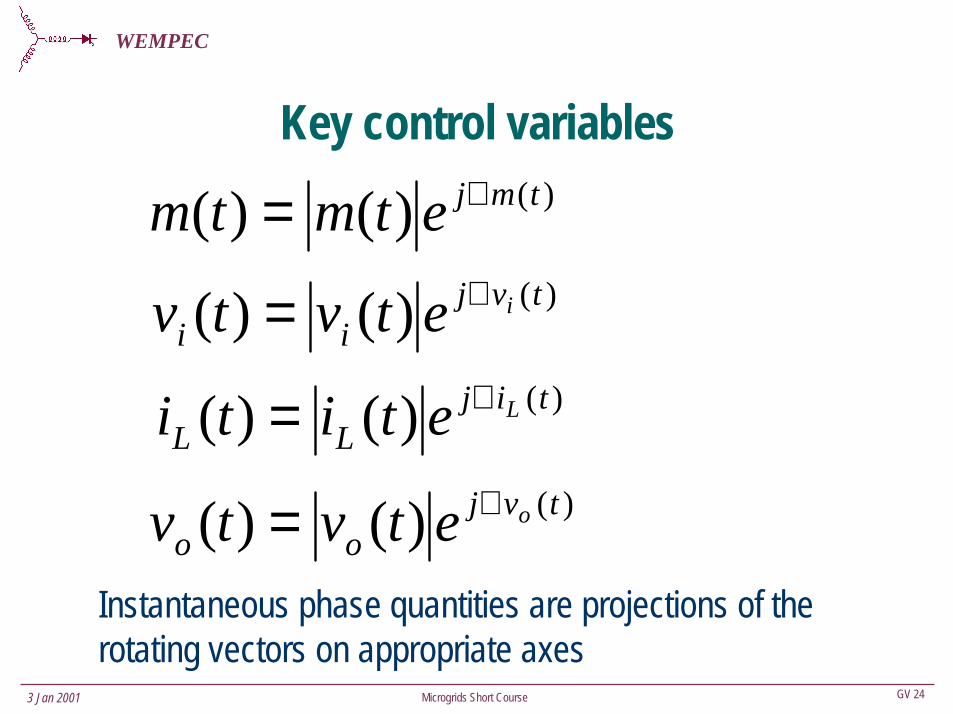
Key control variables
Magnitude and Phase angle
Modulation inputInverter outputFilter inductor current outputCapacitor voltage output
3 Jan 2001
WEMPEC
GV 24Microgrids Short Course
Key control variables)()()( tmjetmtm ∠=)()()( tvj
iiietvtv ∠=
)()()( tijLL
Letiti ∠=)()()( tvj
oooetvtv ∠=
Instantaneous phase quantities are projections of the rotating vectors on appropriate axes
3 Jan 2001
WEMPEC
GV 25Microgrids Short Course
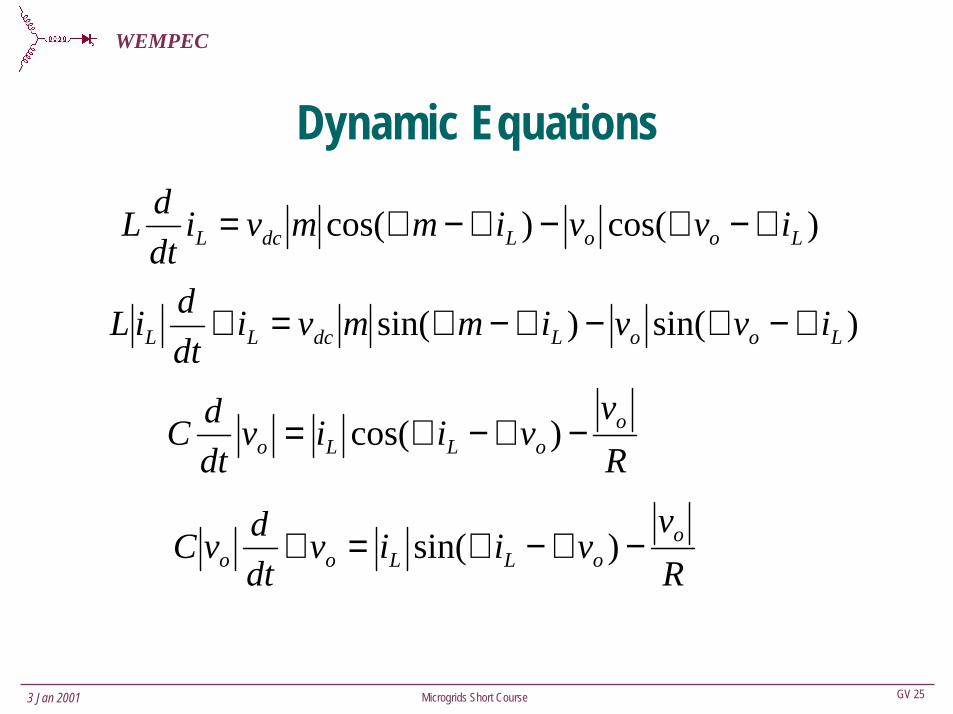
Dynamic Equations
)cos()cos( LooLdcL ivvimmvidtdL ∠−∠−∠−∠=
)sin()sin( LooLdcLL ivvimmvidtdiL ∠−∠−∠−∠=∠
Rv
viivdtdC o
oLLo −∠−∠= )cos(
Rv
viivdtdvC o
oLLoo −∠−∠=∠ )sin(
3 Jan 2001
WEMPEC
GV 26Microgrids Short Course
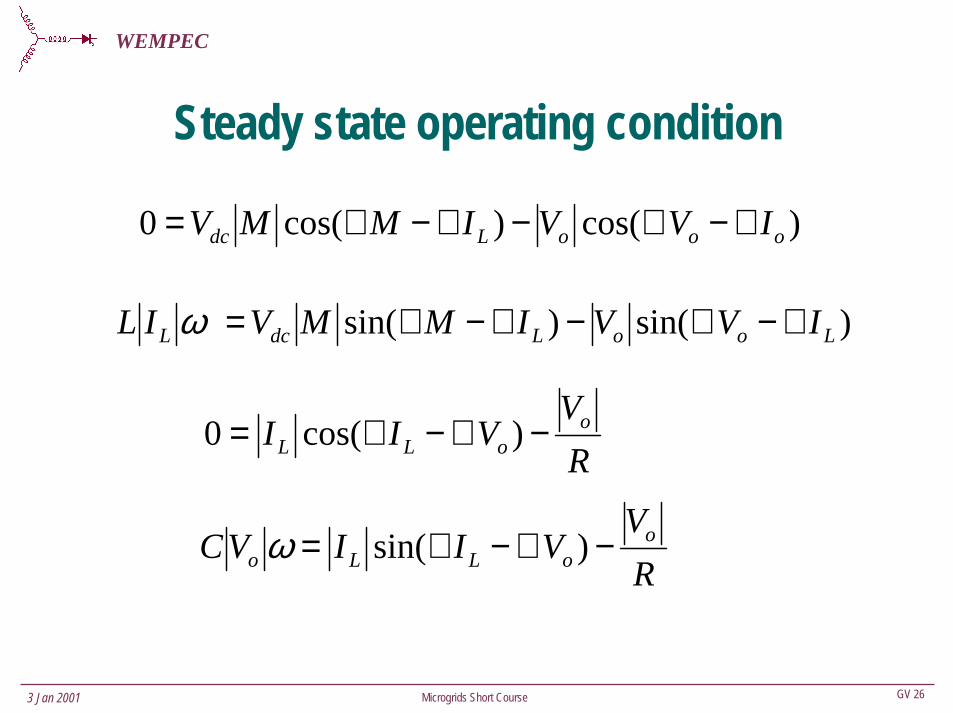
Steady state operating condition
)cos()cos(0 oooLdc IVVIMMV ∠−∠−∠−∠=
)sin()sin( LooLdcL IVVIMMVIL ∠−∠−∠−∠=ω
RV
VII ooLL −∠−∠= )cos(0
RV
VIIVC ooLLo −∠−∠= )sin(ω
3 Jan 2001
WEMPEC
GV 27Microgrids Short Course
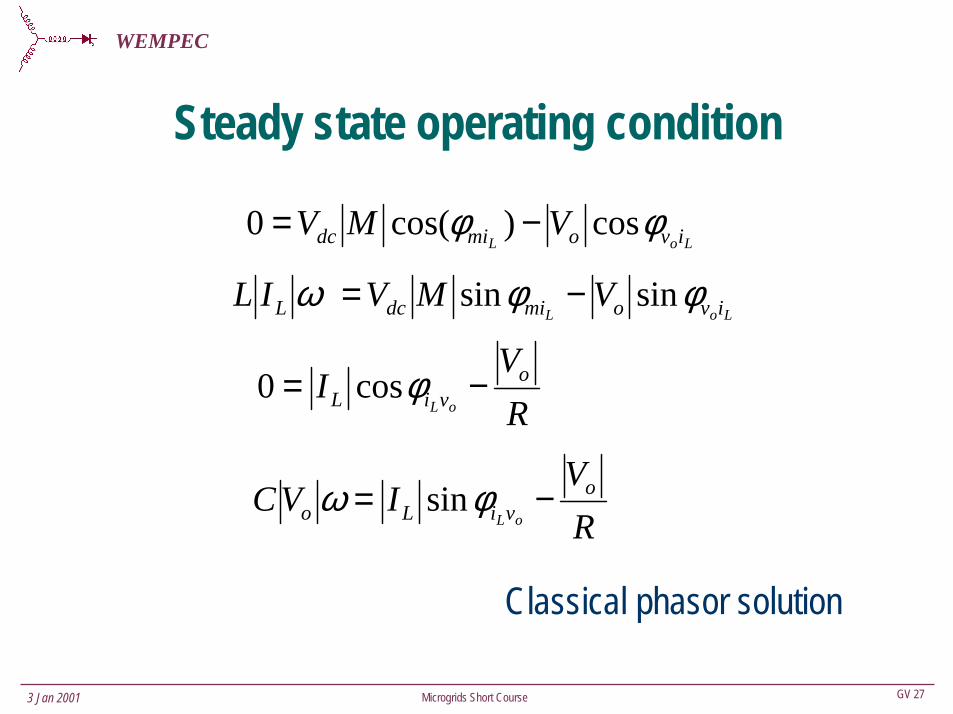
Steady state operating condition
LoL ivomidc VMV φφ cos)cos(0 −=
LoL ivomidcL VMVIL φφω sinsin −=
RV
I oviL oL
−= φcos0
RV
IVC oviLo oL
−= φω sin
Classical phasor solution
3 Jan 2001
WEMPEC
GV 28Microgrids Short Course
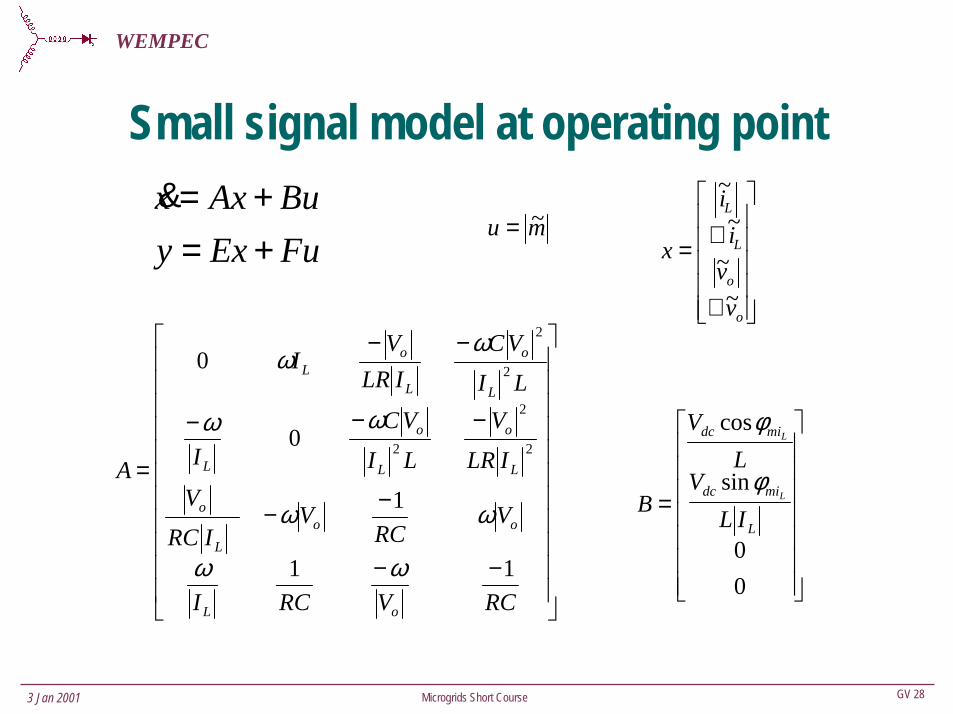
Small signal model at operating point
FuExyBuAxx
+=+=&
−−
−−
−−−
−−
=
RCVRCI
VRC
VIRC
VILR
VLIVC
I
LIVC
ILRV
I
A
oL
ooL
o
L
o
L
o
L
L
o
L
oL
11
1
0
0
2
2
2
2
2
ωω
ωω
ωω
ωω
=
00
sin
cos
L
midc
midc
ILV
LV
B L
L
φ
φ
∠
∠=
o
o
L
L
vvi
i
x
~~
~~
mu ~=
3 Jan 2001
WEMPEC
GV 29Microgrids Short Course
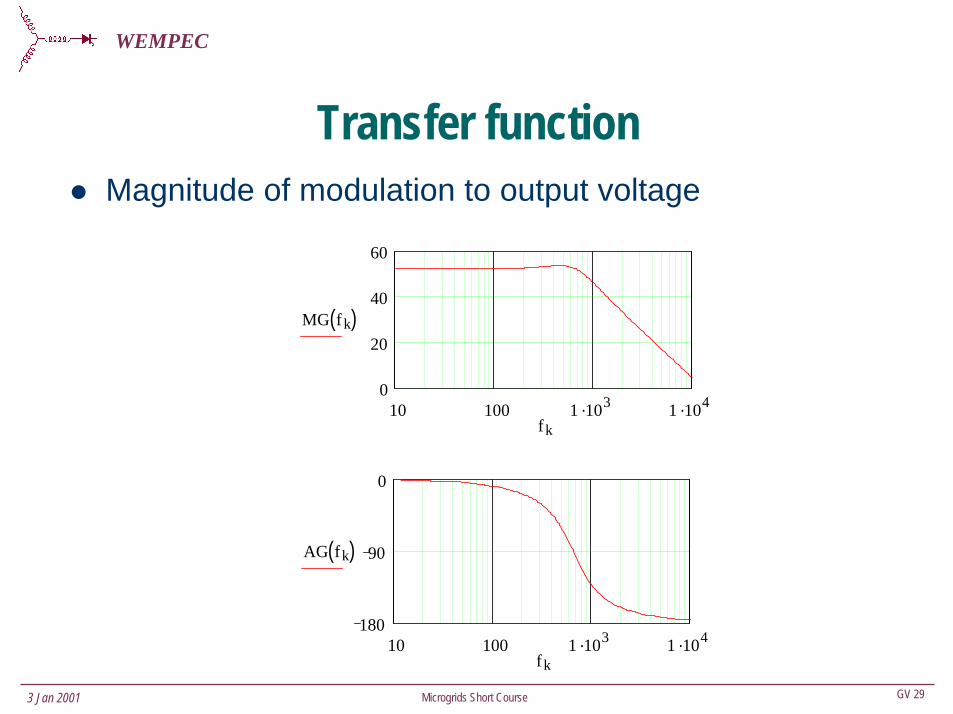
Transfer functionMagnitude of modulation to output voltage
10 100 1 .103 1 .1040
20
40
60
MG fk( )
fk
10 100 1 .103 1 .104180
90
0
AG fk( )
fk
3 Jan 2001
WEMPEC
GV 30Microgrids Short Course
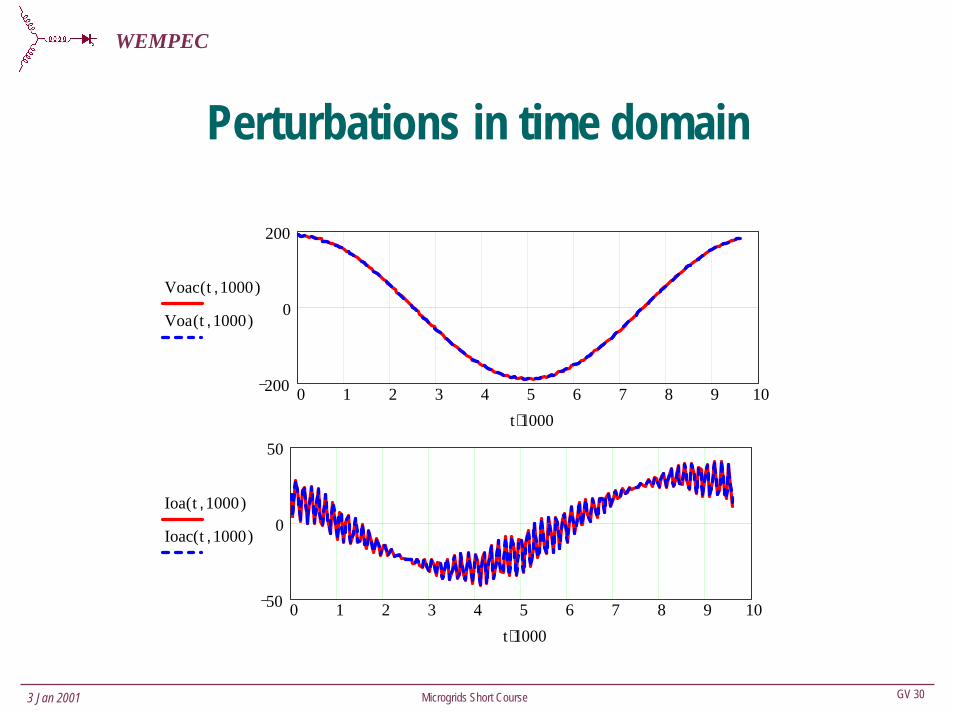
Perturbations in time domain
0 1 2 3 4 5 6 7 8 9 10200
0
200
Voac t 1000,( )
Voa t 1000,( )
t 1000⋅
0 1 2 3 4 5 6 7 8 9 1050
0
50
Ioa t 1000,( )
Ioac t 1000,( )
t 1000⋅
3 Jan 2001
WEMPEC
GV 31Microgrids Short Course
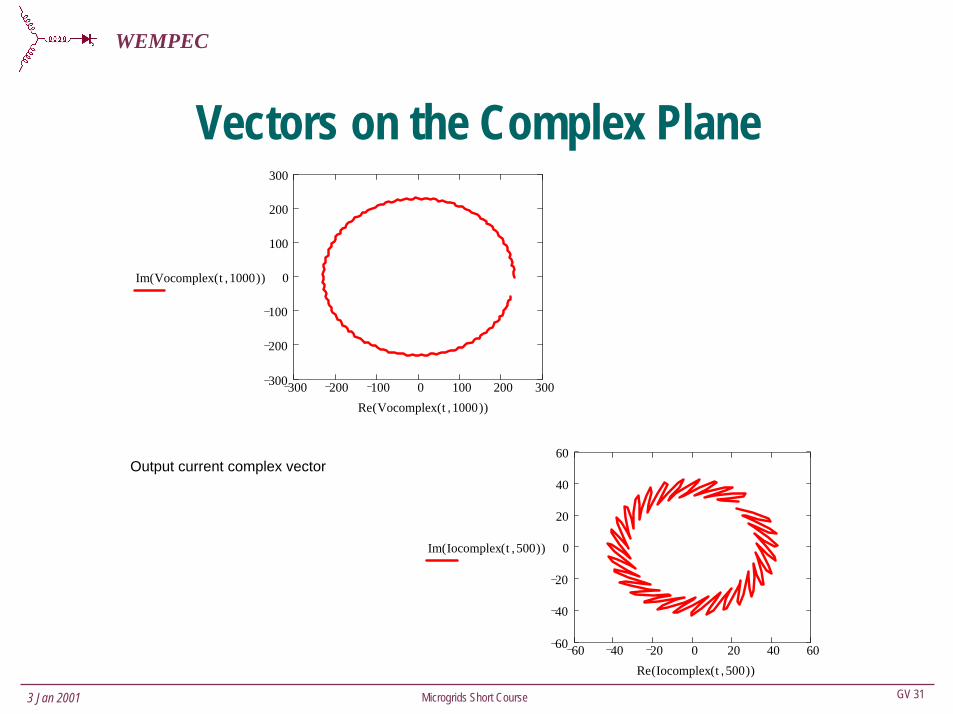
Vectors on the Complex Plane
300 200 100 0 100 200 300300
200
100
0
100
200
300
Im Vocomplex t 1000,( )( )
Re Vocomplex t 1000,( )( )
60 40 20 0 20 40 6060
40
20
0
20
40
60
Im Iocomplex t 500,( )( )
Re Iocomplex t 500,( )( )
Output current complex vector
3 Jan 2001
WEMPEC
GV 32Microgrids Short Course
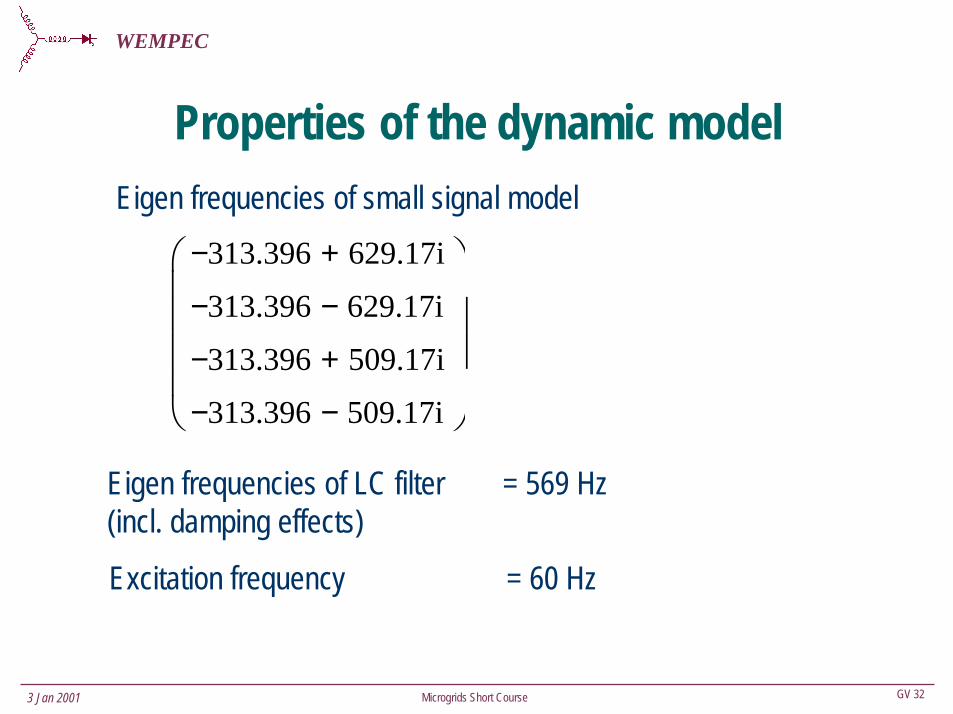
Properties of the dynamic modelEigen frequencies of small signal model
Eigen frequencies of LC filter = 569 Hz(incl. damping effects)
Excitation frequency = 60 Hz
313.396− 629.17i+
313.396− 629.17i−
313.396− 509.17i+
313.396− 509.17i−
3 Jan 2001
WEMPEC
GV 33Microgrids Short Course
Dynamic interaction issues
Angle input to output transfer functionsCross coupling transfer functionsSelection of controllers and tuningOuter loop effects (Real and reactive power, droop, etc.)Frequency synchronizationInteractions between multiple parallel unitsEMI filter interactions
3 Jan 2001
WEMPEC
GV 34Microgrids Short Course
SummaryInverter modeling important aspect of microgrid designStiff dc bus with adequate storage decouples prime mover dynamicsInverter dynamic model based on rotating vectorsModel reduces to phasor model at steady stateSmall signal model properties outlinedVarious transfer functions can be determined, (esp. angle and frequency)Extend and integrate into system models
PSERCR.H.Lasseter University-of-Wisconsin
Robert H. Lasseter Robert H. Lasseter University of Wisconsin University of Wisconsin
Operation and Control of Micro-Grids
PSERCR.H.Lasseter University-of-Wisconsin
MicroMicro--grid concept assumes:grid concept assumes:•• Large clusters of microLarge clusters of micro--sources and sources and
storage systemsstorage systems•• Close to loads with possible CHP Close to loads with possible CHP
applicationsapplications•• Customer Quality of PowerCustomer Quality of Power•• Presented to the grid as a single Presented to the grid as a single
controllable unit (load & source)controllable unit (load & source)
PSERCR.H.Lasseter University-of-Wisconsin
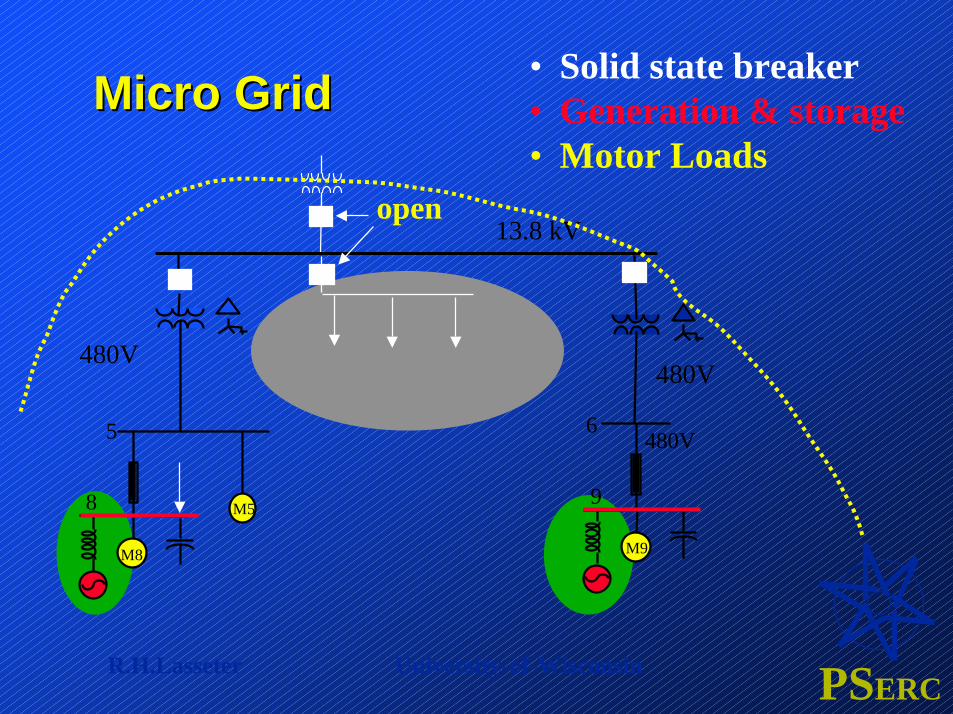
Micro GridMicro Grid • Solid state breaker• Generation & storage• Motor Loads
5
8
M8
M5
6
9
480V
M9
open
480V480V
13.8 kV
PSERCR.H.Lasseter University-of-Wisconsin
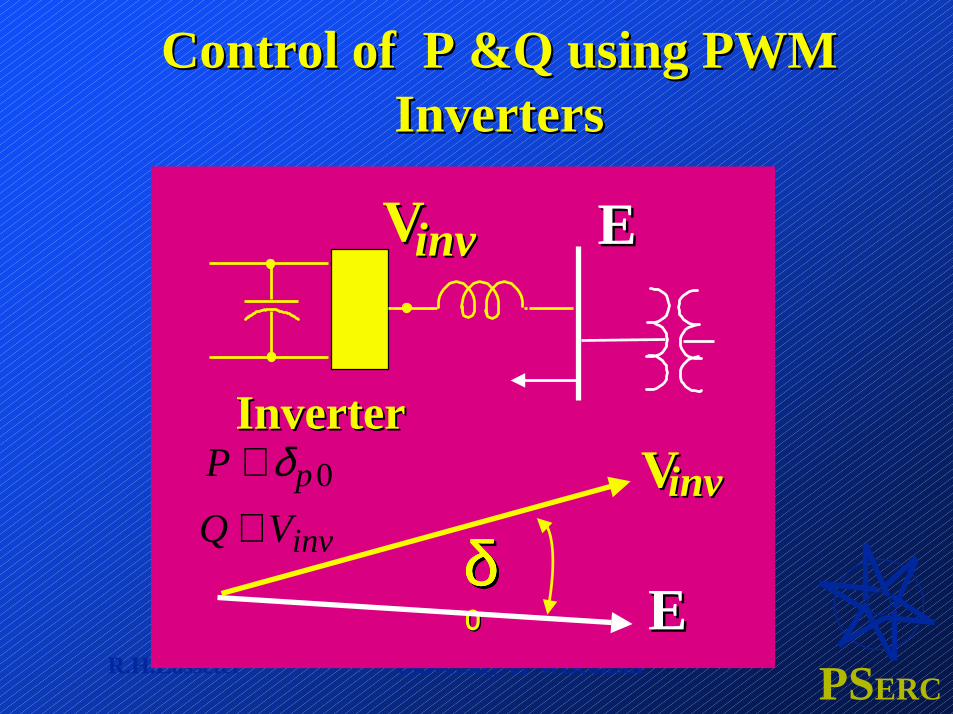
Control of P &Q using PWM Control of P &Q using PWM InvertersInverters
EE
VVinvinv
δδδδδδδδ��00
VVinvinv EE
InverterInverterP ∝ δp0
Q ∝ Vinv
PSERCR.H.Lasseter University-of-Wisconsin
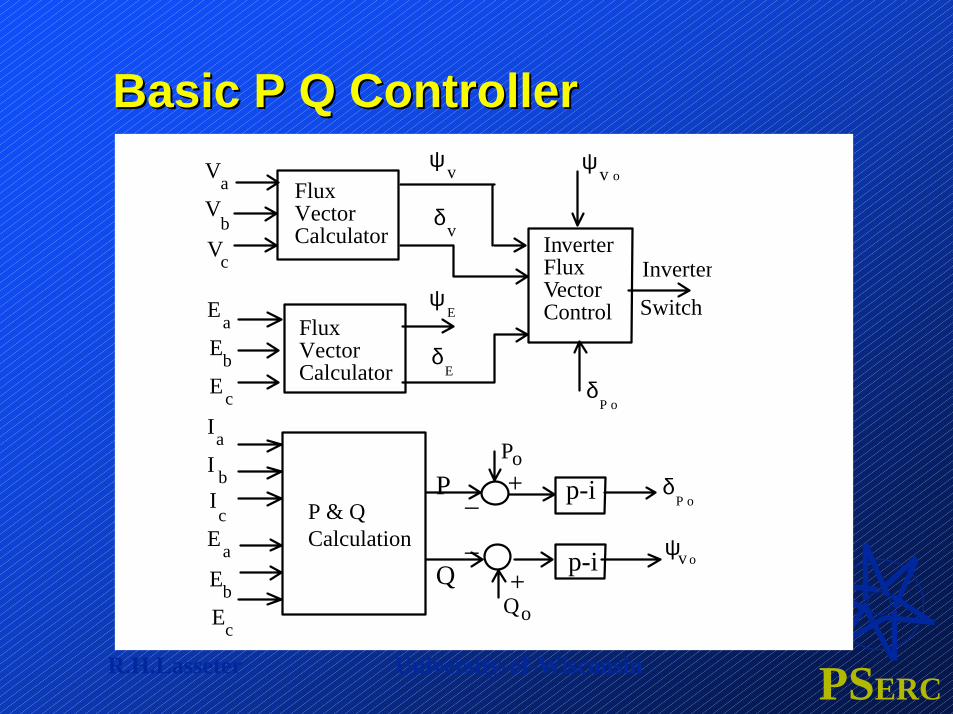
Basic P Q ControllerBasic P Q ControllerVaV
bVc
EaEbEc
r
e
ψv
ψE
δv
δE
δP o
ψv o
IaI bIc
EaEbEc
Q
P _
_
+
+
Po
Qo
ψv o
δP o
Inverter
Switch
FluxVectorCalculator
FluxVectorCalculator
P & QCalculation
InverterFluxVectorControl
p-i
p-i
PSERCR.H.Lasseter University-of-Wisconsin
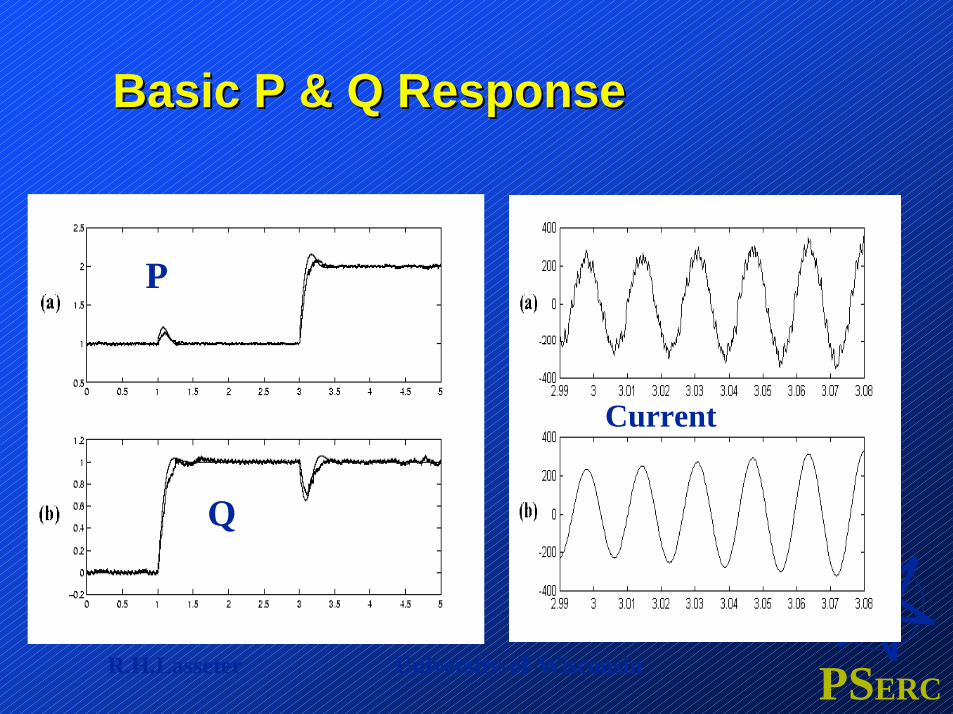
Basic P & Q ResponseBasic P & Q Response
Q
P
Current
PSERCR.H.Lasseter University-of-Wisconsin
Micro Grid connected to T/D GridMicro Grid connected to T/D Grid
MicroMicro--Sources ProvideSources Provide•• Control of local bus voltageControl of local bus voltage•• Control of base power flowControl of base power flow
Fast Load tracking is provided by the gridFast Load tracking is provided by the grid
Micro Grid: Dispatchable load to the gridMicro Grid: Dispatchable load to the grid
PSERCR.H.Lasseter University-of-Wisconsin
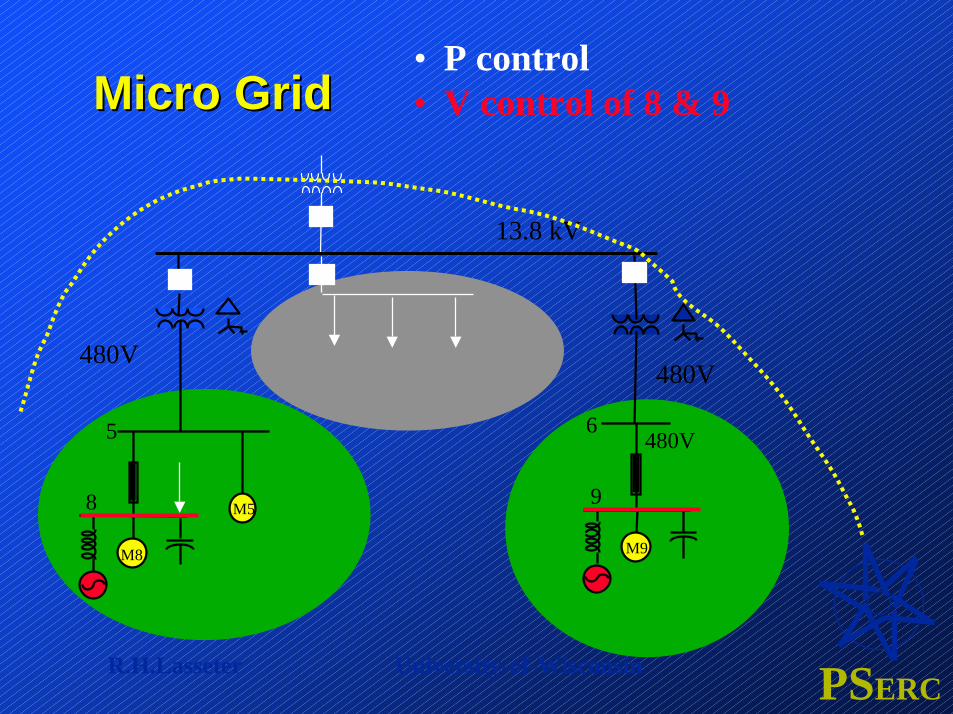
Micro GridMicro Grid• P control• V control of 8 & 9
5
8
M8
M5
6
9
480V
M9
480V480V
13.8 kV
PSERCR.H.Lasseter University-of-Wisconsin
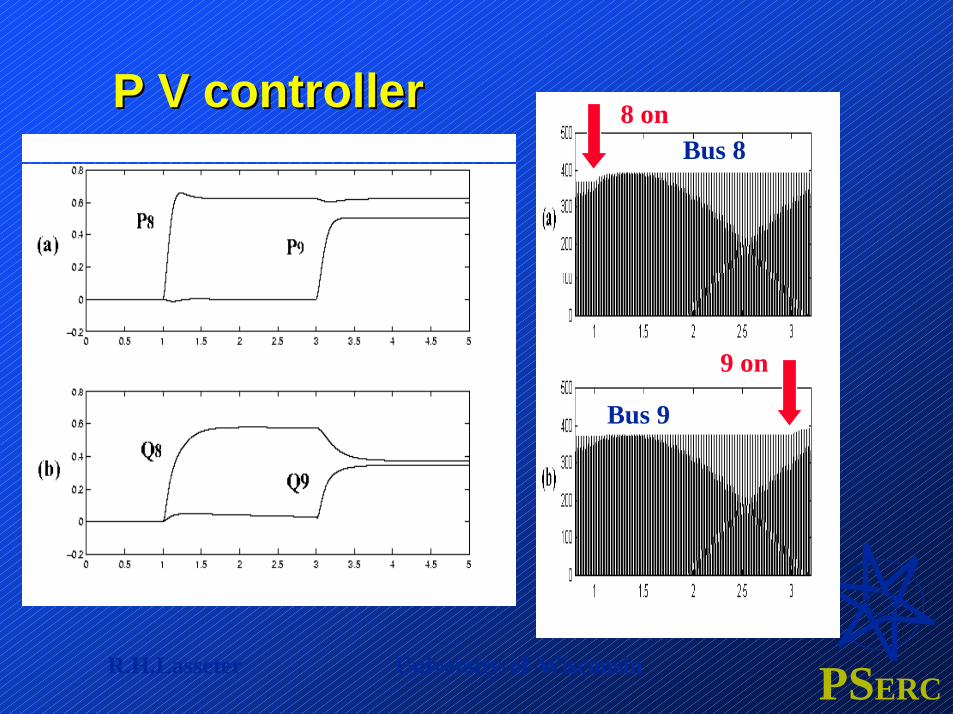
P V controllerP V controller 8 on
9 on
Bus 8
Bus 9
PSERCR.H.Lasseter University-of-Wisconsin
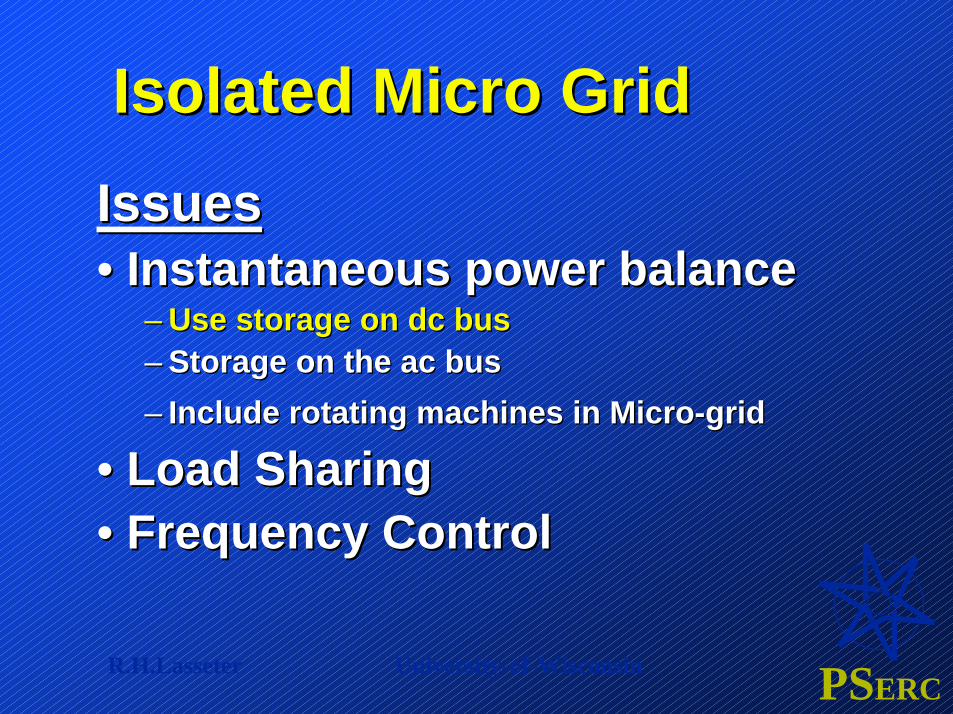
Isolated Micro GridIsolated Micro GridIssuesIssues•• Instantaneous power balanceInstantaneous power balance
–– Use storage on dc busUse storage on dc bus–– Storage on the ac busStorage on the ac bus–– Include rotating machines in MicroInclude rotating machines in Micro--gridgrid
•• Load SharingLoad Sharing•• Frequency ControlFrequency Control
PSERCR.H.Lasseter University-of-Wisconsin
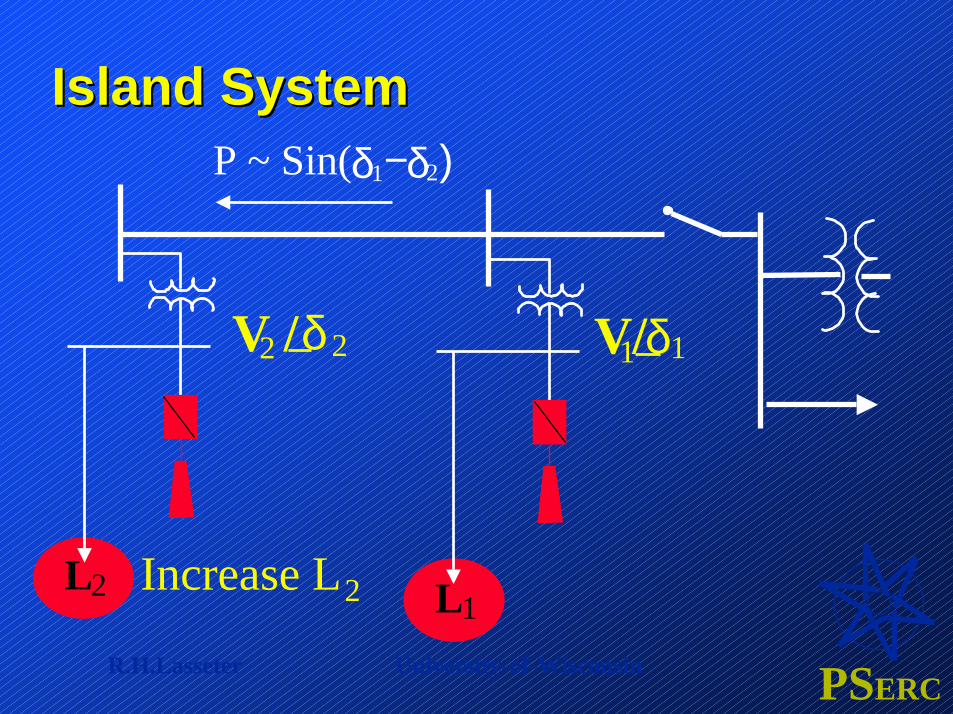
Island SystemIsland System
L1L2
δ2V / 2 δ1V/ 1
P ~ Sin( − )δ
2δ1
Increase L2
PSERCR.H.Lasseter University-of-Wisconsin
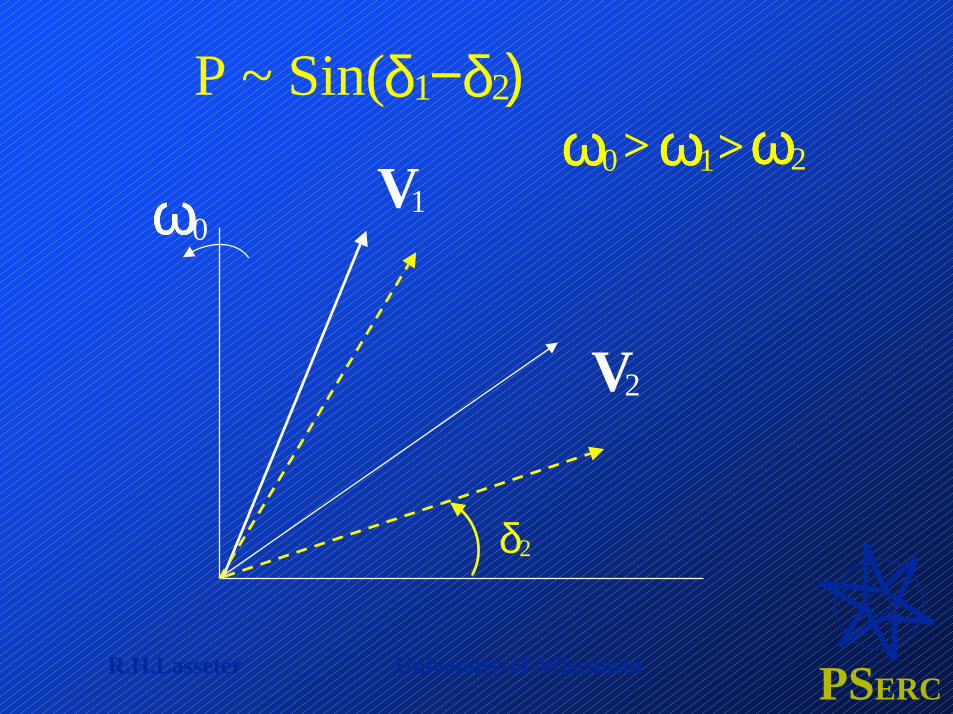
ωωωω0 ωωωω1 ωωωω2> >ωωωω0
V1
V2
P ~ Sin( − )δ1 δ2
δ2
PSERCR.H.Lasseter University-of-Wisconsin
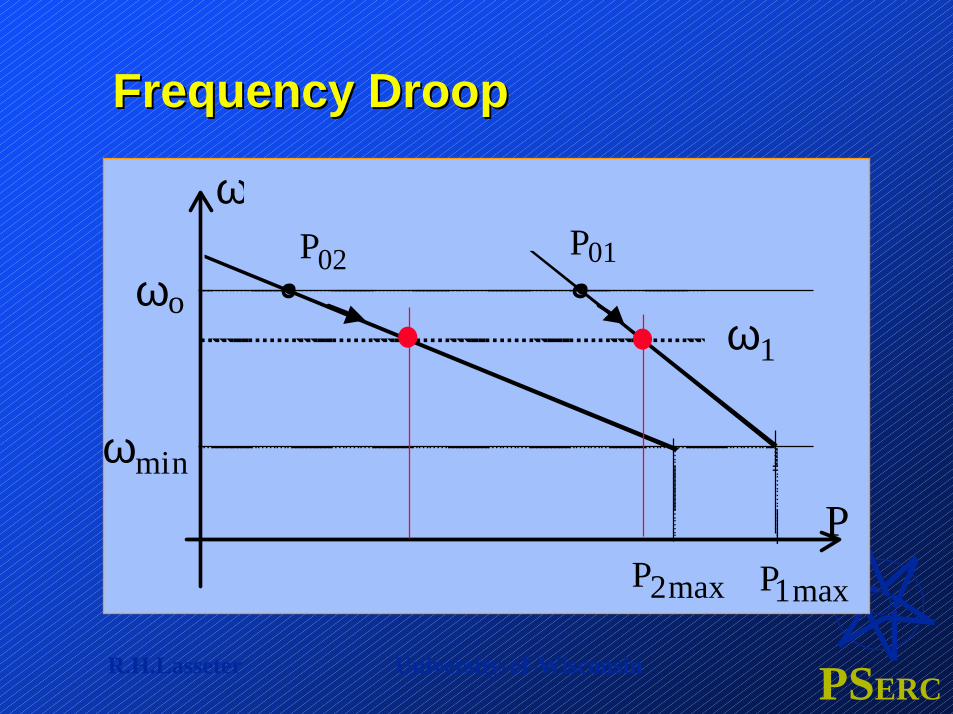
Frequency DroopFrequency Droop
P
ω
ωo
ωmin
ω1
P1max
P01P02
P2max
PSERCR.H.Lasseter University-of-Wisconsin
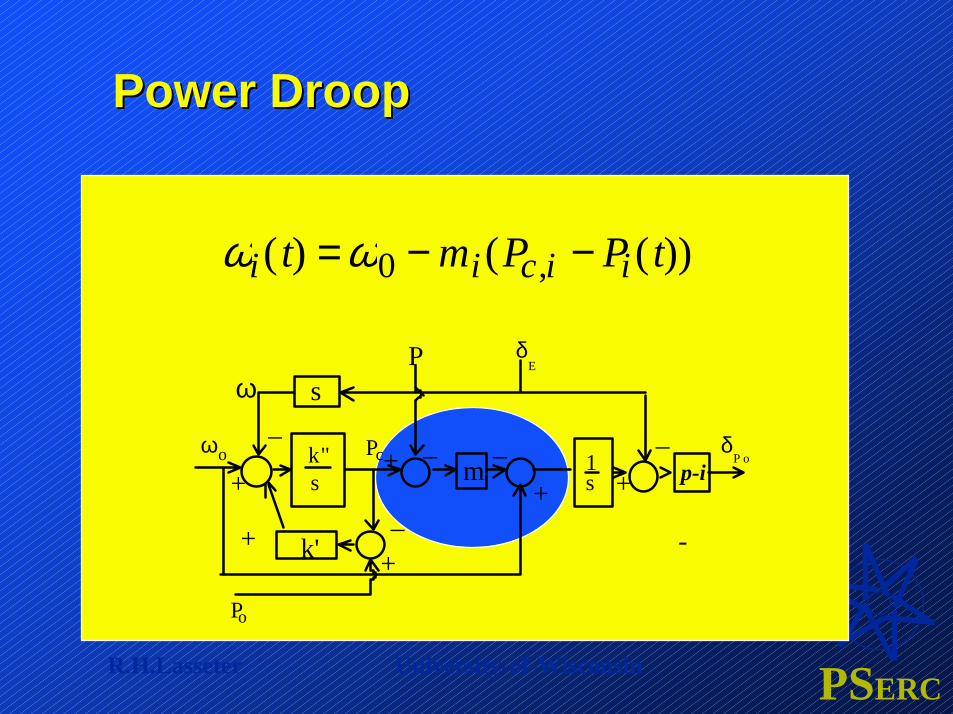
Power DroopPower Droop
ωo
s
ks"
k'
m 1s
-
δE
δP o
Po
P
+
++
++ +
_ _
_
_Pc
ω_
p-i
ωi( t) =ω0 − mi(Pc,i − Pi ( t))
PSERCR.H.Lasseter University-of-Wisconsin
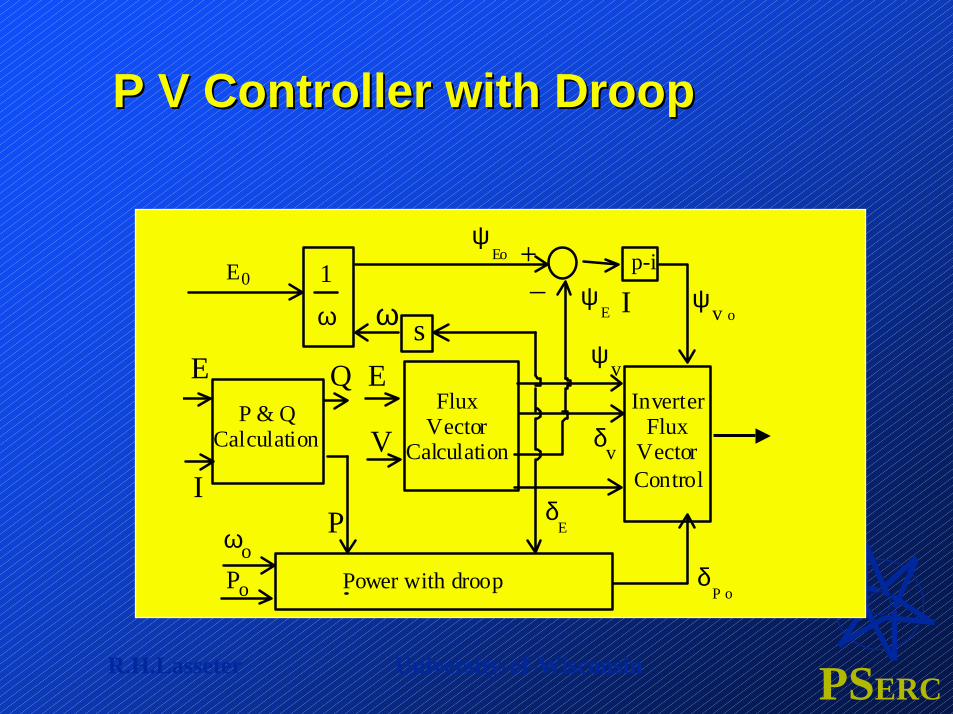
P V Controller with DroopP V Controller with Droop
s
1
ω ω I
P & QCalculation
FluxVector
Calculation
InverterFlux
VectorControl
ωoPo
P
QE
I
E
V
Power with droop
δv
ψv
ψE
δE
+_
δP o
ψv o
ψEo
E0p-i
PSERCR.H.Lasseter University-of-Wisconsin
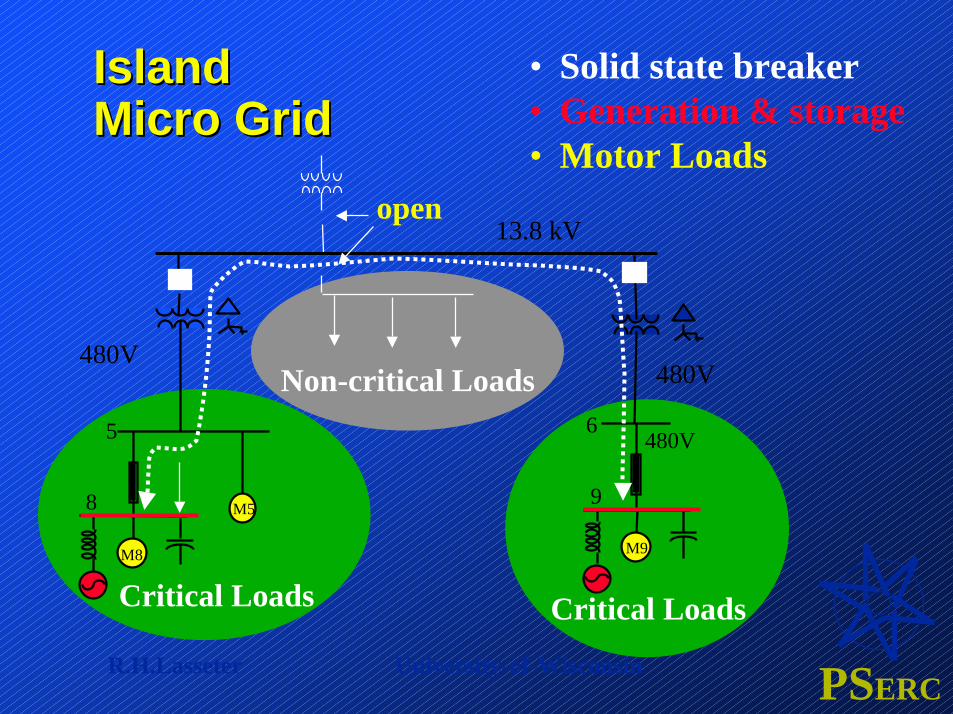
IslandIslandMicro GridMicro Grid
• Solid state breaker• Generation & storage• Motor Loads
Non-critical Loads
Critical Loads
5
8
M8
M5
Critical Loads
6
9
480V
M9
open
480V480V
13.8 kV
PSERCR.H.Lasseter University-of-Wisconsin
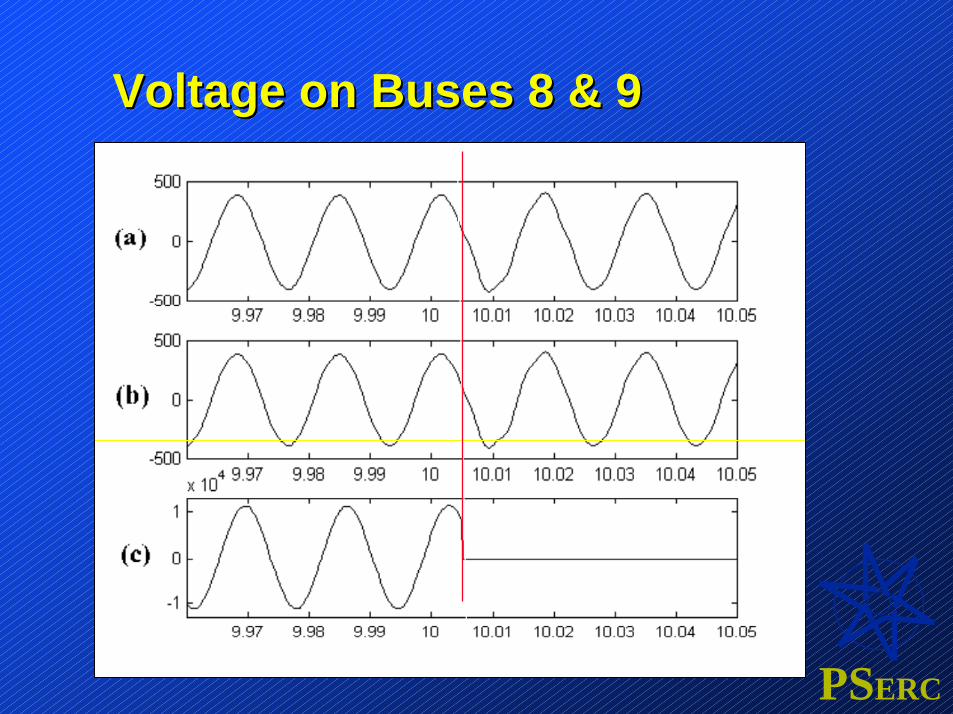
Voltage on Buses 8 & 9Voltage on Buses 8 & 9
PSERCR.H.Lasseter University-of-Wisconsin
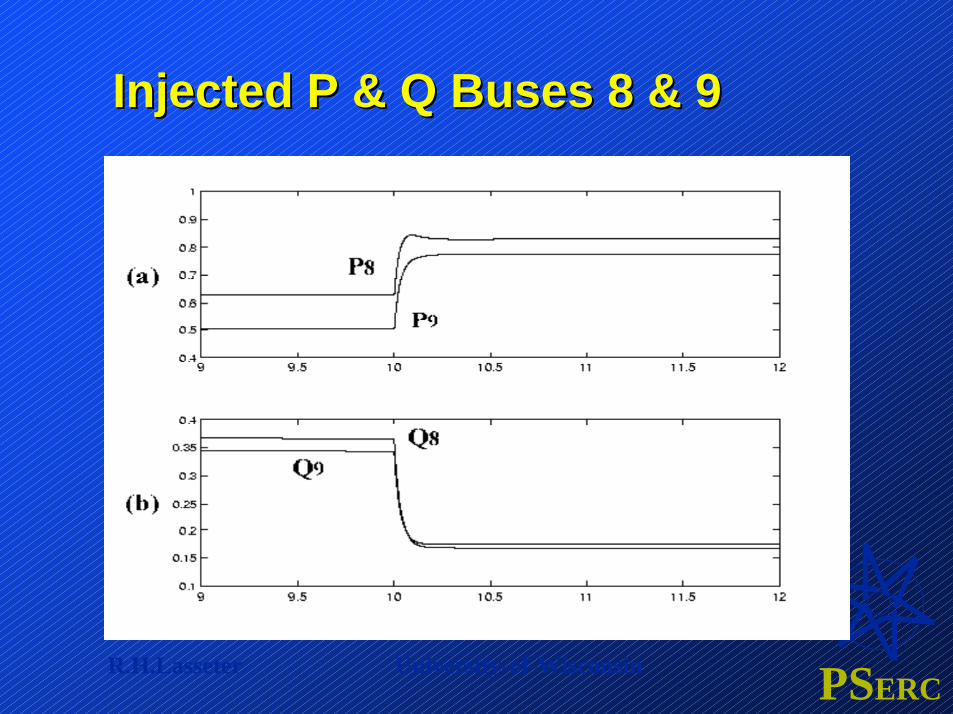
Injected P & Q Buses 8 & 9Injected P & Q Buses 8 & 9

PSERCR.H.Lasseter University-of-Wisconsin
Frequency DroopFrequency Droop
P
ω
ωo
ωmin
ω1
P1max
P01P02
P2max
PSERCR.H.Lasseter University-of-Wisconsin
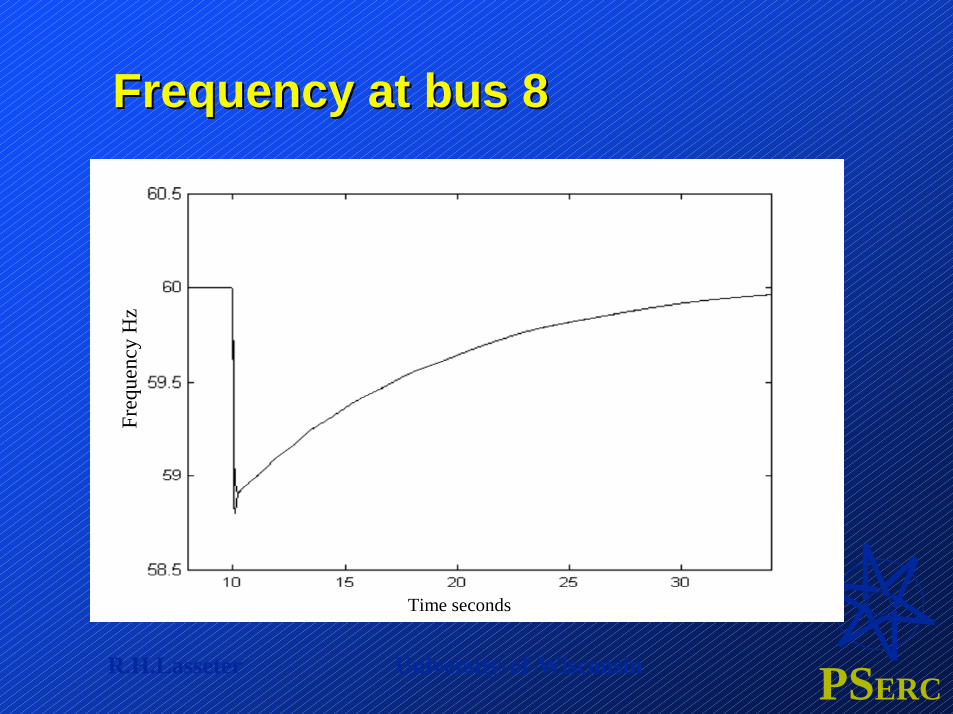
Frequency at bus 8Frequency at bus 8
Time seconds
Freq
uenc
y H
z
PSERCR.H.Lasseter University-of-Wisconsin
Power Quality is the attribute of Power Quality is the attribute of electric power which enables electric power which enables utility customers’ electrical and utility customers’ electrical and electronic equipment to operate electronic equipment to operate as intendedas intended
Sensitive loads Sensitive loads (Quality & Service(Quality & Service))
PSERCR.H.Lasseter University-of-Wisconsin
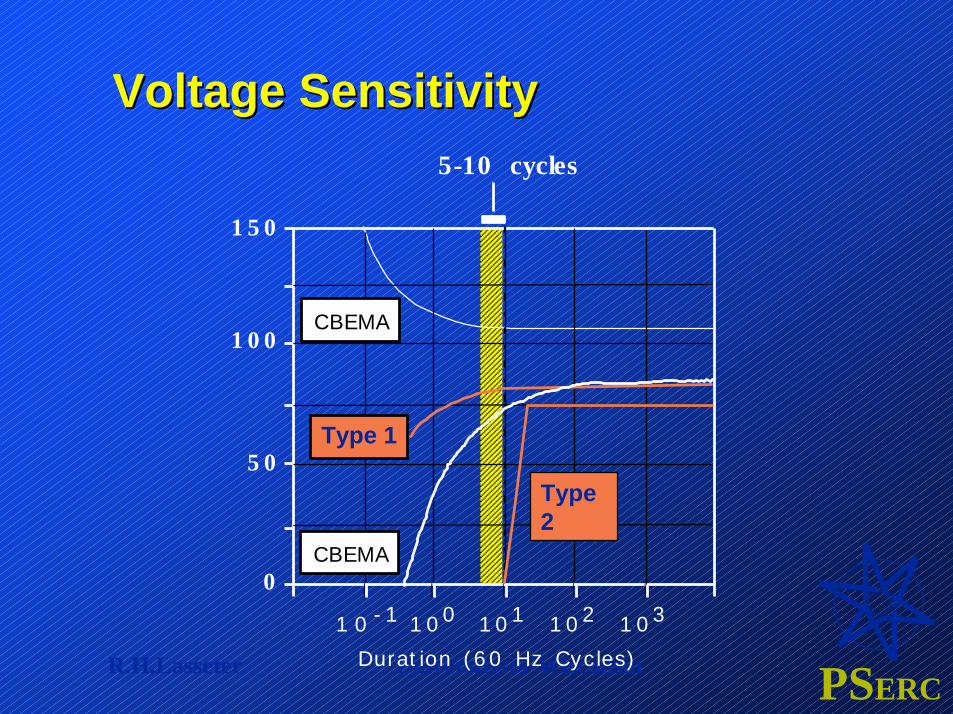
Voltage SensitivityVoltage Sensitivity
1 5 0
1 0 0
5 0
0
1 0 - 1 1 0 0 1 0 1 1 0 2 1 0 3
Durat ion ( 6 0 Hz Cycles)
5-10 cycles
CBEMA
CBEMA
Type 2
Type 1
PSERCR.H.Lasseter University-of-Wisconsin
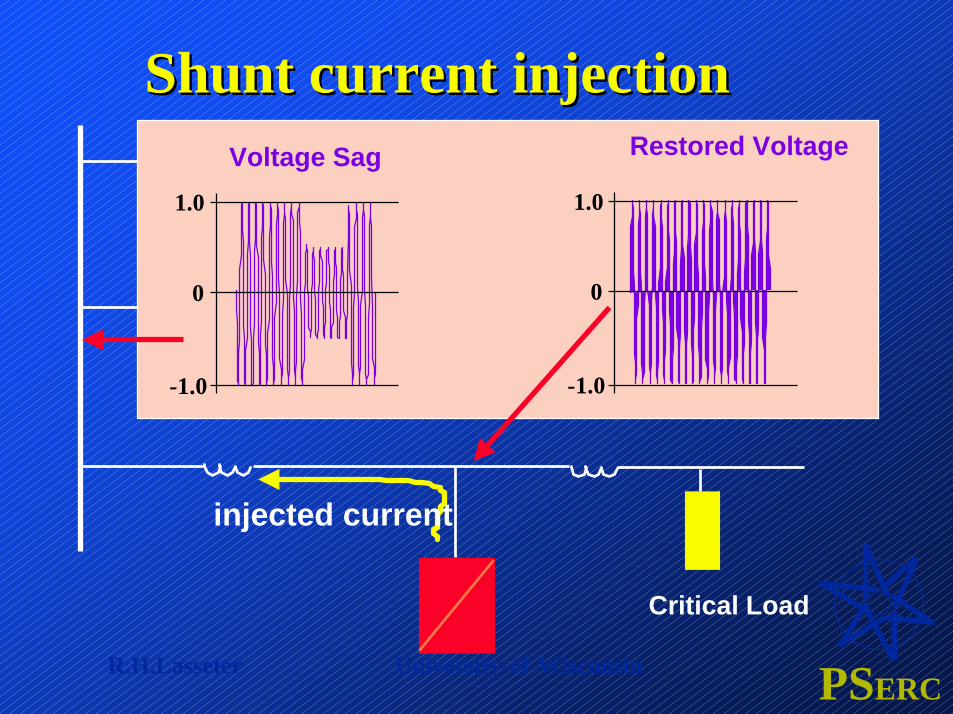
Shunt current injectionShunt current injection
Critical Load
Voltage Sag1.0
-1.0
0
Restored Voltage
1.0
-1.0
0
injected current
PSERCR.H.Lasseter University-of-Wisconsin
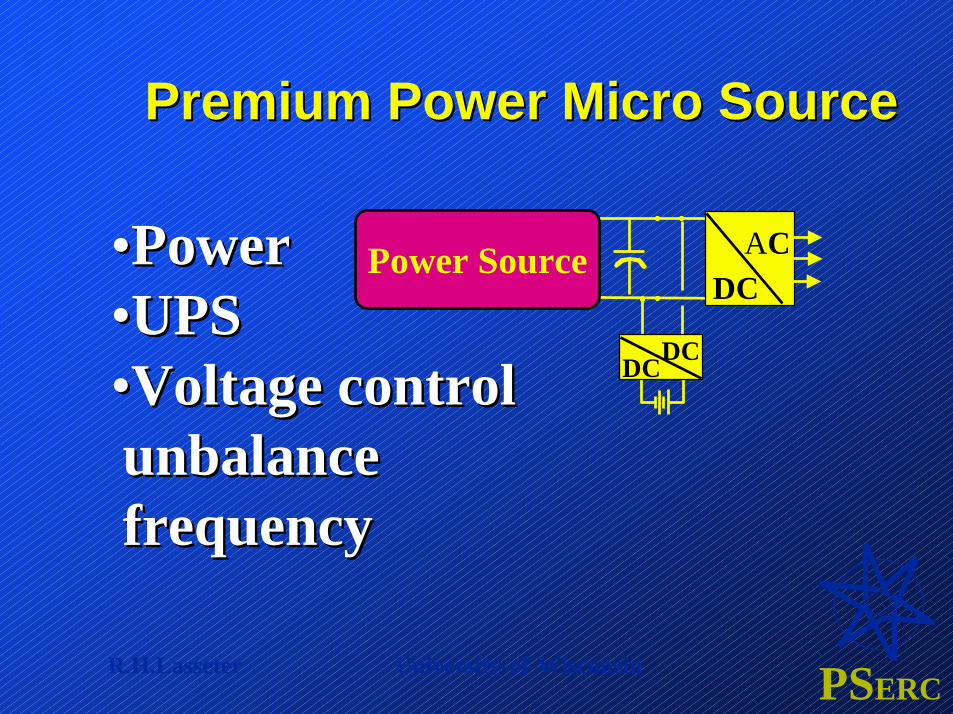
Power Source ACDC
DCDC
••PowerPower••UPS UPS ••Voltage controlVoltage controlunbalanceunbalancefrequencyfrequency
Premium Power Micro SourcePremium Power Micro Source
PSERCR.H.Lasseter University-of-Wisconsin
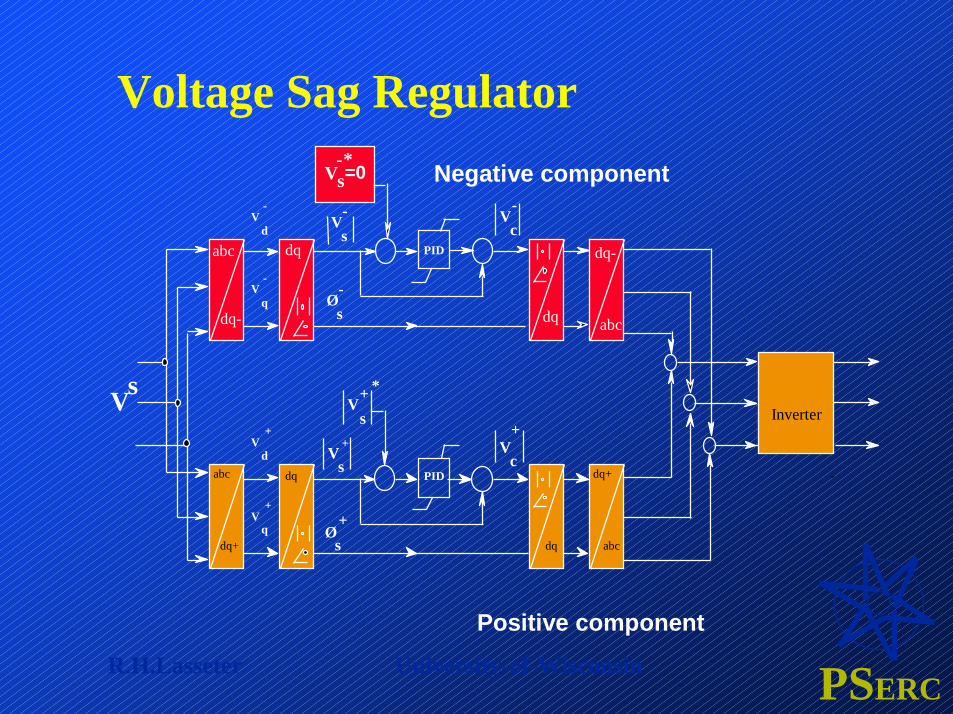
Voltage Sag Regulator
-
sV-*
dq abc
dq+
Vs
abc
dq+
Vd
+
Vq
+
dq
abc
dq-
Vd
-
Vq
-
dq
Vs-
Øs-
dq abc
dq-
Vc-
Vc
+Inverter
PID
Vs+
Vs+ *
Øs+
PID
=0 Negative component
Positive component
PSERCR.H.Lasseter University-of-Wisconsin
Inverter Response to SLG
PSERCR.H.Lasseter University-of-Wisconsin
Micro Grids & Premium PowerMicro Grids & Premium Power
•• Generation Close to loadsGeneration Close to loads–– Local reliabilityLocal reliability–– Possible CHP applicationsPossible CHP applications
•• Premium PowerPremium Power–– UPS functionsUPS functions–– BackBack--up serviceup service–– Custom Power functionsCustom Power functions
PSERCR.H.Lasseter University-of-Wisconsin
Research NeedsResearch Needs
1.1. Clear interfaces/functions to the Clear interfaces/functions to the GridGrid
2.2. MicroMicro--Grid protectionGrid protection3.3. Plug & play controlsPlug & play controls4.4. Placement tools including CHP.Placement tools including CHP.