Embed Size (px)
Citation preview
3/28/2012
1
M i d Wi h d P i l Di hMonitored Withstand, Partial Discharge and Tan Delta Tests at Snohomish PUD
Ni l H t 1 J h P k l1 St St ik2Nigel Hampton1, Joshua Perkel1, Steve Stangvik21NEETRAC & 2Snohomish PUD
Spring 2012 ICC Meeting – Subcommittee FSeattle WA
Spring 2012 ICC Meeting Subcommittee F – Field Testing and Diagnostics
Seattle, WAMarch 27, 2012
1
3/28/2012
2
Part 1 Spring ICC: Testing &Part 1 Spring ICC: Testing & Asset Prognosis
Part 2 Fall ICC: Health Indices
Spring 2012 ICC Meeting Subcommittee F – Field Testing and Diagnostics 2
3/28/2012
3
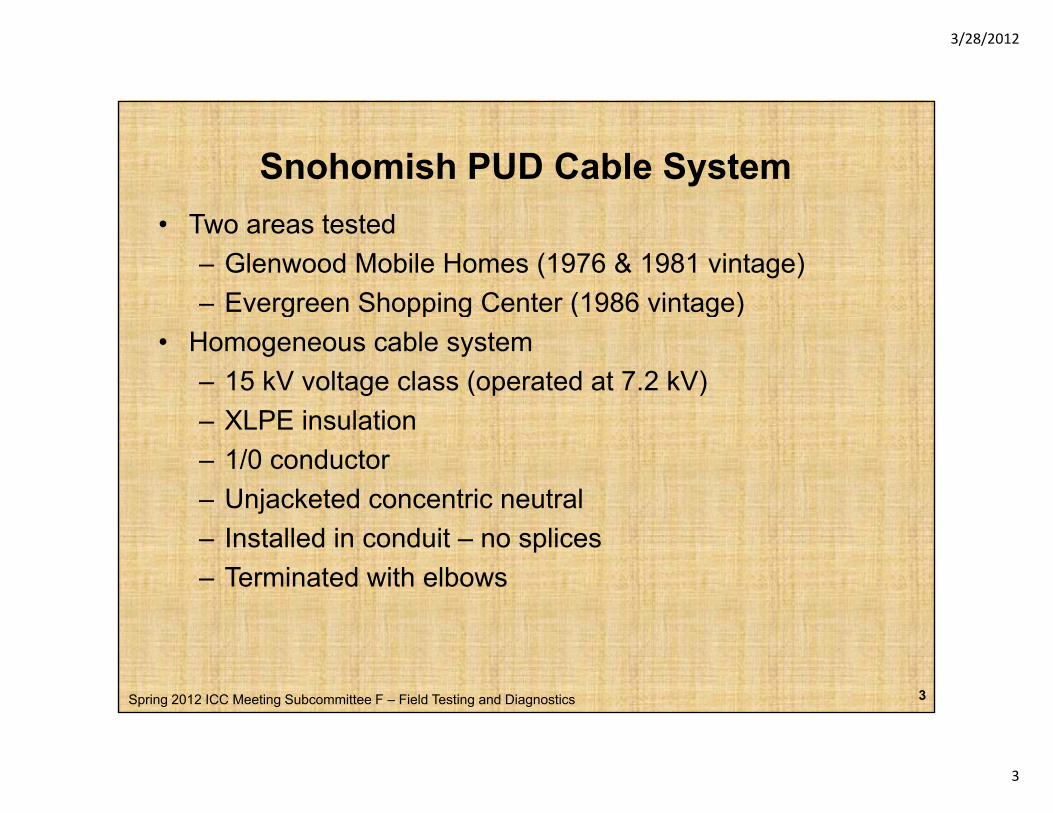
Snohomish PUD Cable System• Two areas tested
– Glenwood Mobile Homes (1976 & 1981 vintage)– Evergreen Shopping Center (1986 vintage)– Evergreen Shopping Center (1986 vintage)
• Homogeneous cable system– 15 kV voltage class (operated at 7.2 kV)– XLPE insulation– 1/0 conductor– Unjacketed concentric neutralj– Installed in conduit – no splices– Terminated with elbows
Spring 2012 ICC Meeting Subcommittee F – Field Testing and Diagnostics 3
3/28/2012
4
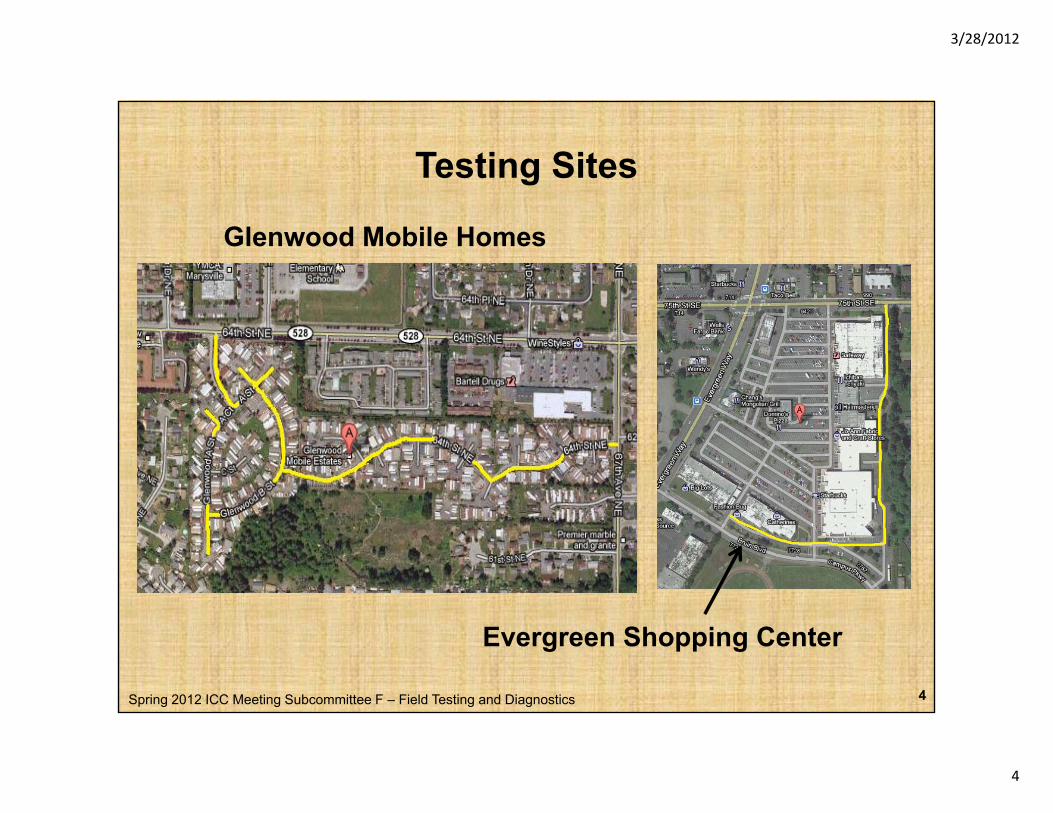
Testing Sites
Glenwood Mobile Homes
Spring 2012 ICC Meeting Subcommittee F – Field Testing and Diagnostics 4
Evergreen Shopping Center
3/28/2012
5
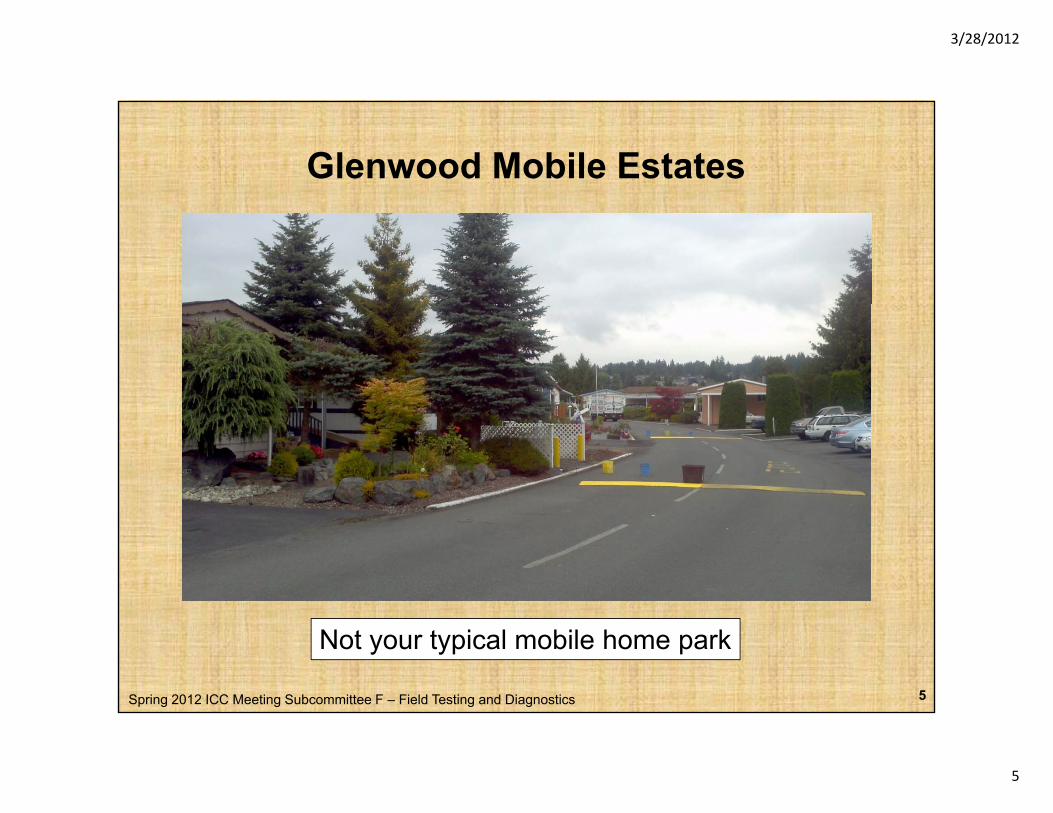
Glenwood Mobile Estates
Spring 2012 ICC Meeting Subcommittee F – Field Testing and Diagnostics 5
Not your typical mobile home park
3/28/2012
6
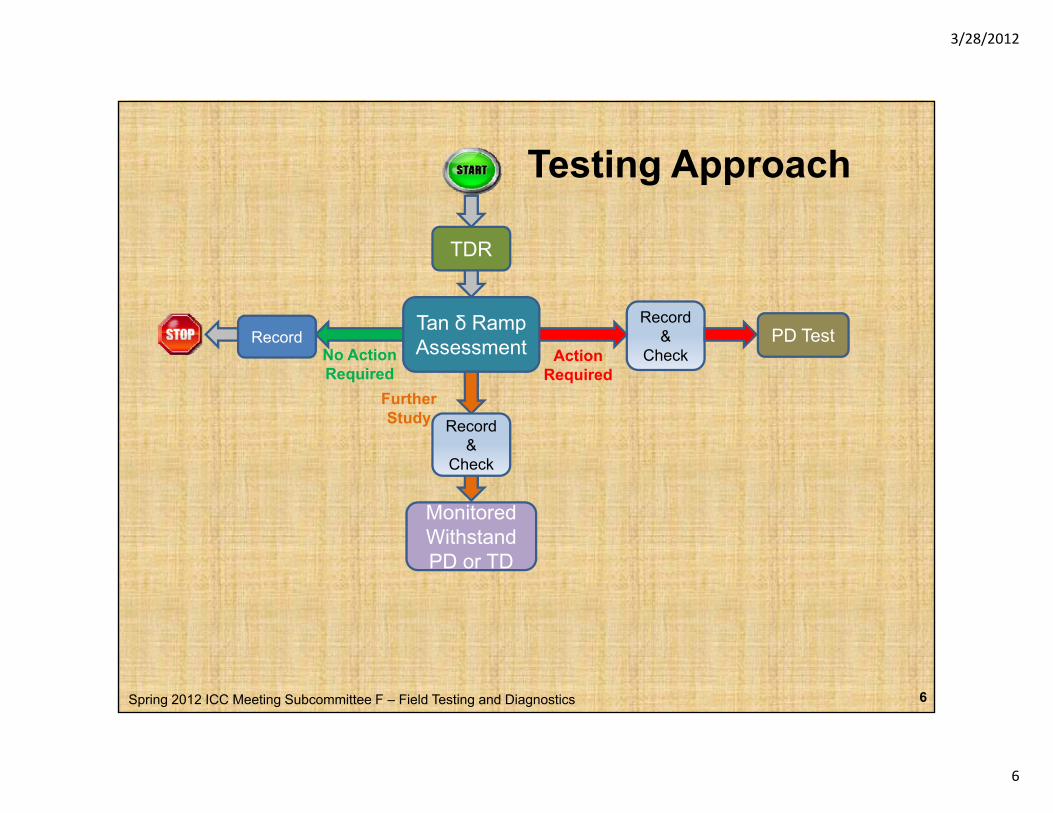
Testing Approach
TDR
No Action Required
Action Required
Record&
CheckPD Test
Further
Tan δ RampAssessmentRecord
Study
Monitored
Record &
Check
Monitored WithstandPD or TD
Spring 2012 ICC Meeting Subcommittee F – Field Testing and Diagnostics 6
3/28/2012
7
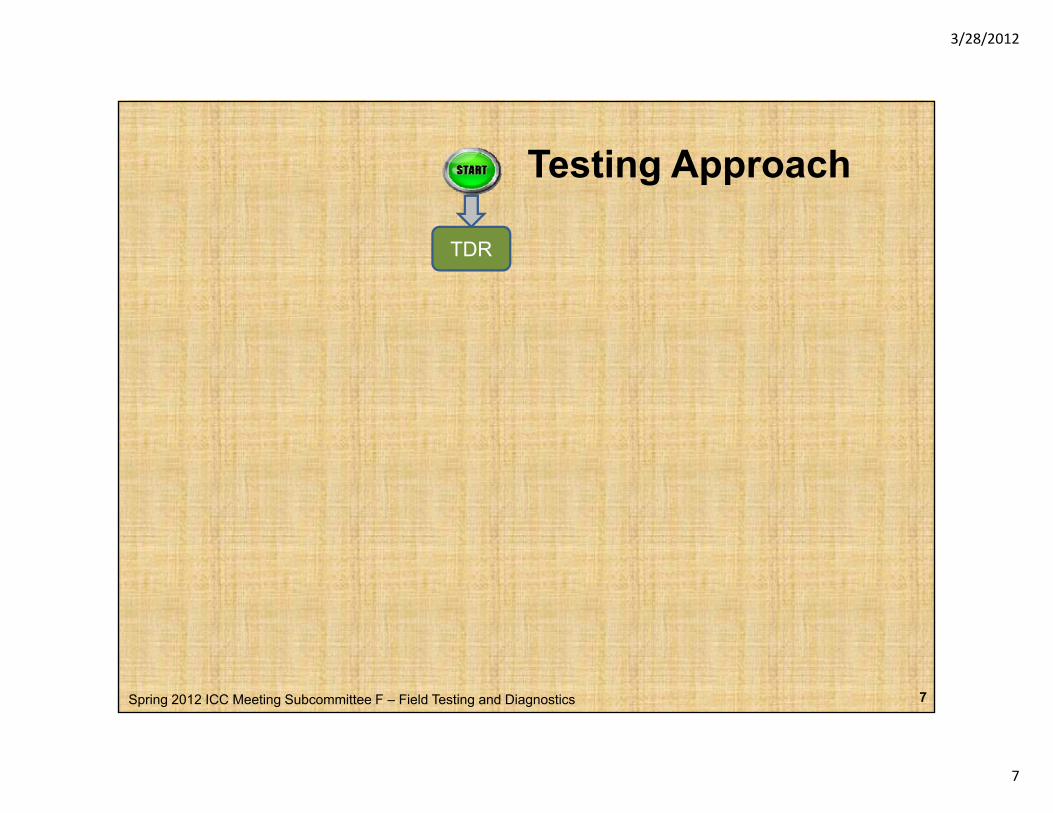
Testing Approach
TDR
Spring 2012 ICC Meeting Subcommittee F – Field Testing and Diagnostics 7
3/28/2012
8
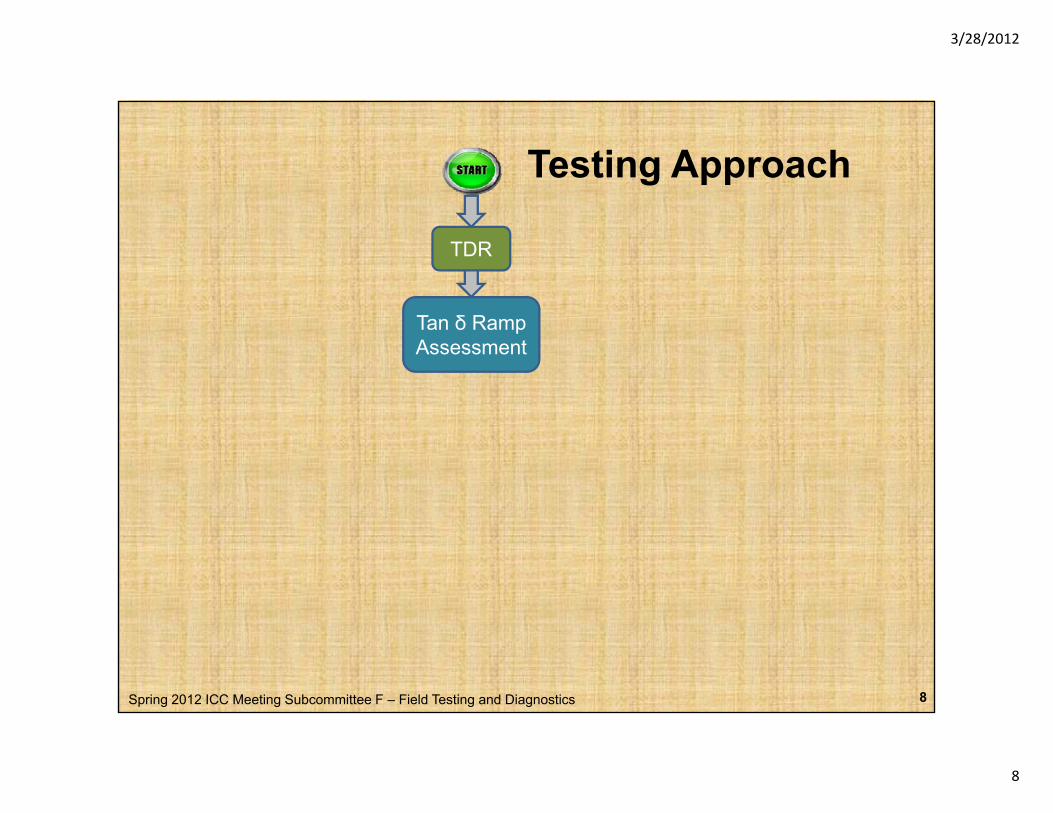
Testing Approach
TDR
Tan δ RampAssessment
Spring 2012 ICC Meeting Subcommittee F – Field Testing and Diagnostics 8
3/28/2012
9
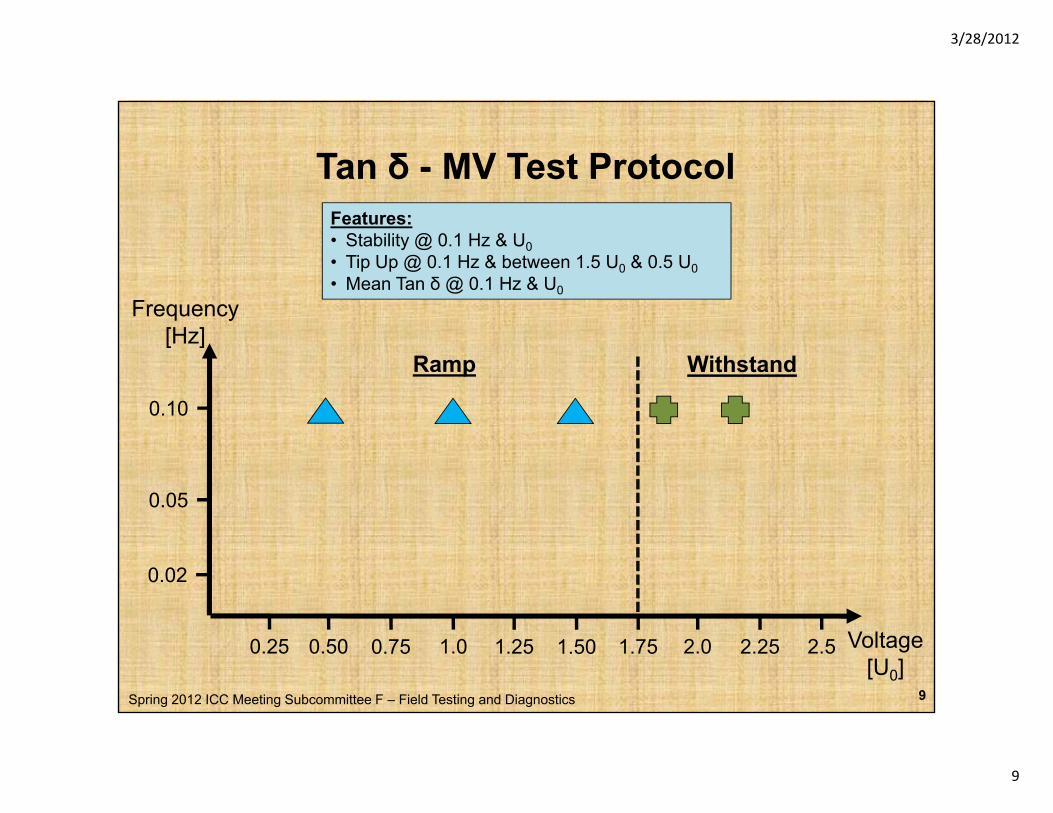
Tan δ - MV Test Protocol
Frequency
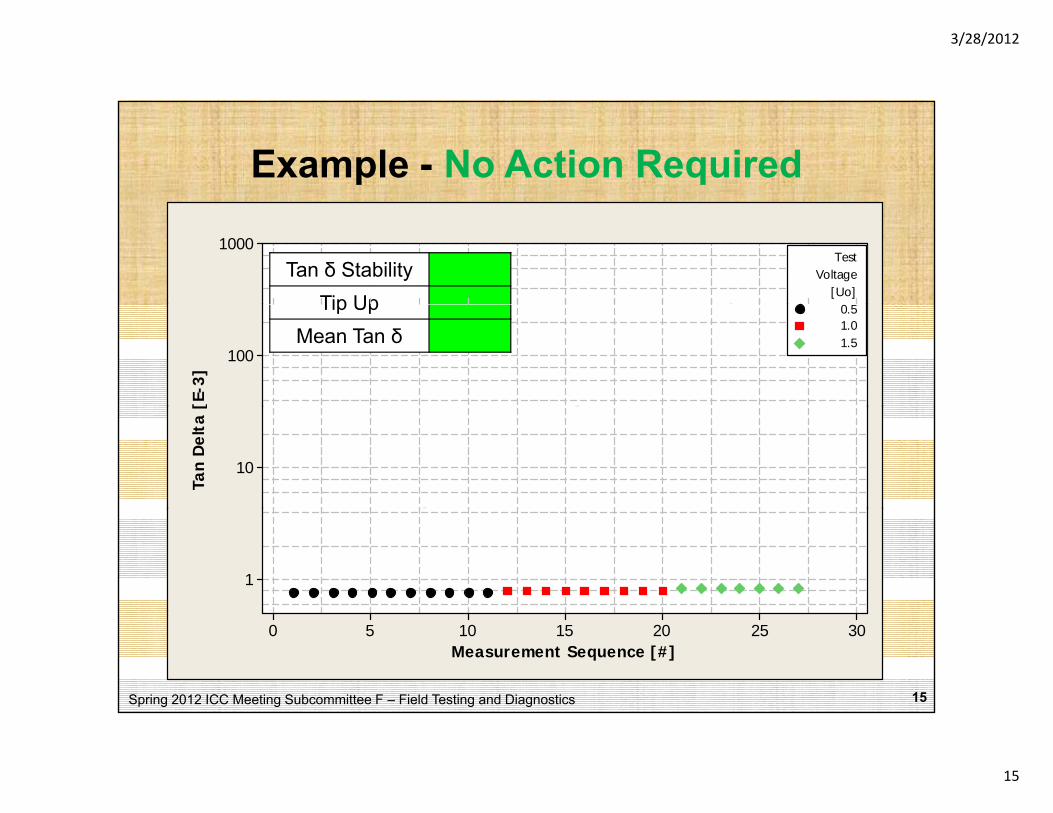
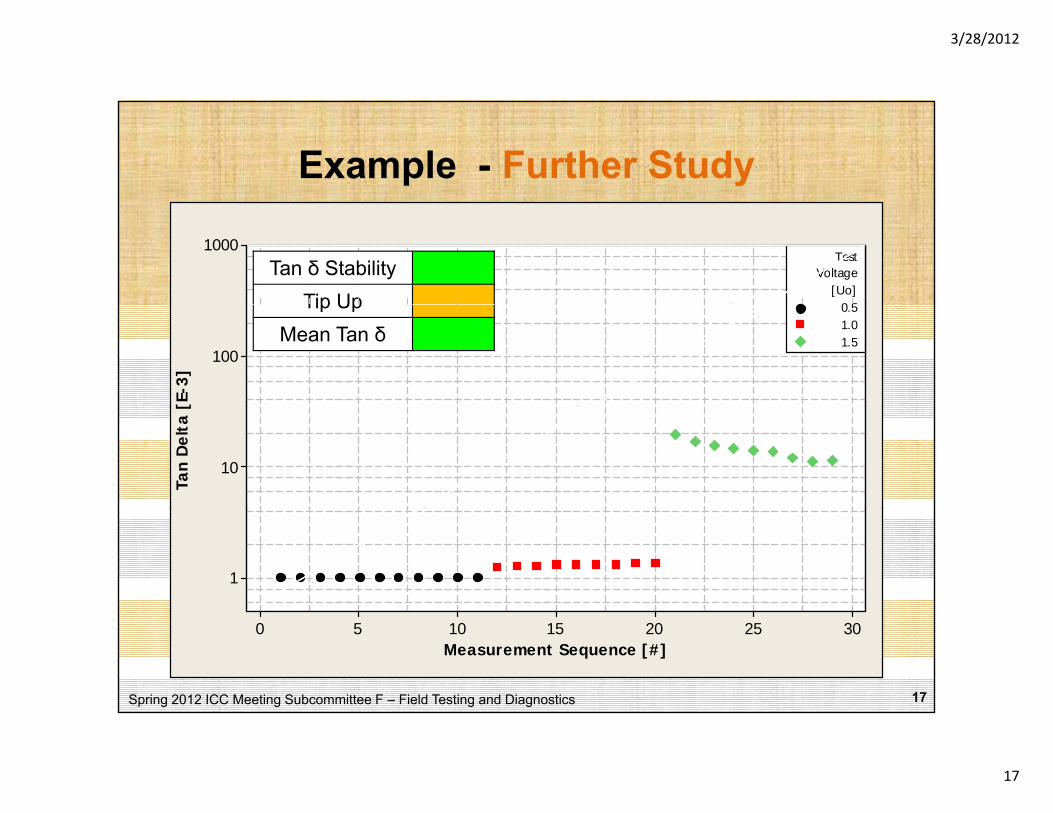
Features:• Stability @ 0.1 Hz & U0• Tip Up @ 0.1 Hz & between 1.5 U0 & 0.5 U0• Mean Tan δ @ 0.1 Hz & U0
Frequency[Hz]
0 10
Ramp Withstand
0.05
0.10
0.02
Spring 2012 ICC Meeting Subcommittee F – Field Testing and Diagnostics 9
Voltage[U0]
0.25 0.50 0.75 1.0 1.25 1.50 1.75 2.0 2.25 2.5
3/28/2012
10
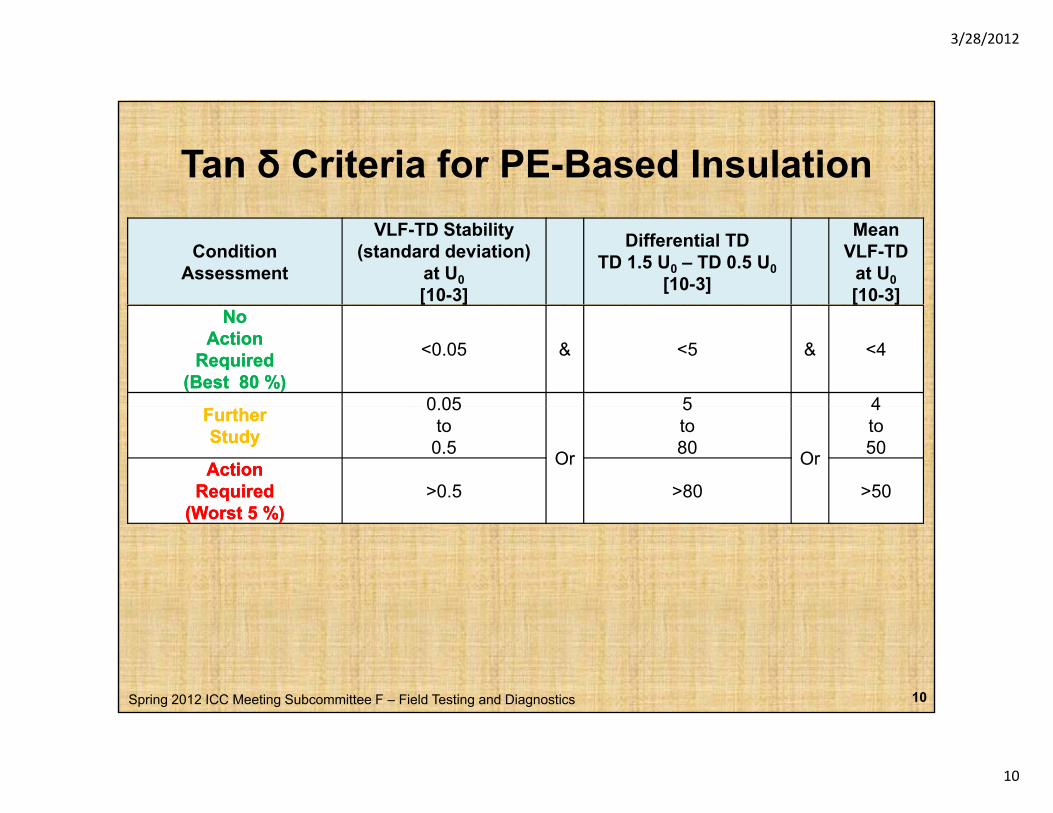
Tan δ Criteria for PE-Based Insulation
ConditionAssessment
VLF-TD Stability(standard deviation)
at U0[10-3]
Differential TDTD 1.5 U0 – TD 0.5 U0
[10-3]
MeanVLF-TD
at U0[10-3][ ] [ ]
No No ActionAction
RequiredRequired(Best 80 %)(Best 80 %)
<0.05 & <5 & <4
0 05 5 4FurtherFurtherStudyStudy
0.05 to
0.5 Or
5 to 80 Or
4 to 50
ActionActionRequiredRequired
(W t 5 %)(W t 5 %)>0.5 >80 >50
(Worst 5 %)(Worst 5 %)
Spring 2012 ICC Meeting Subcommittee F – Field Testing and Diagnostics 10
3/28/2012
11
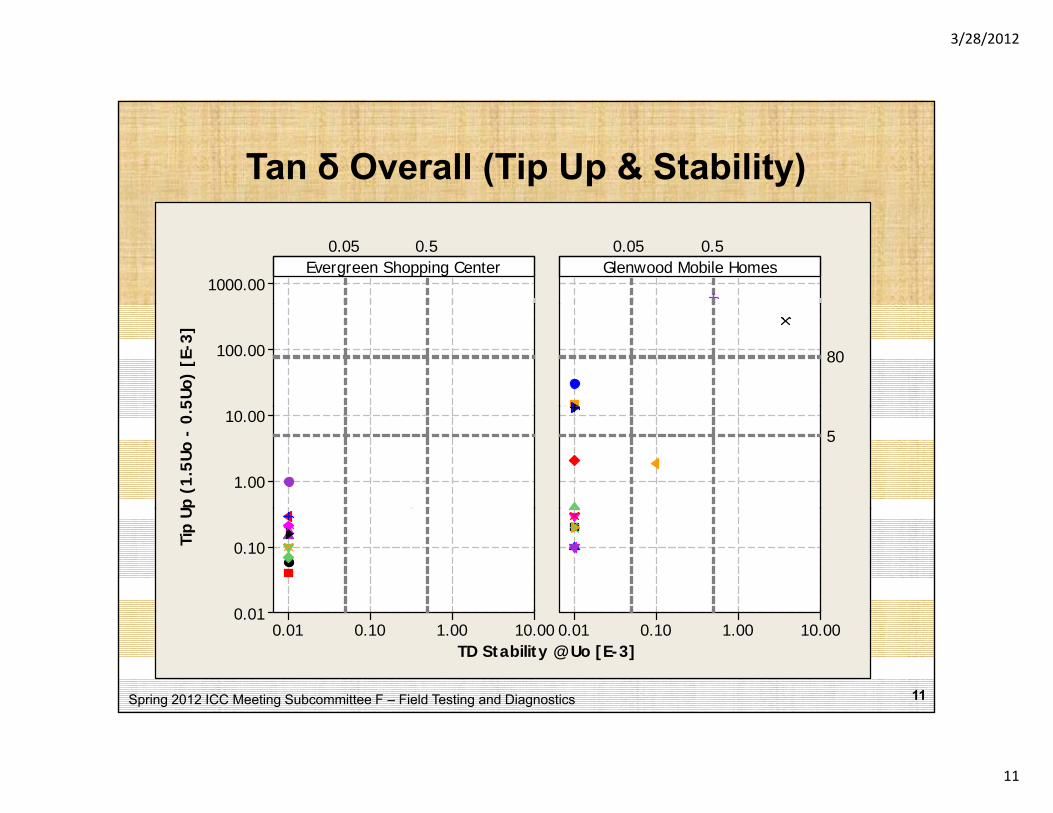
Tan δ Overall (Tip Up & Stability)
1000.00Evergreen Shopping Center
0.05 0.5Glenwood Mobile Homes0.05 0.5
100.00
5Uo)
[E-
3]
80
10.00
1.00
Up (
1.5U
o -
0.5
5
0.10
0 01
Tip
U
Spring 2012 ICC Meeting Subcommittee F – Field Testing and Diagnostics 11
10.001.000.100.010.01
10.001.000.100.01TD Stability @ Uo [E-3]
3/28/2012
12
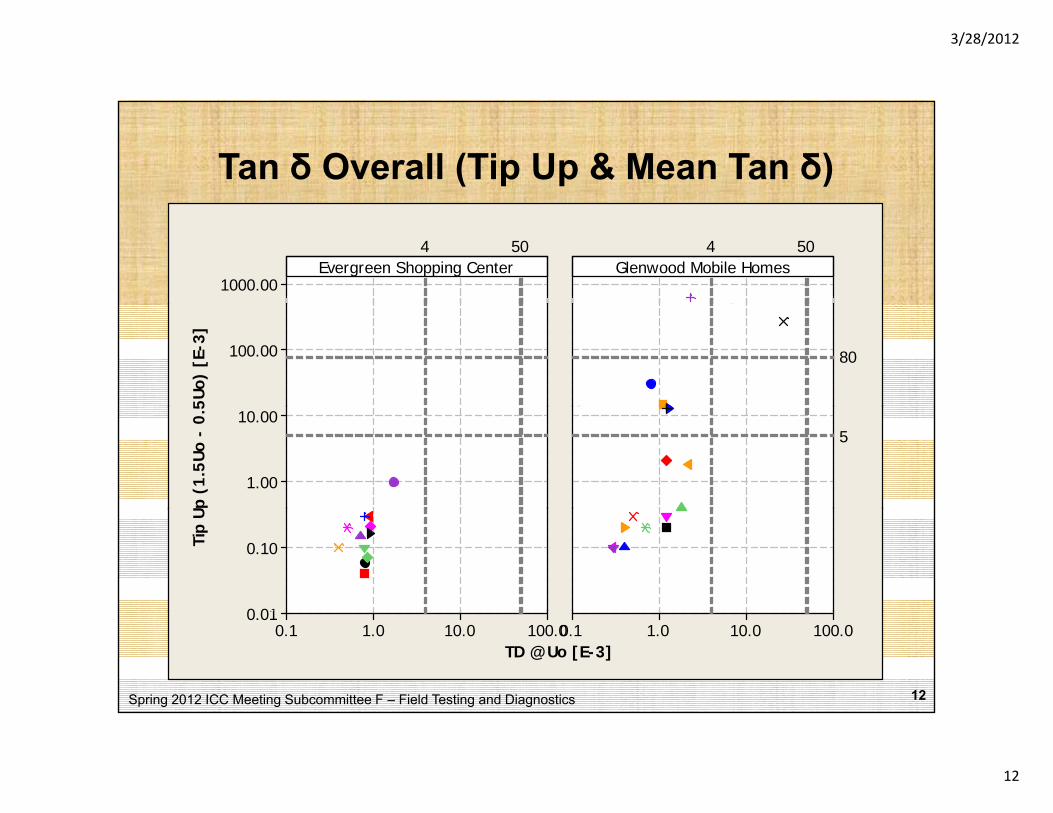
Tan δ Overall (Tip Up & Mean Tan δ)
1000.00Evergreen Shopping Center
4 50Glenwood Mobile Homes
4 50
100.00
5Uo)
[E-
3]
80
10.00
1.00
Up (
1.5U
o -
0.5
5
0.10
0 01
Tip
U
Spring 2012 ICC Meeting Subcommittee F – Field Testing and Diagnostics 12
100.010.01.00.10.01
100.010.01.00.1TD @ Uo [E-3]
3/28/2012
13
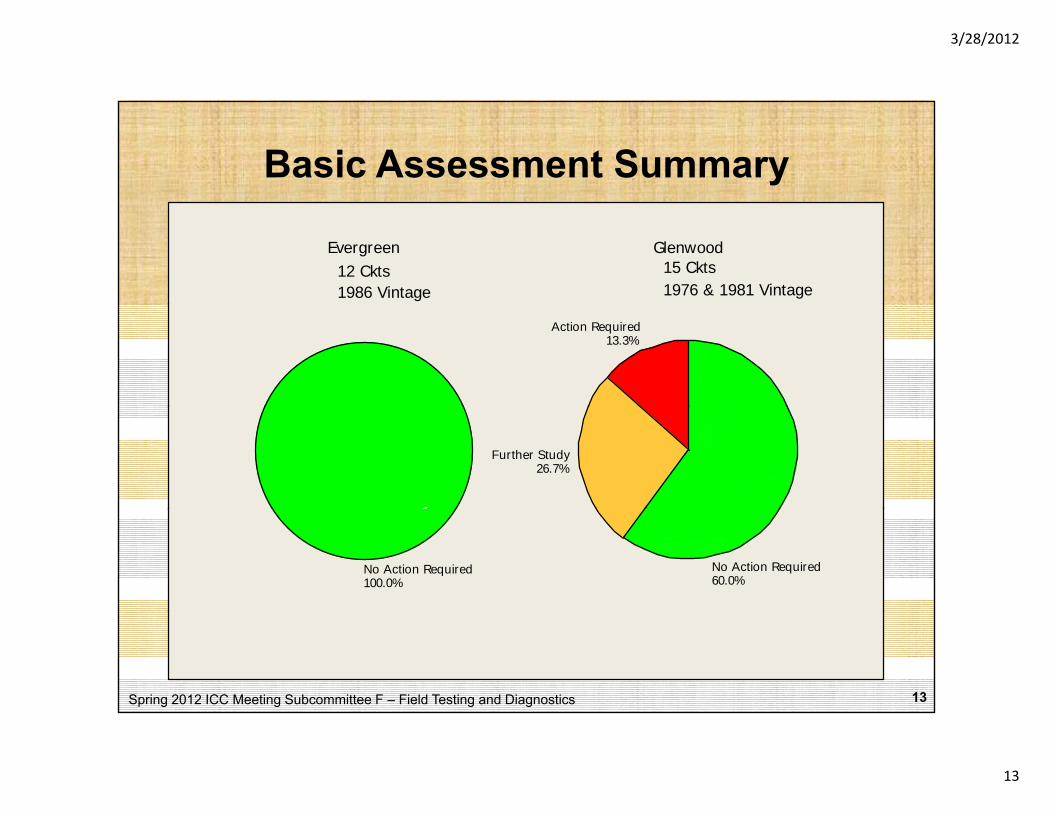
Basic Assessment Summary
Evergreen Glenwood
1986 Vintage12 Ckts
1976 & 1981 Vintage15 Ckts
Action Required13.3%
Further Study26.7%
No Action Required100.0%
No Action Required60.0%
Spring 2012 ICC Meeting Subcommittee F – Field Testing and Diagnostics 13
3/28/2012
14
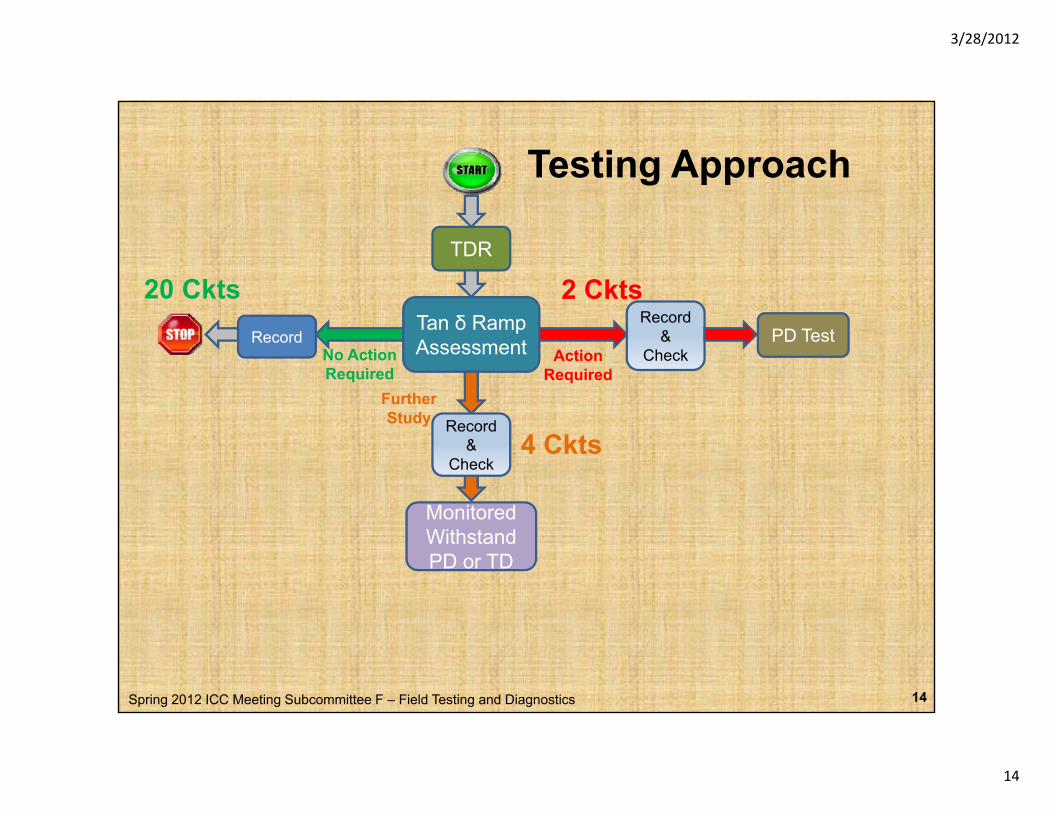
Testing Approach
TDR
2 Ckts20 Ckts
No Action Required
Action Required
Further
Tan δ RampAssessmentRecord
Record&
CheckPD Test
Study
Monitored
Record &
Check4 Ckts
Monitored WithstandPD or TD
Spring 2012 ICC Meeting Subcommittee F – Field Testing and Diagnostics 14
3/28/2012
15
Example - No Action Required
1000
0 5[Uo]
VoltageTest
Tan δ StabilityTip Up
100
[E-3
]
0.51.01.5
Tip UpMean Tan δ
10
Tan
Del
ta [
1
Spring 2012 ICC Meeting Subcommittee F – Field Testing and Diagnostics 15
302520151050Measurement Sequence [#]
3/28/2012
16
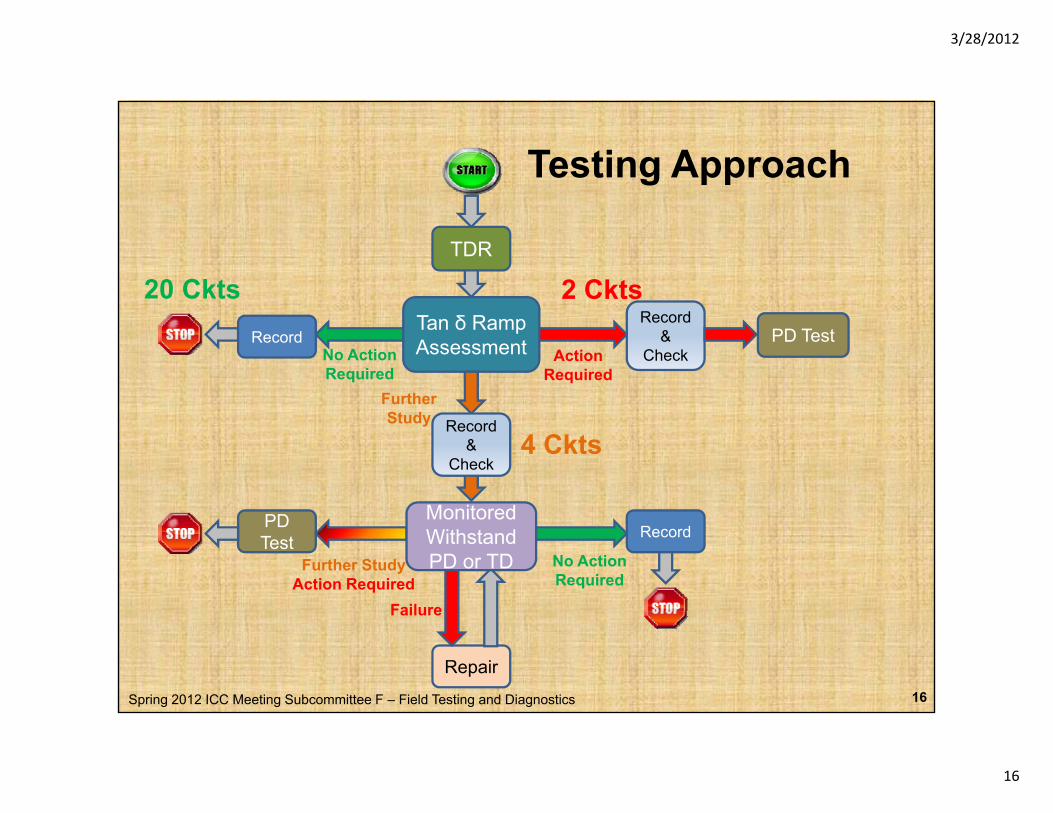
Testing Approach
TDR
2 Ckts20 Ckts
No Action Required
Action Required
Further
Tan δ RampAssessmentRecord
Record&
CheckPD Test
Study
Monitored
Record &
Check4 Ckts
Record
Further StudyAction Required
PD Test
No Action Required
Failure
Monitored WithstandPD or TD
Spring 2012 ICC Meeting Subcommittee F – Field Testing and Diagnostics 16
Repair
Failure
3/28/2012
17
Example - Further Study
1000
0 5[Uo]
VoltageTest
Tan δ StabilityTip Up
100
[E-3
]
0.51.01.5
Tip UpMean Tan δ
10
Tan
Del
ta [
1
Spring 2012 ICC Meeting Subcommittee F – Field Testing and Diagnostics 17
302520151050Measurement Sequence [#]
3/28/2012
18
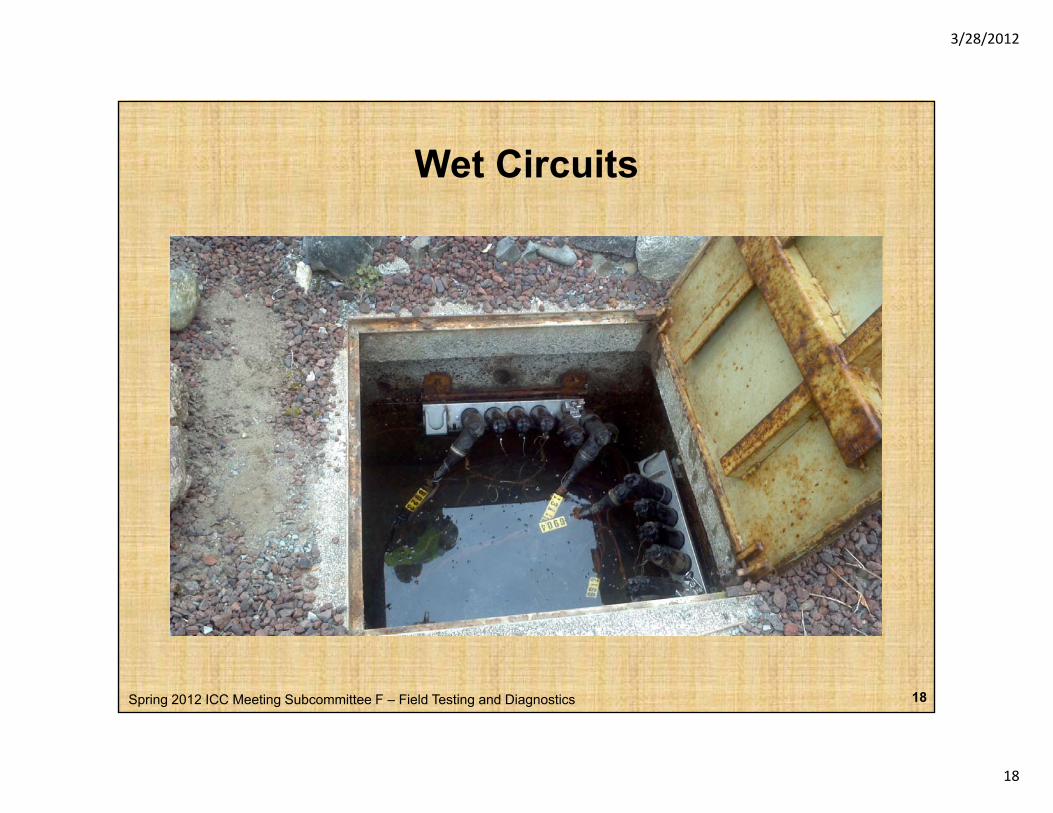
Wet Circuits
Spring 2012 ICC Meeting Subcommittee F – Field Testing and Diagnostics 18
3/28/2012
19
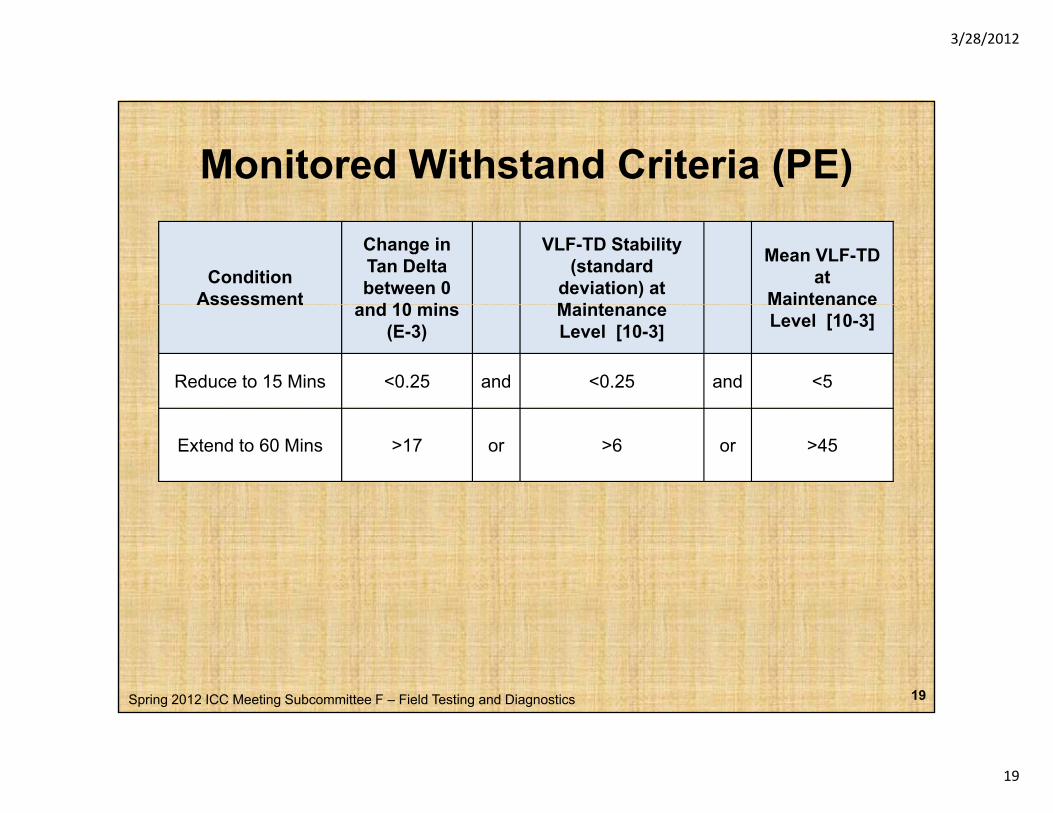
Monitored Withstand Criteria (PE)
ConditionAssessment
Change in Tan Delta between 0
d 10 i
VLF-TD Stability (standard
deviation) at M i t
Mean VLF-TD at
MaintenanceAssessment and 10 mins(E-3)
Maintenance Level [10-3]
Maintenance Level [10-3]
Reduce to 15 Mins <0.25 and <0.25 and <5
Extend to 60 Mins >17 or >6 or >45
Spring 2012 ICC Meeting Subcommittee F – Field Testing and Diagnostics 19
3/28/2012
20
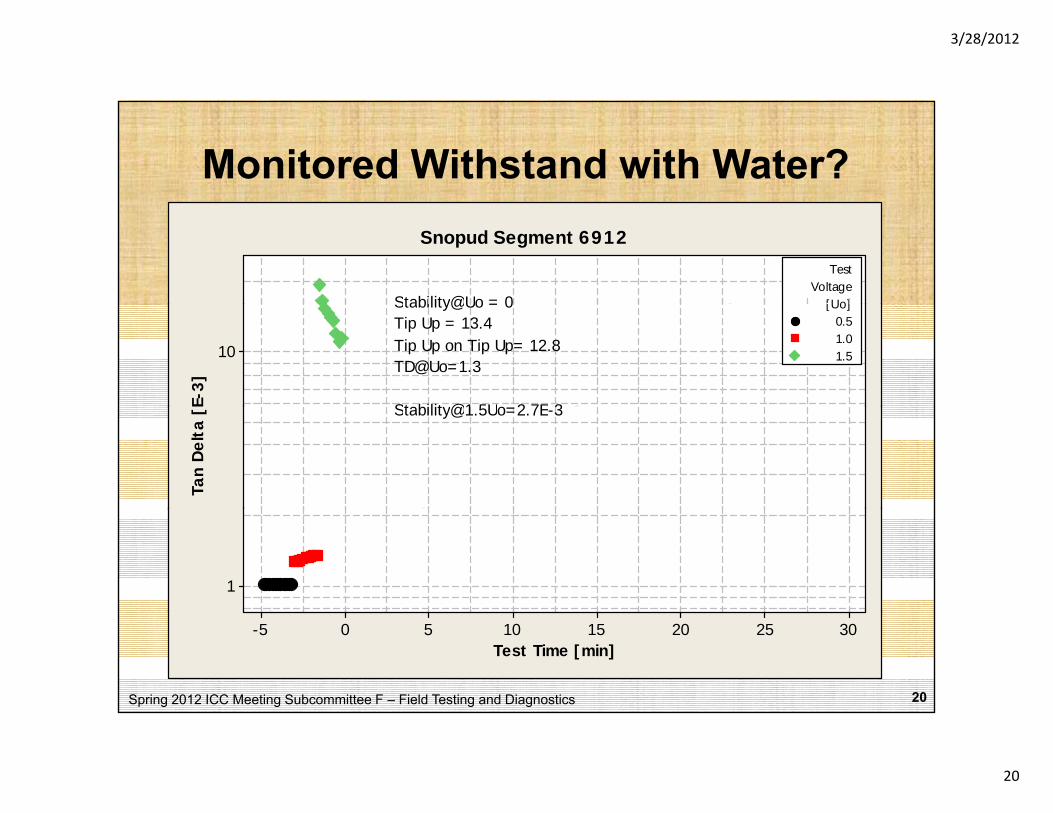
Monitored Withstand with Water?
[Uo]Voltage
Test
Stability@Uo = 0
Snopud Segment 6912
10
E-3]
0.51.01.5
[Uo]
Stability@1 5Uo 2 7E 3
TD@Uo=1.3Tip Up on Tip Up= 12.8Tip Up = 13.4Stability@Uo = 0
Tan
Del
ta [ [email protected]=2.7E-3
1
Spring 2012 ICC Meeting Subcommittee F – Field Testing and Diagnostics 20
302520151050-5Test Time [min]
3/28/2012
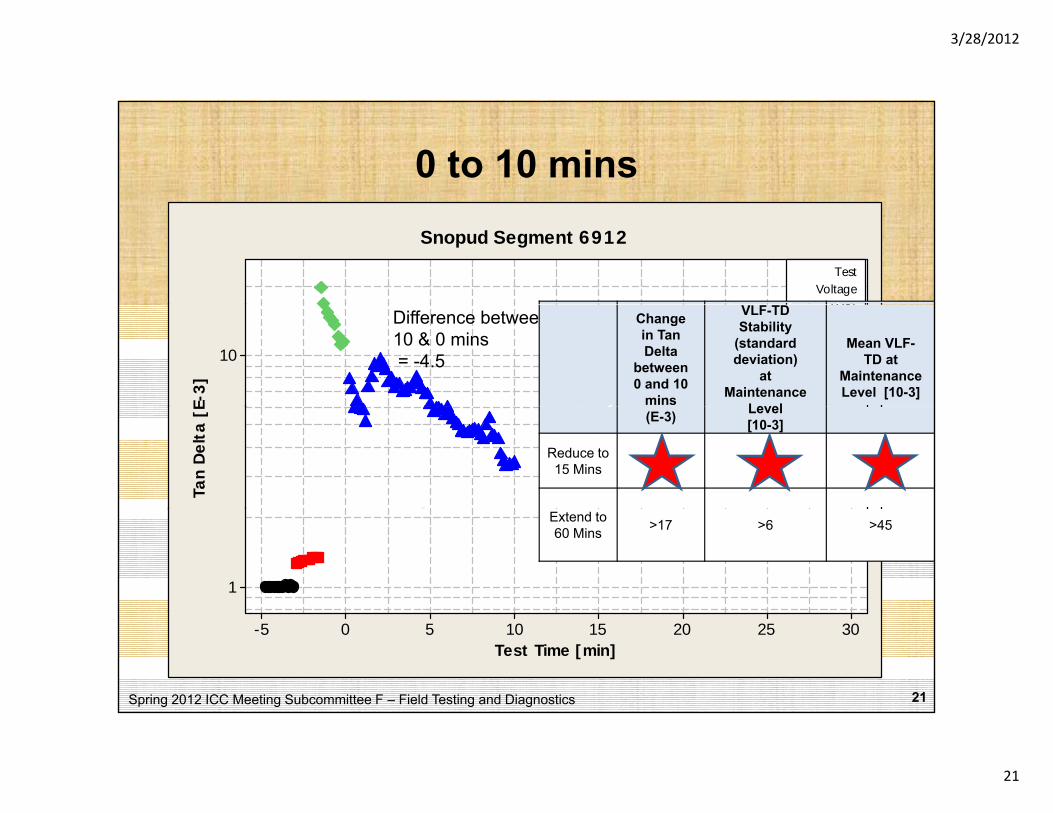
21
0 to 10 mins
[Uo]Voltage
Test
Snopud Segment 6912
10
E-3]
0.51.01.52.2
[Uo]Difference between 10 & 0 mins= -4.5
Change in Tan Delta
between 0 and 10
mins
VLF-TD Stability
(standard deviation)
at Maintenance
Level
Mean VLF-TD at
Maintenance Level [10-3]
Tan
Del
ta [
E
(E-3) Level[10-3]
Reduce to15 Mins <0.25 <0.25 <5
1
Extend to60 Mins >17 >6 >45
Spring 2012 ICC Meeting Subcommittee F – Field Testing and Diagnostics
302520151050-5Test Time [min]
21
3/28/2012
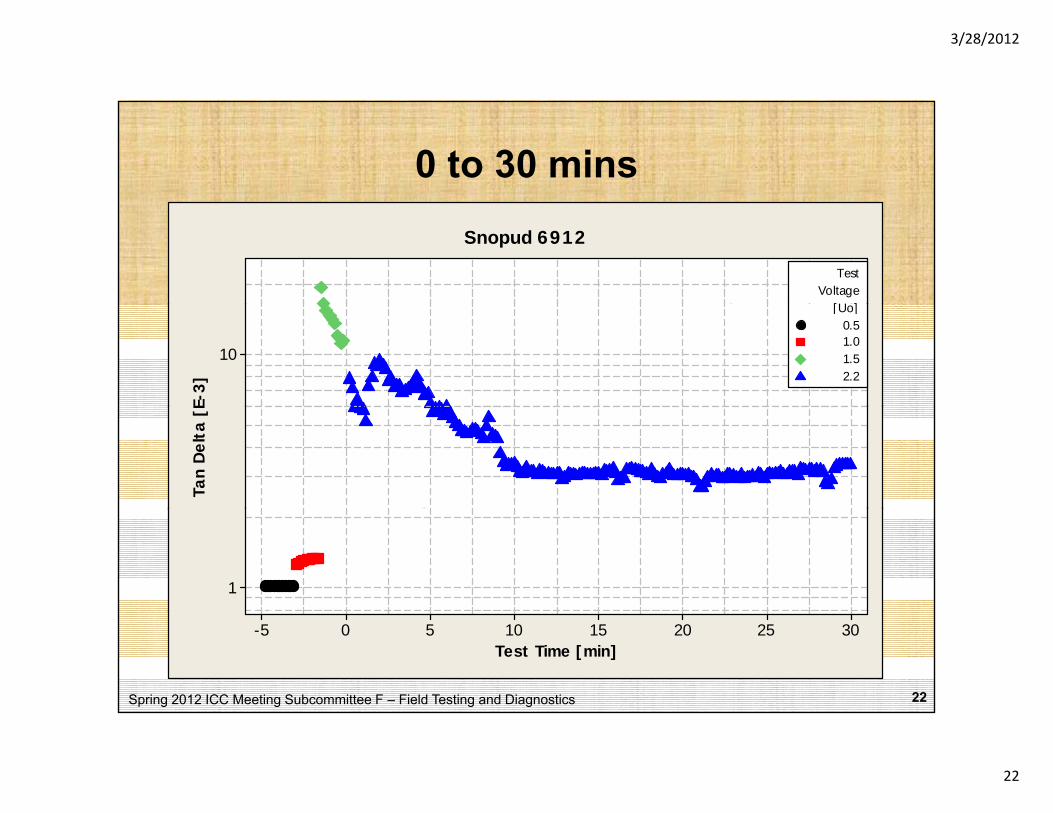
22
0 to 30 mins
[U ]Voltage
Test
Snopud 6912
10
E-3]
0.51.01.52.2
[Uo]
Tan
Del
ta [
E
1
Spring 2012 ICC Meeting Subcommittee F – Field Testing and Diagnostics 22
302520151050-5Test Time [min]
3/28/2012
23
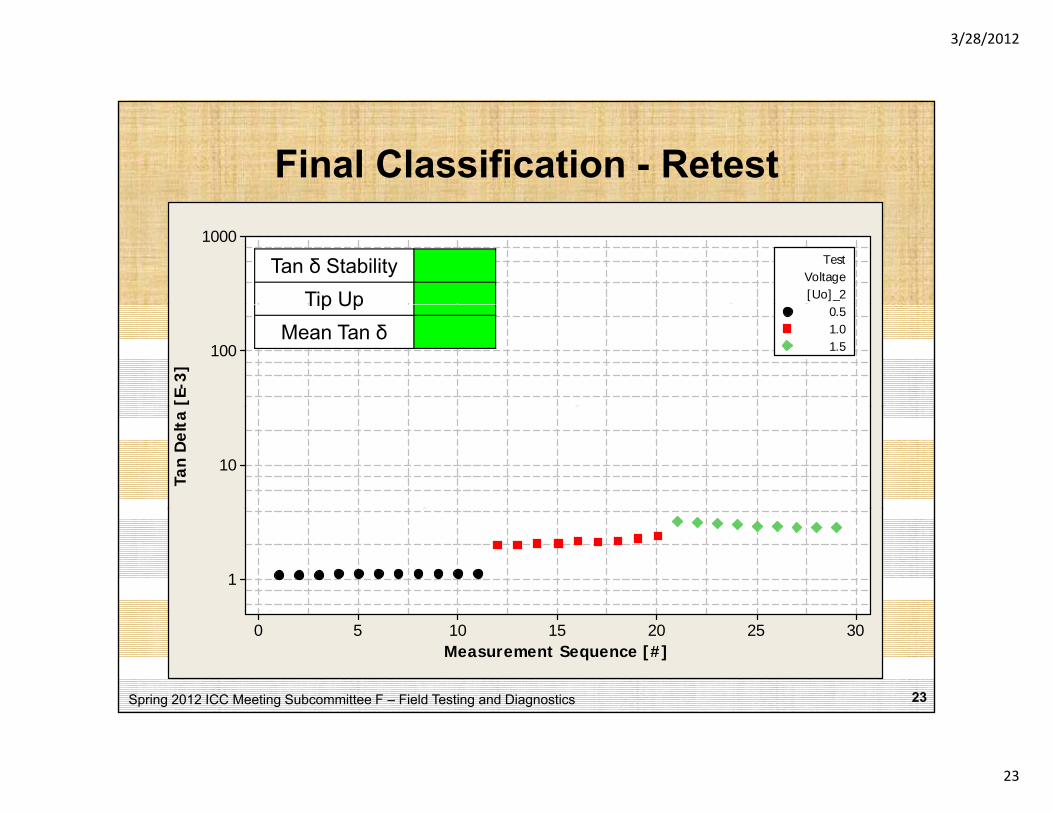
Final Classification - Retest1000
[Uo]_2Voltage
TestTan δ StabilityTip Up
100
[E-3
]
0.51.01.5
Tip UpMean Tan δ
10
Tan
Del
ta
1
Spring 2012 ICC Meeting Subcommittee F – Field Testing and Diagnostics 23
302520151050Measurement Sequence [#]
3/28/2012
24
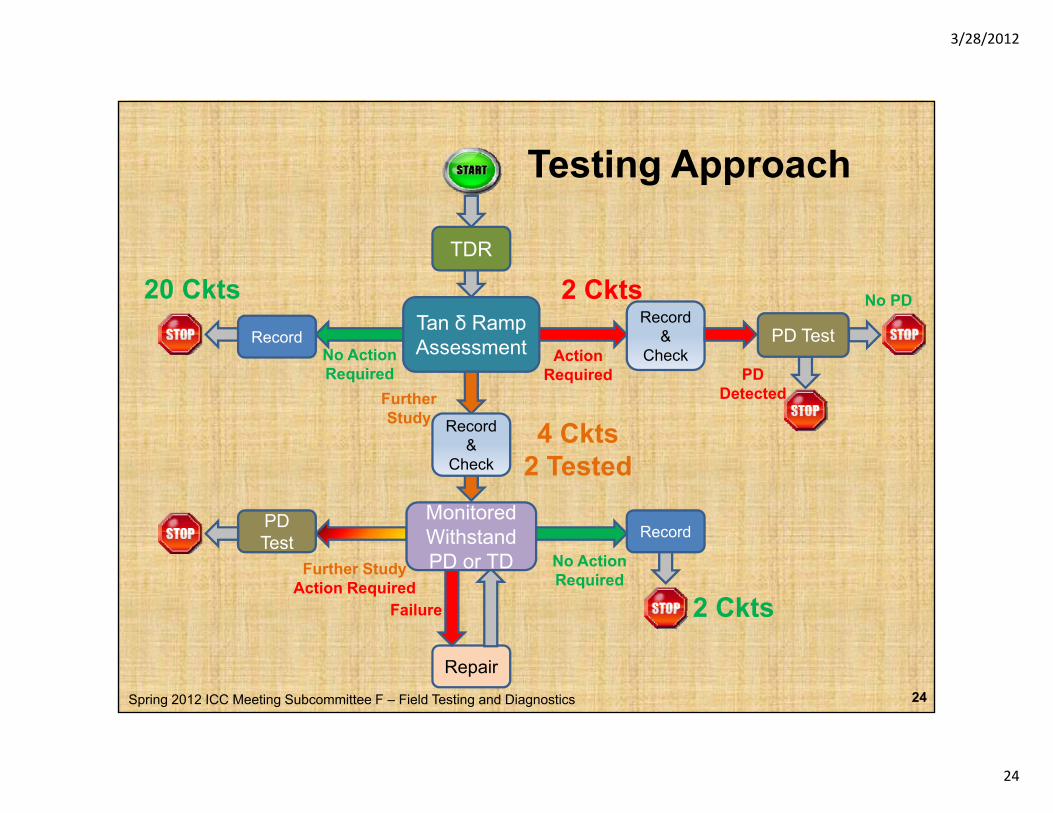
Testing Approach
TDR
2 Ckts20 Ckts No PD
No Action Required
Action Required
Further
Tan δ RampAssessmentRecord
Record&
CheckPD Test
PD Detected
No PD
Study
Monitored
Record &
Check
4 Ckts2 Tested
Record
Further StudyAction Required
PD Test
No Action Required
Failure
Monitored WithstandPD or TD
2 Ckts
Spring 2012 ICC Meeting Subcommittee F – Field Testing and Diagnostics 24
Repair
Failure 2 Ckts
3/28/2012
25
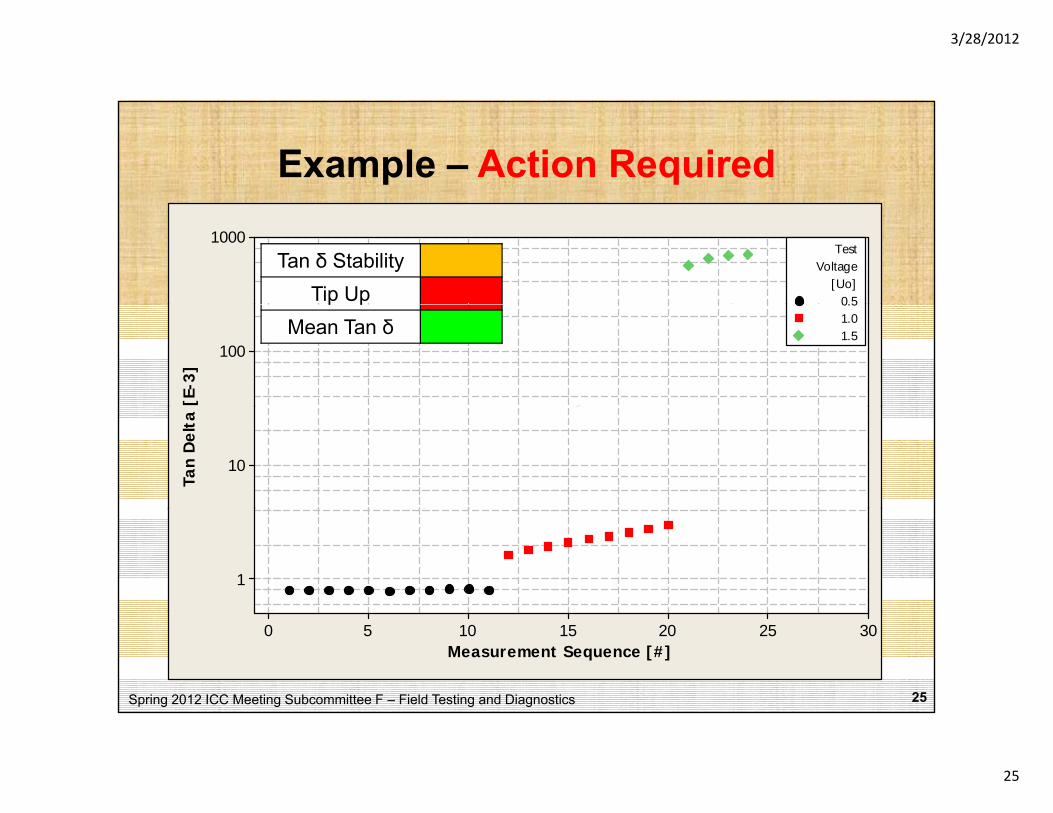
Example – Action Required1000
0.5[Uo]
VoltageTest
Tan δ StabilityTip Up
100
[E-3
]
0.51.01.5
p pMean Tan δ
10
Tan
Del
ta
1
Spring 2012 ICC Meeting Subcommittee F – Field Testing and Diagnostics
302520151050Measurement Sequence [#]
25
3/28/2012
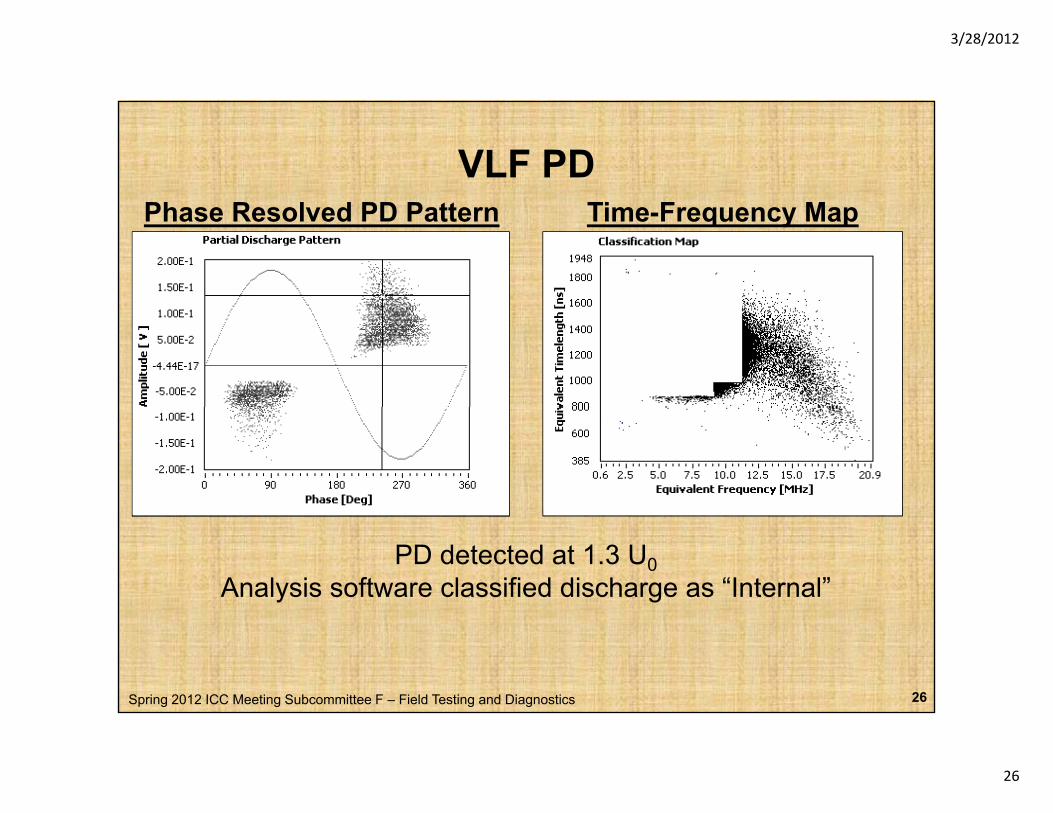
26
VLF PDPh R l d PD P tt Ti F MPhase Resolved PD Pattern Time-Frequency Map
PD detected at 1.3 U0Analysis software classified discharge as “Internal”
Spring 2012 ICC Meeting Subcommittee F – Field Testing and Diagnostics 26

3/28/2012
27
Testing Approach
TDR
20 Ckts 2 Ckts No PD1 Ckt
No Action Required
Action Required
Further
Tan δ RampAssessmentRecord
Record&
CheckPD Test
PD Detected
No PD
1 CktStudy
Monitored
Record &
Check
4 Ckts2 Tested
1 Ckt
Record
Further StudyAction Required
PD Test
No Action Required
Failure
Monitored WithstandPD or TD
2 Ckts
Spring 2012 ICC Meeting Subcommittee F – Field Testing and Diagnostics 27
Repair
Failure 2 Ckts
3/28/2012
28
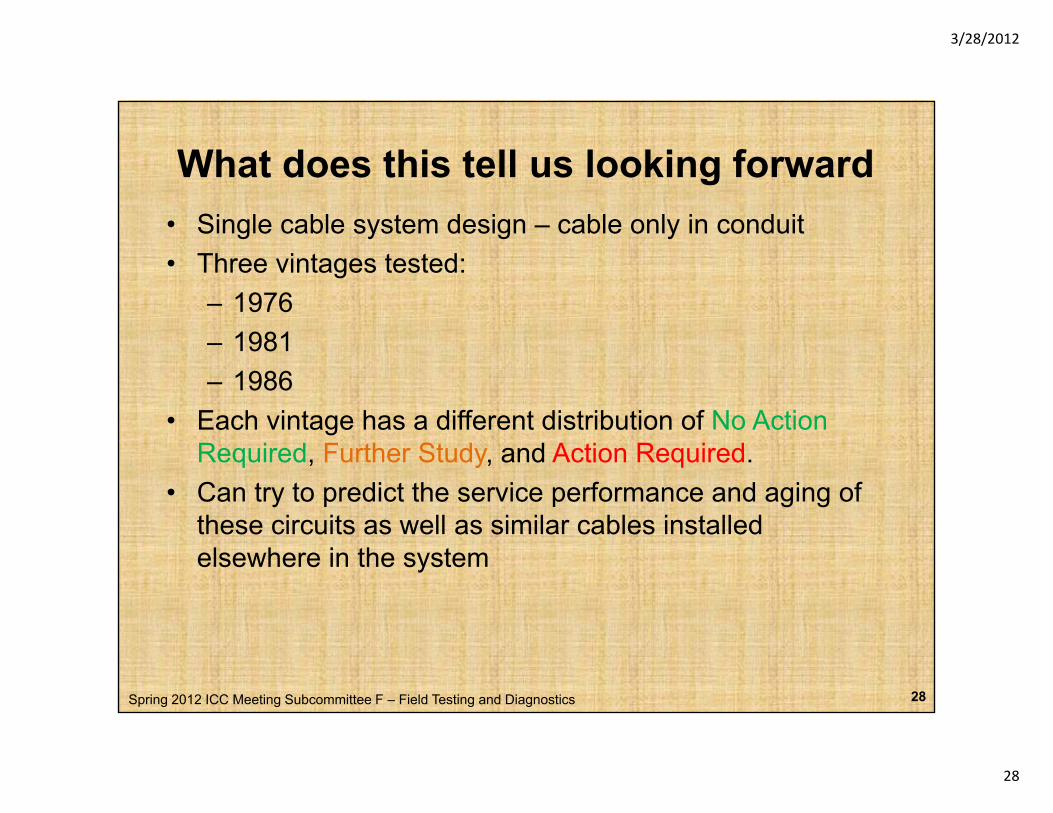
What does this tell us looking forward• Single cable system design – cable only in conduit• Three vintages tested:
– 1976– 1976– 1981– 1986
• Each vintage has a different distribution of No Action Required, Further Study, and Action Required.
• Can try to predict the service performance and aging of these circuits as well as similar cables installed elsewhere in the system
Spring 2012 ICC Meeting Subcommittee F – Field Testing and Diagnostics 28
3/28/2012
29
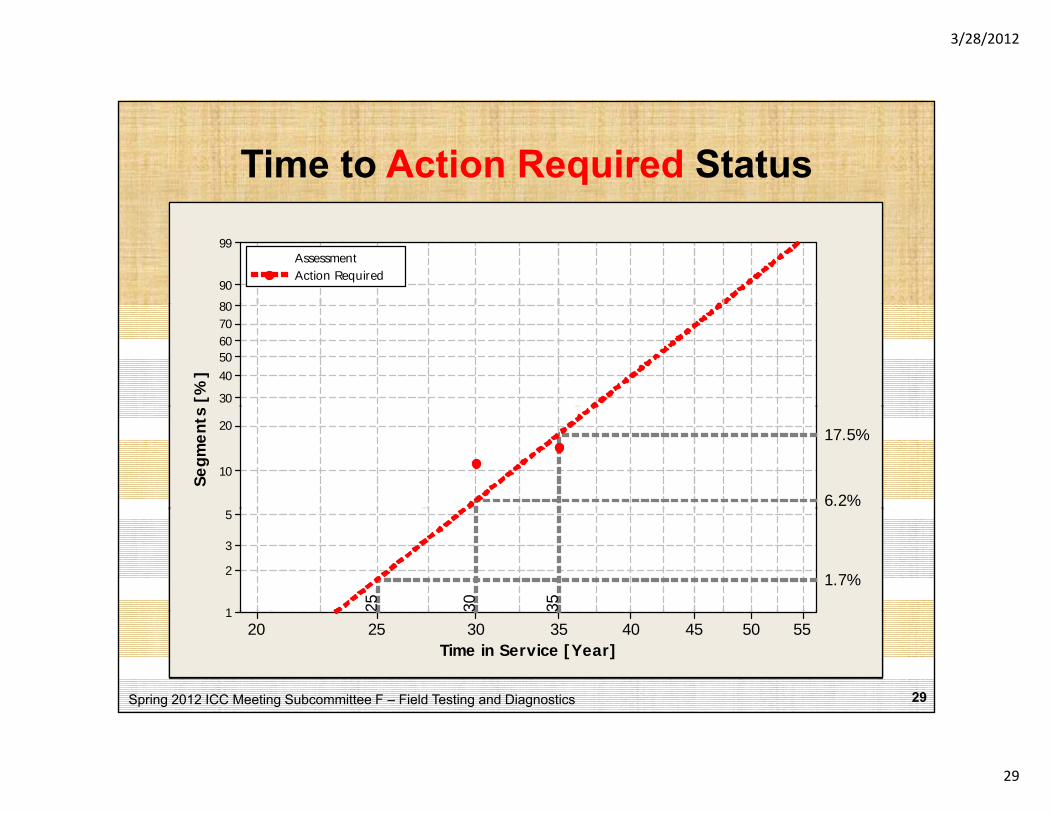
Time to Action Required Status
99
90
80
Action RequiredAssessment
99
90
80
Action RequiredAssessment
99
90
80
Action RequiredAssessment
8070605040
30[%]
8070605040
30[%]
8070605040
30[%]
20
10
Segm
ents
20
10
Segm
ents
20
10
Segm
ents
6.2%
17.5%
5
3
2
1
5
3
2
1
5
3
2
1
1.7%
25 30 35
Spring 2012 ICC Meeting Subcommittee F – Field Testing and Diagnostics
55504540353025201
Time in Service [Year]5550454035302520
1
Time in Service [Year]
29
55504540353025201
Time in Service [Year]
2 3 3
3/28/2012
30
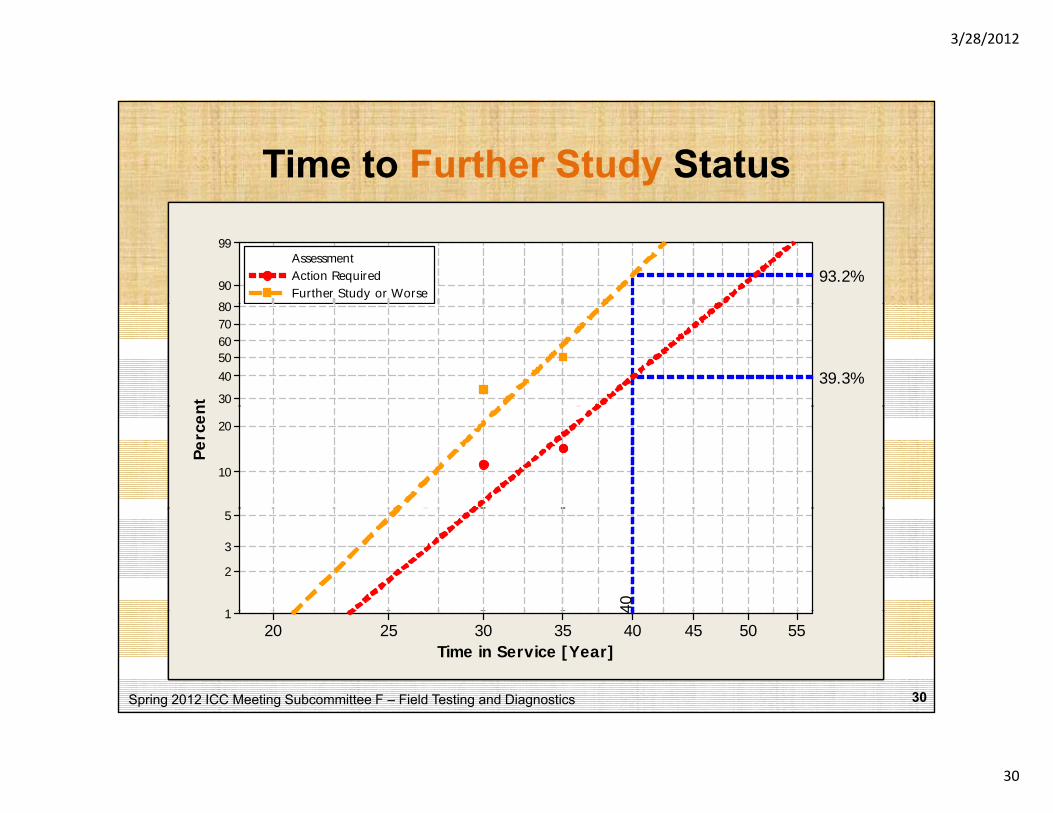
Time to Further Study Status
99
90
80
Action RequiredFurther Study
Assessment99
90
80
Action RequiredFurther Study or Worse
Assessment99
90
80
Action RequiredFurther Study or Worse
Assessment99
90
80
Action RequiredFurther Study or Worse
Assessment99
90
80
93.2%Action RequiredFurther Study or Worse
Assessment
8070605040
30
nt
8070605040
30
nt
8070605040
30
nt
8070605040
30
nt
57.7%
8070605040
30
nt
39.3%
20
10
Perc
en 20
10
Perc
en 20
10
Perc
en
6.2%
20.6%20
10
Perc
en
6.2%
20.6%17.5%
20
10
Perc
en
5
3
2
1
5
3
2
1
5
3
2
1 30
5
3
2
1 25
1.7%
4.8%
30 35
5
3
2
1 40
Spring 2012 ICC Meeting Subcommittee F – Field Testing and Diagnostics
55504540353025201
Time in Service [Year]
30
55504540353025201
Time in Service [Year]5550454035302520
1
Time in Service [Year]
3
55504540353025201
Time in Service [Year]
2 3 3
55504540353025201
Time in Service [Year]
4
3/28/2012
31
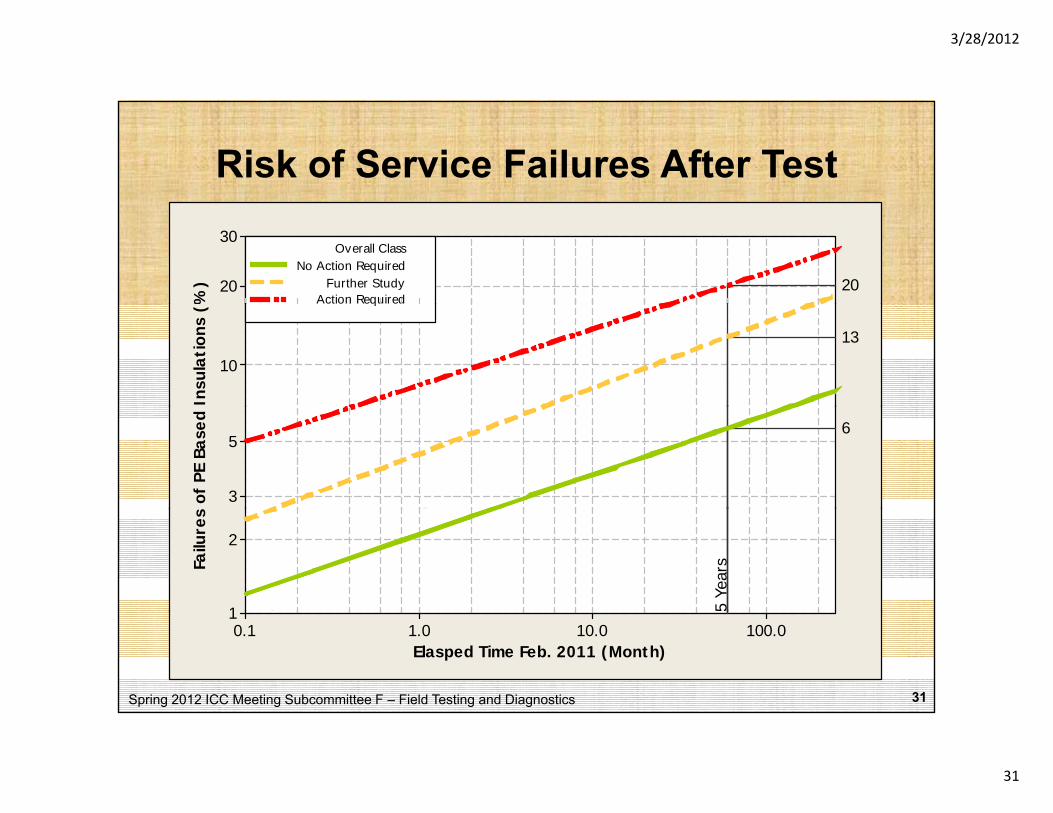
Risk of Service Failures After Test30
20
%) 20
No Action RequiredFurther Study
Action Required
Overall Class
10
Insu
lati
ons
(
13
q
5
3 of
PE B
ased
6
2
1
Failu
res
5 Ye
ars
Spring 2012 ICC Meeting Subcommittee F – Field Testing and Diagnostics 31
100.010.01.00.11
Elasped Time Feb. 2011 (Month)
3/28/2012
32
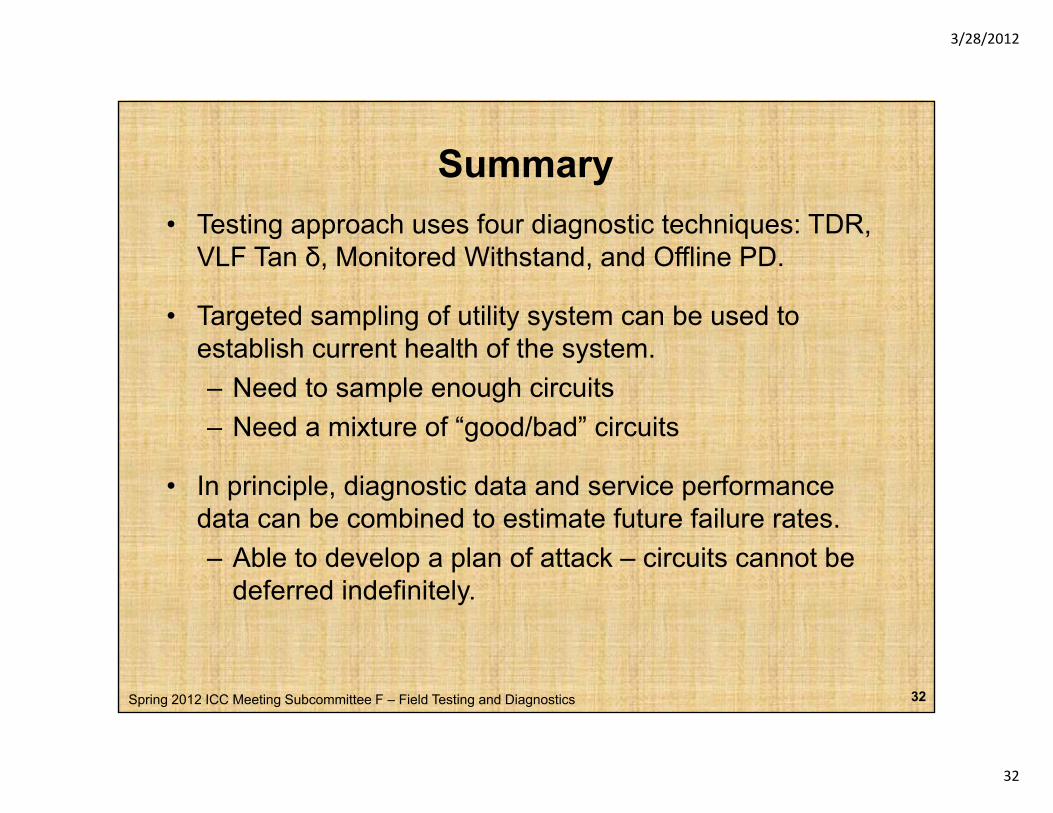
Summary• Testing approach uses four diagnostic techniques: TDR,
VLF Tan δ, Monitored Withstand, and Offline PD.
• Targeted sampling of utility system can be used to establish current health of the system. – Need to sample enough circuits– Need a mixture of “good/bad” circuits
• In principle, diagnostic data and service performance d t b bi d t ti t f t f il tdata can be combined to estimate future failure rates.– Able to develop a plan of attack – circuits cannot be
deferred indefinitely.
Spring 2012 ICC Meeting Subcommittee F – Field Testing and Diagnostics 32
3/28/2012
33
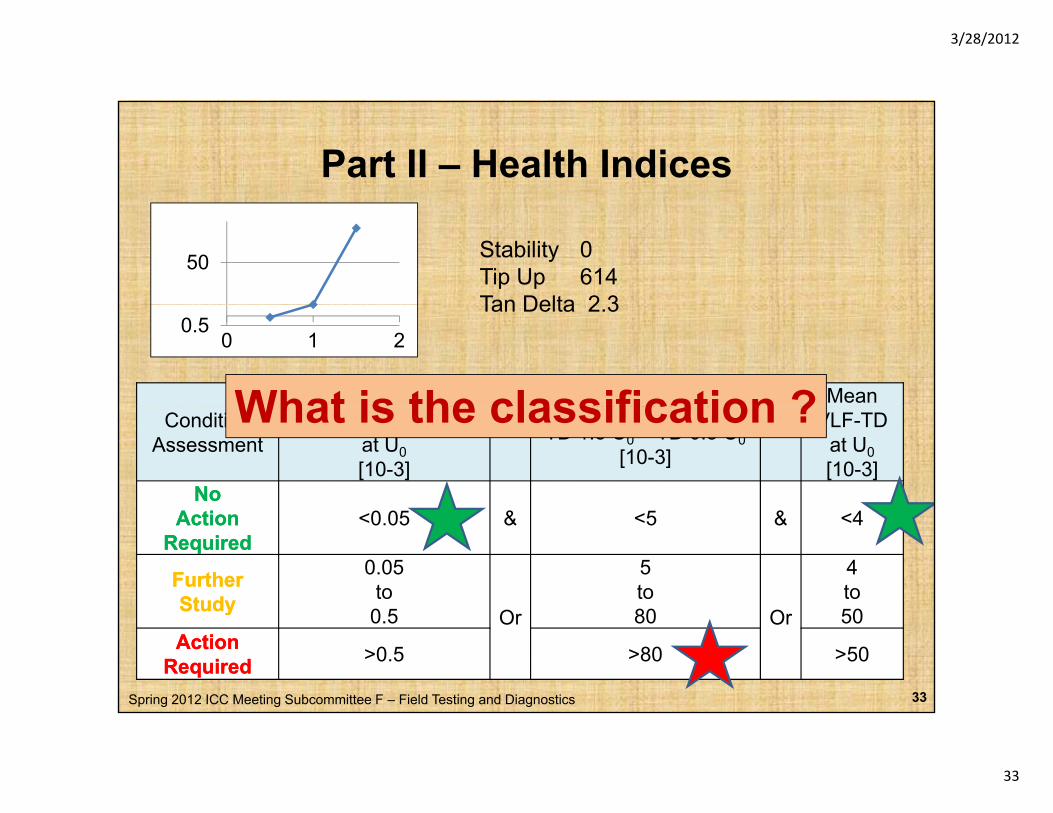
Part II – Health Indices
50 Stability 0Tip Up 614Tan Delta 2 3
VLF-TD Stability Differential TD Mean
0.50 1 2
Tan Delta 2.3
What is the classification ?ConditionAssessment
y(standard deviation)
at U0[10-3]
Differential TDTD 1.5 U0 – TD 0.5 U0
[10-3]
VLF-TDat U0[10-3]
No No
What is the classification ?
ActionActionRequiredRequired
<0.05 & <5 & <4
FurtherFurtherStudyStudy
0.05 to 0 5 O
5 to 80 O
4 to 50
Spring 2012 ICC Meeting Subcommittee F – Field Testing and Diagnostics
StudyStudy 0.5 Or 80 Or 50ActionAction
RequiredRequired >0.5 >80 >50
33