Embed Size (px)
Citation preview
Miami-Dade County Public SchoolsDivision of Academics
RequiredESSENTIAL
Laboratory Activities
For the Middle SchoolM/J Comprehensive Science 2
REVISED June 20141

THE SCHOOL BOARD OF MIAMI-DADE COUNTY, FLORIDA
Ms. Perla Tabares Hantman, ChairDr. Lawrence S. Feldman, Vice-Chair
Dr. Dorothy Bendross-MindingallMs. Susie V. CastilloMr. Carlos L. Curbelo
Dr. Wilbert “Tee” HollowayDr. Martin KarpDr. Marta Pérez
Ms. Raquel A. Regalado
Ms. Krisna MaddyStudent Advisor
Mr. Alberto M. CarvalhoSuperintendent of Schools
Ms. Marie IzquierdoChief Academic Officer
Office of Academics and Transformation
Dr. Maria P. de ArmasAssistant Superintendent
Division of Academics, Accountability, and School Improvement
Mr. Cristian CarranzaAdministrative Director
Division of Academics, Accountability & School Improvement
Dr. Ava D. RosalesExecutive Director
Department of Mathematics and Science
2
Table of ContentsIntroduction....................................................................................................................................4
Materials List..................................................................................................................................5
Next Generation Sunshine State Standards..................................................................................9
Lab Roles and Their Descriptions................................................................................................11
Laboratory Safety and Contract...................................................................................................12
Pre-Lab Safety Worksheet and Approval Form...........................................................................13
Parts of a Lab Report...................................................................................................................14
Experimental Design Diagram.....................................................................................................16
Engineering Design Process.......................................................................................................18
Conclusion Writing.......................................................................................................................19
Required Essential Lab ActivitiesTopic:I. The Great Tomato Race …………………………………………………………………………...20
II. Temperature Changes Everything w/ Differentiated Instruction Inquiry………………………23
II. Chemical Change in a Bag w/ Differentiated Instruction Inquiry……………………………… 27
III. Stations: Energy Transformations w/ Differentiated Instruction Inquiry................................33
IV. Solar Energy vs. Color w/ Differentiated Instruction Inquiry ..............................................39
V. Wave Speed w/ Differentiated Instruction Inquiry & Literature Connection: Rogue Waves...44
VI. Seven Earth Layer Density Column w/ Literature Connection: Archimedes’ Crown.............55
VII. Density Driven Fluid Flow w/ Differentiated Instruction Inquiry.............................................61
VII. Crayon Rock Cycle................................................................................................................67
IX. Fossils and Law of Superposition w/ Differentiated Instruction Inquiry.................................72
X. Becoming Whales: Fossil Records w/ Differentiated Instruction Inquiry...............................80
X. Moth Catcher w/ Differentiated Instruction Inquiry................................................................91
XI. Bird Beak Adaptations w/ Differentiated Instruction Inquiry..................................................96
XII. Everglades Biodiversity......................................................................................................102
XIII. Cleaning Up an Oil Spill....................................................................................................109
XIV. GMO’s Offspring................................................................................................................115
XV. Perfect Parents = Perfect Babies........................................................................................120
XV. Incomplete Dominance Lab (Advanced).............................................................................115
Additional Lab ActivitiesXII. Energy Pipeline w/ Differentiated Instruction Inquiry..........................................................130
XIII. Water and Air Acidification w/ Differentiated Instruction Inquiry........................................135
XIV. Human Variations..............................................................................................................144
3

Introduction
The purpose of this packet is to provide the M/J Comprehensive Science 2 teachers with a list of basic laboratory and hands-on activities that students should experience in class. Each activity is aligned with the M/J Comprehensive Science 2 Curriculum Guide and the Next Generation Sunshine State Standards (NGSSS). Emphasis should be placed on those activities that are aligned to the Annually Assessed benchmarks, which are consistently assessed in the Florida Comprehensive Assessment Test 2.0 (FCAT 2.0).
All hands-on activities were designed to cover most concepts found in M/J Comprehensive Science 2. In some cases, more than one lab was included to cover a specific benchmark. In most cases, the activities were designed as simple as possible without the use of advanced technological equipment to make it possible for all teachers to use these activities. All activities and supplements (i.e., Parts of a Lab Report) should be modified, if necessary, to fit the needs of an individual class and/or student ability.
This document is intended to be used by science departments in M-DCPS so that all science teachers can work together, plan together, and rotate lab materials among classrooms. Through this practice, all students and teachers will have the same opportunities to participate in these experiences and promote discourse among learners, forming the building blocks of authentic learning communities.
Acknowledgement:
M-DCPS Department of Mathematics and Science would like to acknowledge the efforts of the teachers who worked arduously and diligently on the preparation of this document.
4
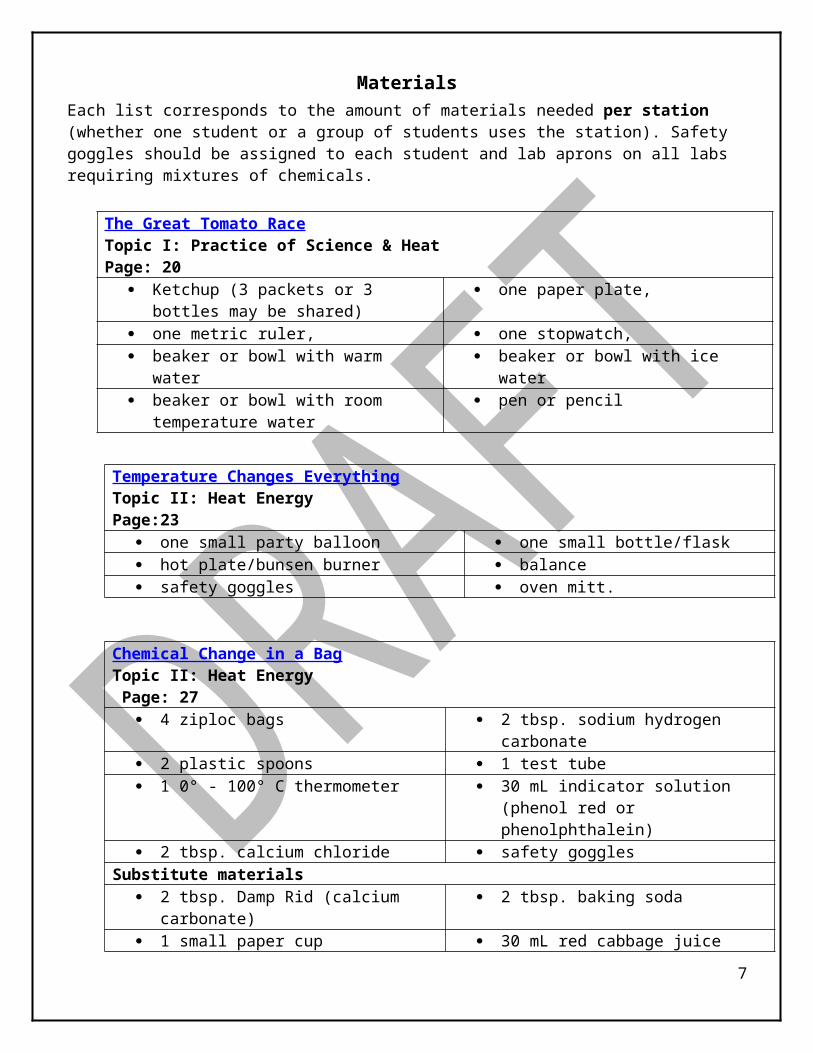
MaterialsEach list corresponds to the amount of materials needed per station (whether one student or a group of students uses the station). Safety goggles should be assigned to each student and lab aprons on all labs requiring mixtures of chemicals.
The Great Tomato RaceTopic I: Practice of Science & Heat Page: 20
Ketchup (3 packets or 3 bottles may be shared)
one paper plate,
one metric ruler, one stopwatch, beaker or bowl with warm water beaker or bowl with ice water beaker or bowl with room temperature
water pen or pencil
Temperature Changes Everything Topic II: Heat Energy Page:23
one small party balloon one small bottle/flask hot plate/bunsen burner balance safety goggles oven mitt.
Chemical Change in a BagTopic II: Heat Energy Page: 27
4 ziploc bags 2 tbsp. sodium hydrogen carbonate 2 plastic spoons 1 test tube 1 0° - 100° C thermometer 30 mL indicator solution (phenol red
or phenolphthalein) 2 tbsp. calcium chloride safety goggles
Substitute materials 2 tbsp. Damp Rid (calcium carbonate) 2 tbsp. baking soda 1 small paper cup 30 mL red cabbage juice
Materials for teacher’s demonstration: Matches and wooden splint
Stations: Energy TransformationsTopic III: Conservation of Energy & Energy TransformationsPage:33
Wire Wax Batteries Small Pan Battery Holders Rubber Ball Light bulb sockets Ruler Small light bulbs Mini Fans Solar cells Hot plate
Materials (Cont.)
5
Solar Energy vs. Color Topic IV:Electromagnetic Spectrum Page:39
pieces of construction paper (recommended size 12cm by 16cm).
Construction paper : suggested colors- white, black, gray, brown
stop watch Celsius thermometers safety goggles tape
Wave Speed Topic V Properties of Waves Page: 44
2-Liter clear plastic bottles with cap (remove label)
stop watch
Grease pencil/permanent marker Metric ruler Water Oil Eye protection
Seven Earth Layer Density Column Topic VI Layers of EarthPage:55
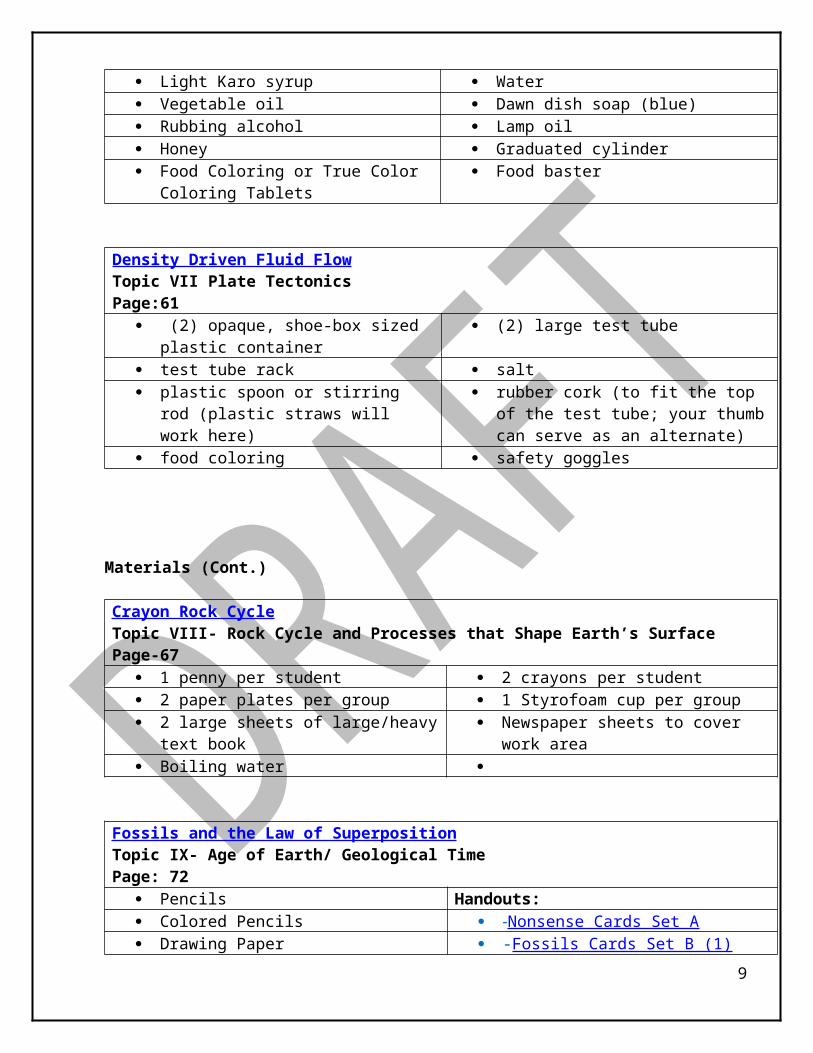
Light Karo syrup Water Vegetable oil Dawn dish soap (blue) Rubbing alcohol Lamp oil Honey Graduated cylinder Food Coloring or True Color Coloring
Tablets Food baster
Density Driven Fluid Flow Topic VII Plate Tectonics Page:61
(2) opaque, shoe-box sized plastic container
(2) large test tube
test tube rack salt plastic spoon or stirring rod (plastic
straws will work here) rubber cork (to fit the top of the test
tube; your thumb can serve as an alternate)
food coloring safety goggles
Materials (Cont.)
6
Crayon Rock CycleTopic VIII- Rock Cycle and Processes that Shape Earth’s SurfacePage-67
1 penny per student 2 crayons per student 2 paper plates per group 1 Styrofoam cup per group 2 large sheets of large/heavy text book Newspaper sheets to cover work area Boiling water
Fossils and the Law of Superposition Topic IX- Age of Earth/ Geological TimePage: 72
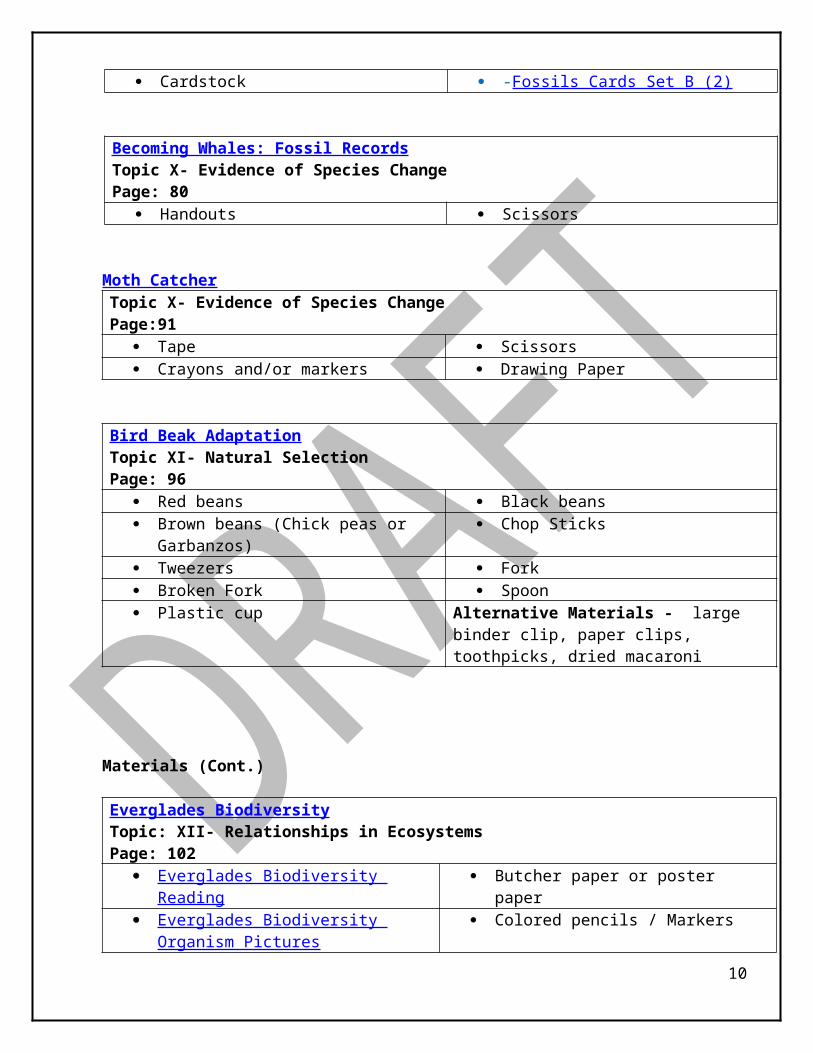
Pencils Handouts: Colored Pencils -Nonsense Cards Set A Drawing Paper -Fossils Cards Set B (1) Cardstock -Fossils Cards Set B (2)
Becoming Whales: Fossil Records Topic X- Evidence of Species ChangePage: 80
Handouts Scissors
Moth Catcher Topic X- Evidence of Species ChangePage:91
Tape Scissors Crayons and/or markers Drawing Paper
Bird Beak Adaptation Topic XI- Natural SelectionPage: 96
Red beans Black beans Brown beans (Chick peas or
Garbanzos) Chop Sticks
Tweezers Fork Broken Fork Spoon Plastic cup Alternative Materials - large binder clip,
paper clips, toothpicks, dried macaroni
Materials (Cont.)
Everglades Biodiversity7

Topic: XII- Relationships in EcosystemsPage: 102
Everglades Biodiversity Reading Butcher paper or poster paper Everglades Biodiversity Organism
Pictures Colored pencils / Markers
Cleaning Up an Oil SpillTopic XIII- Human Impact on EarthPage:110
container or 4 wide rimed containers per group that fits over 2500ml of water
4 table spoons of vegetable oil
1-3 drops of food coloring 2 sponges 2 - 4 cotton balls 2 paper towel pieces Dish soap
GMO’s OffspringTopic XIV- DNA, Chromosomes, and HeredityPage: 116
Lab Sheet Colored Pencils
Perfect Parents=Perfect BabiesTopic XV- Genetic Traits and HeredityPage: 121
Lab Sheet Colored Pencils
Incomplete Dominance (Advanced)Topic XV- Genetic Traits and HeredityPage: 124
2 purple plastic egg 2 pink plastic eggs 2 orange plastic eggs 2 blue plastic eggs 2 green plastic eggs 2 yellow plastic eggs 7 purple plastic items 7 yellow plastic items 7 pink plastic items 10 orange plastic items 7 blue plastic items 10 green plastic items
Additional Lab Resource Materials Not Listed. Please see individual lab resources for additional materials needed.
Energy Pipeline Page 131 Water & Air Acidification Page 136 Human Variation Page 145
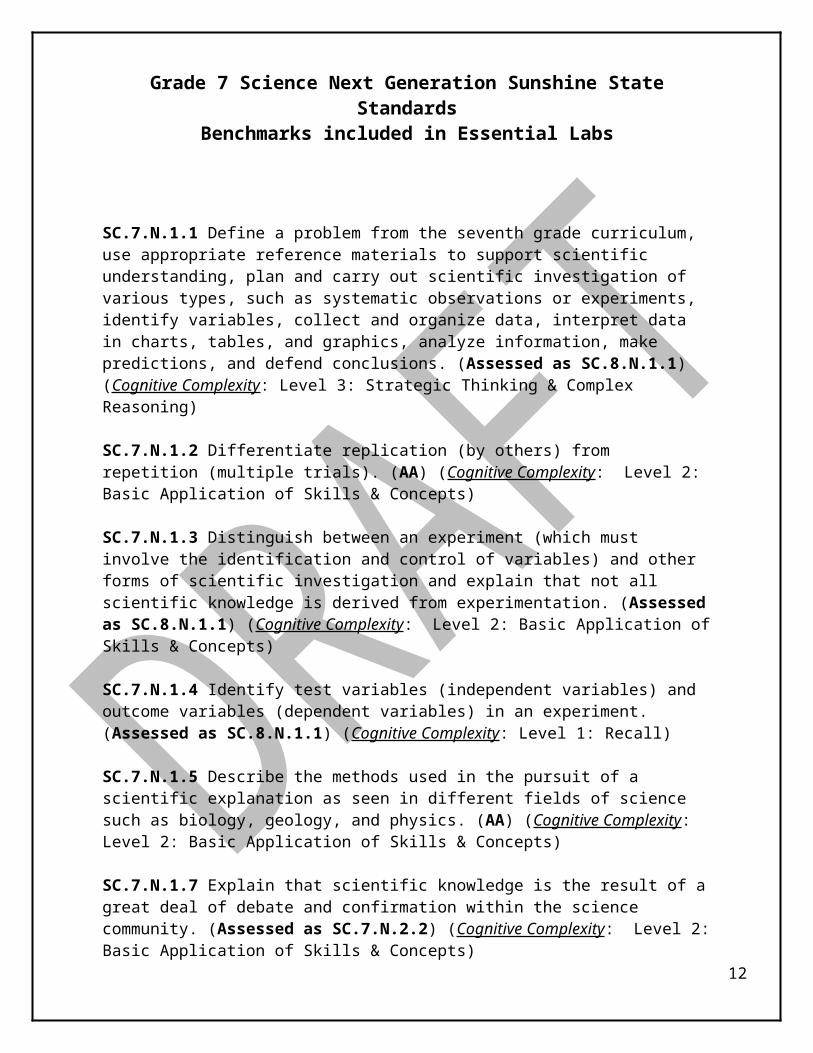
Grade 7 Science Next Generation Sunshine State Standards Benchmarks included in Essential Labs
8
SC.7.N.1.1 Define a problem from the seventh grade curriculum, use appropriate reference materials to support scientific understanding, plan and carry out scientific investigation of various types, such as systematic observations or experiments, identify variables, collect and organize data, interpret data in charts, tables, and graphics, analyze information, make predictions, and defend conclusions. (Assessed as SC.8.N.1.1) (Cognitive Complexity: Level 3: Strategic Thinking & Complex Reasoning)
SC.7.N.1.2 Differentiate replication (by others) from repetition (multiple trials). (AA) (Cognitive Complexity: Level 2: Basic Application of Skills & Concepts)
SC.7.N.1.3 Distinguish between an experiment (which must involve the identification and control of variables) and other forms of scientific investigation and explain that not all scientific knowledge is derived from experimentation. (Assessed as SC.8.N.1.1) (Cognitive Complexity: Level 2: Basic Application of Skills & Concepts)
SC.7.N.1.4 Identify test variables (independent variables) and outcome variables (dependent variables) in an experiment. (Assessed as SC.8.N.1.1) (Cognitive Complexity: Level 1: Recall)
SC.7.N.1.5 Describe the methods used in the pursuit of a scientific explanation as seen in different fields of science such as biology, geology, and physics. (AA) (Cognitive Complexity: Level 2: Basic Application of Skills & Concepts)
SC.7.N.1.7 Explain that scientific knowledge is the result of a great deal of debate and confirmation within the science community. (Assessed as SC.7.N.2.2) (Cognitive Complexity: Level 2: Basic Application of Skills & Concepts)
SC.7.N.2.1 Identify an instance from the history of science in which scientific knowledge has changed when new evidence or new interpretations are encountered. (Assessed as SC.6.N.2.2) (Cognitive Complexity: Level 1: Recall)
SC.7.E.6.2 Identify the patterns within the rock cycle and relate them to surface events (weathering and erosion) and sub-surface events (plate tectonics and mountain building). (AA)(Cognitive Complexity: Level 3: Strategic Thinking & Complex Reasoning)
SC.7.E.6.3 Identify current methods for measuring the age of Earth and its parts, including the law of superposition and radioactive dating. (Assessed as SC.7.E.6.4) (Cognitive Complexity: Level 2: Basic Application of Skills & Concepts)
SC.7.E.6.4 Explain and give examples of how physical evidence supports scientific theories that Earth has evolved over geologic time due to natural processes. (AA) (Cognitive Complexity: Level 3: Strategic Thinking & Complex Reasoning)
9
SC.7.E.6.6 Identify the impact that humans have had on Earth, such as deforestation, urbanization, desertification, erosion, air and water quality, changing the flow of water. (Assessed as SC.7.E.6.2) (Cognitive Complexity: Level 2: Basic Application of Skills & Concepts)
SC.7.P.10.2 The student observes and explains that light can be reflected, refracted, and absorbed. (Assessed as SC.7.P.10.3) (Cognitive Complexity: Level 3: Strategic Thinking & Complex Reasoning)
SC.7.P.10.3 The student recognizes that light waves, sound waves and other waves move at different speeds in different materials. (AA) (Cognitive Complexity: Level 1: Recall)
SC.7.P.11.1 Recognize that adding heat to or removing heat from a system may result in a temperature change and possibly a change of state. (Cognitive Complexity: Level 1: Recall)
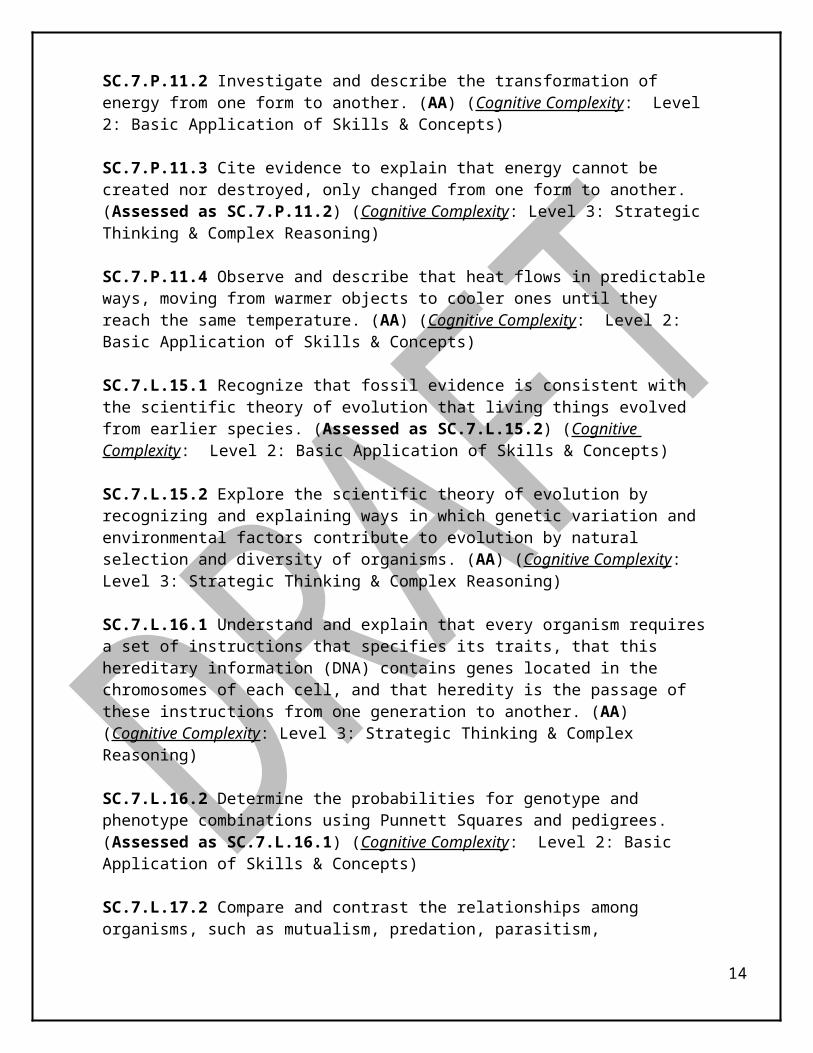
SC.7.P.11.2 Investigate and describe the transformation of energy from one form to another. (AA) (Cognitive Complexity: Level 2: Basic Application of Skills & Concepts)
SC.7.P.11.3 Cite evidence to explain that energy cannot be created nor destroyed, only changed from one form to another. (Assessed as SC.7.P.11.2) (Cognitive Complexity: Level 3: Strategic Thinking & Complex Reasoning)
SC.7.P.11.4 Observe and describe that heat flows in predictable ways, moving from warmer objects to cooler ones until they reach the same temperature. (AA) (Cognitive Complexity: Level 2: Basic Application of Skills & Concepts)
SC.7.L.15.1 Recognize that fossil evidence is consistent with the scientific theory of evolution that living things evolved from earlier species. (Assessed as SC.7.L.15.2) (Cognitive Complexity: Level 2: Basic Application of Skills & Concepts)
SC.7.L.15.2 Explore the scientific theory of evolution by recognizing and explaining ways in which genetic variation and environmental factors contribute to evolution by natural selection and diversity of organisms. (AA) (Cognitive Complexity: Level 3: Strategic Thinking & Complex Reasoning)
SC.7.L.16.1 Understand and explain that every organism requires a set of instructions that specifies its traits, that this hereditary information (DNA) contains genes located in the chromosomes of each cell, and that heredity is the passage of these instructions from one generation to another. (AA) (Cognitive Complexity: Level 3: Strategic Thinking & Complex Reasoning)
SC.7.L.16.2 Determine the probabilities for genotype and phenotype combinations using Punnett Squares and pedigrees. (Assessed as SC.7.L.16.1) (Cognitive Complexity: Level 2: Basic Application of Skills & Concepts)
10

SC.7.L.17.2 Compare and contrast the relationships among organisms, such as mutualism, predation, parasitism, competition, and commensalism. (Cognitive Complexity: Level 2: Basic Application of Skills & Concepts)(AA)= Annually Assessed Benchmarks
11
Lab Roles and Their DescriptionsCooperative learning activities are made up of four parts: group accountability, positive interdependence, individual responsibility, and face-to-face interaction. The key to making cooperative learning activities work successfully in the classroom is to have clearly defined tasks for all members of the group. An individual science experiment can be transformed into a cooperative learning activity by using these lab roles.
Project Director (PD)The project director is responsible for the group.Roles and responsibilities:
Reads directions to the group Keeps group on task Is the only group member allowed to
talk to the teacher Shares summary of group work and
results with the class
Materials Manager (MM)The materials manager is responsible for obtaining all necessary materials and/or equipment for the lab.Roles and responsibilities:
The only person allowed to be out of his/her seat to pick up needed materials
Organizes materials and/or equipment in the work space
Facilitates the use of materials during the investigation
Assists with conducting lab procedures Returns all materials at the end of the
lab to the designated area
Technical Manager (TM)The technical manager is in charge of recording all data.Roles and responsibilities:
Records data in tables and/or graphs Completes conclusions and final
summaries Assists with conducting the lab
procedures Assists with the cleanup
Safety Director (SD)The safety director is responsible for enforcing all safety rules and conducting the lab.Roles and responsibilities:
Assists the PD with keeping the group on-task
Conducts lab procedures Reports any accident to the teacher Keeps track of time Assists the MM as needed.
When assigning lab groups, various factors need to be taken in consideration; Always assign the group members, preferably trying to combine in each
group a variety of skills. Evaluate the groups constantly and observe if they are on-task and if the
members of the group support each other in a positive way. Once you realize that a group is not working to expectations, re-assign the members to another group.
12

Laboratory Safety
Rules:
Know the primary and secondary exit routes from the classroom.
Know the location of and how to use the safety equipment in the classroom.
Work at your assigned seat unless obtaining equipment and chemicals.
Do not handle equipment or chemicals without the teacher’s permission.
Follow laboratory procedures as explained and do not perform unauthorized experiments.
Work as quietly as possible and cooperate with your lab partner.
Wear appropriate clothing, proper footwear, and eye protection.
Report to the teachers all accidents and possible hazards.
Remove all unnecessary materials from the work area and completely clean up the work area after the experiment.
Always make safety your first consideration in the laboratory.
Safety Contract:
I will: Follow all instructions given by the teacher. Protect eyes, face and hands, and body while conducting class activities. Carry out good housekeeping practices. Know where to get help fast. Know the location of the first aid and fire fighting equipment. Conduct myself in a responsible manner at all times in a laboratory situation.
I, _______________________, have read and agree to abide by the safety regulations as set forth above and also any additional printed instructions provided by the teacher. I further agree to follow all other written and verbal instructions given in class.
Student’s Signature:____________________________ Date: ___________________
13
Parent’s Signature: Date: ___________________
14

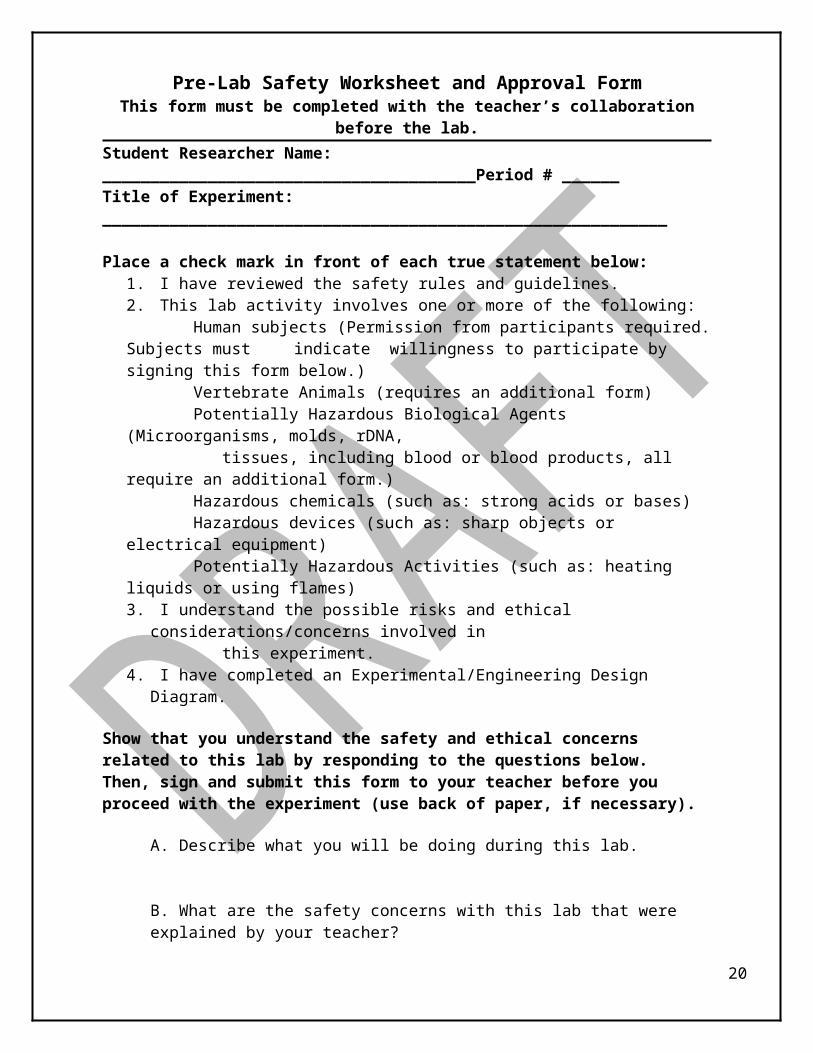
Pre-Lab Safety Worksheet and Approval FormThis form must be completed with the teacher’s collaboration before the lab.
Student Researcher Name: _______________________________________Period # ______Title of Experiment: ___________________________________________________________
Place a check mark in front of each true statement below: 1. I have reviewed the safety rules and guidelines.2. This lab activity involves one or more of the following: Human subjects (Permission from participants required. Subjects must
indicate willingness to participate by signing this form below.) Vertebrate Animals (requires an additional form) Potentially Hazardous Biological Agents (Microorganisms, molds, rDNA, tissues, including blood or blood products, all require an additional form.) Hazardous chemicals (such as: strong acids or bases) Hazardous devices (such as: sharp objects or electrical equipment) Potentially Hazardous Activities (such as: heating liquids or using flames)3. I understand the possible risks and ethical considerations/concerns involved in this experiment.4. I have completed an Experimental/Engineering Design Diagram.
Show that you understand the safety and ethical concerns related to this lab by responding to the questions below. Then, sign and submit this form to your teacher before you proceed with the experiment (use back of paper, if necessary).
A. Describe what you will be doing during this lab.
B. What are the safety concerns with this lab that were explained by your teacher?
How will you address them?
C. What additional safety concerns or questions do you have?
D. What ethical concerns related to this lab do you have? How will you address them?
Student Researcher’s Signature/Date: Teacher Approval Signature:
__________________________________________________________________
Human Subjects’ Agreement to Participate:
_______________________________ ____________________________Printed Name/Signature/Date Printed Name/Signature/Date
15

__________________________________________________________________
Printed Name/Signature/Date Printed Name/Signature/Date
Parts of a Lab ReportA Step-by-Step Checklist
Good scientists reflect on their work by writing a lab report. A lab report is a recap of what a scientist investigated. It is made up of the following parts.
Title (underlined and on the top center of the page)
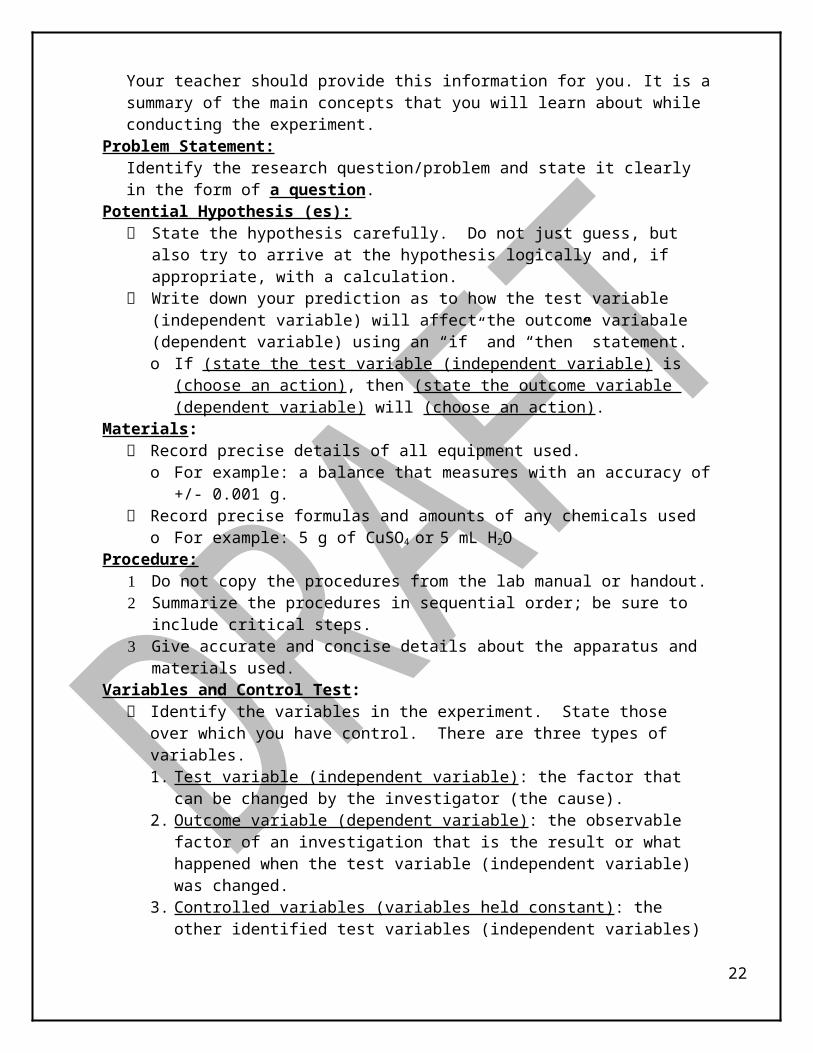
Benchmarks Covered: Your teacher should provide this information for you. It is a summary of the main concepts that you will learn about while conducting the experiment.
Problem Statement:Identify the research question/problem and state it clearly in the form of a question.
Potential Hypothesis (es): State the hypothesis carefully. Do not just guess, but also try to arrive at the
hypothesis logically and, if appropriate, with a calculation. Write down your prediction as to how the test variable (independent variable)
will affect the outcome variabale (dependent variable) using an “if” and “then” statement. o If (state the test variable (independent variable) is (choose an action), then
(state the outcome variable (dependent variable) will (choose an action).Materials:
Record precise details of all equipment used.o For example: a balance that measures with an accuracy of +/- 0.001 g.
Record precise formulas and amounts of any chemicals usedo For example: 5 g of CuSO4
or 5 mL H2O Procedure:
1 Do not copy the procedures from the lab manual or handout.2 Summarize the procedures in sequential order; be sure to include critical steps.3 Give accurate and concise details about the apparatus and materials used.
Variables and Control Test: Identify the variables in the experiment. State those over which you have
control. There are three types of variables.1. Test variable (independent variable): the factor that can be changed by the
investigator (the cause).2. Outcome variable (dependent variable): the observable factor of an
investigation that is the result or what happened when the test variable (independent variable) was changed.
3. Controlled variables (variables held constant): the other identified test variables (independent variables) in the investigation that are kept or remain the same during the investigation.
16

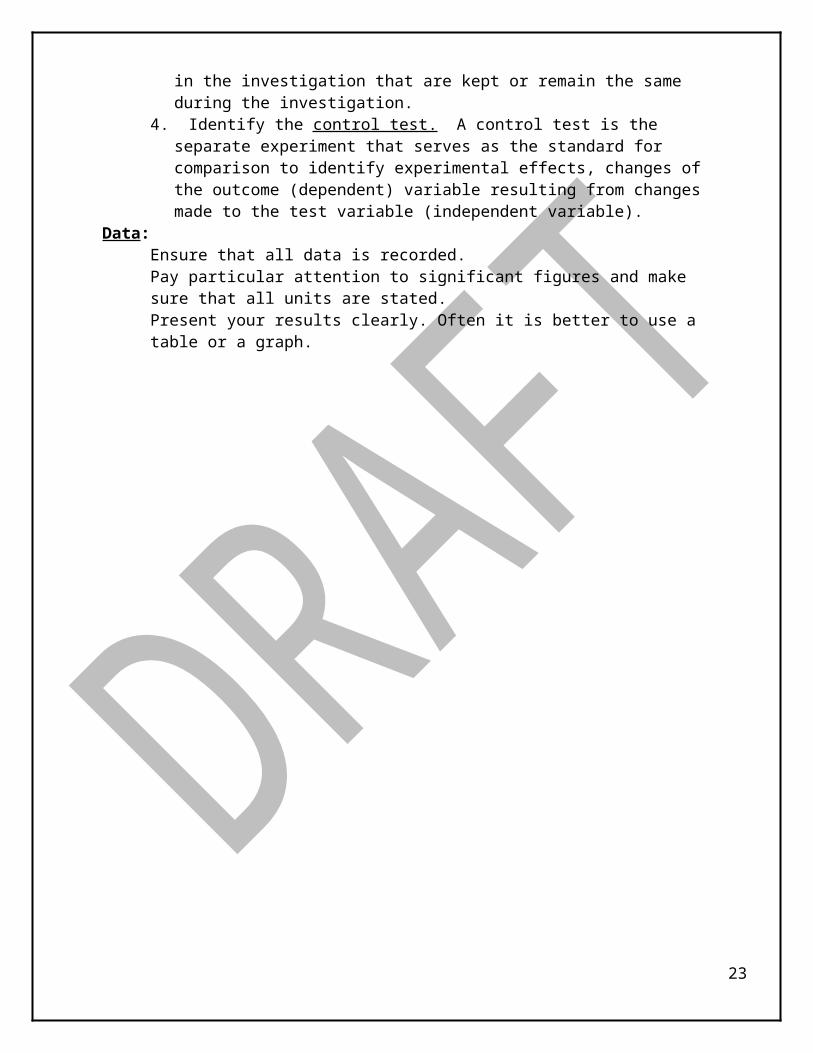
4. Identify the control test. A control test is the separate experiment that serves as the standard for comparison to identify experimental effects, changes of the outcome (dependent) variable resulting from changes made to the test variable (independent variable).
Data:Ensure that all data is recorded.Pay particular attention to significant figures and make sure that all units are stated.Present your results clearly. Often it is better to use a table or a graph.
17
If using a graph, make sure that the graph has a title, each axis is labeled clearly, and the correct scale is chosen to utilize most of the graph space.Record qualitative observations. Also list the environmental conditions.
Include color changes, solubility changes, and whether heat was released or absorbed.
Results:1 Ensure that you have recorded your data correctly to produce accurate results.2 Include any errors or uncertainties that may affect the validity of your result.
Conclusion and Evaluation:A conclusion statement answers the following 7 questions in at least three paragraphs.I. First Paragraph: Introduction
1. What was investigated?a) Describe the problem or state the purpose of the experiment.
2. Was the hypothesis supported by the data?a) Compare your actual result to the expected result (either from the literature,
textbook, or your hypothesis)b) Include a valid conclusion that relates to the initial problem or hypothesis.
3. What were your major findings?a) Did the findings support or not support the hypothesis as the solution to the
restated problem?b) Calculate the percentage error from the expected value.
II. Middle Paragraphs: These paragraphs answer question 4 and discuss the major findings of the experiment using data.4. How did your findings compare with other researchers?
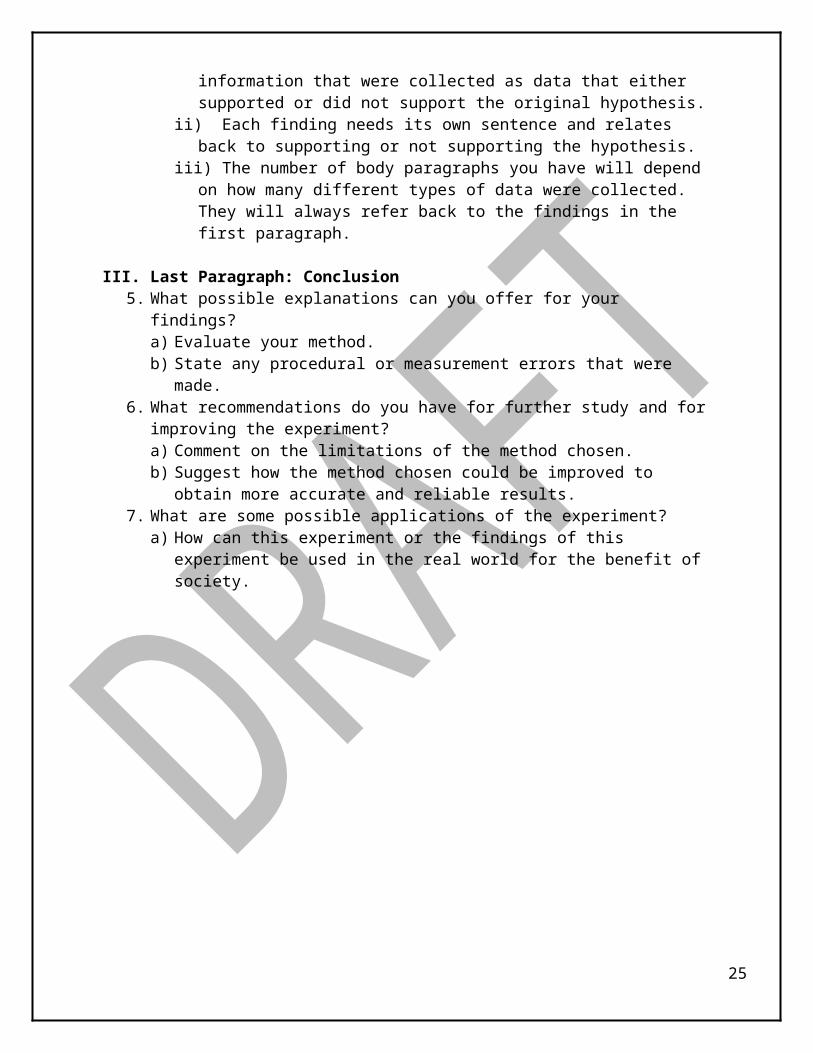
a) Compare your result to other students’ results in the class.i) The body paragraphs support the introductory paragraph by elaborating
on the different pieces of information that were collected as data that either supported or did not support the original hypothesis.
ii) Each finding needs its own sentence and relates back to supporting or not supporting the hypothesis.
iii) The number of body paragraphs you have will depend on how many different types of data were collected. They will always refer back to the findings in the first paragraph.
III. Last Paragraph: Conclusion5. What possible explanations can you offer for your findings?
a) Evaluate your method.b) State any procedural or measurement errors that were made.
6. What recommendations do you have for further study and for improving the experiment?a) Comment on the limitations of the method chosen.b) Suggest how the method chosen could be improved to obtain more
accurate and reliable results.7. What are some possible applications of the experiment?
18
a) How can this experiment or the findings of this experiment be used in the real world for the benefit of society.
19
Name: _____________________________________ Date: _____________________________Period: _____
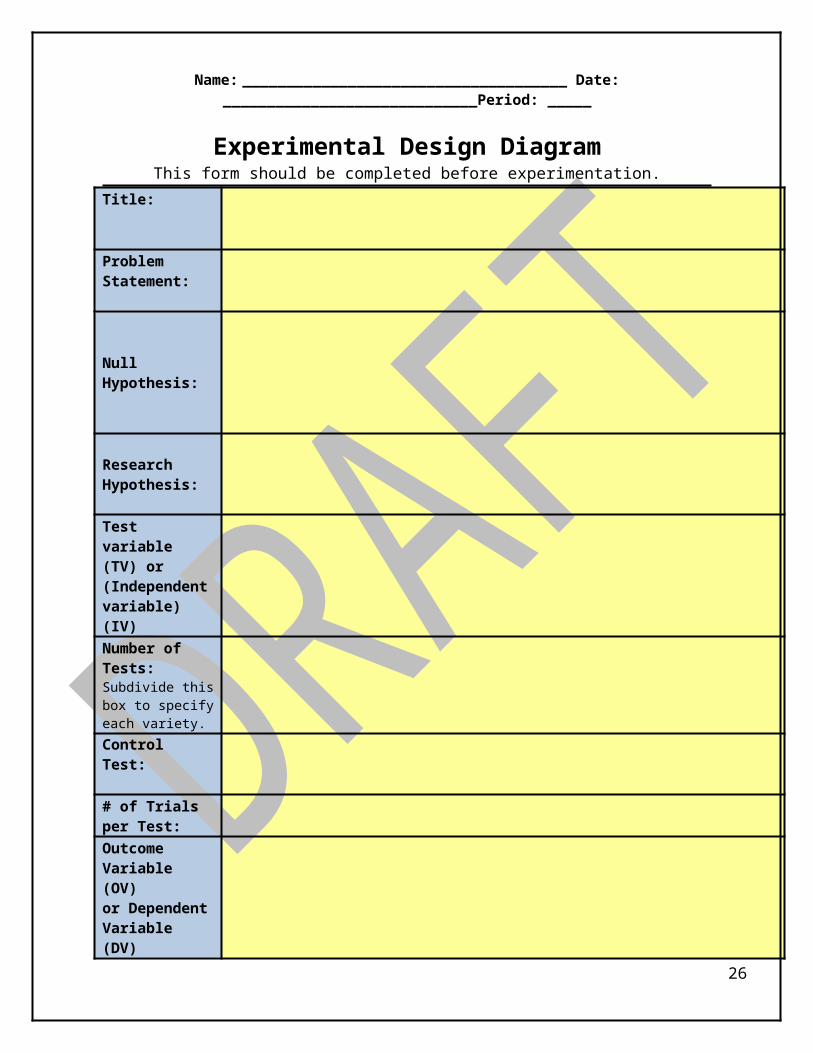
Experimental Design DiagramThis form should be completed before experimentation.
Title:
Problem Statement:
Null Hypothesis:
Research Hypothesis:
Test variable (TV) or (Independent variable) (IV)Number of Tests:Subdivide this box to specify each variety.Control Test:
# of Trials per Test:Outcome Variable (OV)or Dependent Variable (DV)Controlled Variables or VariablesHeld Constant
1.
2.
3.
4.
5.
6.
20

Experimental Design Diagram Hints:
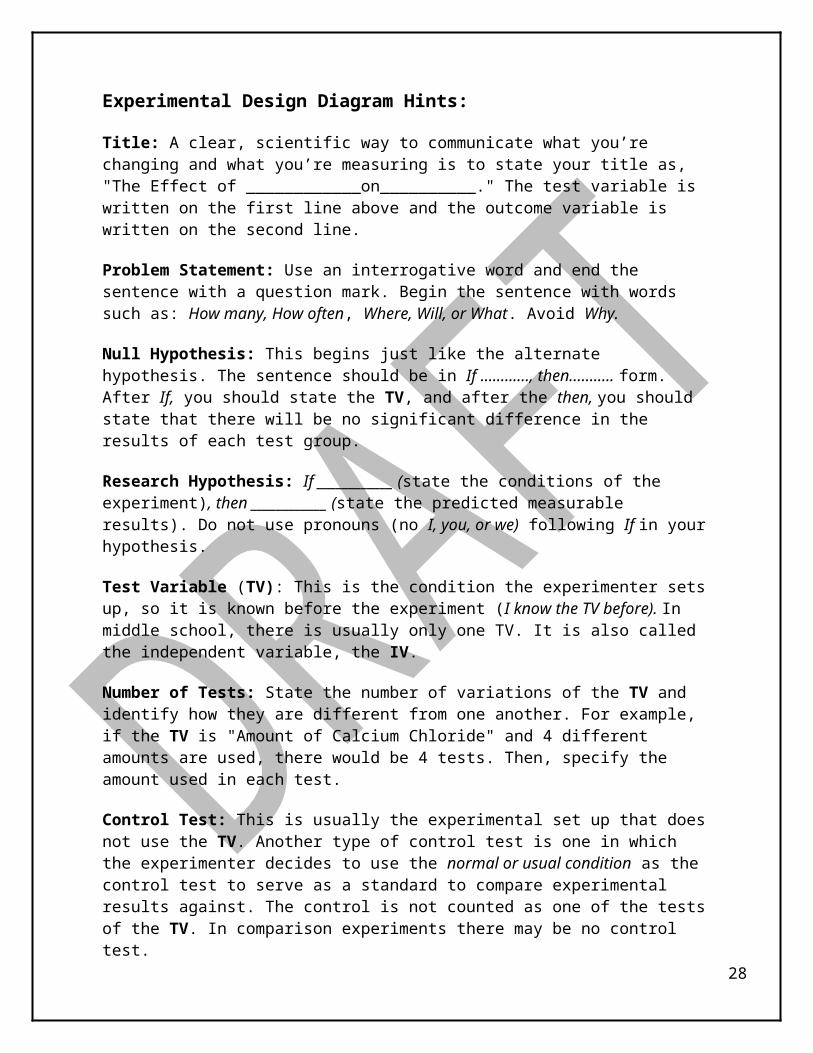
Title: A clear, scientific way to communicate what you’re changing and what you’re measuring is to state your title as, "The Effect of ____________on__________." The test variable is written on the first line above and the outcome variable is written on the second line.
Problem Statement: Use an interrogative word and end the sentence with a question mark. Begin the sentence with words such as: How many, How often, Where, Will, or What. Avoid Why.
Null Hypothesis: This begins just like the alternate hypothesis. The sentence should be in If ............, then........... form. After If, you should state the TV, and after the then, you should state that there will be no significant difference in the results of each test group.
Research Hypothesis: If ____________ (state the conditions of the experiment), then ____________ (state the predicted measurable results). Do not use pronouns (no I, you, or we) following If in your hypothesis.
Test Variable (TV): This is the condition the experimenter sets up, so it is known before the experiment (I know the TV before). In middle school, there is usually only one TV. It is also called the independent variable, the IV.
Number of Tests: State the number of variations of the TV and identify how they are different from one another. For example, if the TV is "Amount of Calcium Chloride" and 4 different amounts are used, there would be 4 tests. Then, specify the amount used in each test.
Control Test: This is usually the experimental set up that does not use the TV. Another type of control test is one in which the experimenter decides to use the normal or usual condition as the control test to serve as a standard to compare experimental results against. The control is not counted as one of the tests of the TV. In comparison experiments there may be no control test.
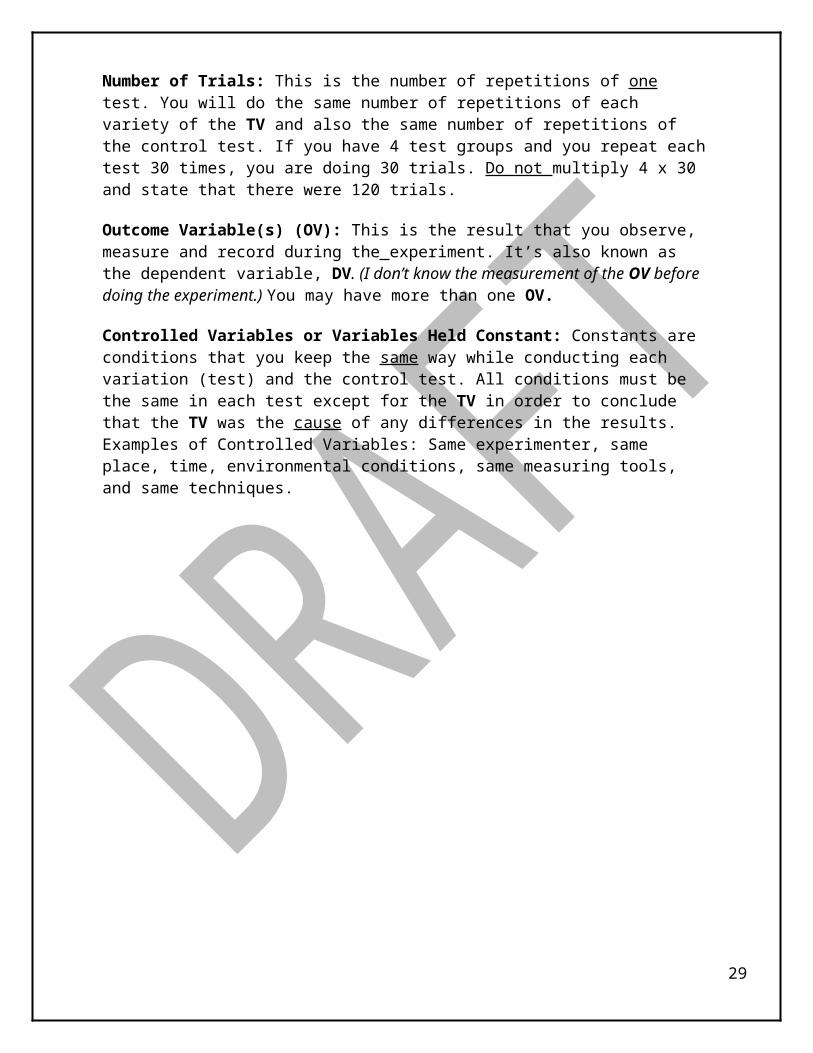
Number of Trials: This is the number of repetitions of one test. You will do the same number of repetitions of each variety of the TV and also the same number of repetitions of the control test. If you have 4 test groups and you repeat each test 30 times, you are doing 30 trials. Do not multiply 4 x 30 and state that there were 120 trials.
Outcome Variable(s) (OV): This is the result that you observe, measure and record during the experiment. It’s also known as the dependent variable, DV. (I don’t know
21
the measurement of the OV before doing the experiment.) You may have more than one OV.
Controlled Variables or Variables Held Constant: Constants are conditions that you keep the same way while conducting each variation (test) and the control test. All conditions must be the same in each test except for the TV in order to conclude that the TV was the cause of any differences in the results. Examples of Controlled Variables: Same experimenter, same place, time, environmental conditions, same measuring tools, and same techniques.
22
Step 1Identify the
Need or Problem
Step 3Develop Possible
Solution(s)
Step 2Research the
Need or Problem
Step 6Test and Evaluate
the Solution(s)
Step 7Communicate the Solution(s)
Step 8Redesign
Step 5Construct a Prototype
Step 4Select the Best
Possible Solution(s)
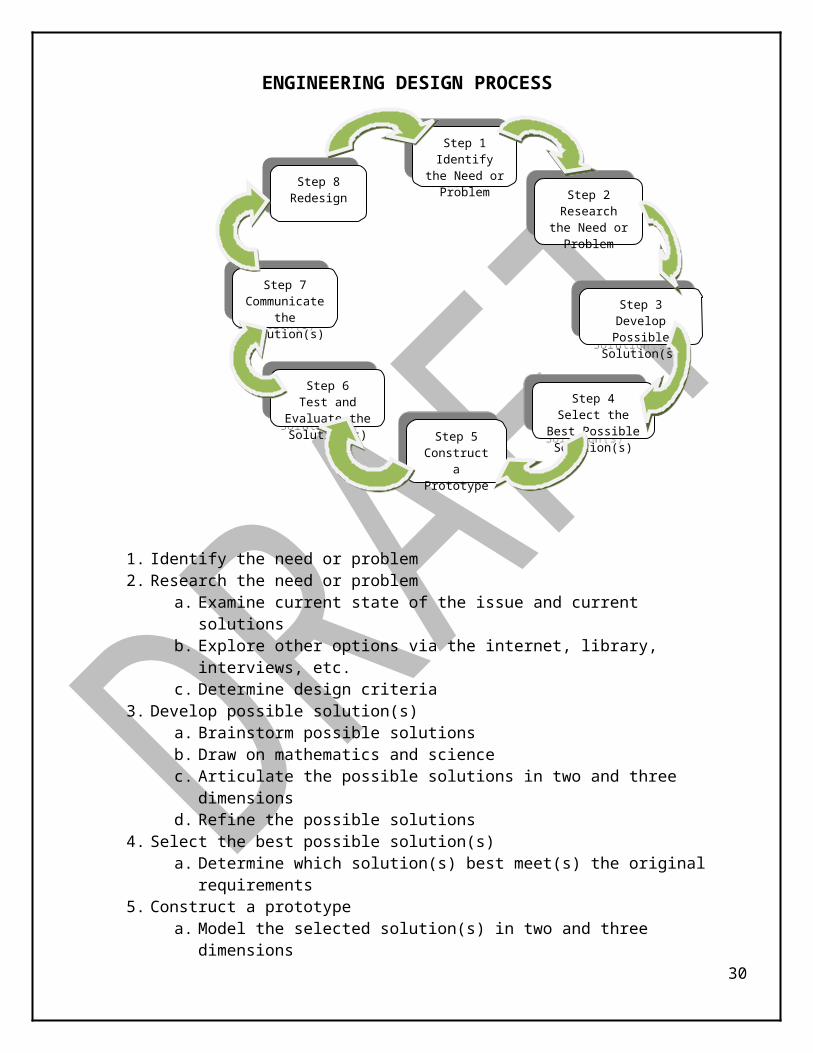
ENGINEERING DESIGN PROCESS
1. Identify the need or problem 2. Research the need or problem
a. Examine current state of the issue and current solutions b. Explore other options via the internet, library, interviews, etc.c. Determine design criteria
3. Develop possible solution(s) a. Brainstorm possible solutions b. Draw on mathematics and science c. Articulate the possible solutions in two and three dimensions d. Refine the possible solutions
4. Select the best possible solution(s) a. Determine which solution(s) best meet(s) the original requirements
5. Construct a prototype a. Model the selected solution(s) in two and three dimensions
6. Test and evaluate the solution(s) a. Does it work? b. Does it meet the original design constraints?
7. Communicate the solution(s) a. Make an engineering presentation that includes a discussion of how the
solution(s) best meet(s) the needs of the initial problem, opportunity, or need
b. Discuss societal impact and tradeoffs of the solution(s) 8. Redesign
a. Overhaul the solution(s) based on information gathered during the tests and presentation
23

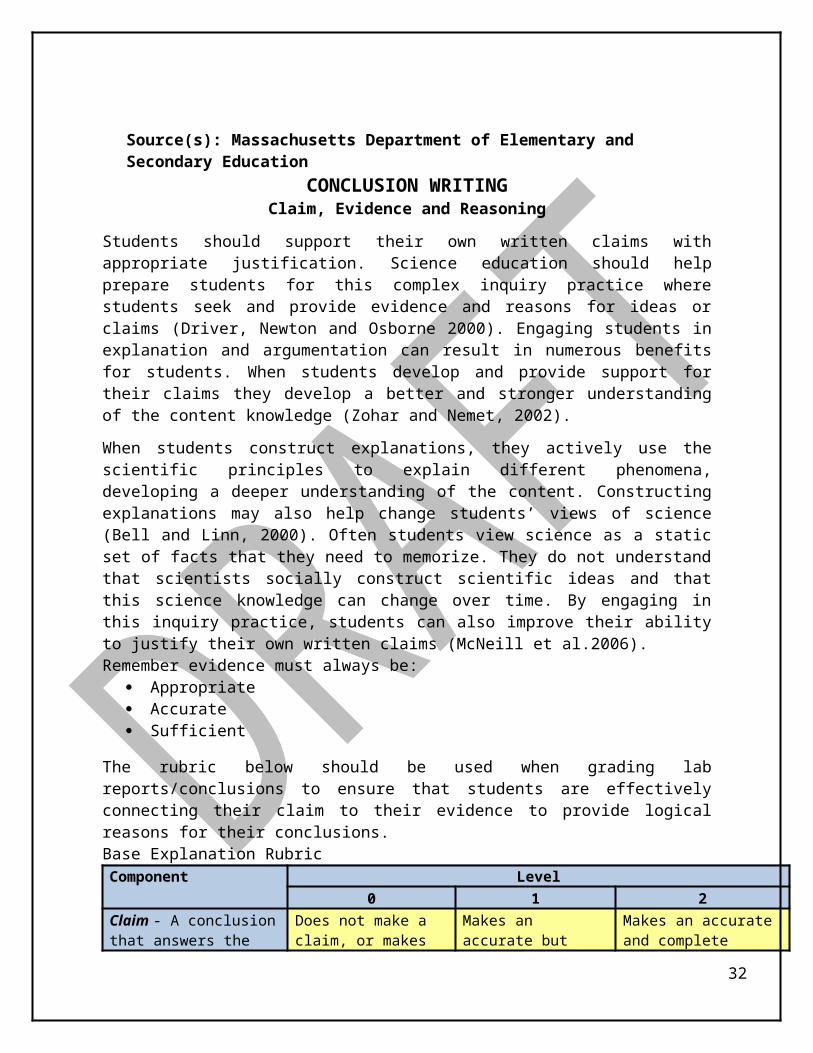
Source(s): Massachusetts Department of Elementary and Secondary Education
CONCLUSION WRITINGClaim, Evidence and Reasoning
Students should support their own written claims with appropriate justification. Science education should help prepare students for this complex inquiry practice where students seek and provide evidence and reasons for ideas or claims (Driver, Newton and Osborne 2000). Engaging students in explanation and argumentation can result in numerous benefits for students. When students develop and provide support for their claims they develop a better and stronger understanding of the content knowledge (Zohar and Nemet, 2002).
When students construct explanations, they actively use the scientific principles to explain different phenomena, developing a deeper understanding of the content. Constructing explanations may also help change students’ views of science (Bell and Linn, 2000). Often students view science as a static set of facts that they need to memorize. They do not understand that scientists socially construct scientific ideas and that this science knowledge can change over time. By engaging in this inquiry practice, students can also improve their ability to justify their own written claims (McNeill et al.2006). Remember evidence must always be:
Appropriate Accurate Sufficient
The rubric below should be used when grading lab reports/conclusions to ensure that students are effectively connecting their claim to their evidence to provide logical reasons for their conclusions.Base Explanation RubricComponent Level
0 1 2Claim - A conclusion that answers the original question.
Does not make a claim, or makes an inaccurate claim.
Makes an accurate but incomplete claim.
Makes an accurate and complete claim.
Evidence – Scientific data that supports the claim. The data needs to be appropriate and sufficient to support the claim.
Does not provide evidence, or only provides inappropriate evidence (evidence that does not support the claim).
Provides appropriate but insufficient evidence to support claim. May include some inappropriate evidence.
Provides appropriate and sufficient evidence to support claim.
Reasoning – A justification that links the claim and evidence. It shows why the data count as evidence by using appropriate and sufficient scientific principles.
Does not provide reasoning, or only provides reasoning that does not link evidence to claim
Provides reasoning that links the claim and evidence. Repeats the evidence and/or includes some – but not sufficient – scientific principles.
Provides reasoning that links evidence to claim. Includes appropriate and sufficient scientific principles.
24
McNeill, K. L. & Krajcik, J. (2008). Inquiry and scientific explanations: Helping students use evidence and reasoning. In Luft, J., Bell, R. & Gess-Newsome, J. (Eds.). Science as inquiry in the secondary setting. (p. 121-134). Arlington, VA: National Science Teachers Association Press.
25
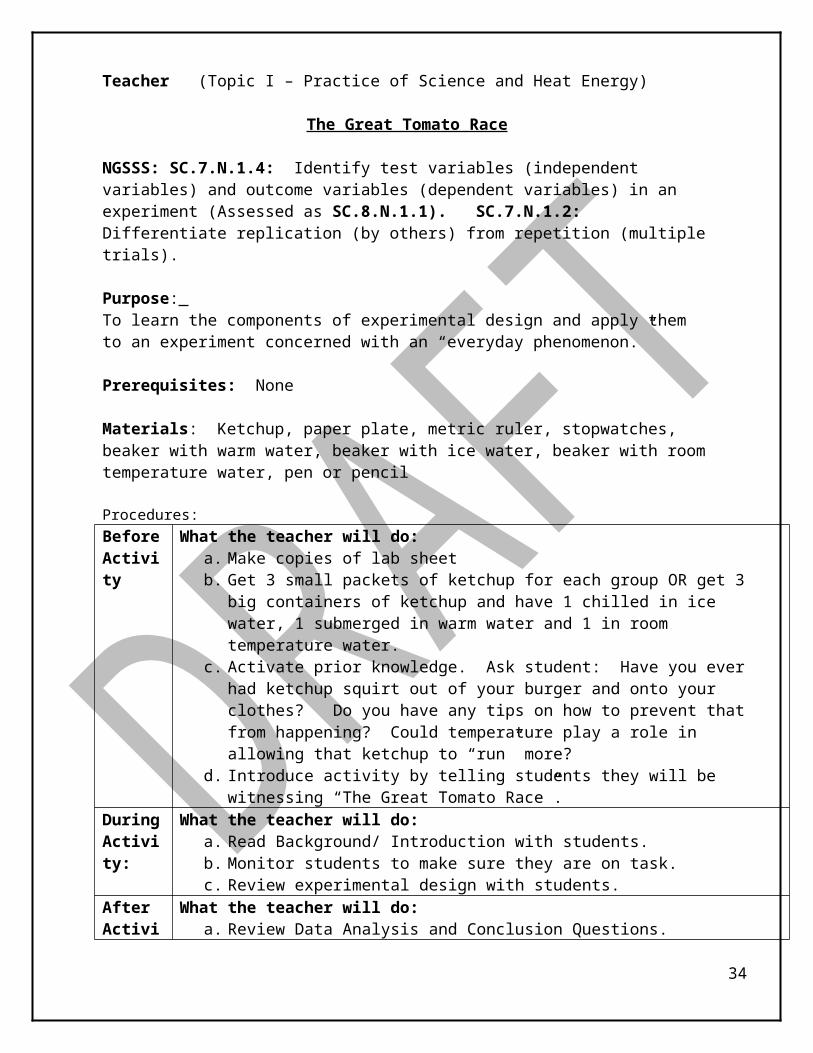
Teacher (Topic I – Practice of Science and Heat Energy)
The Great Tomato Race
NGSSS: SC.7.N.1.4: Identify test variables (independent variables) and outcome variables (dependent variables) in an experiment (Assessed as SC.8.N.1.1). SC.7.N.1.2: Differentiate replication (by others) from repetition (multiple trials).
Purpose: To learn the components of experimental design and apply them to an experiment concerned with an “everyday phenomenon.”
Prerequisites: None
Materials: Ketchup, paper plate, metric ruler, stopwatches, beaker with warm water, beaker with ice water, beaker with room temperature water, pen or pencil
Procedures:Before Activity
What the teacher will do: a. Make copies of lab sheetb. Get 3 small packets of ketchup for each group OR get 3 big containers of
ketchup and have 1 chilled in ice water, 1 submerged in warm water and 1 in room temperature water.
c. Activate prior knowledge. Ask student: Have you ever had ketchup squirt out of your burger and onto your clothes? Do you have any tips on how to prevent that from happening? Could temperature play a role in allowing that ketchup to “run” more?
d. Introduce activity by telling students they will be witnessing “The Great Tomato Race”.
During Activity:
What the teacher will do:a. Read Background/ Introduction with students. b. Monitor students to make sure they are on task.c. Review experimental design with students.
After Activity:
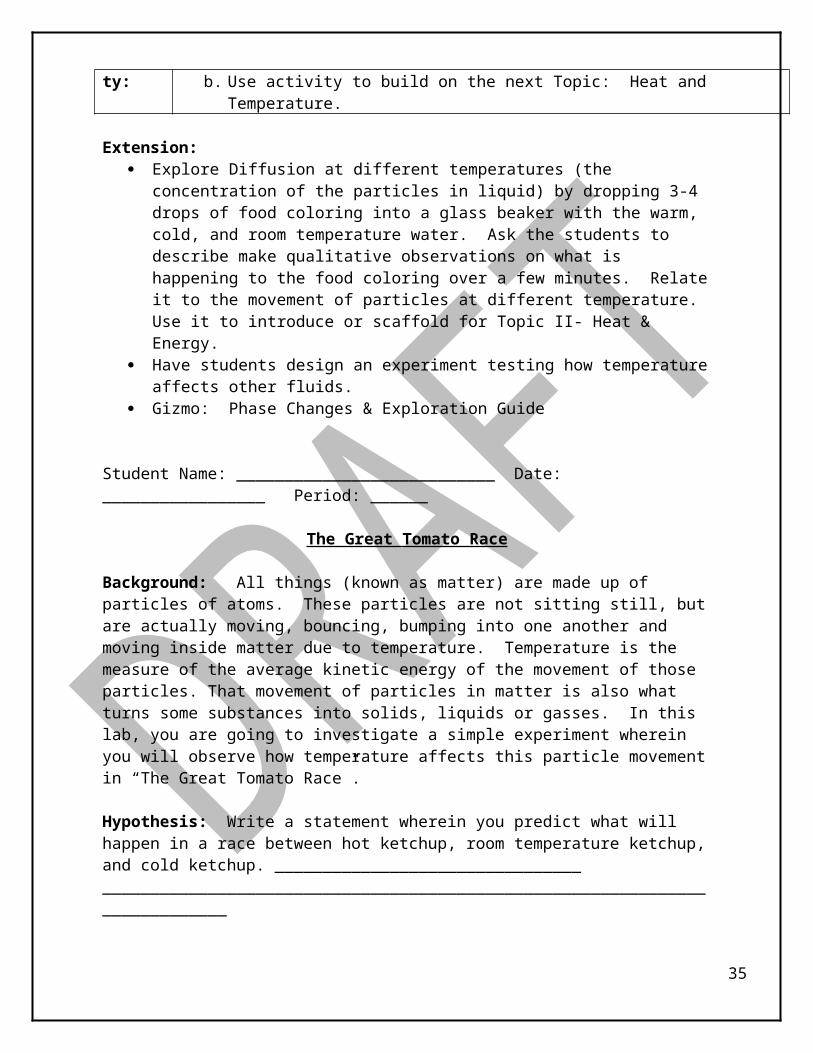
What the teacher will do:a. Review Data Analysis and Conclusion Questions.b. Use activity to build on the next Topic: Heat and Temperature.
Extension: Explore Diffusion at different temperatures (the concentration of the particles in
liquid) by dropping 3-4 drops of food coloring into a glass beaker with the warm, cold, and room temperature water. Ask the students to describe make qualitative observations on what is happening to the food coloring over a few minutes. Relate it to the movement of particles at different temperature. Use it to introduce or scaffold for Topic II- Heat & Energy.
Have students design an experiment testing how temperature affects other fluids.
Gizmo: Phase Changes & Exploration Guide
26

Student Name: ___________________________ Date: _________________ Period: ______
The Great Tomato Race
Background: All things (known as matter) are made up of particles of atoms. These particles are not sitting still, but are actually moving, bouncing, bumping into one another and moving inside matter due to temperature. Temperature is the measure of the average kinetic energy of the movement of those particles. That movement of particles in matter is also what turns some substances into solids, liquids or gasses. In this lab, you are going to investigate a simple experiment wherein you will observe how temperature affects this particle movement in “The Great Tomato Race”.
Hypothesis: Write a statement wherein you predict what will happen in a race between hot ketchup, room temperature ketchup, and cold ketchup. ____________________________________________________________________________________________________________
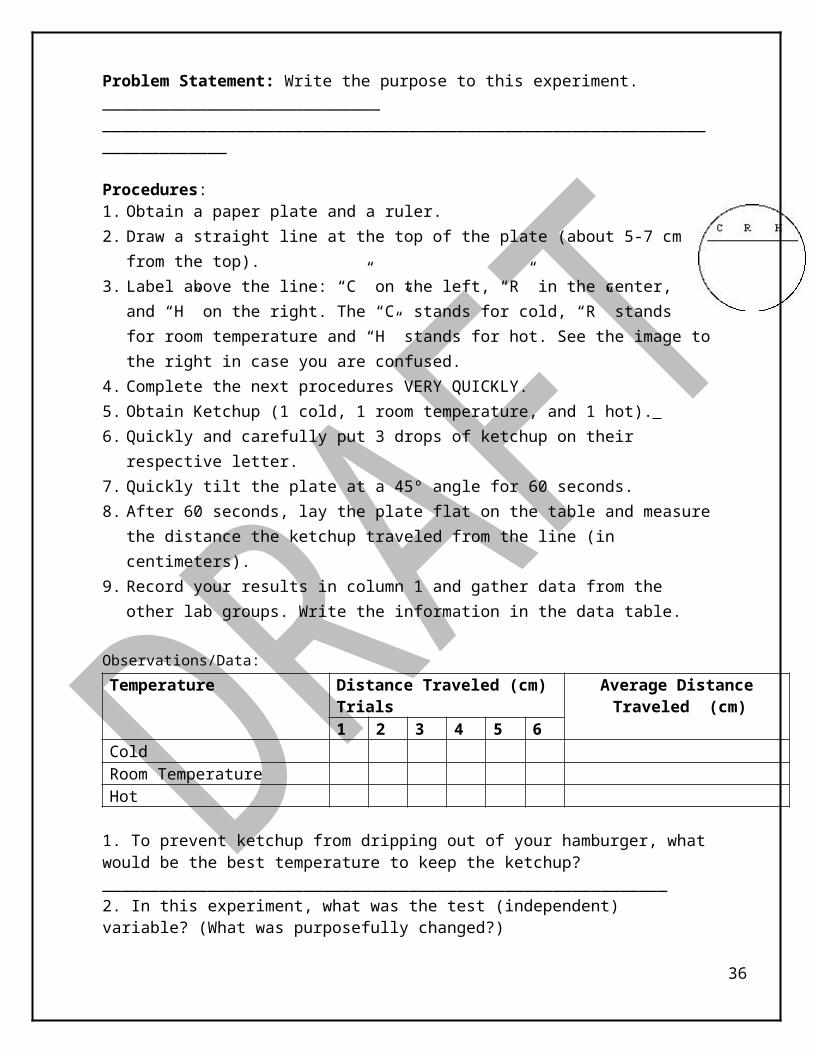
Problem Statement: Write the purpose to this experiment. _________________________________________________________________________________________________________
Procedures:1. Obtain a paper plate and a ruler.2. Draw a straight line at the top of the plate (about 5-7 cm from the top).3. Label above the line: “C” on the left, “R” in the center, and “H” on the right. The
“C” stands for cold, “R” stands for room temperature and “H” stands for hot. See the image to the right in case you are confused.
4. Complete the next procedures VERY QUICKLY.5. Obtain Ketchup (1 cold, 1 room temperature, and 1 hot). 6. Quickly and carefully put 3 drops of ketchup on their respective letter. 7. Quickly tilt the plate at a 45º angle for 60 seconds.8. After 60 seconds, lay the plate flat on the table and measure the distance the
ketchup traveled from the line (in centimeters).9. Record your results in column 1 and gather data from the other lab groups. Write
the information in the data table.
Observations/Data:Temperature Distance Traveled (cm)
TrialsAverage Distance Traveled
(cm)1 2 3 4 5 6
ColdRoom TemperatureHot
27
1. To prevent ketchup from dripping out of your hamburger, what would be the best temperature to keep the ketchup? ___________________________________________________________2. In this experiment, what was the test (independent) variable? (What was purposefully changed?) ___________________________________________________________________3. In this experiment, what was the outcome (dependent) variable? (What measured change?) ____________________________________________________________________________4. What were constants (remained the same) throughout the experiment? _____________________________________________________________________________________________5. What would be the control? (What is the basis for comparison? What is “normal” temperature of ketchup?) _____________________________________________________________________________________________________________________________________________6. Why did you gather information from other groups? _____________________________________________________________________________________________________________7. Describe how this experiment can be Replicated. ______________________________________________________________________________________________________________8. Describe how this experiment is subject to Repetition. ______________________________ ____________________________________________________________________________9. How could you improve this experiment? ____________________________________________________________________________________________________________________10. According to the Law of Thermodynamics, particles in matter move depending on
temperature. Discuss how you think the particles moved in the cold ketchup, warm ketchup, and room temperature ketchup. Justify your response based on your data. ____________
____________________________________________________________________________________________________________________________________________________________________________________________________________________________________
Conclusion: Claim:Make a CLAIM that answers the original question/problem. .
28
EvidenceSupport your claim using scientific data.
ReasoningExplain why the data that you mentioned supports your claim.
29
Teacher (Topic II- Heat Energy)
TEMPERATURE CHANGES EVERYTHINGAdapted from Science NetLinks Activity Sheet - Temperature Changes Everything
NGSSS:SC.7.P.11.1 Recognize that adding heat to or removing heat from a system may result in a temperature change and possibly a change of state.SC.7.P.11.4 Observe and describe that heat flows in predictable ways, moving from warmer objects to cooler ones until they reach the same temperature. (AA)
Purpose of the Lab/ Activity: Explain how adding or removing heat from a system may result in a
change in temperature or a change of state. Predict how heat will flow in a system i.e., from warmer to cooler until they
reach the same temperature.
Prerequisites: Temperature affects the motion of molecules. As air is warmed, the energy from the heat causes the molecules of air to
move faster and farther apart.
Materials: one small party balloon, one small bottle/flask, hot plate/Bunsen burner, balance, oven mitt, water
Procedures: Day of Activity:Before activity:
What the teacher will do:a. Activate student’s prior knowledge by the following video. b. Play the “Behavior of Matter” interactive video for students to see how the
molecules in solids, liquids, and gas behave as heat is added or removed (http://www.bbc.co.uk/schools/ks3bitesize/science/chemical_material_behaviour/behaviour_of_matter/activity.shtml ).
During activity:
What the teacher will do:1. Form groups of 3-4 students.2. Facilitate the collection of materials by students.3. Walk about the groups as they conduct their labs. Ask higher order thinking
questions.4. Facilitate the observations and completion of data writing for the activities by
asking questions.AfterActivity:
What the teacher will do: Elaborate: Students can research how a hot air balloon works. They can draw a diagram of how the gas particles move and why.
Extension:1. Develop a problem statement based on the concept of heat being added or
being removed from a system (think carefully of the impact of those changes on the system.)
2. State your hypothesis.3. Design an experiment to test your hypothesis.4. Carry out the experiment you designed.5. Direct the students to submit a completed lab report to your teacher.
30
6. Use the “Claim, Evidence & Reasoning” rubric to defend your claims in the conclusion.
31
Student Name: ___________________________ Date: _________________ Period: ______
TEMPERATURE CHANGES EVERYTHINGAdapted from Science NetLinks Activity Sheet - Temperature Changes Everything
NGSSS:SC.7.P.11.1 Recognize that adding heat to or removing heat from a system may result in a temperature change and possibly a change of state.SC.7.P.11.4 Observe and describe that heat flows in predictable ways, moving from warmer objects to cooler ones until they reach the same temperature. (AA)
Background:One of the most important concepts for students to understand is that temperature affects the motion of molecules. As air is warmed, the energy from the heat causes the molecules of air to move faster and farther apart. Some students may have difficulty with this concept because they lack an appreciation of the very small size of particles or may attribute macroscopic properties to particles. Students might also believe that there must be something in the space between particles. Finally, students may have difficulty in appreciating the intrinsic motion of particles in solids, liquids, and gases; and have problems in conceptualizing forces between particles. In order to clarify student thinking about molecules and their relationship to temperature, instruction has to make the molecular world understandable to students.
Problem Statement: How does adding heat to a system cause a change of state of matter?
Vocabulary: : heat, temperature, liquid, solid, gas, state of mater, evaporation, melting point, boiling point, condensation, molecular motion, Celsius, Fahrenheit, kinetic energy
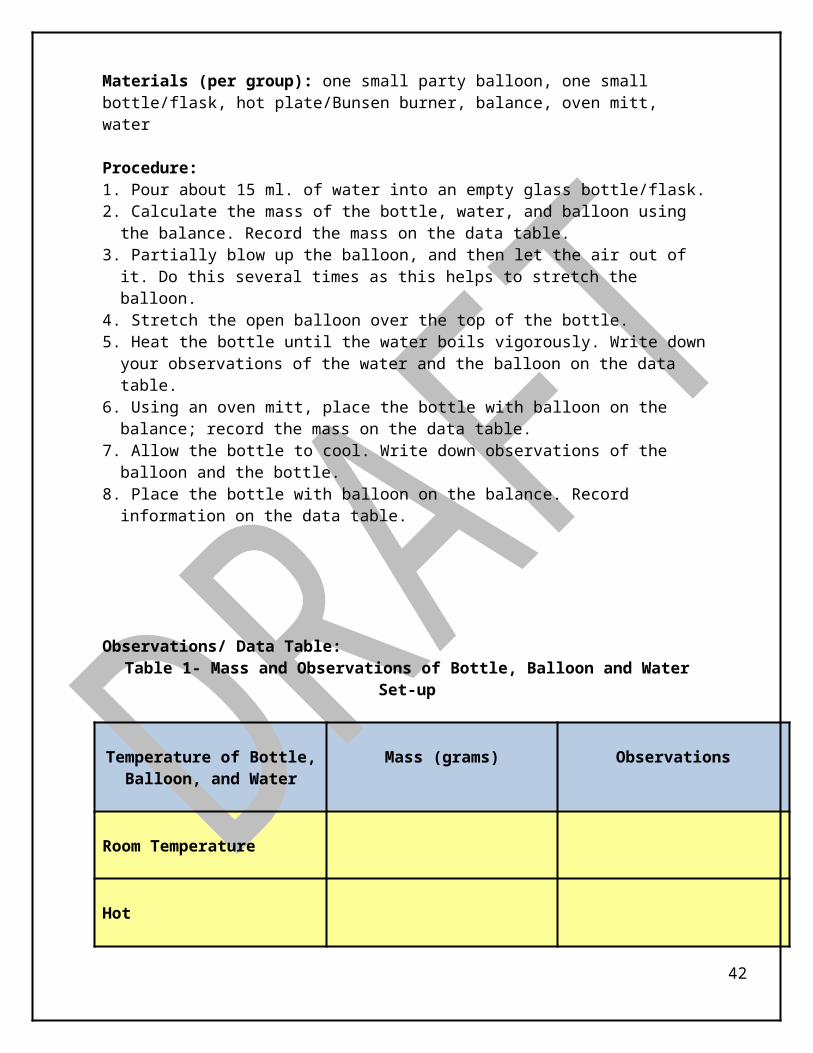
Materials (per group): one small party balloon, one small bottle/flask, hot plate/Bunsen burner, balance, oven mitt, water
Procedure:1. Pour about 15 ml. of water into an empty glass bottle/flask.2. Calculate the mass of the bottle, water, and balloon using the balance. Record the
mass on the data table.3. Partially blow up the balloon, and then let the air out of it. Do this several times as
this helps to stretch the balloon.4. Stretch the open balloon over the top of the bottle.5. Heat the bottle until the water boils vigorously. Write down your observations of the
water and the balloon on the data table.6. Using an oven mitt, place the bottle with balloon on the balance; record the mass
on the data table.7. Allow the bottle to cool. Write down observations of the balloon and the bottle.8. Place the bottle with balloon on the balance. Record information on the data table.
32

Observations/ Data Table:Table 1- Mass and Observations of Bottle, Balloon and Water Set-up
Temperature of Bottle, Balloon, and Water
Mass (grams) Observations
Room Temperature
Hot
Cool
Observations/ Data Analysis:1. What do you think caused the balloon to expand?_______________________________________________________________________________________________________________
2. What is happening inside the balloon that is causing this to happen? ___________________
3. How does adding heat affect the liquid water?__________________________________________________________________________________________________________________4. Why do you think the balloon was pulled into the bottle? What is happening outside the balloon that is causing this to happen?__________________________________________________________________________________________________________________________5. What did you observe inside the bottle as it cooled?_________________________________ 6. What is happening to particles inside the balloon? Are they moving? How are they moving? ________________________________________________________________________________________________________________________________________________________
Results/ Conclusion
33
1. How did this experiment demonstrate water changing from liquid to gas?________________
____________________________________________________________________________
2. What would have happened if the bottle were placed in the freezer? ______________________________________________________________________________________________
3. Sketch a model of the water molecules in liquid state in the flask and in gas state in the flask and balloon.
34
STUDENT HANDOUT
DIFFERENTIATED INSTRUCTION: OPEN INQUIRY
TEMPERATURE CHANGES EVERYTHING
Objectives/Purpose: Explain how adding or removing heat from a system may result in a change in
temperature or a change of state. Predict how heat will flow in a system i.e. from warmer to cooler until they reach
the same temperature..Demonstrate Achievement of the following Goals: Develop a problem statement based on the concept of heat being added or being
removed from a system (think carefully about the impact of those changes on the system.)
State your hypothesis. Design an experiment to test your hypothesis. Carry out the experiment you designed. Submit a completed lab report to your teacher. Use the “Claim, Evidence & Reasoning” rubric to defend your claims when
writing your conclusion.
35
Teacher (Topic II- Heat Energy)
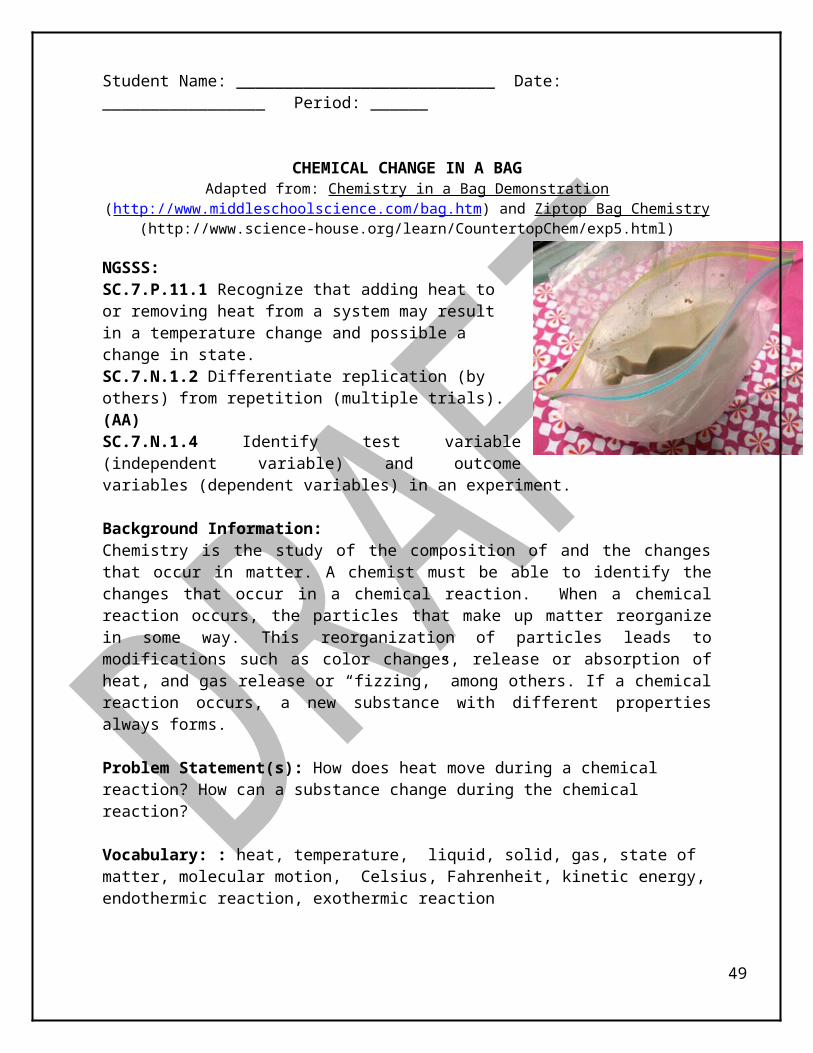
CHEMICAL CHANGE IN A BAGAdapted from: Chemistry in a Bag Demonstration
(http://www.middleschoolscience.com/bag.htm) and Ziptop Bag Chemistry (http://www.science-house.org/learn/CountertopChem/exp5.html)
NGSSS:SC.7.P.11.1 Recognize that adding heat to or removing heat from a system may result in a temperature change and possible a change in state.SC.7.N.1.2 Differentiate replication (by others) from repetition (multiple trials). (AA)SC.7.N.1.4 Identify test variable (independent variable) and outcome variables (dependent variables) in an experiment.
Purpose of the Lab/Activity: Describe physical changes. Identify when a chemical change has taken place. Compare/contrast physical and chemical changes. Measure changes in temperature. Compare endothermic and exothermic reactions.
Prerequisites: Adding heat or removing heat from a system may result in a temperature change. Adding heat or removing heat may result in a change of state. Physical changes are reversible. Chemical changes are not reversible and yield new
substances. Some chemical reactions release heat, while others absorb heat.
Materials:
Materials per lab group 4 Ziploc bags 2 plastic spoons 1 0o-100o C thermometer 2 tbsp. calcium chloride 2 tbsp. sodium hydrogen
carbonate 1 test tube 30 mL indicator solution
(phenol red/ phenolphthalein)
Materials for Teacher’s
Matches and wooden splint
Substitute Materials 2 tbsp. Damp Rid (calcium chloride) 2 tbsp. baking soda (sodium hydrogen carbonate) 1 small paper cup
36

30 mL red cabbage juice
Before activity
What the teacher will do: Engage:Chemical reactions happen all around us. Can you name some chemical reactions that we observe in our everyday lives?
During activity
What the teacher will do:1. Form groups of 3-4 students.2. For part 1 of the activity, place 2 tsp. of sodium hydrogen carbonate
(NaHCO3) to a Ziploc bag for each group.3. For part 2 of the activity, place 2 tsp. of calcium chloride (CaCl2 ) to a
second Ziploc bag.4. For part 3, place 2 tsp. of sodium hydrogen carbonate (NaHCO3) into a
third Ziploc bag. After, place 2 tsp. of calcium chloride (CaCl2) into the third Ziploc bag.
5. Observe students as the phenol red is added to the Ziploc bags.6. Facilitate the observations and completion of data writing for the activities
by asking questions. After activity
What the teacher will do:1. After a class discussion about the changes in the three bags, light a match. 2. Light the splint with the match.3. Hold the third bag, open it, and quickly place the burning splint into the bag.4. Ask students to describe what happened during this demonstration. NOTE:You might want to double the bags. Small tears in the bag might occur. The third bag may burst; it gets pretty full and tight. The flame will go out (even though the kids hope for a huge explosion) and you can have them guess why it went out.The phenolphthalein turns pink in a base and clear for an acid or neutral substance.Cabbage juice will turn greenish blue for a base, purplish for neutral, and pink for acid.Some students are afraid of matches or have never used them before. Advise them regarding the safety procedures pertaining to the use of matches.
Cautions! Do not do a flame test for bags 1 and 2. It will ignite. Phenolphthalein is flammable.
Extension: Develop a problem statement based on the concept of heat being added or being
removed from a system using the materials provided (think carefully about the impact of those changes on the system.)
State your hypothesis. Design an experiment to test your hypothesis. Carry out the experiment you designed. Submit a completed lab report to your teacher. Use the “Claim, Evidence & Reasoning” rubric to defend your claims when writing
your conclusion.37

Student Name: ___________________________ Date: _________________ Period: ______
CHEMICAL CHANGE IN A BAGAdapted from: Chemistry in a Bag Demonstration (http://www.middleschoolscience.com/bag.htm) and Ziptop Bag Chemistry (http://www.science-house.org/learn/CountertopChem/exp5.html)
NGSSS:SC.7.P.11.1 Recognize that adding heat to or removing heat from a system may result in a temperature change and possible a change in state.SC.7.N.1.2 Differentiate replication (by others) from repetition (multiple trials). (AA)SC.7.N.1.4 Identify test variable (independent variable) and outcome variables (dependent variables) in an experiment.
Background Information: Chemistry is the study of the composition of and the changes that occur in matter. A chemist must be able to identify the changes that occur in a chemical reaction. When a chemical reaction occurs, the particles that make up matter reorganize in some way. This reorganization of particles leads to modifications such as color changes, release or absorption of heat, and gas release or “fizzing,” among others. If a chemical reaction occurs, a new substance with different properties always forms.
Problem Statement(s): How does heat move during a chemical reaction? How can a substance change during the chemical reaction?
Vocabulary: : heat, temperature, liquid, solid, gas, state of matter, molecular motion, Celsius, Fahrenheit, kinetic energy, endothermic reaction, exothermic reaction
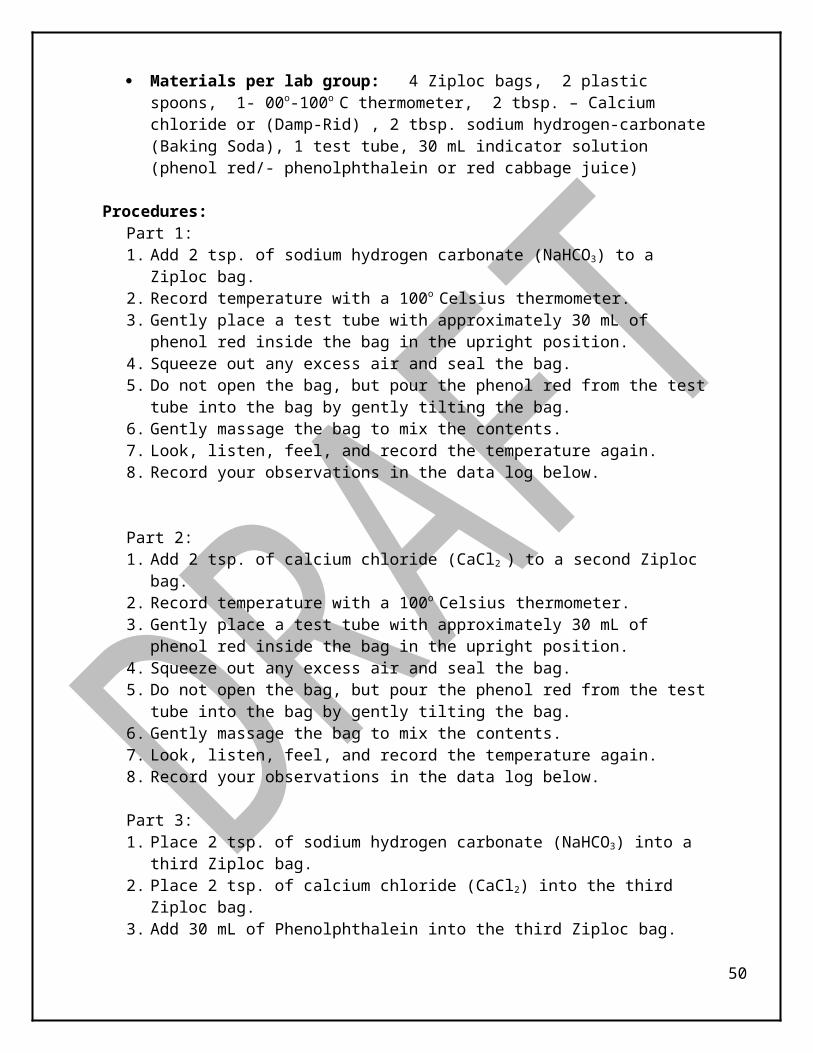
Materials per lab group: 4 Ziploc bags, 2 plastic spoons, 1- 00o-100o C thermometer, 2 tbsp. – Calcium chloride or (Damp-Rid) , 2 tbsp. sodium hydrogen-carbonate (Baking Soda), 1 test tube, 30 mL indicator solution (phenol red/- phenolphthalein or red cabbage juice)
Procedures: Part 1:1. Add 2 tsp. of sodium hydrogen carbonate (NaHCO3) to a Ziploc bag.2. Record temperature with a 100o Celsius thermometer.3. Gently place a test tube with approximately 30 mL of phenol red inside the bag
in the upright position. 4. Squeeze out any excess air and seal the bag. 5. Do not open the bag, but pour the phenol red from the test tube into the bag by
gently tilting the bag.6. Gently massage the bag to mix the contents. 7. Look, listen, feel, and record the temperature again. 8. Record your observations in the data log below.
38

Part 2: 1. Add 2 tsp. of calcium chloride (CaCl2 ) to a second Ziploc bag.2. Record temperature with a 100o Celsius thermometer. 3. Gently place a test tube with approximately 30 mL of phenol red inside the bag
in the upright position.4. Squeeze out any excess air and seal the bag. 5. Do not open the bag, but pour the phenol red from the test tube into the bag by
gently tilting the bag.6. Gently massage the bag to mix the contents. 7. Look, listen, feel, and record the temperature again.8. Record your observations in the data log below.
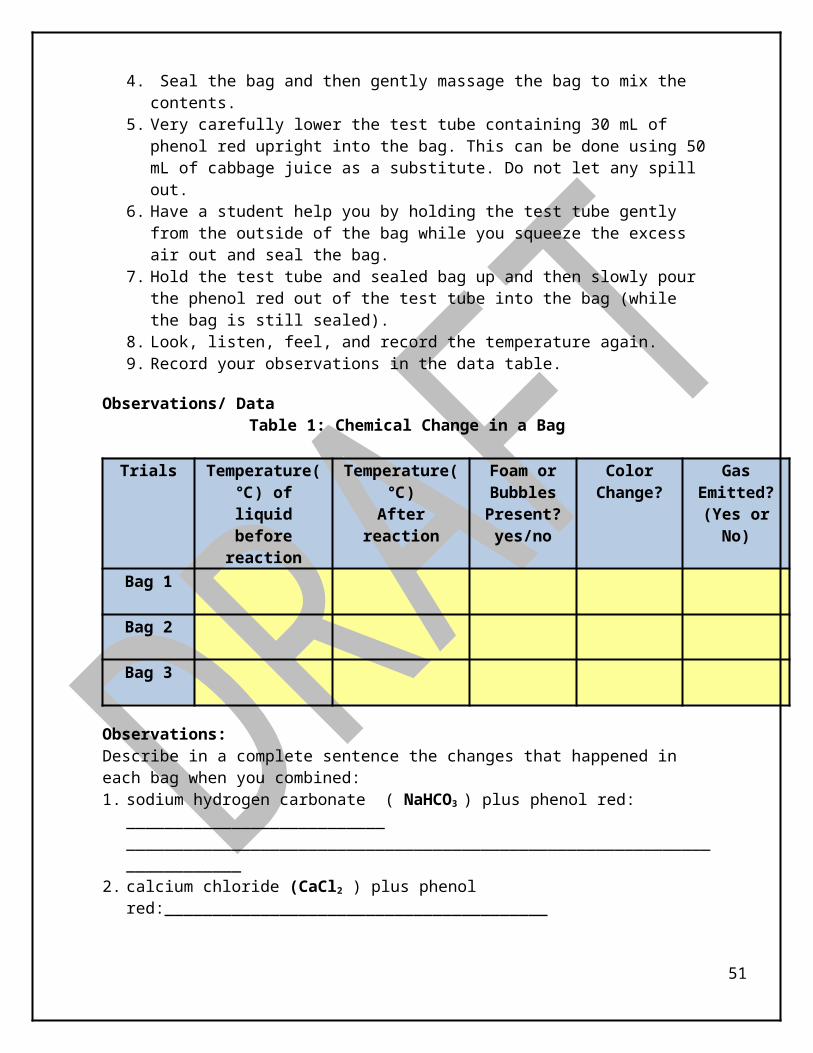
Part 3: 1. Place 2 tsp. of sodium hydrogen carbonate (NaHCO3) into a third Ziploc bag.2. Place 2 tsp. of calcium chloride (CaCl2) into the third Ziploc bag.3. Add 30 mL of Phenolphthalein into the third Ziploc bag. 4. Seal the bag and then gently massage the bag to mix the contents.5. Very carefully lower the test tube containing 30 mL of phenol red upright into
the bag. This can be done using 50 mL of cabbage juice as a substitute. Do not let any spill out.
6. Have a student help you by holding the test tube gently from the outside of the bag while you squeeze the excess air out and seal the bag.
7. Hold the test tube and sealed bag up and then slowly pour the phenol red out of the test tube into the bag (while the bag is still sealed).
8. Look, listen, feel, and record the temperature again. 9. Record your observations in the data table.
Observations/ DataTable 1: Chemical Change in a Bag
Trials Temperature(℃) of liquid
before reaction
Temperature(℃)
After reaction
Foam or BubblesPresent?
yes/no
Color Change?
Gas Emitted?
(Yes or No)
Bag 1
Bag 2
Bag 3
Observations: Describe in a complete sentence the changes that happened in each bag when you combined: 1. sodium hydrogen carbonate ( NaHCO3 ) plus phenol red:
___________________________
39
_________________________________________________________________________
2. calcium chloride (CaCl2 ) plus phenol red:_________________________________________________________________________________________________________________
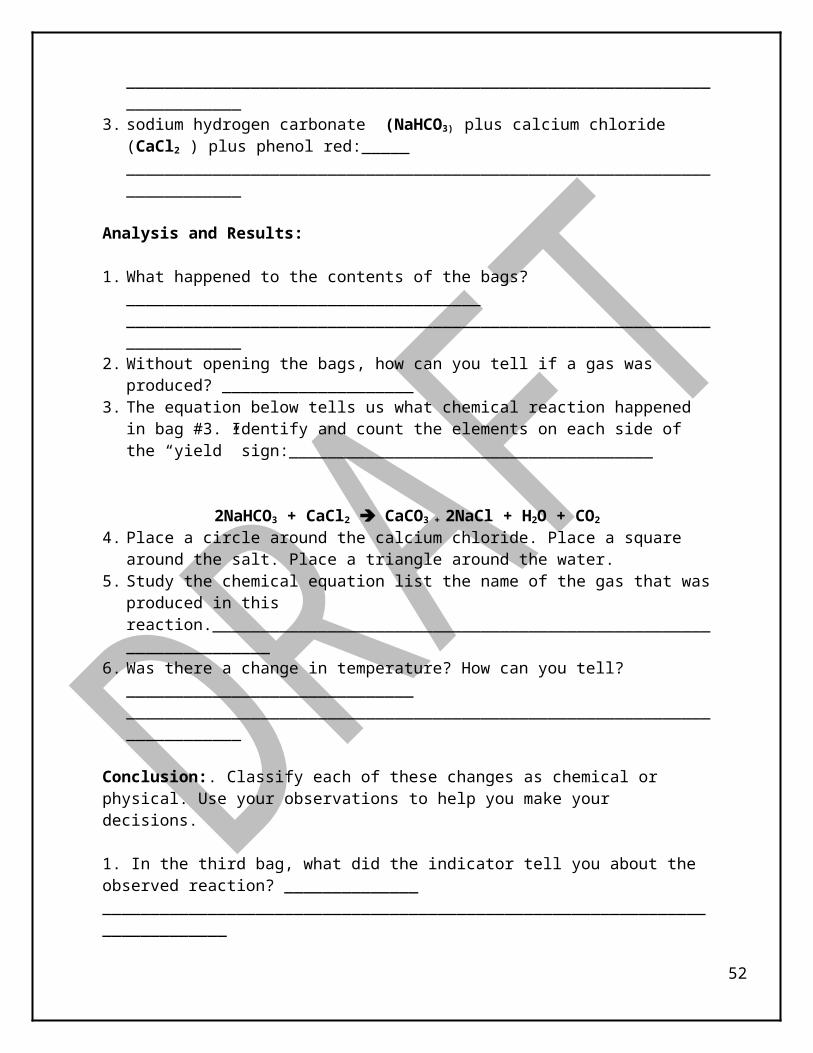
3. sodium hydrogen carbonate (NaHCO3) plus calcium chloride (CaCl2 ) plus phenol red:______________________________________________________________________________
Analysis and Results:
1. What happened to the contents of the bags? ______________________________________________________________________________________________________________
2. Without opening the bags, how can you tell if a gas was produced? ____________________
3. The equation below tells us what chemical reaction happened in bag #3. Identify and count the elements on each side of the “yield” sign:______________________________________
2NaHCO3 + CaCl2 CaCO3 + 2NaCl + H2O + CO2
4. Place a circle around the calcium chloride. Place a square around the salt. Place a triangle around the water.
5. Study the chemical equation list the name of the gas that was produced in this reaction.___________________________________________________________________
6. Was there a change in temperature? How can you tell?_______________________________________________________________________________________________________
Conclusion:. Classify each of these changes as chemical or physical. Use your observations to help you make your decisions.
1. In the third bag, what did the indicator tell you about the observed reaction? ______________ ____________________________________________________________________________2. Which was an endothermic reaction? Which was endothermic? Explain your answers.Endothermic: _________________________________________________________________Exothermic: __________________________________________________________________
40

____________________________________________________________________________
41
STUDENT HANDOUT
DIFFERENTIATED INSTRUCTION: OPEN INQUIRY
CHEMICAL CHANGE IN A BAG
Objectives/Purpose: Describe physical changes. Identify when a chemical change has taken place. Compare/contrast physical and chemical changes. Measure changes in temperature. Compare endothermic and exothermic reactions.
.Demonstrate Achievement of the following Goals: Develop a problem statement based on the concept of heat being added or being
removed from a system using the materials provided (think carefully about the impact of those changes on the system.)
State your hypothesis. Design an experiment to test your hypothesis. Carry out the experiment you designed. Submit a completed lab report to your teacher. Use the “Claim, Evidence & Reasoning” rubric to defend your claims when
writing your conclusion.
42

Teacher (Topic III- Conservation of Energy and Energy Transformations)
Stations: Energy Transformations NGSSS:SC.7.P.11.2 Investigate and describe the transformation of energy from one form to another. (AA)SC.7.P.11.3 Cite evidence to explain that energy cannot be created nor destroyed, only changed from one form to another.
Purpose of the Lab/ Activity:Investigate and describe the transformation of energy from one form to another.
Prerequisites: The amount of energy that is present before and after work is the same. Energy is conserved. Energy can neither be created nor destroyed; it can only be converted from one
form to another. The amount of energy in a closed system remains constant.
Materials (per group) Wire Batteries Battery Holders Light bulb sockets Small light bulbs Solar cells Mini Fans Hot plate Wax Small Pan Rubber Ball Ruler
Procedures: Day of Activity:
Before activity
What the teacher will do:1. ENGAGE:
Ask students to explain energy transformation. Have students identify examples of energy transformations in their daily lives.
2. Prepare each station with necessary materials. 3. Explain the directions for each lab station to the students.
Directions: Complete each activity at each lab station and answer all the questions before moving on to the next part. Identify the energy transformation that is occurring in each activity.
During activity
What the teacher will do:1. Form groups of 3-4 students.
43

2. Prepare each station with the materials for students3. Allow groups to remain at each station for 15-20 minutes4. Conduct a rotation of the lab stations.5. Walk about the groups as they perform the activities. Ask higher order
thinking questions.6. Facilitate the observations and completion of data writing for the
activities by asking questions.After activity
What the teacher will do:Elaborate:
1. Direct students to identify and explain energy transformations that occur in the real world.
Extension:1. Facilitate the following extension activity:
Develop a problem statement based on the concept that different forms of energy may change but nothing is created or destroyed.
State your hypothesis. Design an experiment to test your hypothesis. Carry out the experiment you designed. Submit a completed lab report to your teacher. Use the “Claim, Evidence & Reasoning” rubric to defend your claims when writing
your conclusion.
44

Student Name: ___________________________ Date: _________________ Period: ______
Stations: Energy Transformations
NGSSS:SC.7.P.11.2 Investigate and describe the transformation of energy from one form to another. (AA)SC.7.P.11.3 Cite evidence to explain that energy cannot be created nor destroyed, only changed from one form to another.
Background Information: The laws of thermodynamics are very important not just to scientists but also in our everyday lives. The first law of thermodynamics explains that the amount of energy that is present before and after work is the same. Energy is conserved. For example, if you drop a ball, scientists are able to measure the energy before, during, and after the fall. The amount of energy remains constant throughout the procedure. Similarly, when a ball is thrown or a spring released or a match is burned, the energy can be measured. This is the reason behind the first law of thermodynamics: “Energy can neither be created nor destroyed; it can only be converted from one form to another.” Scientists have found that the amount of energy in a closed system remains constant.
Problem Statement: How does energy transfer during different types of movement?
Vocabulary: : energy, heat, scientific law, kinetic energy, potential energy, conservation, temperature, conduction, convection, radiation, thermal, radiant, chemical, mechanical, transformation
Materials: Wire, Batteries, Battery-holders, light-bulb sockets, Small light bulbs, Solar cells, Mini-fans, Hot-plate, Wax, Small Pan, Rubber ballProcedures:
Lab 1:
Directions: 1) Rub your hands together, gradually picking up the speed.
HOT Questions:1) Identify the types of energies that you used to rub your hands together.2) Identify the type of energy that was given off from your hands.3) If you rub your hands faster or slower, how does this affect the result?4) Complete an energy transformation flow chart for this activity
Lab 2:
Directions1) Connect one wire to one of the battery springs.2) Connect the second wire to the second battery spring3) Put one wire at the bottom of the light bulb
45

4) Put the second wire on the side of the light bulb
HOT Questions:1) Describe what happened when you connected the battery, wires and light
bulb.____________________________________________________________________
2) Identify the type of energy in the battery.____________________________________
3) How was the energy converted to light and heat?_________________________________________________________________________________________________
4) Complete an energy transformation flow chart for this activity________________________________________________________________________________________
Lab 3:
Directions1) Connect one wire to a solar cell.2) Connect that wire to the mini-fan3) Connect the second wire attached to the fan to the solar cell.4) Take materials outside to expose the solar cell to the sun.5) Keep your hands out of the way of the fan blades!
HOT Questions:1) What happened when you connected the solar cell, wires and fan?
_______________2) What type of energy do you start with in the solar cell?
_________________________3) How does the energy transform from the wires to the fan?
__________________________________________________________________________________________
4) Complete an energy transformation flow chart for this activity.____________________________________________________________________
Lab 4:
Directions1) Do three jumping jacks.
HOT Questions:1) Identify the type of energy within the food you have eaten
today._____________________________________________________________________________________
46

2) Explain the type of energy that it converts to when you do the jumping jacks.___________________________________________________________________________
3) If you ate more crackers, how would this affect the amount of jumping jacks you could do? Explain your answer and how it relates to the Law of Conservation of Energy.____________________________________________________________________ ____________________________________________________________________
4) Complete an energy transformation flow chart for this activity.____________________________________________________________________
Lab 5:
Directions:1) Plug in the hot plate.2) Turn the dial to hot.3) Place the scented wax in a pot and place on the hot plate.4) Watch for one minute.
HOT Questions:1) Identify the type of energy from the
outlet.__________________________________2) Describe how the energy changed the state of the
wax.________________________3) Complete and energy transformation flow chart for this activity._______________________________________________________________________
Lab 6:
Directions: 1) Have one group member hold the bouncy ball at his or her waist.2) Measure the height of his or her waist from the floor with the ruler. 3) Drop the ball and have another group member measure the height it
bounces back up to.
HOT Questions:1) What is the height of your team members’ waist/the original drop height?
__________2) What was the final bounce back height?
____________________________________3) Complete an energy transformation flow chart for this activity.
____________________________________________________________________
47
Conclusion: Explain how the Law of Conservation of Energy applies to each of these activities.________________________________________________________________________________________________________________________________________________________________________________________________________________________________________________________________________________________________________________
48
DIFFERENTIATED INSTRUCTION: OPEN INQUIRY
ENERGY TRANSFORMATIONS
Objectives/Purpose: The student will demonstrate understanding by designing a complex drawing
demonstrating more than one form of energy transformation. The student will explain the differences in various forms of energy. The students will demonstrate that certain forms of energy require more energy
Demonstrate Achievement of the following Goals: Develop a problem statement based on the concept that different forms of energy
may change but nothing is created or destroyed. State your hypothesis. Design an experiment to test your hypothesis. Carry out the experiment you designed. Submit a completed lab report to your teacher. Use the “Claim, Evidence & Reasoning” rubric to defend your claims when
writing your conclusion.
49
Teacher (Topic IV- Electromagnetic Spectrum)
SOLAR ENERGY VS. COLORAdapted from Sharon Goldblatt Greco Middle School Project CLASS
NGSSS:SC.7.P.10.2 The student observes and explains that light can be reflected, refracted, and absorbed. SC.7.P.11.2 Investigate and describe the transformation of energy from one form to another. (AA)SC.7.P.11.3 Cite evidence to explain that energy cannot be created nor destroyed, only changed from one form to another. SC.7.P.11.4 Observe and describe that heat flows in predictable ways, moving from warmer objects to cooler ones until they reach the same temperature. (AA)SC.7.N.1.1 Define a problem from the seventh grade curriculum, use appropriate reference materials to support scientific understanding, plan and carry out scientific investigation of various types, such as systematic observations or experiments, identify variables, collect and organize data, interpret data in charts, tables, and graphics, analyze information, make predictions, and defend conclusions. SC.7.N.1.3 Distinguish between an experiment (which must involve the identification and control of variables) and other forms of scientific investigation and explain that not all scientific knowledge is derived from experimentation. SC.7.N.1.4 Identify test variables (independent variables) and outcome variables (dependent variables) in an experiment.
Purpose of the Lab/ Activity: The student will demonstrate the efficiency of a solar collector is based on its
design and color selection. The student will explain the different temperatures obtained in various solar
collectors. The students will demonstrate that certain materials absorb solar energy better
than others while certain colors reflect more energy than others. The students will identify variables in a solar energy-collection investigation.
Prerequisites: Light behaves in three ways- reflection, refraction, and absorption. Light moves directly through translucent materials. Light bends as it moves through materials of different states. Light is absorbed within opaque materials.
Materials (per group): pieces of construction paper (recommended size 12cm by 16cm)
colors- white, black, gray, brown Celsius thermometers tape stop watch
50
Procedures: Day of ActivityBefore activity
What the teacher will do:
Engage: Give your students the scenario below as employees of DOE or home owners and have them brain storm how to create a lab and collect data to help resolve the following situation:
To Whom it may concern at the Department of Energy,I am putting a new roof on my house and want to make it energy efficient. I live in southern Florida and have tried to find out about what roof colors will absorb the least amount of heat. I believe that white is best, but white doesn't go with our house color. Also, the builders in this region of the country are not at all concerned with energy conservation. They have been of no help. What color choice would be best a brown roof or medium grey or can you suggest another color?
During activity
What the teacher will do:7. Form groups of 3-4 students.8. Demonstrate for students to make a hamburger style pocket using
construction paper.9. Facilitate the collection of materials and set up of materials by students.
This activity may be performed indoors using a window sill or outdoors. 10. Walk about the groups as students conduct their labs and ask students
higher order thinking questions.11. Facilitate the observations and completion of data writing for the
activities by asking questions.After activity
What the teacher will do:Elaboration: Ask students the following question: Explain why dark colored clothing is worn in the winter and light colored clothing is worn in the summer!
Extension: 1. Facilitate open inquiry based on the concept that certain colors absorb
more solar energy than others using the materials provided. Develop a problem statement based on the concept that certain colors absorb
more solar energy than others using the materials provided. State your hypothesis. Design an experiment to test your hypothesis. Carry out the experiment you designed. Submit a completed lab report to your teacher. Use the “Claim, Evidence & Reasoning” rubric to defend your claims when
writing your conclusion.
51
Student Name: ___________________________ Date: _________________ Period: ______
SOLAR ENERGY VS. COLORHow does color affect how much solar energy is absorbed?
Adapted from Sharon Goldblatt Greco Middle School Project CLASS
NGSSS:SC.7.P.10.2 The student observes and explains that light can be reflected, refracted, and absorbed. SC.7.P.11.2 Investigate and describe the transformation of energy from one form to another. (AA)SC.7.P.11.3 Cite evidence to explain that energy cannot be created nor destroyed, only changed from one form to another. SC.7.P.11.4 Observe and describe that heat flows in predictable ways, moving from warmer objects to cooler ones until they reach the same temperature. (AA)SC.7.N.1.4 Identify test variables (independent variables) and outcome variables (dependent variables) in an experiment.
Background: In order to utilize solar energy, a solar collector is necessary. A solar collector allows sunlight inside the devise which then absorbs the sunlight. The color of the collector has drastic impact on the amount of sunlight that it collects. Darker solar collectors are more effective in absorbing sunlight than lighter solar collectors. For this reason, solar collectors are commonly black, dark blue and dark red.
Problem Statement: How does color affect how much solar energy is absorbed within a solar collector?
Vocabulary: wave, thermal energy, temperature, radiation, medium/media, wave speed, reflection, refraction, absorption, experiment, investigation, model, observation, replication, variable
Hypothesis: ______________ color will absorb the most thermal energy.
Materials per group: pieces of construction paper (recommended size 12cm by 16cm) suggested
colors- white, black, gray, brown, Celsius thermometers, tape, stop watch
Procedures: 1. Fold each sheet of construction paper hamburger style and tape on 2
sides to make a pocket
2. Place one thermometer in the center of each paper pocket.3. Place the four paper pockets in a row on cement (what most homes in
South Florida are constructed) 4. Place one thermometer on the cement surface without any construction paper.
52

5. Make sure all of the thermometers are exposed to the light equally and can be read easily.
6. Take the temperature then every 5 minutes for 25 minutes.
Observations/ Data 1. On a separate sheet of paper, create a data table and graph your results.
Observations/ Data Analysis:2. Discuss why there was a thermometer without construction
paper._________________________________________________________________________________________
3. What color construction paper did you select as your hypothesis and why?___________________________________________________________________________________
4. Discuss the findings of your experiment.______________________________________________________________________________________________________________
5. List the colors in order of most to least absorption.______________________________________________________________________________________________________
6. List the colors in order of most to least reflection. _______________________________________________________________________________________________________
Conclusion7. Would you want your roof to absorb a high or low amount of thermal energy?
_______________________________________________________________________________
8. Would you want your roof to reflect a high or low amount of thermal energy?________________________________________________________________________________
9. Follow the energy transformations from the Sun to your thermometer._____________________________________________________________________________________
10.Discuss the benefits to the homeowner be of having a roof that is low absorption and high reflection? Which colors would this be in our experiment?______________________________________________________________________________________________
53

11.Discuss the drawbacks to the homeowner having a roof that would be high in absorption and low in reflection? Which colors would this be in our experiment?______________________________________________________________________________________
12.Based on this investigation, what observations support the statement: heat flows from warmer objects to cooler objects?_________________________________________________________________________________________________________________
54

STUDENT HANDOUT
DIFFERENTIATED INSTRUCTION: OPEN INQUIRY
SOLAR ENERGY VS COLOR
Objectives/Purpose: The student will demonstrate the efficiency of a solar collector is based on its
design and color selection. The student will explain the different temperatures obtained in various solar
collectors. The students will demonstrate that certain colors of materials absorb solar
energy better than others while other colors reflect more energy than others. The students will identify variables in a solar energy-collection investigation.
Demonstrate Achievement of the following Goals: Develop a problem statement based on the concept that certain colors absorb
more solar energy than others using the materials provided. State your hypothesis. Design an experiment to test your hypothesis. Carry out the experiment you designed. Submit a completed lab report to your teacher. Use the “Claim, Evidence & Reasoning” rubric to defend your claims when
writing your conclusion.
55
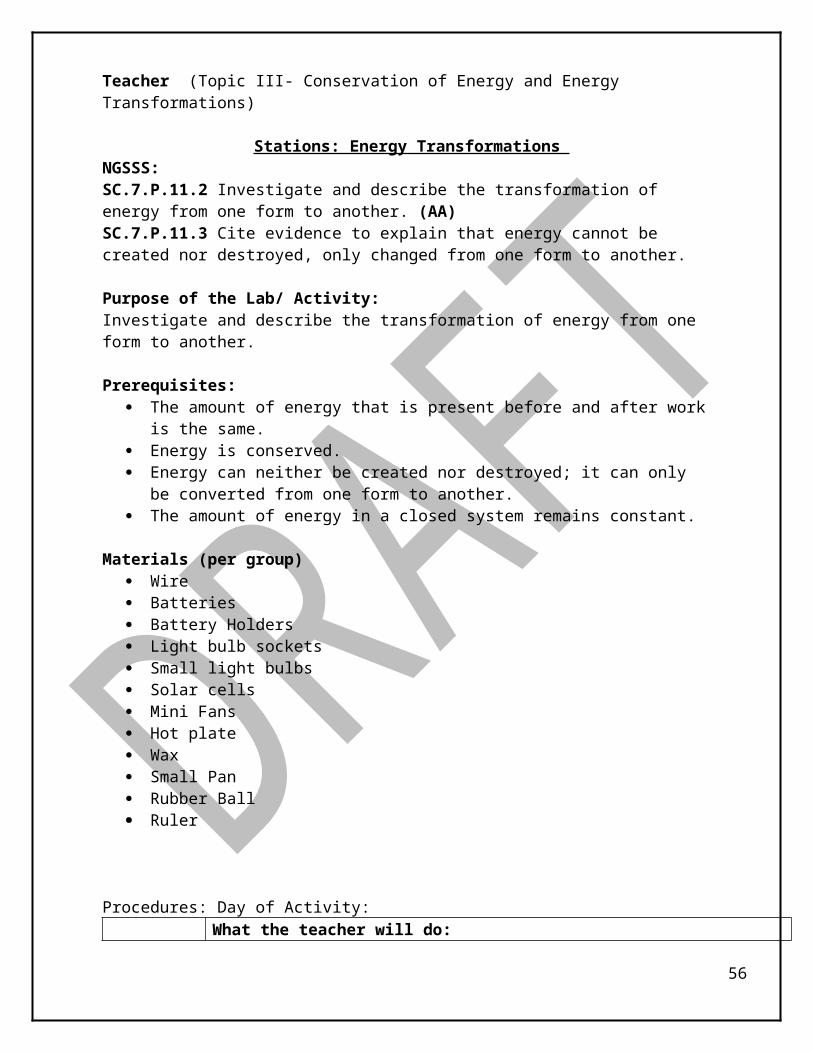
TEACHER (Topic V- Properties of Waves)
WAVE SPEED
NGSSS:SC.7.P.10.3 The student recognizes that light waves, sound waves, and other waves move at different speeds in different materials. (AA)SC.7.N.1.3 Distinguish between an experiment (which must involve the identification and control of variables) and other forms of scientific investigation and explain that not all scientific knowledge is derived from experimentation. (Assessed as SC.8.N.1.1)SC.7.N.1.4 Identify test variables (independent variables) and outcome variables (dependent variables) in an experiment. (Assessed as SC.8.N.1.1)
Purpose of the Lab/ Activity: The student will be able to compare the speeds of two
different waves. The student will determine that wave speed does affect the speed of ships.
Prerequisites: Light waves and sound waves travel at different speeds in different material. Light travels fastest through gas, travels slower through liquids, and slowest
through solids. Sound travels fastest through solids, travels slower through liquids, and slowest
through gas.
Materials: (per group) 2-Liter clear plastic bottles with caps (remove label) metric ruler stop watch water Grease pencil/permanent marker oil
Procedures: Day of Activity:Before activity
What the teacher will do: Engage:
Start class with clip from deadliest catch http://science.howstuffworks.com/rogue-wave.htm
Discuss waves. What are some examples of waves? What travels in waves? What are the different mediums that waves travel in? Discuss and define with students the terms frequency, wavelength,
trough, and crest. Have students draw a diagram labeling the crest, wavelength and trough.
56
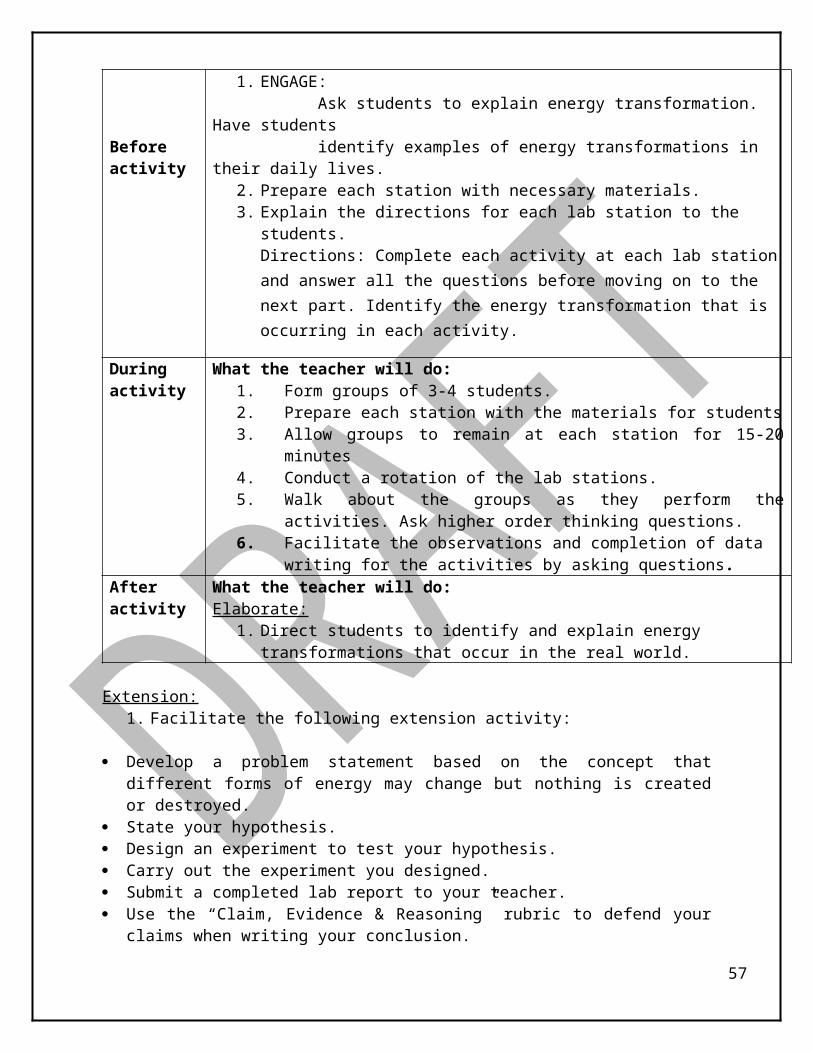
During activity
What the teacher will do:12. Form groups of 3-4 students.13. Facilitate the collection of materials by students.14. Walk about the groups as students conduct their labs. Ask higher
order thinking questions.15. Facilitate the observations and completion of data writing for the
activities by asking questions.After activity
What the teacher will do:Elaboration: The faster the waves move, the faster a ship traveling in the same direction as the waves, will reach its destination.
1. Read the article at (science.howstuffworks.com/rogue-wave2.htm).2. Allow students in groups to discuss their findings.3. Real world application: In a thunder storm, do you hear the thunder before, after, or at the same
times as you see the lightening? In air, does light travel faster than sound. Some of the same material/medium have different waves.
When you are in a room and there is a noise, do you know where it is coming from?
If you are in the ocean/pool swimming under water and you hear a noise, do you know where it is coming from? Why or why not? Discussion: Sound travels faster in water than in air!
Extension: 2. Facilitate the following extension activity.
Develop a problem statement based on the concept that different forms of energy may change but nothing is created or destroyed.
State your hypothesis. Design an experiment to test your hypothesis. Carry out the experiment you designed. Submit a completed lab report to your teacher. Use the “Claim, Evidence & Reasoning” rubric to defend your claims when writing
your conclusion.
57
Student Name: ___________________________ Date: _________________ Period: ______
WAVE SPEED
NGSSS:SC.7.P.10.3 The student recognizes that light waves, sound waves, and other waves move at different speeds in different materials. (AA)SC.7.N.1.3 Distinguish between an experiment (which must involve the identification and control of variables) and other forms of scientific investigation and explain that not all scientific knowledge is derived from experimentation. SC.7.N.1.4 Identify test variables (independent variables) and outcome variables (dependent variables) in an experiment.
Problem Statements: How does the material/medium affect the speed (frequency) of waves? What is the relationship between depth of water and wave speed?
Vocabulary: wave, energy, medium/media, wave speed, experiment, investigation, model, observation, replication, variable
Materials: (per group) 2-Liter clear plastic bottles with caps (remove label), metric ruler, stop watch,
water, Grease pencil/permanent marker, oil
Procedures- Part 1:1. Label two plastic bottles, Bottle 1 and Bottle 2.2. Fill bottle 1 with water to a depth of 5 cm. Fill Bottle 2 with oil to the same
depth. Replace the top on each bottle. Close the bottles tightly. (This can be done ahead of time to save class time or an opportunity to allow more time for discussion of constants and variables).
3. Lay each bottle on its side on a flat table. Allow the bottles to sit undisturbed until the water stops moving.
4. Measure the height of your water/oil in each bottle from the surface of each table. Record your observations.
5. Lift both bottles 3cm from the surface of the table at the same time. Count the number of waves you see in 20 seconds.
6. Repeat step number five for a total of five (5) trials.7. Record the data in the table below.
Observations and Data:Height Number of Waves
Trial 1 Trial 2 Trial 3 Trial 4 Trial 5OilWater
58

Procedures- Part 2
1. Label two 2-liter plastic bottles, Bottle 1 and Bottle 2.2. Fill bottle 1 with water to a depth of 10 cm. Fill Bottle 2 with water to a depth of
30 cm. Replace the top on each bottle. Close the bottles tightly.3. Lay each bottle on its side on a flat table. Allow the bottles to sit undisturbed
until the water stops moving.4. Measure the height of your water in each bottle from the surface of each table.
Record your observations.5. Lift both bottles 3cm from the surface of the table at the same time. Count the
number of waves you see in 20 seconds.6. Repeat step number five for three trials.
Observations and Data:Height Number of Waves
Trial 1 Trial 2 Trial 3 Trial 4 Trial 5Bottle 1Bottle 2
Result/ Conclusion:
1. What are the different materials/mediums in each bottle? _________________________
2. How can you calculate the speed (frequency) of the waves_______________________________________________________________________________________________
3. What can you conclude from analyzing your data?______________________________________________________________________________________________________
4. Compare the speed of the waves produced inside Bottle 1 with the speed of the waves in Bottle 2. _______________________________________________________________
5. Identify the relationship of the material/medium to that of speed of waves. _________________________________________________________________________________
6. Relate how the speed of waves moves in different material/medium to a real world application.___________________________________________________________________________________________________________________________________
59
______________________________________________________________________
60

Literature Connection: How Rogue Waves Workby Ed Grabianowski
Browse the article How Rogue Waves WorkIntroduction to How Rogue Waves Work
During the second season of "Deadliest Catch," a documentary television series about crab fishing in Alaska's Bering Sea, cameras recorded footage of a giant wave striking the ship "Aleutian Ballad." The 60-foot (18-meter) wave rolled the boat onto its side and caused significant damage, though fortunately none of the crew was seriously hurt. The Ballad limped back to port for repairs. The footage captures the suddenness of the massive wave, and just before the impact sends the camera operator tumbling, the "wall of water" breaking over the boat can be seen with frightening clarity.
Waves Image Gallery
Photo courtesy National Weather ServiceA 60-foot rogue wave moves away after hitting a
tanker off Charleston, S.C. See more pictures of waves.
What was this colossal wave that appeared seemingly out of nowhere? It was a rogue wave. Rogue waves sound like something straight out of a sailor's tall tale: ominous, mysterious, solitary waves of enormous height crashing down on ships at sea in seemingly calm waters. But as improbable as they might seem, recent studies suggest these rogues are more common than anyone previously guessed.
Imagine having an 80-foot wall of water barreling toward you. Actually, that might be too tall an order. It's easy to throw around heights like 50 feet or 90 feet without really grasping how huge a wave of such height would be. Here are some handy comparisons:
The average room in your house is probably about 8 feet high. A typical two-story house is between 20 and 30 feet high.
61

The Statue of Liberty is 111 feet tall from her toes to the top of her head, not counting the pedestal or her arm and torch.
Understanding these giant waves is more than just a scientific curiosity -- being able to predict and avoid them could save dozens of lives and hundreds of millions of dollars in cargo every year.
In this article, you'll find out what separates rogue waves (also called freak waves) from other large waves and what causes them, and you'll learn about some of the better-known rogue wave incidents.
Video Gallery: WavesUC Davis and NASA are working together with high-tech wireless sensors and networked buoys to measure readings from Lake Tahoe to track water clarity, wind speed and wave height.
Watch this video about an exhibit that gives an interactive look at how waves affect beach erosion, as well as the larger impact of hurricanes on beachfronts.
In April 2007, an earthquake and tSunami devastated the coastal regions of the Solomon Islands. See how tSunami and earthquake recovery works in this video from Reuters.
A Rogue by Definition
There are many kinds of ocean waves, and some of them are definitely huge. However, not all large waves are rogue waves. Strong storms, such as hurricanes, can cause large waves, but these waves tend to be relatively regular and predictable, though certainly capable of causing serious harm to ships and coastal areas. Undersea earthquakes, coastal landslides and glacial calving (when a large chunk of a glacier breaks off and falls into the ocean) can also create enormous and catastrophic waves. Undersea earthquakes can produce tSunamis, and coastal landslides can produce tidal waves. These could be considered rogues, but, to a certain extent, they are predictable -- as long as someone noticed the event that caused them. So, that pretty much rules them out of rogue status.
A true rogue wave arises seemingly out of nowhere and is significantly higher than the other waves occurring in the area at the time. Exactly how much higher is open to interpretation -- some sources suggest anything twice as large as the current significant wave height is a rogue, while others think anything 33 percent larger counts. It is probably sufficient to say that any wave so large that it is unexpected based on current conditions can be counted as a rogue. A craft navigating 3-foot waves could encounter an 8-foot rogue wave -- while not a record-breaker, it would certainly cause problems for a small boat.
62
© Photographer: Ironrodart | Agency: Dreamstime
Glacial calving can cause enormous waves, but they're
not considered rogue waves.
Rogue waves also tend to be steeper than most waves. The average ocean waves may take the form of massive swells, allowing vessels to maneuver up and down them even if they are many feet high. By contrast, consider this report of the Queen Elizabeth II's encounter with a freak wave:
At 0410 the rogue wave was sighted right ahead, looming out of the darkness from 220°, it looked as though the ship was heading straight for the white cliffs of Dover. The wave seemed to take ages to arrive but it was probably less than a minute before it broke with tremendous force over the bow [source: Science Frontiers].
The phrase "wall of water" is very common in rogue wave reports -- they are usually much steeper than other waves, and therefore slam into ships with tremendous force, often breaking over them.
The ExplorerIn January 2005, the Explorer, a 591-foot research vessel, was struck by a 50-foot rogue wave in the Pacific Ocean. The wave disabled much of the ship’s equipment, including three of four engines . Those on board suffered only minor injuries and the ship made it to Hawaii for repairs. Had the wave been larger, almost 1,000 people could have died [source: The Denver Channel].
While scientists have gained a greater understanding of rogue waves in the last decade, they are still quite enigmatic. No one has ever filmed the formation of a rogue wave in the ocean or followed one through its entire life cycle. There are very few photographs of rogue waves. For centuries, the best evidence for their existence was anecdotal -- the countless stories told by sailors who had survived one.
Gallimore and another crewman were in the wheelhouse. The wind had been blowing fiercely at 100 knots for more than a day, and "Lady Alice" was struggling in rough seas with waves 16 to 23 feet high … At 8:00 A.M. Gallimore looked up and saw a huge wall of water bearing down on "Lady Alice." From his view in the wheelhouse, he could not see the top of the wave …The wave crashed down on top of the wheelhouse, driving the vessel underwater …The crewman in the wheelhouse with him was thrown down with such force that he suffered two fractured vertebrae. To top the radar antennas with enough force to rip them from the steel mast where they are bolted … the wave had to be 40 feet or higher [source: Smith, 195].
What Causes Rogue Waves?To understand what causes a rogue wave, first you must learn a little about regular waves. Think about waves you're familiar with -- such as the waves you body surf in at the beach or at the local water park's wave pools . A wave has several characteristics that can be used to define it.
The crest is the highest portion of the wave. The trough is the lowest portion of the wave (the "dip" in between waves). The distance from the trough to the crest represents a wave's height. The distance between crests represents a wave's length. The amount of time that passes between one crest and the next is the wave
period or wave speed. The amount of kinetic and potential energy carried by the wave is known as
wave energy [source: Bryant, 156].
63

A huge number of variables influence these factors, including the depth of the water, tidal forces, wind blowing across the water, physical objects such as islands that reflect waves, and interaction with other waves and ocean currents. At any given moment, thousands of waves are passing and interacting through a specific area of ocean. The faster the wind is and the longer it blows, the stronger and larger the waves. Fetch is the unobstructed distance of ocean over which the wind can blow on the water -- it's how much ocean the wind is blowing on. More fetch means bigger waves.
Weather reports list the significant wave height, which is the height of the highest one-third of the waves. Why do rogue waves exceed the significant wave height by so much? Scientists aren't completely sure, but they have some good theories.
One possibility is that ocean currents cause waves to "pile up" when waves run into currents head on. Powerful storms can cause significant wave heights of 40 to 50 feet (12 to 15 meters). When such waves run into a strong current, the current can increase wave heights and cause the waves to break. This would explain monster waves 98 feet (30 meters) high or more, and account for the "wall of water" effect. Rogue waves frequently occur in areas known for strong ocean currents. For example, he Agulhas Current runs southward along the east coast of Africa. Storm waves moving up from the south crash into the current -- mathematical predictions suggest rogue waves there could reach 190 feet in height, and 20 ships have reported rogue wave strikes in that area since 1990 [source: Smith, 188]. The Gulf Stream, which runs up the east coast of the United States, is another potential rogue wave source. Rogues originating in the Gulf Stream could be responsible for much of the legend of the Bermuda Triangle.
Not all rogue waves occur in strong ocean currents, however. Scientists think some waves may be caused by randomly occurring wave reinforcement. Whenever two waves interact, their wave height is added together. If a 5-meter wave passes over a 10-meter wave, the result is a briefly occurring 15-meter wave. This can happen in the opposite manner as well. A 15-meter wave moving across a 10-meter trough results in a 5-meter wave. Dozens of waves could be interacting and reinforcing each other. Once in awhile, several waves may come together at just the right moment and create one huge wave in relatively calm seas. If 10 waves that are only 5 feet high come together, they will result in a 50-foot wave. This fits descriptions of rogue waves that seem to appear out of nowhere and disappear after just a few minutes.
The Queen ElizabethDuring World War II, British cruise liners were converted to carry troops from the United States to Europe. One such vessel was the "RMS Queen Elizabeth." A rogue wave struck the ship near Greenland in 1942, shattering windows 90 feet above the waterline and nearly rolling the ship. It recovered and narrowly averted an unprecedented maritime disaster -- the ship was carrying more than 10,000 troops at the time [source: Sverre Haver].
64
Common Rogues-Most reports of rogue waves rely on size estimates by witnesses. These estimates are based on the height of the ship above the waterline and how far up the ship the wave reached when it hit. It was commonly assumed that tales of waves 100 feet tall or taller were exaggerations (and some of them certainly were). At best, such waves were incredibly rare.
Photo courtesy Sverre HaverA recording of the rogue wave off the Draupner
Platform in the North Sea on New Year's Day 1995Beginning in the 1990s, sailors and scientists began to suspect that rogue waves were responsible for many more losses at sea than they had previously guessed. The Queen Elizabeth II, Caledonian Star and Bremen cruise ships were all hit by monstrous waves in a span of six years. Previously, data collected by weather ships suggested that such waves would occur only every 50 years or more [source: Smith, 210]. In 2004, the European Space Agency (ESA) used data from two radar-equipped satellites to see how frequent rogue waves actually are. After analyzing radar images of worldwide oceans taken over a period of three weeks, the ESA's MaxWave Project found 10 waves 82 feet (25 meters) or higher. That was an astonishingly high number for such a relatively short time span; it forced scientists to seriously rethink their ideas on rogue waves [source: ESA]. The ESA is undertaking another project, WaveAtlas, to survey the oceans over a much longer period and develop the most accurate estimate possible for the frequency of rogue waves.
Other hard evidence of monster waves comes from instruments designed to measure wave heights. One such instrument was mounted on an offshore oil rig known as the Draupner Platform. On New Year's Day 1995, the platform was measuring waves no more than 16 to 23 feet (5 to 7 meters) high. Then it suddenly registered a single wave almost 66 feet (20 meters) high [source: Smith, 208]. Canadian weather buoys near Vancouver recorded waves 100 feet high and higher throughout the 1990s [source: Smith, 211].
The Wreck of the Edmund FitzgeraldRogue waves may not be restricted to the world's oceans. Extremely large inland waters (such as North America's Great Lakes) may also develop rogue waves, although little scientific data exists to confirm this. Anecdotal evidence abounds, however. One of the most infamous sinkings in Great Lakes history, the "Edmund Fitzgerald," may have been caused by
65
one or more rogue waves. In November 1975, the 729-foot bulk cargo vessel was struggling through a horrendous storm along with the "Arthur Anderson." Blinded by the storm, the Anderson was hit by two 35-foot waves (truly massive even for Lake Superior) and then lost sight of the Fitzgerald on radar [source: Cush, 111]. The Edmund Fitzgerald was eventually found at the lake's bottom, broken in two. Though there are many theories, some suggest that a combination of factors, including the rogue waves that hit the Anderson and drove the Fitzgerald violently under the water, never to resurface.
Wave Defense-If the MaxWave study is correct, and rogue waves are much more common than previously thought, does that mean oceangoing vessels are far riskier than we thought? It might. Ships and offshore structures, such as oil rigs, are built to withstand a certain significant wave height, whatever is determined that the ship is likely to encounter in its lifetime. Few are built to handle 100-foot waves. Furthermore, a ship's ability to withstand a strike by a rogue wave depends in large part on the ballast, or stability. If a ship has the right amount of ballast and is floating at the proper level, it will be more likely to right itself after being pushed over by a wave [source: Smith, 233]. Today's international shipping laws don't necessarily take frequent rogue waves into account where ship construction and maintenance are concerned. But that's not to say all ships are unsafe -- perhaps it would be impossible to build a ship that could withstand any wave.
And it's not just ships and offshore structures that need to worry about rogue waves. These walls of water may pose a serious threat even to people who aren't on the water. The U.S. Navy has expressed concern that some Coast Guard rescue helicopters lost at sea may have been struck by rogue waves [source: U.S. Naval Institute]. And shorelines where there is a steep drop-off to deep ocean close to shore can be dangerous for those exploring the rocks. Unexpected waves have been known to sweep people off the rocks, where the undertow drags them down and away.
Currently, it is impossible to predict a rogue wave. However, MaxWave and WaveAtlas could give scientists and sailors a good look at the conditions that cause rogue waves, as well as indicate areas where they happen most often. This could allow shipping routes to take into account particularly dangerous areas when the weather conditions could lead to rogues. Avoiding these areas could save hundreds of lives every year.
Rogue versus TsunamiWhen you think of giant, frightening, destructive waves, tsunamis definitely come to mind. But don't confuse these giant waves with rogues -- while both can be catastrophic, they are quite different. The easiest way to remember the difference is by what causes the "wall of water" and where the destruction from it occurs.
TSunamis are most often caused by undersea earthquakes, which send tons of rock shooting upward with tremendous force. The energy of that force is transferred to the water.
66
Three SistersRogue waves do not always come alone. A phenomenon well known to sailors is the "Three Sisters." After one huge wave has passed, it may be followed by two more. These trios of monster waves can be especially devastating -- the first can disable a ship and leave it unable to maneuver itself to avoid or ride out the subsequent waves.

So, unlike normal waves that are caused by wind forces, the driving energy of a tsunami moves through the water, not on top of it. Therefore, as the tsunami travels through deep water -- at up to 500 or 600 miles per hour -- it's barely evident above water. A tsunami is typically no more than 3 feet (1 meter) high. Of course, all that changes as the tsunami nears the coastline. It is then that it attains frightening height and achieves its more recognizable and disastrous form.
Rogue waves, as we've discussed in this article, arise seemingly out of nowhere, and they can attain their massive heights in deep water, not just along the shoreline.
STUDENT HANDOUT
DIFFERENTIATED INSTRUCTION: OPEN INQUIRY
WAVE SPEED
Objectives/Purpose: The student will be able to compare the speeds of two different waves. The student will determine that wave speed does affect the speed of ships.
Demonstrate Achievement of the following Goals: Develop a problem statement based on the concept that waves travel at different
speeds in different materials. State your hypothesis. Design an experiment to test your hypothesis. Carry out the experiment you designed.
67
Submit a completed lab report to your teacher. Use the “Claim, Evidence & Reasoning” rubric to defend your claims when
writing your conclusion.
68

Teacher (Topic VI-Layers of Earth)
SEVEN EARTH LAYER DENSITY COLUMN
NGSSS:SC.7.E.6.1 Describe the layers of the solid Earth, including the lithosphere, the hot convecting mantle, and the dense metallic liquid and solid cores. SC.7.E.6.5 Explore the scientific theory of plate tectonics by describing how the movement of Earth's crustal plates causes both slow and rapid changes in Earth's surface, including volcanic eruptions, earthquakes, and mountain building. AA SC.7.N.3.2 Identify the benefits and limitations of the use of scientific models MACC.6.SP.2.5 Summarize numerical data sets in relation to their context, such as by:MACC.6.SP.2.5b Describing the nature of the attribute under investigation, including how it was measured and its units of measurement.
Purpose of the Lab/ Activity: To visualize that the liquids that weigh more (have a higher density) will sink
below the liquids that weigh less (have a lower density).
Prerequisites: Density is basically how much "stuff" is smashed into a particular area or a
comparison between an object's mass and volume. Density = Mass divided by Volume. Based on this equation, if the weight (or
mass) of something increases but the volume stays the same, the density has to go up. Likewise, if the mass decreases but the volume stays the same, the density has to go down.
Lighter liquids (like water or rubbing alcohol) are less dense than heavy liquids (like honey or Karo syrup) and so float on top of the more dense layers.
Materials (per group): Light Karo syrup Water Vegetable oil Dawn dish soap (blue) Rubbing alcohol Lamp oil Honey Graduated cylinder Food Coloring or True Color Coloring Tablets Food baster 9 oz portion cups
69
Procedures: Day of ActivityBefore Activity
What the teacher will do:Engage: Ask students: In thinking about a cup of hot chocolate with marshmallows, why do the marshmallows float on top?
During activity
What the teacher will do:1. Measure 8 ounces of each type of liquid into the 9 ounce portion cups. 2. Direct students to color each of the liquids to make a more dramatic
effect in your column. Light Karo syrup is easier to color than dark syrup. The only liquids that you may not be able to color are the vegetable oil and the honey.
3. Direct students to start their column by pouring the honey into the cylinder.
4. Next, students should pour each liquid SLOWLY into the container, one at a time. It is very important to pour the liquids slowly and into the center of the cylinder. Make sure that the liquids do not touch the sides of the cylinder while you are pouring. It’s okay if the liquids mix a little as you are pouring.
5. Explain to students that the layers will always even themselves out because of the varying densities.
6. Make sure that students pour the liquids in the following order: o Honeyo Karo syrupo Dish soapo Watero Vegetable oilo Rubbing alcoholo Lamp oil
7. As students pour, the liquids will layer on top of one another. After students pour in the liquids there will be a seven-layer science experiment - a science burrito!
After activity
What the teacher will do:Extension: Develop a problem statement based on the concept that substances with
higher densities sink to the bottom and those with less densities float on top. State your hypothesis. Design an experiment to test your hypothesis. Carry out the experiment you designed. Submit a completed lab report to your teacher. Use the “Claim, Evidence & Reasoning” rubric to defend your claims when
writing your conclusion.
70
Student Name: ___________________________ Date: _________________ Period: ______
SEVEN LAYER DENSITY COLUMN
NGSSS:SC.7.E.6.1 Describe the layers of the solid Earth, including the lithosphere, the hot convecting mantle, and the dense metallic liquid and solid cores. SC.7.E.6.5 Explore the scientific theory of plate tectonics by describing how the movement of Earth's crustal plates causes both slow and rapid changes in Earth's surface, including volcanic eruptions, earthquakes, and mountain building. AA SC.7.N.3.2 Identify the benefits and limitations of the use of scientific models Assessed as SC.7.N.1.5
BACKGROUND:
The same amount of two different liquids will have different weights because they have different masses. The liquids that weigh more (have a higher density) will sink below the liquids that weigh less (have a lower density).
To test this, you might want to set up a scale and measure each of the liquids that you poured into your column. Make sure that you measure the weights of equal portions of each liquid. You should find that the weights of the liquids correspond to each different layer of liquid. For example, the honey will weigh more than the Karo syrup. By weighing these liquids, you will find that density and weight are closely related.
NOTE: The numbers in the table are based on data from manufacturers for each item. Since each manufacturer has its secret formula, the densities may vary from brand to brand. The table shows the densities of the liquids used in the column as well as other common liquids (measured in g/cm3 or g/mL).
71
Material DensityRubbing Alcohol .79Lamp Oil .80Baby Oil .83Vegetable Oil .92Ice Cube .92Water 1.00Milk 1.03Dawn Dish Soap 1.06Light Corn Syrup 1.33Maple Syrup 1.37Honey 1.42

Density is basically how much "stuff" is smashed into a particular area... or a comparison between an object's mass and volume. Remember the all-important equation: Density = Mass divided by Volume. Based on this equation, if the weight (or mass) of something increases but the volume stays the same, the density has to go up. Likewise, if the mass decreases but the volume stays the same, the density has to go down. Lighter liquids (like water or rubbing alcohol) are less dense than heavy liquids (like honey or Karo syrup) and so float on top of the more dense layers.
Problem Statement: How do liquids with different densities behave when they are all poured into one container?
Vocabulary: Density, solid, liquid, lithosphere, heat, model, crust, mantle, inner core, outer core, oceanic crust, continental crust, convection, model (scientific model), theory (scientific theory)Materials (per group): Light Karo syrup Water Vegetable oil Dawn dish soap (blue) Rubbing alcohol Lamp oil Honey Graduated cylinder Food Coloring or True Color Coloring Tablets Food baster 9 oz portion cups
Procedures1. Measure 8 ounces of each type of liquid into the 9 ounce portion cups. 2. You may want to color each of the liquids to make a more dramatic effect in your
column. Light Karo syrup is easier to color than dark syrup. The only liquids that you may not be able to color are the vegetable oil and the honey.
3. Start your column by pouring the honey into the cylinder. 4. Now, you will pour each liquid SLOWLY into the container, one at a time. It is very
important to pour the liquids slowly and into the center of the cylinder. Make sure that the liquids do not touch the sides of the cylinder while you are pouring. It’s okay if the liquids mix a little as you are pouring.
5. The layers will always even themselves out because of the varying densities.6. Make sure you pour the liquids in the following order: o Honeyo Karo syrupo Dish soapo Watero Vegetable oilo Rubbing alcoholo Lamp oil
72

7. As you pour, the liquids will layer on top of one another. After you pour in the liquids you will have a seven-layer science experiment - a science burrito!
OBSERVATION AND DATABased on your observations, draw and label a diagram of the liquids as they appear from most dense to least dense.
Results/ Conclusion
1. Which liquid is most dense, least dense?______________________________________ _________________________________________________________________________2. How does the table of densities compare with the way in which the liquids
stacked up? _______________________________________________________________________
3. What surprised you about the way the liquids stacked? ___________________________ _______________________________________________________________________
4. How does the concept of density apply to the layers of the Earth? __________________ _______________________________________________________________________
73

Literature Connection:
“Archimedes and the King’s Crown”
An ancient story tells about a Greek king, a gold crown and an amazing scientist named Archimedes. The king had ordered a solid golden crown made. When the court goldsmiths presented it to him, he asked Archimedes to test it to make sure it was pure gold. Archimedes knew that pure gold was very soft. He could bite a piece of it, and his teeth would leave a dent in it. (But he also knew that the king would be mad if he returned a dented crown. He couldn't use THAT
test.) Archimedes also knew that if he took equal volumes of gold and water, the gold would weigh 23 times more than the water. He COULD use this test. (The problem was measuring the volume of the crown, an irregular object.).
One night, while filling his tub, for a bath, Archimedes accidentally filled it to the very top. As he stepped into it, water spilled out over the top. The idea struck him, that if he collected the water, and measured it, he would know the volume of his body. HE COULD USE THIS TO MEASURE THE CROWN! In other words, the amount of displaced water in the bathtub was the same amount as the volume of his body.Archimedes was so excited that he jumped out of the tub. He ran outside and down the street yelling "Eureka! Eureka! (One of the few Greek words I know!) I found the answer!"
www.sciencenet.org.uk/.../Chemistry/ StructBond/c00195b.html
All this was fine except in his excitement, Archimedes had forgotten to put on his clothes.
He was running down the street naked! Archimedes was able to get the volume of the crown and an equal volume of pure gold obtained, no doubt, from the King’s treasury. When he placed the two items into separate pans on a two-pan balance, well, I guess you can figure out the answer if I tell you that the goldsmith was put into jail!
74

TEACHER- (Topic VII- Plate Tectonics)
DENSITY DRIVEN FLUID FLOWModified & adapted from NASA's "A Teacher's Guide with Activities",
Microgravity Science and Applications Division, Office of Space Science and Applications, and NASA's Education Division
http://science.nasa.gov/msl1/ground_lab/ground_lab.htm Bryan Walls
NGSSS:SC.7.P.11.4 Observe that heat flows in predictable ways, moving from warmer objects to cooler ones until they reach the same temperature. (AA)SC.7.E.6.1 Describe the layers of the solid Earth, including the lithosphere, the hot convecting mantle, and the dense metallic liquid and solid cores.SC.7.E.6.2 Identify the patterns within the rock cycle and relate them to surface events (weathering and erosion) and sub-surface events (plate tectonics and mountain building). (AA)
Purpose of the Lab/ Activity: Observe that fluid flow is caused by differences in solution density. Model the convection flow occurring in the mantle
Prerequisites: All matter takes up space and has mass. The ratio of an object’s mass to its volume is its physical property called
density. Density is measured in grams per milliliter if the substance is a liquid or grams
per centimeter cubed if it is a solid. Each element and compound has a unique density associated with it.
Materials (per group): (2) opaque, shoe-box sized plastic container (2) large test tube (1) test tube rack (2) rubber cork (to fit the top of the test tube; your thumb can serve as an alternate) food coloring salt plastic spoon or stirring rod (plastic straws will work here)
75
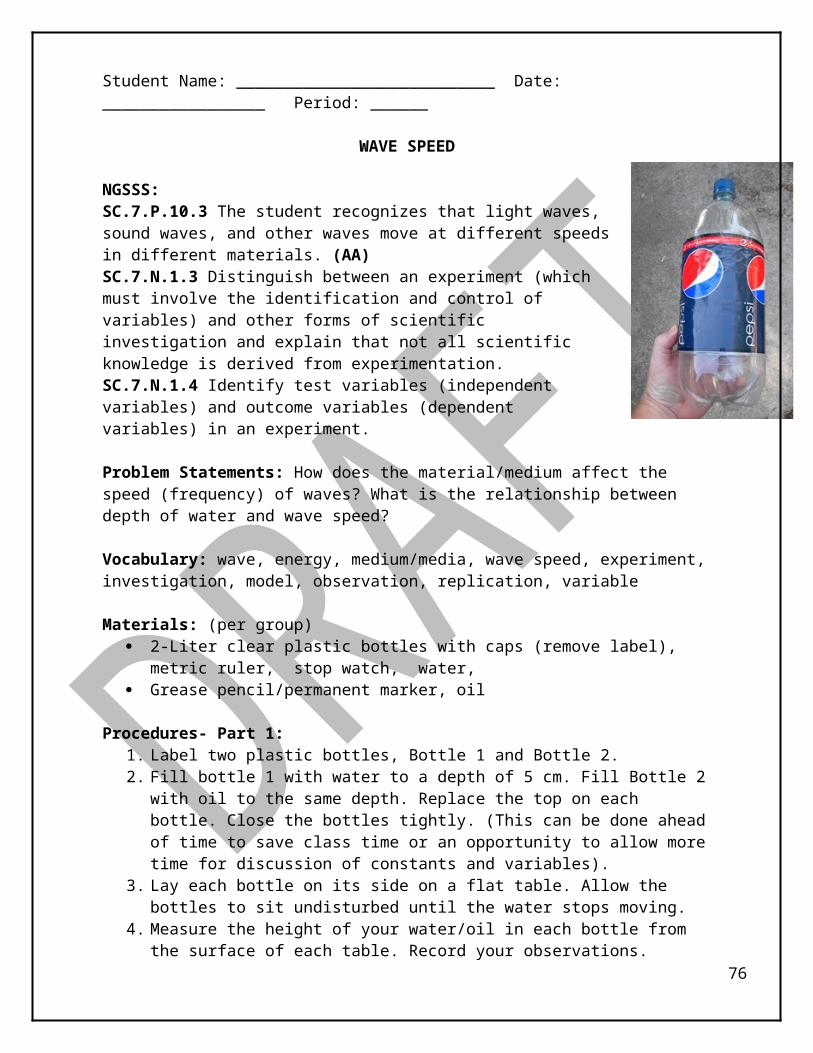
Extensions: Additional Materials Needed:- (1) Hot Plate- (2) 250 mL beaker
Procedures: Day of the Activity:
Before activity
What the teacher will do:Engage:Discuss the following question with your class: “Why do huge cruise ships float and small rocks sink?”
During activity
What the teacher will do:a. Form groups of 3-4 students.b. Facilitate the collection of materials by students.c. Walk about the groups as they conduct their lab. Ask higher order thinking questions.d. Facilitate the observations and completion of data writing for the activities by asking questions.
After activity
What the teacher will do:Elaborate: Have students clarify their answers to “Why do huge cruise ships float and small rocks sink?”
Extension1. Facilitate the extension through open inquiry using the alternate procedures
below.Additional Materials Needed:- (1) Hot Plate- (2) 250 mL beaker Alternative proceduresA. Repeat the experiment, but replace the water in the test tube with hot, unsalted water.B. Replace the salt water in the large container with cold, unsalted water.C. Repeat the experiment with different amounts of salt.D. Try replacing the salt in the experiment with sugar and/or baking soda.
76
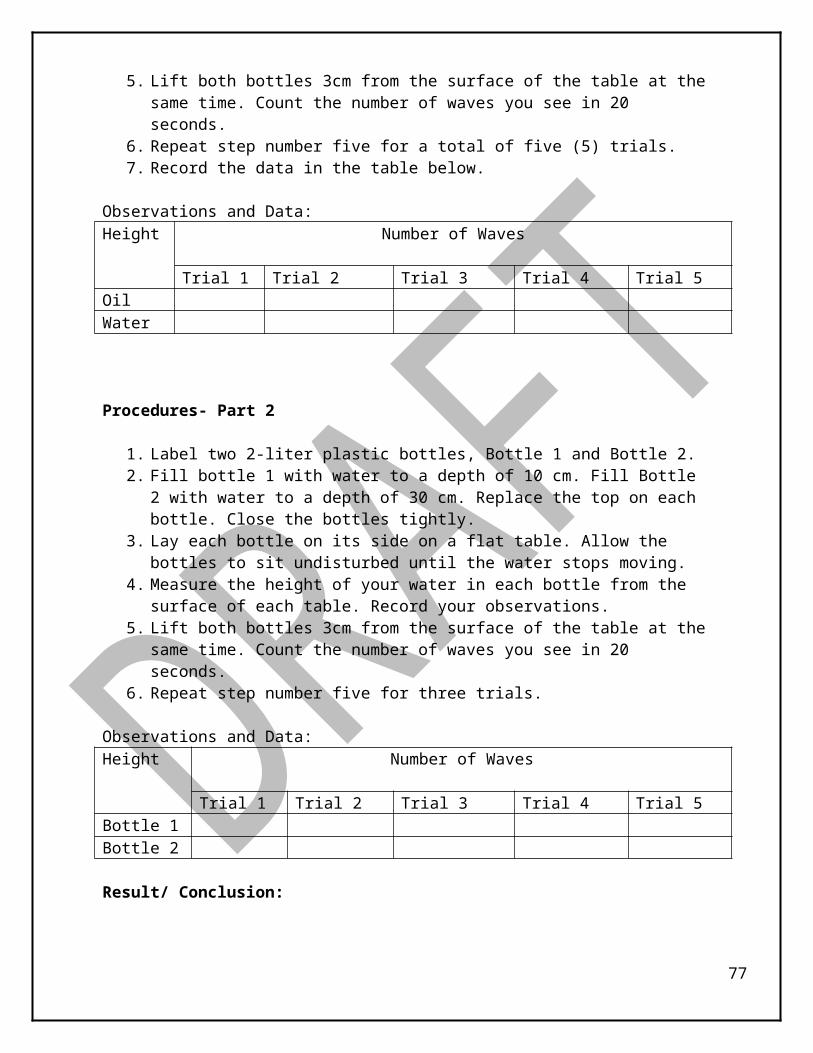
Student Name: ___________________________ Date: _________________ Period: ______
DENSITY DRIVEN FLUID FLOWModified & adapted from NASA's "A Teacher's Guide With Activities",
Microgravity Science and Applications Division, Office of Space Science and Applications, and NASA's Education Division
http://science.nasa.gov/msl1/ground_lab/ground_lab.htmBryan Walls
NGSSS:SC.7.P.11.4 Observe that heat flows in predictable ways, moving from warmer objects to cooler ones until they reach the same temperature. (AA)SC.7.E.6.1 Describe the layers of the solid Earth, including the lithosphere, the hot convecting mantle, and the dense metallic liquid and solid cores.SC.7.E.6.2 Identify the patterns within the rock cycle and relate them to surface events (weathering and erosion) and sub-surface events (plate tectonics and mountain building). (AA)
Background:All matter takes up space and has mass. The ratio of an object’s mass to its volume is an important physical property called density. This important property is commonly measured in grams per milliliter if the substance is a liquid or grams per centimeter cubed if it is a solid. Density is a physical property of matter, as each element and compound has a unique density associated with it. Density defined in a qualitative manner as the measure of the relative "heaviness" of objects with a constant volume. The Earth is composed of materials of different densities.
Recall that the rock cycle is, in part, a result of the exchange of materials between the layers of the Earth. The layer below the crust of the Earth is the viscous, hot mantle that drives the movement of the plates as a result of convection currents occurring in the mantle.
Problem Statement: How does a dense substance move within a less dense substance?
Vocabulary: heat, temperature, kinetic energy, density, model, rock cycle, igneous rock, sedimentary rock, metamorphic rock,
Materials (per group): (2) opaque, shoe-box sized plastic container, (2) large test tube, (1) test tube rack, (2) rubber cork (to fit the top of the test tube; your thumb can serve as an alternate), food coloring, salt, plastic spoon or stirring rod (plastic straws will work too)
Procedures:Part A:1. Fill the plastic container ¾ full with water (H2O). Then mix in enough salt (NaCl)
so the water becomes cloudy. Use the stirring rod to mix in the salt. You are making a salt water solution.
2. Fill the test tube with unsalted water and add two or three drops of food 77
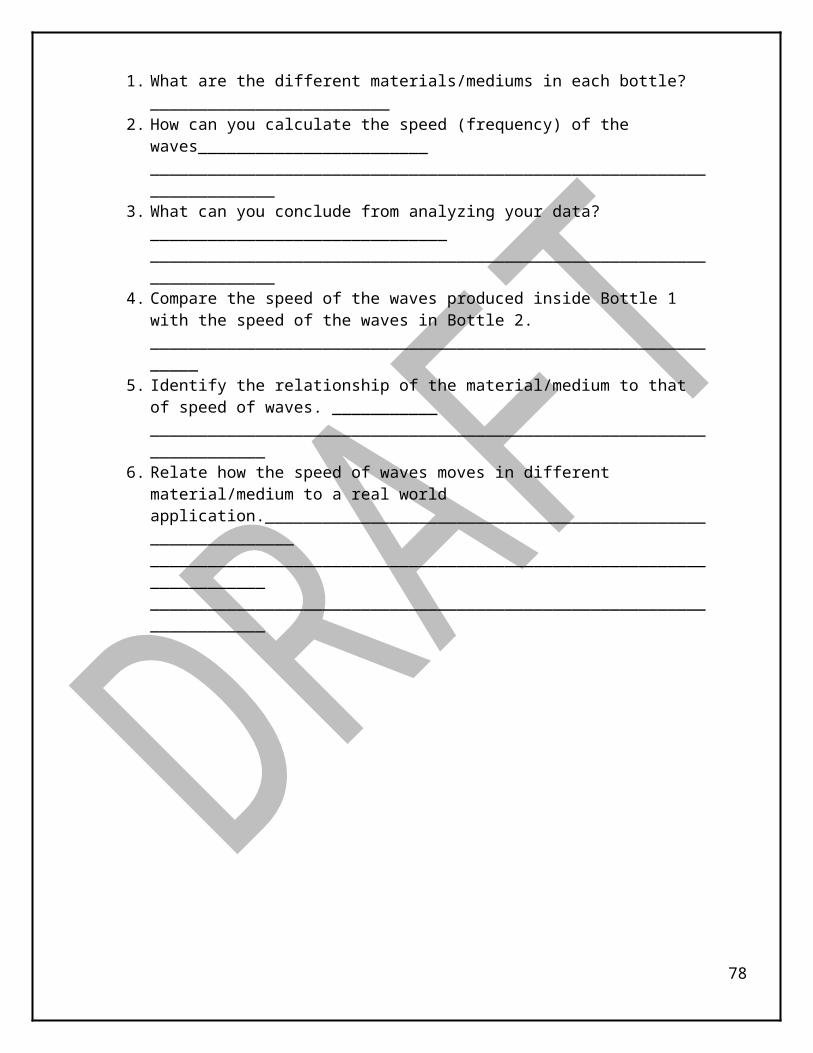
coloring to make it a dark color. Swirl the test tube to mix in the food coloring.3. Place the rubber cork (or your thumb) over the opening of the test tube and
cover completely.4. Lower the test tube carefully into the salt water in the large container. Remove
the cork (thumb), let the test tube sit on the bottom undisturbed and observe the direction the colored water flows.
5. Draw, color and label: Diagram A (Include: container, salt water, test tube, unsalted water, the motion of the colored water)
6. Repeat the steps (#1 - #3). Now, lower the test tube just below the surface of the water. Remove the cork (thumb) while holding the test tube and observe the direction the colored water flows.
7. Draw, color and label: Diagram B (Include: container, salt water, test tube, unsalted water, the motion of the colored water)
8. Remove the test tube from the plastic container. Rinse both with water and dry.
Observations/ Data:(Part A)
Diagram A Diagram B
ProceduresPART B:1. Fill the plastic container ¾ full with water (H2O). 2. Fill the test tube ½ full with water. Then mix in 3-5 spoonfuls of salt (NaCl) so
the water becomes cloudy. 3. Add two or three drops of food coloring to make it a dark color. Swirl the test tube
to mix in the food coloring and salt.4. Place the rubber cork (or your thumb) over the opening of the test tube and
cover completely.5. Lower the test tube carefully into the unsalted water in the large container.
Remove the cork (thumb), let the test tube sit on the bottom undisturbed and observe the direction the colored water flows.
6. Draw, color and label: Diagram C (Include: container, salt water, test tube, unsalted water, the motion of the colored water)
7. Repeat the steps (#1 - #4). Now, lower the test tube just below the surface of the water. Remove the cork (thumb) while holding the test tube and observe the direction the colored water flows.
8. Draw, color and label: Diagram D (Include: container, salt water, test tube, unsalted water, the motion of the colored water)
9. Remove the test tube from the plastic container. Rinse both with water and dry.
Observations/ Data:(Part B)
78
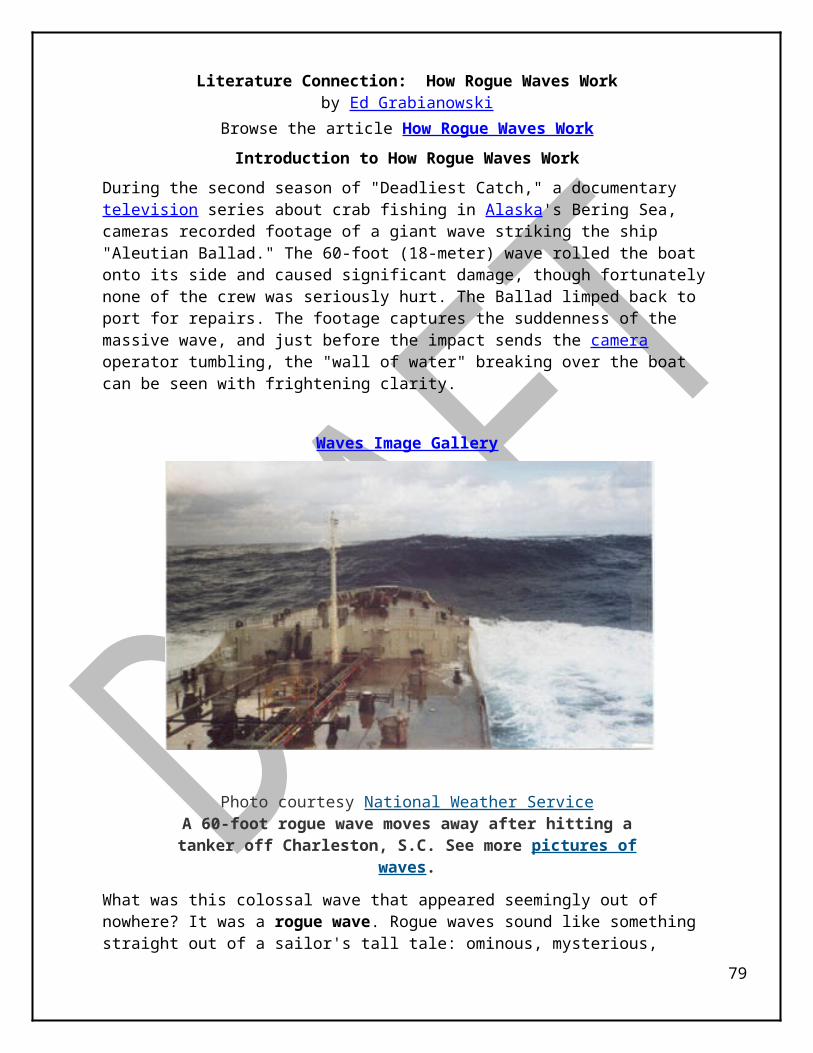
Diagram C Diagram D
Results/ Conclusions:1. Based on your observations, which solution is denser: salt water or un-salted, dyed
water?______________________________________________________________________ ______________________________________________________________________
2. What do you think would happen if salt water were in both the test tube and the container?_________________________________________________________________________
3. What do you think would happen if unsalted water were in both the test tube and the container? _________________________________________________________________________________________________________________________________________
4. What was the test (independent) variable in Part A?_________________________________________________________________________________________________________
5. What was a controlled variable in Part A?_________________________________________________________________________________________________________________
6. How does this model the convection currents occurring in the mantle?_________________ _________________________________________________________________________ __________________________________________________________________________
79
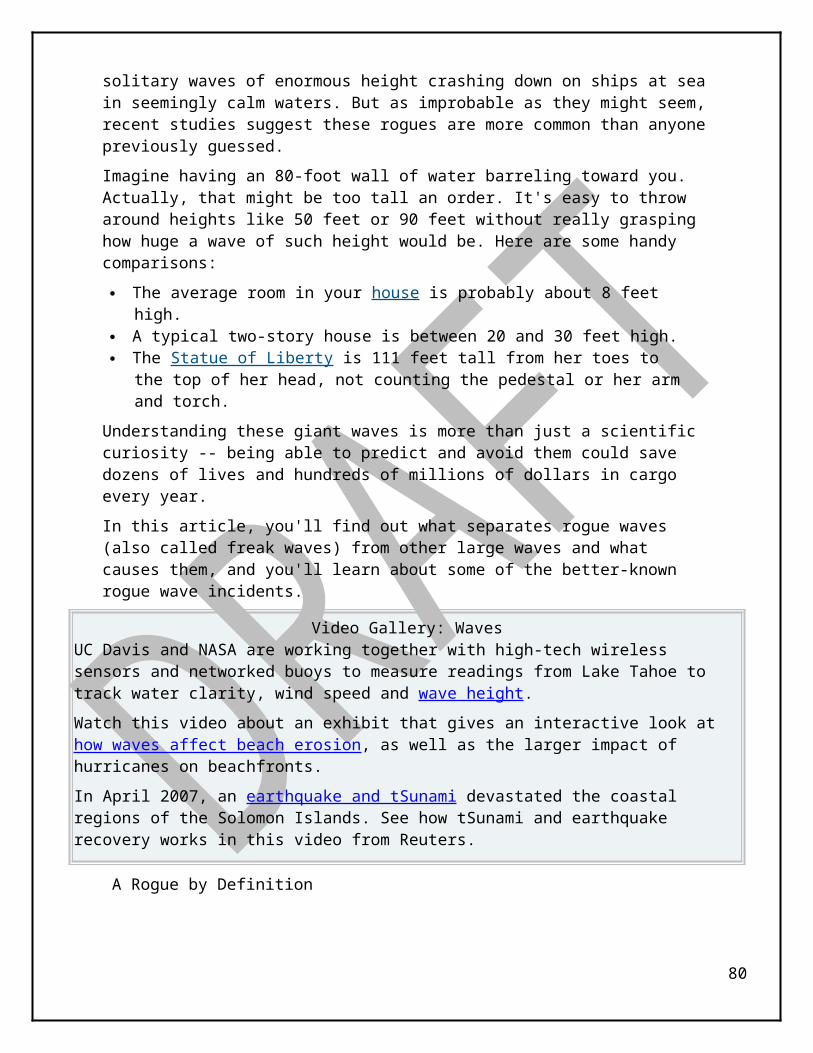
STUDENT HANDOUT
DIFFERENTIATED INSTRUCTION: OPEN INQUIRY
DENSITY DRIVEN FLUID FLOW
Objective/Purpose: Observe that fluid flow is caused by differences in solution density. Model the convection flow occurring in the mantle.
Demonstrate Achievement of the following Goals: Develop a need or problem statement based on the knowledge of convection
flow in the mantle that results in plate tectonics and mountain building. Complete the Engineering Design Process (see p. 17). Submit a completed Engineering Design Process report to your teachers detailing
your solution to the need or problem. How does the prototype demonstrate the concept that you investigated? Use the “Claim, Evidence & Reasoning” rubric to defend your claims when
writing your conclusion.
80
Teacher (Topic VIII- Rock Cycle and Processes that Shape Earth’s Surface)
CRAYON ROCK CYCLE LAB
NGSSS:SC.7.E.6.2 Identify the patterns within the rock cycle and relate them to surface events (weathering and erosion) and sub-surface events (plate tectonics and mountain building). AA SC.7.E.6.6 Identify the impact that humans have had on Earth, such as deforestation, urbanization, desertification, erosion, air and water quality, changing the flow of water. SC.7.E.6.5 Explore the scientific theory of plate tectonics by describing how the movement of Earth's crustal plates causes both slow and rapid changes in Earth's surface, including volcanic eruptions, earthquakes, and mountain building. AA LACC.68.RST.3.7 Integrate quantitative or technical information expressed in words in a text with a version of that information expressed visually (e.g., in a flowchart, diagram, model, graph, or table).
Purpose of the Lab/ Activity:
Describe the processes that allow rocks to change from one type to another in a continuous cycle.
Prerequisites:
Students should know the basics of the rock cycle and know how each rock can change into any of the other types of rocks depending on the process it undergoes either under Earth’s crust or at Earth’s surface.
Student should have an understanding of weathering and erosion. Students should have an understanding of plate tectonics and mountain
building.
Materials
1 penny per student 1 -2 crayons per student 2 paper plates per group 1 Styrofoam cup per group 2 large sheets of tin foil per group 1 large/heavy textbook Newspaper to cover work area Boiling hot water
81
Procedures:
Before activity
What the teacher will do:1. Have students first cover their work spaces with newspaper.
During activity
What the teacher will do:1. Form groups of 3-4 students.2. Facilitate the collection of materials by students.3. Have students use their penny to shave the crayon down into small pieces
onto the paper plate. Set a time limit to this so that all shaving of crayons is finished in 5 minutes max (make sure they peel the paper off the crayons).
4. Have students stop and reflect in their group about what process in the rock cycle they are completing. This should be answered in their notebooks.
5. Ask students, “What remains when a rock is weathered or broken down into pieces?”
6. Have students transfer or erode the sediment onto the sheet of tin foil so that the entire pile is at the center of the foil (at this point as much sediment as possible from all group members, should be on the foil).
7. Have students fold the piece of foil on top of the pile, place the text book on top, and gently push twice on the text book. Students should unfold the foil and look at the rock.
8. Ask students: What type of rock has now been created? Sedimentary rock. What process occurred? Cementation and compaction. What characteristics do you notice about the rock? It breaks apart easily back into the sediments.
9. Bring water to boiling in a tea kettle or on a hot plate and pour some into each of the students’ cups. Have them place their rock back inside the folded tin foil and hold it above the boiling water for about 15 seconds, and then to push the textbook on top again, but harder this time.
10. Have students unfold the foil and look at the rock. Ask students: Now what type of rock has been created? Metamorphic rock. What process did it undergo in order to be changed? Heat and pressure. What characteristics do you notice about the rock? It is smoother and the colors have blended together more.
11.Have students shape their second piece of foil (a new one) into a sort of boat such that there is a space in the middle for the rock and the foil is high on the sides. Have them place their rock in the center of the boat (again as much sediment as possible). Now have them float their tin foil boat on the boiling water for about 30 seconds. This is the coolest part because the crayons completely melt back into wax and all of the colors blend together. Have students carefully pull their boat out of the water and let it cool. Then, they can pop their rock out of the foil. Ask students: What type of rock has now been created? Igneous rock. What process occurred? Melting and cooling. What characteristics do you notice about the rock? It is very smooth and all of the original sediments are now completely molded together.
82
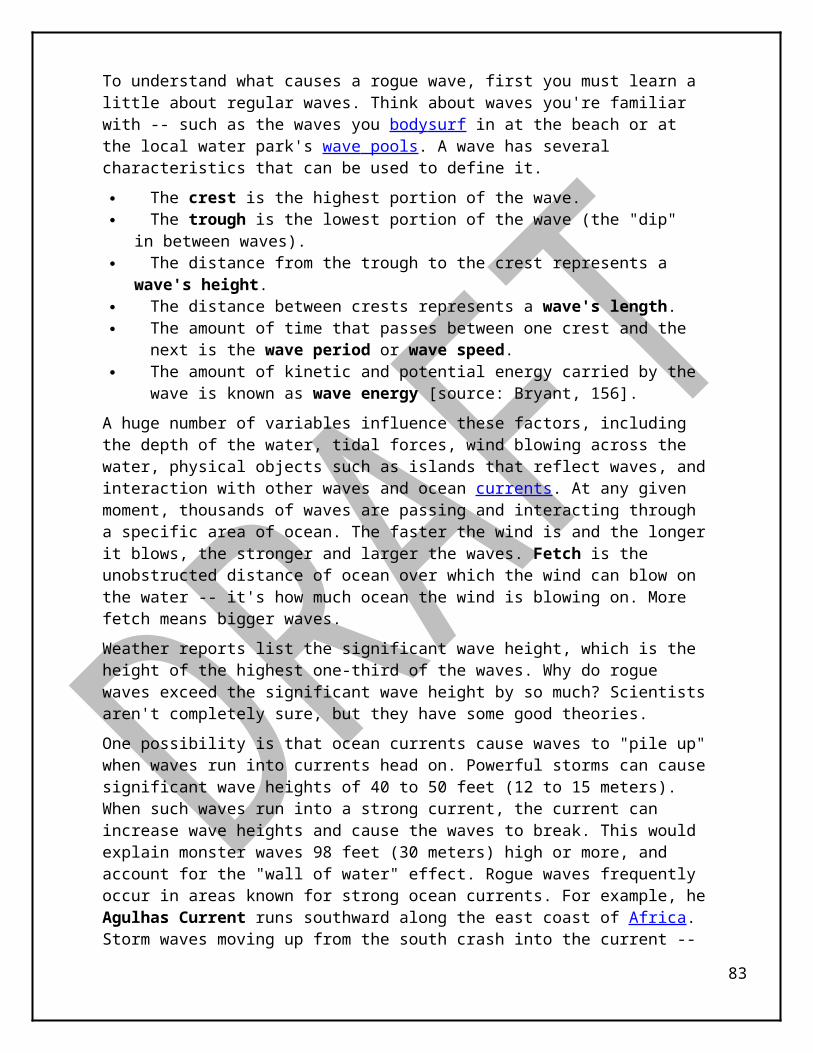
12.Walk about the groups as they conduct their lab. Ask higher order thinking questions.
13.Facilitate the observations and completion of data writing for the activities by asking questions.
After activity
What the teacher will do:
Elaborate:
Repeat some of these steps to demonstrate that the igneous rock can now be weathered back into sediment after it was melted and then that it is possible to be forced back under Earth’s crust and melted again into an Igneous rock when it meets lava. This should help solidify the point of this being a continuous cycle. This lab is simply meant to model what is occurring over millions of years continuously as new rocks are created for decades and centuries. It is important to also emphasize this length of time so that students realize this process is long and never ending.
83

Student Name: ___________________________ Date: _________________ Period: ______
CRAYON ROCK CYCLE LAB
NGSSS:SC.7.E.6.2 Identify the patterns within the rock cycle and relate them to surface events (weathering and erosion) and sub-surface events (plate tectonics and mountain building). AA SC.7.E.6.6 Identify the impact that humans have had on Earth, such as deforestation, urbanization, desertification, erosion, air and water quality, changing the flow of water. SC.7.E.6.5 Explore the scientific theory of plate tectonics by describing how the movement of Earth's crustal plates causes both slow and rapid changes in Earth's surface, including volcanic eruptions, earthquakes, and mountain building. AA LACC.68.RST.3.7 Integrate quantitative or technical information expressed in words in a text with a version of that information expressed visually (e.g., in a flowchart, diagram, model, graph, or table).
Background:The rock cycle describes the continuous processes that break down and form the three main rocks- igneous, sedimentary and metamorphic. Igneous rock is formed by the cooling and hardening of magma. Sedimentary rock is formed through weathering and erosion, deposition, compaction, and cementation of rock fragments. Metamorphic rock is formed by great heat and pressure on a rock that causes it to change form into a metamorphic rock.
Problem Statement: How can crayons be used to model the rock cycle?
Vocabulary: heat, temperature, kinetic energy, density, model, rock cycle, igneous rock, sedimentary rock, metamorphic rock, solid, liquid, lithosphere, heat, crust, mantle, inner core, outer core, oceanic crust, continental crust, convection,
Materials: 1 penny per student, 2 crayons per student, 2 paper plates per group, 1 Styrofoam cup per group, 2 large sheets of tin foil per group, 1 large/heavy textbook, Newspaper to cover work area, Boiling hot water
Procedures:1. Collect all materials2. Using the penny, shave the crayon down into small
pieces onto the paper plate. All shaving of crayons should be finished in 5 minutes max (make sure to peel the paper off the crayons).
3. Stop and reflect in your group about what process in the rock cycle is being completed.
84
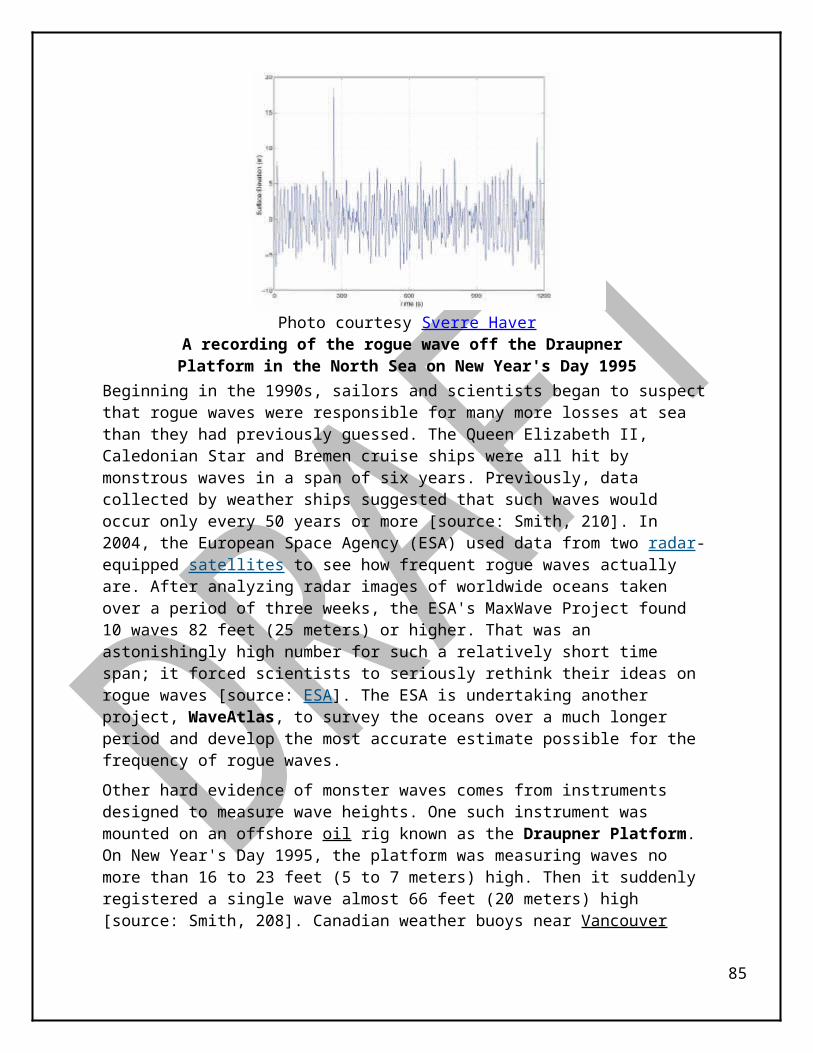
4. Transfer the sediment onto the sheet of tin foil so that the entire pile is at the center of the foil (at this point as much sediment as possible from all group members, should be on the foil).
5. Fold the piece of foil on top of the pile and place the text book on top. Gently push twice on the text book. Unfold the foil and look at the rock. What type of rock has now been created? What process occurred? What characteristics do you notice about the rock? _____________________________________________________________________ _____________________________________________________________________
6. Bring water to boiling on a hot plate and pour some into the cups. Place the rock back inside the folded tin foil and hold it above the boiling water for about 15 seconds, and then to push the textbook on top again, but harder this time.
7. Unfold the foil and look at the rock. Now what type of rock has been created? What process did it undergo in order to be changed? What characteristics do you notice about the rock? _____________________________________________________________ _____________________________________________________________________
8. Shape the second piece of foil (a new one) into a sort of boat such that there is a space in the middle for the rock and the foil is high on the sides. Place your rock in the center of the boat (again as much sediment as possible). Float your tin foil boat on the boiling water for about 30 seconds. This is the coolest part because the crayons completely melt back into wax and all of the colors blend together. Carefully pull your boat out of the water and let it cool.
9. Then, pop your rock out of the foil. What type of rock has now been created. What process occurred? What characteristics do you notice about the rock? _________________________________________________________________ ______________________________________________________________________ ______________________________________________________________________
Observations/ Data:Process of the lab activity Process of the rock cycleShaving down of crayonsTransferring of the sediment onto the sheet of tin foilPushing on the pile of crayon with the textbookHolding the rock in the tin foil above the boiling water and then pressing the textbook on the rock afterFloating the tin foil boat on the boiling
85
water for about 30 seconds with the rock in the center of the boat Cooling of the melted crayons
Results/ Conclusions:1. What type of rock does each of the processes of the rock cycle form?_______________________________________________________________________________________________________________________________________________________________________________________________________________________________________________
86

Teacher (Topic IX Age of Earth/ Geological Time)
FOSSILS AND THE LAW OF SUPERPOSITIONSource: http://www.uen.org/Lessonplan/preview.cgi?LPid=16319
Benchmarks:SC.7.E.6.3 Identify current methods for measuring the age of Earth and its parts, including the law of superposition and radioactive dating. (Assessed as SC.7.E.6.4)SC.7.E.6.4 Explain and give examples of how physical evidence supports scientific theories that Earth has evolved over geologic time due to natural processes. (AA)
Objective/Purpose: Students will use their knowledge about fossils to arrange fossil pictures in
sequence from oldest to youngest. Explain how fossils can be used to make inferences about past life, climate,
geology, and environments.
Materials: Pencils, Colored Pencils, Drawing Paper, Cardstock, Handouts:
Nonsense Cards Set A Fossils Cards Set B (1) , Fossils Cards Set B (2) , Stratigraphic Section for Set B ,
Additional Web Sites The Relative Time Scale
Background for Teachers:
Invitation to Learn? Teaching about Earth’s history can be a challenge. The idea of millions and billions of years is difficult for students and adults to comprehend. However, “relative” dating or time can be an easy concept for students to learn.In this activity, students begin a sequencing activity with familiar items—letters written on cards. Once they are able to manipulate the cards into the correct sequence, they are asked to do a similar sequencing activity using fossil pictures printed on “rock layer” cards. Sequencing the rock layers will show students how paleontologists use fossils to give relative dates to rock strata.
Procedures:Before Activity
What the teacher will do: Engage - Part 1:Have the students define and identify the Law of Superposition, Radiometric Dating vs. Relative Dating. You may want to have the students compare Radiometric Dating vs. Relative Dating. Read and discuss “Background” reading passage with the students. Hand out Nonsense Cards, Set A in random order. Students place on the table and work in small groups to sequence the eight cards by comparing letters that are common to individual cards, and therefore, overlap. There should be lots of
87
discussion. The first card in the sequence has “TC” on it. If the letters “T” and “C” represent fossils in the oldest rock layer, they are the oldest fossils, or the first fossils formed in the past for this sequence of rock layers. Optional: PowerPoint of this activity (http://middleschoolscience.com/superposition-fossils.ppt) & student handout (http://middleschoolscience.com/superposition-ppt-worksheet.pdf).
During Activity
What the teacher will do:Read Procedures for Activity 1 with the students.Verify that the cards are stacked in the correct column order with the oldest rocks at the bottom.Have students complete Activity 2 with other students.Ask students to let you know when the fossil layer is correct & completedVerify responses or help them correct as needed.
After Activity
What the teacher will do:Review and discuss Analysis & Conclusion questions with the students. Reiterate that although you are reproducing Relative Dating, Radiometric Dating shows actual numbers.
Extensions: Students research different fossils to see where they are on the geologic time
scale. Research the internet for fossil trivia, then write a question and answer game
for the class. Students write a story telling the life of an animal that is facing extinction. Draw a fossil Pop-up book. Write a short definition below each picture. Students may take family field trips to a nearby fossil bed. Visit virtual dinosaur quarries Take home card sets A and B and teach a family member about the Law of
Superposition
Assessment: Checking individual stacks of cards. Verbal answers to the discussion questions. Students write a short paragraph explaining the Law of Superposition. Sequence information using items which overlap specific sets; students will
relate sequencing to the Law of Superposition and then show how fossils can be used to give relative dates to rock layers.
Bibliography:Schmoker, M. 1999. The Key to Continuous School Improvement. Results 2nd Edition Association for Supervision and Curriculum Development pg. 71“We labor under the incorrect notion that students must master basic skills before they can learn higher-order skills or engage in complex activities. Studies in math, reading, and writing clearly demonstrate that the opposite is true. Students learn best when basic skills are taught in a vital challenging context that makes the skills meaningful. The very thing that keeps students from achieving in these areas is the dry irrelevant teaching strategies we often employ, especially with students who most need real challenges.” (Means, Chelemer, and Knapp, Teaching Advanced Skills to at Risk Students: Jossey-Bass 1991) Schmoker, M. 1999 The key to continuous school improvement Results 2nd Edition ASCD pg. 73
Virtually every teacher has acquired some semblance of training in this highly effective method (cooperative learning); estimates are that only about 10 percent of teachers use cooperative learning. One of the simplest forms of cooperative learning—having students occasionally work in pairs to ensure each other’s understanding of difficult concepts— can be expected to bring immediate effects especially among low-achievers. They also found that such simple pairings are especially effective in helping students to succeed in math and science.” (Joyce B. Weil and Showers 1992 Models of Teaching. New York: Allyn and Bacon.)
Adapted from Utah Lesson Plans88

89
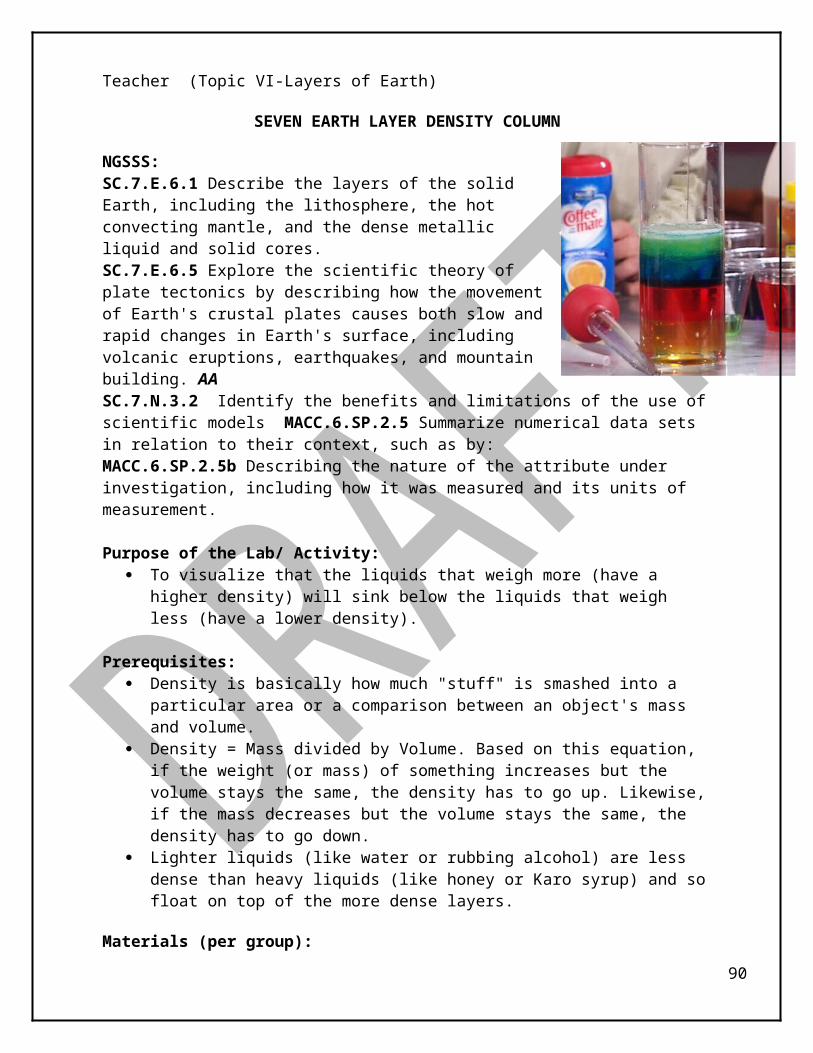
90
91
92
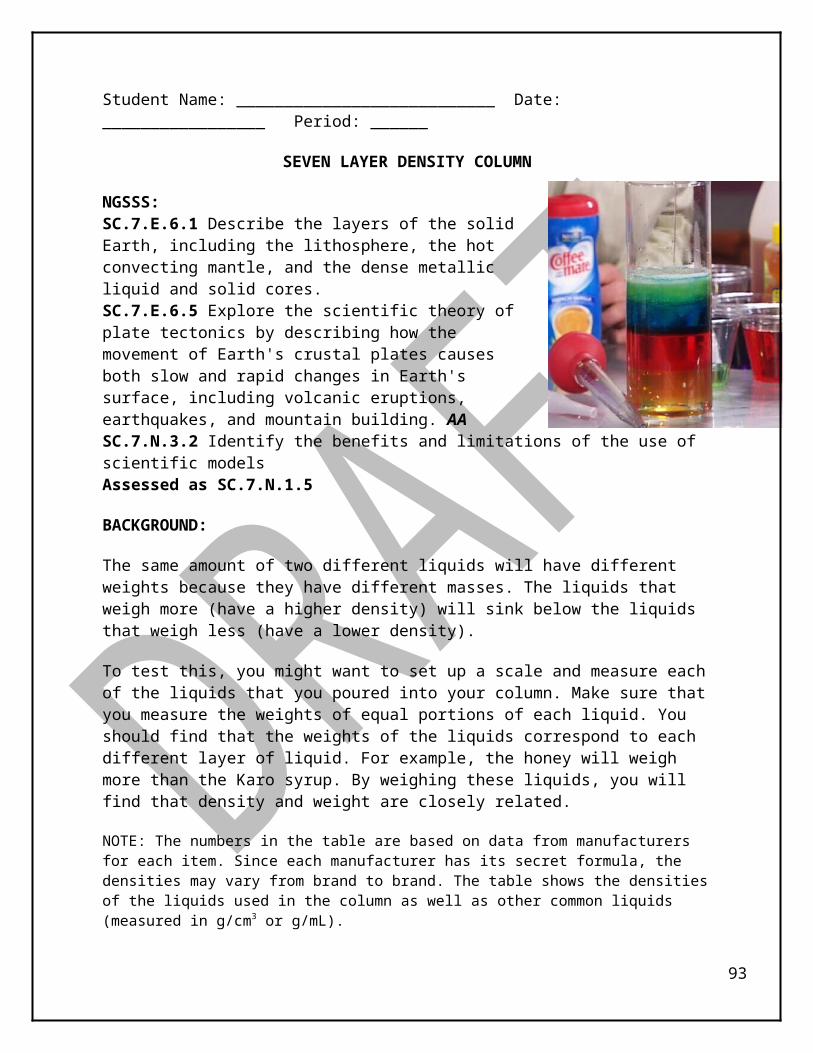
Student Name: _______________________________ Date:_________________ Period:____
FOSSILS AND THE LAW OF SUPERPOSITION
Benchmarks:SC.7.E.6.3 Identify current methods for measuring the age of Earth and its parts, including the law of superposition and radioactive dating. (Assessed as SC.7.E.6.4)SC.7.E.6.4 Explain and give examples of how physical evidence supports scientific theories that Earth has evolved over geologic time due to natural processes. (AA)
Background: Scientists have good evidence that Earth is very old, approximately four and one-half billion years old. Scientific measurements such as radiometric dating use the natural radioactivity of certain elements found in rocks to help determine their age. Scientists also use direct evidence from observations of the rock layers themselves to find the relative age of rock layers. Specific rock formations indicate a particular type of environment existing when the rock was being formed. For example, most limestone represents marine environments, whereas, sandstones with ripple marks might indicate a shoreline habitat or riverbed.
The study and comparison of exposed rock layers or strata in different areas of Earth led scientists in the early 19th century to propose that the rock layers could be correlated from place to place. Locally, physical characteristics of rocks can be compared and correlated. On a larger scale, even between continents, fossil evidence can help in matching rock layers. The Law of Superposition, which states that in an undisturbed horizontal sequence of rocks, the oldest rock layers will be on the bottom, with successively younger rocks on top. The Law of Superposition allows geologists to correlate rock layers around the world. This also means that fossils found in the lowest levels in a sequence of layered rocks represent the oldest record of life there. By matching partial sequences, the truly oldest layers with fossils can be identified.
By correlating fossils from various parts of the world, scientists are able to give relative ages to particular strata (layers). This is called relative dating. Relative dating tells scientists if a rock layer is “older” or “younger” than another, based on the fact that older rocks are pushed down and newer rocks are found above. If certain fossils are typically found only in a certain rock unit and are found in many places worldwide, they may be useful as index or guide fossils in finding the age of undated strata. By using this information from rock formations in various parts of the world and correlating the studies, scientists have been able to construct the Geologic Time Scale. This relative time scale divides the vast amount of Earth history into various sections based on geological events (sea encroachments, mountain-building, and depositional events), and notable biological events (appearance, relative abundance, or extinction of certain life forms). In this activity, you will use the Law of Superposition to fossils in the correct order in which they formed.
Vocabulary: Law of Superposition, Radiometric Dating, Geologic Time Scale, strata
93
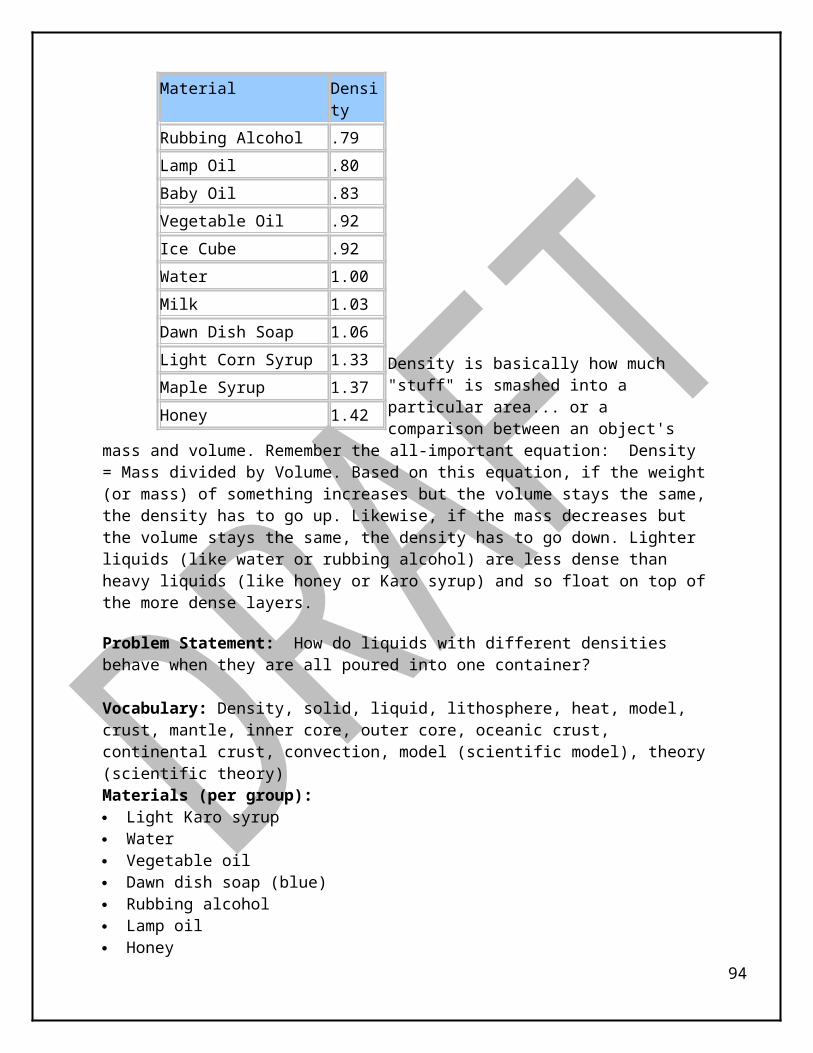
Materials: Nonsense Cards for Activity 1, Fossil Set Cards (8 total) for Activity 2
Procedures: Explore Activity 1-1. On your desk, you have 8 large colored index cards with nonsense letters placed on them.2. Your task is to determine what the correct sequence of the letters. 3. Clues: The card with the letters “C” and “T” is on the bottom, or the oldest layer Look for a card that has either a “T” or “C” written on it for the second layer Each layer must have a letter from the layer below. Analysis of Activity 1:1. After putting the cards in order, write down the sequence of letters for easy checking. Start at the bottom going oldest to youngest. ____________________________________________2. How do you know “X” is older than “M”? Explain. _____________________________________________________________________________________________________________3. Explain why “D” in the rock layer represented by DM is the same age as “M.” ____________ ____________________________________________________________________________4. Explain why “D” in the rock layer represented by the OXD is older than “D” in the rock layer represented by DM. ___________________________________________________________ ___________________________________________________________________________
Explore Activity 2:1. Look carefully at the second set of cards with sketches of fossils on them. Each card represents a particular rock layer with a collection of fossils that are found in that particular rock stratum. All of the fossils represented would be found in sedimentary rocks of marine origin. 2. The oldest rock layer is marked with the letter “M” in the lower left-hand corner. Find a rock layer that has at least one of the fossils you found in the oldest rock layer. This rock layer would be younger as indicated by the appearance of new fossils in the rock stratum. Remember that extinction is forever. If an organism disappears, it cannot reappear later. Use this information to sequence the cards in a vertical sequence of fossils in rock strata from oldest to youngest.
Analysis of Activity 2 : 1. List the order of the cards from “Oldest” to “Youngest”. ______________________________2. How does this activity relate to how geologist identify the ages of rocks? ____________________________________________________________________________________________3. Give examples from this lab on how physical evidence supports scientific theories that Earth has evolved over geologic time due to natural processes. ______________________________
94

____________________________________________________________________________________________________________________________________________________________________________________________________________________________________Content Analysis: (Hint! Use Background information if you need help.)1. According to most scientists, how old is the Earth? _________________ How do they know? ___________________________________________________________________________2. Give an example of how specific rock formations indicate a particular type of environment existing when the rock was being formed. _____________________________________________________________________________________________________________________3. How do scientist measure the absolute or exact age of Fossils or rocks? __________________________________________________________________________________________4. What are index or guide fossils? _______________________________________________5. What was used to create the Geologic Time Scale? ________________________________6. Scientists use several methods to identify the age of the Earth, it’s layers, and fossils. Which method do you think is the most reliable for determining age. Explain your reasoning. _______
STUDENT HANDOUT
DIFFERENTIATED INSTRUCTION: OPEN INQUIRY
FOSSILS AND THE LAW OF SUPERPOSITION
95
Objective/Purpose: Use knowledge about fossils to arrange fossil in sequence from oldest to
youngest. Explain how fossils can be used to make inferences about past life, climate,
geology, and environments.
Demonstrate Achievement of the following Goals: Develop a problem statement about fossil investigations. Create a model to demonstrate the concept/idea outlined in your problem
statement above. How does the model demonstrate the concept/idea that you investigated? Use the “Claim, Evidence & Reasoning” rubric to defend your claims when
writing your conclusion.
96

Teacher (Topic X- Evidence of Species Change)
BECOMING WHALES: FOSSIL RECORDSSource: http://www2.edc.org/weblabs/ExploringEvolution/evolution.swf\
Adapted from Becoming Whales: Experiencing Discoveries of Whale Evolution by Larry Flammer, 8 October 1997 [revised Nov. 2002]
http://www.indiana.edu/~ensiweb/lessons/whale.ev.html
Benchmarks:SC.7.L.15.1 Recognize that fossil evidence is consistent with the scientific theory of evolution that living things evolved from earlier species. (Assessed as SC.7.L.15.2) SC.7.N.1.3 Distinguish between an experiment (which must involve the identification and control of variables) and other forms of scientific investigation and explain that not all scientific knowledge is derived from experimentation. (Assessed as SC.7.N.1.1)SC.7.N.1.5 Describe the methods used in the pursuit of a scientific explanation as seen in different fields of science such as biology, geology, and physics. (AA)SC.7.N.1.7 Explain that scientific knowledge is the result of a great deal of debate and confirmation within the science community. (Assessed as SC.7.N.2.2)
Objectives/Purpose: 1. Examine evidence of evolutionary history of modern whales by investigating the fossil record (paleontological evidence) of several whale “cousins” from the Eocene Epoch (~58-35 mya).2. Construct the evolution of modern whales along a timeline of the history of the Earth and discuss the age of the Earth. 3. Identify the evidence to the understanding evolution of whales to the scientific theory of evolution.
97
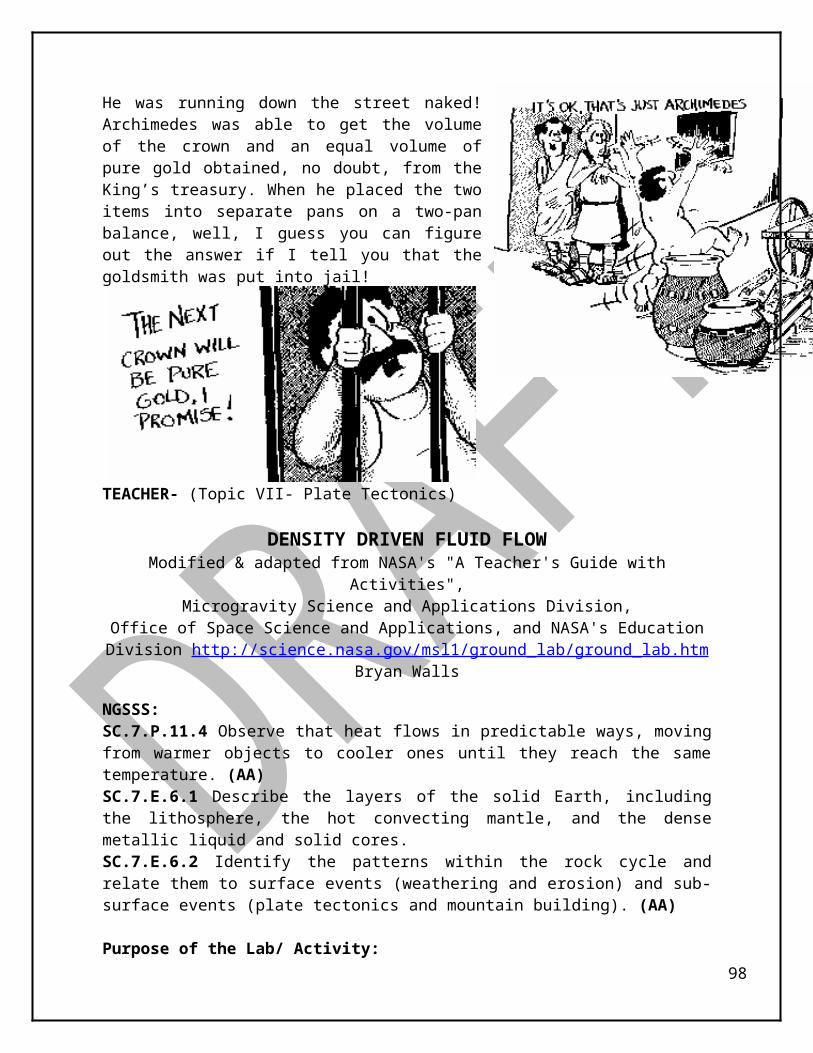
Materials: Whales in the Making Pictures, Handout with Background, Lab Data sheet.
Procedures: Before Activity
What the teacher will do: Engage:Has anyone seen a real whale? Where? What kind? See smaller whales and larger whales (Examine “Some Modern Whales”. Compare the baleen and toothed)What kind of animal is a whale? What are some of their mammalian features How big are these whales? As big as a room? Bigger? Smaller? Examine the size of whales from smallest to largest-about 1.4 m to 21 m) use a meter tape/stick or rope to visualize the size humpback or gray whale which is half that of a blue whale or use a Interactive white board if available to view the actual size of a blue whaleMath connection: Whale length-table for overhead projector, so students can make full size strips of adding machine tape to match actual whale lengths (modern and extinct) to get a realistic sense of relative sizes (optional).Discuss “What Kind of Creature is a Whale” [a Mammal]..... some of their features? Big, swim in oceans, nurse their young, hair…Hind limb buds on whale embryo, Hip bones in adult whales How long have whales been on Earth? Where did they come from? Display time line- Cenozoic Time Line Have students individually hypothesize where they believe whales came from and illustrate what whales may have looked like long ago.Assign groups of 2-4 if needed.
During Activity
What the teacher will do: ExploreModel the completion of the Data Table as needed per class.
After Activity
What the teacher will do:Discuss and Review Data Table and Extension questions.Review and discuss how the arrangement of the whale fossils differed from that suggested by the handouts.
Elaborate/Extension:If you have access, view the short (5 minute) PBS video online at: http://www.pbs.org/wgbh/evolution/library/03/4/l_034_05.html
Using History of Earth timeline, situate the Eocene Epoch and Cenozoic in its proper location along the timeline tape. Discuss the relative length of the history of the Earth compared to the length of the evolutionary history of whales. If it doesn’t arise in the discussion, point out that the evolutionary process is an extremely lengthy process; the common misconception is the confusion of macroevolution with microevolution. Prepare a Timeline to scale – 3 cm = 1 million years Also available is the timeline for the 4.5 billion year history of our Solar System and other models. Evolution of Whales and Virtual Lab
Evaluate:Return to the explanation of how whales may have evolved from a land-dwelling ancestor. Reflect on what you have learned about the origins of whales and revise your response to this prompt.
Extension:
98
Whales may be related to deer-like creature : ; http://www.indiana.edu/~ensiweb/lessons/wh.ph.os.html ; The organsystems of ancient whales that we study: http://www.indiana.edu/~ensiweb/lessons/whalekiosk.html
99
Whales in the Making
1. Archaelcetes(primitive whales)
Dorudon
100
2. Mesonychids(extinct land mammals with whale- like teeth)
Pachyaena
3. Pakicetus inactus
101
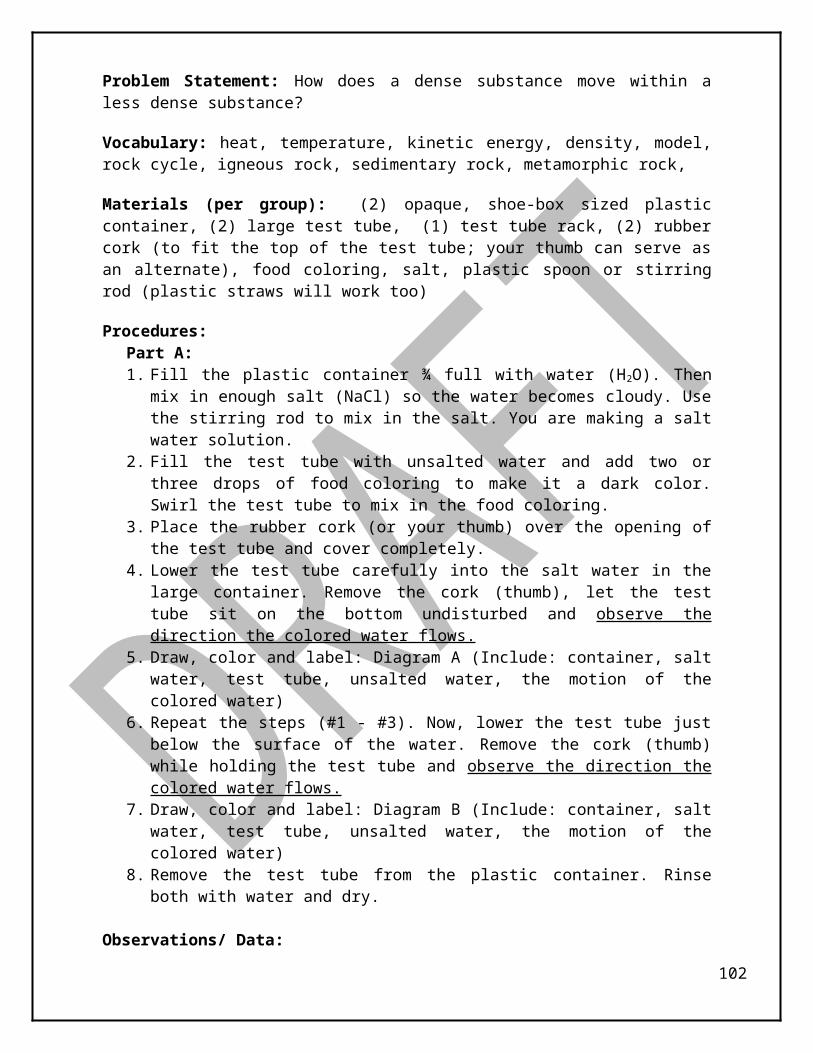
4.Basilosaurus isis
5.Rodhocetus kasrani
102
6.Ambulacetus natans
103
WHALE HUNT: BACKGROUND SEARCHING FOR WHALE FOSSILS
1. We have NO fossils of modern whales earlier than about 25 million years ago (mya).However, for many years, we have been finding a number of fossils of various primitive whales(archaeocetes) between 25 and 45 million years old, and somewhat different from modern whales, e.g. with very distinctive teeth An example of these early whales would be Dorudon. Place the fossil picture strip of Dorudon at about 36 mya on your timeline (actual range about 39-36 mya); (“mya”=millions of years ago). Dorudon lived in the shallow warm seas around the world. This is supported by their fossils usually found in deposits indicative of fully marine environments, lacking any freshwater influx They were probably distributed throughout the tropical and subtropical seas of the world.
2. As more fossils have been discovered from the early Eocene (55 to 34 mya), we searched for a land mammal from which whales most likely evolved. The group of animals that had features like those distinctive teeth that are also found in the earliest primitive whales, was called the Mesonychids. A typical example of these animals was Pachyaena. The legs were presumably functional both on land and in the sea. It could easily support its own weight while on land, the tibia differs little from that of the fully terrestrial mesonychid The Pachyaena live near the coastal areas, typicaly foraging in shallow water, wetlands and near by shore vegetation. Mesonychids also had hooves, suggesting that whales may be related to other animals with hooves, like cows, horses, deer and pigs. Place the Pachyaena strip at about the 55 mya level on your timeline. Mesonychids lived from 58-34 mya.
3. In 1983, all we had were these primitive whales and mesonychids, with a big gap in between. This year, paleontologist Philip Gingerich was searching in Eocene deposits in Pakistan, and found the skull of an amazing fossil. It had teeth like the Dorudon whale, with whale-like ear bones and other features, but it was much older (50 mya), and there were indications that it had four legs. But the skull also had characteristics in common with the Archaeocetes, the oldest known whales. The new bones, dubbed Pakicetus, proved to have key features that were transitional between terrestrial mammals and the earliest true whales. One of the most interesting was the ear region of the skull. In whales, it is extensively modified for directional hearing underwater. In Pakicetus, the ear region is intermediate between that of terrestrial and fully aquatic animals. Possible semi-aquatic nature. However, in 2009 Thewissen et al. argued that "the orbits ... of these cetaceans were located close together on top of the skull, as is common in aquatic animals that live in water but look at emerged objects. Just like Indohyus, limb bones of pakicetids suggestive of aquatic habitat” (since heavy bones provide ballast).Somewhat more complete skeletal remains were discovered in 2001, prompting the view that Pakicetus was primarily a land animal about the size of a wolf. He called this Pakicetus, so place your Pakicetus strip on your timeline at 50 mya. Later, more complete fossils confirmed that it had 4 walking legs, with tiny hooves!
4. In 1990, in Egypt, Gingerich’s team found the tiny hind limb bones of Basilosaurus. There were lots of Basilosaurus skeletons there (once covered by the Mediterranean). Basilosaurus had first been discovered in the Appalachians of America. These new leg fossils were about 37 my old, so place the Basilosaurus strip at 37 mya on your time line. The legs were about 2 feet long, and useless for carrying the animal on land. By 40 million years ago, Basilosaurus -- clearly an animal fully adapted to an aquatic
104
environment -- was swimming the ancient seas, propelled by its sturdy flippers and long, flexible body. Yet Basilosaurus still retained small, weak hind legs -- baggage from its evolutionary past -- even though it could not walk on land. Both basilosaurids and dorudontids have skeletons that are immediately recognizable as cetaceans. A basilosaurid was as big as the larger modern whales, up to 18 m (60 ft) long; dorudontids were smaller, about 5 m (16 ft) long. They had a tail fluke, but their body proportions suggest that it swam by caudal undulation and that the fluke was not the propulsive organ. The forelimbs of basilosaurids and dorudontids were probably flipper-shaped, and the external hind limbs were tiny and are certainly not involved in locomotion. Their fingers, on the other hand, still retain the mobile joints of their ambulocetid relatives
5. In early 1994, Gingerich was hunting in Pakistan again, in Eocene sediments, and found the fossil remains of a 4-legged early whale that was more recent than Pakicetus, and with more aquatic features (shorter legs, whale-like ear bones, skull with nostril between eyes and tip of nose). Rhodocetus shows evidence of an increasingly marine lifestyle. Its neck vertebrae are shorter, giving it a less flexible, more stable neck -- an adaptation for swimming also seen in other aquatic animals such as sea cows, and in an extreme form in modern whales. The ear region of its skull is more specialized for underwater hearing. And its legs are disengaged from its pelvis, symbolizing the severance of the connection to land locomotion. The ear bones of Rodhocetus are already very whale-like, though the swimming style is very different. Rodhocetus is more obviously aquatic than earlier known species and had large, paddling hind feet to propel it through the water. It also had a strong tail which may have helped to act as a rudder. He called it Rodhocetus. Place the Rodhocetus strip at 46 mya. Rodhocetus also had tiny hooves on its toes!
6. NOW, notice the gap between the very terrestrial Pakicetus at 50 mya and the clearly more aquatic Rodhocetus at 46 mya. Talk with your partners about what you think an animal intermediate between Pakicetus and Rodhocetus might look like, and where you would most likely find that animal. Make a sketch of what you think it would look like and what habitat it might have lived in.
7. After most of you have “made your predictions” (shown your drawings to your teacher), you will be shown the next discovery...
8. In late 1994, Hans Thewissen (one of Gingerich’s students) was searching ....where?.....[right, Pakistan]... in 49 my old deposits, and found a nearly complete fossil of what he called “The Walking Whale” - Ambulocetus. Place the Ambulocetus strip at 49 mya years ago, between Pakicetus and Rodhocetus. It was about the size of a large sea lion, and with its huge hind feet, probably swam like an otter. It also had whale-like ear-bones and little hooves on its toes! Ambulocetus, was an amphibious animal. Its forelimbs were equipped with fingers and small hooves. The hind feet of Ambulocetus, however, were clearly adapted for swimming. Functional analysis of its skeleton shows that it could get around effectively on land and could swim by pushing back with its hind feet and undulating its tail, as otters do today. Having the appearance of a 3 meter (10-foot) long mammalian crocodile, it was clearly amphibious, as its back legs are better adapted for swimming than for walking on land, and it probably swam by undulating its back vertically, as otters and whales do. It has been speculated that Ambulocetids hunted like crocodiles, lurking in the shallows to
105
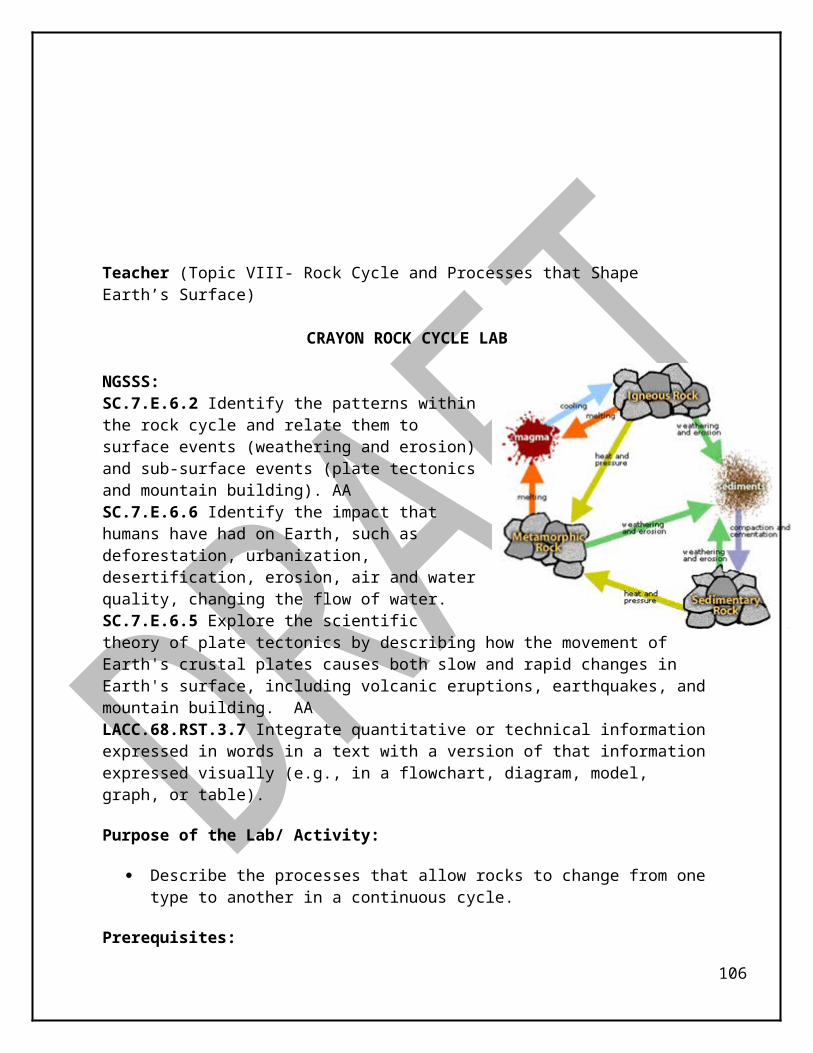
snatch unsuspecting prey. Chemical analysis of its teeth shows that it was able to move between salt and fresh water. Scientists consider Ambulocetus to be an early whale because it shares underwater adaptations with them: it had an adaptation in the nose that enabled it to swallow underwater, and its periotic bones had a structure like those of whales, enabling it to hear well underwater. In addition, its teeth are similar to those of early cetaceans. Ambulocetus ("walking whale") was an early cetacean that could walk as well as swim. ambulocetids inhabited the bays and estuaries of the Tethys Ocean in northern Pakistan. It is clear that ambulocetids tolerated a wide range of salt concentrations Hence, ambulocetids represent the transition phase of cetacean ancestors between fresh water and marine habitat.
Student Name: ____________________________ Date: _________________ Period: ____
BECOMING WHALES: FOSSIL RECORDS
Benchmarks: SC.7.L.15.1 Recognize that fossil evidence is consistent with the scientific theory of evolution that living things evolved from earlier species. SC.7.N.1.3 Distinguish between an experiment (with variables) and other forms of scientific investigation and explain that not all scientific knowledge is derived from experimentation. SC.7.N.1.5 Describe the methods used in the pursuit of a scientific explanation as seen in different fields of science such as biology, geology, and physics. SC.7.N.1.7 Explain that scientific knowledge is the result of a great deal of debate and confirmation within the science community.
Background: Have you ever wondered how whales got here? What did they once look like?If, as it is widely believed by paleontologists, whales did evolve from terrestrial mammals, we should be able to find the fossil remains of early “pre-whales”,
probably somewhat whale-like, but with legs of varying degrees of reduction and certain other features of varying degrees of similarity to ancestral and modern whales. In this activity, you will be investigating how paleontologists believe whales have morphed.
Procedures: 1. Take the five drawings of fossils whales (either in full or partial), that lived between 55 and 34 million years ago and analyze the difference between the whales.2. Cut up the 5 different drawings of the reconstructions of what these “whales in the making” may have looked like.
106

3. Use the brief information sheet titled: WHALE HUNT: SEARCHING FOR WHALE FOSSILS which includes the critical morphological (=shape or form) features that paleontologists used to identify when the species existed during the Eocene Epoch approximately 58 million years ago to complete the Whale Evolution Data Table.4. In groups of 2-4, arrange these early whale “cousins” in the order on the Eocene timeline in which you think they may have appeared in the fossil record. Be sure to write down the evidence upon which you based your decisions.
107
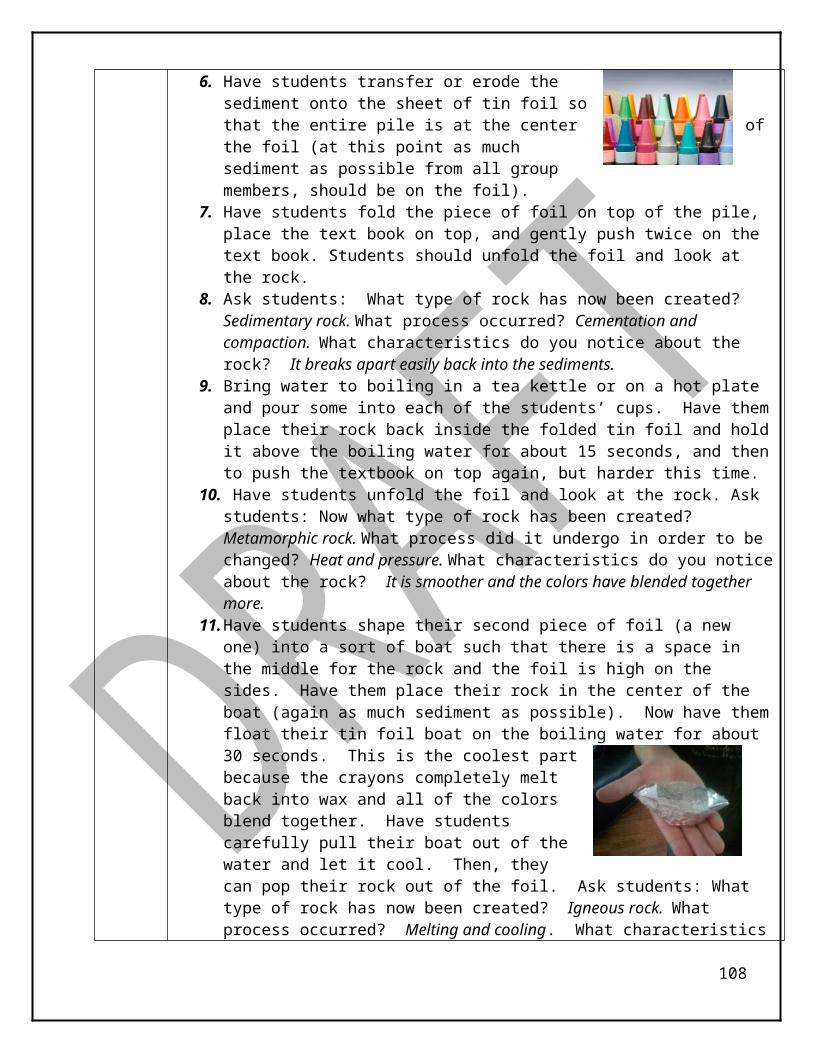
Whale Evolution Data Table:
Name Mesonychidse.g.
Pachyaena
Pakicetus Ambulocetus Rhodocetus Basilosaurus Archaelcetes
Geological age (mya)Habitat (land, fresh water, marine, shallow sea, open ocean)
Skull, teeth, ear structure, types most like….
aquatic or land mammal?Limbs and tail:
Description:
Did it swim?
How?

STUDENT HANDOUT
DIFFERENTIATED INSTRUCTION: OPEN INQUIRY
BECOMING WHALES : FOSSIL RECORDS
Objectives/Purpose: Examine evidence of evolutionary history of modern whales by investigating the fossil
record (paleontological evidence) of several whale “cousins” from the Eocene Epoch (~58-35 mya).
Construct the evolution of modern whales along a timeline of the history of the Earth and discuss the age of the Earth along with the time frame in which macroevolution occurs.
Compare the evidence to the understanding evolution of whales to the scientific theory of evolution.
Demonstrate Achievement of the following Goals: Develop a problem statement about the history and evolution of whales. Create a model to demonstrate the concept/idea outlined in your problem statement above. How does the model demonstrate the concept/idea that you investigated? Use the “Claim, Evidence & Reasoning” rubric to defend your claims when writing your
conclusion.
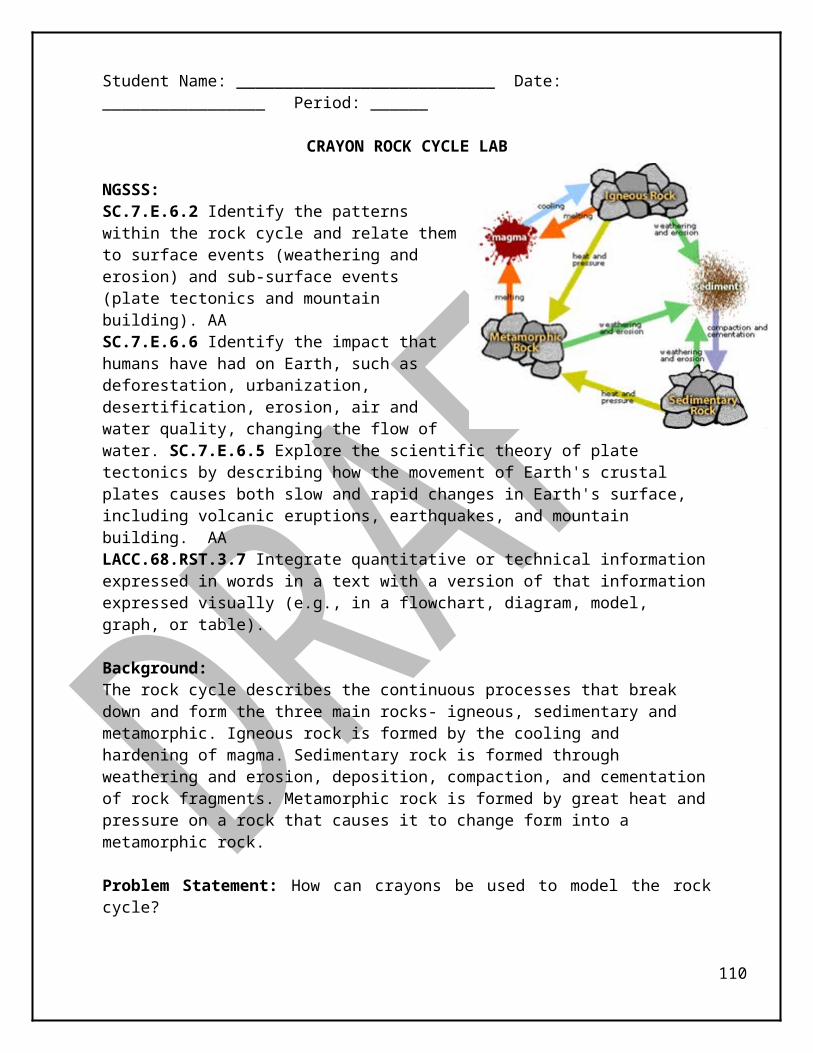
Teacher (Topic X- Evidence of Species Change)
MOTH CATCHERSource: Predator Avoidance
Camouflage (http://www.flmnh.ufl.edu/education/guides/butterfly-guide.pdf)
Benchmarks:SC.7.L.15.2 Explore the scientific theory of evolution by recognizing and explaining ways in which genetic variation and environmental factors contribute to evolution by natural selection and diversity of organisms. (AA)SC.7.N.1.3 Distinguish between an experiment (which must involve the identification and control of variables) and other forms of scientific investigation and explain that not all scientific knowledge is derived from experimentation. (Assessed SC.8.N.1.1)SC.7.N.1.5 Describe the methods used in the pursuit of a scientific explanation as seen in different fields of science such as biology, geology, and physics. (AA)
Objectives/Purpose: Identify ways in which genetic variation and environmental factors contribute to evolution by
natural selection and diversity of organisms.Materials: Tape, Crayons and/or Markers, Scissors, Drawing paper
Before Activity
What the teacher will do: / Engage:1. Review camouflage briefly with the class. 2. Ask students to brainstorm animals that relay on Butterflies, moths, or insects for food. 3. Discuss how some animals (for example, birds, bats, spiders, dragonflies, and mice) rely
heavily on Lepidoptera which are butterflies, moths, and insects for food. 4. Ask students: What are some strategies butterflies, moths and insects have evolved to
keep from being eaten. 5. Lead discussion to camouflage and tell students that they are going to mimic camouflage
in this lab. During Activity
What the teacher will do: Explore:1. Have students draw, cut, and color a butterfly or moth. 2. Ask each child to make a butterfly that would be camouflaged in the classroom.3. When completed, have kids attach a piece of tape to the back and break the class into
groups of 5-8.4. Have the students hide their butterflies around the room in places where their butterflies
would be difficult to see. 5. Read procedures with the students. 6. You can choose to assign the kids the role of a bird, bat, dragonfly, spider, mice, lizard.7. When the first group is done have the rest of the class get up and try to find the
camouflaged butterflies.8. When all butterflies have been found, let the next group hide their butterflies.9. Continue this process until all students have had a chance to hide their butterflies.
After Activity
What the teacher will do: Explain1. Review the Analysis questions with the students.2. Discuss how over time, the species that blend in the best are able to grow and reproduce, hence leading to evolutionary changes and genetic variation.
Extension: Research more about the Peppered Moth and the debate and Virtual Lab
(http://www.biologycorner.com/worksheets/pepperedmoth.html ) Adapted from Florida Museum of Natural History http://www.flmnh.ufl.edu lesson 13
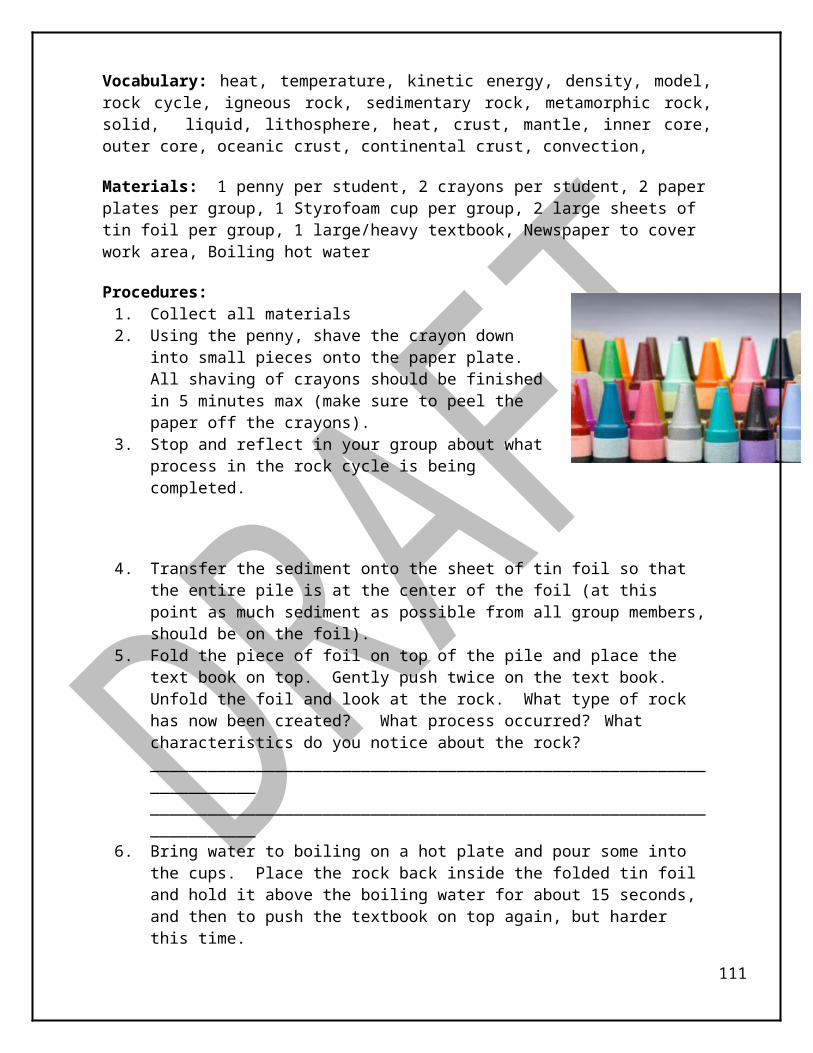
Student Name:_____________________________ Date:__________________ Period: _____
MOTH CATCHERSource: Predator Avoidance Camouflage (http://www.flmnh.ufl.edu/education/guides/butterfly-guide.pdf)
Benchmarks:SC.7.L.15.2 Explore the scientific theory of evolution by recognizing and explaining ways in which genetic variation and environmental factors contribute to evolution by natural selection and diversity of organisms. (AA) SC.7.N.1.3 Distinguish between an experiment (which must involve the identification and control of variables) and other forms of scientific investigation and explain that not all scientific knowledge is derived from experimentation. (Assessed SC.8.N.1.1) SC.7.N.1.5 Describe the methods used in the pursuit of a scientific explanation as seen in different fields of science such as biology, geology, and physics. (AA)
Background: Butterflies and moths have evolved several strategies to keep from being eaten. These include warning coloration, camouflage, and even Mimicry. In bright warning coloration, yellow-and-black, orange, or red, warn birds and other predators that such insects may bite, sting, taste badly or are poisonous. In camouflage Moths and many butterflies, particularly females, have earth-tone colors or patterns that resemble tree bark, lichens, or leaves. This “cryptic coloration” allows them to avoid predators by blending into their surroundings. In Mimicry, some butterflies and moths deter predators by copying the color pattern of other less edible species or other insects, plants, and animals. There are two types of mimicry known. Batesian Mimicry and Mullerian Mimicry. In Batesian Mimicry, some harmless Lepidoptera species “pretend” to be poisonous and predators avoid them. In Mullerian Mimicry, two different species copy the warning characteristics of one another and are both poisonous or distasteful. When a predator attacks one of the two, it remembers the color. Mimicry, Camouflage and warning coloration has been studied continuously and are a great examples of how environmental factors contribute to evolution and diversity of organisms. In this lab, you will practice camouflage and survival.
Procedures:
1. You are going to play a camouflage game. You will take turns being Predators, and are going to make butterflies that will be prey to another group.2. Draw, color, and cut a butterfly that would be able to blend in with some part of this classroom. (Think of size, and coloration) 2. When told to do so, place the cutout on the room’s perimeter (environment) to best camouflage them using a piece of tape. Your challenge is to have the moth survive an outside predator! 3. All moths must be placed in plain sight. (They can’t be partially covered by objects!) Moths can’t be placed on the ceiling or the floor! Your Moth will be exposed to predators. 4. When Predators are set loose, they can only make 1 complete trip around the room looking for food. Once they have passed a spot they cannot go back to it.5. When you are the predators, decide who will be the Bird, Bat, Dragonfly, Spider, Mice, Lizard, or Frog that will eat the butterfly or moth.

Data:
Explain:1. Analyze your data. Identify which “Predator” collected the most Lepidoptera? _____________________________
2. What strategy did that “Predator” use to make him/her more successful? ________________________________
________________________________________________
3. How does their strategy relate to a strategy used in nature? _________________________________________________________________________________________
4. Asses what this experiment shows about how prey is selected by predators? _____________________________
________________________________________________
5. Infer how this activity models natural selection? ________________________________________________
________________________________________________________________________________________________
6. Explain how luck and location are important factors. ________________________________________________________________________________________________
7. Which moth coloration (light or dark) would be the best adaptation for a newspaper background? Explain. _________________________________________________________________________
Predator Number of
Lepidoptera
eaten (Moths)
Bird
Bat
Dragonfly
Spider
Mice
Lizard
Frog

8. Compare and contrast advantage(s)/disadvantage(s) of using camouflage as a survival strategy. Advantages: _______________________________________________________ Disadvantages: _____________________________________________________________
Conclusion:
1. In England during the industrial revolution, factories burned so much coal that the trees in the countryside gradually became coated with dark soot over a long period of time. Infer how the moths in this area responded/adapted to their slowly changing environment? __________________________________________________________________________________________________________________________________________________
2. How did the environmental factors of soot affect the evolution of the species? __________________________________________________________________________________________________________________________________________________3. What field of science would a scientist studying Lepidoptera species fall into? _________________________________________________________________________What methods might that scientist use to learn about the species? _____________________________________________________________________________________________
4. Examine the table below. Construct a graph to represent the data. Plot the years of study on the x-axis and the number of moths captured on the y-axis. You should have 2 lines on your graph –one for light moths, and one for dark moths.
Year# of Light
Moths Captured
# of Dark Moths
Captured
2 537 112
3 484 198
4 392 210
5 246 281
6 225 337
7 193 412
8 147 503
9 84 550
10 56 599
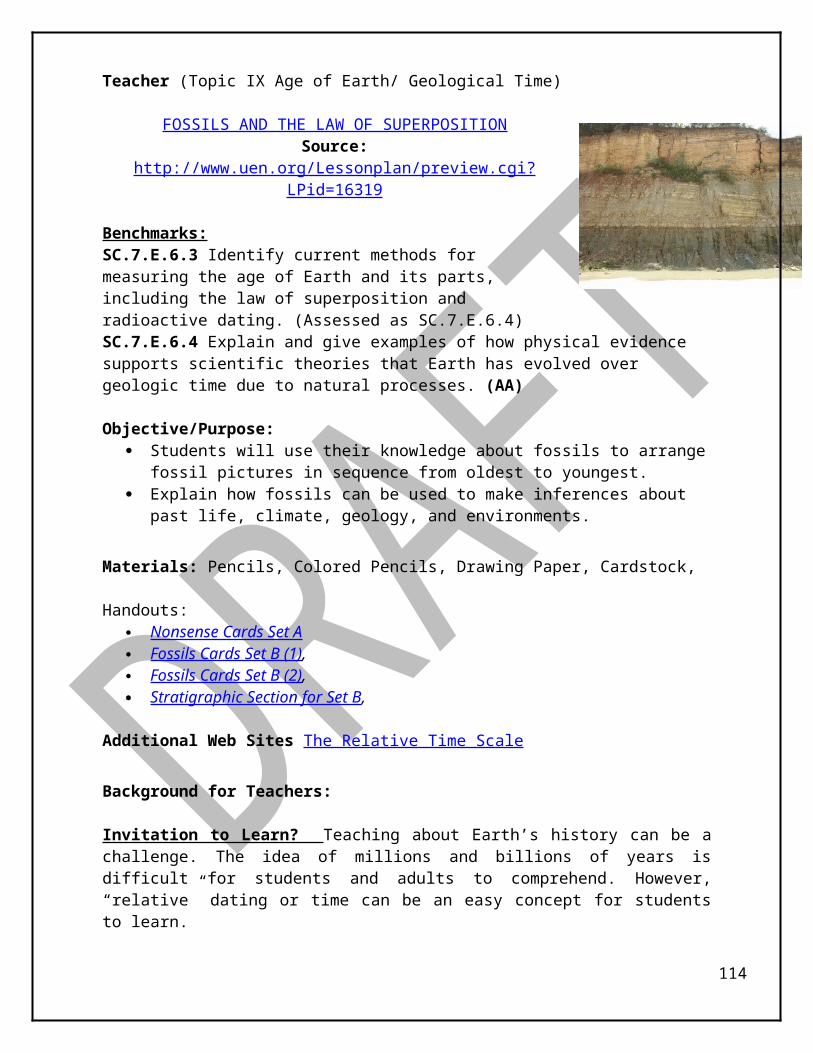
STUDENT HANDOUT
DIFFERENTIATED INSTRUCTION: OPEN INQUIRY
MOTH CATCHER
Objectives/Purpose: Identify ways in which genetic variation and environmental factors contribute to evolution
by natural selection and diversity of organisms.
Demonstrate Achievement of the following Goals: Develop a problem statement about natural selection, diversity of organisms and
camouflage. State your hypothesis. Using the materials provided design an experiment to test your hypothesis. Carry out the experiment you designed. Submit a completed lab report to your teacher. Use the “Claim, Evidence & Reasoning” rubric to defend your claims when writing your
conclusion.

Teacher (Topic XI- Natural Selection)
Bird Beak Adaptation
Benchmark: SC.7.L.15.3 Explore the scientific theory of evolution by relating how the inability of a species to adapt within a changing environment may contribute to the extinction of that species. (Assessed as SC.7.L.15.2-Explore the scientific theory of evolution by recognizing and explaining ways in which genetic variation and environmental factors contribute to evolution by natural selection and diversity of organisms.) SC.7.L.17.3 Describe and investigate various limiting factors in the local ecosystem and their impact on native populations, including food, shelter, water, space, disease, parasitism, predation, and nesting sites.
Purpose: To learn about the advantages and disadvantages of phenotype variation and limiting factors through simulating birds with different types of beaks competing for various foods.
Prerequisites: Recognize that there are variations amongst different bird species.
Materials (per group):
Ziploc bag with red, white, black, and chick peas (garbanzo) beans, chop sticks, tweezers, fork, modified fork (broken fork), spoon, cups (Can be changed to using other tools such as binder clips, or clothes pins, etc.)
Procedures:Before Activity
What the teacher will do:a. Activate Prior knowledge by asking students the following: What do animals
compete for in the wild? If you broke your hand, how would you be able to complete basic tasks such as brushing your teeth, eating and washing your face? During the discussion, students should bring up what are adaptations.
b. Read background to students and have a discussion about helpful adaptations and how they are passed on to offspring
c. Show pictures of different types of iguanas and have students describe and explain why there are variations.
d. Prepare Ziploc bags with materials for each group. e. Read and review Background and instructions with the students.f. Make sure students understand that they can fill in their data table by rotating
the “beaks”.g. Have a practice round so the students can practice “feeding” with one hand
holding their stomachs with the other.h. Make sure students clear their desks so as not to use books or other materials
to help them feed.i. When describing the materials, discuss the broken fork as a representation of a
broken beak. Ask the students: What happens to animals in the wild when they break a vital body part such as a beak?
During Activity
What the teacher will do:a. Manipulate the time or countdown clock.b. After a few trials, teacher may choose to say something like “a disease affected the
fish and now there is less fish” and collect some beans from each table before the next “feeding” session.
c. Allow the students’ time to count their beans and record it correctly on the data table.
d. If students complain about there being more of one bean, relate it to how there are sometimes more of a particular food in certain areas over others.
e. Make sure students are filling out their data table correctly
After Activity
What the teacher will do:a. Lead discussion and focus on the investigation questions.b. Discuss how variation occurs over many generations.
ELABORATE/EXTENSION: Research other examples of organisms that have genetics variations that have resulted in survival of their species. Using this information, create a PowerPoint presentation which shows how species have passed on beneficial characteristics (adaptations) to their offspring to ensure the survival of the species.

Student Name: ___________________________ Date: ____________________ Period:_____
Bird’s Beak Adaptation
Benchmark/ Objective: Explore the scientific theory of evolution by relating how the inability of a species to adapt within a changing environment may contribute to the extinction of that species. Explore the scientific theory of evolution by recognizing and explaining ways in which genetic variation and environmental factors contribute to evolution by natural selection and diversity of organisms. Describe and investigate various limiting factors in the local ecosystem and their impact on native populations, including food, shelter, water, space, disease, parasitism, predation, and nesting sites.
Background: Animals depend on their physical features to help them obtain food, keep safe, build homes, withstand weather, and attract mates. These physical features are called physical variations. In the wild, animals that have variations that enable them to take advantage of available foods and resources will be more likely to survive. This process ensures that beneficial adaptations will continue in future generations, while disadvantageous characteristics will not. Understanding adaptive variations is required in understanding how populations exist in ecosystems evolve over time. The shape of a bird's beak, color, thickness or thinness of the fur, and even the shape of the nose or ears are physical adaptations that help animals survive. In this lab, you will investigate how different utensils make collecting different objects easier or more difficult.
Materials: red, white, black, and brown beans, chop sticks, tweezers, fork, modified fork, spoon
Procedures:1. You are a very hungry bird. The tool represents your “beak”. You can only use your beak
to pick up food. The cup is your stomach. You must hold your beak in one hand and your stomach in your other hand, close to your body and standing upright. Only food that is placed in the cup by the beak has been “eaten”. Select a “beak” for each trial.
2. Scatter each of the different types of food on your (table) “habitat”. When the teacher says “Go” you will have 30 seconds to feed (or until the food runs out). Collect as much food in your stomach as possible until the teacher says “Stop”.
3. After each trail, you are to use a different “beak”.4. Complete the data table upon each feeding session.
Hypothesis: __________ utensil will collect the most __________ colored beans..Materials: Ziploc bag with red, white, black and chick peas (garbanzo) beans, chopsticks, tweezers, fork, modified fork (broken fork), spoon, cups
Data:

Utensil Type # of Red beans
# of White Beans
# of BlackBeans
# of BrownBeans (Chick Peas (Garbanzos)
Total # of Beans
Chop Sticks
Tweezer
Spoon
Fork
Modified fork
Total # of Beans
Analysis & Conclusion:
1. According to the data, which color bean was picked up the most? _____________________ Why do you think that bean was picked up the most? ________________________________________________________________________________________________________
2.Which type of beak was best adapted to each type of food? Which beak was least adapted to each type of food? ___________________________________________________________________________________________________________________________________
3. If the utensils represented the beaks of different birds, which utensil would you prefer to have as a beak and why. __________________________________________________________________________________________________________________________________
4. Do you think that the type of beak a bird has affects its ability to survive? ______________ Explain your answer. _______________________________________________________________________________________________________________________________
5.What did you notice about your behavior and the behavior of the other “birds”? Was the behavior of the birds analogous to the behavior of real birds in the wild? __________________________________________________________________________________________________________________________________________________________________
6. Using the following rating system, describe what your life would be like if you were a bird with a tweezer beak. Explain your conclusion.
Total # of Beans Ability to Survive0-10 Would die of starvation11-15 Would be very vulnerable to disease15-20 Would be able to live, but would be unable to reproduce21 or more Able to live and reproduce
__________________________________________________________________________________________________________________________________________________
7. When members of a species compete, what do they compete for? ___________________________________________________________________________________________
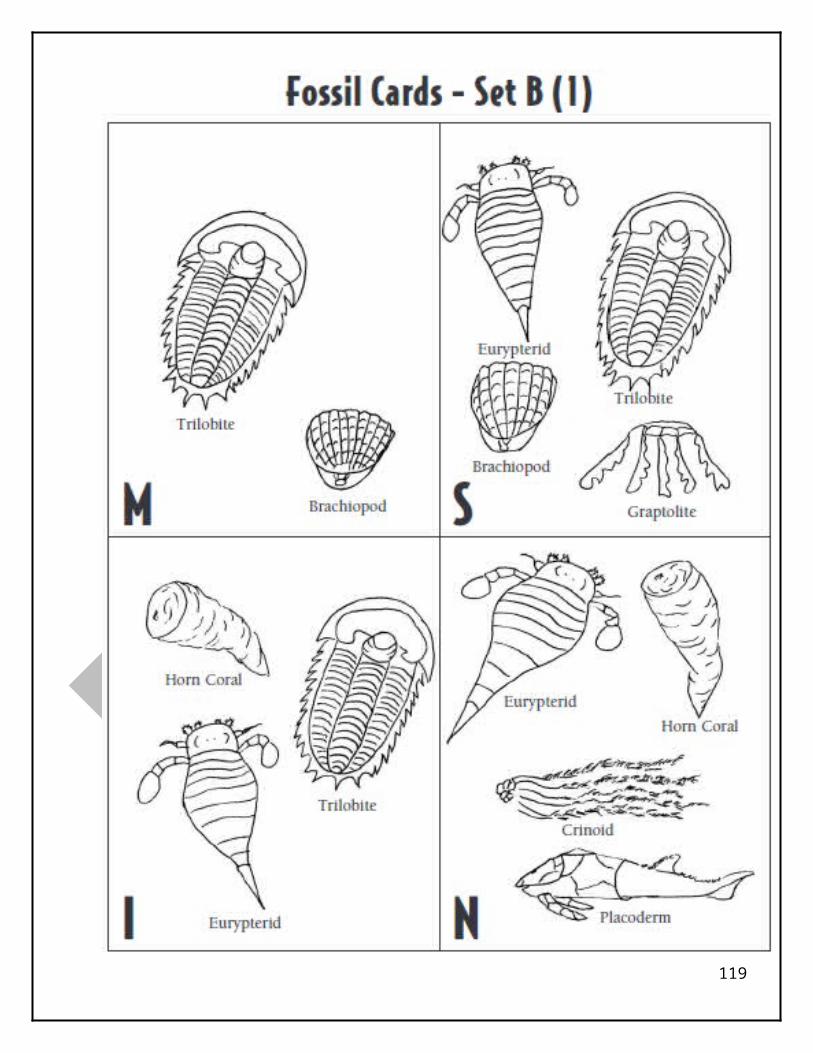
8. During the winter, the arctic fox does not produce fur pigment and its fur appears white which blends in with the surrounding snow. Why is this an example of an environmental adaptation? ______________________________________________________________________________________________________________________________________________________________________________________________________________________________________________________________________________________
9. How do helpful variations accumulate in a species over time? ______________________________________________________________________________________________Why do these variations exist? _______________________________________________ ________________________________________________________________________
10. In the Galapagos Islands, Darwin noted that there were many physical changes that occurred over generations between the organisms in the mainland and those from the Island. How can isolation of a group result in a new species? _______________________________________________________________________________________________
11. Graph your results from the total number of beans you collected. Remember to label the X and Y axis.
12.What type of graph did you use? Explain why. _____________________________________________________________________________________________________________
13.How does your graph compare to those of your peers? Explain why you think that may be. __________________________________________________________________________________________________________________________________________________
14.How does the lab simulation provide support for the theory of evolution?__________________________________________________________________________________________________________________________________________________________________
15.Complete a Claim, Evidence and Reasoning for this activity.
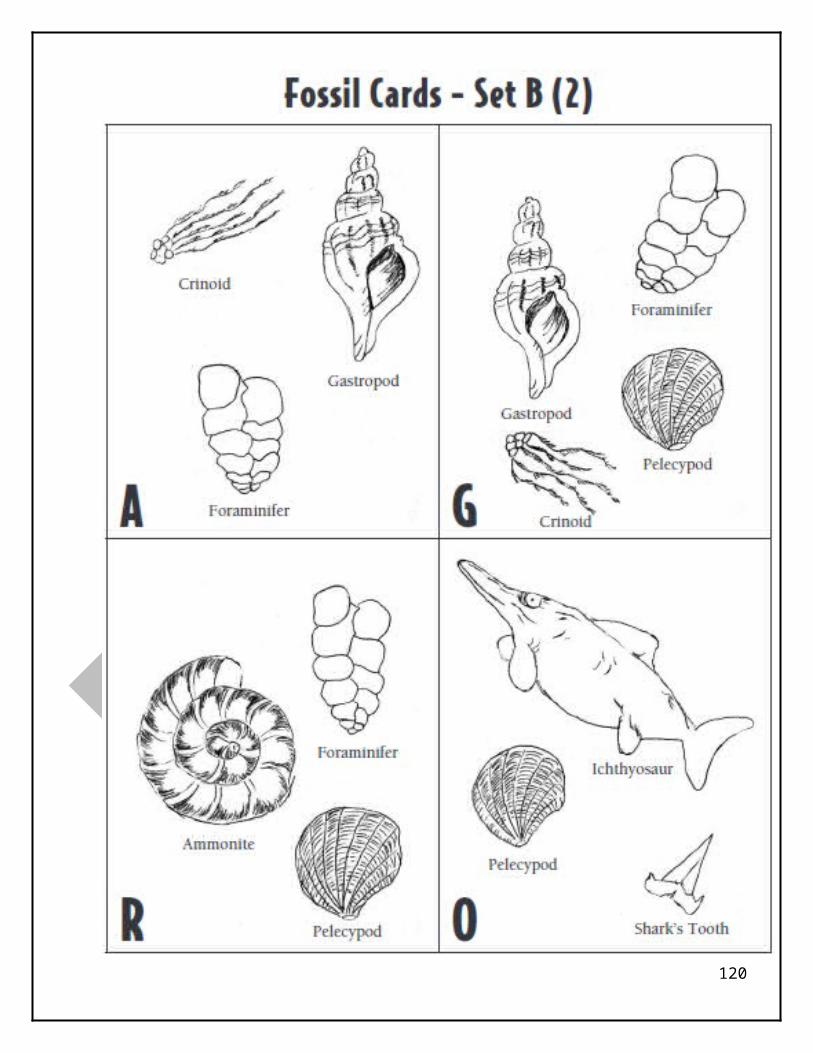
STUDENT HANDOUT
DIFFERENTIATED INSTRUCTION: OPEN INQUIRY
BIRD BEAK ADAPTATION LAB
Objectives/Purpose:. To learn about the advantages and disadvantages of phenotype variation, by simulating birds with different types of beaks competing for various foods.
Demonstrate Achievement of the following Goals: Develop a problem statement based on the relationship between type of bird beak and
competition for different types of food. State your hypothesis. Design an experiment to test your hypothesis. Carry out the experiment you designed. Submit a completed lab report to your teacher. Use the “Claim, Evidence & Reasoning” rubric to defend your claims when writing your
conclusion.

Teacher (Topic XII- Relationships in Ecosystems)
Everglades Biodiversity
NGSSS: SC.7.L.17.1: Explain and illustrate the roles of and relationships among producers, consumers, and decomposers in the process of energy transfer in a food web. (Assessed as SC.7.L.17.2 Compare and contrast the relationships among organisms, such as mutualism, predation, parasitism, competition, and commensalism.)SC.7.E.6.6: Identify the impact that humans have had on Earth, such as deforestation, urbanization, desertification, erosion, air and water quality, changing the flow of water. (Assessed as SC.7.E.6.2)
Purpose of the Lab/Activity: To identify the roles of producers and consumers in a food web. To recognize the effects of human interaction in a natural ecosystem.
Prerequisites: None
Materials: (per group) Everglades Biodiversity Reading, Everglades Biodiversity Organism Pictures, butcher paper or poster paper.
Procedures:Before Activity:
What the teacher will do:NOTE: Get pictures or have students access and print images of the following organisms: 1. Snail Kite Hawk (Rostrhamus sociabilis) 2. Turkey Vulture (Cathartes aura) 3. Florida panther (Felis concolor) 4. Apple snail (Pomacea paludosa) 5. Alligator Gar (Atractosteus spatula), 6. American Alligator (Alligator mississippiensis) 7. Opossum (Didelphis virginiana) 8. Wood Stork (Mycteria Americana) 9. Salifin Catfish (Pterygoplichthys multiradiatus) 10. Burmese Python (Python bivitatus) 11. Zooplankton 12. Phytoplankton 13. Mosquito fish (Gambusia affinis) (Due to copyright issues, pictures are not provided)
a. Activate prior knowledge by discussing vocabulary and asking students to identify a Producer, primary consumer, secondary consumer, and tertiary consumer.
b. Define and tell the students that they will be identifying the roles or organisms in the Everglades Ecosystem.
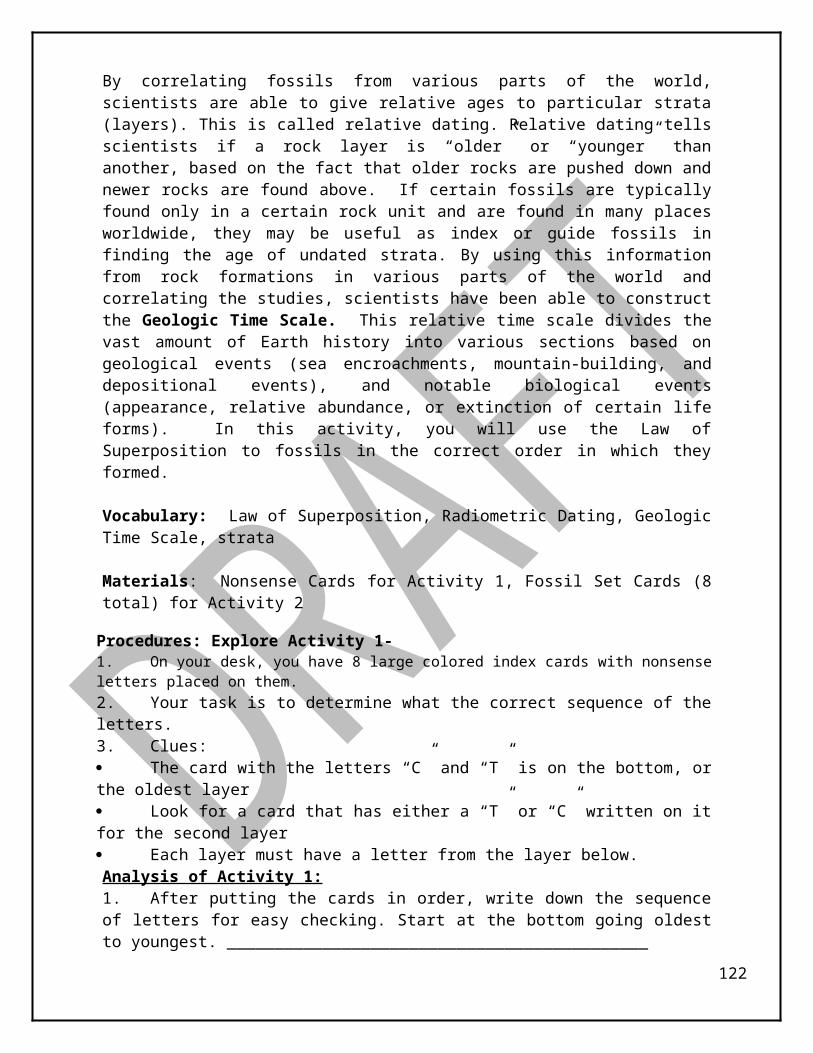
During Activity:
What the teacher will do:a. Assign students to groups of 3-4 students.b. Monitor students to make sure they are remaining on task and are following
proper lab protocol.c. Assign students the task of each reading one of the organisms to decide on
their position as producer, and level of consumer.After Activity:
What the teacher will do:a. Review the analysis questions with the students.b. Review and discuss conclusion questions with the students.
Extension: Have students create a food web for another ecosystem or Biome. Ask students to identify the producers, and levels of consumers. Research individualized relationships amongst a specific ecosystem and share the information with a peer.
Diagram Citation: Radcliffe / Centreville Middle School, Centreville MD, George M. N.p., n.d. Web.
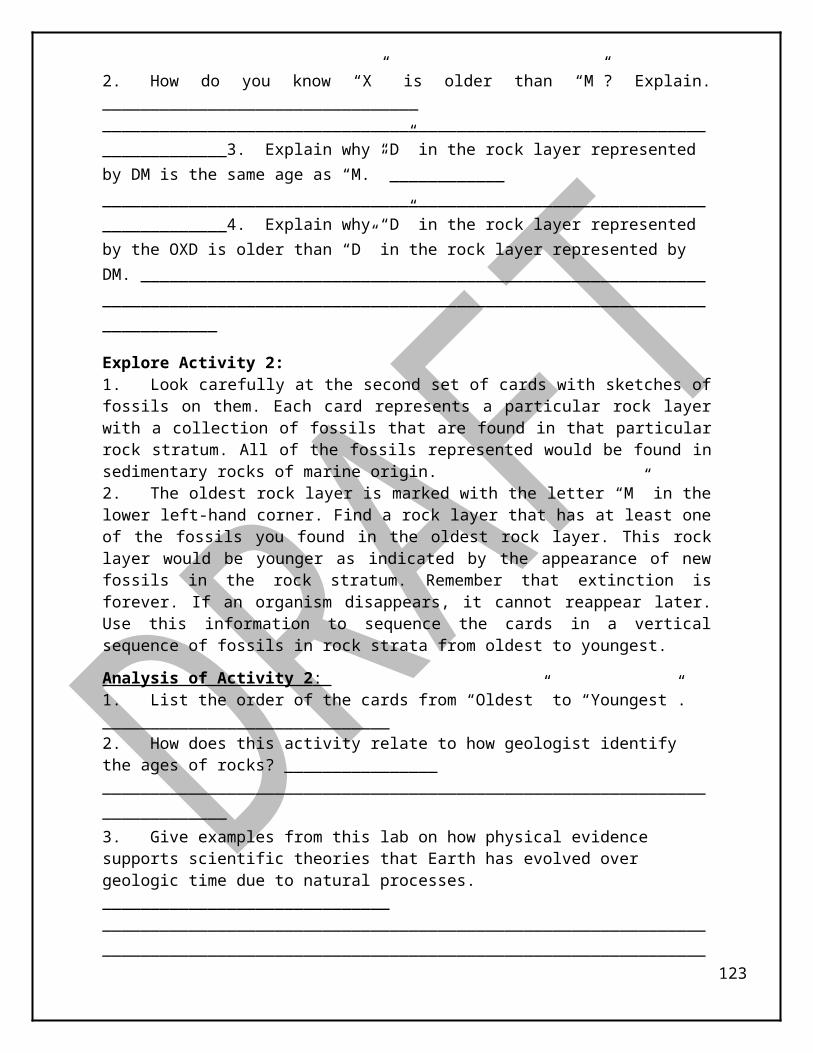
Student Name:_________________________________ Date: ________________ Period:___
Everglades Biodiversity
NGSSS: SC.7.L.17.1: Explain and illustrate the roles of and relationships among producers, consumers, and decomposers in the process of energy transfer in a food web. SC.7.E.6.6: Identify the impact that humans have had on Earth.
Background: (Source: www.epa.gov)All organisms in an ecosystem need energy to survive. This energy is obtained through food. Producers obtain energy by making their own food whereas consumers must feed on other organisms for energy. This dependence on other organisms for food leads to feeding relationships that interconnect all living things in an ecosystem. A food chain illustrates the simplest kind of feeding relationship. For example, in a forest ecosystem, a grasshopper feeds on plants. The grasshopper is consumed by a spider and the spider is eaten by a bird. Finally, that bird is hunted by a hawk. A food chain clearly shows this pathway of food consumption.
You could probably think of another food chain for a forest ecosystem. In fact, many different food chains exist in ecosystems. Although there are many different kinds of food chains, each food chain follows the same general pattern. A link in a food chain is called a trophic, or feeding level. The trophic levels are numbered as the primary, secondary, and tertiary consumer levels, starting with the producers.
In this activity, you will be constructing a food web of Everglades Ecosystems and identifying the impact within their environment.
Problem Statement: Part A: How does energy flow in an ecosystem as it transferred through the food web? Part B: In what ways do human activities positively and negatively impact ecosystems?
Vocabulary: food chain, food web, producer, primary consumer, secondary consumer, tertiary consumer, decomposer, energy transfer, invasive species, conservation.
Materials: (per group) Everglades Biodiversity Background & Pictures, butcher or poster paper.
Procedures:1. As a group, read and review the Background information on each of the Everglades
Biodiversity.2. Each student should read an organism to the group.
3. Discuss and arrange each of the Everglades organisms into a food web on the Poster board or Butcher paper. Draw arrows between each food source and the organism that eats that food. (Remember that the arrow represents the flow of energy.) Note: Some omnivores may be primary consumers or secondary consumers and so on.
Observation/Data Analysis: Individual Assignment1. Identify 1 food chain from your completed web that consists of at least 4 energy levels (Put arrows in between to identify energy flow). ___________________________________________________________________________________________________________________ 2. Identify the organisms provided as:Producers: _________________________________________________________________Primary: __________________________________________________________________Secondary: ________________________________________________________________Tertiary:___________________________________________________________________Decomposers: _____________________________________________________________
Data Analysis: 1. Review your food web. In nature, how would the amount of secondary consumers in an ecosystem compare to the amount of producers? ___________________________________________________________________________________________________________2. What would be the benefit of being a producer in terms of energy? ___________________________________________________________________________________________3. Large predatory fish are usually found as secondary or tertiary consumer. What does this mean in terms of the amount of energy that is available to them? _______________________________________________________________________________________________
Results/Conclusion: Directions: Analyze the information provided and answer the following questions.
Snail Kite, Florida Apple Snail, & Wood Stork1. Explain why the population of the Snail Kite Hawk is affected by the Florida Apple Snail population. _____________________________________________________________________________________________________________________________________________
2. Both the Apple Snail and the Snail Kite are endangered species. Based on your food web, which of these two organisms is more crucial to the success of the food web? Explain your answer. Defend your answer based on your food web. _____________________________________________________________________________________________________________________________________________________________________________________
3. The Wood Stork’s feeding technique improves in the dry season as fish are concentrated in areas of low elevation. In the wet season, the fishes are spread and the Wood Stork has to work harder along the shores to find food. Humans often control the water levels in the Everglades by opening up the Flood gates and releasing water into the ocean. How can humans controlling water levels affect the Wood Stork population? ______________________________________________________________________________________________________________________________________________________4. How can humans controlling the water levels affect other species of aquatic life? _____________________________________________________________________________

5. In a natural Everglades water flow, the population of wading birds like Wood stork and Snail Kite alternate back and forth. The Snail Kite does best in constant water levels because the Apple Snail needs a specific amount of moisture to grow and thrive. Wading birds such as the Wood Stork, feed easier in low water levels which is opposite. Explain how one species is affected while another species benefits. ________________________________________________________________________________________________________________________
American Alligator6. How would a decline in the alligator population affect the business of the fishermen? Explain why. __________________________________________________________________ ________________________________________________________________________________________________________________________________________________________7. The Alligator and the Python are competing for top predator. What affect can the introduction of a non-native species have on an ecosystem? ____________________________ ____________________________________________________________________________________________________________________________________________________________________________________________________________________________________
Florida Panther8. The Florida Panther has been primarily affected by habitat loss. What impact have humans had on affecting the Florida Panther population? __________________________________________________________________________________________________________
Sailfin Catfish9. Explain how the introduction of the Sailfin Catfish to a new ecosystem can have a negative impact on food web. Explain why the Sailfin Catfish population has been so successful in the Everglades ecosystem. ___________________________________________________________________________________________________________________________________
Turkey Vultures10. Turkey Vultures are scavenger organisms that maintain a pecking order within their family groups. Within a Vultures pecking order, the “head” vulture feeds and then the other vultures feed in order. Why are scavengers important in an ecosystem? ______________________________________________________________________________________________________________________________________________________________________________
Mosquito Fish11. The Mosquito Fish (although native to Florida) has been introduced to areas and other countries in order to control Mosquito populations. What are some effects that can have on other ecosystems? _________________________________________________________________________________________________________________________________________________________________________________________________________________________
Eastern Bluebird / Purple Martin BirdsThe Eastern Bluebird like the Purple Martin birds were reintroduced after being almost wiped out completely in South Florida. Since this migratory species of birds are cavity nester, their habitat has been decimated due to deforestation. Many homeowners and schools are creating habitat by having houses and gourds to encourage their nesting and reestablish populations.
Extension: Write a paragraph discussing how human activities can lead to the extinction of several species including the Eastern Bluebird and design a process to restore endangered species.
Everglades Biodiversity
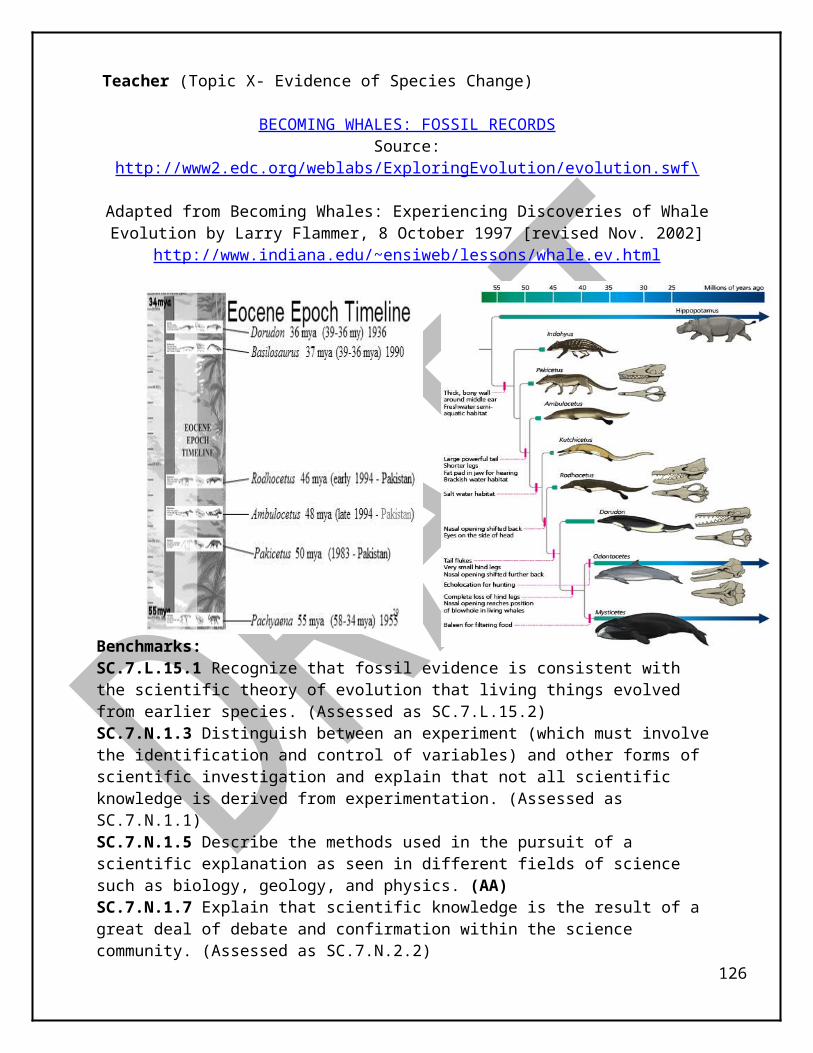
Snail Kite Hawk - The slender, curved bill of this medium-sized raptor is an adaptation for extracting the kite’s primary prey, the apple snail, from its shell. Because of its highly specific diet composed almost entirely of apple snails, survival of the Snail Kite depends directly on the hydrology and water quality of these watersheds, each of which has experienced pervasive degradation as a result of urban development and agricultural activities. Snail Kite was listed as endangered in 1967.
Turkey vulture - Vultures are primarily scavengers, feeding on dead animals. They soar the south Florida skies sometimes miles apart from each other but when a vulture sees or smells food, others may be watching and may move in that direction. Soon, a large group of vultures may be circling gracefully over a carcass.
Florida Panther - Once common throughout the southeastern United States, fewer than 100 Florida panthers are estimated to live in South Florida today, making it a highly endangered species. Florida panthers were heavily hunted after 1832 because they were perceived as a threat to humans, livestock, and game animals. The species was nearly extinct by the mid-1950s. Today, the primary threats to the remaining panther population are habitat loss and lack of genetic variation due to inbreeding. Urban development and the expansion of agricultural farmland has reduced the amount of suitable panther habitat. Other factors include mortalities from collisions with automobiles, territorial disputes with other panthers, disease, and environmental toxins. Florida Apple Snail - This golf - ball sized wetland snail is a critical food web component in Florida wetlands, contributing to the diets of turtles, fish, alligators and wading birds. The apple snail feeds on plants both above and under the water. These snails have both a gill and an air sac that functions as a lung. Even though this allows them to be able to breathe both above and below the water, the effects of dry downs, a hydrologic event where the water table drops below ground level, are of special concern. Although dry downs occur naturally in Florida wetlands, increases in the frequency and duration of dry downs, a result of water control projects, are generally believed to negatively affect apple snails because they can only live in dry conditions for a limited amount of time.
Alligator Gar - This odd-looking fish has a long body covered with hard, diamond-shaped plates called ganoid scales that Native Americans once used as arrowheads. Young Florida gars feed on zooplankton, insect larvae and small fish. Adults feed primarily on fish, along with some crustaceans and insects. The gar floats silently near the surface of the water, disguised as a stick or log. When it comes upon a fish, it propels itself slowly forward with a flick of its fins. Once into position the gar snaps its head sideways and secures the prey with its sharp teeth.
American Alligator - The American Alligator is the largest reptile in North America and is considered a keystone species in the Everglades ecosystem. A keystone species is a species that plays a critical role in maintaining the balance of an ecological community. The American Alligator was hunted without limit until it became an endangered species, on the verge of extinction. Then people realized that as the alligators disappeared, so did all those game fish that people liked to catch. That was when they realized that the alligators' favorite food, a large fish called a gar, had had a population explosion with no alligators to keep their numbers down. Gar fishes like to eat many kinds of game fish. So, with no alligators to keep their numbers down, there were too many Gar fishes gobbling up all the smaller fishes. The Alligator was put on the
Endangered Species list in 1967 and protected from hunting. Over time, their numbers began to recover and the Gar population was again under control.
Opossum - Opossums are common creatures to many habitats. They tend to be semi-aboreal, which means they spend their time both in the trees and on the ground. Their diets vary, as they will eat anything from small aquatic animals, birds, amphibians and insects to fruits and plant material. The opossum is the only marsupial (pouched) animal in the Everglades.
Wood Stork - The Wood Stork is a large, bald-headed wading bird that stands more than 3 feet tall. It is the only stork breeding in the United States and was placed on the Federal Endangered Species list in 1984. The Wood Stork used to thrive in south Florida because it is a specialized species that prefers habitats with distinct wet and dry seasons. A stork locates food — mostly small, freshwater fish and snails — not by sight but by tactolocation, with its bill in shallow water. The stork sweeps its submerged bill from side to side as it walks slowly forward. Its bill snaps shut with a 25-millisecond reflex action — the fastest known for vertebrates — whenever it touches prey. The effectiveness of this feeding technique increases as fish are concentrated in pools by seasonal water-level declines that result from the prolonged dry seasons. When the natural hydrologic cycle is upset by human-controlled water-management activities, Wood Storks fail to feed and nest successfully because they will not attempt to nest if sufficient food is not available. Hydrologic conditions resulting from recent water-management activities often are unfavorable to Wood Stork feeding and nesting requirements.
Sailfin Catfish - This catfish, also known as the Suckermouth catfish, is an invasive species in the Everglades ecosystem. It is an efficient aquarium cleaner because it feeds on algae and weeds. These fishes were introduced to the Everglades when they outgrow their aquariums and people decide to release them into the wild. Their feeding on algae and weeds competes with smaller native fishes. Birds that attempt to eat them can be harmed or suffocated by their spiny dorsal fins of the Catfish.
Python Snake- The exotic invasive python was introduced into the Everglades as unwanted pets. As an alien to the Everglades, it has no natural predators to keep the population under control. It has a voracious appetite for other animals, has been found to compete and even eat the American Alligator, and is very versatile in that it can live in all habitats and ecosystems.
Zooplankton - Zooplankton are a key component of almost all aquatic ecosystems. They are tiny organisms found near the surface of the water and feed on phytoplankton.
Phytoplankton - Phytoplankton, also known as algae, are also a key component of many aquatic ecosystems. They are tiny autotrophic organisms found near the surface of the water where they can harness the sun’s energy. Phytoplankton is the base of the Everglades Food chain and serves as habitat for many small organisms such as shrimp, crawfish, crabs, etc.
Mosquitofish- The Gambusia is commonly called the Mosquito fish because it consumes a large amount of mosquito larvae, relative to its body size. The Gambusia’s main diet however consists of zooplankton, and insects. They play a major role on the Everglades food web.
Teacher (Topic XIII –Human Impact on Earth)

Cleaning Up an Oil SpillAdapted Activity from National Geographic Education
http://education.nationalgeographic.com/education/activity/simulate-oil-spill-cleanup/?ar_a=1 References: Brown, National Geographic Society, Julie. "Simulate an Oil Spill Cleanup." - National Geographic Education. Ed. Christina Riska, National Geographic Society and Kathleen Schwille, National Geographic Society. National Geographic Education, n.d. Web. 25
May 2014.
NGSSS: SC.7.E.6.6 Identify the impact that humans have had on Earth, such as deforestation, urbanization, desertification, erosion, air and water quality, changing the flow of water. Assessed as SC.7.E.6.2 SC.7.N.1.2 Differentiate replication (by others) from repetition (multiple trials). AA
Purpose of the Lab/Activity: Understand how oil spills are a major problem for biodiversity, humans, food sources,
tourism, and health. To investigate methods used to clean up oil spills.
Prerequisites: None
Materials: (per group) container or 4 wide rimed containers per group that fits over 2500ml of water, 4 table spoons of vegetable oil, 1-3 drops of food coloring, 2 sponges, 2 - 4 cotton balls, 2 paper towel pieces, dish soap
Procedures:
Before Activity:
What the teacher will do:Have sponges, and paper towels cut up for the students to use. (It is recommended that you keep everything at about 1inch.Sponges and paper towels should be cut into smaller pieces to simulate a smaller scale model.Read and discuss Background and introduction with the students.Build background on the 2010 Gulf of Mexico oil spill.Download and display the map Gulf of Mexico: http://education.nationalgeographic.com/media/file/A_Geography_of_Offshore_Oil-Map.pdf On the map, identify the location of the Macondo well—the site of the leak and the accidental destruction of the Deepwater Horizon drilling rig. Ask the students, What do you think has caused for the oil to spread towards shore? and Explain how the oil has been distributed throughout these regions by currents, waves, winds, and tides.Ask students to brainstorm some ways in which oil spills are cleaned up. Lead discussion to include: absorber removers (sponges, cotton ball, paper towels, sandbags), and dispersers (chemical such as dish soap that breaks down oil and makes it sink or distributes it elsewhere).Assign lab groups of 4-6 students if needed.
During Activity:
What the teacher will do:Allow students to investigate ways of cleaning up the oil. Make sure students understand that oil and food coloring will not mix in completely.Make sure students test all absorbers before they test dispersers.
After What the teacher will do:

Activity: Discuss extension questions.Make sure students understand that food coloring represents chemicals trapped insilde crude oil. (Discussion? 1.) Discuss how effective cleanup efforts have been in the Gulf or other Oil Spills and the Long term implications and impact it may have on Environment, Wildlife, Economy, etc.Since oil used is vegetable oil, it will biodegrade and makes for easy clean up.
Extensions: Have students design their own Oil Absorber or Disperser method and test its effectiveness. Research Corexit 9500 (used to clean up the Gulf spill) investigate the possible ecological effects that this chemical could have on marine ecosystems.
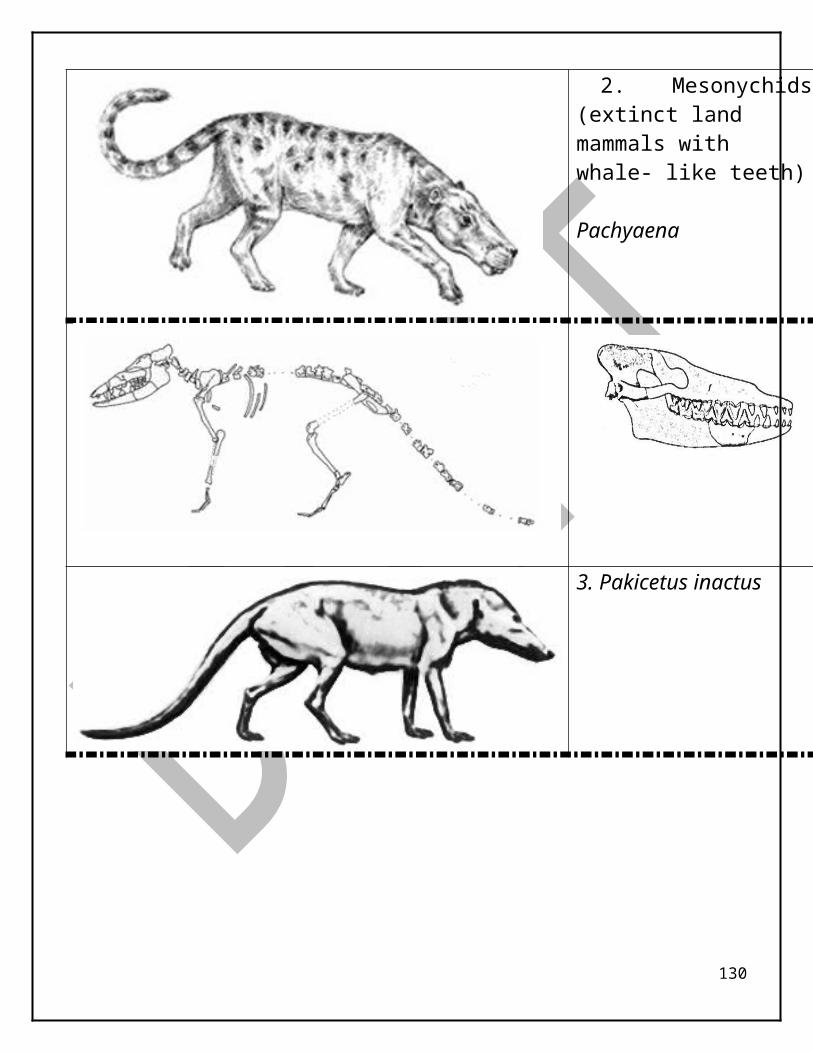
Student’s Name: ______________________________ Date: _____________ Period: ______
Cleaning Up an Oil SpillAdapted Activity from National Geographic Education
NGSSS: SC.7.E.6.6 Identify the impact that humans have had on Earth, such as deforestation, urbanization, desertification, erosion, air and water quality, changing the flow of water SC.7.N.1.2 Differentiate replication (by others) from repetition (multiple trials).
Background: An increased need to drill for oil and petroleum has led to multiple oil spills. Oil spills affect the overall health of marine animals, their environments, coastal areas, and even our seafood supply. These spills affect the livelihood of wildlife as well as coastal residents, fishermen, restaurants, tourism industry and overall economy of a state.
In April 20, 2010, British Petroleum (BP) had a deep water ocean oil rig, known as the Deepwater Horizon explode, killing 11 people and spilling an estimated 4.9 million barrels of crude oil over 86 days into the Gulf of Mexico. After finally stopping the leak in mid-July, the disaster was deemed as the largest environmental oil spill disaster of our time. The oil has invaded coastal environments and estuaries in Louisiana, Mississippi, Alabama and even us here in Florida.
BP was held accountable for the disaster and had to use several strategies corralling, burning, skimming, absorbing and dispersing oil to reduce the detrimental effects of the oil spill disaster. In this lab activity, you will investigate the effectiveness of using absorbers to collect oil and soap as dispersers of oil.
Unfortunately, according to government scientist in October 2010, BP removed a quarter of the oil, another quarter is believed to have dispersed into smaller molecules, a third quarter was dispersed into smaller molecules by dispersers, and the last quarter is still found as in sleeks that invade our shores and coast lines.
Problem Statement: What are the most effective methods of cleaning up oil spills?
Vocabulary: Absorbers, Dispersers
Materials: (per group) container or 4 wide rimed containers per group that fits over 2500ml of water, 4 table spoons of vegetable oil, 1-3 drops of food coloring, 2 sponges, 2 - 4 cotton balls, 2 paper towel pieces, dish soap
Hypothesis: Write a statement describing what you think will work best at cleaning up an oil spill. ____________________________________________________________________________________________________________________________________________________
Procedures:
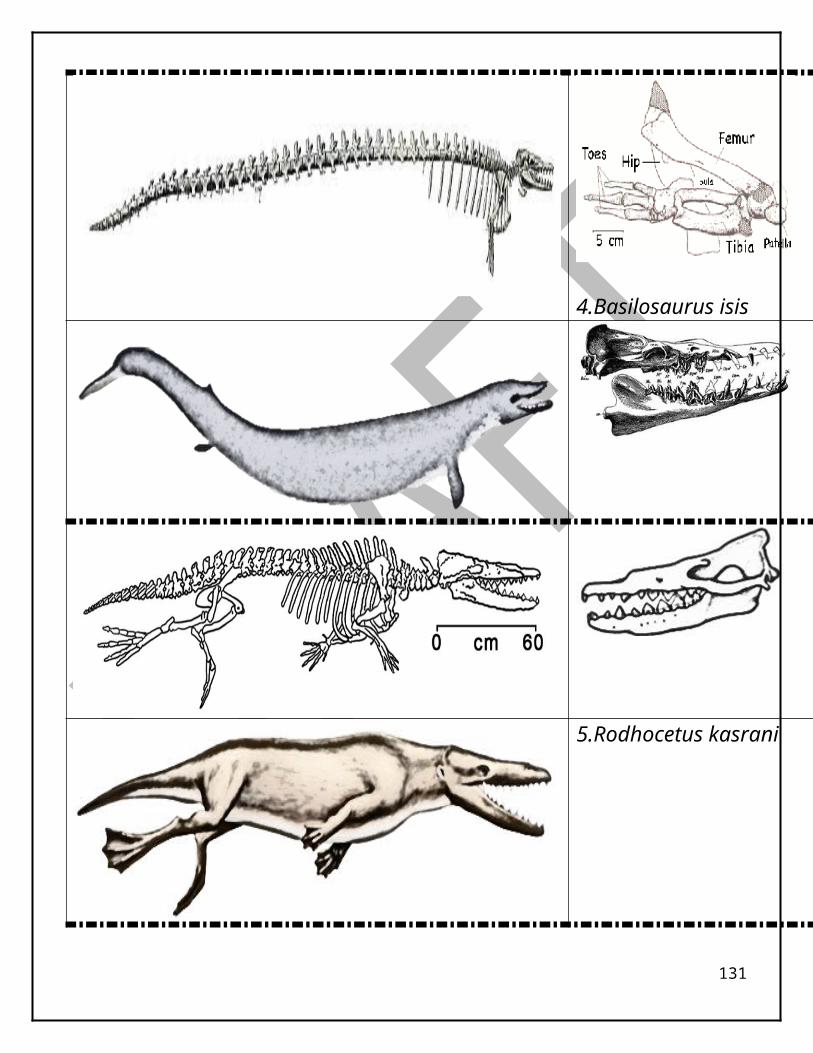
1. In your lab groups of 4-6 students, you are going to simulate an oil spill. Taking a container fill up with 2500 ml of water , put 4 Table spoons of Vegetable Oil and 1-2 drops of food coloring. (If there are enough containers, you may choose to complete this with 3 containers total.
2. Mix oil, and food coloring first. Then place mixed food coloring and oil with water. Carefully trying to keep oil and food coloring together, pour it into the center of the water container.
Part A: Using Absorbers.3. Observe the supplies you have available and decide as a group how those supplies might
represent each type of equipment used to clean up oil spills. 4. Test out different materials as Absorbers. Try to collect the oil before it gets to the edges of
the container or containers.5. Complete Data I Table.
Part B: Using Dispersants. 6. Pour 4 more tablespoons of oil if needed for Dispersant part of the experiment.7. Simulate Clean-up efforts after the use of a dispersant by pouring 3-4 drops of dishwashing
liquid on the oil. 8. Complete Data II after making observations.9. Use a clean sponge, cotton ball, and piece of paper towel to test absorption of oil after the
use of a disperser (soap). 10.Complete Data II Table.11.Clean up. Vegetable Oil is biodegradable.
Observations/Data:
Data I: Part A: Absorber CollectorsAbsorber Equipmen
t
Effectiveness Rating 1-5 (5 most effective 100% of oil was collected)
Justify Rating
Observations
sponge
Paper towel
Cotton
Data II: Part B: Absorber Effectiveness after Disperser
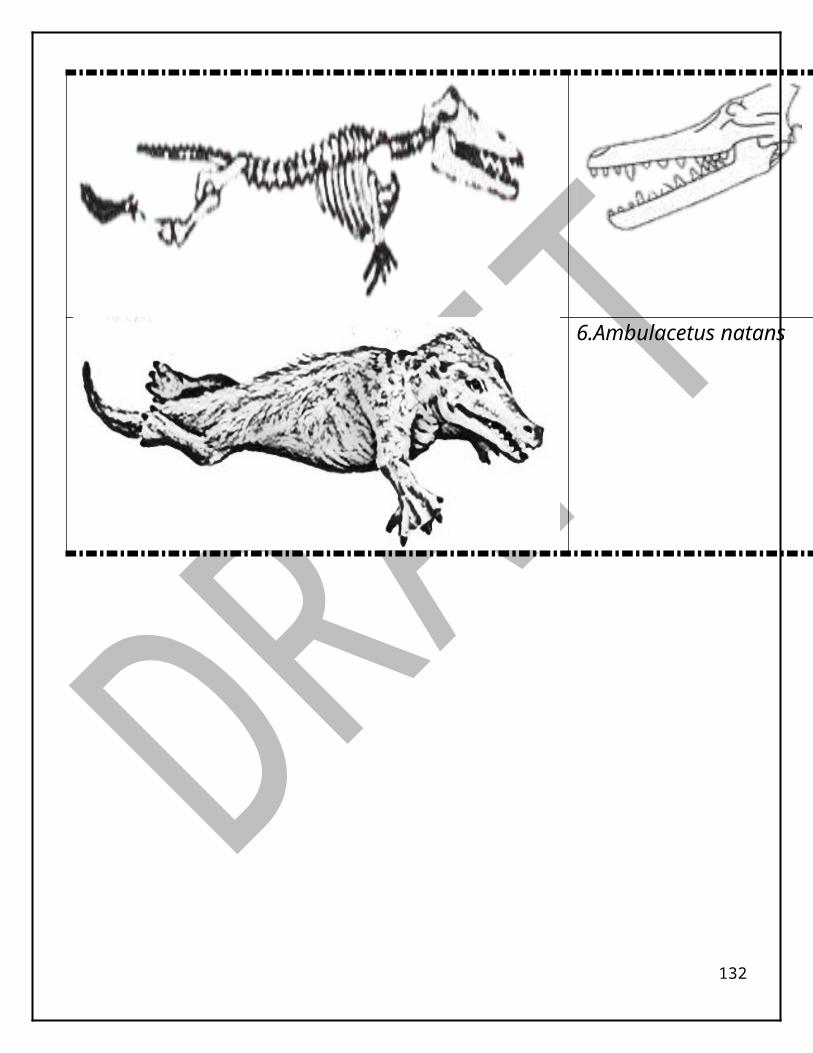
Absorber Equipmen
t
Effectiveness Rating 1-5 (5 most effective 100% of oil was collected)
Justify Rating
Observations
sponge
Paper towel
cotton
Observations/Data Analysis:
1. What do you think the oil and food coloring represent in this activity? _______________________________________________________________________________________________2. Analyze your data. What was most effective and least effective at collecting oil? _________________ Why might that be? ___________________________________________________3. What happened after the dish soap was applied to the oil and chemicals (dye)? _____________________________________________________________________________________44. Unfortunately, according to government scientist in October 2010, BP removed a quarter of the oil from the Deepwater Horizon leak, another quarter is believed to have dispersed into smaller molecules, a third quarter was dispersed into smaller molecules by dispersers, and the last quarter is still found as sleeks that invade our shores and coast lines. What long term effects can oil spills have on the environment and biodiversity? ________________________________ ____________________________________________________________________________________________________________________________________________________________________________________________________________________________________________________________________________________________________________________
Results and Conclusion:1. How is an oil spill evidence of how humans have had an impact on our environment? __________________________________________________________________________________________________________________________________________________________ 2. How does the use of oil and petroleum affect the air and water quality of our Earth? _____________________________________________________________________________________3. Identify the following: 4. Test (Independent) variable:___________________________________________________5. Outcome (Dependent) Variable: ________________________________________________6. Describe how this experiment would be Replicated? ________________________________7. Describe Repetition in this experiment? __________________________________________8. How would you improve this experiment? ________________________________________

9. Based on your lab, can you make any recommendations on clean up strategies to use on future oil spill disasters? ___________________________________________________ ______________________________________________________________________________________________________________________________________________
10.Scientists are always looking for new ways to solve environmental problems. Can you design something to clean up oil spills? Describe what you would design and how you would go about testing it. _______________________________________________________________________________________________________________________________________________________________________________________________________________________________________________________________________
References: Brown, National Geographic Society, Julie. "Simulate an Oil Spill Cleanup." - National Geographic Education. Ed. Christina Riska, National Geographic Society and Kathleen Schwille, National Geographic Society.
National Geographic Education, n.d. Web. 25 May 2014.

Teacher (Essential Lab Topic XIV DNA, Chromosomes, and Heredity)
GMO’s OffspringNGSSS:SC.7.L.16.1 Understand and explain that every organism requires a set of instructions that specifies its traits, that this hereditary information (DNA) contains genes located in the chromosomes of each cell, and that heredity is the passage of these instructions from one generation to another. AA (Cognitive Complexity.: Level 3: Strategic Thinking & Complex Reasoning)
Purpose of the Lab/Activity: To create imaginary organisms with pairs of chromosomes that represent phenotypes To understand that every organism will inherit traits from both parents.
Materials: 2 pennies and colored pencils
Procedures: Before activity:
What the teacher will do:a. Activate student’s prior knowledge. Ask students: What are some
differences between you and your parents? b. Identify physical traits and have kids note that they are phenotypes.c. Pair up students if needed.
During activity:
What the teacher will do:a. Make sure students are flipping coins and identifying the alleles
correctly.b. Make sure students understand that they are flipping coins to identify the
alleles of the parents. You may want to tell them that each coin toss represents alleles from the parent’s parents (offspring’s grandparents).
After activity:
What the teacher will do:a. If needed, review how to complete Punnett Squares with the students.b. Discuss Conclusion Questions with the students. Make sure students
understand that traits are inherited from the parents. c. Address Misconception that all traits that are dominant “take over”.
Students confuse the word “dominance”, however they should not see dominant traits as being possessive or negative, but instead as simply being visible. Address how recessive alleles are expressed through transcription and translation, and that they may have functional gene products in offspring’s.
Extension: Have students make a model of the GMO organism and offspring. Have them identify what their phenotypic adaptations are best suited for. Have student design an environment where their GMO family will live and thrive.
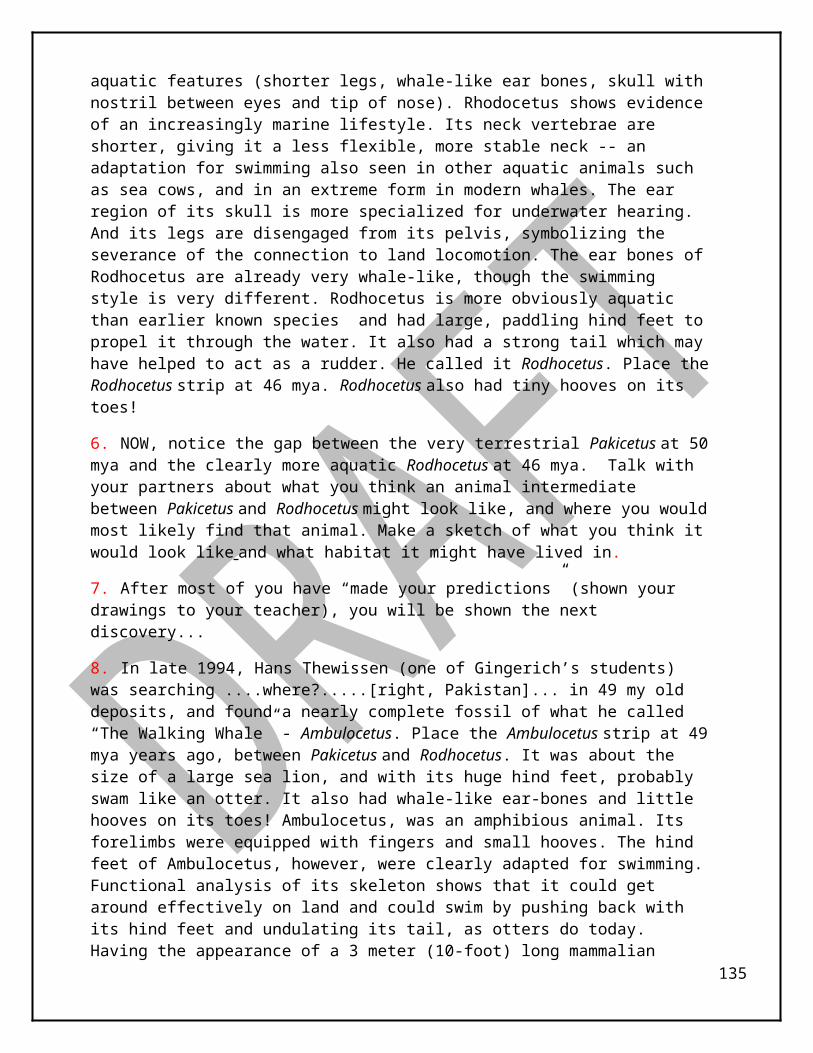
Student Name: ____________________________ Date:____________________ Period: ___
GMO’s OffspringNGSSS:SC.7.L.16.1 Understand and explain that every organism requires a set of instructions that specifies its traits, that this hereditary information (DNA) contains genes located in the chromosomes of each cell, and that heredity is the passage of these instructions from one generation to another.
Background: Scientist are constantly changing the DNA of seeds and food in order to make crops grow, and be more appealing to the buyer. These vegetables and fruits are known as GMO foods. GMO stands for Genetically Modified Organisms. Can you imagine if Scientists would do that with other organisms? In this lab you will. You will be creating a Genetically Modified Organism and it’s possible offspring based on probability. You will create parents for the GMO Offspring using seven pairs of alleles. You are then to take the genotypes with the highest probability according to your Punnett Squares and draw your GMO offspring. Happy building!
Objective: To explore genetic variation in a species by constructing a fictitious GMO offspring according to its genes.
Materials: 4 coins, colored pencils, lab sheet
Procedure: 1. Each partner will be flipping 2 coins to determine the Alleles for the Mother and Father GMO. 2. Two heads indicate a homozygous dominant trait. A head and a tail equal a heterozygous
dominant trait. Two tails represents a recessive trait.3. Complete Data Table I for the Mother, and Data Table II, for the Father.4. Draw your GMO Parents.5. The Genotypes from the Coin Toss outcome for each parent is to be used to complete the
Punnett Squares for the GMO Offspring.6. Complete the Punnett Squares for each of the seven pairs of alleles from the parents for the
GMO Offspring. 7. Draw your GMO Offspring.8. At the end of the activity, you should have drawn the family. Each parent; and the child using
the highest probability of traits. If the traits for the offspring are 50% possible, you may “Genetically Modify” to your taste (In other words, you are choosing the trait you like best to draw.)
Data Table I: Mother’s Traits
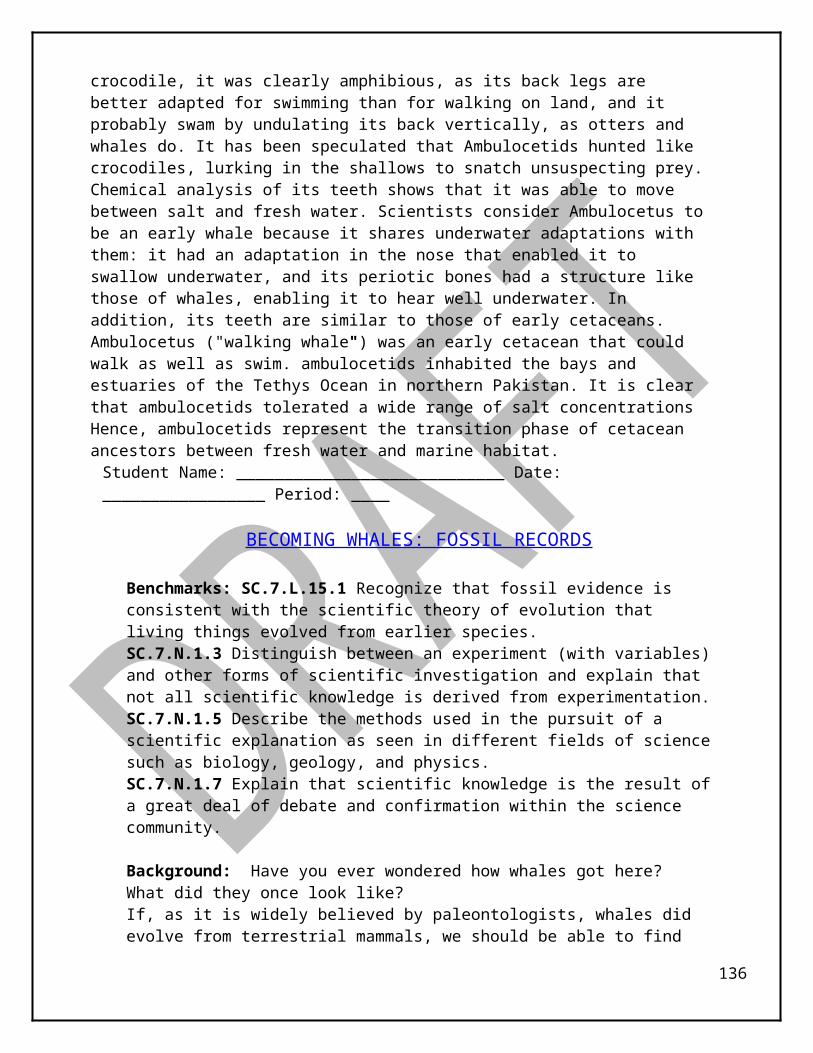
AllelesGenetic Trait
Heads Dominant
TailsRecessive
Coin Toss 1
Coin Toss 2
Genotype (Alleles from both coin
tosses)
Phenotype (physical
trait)1. # of eyes T= two T = one2. Color of
eyesE= brown e= blue
3. Color of hair
H= green h= red
4. Color of body
B = yellow b= purple
5. Body Shape
S= short s= tall
6. Antennae A= present a= absent7. Wings W= present w= absent
Data Table II: Father’s Traits Alleles
Genetic Trait
Heads Dominant
TailsRecessive
Coin Toss 1
Coin Toss 2
Genotype (Alleles from both coin
tosses)
Phenotype (physical
trait)1. # of eyes T= two T = one2. Color of
eyesE= brown e= blue
3. Color of hair
H= green h= red
4. Color of body
B = yellow b= purple
5. Body Shape
S= short s= tall
6. Antennae A= present
a= absent
7. Wings W= present w= absent
Observations/Data Analysis:Sketch and color your Parent GMO.
Using Data Table I and Table II, complete a Punnett Square for each Trait for the GMO

Offspring. Remember Each Parent’s Alleles from the CoinTosses need to be represented on top and on the side of the Punnett Square. If the outcome is 50/50, you may choose the phenotype for your offspring. Note the Most Probable Phenotype below.
1. # of Eyes 2. Color of eyes 3. Color of hair
Most Probable Phenotype: Most Probable Phenotype: Most Probable Phenotype:
_____________________ _____________________ _____________________
4. Color of Body 5. Body Shape 6. Antennae
Most Probable Phenotype: Most Probable Phenotype: Most Probable Phenotype:
_____________________ _____________________ _____________________
7. Wings Sketch and Color your GMO Offspring Baby.
Most Probable Phenotype:
____________________
Analysis/ Conclusion:
1. Where did the GMO Offspring baby get his possible traits from? _______________________

____________________________________________________________________________
2. What would happen if only the mother provided all of the offspring’s chromosomes? ______
____________________________________________________________________________
3. What is the advantage for a GMO Offspring to receive chromosomes from both, the mother and the father? ____________________________________________________________
____________________________________________________________________________
4. An adaptation is a change that makes an organism better suited for survival in its environment. They usually occur due to a change in a gene or genes. Discuss two adaptations your GMO Offspring has and what they may be best suited for. _____________
____________________________________________________________________________
5. What type of environment would you expect your GMO Offspring to be living in and why? Describe the environment and conditions of that habitat. _____________________________ ______________________________________________________________________________________________________________________________________________________________________________________________________________________________

Teacher (Topic XV Genetic Traits and Heredity)
Perfect Parent = Perfect Babies
NGSSS: SC.7.L.16.1 Understand and explain that every organism requires a set of instructions that specifies its traits, that this hereditary information (DNA) contains genes located in the chromosomes of each cell, and that heredity is the passage of these instructions from one generation to another. SC.7.L.16.2 Determine the probabilities for genotype and phenotype combinations using Punnett Squares
Purpose of this Lab/Activity: To understand that some phenotypic traits are more common than others. To recognize that phenotypic traits are observable traits passed down through genes.
Materials: Facial picture of a celebrity or model, selfie or picture of student, Paper, pencil/pen
Procedures: Before Activity
What the teacher will do:a. Activate prior knowledge or review prior concept by asking students to identify
common phenotypic traits in 2 students.b. Have students identify observable phenotypic traits around the class.c. Have students pick or bring in 2 celebrity or model pictures that they will use to
identify the phenotypic traits.During Activity
What the teacher will do:a. Monitor to make sure students are on task and correctly identifying the
Phenotypes.After Activity
What the teacher will do:a. Review Analysis and Conclusion questions.
Extensions: Have students research the frequency of specific traits and compare those to the class phenotypic traits.
Student Name: ______________________________ Date: _________________ Period: ____
Perfect Parents = Perfect Baby Lab
NGSSS: SC.7.L.16.2 Determine the probabilities for genotype and phenotype combinations using Punnett Squares
Background: Have you ever wondered what your baby would look like? Imagine having a baby with your crush. Wouldn’t that be the Perfect baby? Choosing a perfect mate can help you produce beautiful babies… right? So now, imagine that you are about 15-20 years older, in a stable long-lasting healthy relationship, and have planned to have a baby with the perfect man or woman. In this lab, you are going to identify your phenotypes and join them with the perfect mate to identify and predict the outcome of the “Perfect Baby”. Enjoy!
Procedure: 1. Choose a mate. Your mate can be a celebrity or model. You may choose a “boyfriend” or
“girlfriend”, but they have to be in agreement. Make sure you are respectful and ask.2. Using the Data I given about these 6 traits, figure out what the genotypes are for each of the
characteristics for you and your mate as future parents. 3. Complete Data II by putting a picture of you and your future mate.4. Complete Data III by identifying the Phenotypes (physical traits) and the Genotypes (Genetic
Alleles) for both you and your mate.4. Create and record all your data in the Punnett Square for each of the traits. 5. List the probability for each of the traits.
Data: Trait Phenotypic Dominance Hair Color Black hair is homozygous dominant; Brown hair is heterozygous, Blond is
homozygous recessive Eye Color Brown eyes are dominant; blue eyes are recessive, green are heterozygous Dimples No Dimples is dominant; Dimples are recessive Ears Big ears are dominant; small ears are recessive; medium are heterozygous Nose Wide nose is dominant; thin nose is recessive, flat nose is heterozygous Hair Texture Straight hair is dominant; curly hair is recessive, wavy hair is heterozygous
Data II: Insert a picture of yourself and your future mate.
My Selfie/Picture My Future Mate’s Facial Profile Picture
Data III:
Trait Phenotype Genotype (Allele)

Mother Father Mother Father1. Hair Color 2. Eye Color 3. Dimples 4. Ears 5. Nose 6. Hair Texture
Complete the Punnett Squares to determine the probability that your child will inherit each parent’s phenotype.
1. Hair Color 2. Eye Color 3. Dimples
% Probability for Phenotypic %Probability for Phenotypic % Probability for Phenotypic
Brown:_______ Brown:________ Present:_______Black:________ Green:________ Absent:________Blonde:_______ Blue:_________
4.Ears 5. Nose 6. Hair Texture
% Probability for Phenotypic %Probability for Phenotypic % Probability for Phenotypic
Big:_______ Wide:________ Straight:_______Small:________ Pointy:________ Curly:________Medium:_______ Flat:_________ Wavy:________
Analysis/Conclusion: 1. Based on the information gathered, what are the chances that your child will look more like
you or your mate? ________________________________________________________2. Explain why there is a possibility that your child may not have traits similar to either one of
you. __________________________________________________________________3. Was your baby as perfect as you hoped? Explain. ______________________________
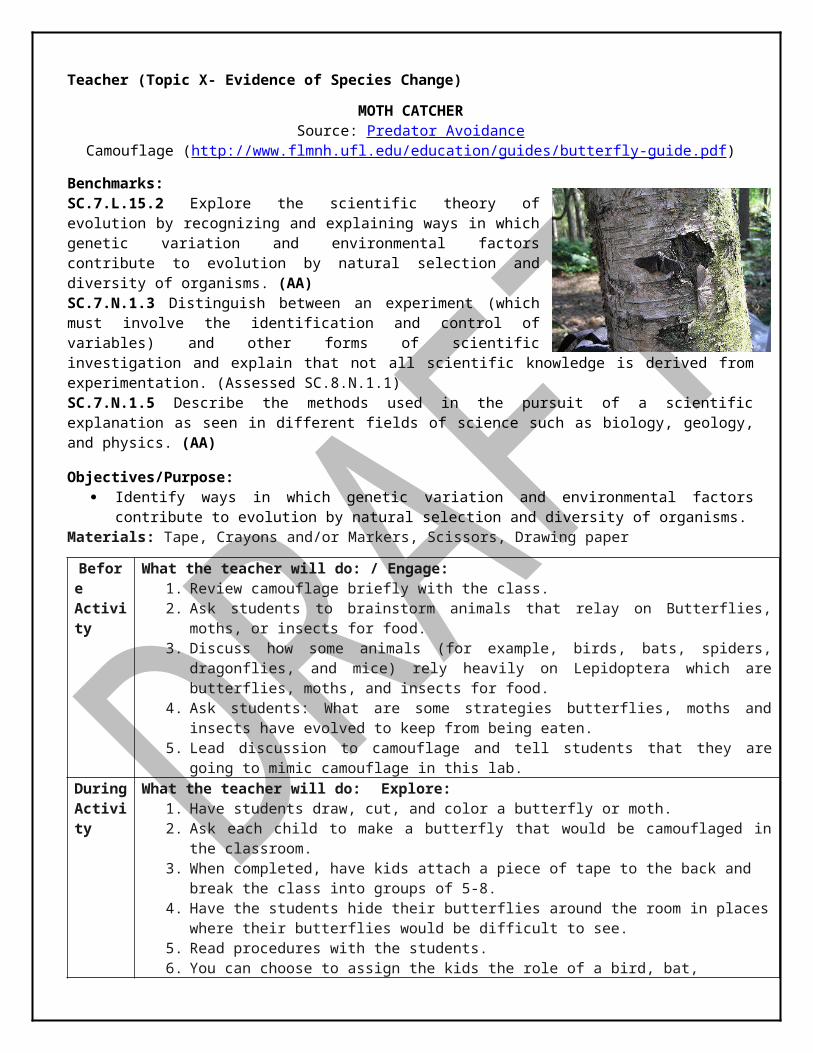
Incomplete Dominance Lab(Advanced)
Benchmarks:SC.7.L.16.2 Determine the probabilities for genotype and phenotype combinations using Punnett Squares and pedigrees. (Assessed as SC.7.L.16.2)SC.7.N.1.3 Distinguish between an experiment (which must involve the identification and control of variables) and other forms of scientific investigation and explain that not all scientific knowledge is derived from experimentation. (Assessed as SC.7.N.1.1)
Objectives/Purpose: Describe and explain that every organism requires a set of instructions that specifies traits. Determine the probabilities for genotype and phenotype combinations using Punnett
Squares. Use Punnett Squares to determine genotypic and phenotypic probabilities in the form of
percents or percentages.
Materials: (per group)

2 purple plastic eggs 2 pink plastic eggs 2 orange plastic eggs 2 blue plastic eggs 2 yellow plastic eggs 2 green plastic eggs
purple plastic items pink plastic items 10 orange plastic items blue plastic items 7 yellow plastic items green plastic items
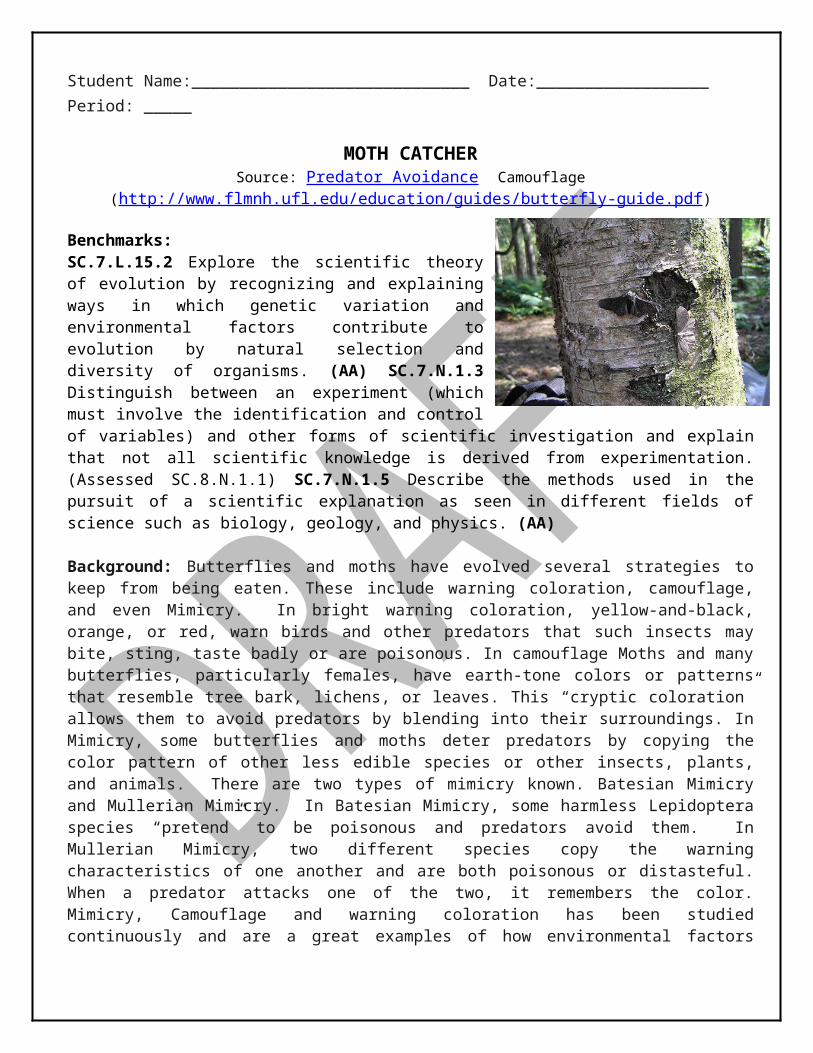
Engage: Introduce the concepts of dominance, recessiveness, Punnett Squares, genotype, phenotype, homozygous, heterozygous, pedigree, trait, allele, hybrid, pure-bred, etc. Play “What is Heredity?” short introductory video.
Explore:Teacher information page:
Setting up eggs: Make all 12 color combinations per lab group of 4 students. Inside each egg, place the 4 correct colored pieces to show the offspring. You can use
candy, but I would use plastic pieces of some type, like buttons, centimeter cubes, or any colored manipulative that will fit.
From the basket at each lab table, each student will select 5 eggs, one at a time. Students may work independently or with a partner, or a combination of both. Maybe
have them do 3 together, and 2 on their own. Collect your eggs back for next year.
Student Name: _______________________ Date:_______________ Period:______
Directions: 1. On your lab table, there are a variety of plastic eggs. 2. Choose one egg, but do not open it yet. 3. Record the Phenotypes and Genotypes of your egg. 4. Place the genotypes of your egg into the Punnett Square. 5. Determine the genotypes and phenotypes of the offspring. 6. Open your egg – do your results match the results inside the egg?
a. If yes, then place the egg back together and pick another egg! b. If no, check your work and make corrections.
7. Continue until you have completed 5 eggs.

Example of how to fill in data:
My Results: 2 (BB) Blue and 2 (Bb) Green
Inside the Egg: 2 Blue Pieces and 2 Green Pieces
My Results: _____________________________________________________________
Inside the Egg: __________________________________________________________
My Results: _____________________________________________________________
Inside the Egg: __________________________________________________________
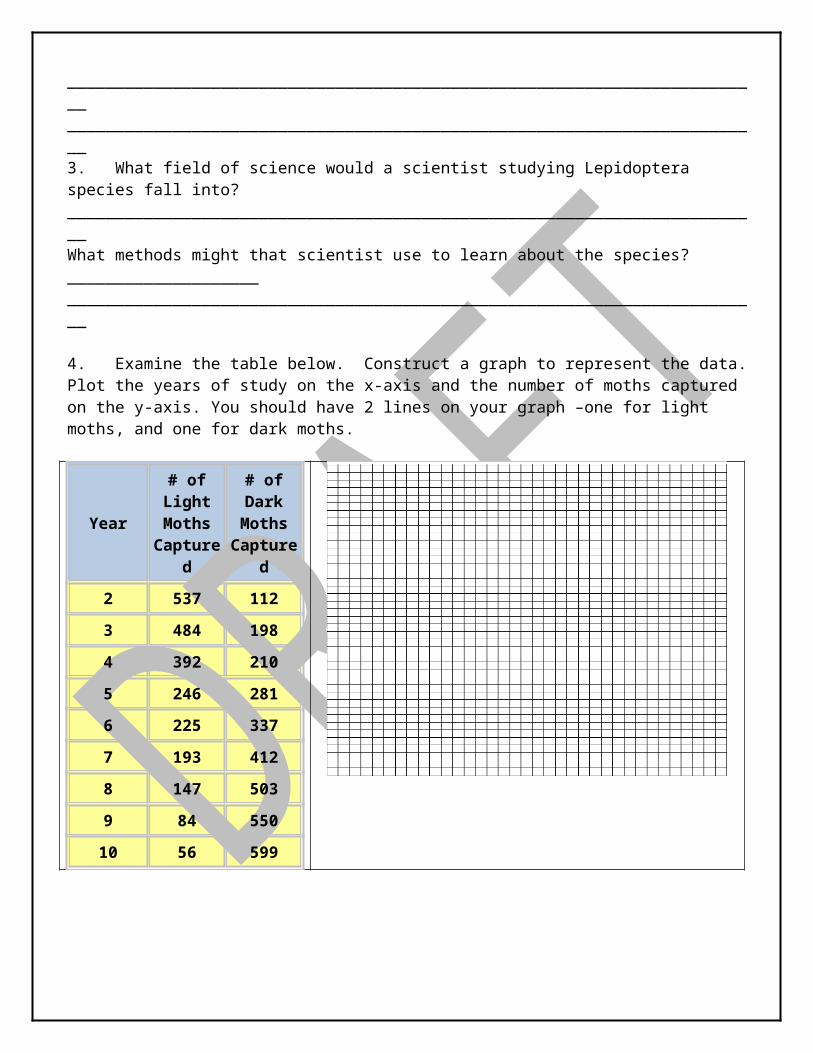
My Results: _____________________________________________________________
Inside the Egg: __________________________________________________________
My Results: _____________________________________________________________
Inside the Egg: __________________________________________________________

Explain:1. Which phenotypes had the greatest probability of occurring and why?
Elaborate/Extension: Pass out plastic eggs from above but use white items to represent albinos or smush some of the candies to represent the incidence of mutation or genetic disease.
Evaluate:
Students complete a Bikini Bottom Genetics worksheet about Incomplete Dominance.
Answer Key:purple x purple = (PP x PP)= all (PP) or purple possibilities purple x pink = (PP x pp)= all (Pp) or orange possibilities pink x pink = (pp x pp)= all (pp) or pink possibilities orange x orange = (Pp x Pp)= 1 purple (PP), 2 orange (Pp) and 1 pink (pp) orange x purple = (Pp x PP)= 2 purple (PP) and 2 orange (Pp) orange x pink = (Pp x pp)= 2 orange (Pp) and 2 pink (pp)
blue x blue = (BB x BB) = all (BB) or blue possibilities blue x yellow = (BB x bb) = all (Bb) or green possibilities blue x green = (BB x Bb) = 2 blue (BB) and 2 Green (Bb) yellow x yellow = (bb x bb) = all yellow (bb) possibilities green x yellow = (Bb x bb) = 2 green (Bb) and 2 yellow (bb) green x green = (Bb x Bb) = 1 Blue (BB), 2 Green (Bb), and 1 yellow (bb)
Additional Resource (Topic XII – Relationships in Ecosystems)
ENERGY PIPELINE
ADAPTED LESSON FROM PROJECT WILD K-12 ACTIVITY GUIDE
Benchmarks:SC.7.L.17.1: Explain and illustrate the roles of and relationships among producers, consumers, and decomposers in the process of energy transfer in a food web. (Assessed as SC.7.L.17.2 Compare and contrast the relationships among organisms, such as mutualism, predation, parasitism, competition, and commensalism.)
Objectives/Purpose:The purpose of this study is for students to investigate energy flow in ecosystems through experience. By completing this activity students will learn that energy flow does not occur cyclically like water or nitrogen, but as a pyramid.
Background:In every ecosystem, the biotic and abiotic components are linked by energy flow and material cycling to form a functional unit which successive levels of consumers depend on organisms at lower levels. Each of these trophic levels is defined according to its major role at each level (producers, primary and secondary consumers, and decomposers). The trophic level that ultimately supports all others consists of autotrophs, the primary producers. These are mostly the plants that use Sunlight to make organic compounds (sugars), which provide energy for their metabolic process and growth. All other organisms are heterotrophs, consumers that are unable to make their own food. They are directly or indirectly dependent on the photosynthetic output of the producers. The primary consumers of the plants are the herbivores, and secondary consumers that eat herbivores are the carnivores.
Energy flows through the ecosystem according to the laws of thermodynamics, and it determines the trophic relationships. Unlike materials such as water, oxygen, carbon, phosphates, and nitrates that are recycled energy are lost at each level. Each successive trophic level contains less energy, less organic material, and fewer numbers of organisms. As a rule, about 90 percent of the available energy for any trophic level is lost through heat, movement, and other metabolic activities. Only 10 percent, on average, is available for transfer to the next level.
Consequently, food chains tend to be short, and the resulting energy pyramid has implications for human food supplies. Because humans are omnivores, they are capable of eating plants and animals. When human (or any consumer) consumes most of their food from a secondary or tertiary level, the transfer of energy is less efficient than it is when they consume at the primary level. There are relatively few top predators (secondary consumers) in an ecosystem because of this considerable loss of energy between levels.
The purpose of this activity is to demonstrate some of the complex trophic interactions resulting from the flow of energy throughout ecosystem. Although material substances such as water, nitrogen, carbon, and phosphorus cycle through ecosystems, energy takes a one-way course through an ecosystem and is dissipated at every trophic level
Materials:

Large amount of pea-sized gravel or beans Large empty bucket or large graduated cylinder labeled “unused-calories” Cups Metabolism cards. (each card glued inside a cup)
Engage:Teacher will ask students about what they had for dinner last night? Choose a “meat” scenario and a “green” scenario if possible. Travel backwards through a possible food chain. During this time, teacher will probe students’ knowledge about energy flow. Show the Study Jams video: Food Webs: http://studyjams.scholastic.com/studyjams/jams/science/ecosystems/food-webs.htm
Draw or show a food web and have the students identify: (producers, plants, autotrophs, herbivore, primary consumer, carnivore, secondary consumer, tertiary consumer, heterotroph, decomposers, Sunlight). Then have them give an example of each.
Explore:Students will explore the flow of energy through participating in the Energy Pipeline activity.
1. Divide the students into pairs a. One Sun (one Sun for 2 pairs of autotrophs/plants= 3 Suns)b. 6 pairs of autotrophs/plantsc. 2-3 pairs of herbivores/ primary consumersd. 1-2 pairs of carnivores/ secondary consumers
2. Distribute a set of cups/metabolism card to each pair of Suns and organisms. Look at each card; notice that each card explains a part of the metabolism processes. Each process indicates how many beans/gravels are placed in the cup.
3. Explain that the Sun pair will carefully hand 10 pieces of bean/gravel to each plant pair. Each piece of bean/gravel represents a photon of Sunlight containing one calorie of energy. The plant pair should place their bean/gravel in their cups as indicated by the metabolism cards. Sun pair will continue to hand 10 pieces continuously throughout the activity.
4. When a plant pair has placed all 10 beans/gravel in their proper cups, the Sun pair keeps supplying them with another 10 pieces and so on (10 at a time) until they accumulated 10 “calories” beans/gravel in the growth bowl. At that time the sufficiently large enough to be eaten by a primary consumer (herbivore). The 10 pieces from the growth cup is given to a primary consumer/herbivore pair. The discarded beans/gravel is placed in the “unused-calories” bucket.
5. Once the herbivores/primary consumer receives the 10 beans/gravel from the plant, they sort the beans/gravel into the corresponding herbivore metabolism cards.
6. Plants resume getting “calories” from the Sun and sorting.7. Each herbivore pairs sorts their beans/gravel according to the cards until they accumulate 10
“calories” in growth. Then they pass the 10 “calories to the carnivores/secondary consumers’ pair. The unused calories go into the bucket.
8. Herbivores continue receiving beans/gravel from the plants.9. The carnivores/secondary consumers pair then will sort their beans/gravel into their
representative metabolism cards.
Explain:Students will record on their activity sheet what the activity demonstrated about energy flow in ecosystems. Then, the teacher will conduct a brief classroom discussion to ensure that students have made intended/correct deductions.
Growth calories Growth calories Growth calories Growth caloriesCarnivores
Herbivores
Plant
Elaborate:The students will decide where nutrients would fit in the activity. Then the teacher will add nutrients to the activity.
Evaluate:1. Draw a diagram that illustrates the energy flow in a simple ecosystem.
2. Students will provide the following evidence for understanding energy flow through trophic levels.
Performance Criteria Evidence Points or Rating*
Students will understand how energy flows through an ecosystem.
Completion of Energy Pipeline activity with student explanation on activity sheet.
Students will practice keeping records using data charts.
Completion of pair and class data charts.
Students will demonstrate their understanding of nutrient cycling in ecosystems.
Class decision on the placement of nutrients in the activity.
Students will determine the difference between energy and nutrient flow in a simple ecosystem.
Completion of energy flow and nutrient flow diagrams.
*2-Student completed activity with full/correct explanation1-Student completed activity with partial explanation0-Student did not participate in activity or answer question(s)
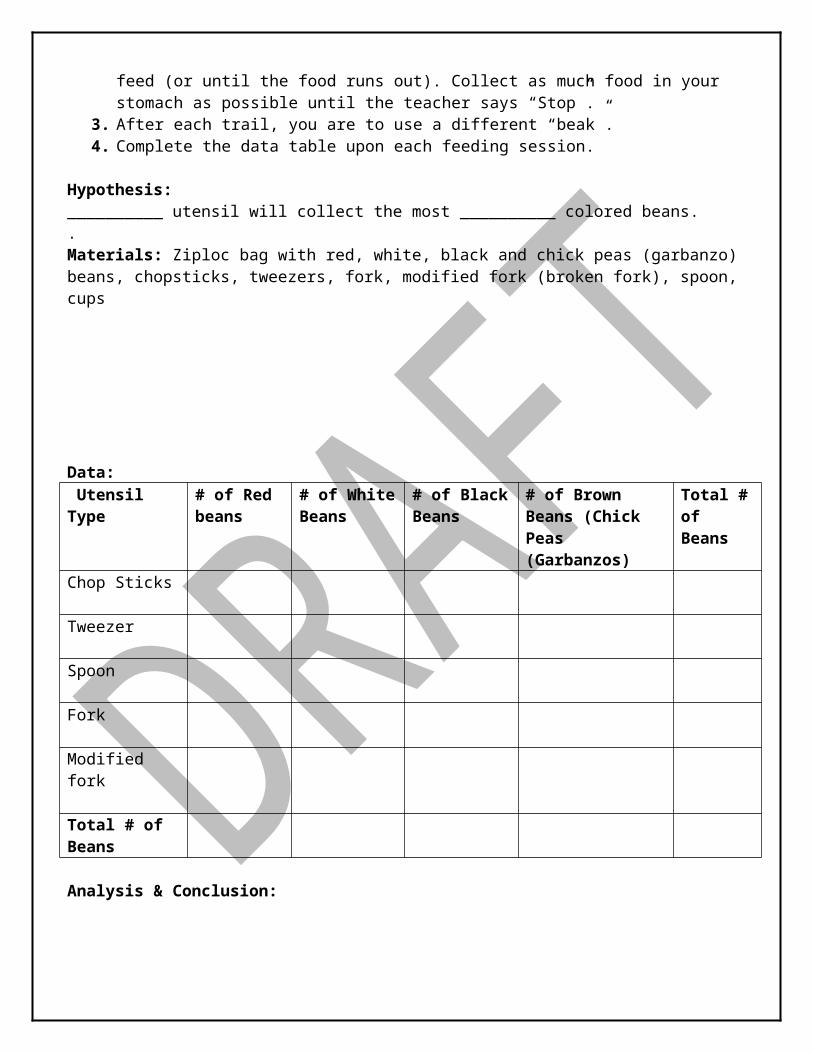
STUDENT HANDOUT
DIFFERENTIATED INSTRUCTION: OPEN INQUIRY
ENERGY PIPELINE
Objectives/Purpose:The purpose of this study is for students to investigate energy flow in ecosystems through experience. By completing this activity students will learn that energy flow does not occur cyclically like water or nitrogen. .Demonstrate Achievement of the following Goals: Develop a problem statement based on the concept of energy moving through system
(think carefully about the impact of those changes on the system.) State your hypothesis. Design an experiment to test your hypothesis. Carry out the experiment you designed. Submit a completed lab report to your teacher. Use the “Claim, Evidence & Reasoning” rubric to defend your claims when writing your
conclusion.

Plant Metabolism CardsReproduction
Plant uses energy to produce seeds.
Place three calories in this cup.
Unused Sunlight
Not all Sunlight can be converted into organic matter.
Place two calories in this cup
GrowthPlant uses energy to grow.
Place one calorie in this cup
PhotosynthesisPlant absorbs energy from the
Sun and produces organic matter
Place three calories in this cup
Respiration Plants burn energy in the process
of photosynthesis
Place one calorie in this cup
Herbivore Metabolism CardsRespiratio
n for Digestion
Herbivore uses energy to break down consumed food.
Place two calories in this cup
Respiration for
MovementHerbivore uses energy to
search for water.
Place three calories in this cup
Respiration for Reproduction
Herbivore uses energy to create nest and raise
young.
Place three calories in this cup
GrowthHerbivore uses energy to break
and storing energy in body
tissues
Place one calorie in this cup
Respiration for Movement
Herbivore uses energy to evade for predators
Place one calorie in this cup
Carnivore Metabolism CardsRespiratio
n for Digestion
Carnivore uses energy to break down consumed food.
Place two calories in this cup
Respiration for
MovementCarnivore uses energy to search
for prey and to hunt food Place three calories in this cup
Respiration for Movement
Carnivore uses energy to build a shelter
Place one calorie in this cup
Respiration for
ReproductionCarnivore uses energy for
extensive courtship display and extra hunting to raise youngPlace
three calories in this cup
Growth
Carnivore uses energy to grow
Place one calorie in this cup
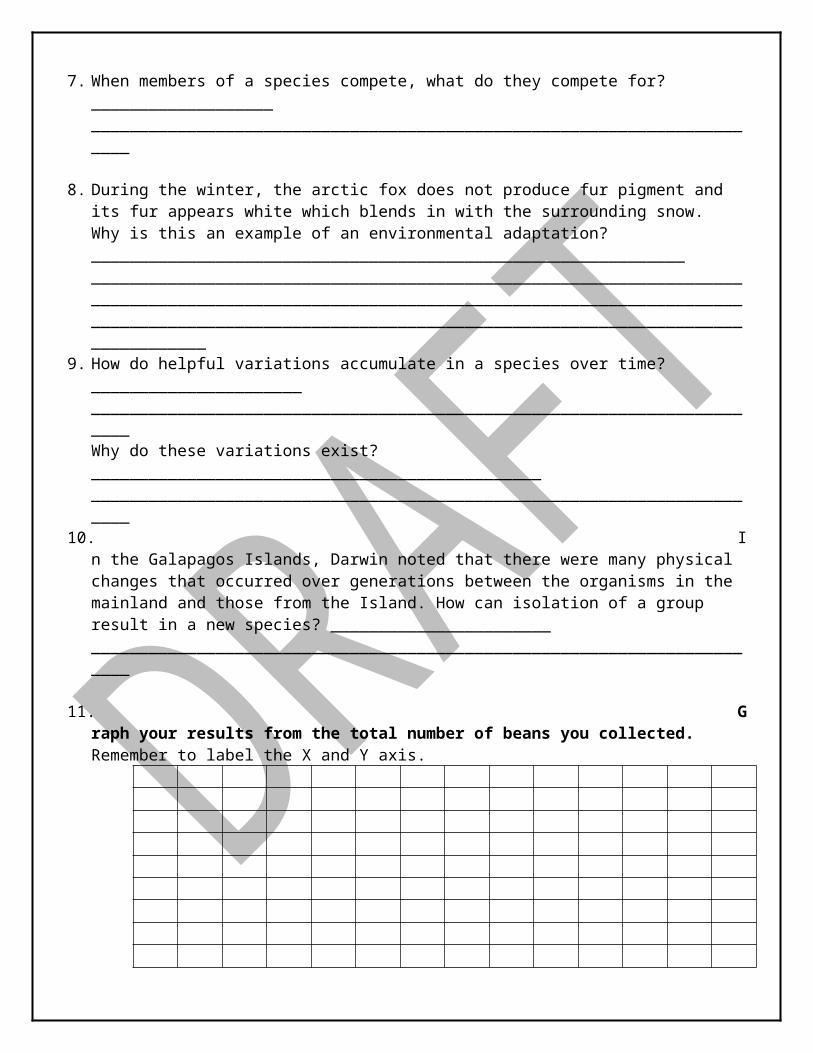
Additional Resource ( Topic XIII- Human Impact on Earth)
WATER & AIR ACIDIFICATION
Adapted from Sarah Cooley ([email protected]) The Ocean Acidification Subcommittee
Ocean Carbon and Biogeochemistry ProgramSources- www.us-ocb.org
Benchmarks:SC.7.E.6.6 Identify the impact that humans have had on Earth, such as deforestation, urbanization, desertification, erosion, air and water quality, changing the flow of water. (Assessed as SC.7.E.6.2)
Background Information for the teacher:Burning fossil fuels releases carbon dioxide into Earth’s atmosphere. This not only leads to a warmer Earth (i.e., global warming, the greenhouse effect), but also changes the chemistry of Earth’s oceans. The ocean is a “carbon sink,” which means that it removes CO2 from the atmosphere. The ocean currently absorbs about one-third of the CO2 released by the burning of fossil fuels. However, beyond a certain level of atmospheric CO2, the ocean can no longer act as a carbon sink without it having a negative impact on marine life. When CO2 dissolves in seawater, it leads to decreased pH levels. The ocean becomes less alkaline. This is referred to as ocean acidification. As the ocean water becomes less alkaline, there is a resulting decrease in the amount of carbonate ions available for many marine organisms to form their calcium
carbonate hard parts. Coral polyps are less able to precipitate the mineral aragonite, which they use to build or rebuild their skeletons. This means that a coral reef might stop growing and become more vulnerable to erosion. Other marine organisms, such as oysters, might also be harmed. Understanding ocean acidification is important for citizens engaged in debating global climate change issues, policies, and solutions. If atmospheric CO2 levels continue to rise, coral reefs may disappear from all of Earth’s oceans by 2100.Teacher’s notes:This activity is done in multi-sessions. Equipment needsSeawater salt mixes and an alkalinity test kit can usually be found at a pet store or ordered online. The smallest size box of sea salt mix (to make 10 gallons of artificial seawater) costs less than $10, and an alkalinity test kit can be bought for about $10-20 (for approximately 75-200 analyses). We recommend alkalinity test kits that relate alkalinity to a numerical scale (KH, meq/l, or ppm CaCO3) rather than just indicating whether it is high/medium/low. A full complement of household acids, bases, and test solutions may add up to $20-30 at the grocery store. The experiments may be done in small clear plastic cups or in inexpensive student laboratory glassware that can be found from many sources\. Disposable glass test tubes are available in bulk for a relatively low cost from suppliers.
Setup notesThe Natural Resources Defense Council produced an excellent mini-documentary(http://www.nrdc.org/oceans/acidification/aboutthefilm.asp) on ocean acidification that may be used as an introduction to the unit. You may also choose to assign students to read one of the background articles listed at the end of this unit in conjunction with the lab activities.
Pre-Lab Set-up*Artificial seawaterMaterials
Instant Ocean brand aquarium salt Water (If you live in an area where the water is very hard, you may wish to use distilled
water instead of tap water; using extremely hard water to make artificial seawater could keep the salts from dissolving correctly
Large jug or clean bucketMethodMix up artificial seawater according to the directions on the Instant Ocean salt package.Make enough that each student will have about 250 mL (1 cup) of artificial seawater.*Red cabbage pH indicator – bromothymol blue, phenol red, or phenolphthalein may be used as alternative pH indicators.Materials
1 head red/purple cabbage (not green)
Water Stovetop/Bunsen burner/electric
kettle Pot or stovetop-safe beaker Sieve or strainer 1 pair of oven mitts Storage bottle or jar with
tightfitting lid, about 500-1000 mL (~1-2 pints)
Isopropyl alcohol Dropper bottle(s), one per lab
group (contact lens solution bottles, eyedroppers, etc.)

MethodRoughly chop 1 head red/purple (not green) cabbage and put in beaker or pot with enough water to cover the cabbage. Bring the water to a full rolling boil, then turn off the heat and allow the cabbage and water to sit for about 10 minutes until the water is dark purple. (Alternatively, pour boiling water over red cabbage in a beaker and let sit until water is dark.) Fill the clean storage bottle about 10% full with isopropyl alcohol1, and then fill it the rest of the way with cabbage extract. Use a strainer or sieve to filter out the cabbage pieces. Be careful to avoid spilling the cabbage juice, because it stains counters and clothing. Cap the bottle and shake up the solution to mix it. (The alcohol prevents the extract from spoiling). Extra cabbage juice can be flushed down the drain. Cool the solution. Label the bottle. Then, fill and label the dropper bottles with cabbage extract. 1 head of cabbage provides about 1L of solution; scale up as needed.(http://www.chemistryland.com/CHM107Lab/Exp10_pHindicator/Lab/PreparingCabbageExtract.htm provides a nice photo-essay about making and using cabbage-based pH)
Objectives/Purpose: In this investigation students will investigate the factors of acidification upon air and water
quality In Ocean acidification in cup students will learn about alkalinity, which helps seawater
resist changes in pH, and test the alkalinity of four different types of water. Students will then compare the responses of different waters to carbon dioxide gas
I’m melting! Seashells in acid Simulates ocean acidification’s effects on the shells of mollusks.
Ocean acidification in a cupMaterials:For each group of 3-4 students:
Dropper bottle of pH indicator Aquarium alkalinity test kit Distilled water* Seawater* Tap water* Seltzer water* *(of each liquid, you need ~250 mL + enough to ½ fill a test tube)
Engage:Read the information: Sea salt gives seawater some unique properties. Sea salt includes a lot of sodium and chloride and gives seawater its salty taste. Sea salt also includes other positively and negatively charged ions. If acid is added to seawater, the negatively charged ions in sea salt [including mostly carbonate (CO3 2-), bicarbonate (HCO3 -), sulfate (SO42-), and orate (B(OH)4-)] react with the free hydrogen ions (H+) from the acid and help buffer (resist changes in) seawater pH. The ability of seawater’s negative ions to neutralize added acid is called alkalinity. In nature, the buffering provided by alkalinity helps keep seawater pH in a fairly small range. Every year, humans are releasing more carbon dioxide into the atmosphere, and the gas mixes into the ocean as well. When atmospheric carbon dioxide gas mixes with seawater, it creates carbonic acid and allows seawater to dissolve calcium carbonate minerals. This process is called ocean acidification. The hard shells and skeletons of marine creatures like scallops,
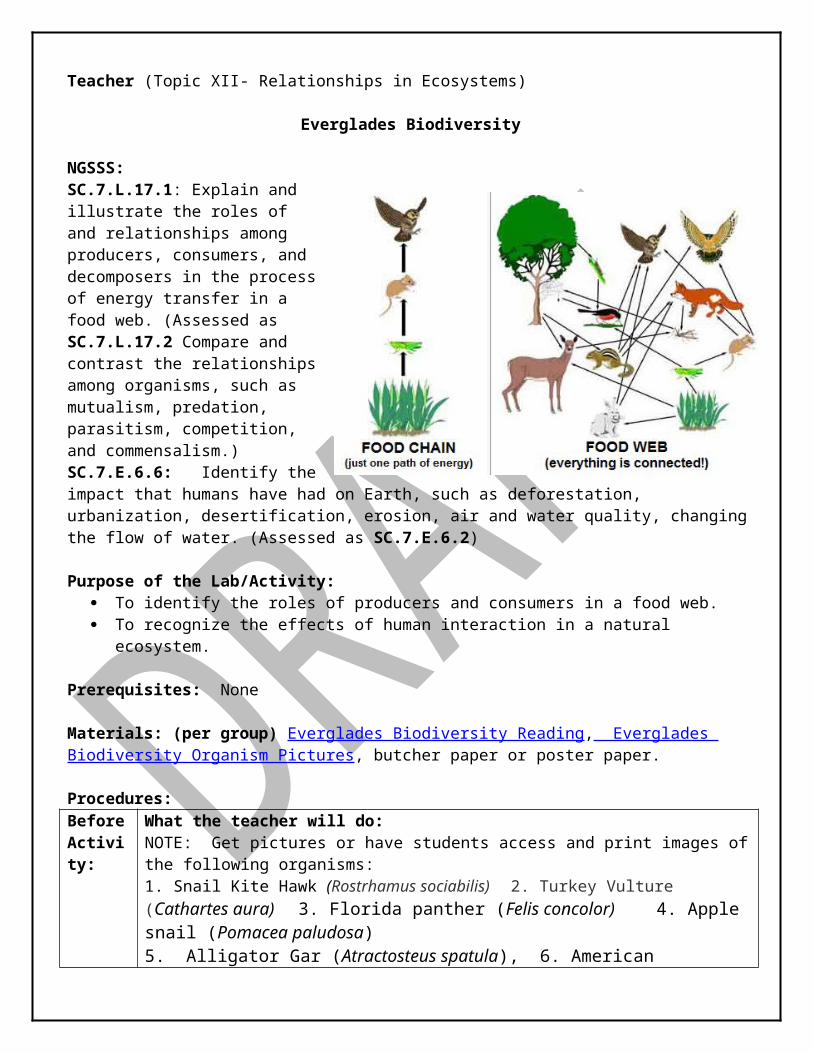
oysters, and corals are made of calcium carbonate minerals. As more carbon dioxide from the atmosphere enters the ocean in the next 100 years, ocean chemistry will change in ways that marine creatures have not experienced in hundreds of thousands of years. The hard shells of marine creatures may become damaged from ocean acidification. Scientists are currently researching what this will do to populations of marine organisms.
After reading the goal and background for this lab, write down predictions (hypotheses) about 1) how the alkalinities of tap water, distilled water, seawater, and seltzer water will compare to each other and 2) their ability to resist pH changes. Use complete sentences. The hypotheses for Parts 1 and 2 should be something like “I predict that the order from lowest to highest alkalinity will be tap water, distilled water, seawater, and seltzer water,” and “I predict that the order from most resistant to least resistant to pH change will be tap water, distilled water, seawater, and seltzer water.”
Relate how humans are releasing carbon dioxide into the atmosphere and its effects in sea water.
Explore: Part 1: Alkalinity (complete in groups of 3 or 4)
1) On your worksheet, write down the date of the experiment, the time of day, and your lab partners’ names. Fill in the data table with the names of the solutions you will test. It will look something like this:
Liquid Predicted Alkalinity Actual Alkalinity Rank
Seawater
Tap water
Distilled water
Under “predicted alkalinity”, rank the fluids based on how much alkalinity you think they will have. Use 1 for the fluid you think will have the least alkalinity and 4 for the fluid that you think will have the most alkalinity.
2) Follow the instructions on the alkalinity test kits to test the alkalinity of distilled water, seawater, and tap water.
3) Write down the alkalinity value (in dKH, meq/l, or ppm CaCO3 depending on your test kit) under “actual alkalinity”.
4) Rank the fluids based on your alkalinity test results. Use 1 for the fluid with least alkalinity and 4 for the fluid with the highest alkalinity.
Part 2: Ocean Acidification (complete in groups of 1 or 2)1) Label your control test tubes with the four types of water: distilled water,
seawater, and tap water. Fill them and place them in the rack.
2) Label your plastic cups with the four types of water. Fill them each with about 250 mL (1 cup) of fluid, following the labels. These are your experimental samples.
3) In your notebook, write down your lab partner’s name for this part of the experiment.
4) Draw a data table that looks something like this:
Liquid Control/start color
Start pH Bubbling time(seconds)
Endcolor
End pH
Tap water
Seawater
Distilled water
5) Add a few drops of pH indicator to the fluids in each test tube and about 10 drops to the fluids in each cup. Under “control/start color”, write the colors of the controls (fluids in the test tubes). Check that the control colors match the sample colors. Again, hold the tubes or cups in front of the white paper if you need help telling apart the colors. Place a straw in each cup.
6) Without sucking up any colored water into your mouth, blow through the straw into the tap water sample so that bubbles come up through the water. Keep blowing for 45 seconds and move the bottom of the straw around to make sure bubbles flow through all the liquid. It’s ok to take quick breaks to breathe in, like you would if you were playing a flute. At the end of 45 seconds of bubbling, write down the color of the water under “end color”.
7) Repeat steps 5 and 6 for the other three water samples.
Based on both, the materials given by your teacher conduct the investigation. Write up lab. Include: your problem statement for this activity. Formulate a hypothesis. Using the given materials design and complete an experiment design.
Demonstration--I’m melting! Seashells in acidMaterials required for an entire class (1-2 days in advance)
White vinegar (500 mL) Water (1500 mL) 2 large glass beakers (1000 mL) Eggshells or very thin sea shells Heavy books

1) Dilute 1 part vinegar in at least 1 part fresh water. If you have multiple types of seashells, place one of each type in this mixture. Place one of each type in fresh water.
2) Check on the shells every few hours. When the vinegar-digested shells are visibly degraded (a day or two, depending on vinegar mixture strength), drain all the shells and rinse off the vinegar-digested shells. Degraded shells will be dull, pitted, translucent, or even cracked.
3) Have students pile books on top of the shells to compare the strength of digested shells and undigested shells. Digested shells should break more easily than undigested shells.
4) If desired, show students the shells while they are in acid. Have them discuss why bubbles are generated and what the bubbles are composed of.
*Note: this demonstration requires 1-2 days of advanced preparation
Explain and Redesigning the Experiment:Students will share their findings from the explore activity. Summarize the results of your activity. What happened to the temperature of the jar over time? Relate how the set up represents the effects of carbon dioxide in ocean water. Can you identify the test (independent), and outcome (dependent) variables in your activity? Did you only change only one variable? Identify what you could do to improve this activity
Optional Extensions:1. Students can design an experiment to investigate the effects of acid concentrations on
eggshells or seashells.2. Students can design an experiment to investigate the effects of “acid rain” on plants
What does this mean to you?
When carbon dioxide (CO2) is absorbed by seawater, chemical reactions occur that reduce seawater pH, carbonate ion concentration, and saturation states of biologically important calcium carbonate minerals. These chemical reactions are termed "ocean acidification" or "OA" for short. Calcium carbonate minerals are the building blocks for the skeletons and shells of many marine organisms. In areas where most life now congregates in the ocean, the seawater is supersaturated with respect to calcium carbonate minerals. This means there are abundant building blocks for calcifying organisms to build their skeletons and shells. However, continued ocean acidification is causing many parts of the ocean to become under saturated with these minerals, which is likely to affect the ability of some organisms to produce and maintain their shells.
Since the beginning of the Industrial Revolution, the pH of surface ocean waters has fallen by 0.1 pH units. Since the pH scale, like the Richter scale, is logarithmic, this change represents approximately a 30 percent increase in acidity. Future predictions indicate that the oceans will continue to absorb carbon dioxide and become even more acidic. Estimates of future carbon dioxide levels, based on business as usual emission scenarios, indicate that by the end of this century the surface waters of the ocean could be nearly 150 percent more acidic, resulting in a
pH that the oceans haven’t experienced for more than 20 million years. Ocean acidification is expected to impact ocean species to varying degrees. Photosynthetic algae and seagrasses may benefit from higher CO2 conditions in the ocean, as they require CO2 to live just like plants on land. On the other hand, studies have shown that a more acidic environment has a dramatic effect on some calcifying species, including oysters, clams, sea urchins, shallow water corals, deep sea corals, and calcareous plankton. When shelled organisms are at risk, the entire food web may also be at risk. Today, more than a billion people worldwide rely on food from the ocean as their primary source of protein. Many jobs and economies in the U.S. and around the world depend on the fish and shellfish in our oceans.
With the potential devastating effects of acidification in air and water, it is reasonable and prudent to examine alternatives to fossil fuels to decrease the amount of CO2 in the atmosphere. The transportation sector is one area that can, generally speaking, use alternative methods of fuel, since there are already a variety of alternate fuels available. The good news is that this transition can be done relatively easily, cheaply, and painlessly.
Activity: Research and discussion questions: answer on a separate sheet
1) Considering the chemical formula of each of the substances you tested, discuss why different acids and bases have slightly or widely different pH values.
2) The pH indicator we used was made from red cabbage. The purplish color is caused by a natural compound called cyanidin, which is a type of anthocyanin.
A) Research the way that anthocyanins react with acidic and basic fluids. Helpful links for researching this answer: http://www.webexhibits.org/causesofcolor/7G.html http://science.howstuffworks.com/vegetable/question439.htm http://www.madsci.org/experiments/archive/859332497.Ch.html http://www.micro-ox.com/chem_antho.htm http://icn2.umeche.maine.edu/genchemlabs/Anthocyanins/fruitjuice2.htm)Given what you now know about the chemical structure of anthocyanins, write down a hypothesis predicting how cyanidin can produce the multiple different colors you observed, depending on acidity.
B) In a paragraph, describe an experiment you could use to test this hypothesis if you were a researcher. (Assume that you could look up how to do anything and that you could build any equipment you needed for the analysis. Use your imagination. The goal is to describe how you would test this hypothesis using the scientific method. Will you need any controls? What test(s) would you perform? How many times should you repeat your test(s)? How would you interpret your results?)
Sources: www.us-ocb.org (http://www.chemistryland.com/CHM107Lab/Exp10_pHindicator/Lab/
PreparingCabbageExtract.htm)
http://ozreef.org/library/tables/alkalinity_convers ion.html. dKH = degrees of carbonate hardness; ppm = parts per million; meq/l = milliequivalents per liter.
Overview documents Ocean Acidification - From Ecological Impacts to Policy Opportunities”. Special
issue of Current: The Journal of Marine Education, 29(1) 2009. http://www.mcbi.org/what/current2.htm
Doney, S.C., V.J. Fabry, R.A. Feely, and J.A. Kleypas. 2009. Ocean acidification: the other CO2 problem. Annual Reviews of Marine Science. 1:169-192. http://arjournals.annualreviews.org/eprint/QwPqRGcRzQM5ffhPjAdT/full/10.1146/annure v.marine.010908.163834
Doney, S.C. 2006. The dangers of ocean acidification. Scientific American. 294: 58-65. http://loer.tamug.edu/Loup/MARS281/Ocean-Acidification(SciAmer-2006).pdf
Kleypas, J.A., et al. 2006. Impacts of ocean acidification on coral reefs and other marine calcifiers: a guide for future research. Report of a workshop sponsored by NSF, NOAA, and USGS. 96 pp http://www.ucar.edu/communications/Final_acidification.pdf
Raven, J. et al. 2005. Ocean acidification due to increasing atmospheric carbon dioxide. The Royal Society. http://royalsociety.org/document.asp?id=3249
Teaching tools Interactive tutorial about ocean acidification’s effects on marine organisms,
with a virtual biology lab about ocean acidification and sea urchins. http://i2i.stanford.edu/carbonlab/co2lab.swf
Short video (21 min) about ocean acidification produced by the Natural Resources Defense Council: “Acid Test: The global challenge of ocean acidification” http://www.nrdc.org/oceans/acidification/aboutthefilm.asp
other marine science educational kits from the Center for Microbial Oceanography: Research and Education website : http://cmore.soest.hawaii.edu/education/teachers/science_kits/ocean_acid_kit.htm
Short video (8 min) about ocean acidification produced by students in the UK: “The Other CO2 Problem” http://www.youtube.com/watch?v=kvUsSMa0nQU
STUDENT HANDOUT
DIFFERENTIATED INSTRUCTION: OPEN INQUIRY
WATER & AIR ACIDIFICATION
Objectives/Purpose: In this investigation students will investigate the factors of acidification upon air and water
quality .
Demonstrate Achievement of the following Goals: Develop a problem statement about the impact of carbon dioxide emissions on the Earth
and the environment. Create models of the Earth to compare and contrast the environments with and without
calcium-based nimals. How does the model demonstrate the concept/idea that was investigated? Use the “Claim, Evidence & Reasoning” rubric to defend your claims when writing your
conclusion.
Teacher (Topic XIV: DNA, Chromosomes, and Heredity)
Human Variations
Benchmarks: (Genetics: Topic XIV Essential Lab)SC.7.L.16.1 Understand and explain that every organism requires a set of instructions that specifies its traits, that this hereditary information (DNA) contains genes located in the chromosomes of each cell, and that heredity is the passage of these instructions from one generation to another. (AA) SC.7.L.16.2 Determine the probabilities for genotype and phenotype combinations using Punnett Squares and pedigrees. (Assessed as SC.7.L.16.1)
Objectives/Purpose: Describe and explain that every organism requires a set of instructions that specifies traits. Determine the probabilities for genotype and phenotype combinations using Punnett Squares. Use Punnett Squares to determine genotypic and phenotypic probabilities in the form of percents or
percentages.
Materials: coins, 2 students, colored pencils or markers If making face model, construction paper for face features, crayons (skin-color set), curling ribbon for hair
(black, brown, yellow), paper plates, scissors
Procedures: Before Activity: What the teacher will do:
a. Decide if you want students to flip coins to make 1 or 2 offspring b. Decide if students will make a model or a drawing of the traits. c. Modify Student lab sheet to reflect Trait’s table for 1 or 2 offspring*, and if traits are
being drawn or made into a model.**d. Students need to pair up or flip 2 coins.e. Read review and discuss the Background and Student Procedures with students.f. Model how alleles are identified based on outcome of Heads, or Tails on coin.
*Benefit of making 2 offspring is being able to compare traits among siblings, but due to time restraints, lab may be done with 1 offspring. ** Allowing students to choose to draw or make model may be a DI strategy.
During Activity: What the teacher will do:a. Monitor students to make sure they are completing the data table correctly based on
their coin outcome.b. A common mistake is that the kids want to put in 2 Alleles for each parent. Refer them
to Procedure #6. c. Facilitate instruction when completing the Evaluation and Conclusion questions.
After Activity: What the teacher will do:a. Review and discuss Evaluation questions with the students. b. Address common misconceptions.
Common Misconceptions: Students often think that every person is unique because each has different genes.
This is not true. Emphasize that all humans have the same genes. In fact, our genes are even in the same order along chromosomes. We are each unique because we inherit different combinations of alleles, resulting in a unique combination of traits.
Students may interpret disease gene discovery to mean that only those who have the disease have the gene. This is not true. Emphasize that each of us has the
newly discovered gene, but none of us will develop symptoms of that disease unless we inherit a form of the gene that is faulty due to mutation.
Assessment: Successful completion of data table, baby face drawing or model, and correct answers to Evaluation
Questions.
Home Learning:Students can complete a similar chart from this lab based on two generations of their own family members. Chart should include human traits such as widow’s peak, tongue roller, hitchhiker thumb, and attached ear lobes, etc.
Extensions:1. Research genetic diseases such as Tay-Sachs, sickle-cell anemia, or cystic fibrosis. 2. Create a pedigree chart for your family of one characteristic such as attached/unattached ear lobes,
tongue roller/tongue non-roller, hair/no hair on knuckles.
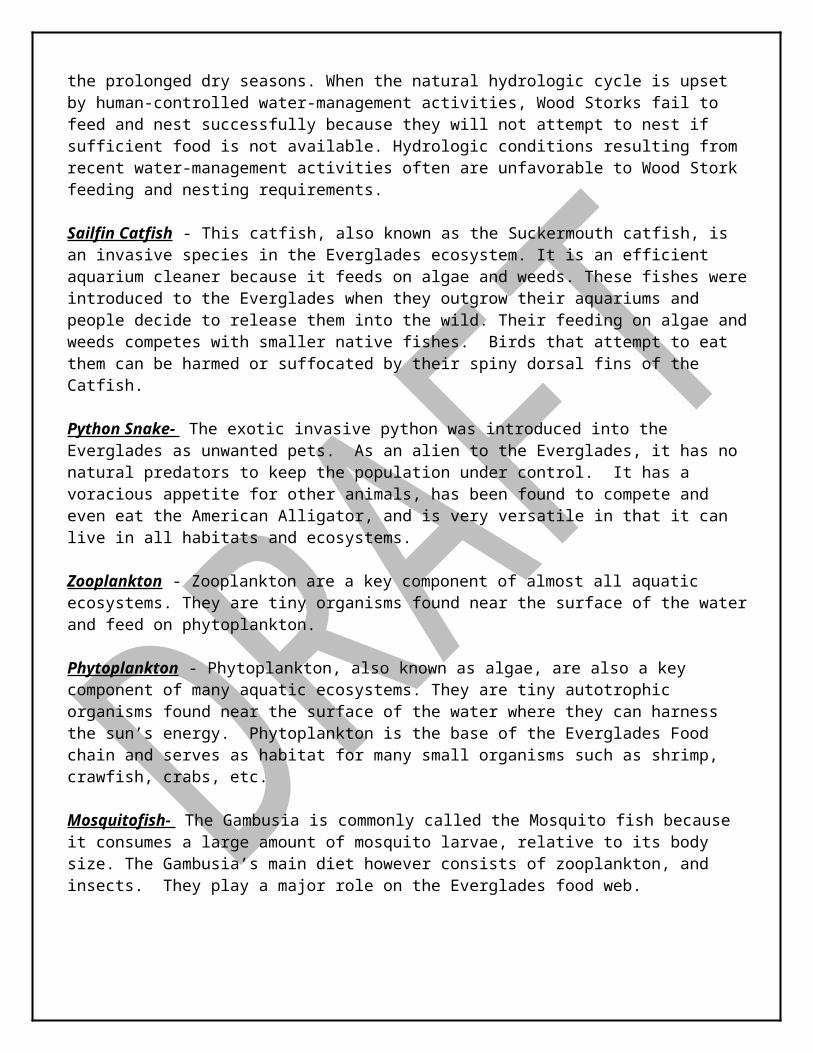
Student Name:__________________________________ Date: ____________________ Period: _____
Human VariationsBenchmarks: SC.7.L.16.1 Understand and explain that every organism requires a set of instructions that specifies its traits, that this hereditary information (DNA) contains genes located in the chromosomes of each cell, and that heredity is the passage of these instructions from one generation to another. SC.7.L.16.2 Determine the probabilities for genotype and phenotype combinations using Punnett Squares and pedigrees.
Background Information:Have you ever wondered why everybody looks different from everyone else? Even brothers and sisters can look different. This is because a large variety of traits exist in the human population. Perhaps this still doesn't explain why brothers and sisters might look very different or, on the contrary, very much alike. This lab exercise will help students understand the many possible combinations available to offspring as they are being produced. Each student will pair off with a peer to become parents and produce a baby. What the baby will look like will depend on the laws of genetics. In this activity students will apply the laws of genetics to determine the appearance of their child's face by flipping coins and pairing alleles for major characteristics. Procedures:
1. Determine with your partner who will be the father and the mother. 2. Use a coin to determine the alleles. The head side represents a dominant allele; and the tail side is the
recessive allele. 3. First, the father will flip the coin to determine the sex of the child. Heads indicates the child will be a boy (Y
Chromosome); tails, a girl (X Chromosome). 4. You and your partner will flip your coin at the same time, to determine which of the traits below pertain to
your baby. Two heads indicate a homozygous dominant trait. A head and a tail equal a heterozygous dominant trait. Two tails represents a recessive trait.
5. You may also see a letter representing a Gene with a subscript H for Heads or T for Tails. 6. Remember, each parent will provide 1 allele, which when joined from both parents, it will show the Child’s
Genotype.7. Record the results for the baby on the table provided. 8. Once the chart is completed, draw or create a 3-dimensional model representing the collected
characteristics of the offspring. 9. Note: If you are making a model, be sure to cut the actual shape of the face and chin.

Trait PossibleGenotypes
Father’s Allele
Mother’s Allele
Child’s Genotype
Child’s Phenotype
Alleles
SexX Father will give an X or Y trait. XX- Female
XY - Male
faceshape
AA,Aa,aa
chinsize
BB,Bb,bb
haircolor
CH CH
CH CT
CT CT
hairtype
DH DH
DH DT
DT DT
widow’s peak
EE,Ee,ee
eyecolor
FF,Ff,ff6. Eye Color
Brown (FF) Green(Ff) Blue (ff)
Eye distance
GH GH
GH GT
GT GT

Trait PossibleGenotypes
Father’s Allele
Mother’s Allele
Child’s Genotype
Child’s Phenotyp
e
Alleles
eyesize
HH HH
HH HT
HT HT
eyeshape
II, Ii, ii
eyeslantedness
JJ, Jj, jj
eyelashes KK, Kk, kk
eyebrowcolor
LH LH
LH LT
LT LT
eyebrowthickness
MM ,Mm, mm
eyebrowlength
NN,Nn, nn
mouthsize
OH OH
OH OT
OT OT
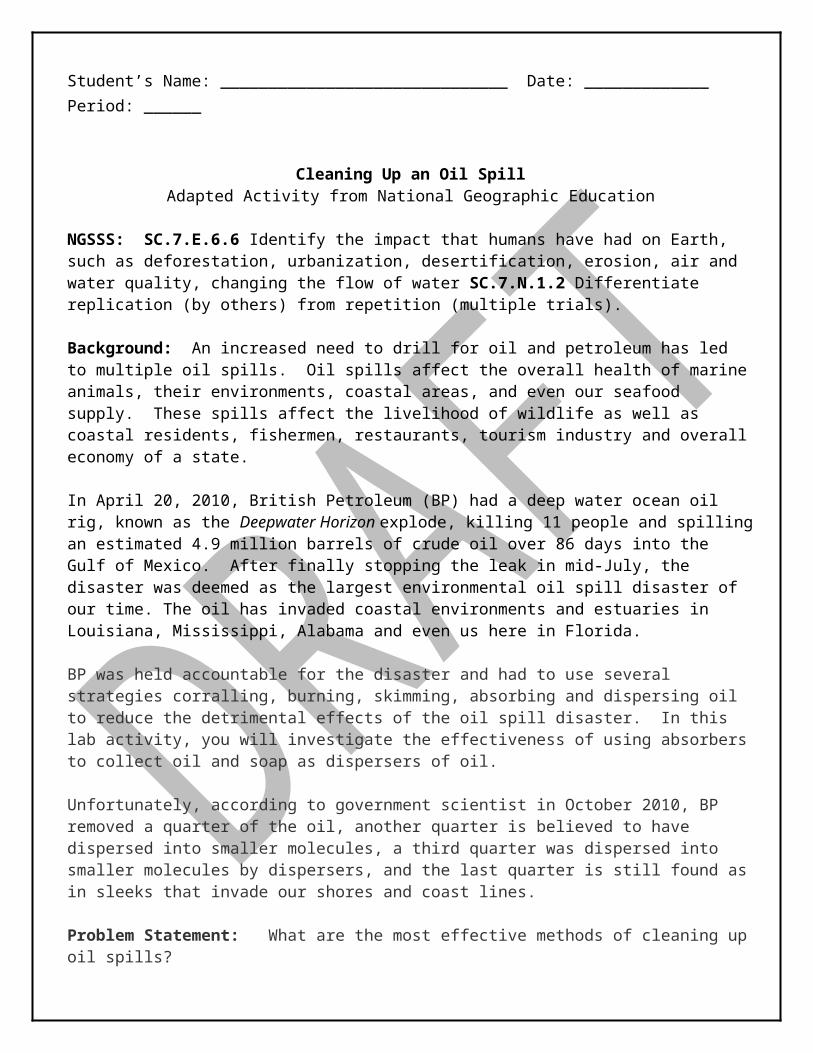
Trait PossibleGenotypes
Father’s Genes
Mother’s Genes
Child’s Genotype
Child’s Phenotyp
e
Alleles
lipthickness
PP, Pp, pp
dimples QQ, Qq, qq
nosesize
RH RH
RH RT
RT RT
noseshape
SS, Ssss
earlobe attachment
TT,Tt, tt
freckles UU ,Uu, uu
Now put it all together.
Draw your Child:
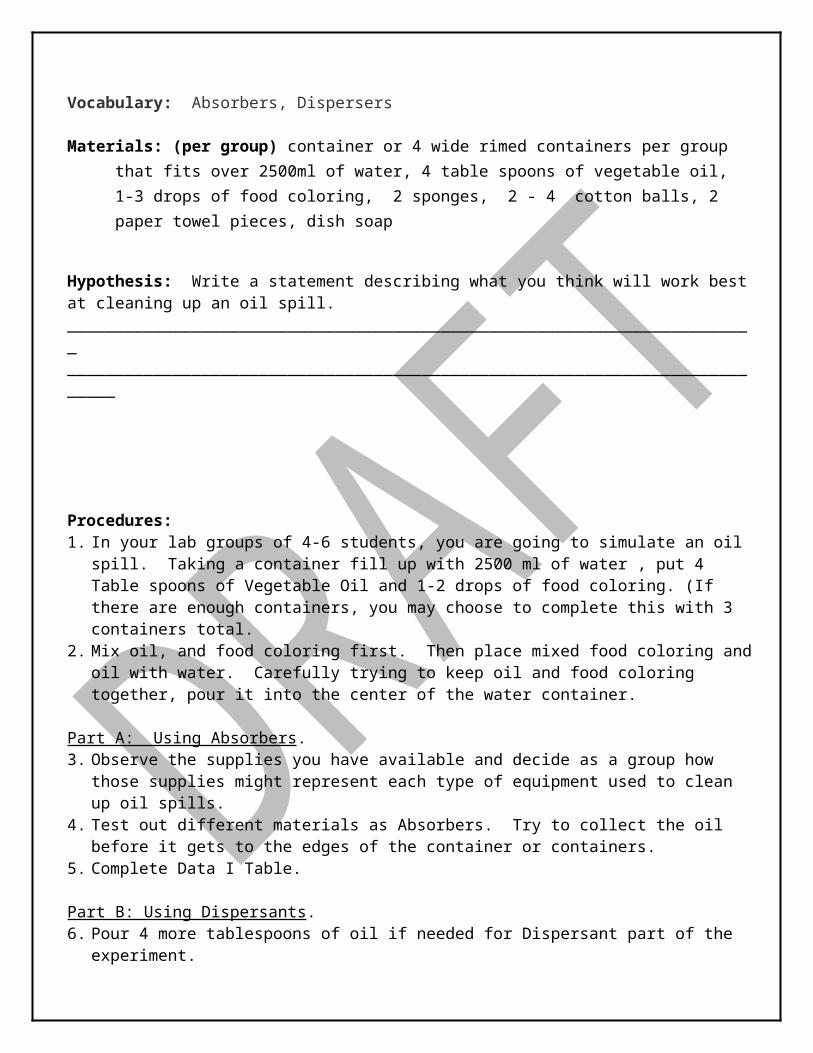
Evaluation:
1. Where do the set of instructions that determines the alleles in organisms come from? ___________________________________________________________________________2. Explain why this statement is true: “Every child is a product of his/her parents.” ________3. __________________________________________________________________________4. Look around at all the other babies. Do any of your classmates create children that look alike?_____________Explain__________________________________________________________________________________________________________________________________.5. Every organism requires a set of instructions that specifies its traits or genotype contained in DNA. How does this lab relate to Heredity? Explain. ___________________________________________________________________________________________________________6. After examining all the children created, describe how sexual reproduction contributes to variation within a species. _______________________________________________________________________________________________________________________________7. Do you think that everyone has a “twin,” that is, someone living somewhere in the world who looks exactly like him/her? Explain your reasoning. __________________________________________________________________________________________________________
Answer the following questions. Show Punnett Square to prove your response.
1. What is the probability of a mother with genotype (HH) and a father with genotype (HH) have a child with free earlobes?________________What will be the Genotype of the Offspring? _____________________ What will be the Phenotype of the Offspring? _______________________ _______________________________________________________________
2. What is the probability of a mother with genotype (FF) and a father with genotype (ff) having a child with a pointed nose? _______________
What are the Genotype of the Offspring? _________________________ What will be the Phenotype of the Offspring? _____________________
__________________________________________________________
3. What is the probability of a mother heterozygous for freckles and a father homozygous for no freckles having a child with freckles? ________________________________________________________What will be the Genotype of the Offspring? _____________________What will be the Phenotype of the Offspring?_____________________
4. How are Punnett Squares used to determine possible Allele outcomes in Genetics? _______________________________________________________________________________________________________________________________________________________________________________________________________________________________________

STUDENT HANDOUT
DIFFERENTIATED INSTRUCTION: OPEN INQUIRY
HUMAN VARIATIONS
Objectives/Purpose: Describe and explain that every organism requires a set of instructions that specifies
traits. Determine the probabilities for genotype and phenotype combinations using Punnett
Squares. Use Punnett Squares to determine genotypic and phenotypic probabilities in the form of
percents or percentages.
Demonstrate Achievement of the following Goals: Develop a problem statement about phenotypic and/or genotypic ratios based on your
knowledge of human variations. Create a model to demonstrate the concept/idea outlined in your problem statement above. How does the model demonstrate the concept/idea that you investigated? Use the “Claim, Evidence & Reasoning” rubric to defend your claims when writing your
conclusion.
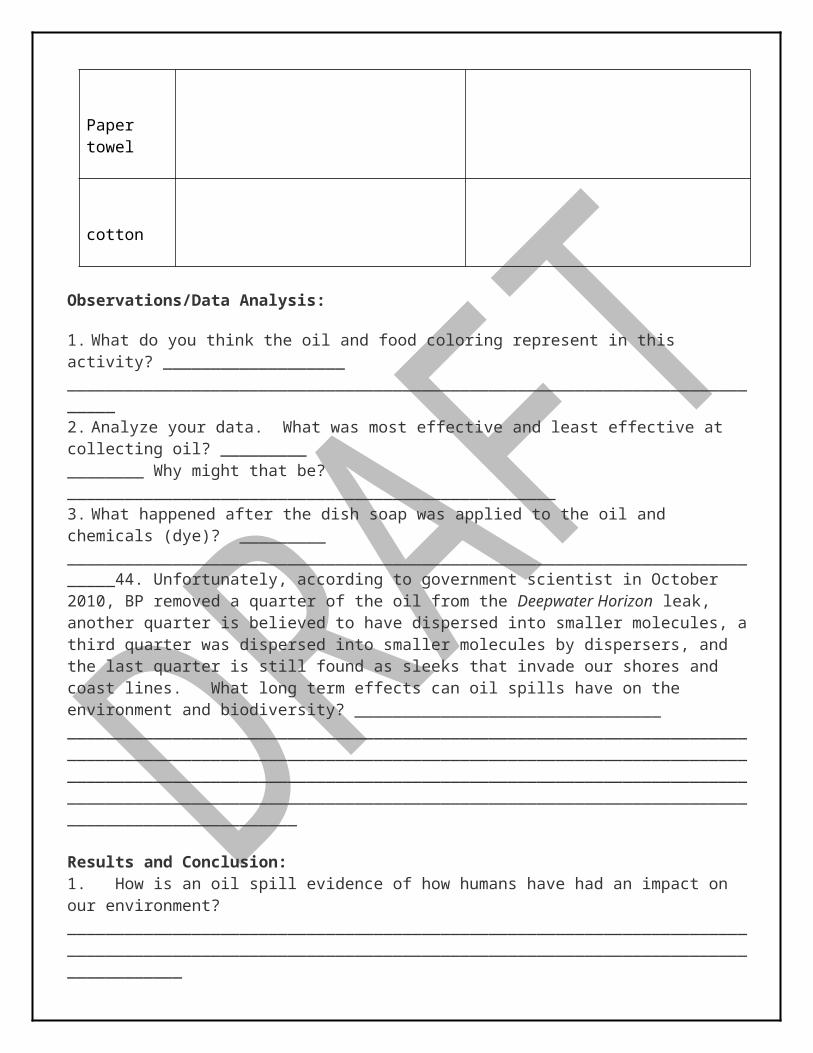
STUDENT HANDOUT
DIFFERENTIATED INSTRUCTION: OPEN INQUIRY
INCOMPLETE DOMINANCE
Objectives/Purpose: Describe and explain that every organism requires a set of instructions that specifies
traits. Determine the probabilities for genotype and phenotype combinations using Punnett
Squares. Use Punnett Squares to determine genotypic and phenotypic probabilities in the form of
percents or percentages.
Demonstrate Achievement of the following Goals: Develop a problem statement about phenotypic and/or genotypic ratios based on your
knowledge of human variations. Create a model to demonstrate the concept/idea outlined in your problem statement above. How does the model demonstrate the concept/idea that you investigated? Use the “Claim, Evidence & Reasoning” rubric to defend your claims when writing your
conclusion.
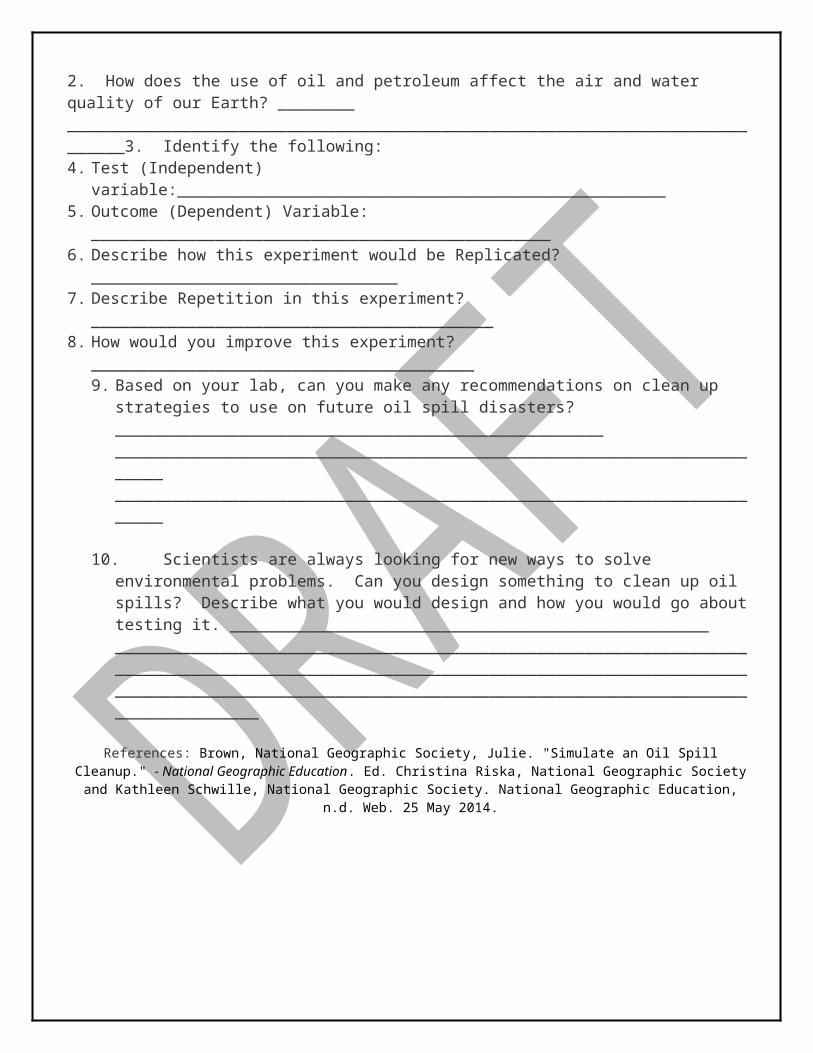
ANTI-DISCRIMINATION POLICYFederal and State Laws
The School Board of Miami-Dade County, Florida adheres to a policy of nondiscrimination in employment and educational programs/activities and strives affirmatively to provide equal opportunity for all as required by law:
Title VI of the Civil Rights Act of 1964 - prohibits discrimination on the basis of race, color, religion, or national origin.
Title VII of the Civil Rights Act of 1964, as amended - prohibits discrimination in employment on the basis of race, color, religion, gender, or national origin.
Title IX of the Educational Amendments of 1972 - prohibits discrimination on the basis of gender.
Age Discrimination in Employment Act of 1967 (ADEA), as amended - prohibits discrimination on the basis of age with respect to individuals who are at least 40.
The Equal Pay Act of 1963, as amended - prohibits gender discrimination in payment of wages to women and men performing substantially equal work in the same establishment.
Section 504 of the Rehabilitation Act of 1973 - prohibits discrimination against the disabled.
Americans with Disabilities Act of 1990 (ADA) - prohibits discrimination against individuals with disabilities in employment, public service, public accommodations and telecommunications.
The Family and Medical Leave Act of 1993 (FMLA) - requires covered employers to provide up to 12 weeks of unpaid, job-protected leave to “eligible” employees for certain family and medical reasons.
The Pregnancy Discrimination Act of 1978 - prohibits discrimination in employment on the basis of pregnancy, childbirth, or related medical conditions.
Florida Educational Equity Act (FEEA) - prohibits discrimination on the basis of race, gender, national origin, marital status, or handicap against a student or employee.
Florida Civil Rights Act of 1992 - secures for all individuals within the state freedom from discrimination because of race, color, religion, sex, national origin, age, handicap, or marital status.
Veterans are provided re-employment rights in accordance with P.L. 93-508 (Federal Law) and Section 295.07 (Florida Statutes), which stipulates categorical preferences for employment.
Revised 9/2008