Embed Size (px)
Citation preview
i
Micelles and bicelles as membrane mimics for membrane protein investigations
Ashton Tirrell Brock
Columbia, South Carolina
B.S. Chemistry, Winthrop University, 2011
A Dissertation presented to the Graduate Faculty
of the University of Virginia in Candidacy for the Degree of
Doctor of Philosophy
Department of Chemistry
University of Virginia
May, 2016

ii
© Copyright by
Ashton Tirrell Brock
All rights reserved.
May 2016.

iii
“Call it a clan, call it a network, call it a tribe, call it a family. Whatever you call it,
whoever you are, you need one.”
– Jane Howard (1935-1996) US journalist, writer
“Nothing will work unless you do.”
– Maya Angelou (1928-2014) US poet, author, civil rights activist

iv
Abstract
Membrane proteins have essential cellular functions in transport, signaling,
energy conversion and catalysis. These ubiquitous proteins comprise approximately 30%
of the genome, and with their roles in intra- and extracellular communication, membrane
proteins are the target of over 60% of the therapeutic drugs on the market. While
membrane protein research is imperative, there is significantly less known about the
function, stability, and structure of these proteins as compared to soluble proteins.
Membrane protein research is challenged by the native environment of these
proteins: the lipid bilayer. Bilayer mimics such as detergent micelles and lipid-detergent
bicelles are often used to isolate membrane proteins. Utilizing these mimics requires an
extensive screening process to identify the appropriate amphiphilic environment for
biophysical characterization, functional assays, and high-resolution structure
determination of membrane proteins. To enable rational mimic selection, the goal of this
research is to investigate the structural properties of micelles and bicelles to determine
how their physical characteristics can forward membrane protein research.
Often considered more membrane-like than micelles, the “ideal” bicelle is
composed of a lipid bilayer encapsulated by a detergent rim. Because of the propensity
for detergents to form ellipsoid micelles in aqueous environments, the feasibility of
distinctly separated lipid and detergent domains suggested by the “ideal” bicelle model is
questioned, especially in respect to detergent-rich bicelles. To investigate the viability of
the “ideal” bicelle, the structure and composition of detergent-rich bicelles was elucidated
with small angle X-ray and neutron scattering. Small angle scattering results suggest that
detergent-rich bicelles form ellipsoid structures similar to mixed micelles, with higher

v
degrees of mixing between lipid and detergent components than suggested by the “ideal”
model. As lipid concentration is increased, the aggregate transitions from a mixed micelle
to bicelle structure. This research emphasizes the importance in understanding the
structures of the mimics used for membrane protein research; the size and shape of these
ellipsoidal detergent-rich bicelles can have a significant impact on mimic selection.
The influence of detergent micelles on protein function was also investigated.
Understanding the key physical detergent properties that impact protein activity will also
guide membrane mimic selection. The activity of several membrane proteins is currently
being assayed in varying detergent micelles to correlate trends between the micelle and
active, stable protein. Functional results from two membrane enzymes, outer membrane
phospholipase A1 (OMPLA) and lipoprotein signal peptidase A (LspA) suggest that the
detergent head group charge and size has a major effect on protein activity, and the
carbon tails of these detergents have minor impacts on detergent binding and catalysis.
Identifying similar trends with other protein-detergent complexes will guide the selection
of the appropriate detergent to use for membrane protein research, and ameliorate
arduous detergent screening.

vi
Table of Contents
Copyright page .................................................................................................................... II
Dedication ..........................................................................................................................III
Abstract ............................................................................................................................. IV
Table of contents ............................................................................................................... VI
List of Figures ..................................................................................................................... X
List of Tables ................................................................................................................... XII
Chapter 1: Membrane proteins in research ..........................................................................1
1.1 Membrane protein background ................................................................................1
1.2 Significance of membrane proteins .........................................................................6
1.3 The native lipid bilayer ............................................................................................7
1.3.1 Lipid bilayer assembly .................................................................................7
1.3.2 The fluid mosaic model ...............................................................................8
1.3.3 The bacterial inner membrane ...................................................................11
1.3.4 The bacterial outer membrane ...................................................................11
1.4 Functions of membrane proteins ............................................................................12
1.4.1 OMPLA structure and function .................................................................14
1.4.2 PagP structure and function .......................................................................19
1.4.3 OmpT structure and function .....................................................................24
1.4.4 LspA structure and function.......................................................................26
1.5 Thesis objectives ....................................................................................................32
1.6 References ..............................................................................................................33
Chapter 2: Membrane mimics ............................................................................................42
2.1 Detergent micelles .................................................................................................42
2.1.1 Self-association of detergent monomers ....................................................42
2.1.2 General detergent micelle categories .........................................................44
2.1.3 Micelle properties ......................................................................................47
2.1.3.1 Effects of head group .....................................................................47
2.1.3.2 Effects of alkyl tail .........................................................................51

vii
2.1.4 Solubilization and folding of membrane proteins in micelles ...................52
2.1.5 Mixed micelles ...........................................................................................54
2.2 Bicelles ...................................................................................................................55
2.2.1 Bicelle composition ...................................................................................58
2.3 Difficulties with protein-mimic investigations ......................................................60
2.3.1 Challenges with protein-detergent complexes ...........................................61
2.3.2 Challenges with low-q bicelle structures ...................................................63
2.4 References ..............................................................................................................65
Chapter 3: The influence of detergents on the function of β-barrel enzymes ....................70
3.1 Protein-detergent complex formation with OMPLA .............................................70
3.2 Pre-assay biophysical characterization of OMPLA ...............................................75
3.2.1 Detergent exchange verification and concentration determination with
NMR ..........................................................................................................75
3.2.2 Determination of the OMPLA oligomeric state .........................................77
3.3 OMPLA activity assay design ...............................................................................83
3.4 Structural considerations for OMPLA activity ......................................................88
3.5 OMPLA activity in varying detergents ..................................................................88
3.5.1 Effects of detergent micelles on OMPLA substrate turnover rates ...........94
3.5.2 Effects of detergent micelles on OMPLA substrate affinity ......................96
3.5.3 Additional remarks of OMPLA activity ....................................................98
3.6 Future directions ..................................................................................................100
3.6.1 PagP purification and activity in detergent micelles................................100
3.6.2 OmpT purification and activity assay design ...........................................101
3.7 Conclusions ..........................................................................................................105
3.8 Materials and methods .........................................................................................108
3.8.1 Expression and purification of β-barrel enzymes ....................................108
3.8.2 SECMALS ...............................................................................................109
3.8.3 OMPLA activity assay .............................................................................110
3.8.4 PagP activity assay ...................................................................................110
Chapter 4: The influence of detergents on LspA function ...............................................113
4.1 Protein-detergent complex formation with LspA ................................................113

viii
4.1.1 Results: LspA PDC stability in detergent micelles ..................................115
4.2 LspA function in detergent micelles ....................................................................122
4.2.1 Development of a custom signal peptide substrate for LspA cleavage ...122
4.2.2 LspA HPLC assay optimization and results ............................................126
4.2.2.1 Results: LspA activity assayed with HPLC .................................128
4.2.3 LspA fluorescence assay optimization and results ..................................133
4.2.3.1 Results: Purified LspA function assayed with fluorescence ........136
4.3 Future directions and conclusions ........................................................................138
4.4 Methods................................................................................................................140
4.4.1 LspA expression and purification ............................................................140
4.4.2 LspA activity assays ................................................................................141
4.5 References ............................................................................................................143
Chapter 5: Small angle scattering of detergent-rich bicelles ...........................................145
5.1 Small angle scattering principles and methodology ............................................146
5.1.1 Small angle scattering theory ...................................................................146
5.1.2 SAXS vs. SANS.......................................................................................152
5.1.3 SANS contrast variation and multi-component systems .........................153
5.2 Previous work and project motivation .................................................................157
5.3 Structure and composition of d54-DMPC/DHPC bicelles ..................................164
5.3.1 Core-shell bicelle model ..........................................................................164
5.3.2 Determination of scattering length densities for core-shell bicelle fits ...167
5.3.3. Systematic generation of bicelle fits ........................................................169
5.3.3.1 Preliminary q = 0.3 bicelle fits .....................................................169
5.3.3.2 2nd
and 3rd
generation fits of q = 0.3 bicelles ..............................175
5.3.3.3 Final generation bicelle fits .........................................................176
5.3.4 Results: SANS-determined bicelle dimensions .......................................176
5.4 Discussion ............................................................................................................182
5.4.1 Dimensions of detergent-rich bicelles .....................................................182
5.4.2 Utilizing MD simulations to observe low-q bicelles ...............................185
5.4.3. Bulk q-ratio vs. actual q-ratio ..................................................................185

ix
5.4.4 Dimensions of the simulated bicelles correlate well with experimental data
..................................................................................................................188
5.4.5 Detergent-rich bicelles are mixed systems that contradict the ideal bicelle
model........................................................................................................192
5.5 Closing remarks and future directions .................................................................193
5.6 Methods................................................................................................................200
5.6.1 Sample preparation ..................................................................................200
5.6.2 SANS data collection and contrast variation ...........................................201
5.7 References ............................................................................................................202

x
List of Figures
Figure 1.1 Membrane protein topology depicted with a fictional amino acid sequence ....4
Figure 1.2. Examples of membrane protein tertiary structures ...........................................5
Figure 1.3. Diagram of the fluid mosaic model ..................................................................9
Figure 1.4. Composition of the outer membrane ..............................................................13
Figure 1.5. Structure of OMPLA ......................................................................................16
Figure 1.6. Phospholipid cleavage sites for OMPLA cleavage ........................................17
Figure 1.7. PagP palmitoylation of Lipid A ......................................................................21
Figure 1.8. Structure of PagP ............................................................................................22
Figure 1.9. Structure of OmpT ..........................................................................................25
Figure 1.10. LspA topology ..............................................................................................27
Figure 1.11. Simple Sec pathway diagram for protein exportation ..................................30
Figure 1.12. Topology of the LspA signal peptide substrate ............................................31
Figure 2.1. The relationship between monomeric concentration and total concentration of
amphiphiles in solution .....................................................................................................43
Figure 2.2. Common detergent monomer structures ........................................................46
Figure 2.3. Ellipsoidal model of a micelle ........................................................................48
Figure 2.4. Ideal bicelle structure .....................................................................................57
Figure 2.5. Bicelle structure dependence on q ..................................................................59
Figure 3.1. OMPLA refolding optimization in several detergents ...................................72
Figure 3.2. OMPLA purification and detergent exchange fractions .................................73
Figure 3.3. OMPLA purified in several detergents ...........................................................74
Figure 3.4. 1-D 1H NMR spectra of OMPLA before and after detergent exchange .........76
Figure 3.5. SECMALS chromatograms with DDM and FC16 OMPLA ..........................81
Figure 3.6. Workflow of the OMPLA activity assay ........................................................84
Figure 3.7. Example of Michaelis-Menten curve representing OMPLA activity .............86
Figure 3.8. Substrate turnover rates (kcat) of OMPLA PDCs ............................................89
Figure 3.9. Substrate specificities (KM) of OMPLA PDCs ..............................................90
Figure 3.10. Surface representation of the OMPLA dimer ...............................................94
Figure 3.11. PagP purified in several detergents ............................................................100
Figure 3.12. PagP activity assay .....................................................................................101
xi
Figure 3.13. Activity of Cyclofos7 PagP ........................................................................102
Figure 3.14. OmpT purified in several detergents ..........................................................104
Figure 3.15. OmpT activity assay ...................................................................................105
Figure 4.1. Hydrogen bonding and protein secondary structure .....................................114
Figure 4.2. LspA purification in FC12 detergent micelles .............................................116
Figure 4.3. Structures of dodecylthiomaltoside and dodecyldimethylglycine detergents
..........................................................................................................................................117
Figure 4.4. LspA PDC solubility in phosphocholine and maltoside detergents .............119
Figure 4.5. Structures of similar detergents and lipids ...................................................121
Figure 4.6. Typical circular dichroism spectra ...............................................................123
Figure 4.7. CD spectra of LspA in varying detergents ...................................................124
Figure 4.8. HPLC activity assay controls .......................................................................127
Figure 4.9. LspA activity with each substrate .................................................................129
Figure 4.10. UVAB3 engineered with the donor/quencher pair .....................................130
Figure 4.11. Fluorogenic signal peptide only chromatograms .......................................131
Figure 4.12. Fluorogenic UVAB3 and UVAB4 positive and negative controls ............132
Figure 4.13. Purified LspA HPLC activity chromatograms ...........................................134
Figure 4.14. LspA fluorescence assay results .................................................................135
Figure 4.15. LspA PDC activity in the presence of globomycin ....................................139
Figure 5.1. SAS experiment design ................................................................................148
Figure 5.2. Example of SANS contrast variation ...........................................................156
Figure 5.3. d54-DMPC/DHPC bicelle SANS contrast variation experimental design ...158
Figure 5.4. Experimental SAXS profiles of DMPC/DHPC bicelles ..............................160
Figure 5.5. SANS contrast variation series of DMPC/DHPC bicelles ...........................163
Figure 5.6. Core-shell models for SANS fitting .............................................................165
Figure 5.7. First generation q = 0.3 bicelle fits ...............................................................172
Figure 5.8. Preliminary bicelle fits plotted in respect to radius vs. length .....................174
Figure 5.9. Small angle neutron scattering profiles of q = 0.3 bicelles ..........................177
Figure 5.10. Small angle neutron scattering profiles of q = 0.7 bicelles .........................178
Figure 5.11. Suggested route for lipid partitioning with increased q-ratio .....................184
Figure 5.12. Simulated DMPC/DHPC bicelles at q-ratios of 0.3 and 0.7 .......................186

xii
Figure 5.13. SAXS profiles generated from simulated DMPC/DHPC bicelles .............189
Figure 5.14 SANS profiles generated from simulated DMPC/DHPC bicelles ..............190
Figure 5.15. Core-shell bicelle fits to the q = 0.5 bicelles ..............................................195
Figure 5.16. Simulated DMPC/DHPC bicelle at q = 0.5 .................................................197
Figure 5.17. Opa proteobicelle SANS scattering profile ................................................199
List of Tables
Table 2.1. Properties of detergent micelles .......................................................................49
Table 3.1. Molecular weights and aggregation numbers from SECMALS of OMPLA
PDCs .................................................................................................................................80
Table 3.2. OMPLA PDC detergent, micelle, and protein concentrations as well as activity
kinetic parameters in varying detergents ..........................................................................93
Table 4.1. LspA purification in varying detergents ........................................................116
Table 4.2. Signal peptides and the custom substrate sequences .....................................123
Table 4.3. LspA fluorescence assay results ....................................................................135
Table 5.1. Neutron scattering lengths and cross-sections ...............................................150
Table 5.2. Scattering length densities (SLD) of water with increasing D2O concentrations
..........................................................................................................................................155
Table 5.3. Measured radii of gyration and dominant head group to head group distances
of DMPC/DHPC bicelles ................................................................................................161
Table 5.4. SASView core-shell bicelle parameters ........................................................168
Table 5.5. Four generations of core-shell bicelle fit constrained parameters .................171
Table 5.6. First generation q = 0.3 bicelle fits ................................................................173
Table 5.7. Final d54-DMPC/DHPC bicelle dimensions .................................................181
Table 5.8. Bicelle dimensions determined from the atomic MD-simulated bicelles ......187
Table 5.9. Bicelle dimensions determined from SAXS and SANS profiles of simulated
complexes .......................................................................................................................191
Table 5.10. d54-DMPC/DHPC dimensions for q = 0.5 bicelles .....................................196
Table 5.11. Size and shape of MD-simulated q = 0.5 bicelles ........................................198

1
Chapter 1: Membrane proteins in research
All functions of living organisms are made possible by the actions of proteins.
Highly abundant and extraordinarily diverse in cells, these biomolecules perform
essential cellular processes to sustain life. Fundamentally, proteins are polymers of 20 or
more amino acids. The amino acid sequence, or primary structure, of these proteins is
dictated from a DNA sequence, representing the “Central Dogma” of molecular biology –
DNA is transcribed to RNA, which is translated to protein.1 Once translated from the
ribosome, these proteins adopt one or more three-dimensional conformations in which
their functional roles are performed.
In 1953, Sanger and Thompson determined the complete amino acid sequence of
bovine insulin, writing: 2,3
“It is certain that proteins are extremely complex molecules but they are no longer
completely beyond the reach of the chemist, so that we may expect to see in the
near future considerable advances in our knowledge of the chemistry of these
substances which are the essence of living matter”
The substantial progress in the field of protein chemistry that Sanger predicted was
exemplified with the publishing of the first high-resolution, three-dimensional protein
structure of myoglobin in 1960 via X-ray crystallography.4 Following these discoveries,
over 24,000 unique protein structures have been deposited in the RCSB Protein Data
Bank. Despite this increasing wealth of information, there is more to learn about the
diverse structures and functions of proteins.
1.1 Membrane protein background

2
Proteins can be divided into two classes: soluble and membrane proteins. Soluble
proteins fold with hydrophobic residues excluded from the aqueous solvent, within the
inner core. Unlike their soluble counterparts, membrane proteins have both hydrophobic
and hydrophilic domains on their surface. Because exposure to the aqueous solvent is
unfavorable for these nonpolar residues, membrane proteins fold within the cellular
membrane such that the hydrophobic residues interact with the hydrocarbon core while
the polar residues remain in the exterior of the membrane. The cellular membrane
satisfies the hydrophilic and hydrophobic protein surface requirements, and stabilizes the
functional fold of membrane proteins.
The membrane is an environment consisting of lipids organized in a two-layered
planar structure with polar head groups facing the aqueous space and nonpolar tails on
the interior. Native bilayers are 40 to 50 Å thick, with the hydrophobic region spanning ~
30 Å and a head group shell of 10 Å or less. The assembly and composition of the bilayer
is discussed extensively in Section 1.3. Because of the hydrophobicity of the membrane,
it is unfavorable for polar and charged residues to interact with the interior of the bilayer.
Hydrophobic residues interact with the bilayer hydrocarbon core, stabilizing the protein’s
fold via van der Waals interactions with the bilayer hydrophobic tails.5
The trends of protein primary structure and fold in bilayers were expanded several
researchers including Wimley and White, who determined the preference for specific
amino acid partitioning into the membrane.6 This research monitored the difference in
free energy of a membrane peptide, WL-X-LL, as it was altered at the X position for
varying amino acids and exposed to octanol and water. The amino acids with the highest
free energy of transition were most likely present in transmembrane domain (TMD) of

3
the bilayer. Following establishing this relationship between amino acids and membrane
partitioning, the hydrophobicity scale, a measure of how soluble an amino acid is in
water, was developed. As expected, it was unfavorable for charged and polar residues to
interact with the hydrocarbon core of the membrane in comparison to nonpolar amino
acids. Therefore, the hydrophilic residues tend to localize near the lipid head groups or in
the periplasmic or extracellular space.
Additional studies analyzed the frequency and position of amino acids of several
membrane proteins. Typically, leucine is the most prevalent residue in membrane protein
sequences, followed by isoleucine, valine, alanine, phenylalanine, and glycine.7 Lysine
and aspartate are the least prevalent amino acids.7 Basic residues are more populated
within the intracellular side of the protein, resulting in the positive-inside rule that often
used for identifying the topology of membrane helices.8 Lysine and arginine, also tend to
“snorkel,” orienting themselves to allow an association between their long aliphatic
chains with the hydrophobic bilayer core while extending beyond the core for interactions
between their positive charged groups at the end of the amino acid with the lipid polar
head group.9 Aromatic residues localize near the membrane interface, enabling hydrogen
bonding with lipid head groups or water molecules while maintaining nonpolar
interactions with hydrocarbon lipid tails.10-12
Membrane protein topology is often
predicted using this knowledge of the localization of charged, aromatic, and nonpolar
residues in a lipid bilayer environment (Figure 1.1).
While all membrane proteins share common distributions of certain amino acids,
the proteins can also be divided into two subclasses by fold: α-helical bundles and β-
barrels (Figure 1.2). α-helical bundles, found in every cellular membrane and the inner

4
Figure 1.1 Membrane protein topology depicted with a fictional amino acid sequence.
Native bilayers are 40 to 50 Å thick, with the hydrophobic region spanning ~30 Å and a
head group shell thickness of 10 Å or less. Membrane proteins often have similar
topology, regardless of the type of membrane or the secondary structure of the protein.
This topology includes the charged and polar residues (green) in the aqueous periplasm
or extracellular space, the aromatic residues (red) near the bilayer interface, the
snorkeling residues (orange) and the interior of the bilayer containing mostly
hydrophobic residues (black).

5
Figure 1.2. Examples of membrane protein tertiary structures. α-helical bundles and β-
barrels, such as rhodopsin (pink) and OmpA (purple), located in the inner and outer
membrane, respectively, are the protein structures found in cellular membranes. These
structures can be monotopic or polytopic, attached to one side of the membrane or
spanning the entire membrane one or more times.

6
membrane of bacteria and organelles, are composed of membrane spanning α-helices.13
Depending on the entry point, slope, and straightness, the length of the transmembrane
helices varies from 20 to 40 residues, with typically 3.6 residues per turn.14
β-barrels are
only found in Gram-negative outer membranes, and in the outer membrane of
mitochondria and chloroplasts.15
Several antiparallel β-strands form a closed cylinder via
hydrogen bonds within the interior, making the rigid, stable β-barrel. Typically, β-barrels
have a periplasmic domain with tight turns and an extracellular side with longer loops.16
β-barrels span the membrane with up to 22 β-strands of 9 to 11 residues each and a tilt of
20-45° with respect to the membrane.13
Most bacterial α-helical and β-barrel proteins are both targeted and inserted into
the membrane through a translocon. Ribosomes making α-helical bundles typically bind
cotranslationally with the SecYEG translocon in the inner membrane. The α-helical
protein is then translated directly into the membrane, moving laterally from the SecYEG
translocon channel.10
β-barrels are transferred to the SecYEG translocon via SecB, and
then posttranslationally translocated through the SecYEG and inner membrane with the
aid of the SecA ATPase. β-barrel proteins are then chaperoned through the periplasmic
space and inserted into the outer membrane via the Bam (β-barrel assembly machinery)
complex.10
Once at their final destination in the inner and outer membranes, these
membrane proteins participate in their cellular roles.
1.2 Significance of membrane proteins
Membrane proteins are essential to the cell with functions in transporting,
signaling, energy conversion, and catalysis. As such, these proteins are ubiquitous;
approximately 30% of the genome encodes for membrane proteins.17
These proteins have

7
significant pharmaceutical implications because of their role in intra- and extracellular
communication. Membrane proteins are the target of approximately 60% of all of the
FDA-approved drugs on the market, ranging from allergy medicine responding to
membrane receptors to diuretics that interact with membrane transporters.18-19
Despite
their significance to physiology and medicinal research, there is considerably less
information about membrane proteins than soluble proteins. Of the 24,693 unique protein
structures deposited in the Protein Data Bank, only 584 (~2%) are membrane proteins.20
Progress in membrane protein characterization is complicated by low protein expression
and lack of in situ biophysical techniques, but the most problematic challenge is the
membrane protein native environment, the lipid bilayer.
1.3 The native lipid bilayer
Membrane proteins are embedded in the lipid bilayer. This vast, heterogeneous,
dynamic native membrane provides the stability and electrostatic interactions necessary
for stable, properly folded, and active membrane proteins. The native lipid bilayer is not a
feasible environment for most biophysical techniques used to study membrane proteins.
Standard techniques such as nuclear magnetic resonance (NMR), X-ray crystallography,
small angle scattering (SAS) require a highly homogenous environment, which is the
opposite of a physiological lipid membrane. Researchers are challenged to solubilize
membrane proteins while preserving its stability and functional fold for accurate
structural or physical characterization of membrane proteins.
1.3.1 Lipid bilayer assembly
Biological membranes are mainly composed of amphipathic glycerophospholipids
and membrane proteins. Each lipid has a hydrophilic polar head group and two

8
hydrophobic nonpolar acyl carbon tails. The assembly of lipid bilayers, monolayers, and
other phases are driven by the hydrophobic effect.21
Water molecules self-associate via
hydrogen bonding. Insertion of nonpolar molecules, such as lipids, into an aqueous
environment distorts these interactions, and forces water molecules to reorder around the
nonpolar entity. There may or may not be a loss of hydrogen bonds during this reordering
of water molecules, affecting the enthalpy. However, the cage, or clathrate, that water
forms around the nonpolar molecule is greatly ordered, resulting in a substantial loss of
entropy. The water molecules lower this entropic cost by sequestering the nonpolar
molecules into larger aggregates, reducing the total surface area of exposed nonpolar
material and decreasing the amount of water molecules in clathrates, increasing
entropy.21
Van der Waals forces between lipid acyl tails further stabilize the nonpolar
aggregate.21
This nonpolar, lipid aggregate surrounded by water maximizes the polar-
polar water interactions and nonpolar-nonpolar acyl tail interactions, while minimizing
unfavorable polar-nonpolar interaction between water and the hydrocarbons.
1.3.2 The fluid mosaic model
The fluid mosaic model was proposed by Singer and Nicholson in 1972 after
much debate about the lipid membrane structure and composition (Figure 1.3).22
The first
principle established by the model is that the lipid aggregate is a bilayer, as opposed to
the monolayers previously expected.23
Lipids have an overall cylindrical shape and
aggregation of these molecules results in a bilayer: a two-layered planar structure with
hydrophilic head groups facing the aqueous space and hydrophobic tails on the interior.
Bilayer thickness depends on the number of carbons in the phospholipid acyl chains.

9
Figure 1.3. Diagram of the fluid mosaic model. The heterogeneous bilayer contains
integral and peripheral membrane proteins embedded in a phospholipid bilayer. This
environment also contains cholesterol, glycolipids, and carbohydrates.
10
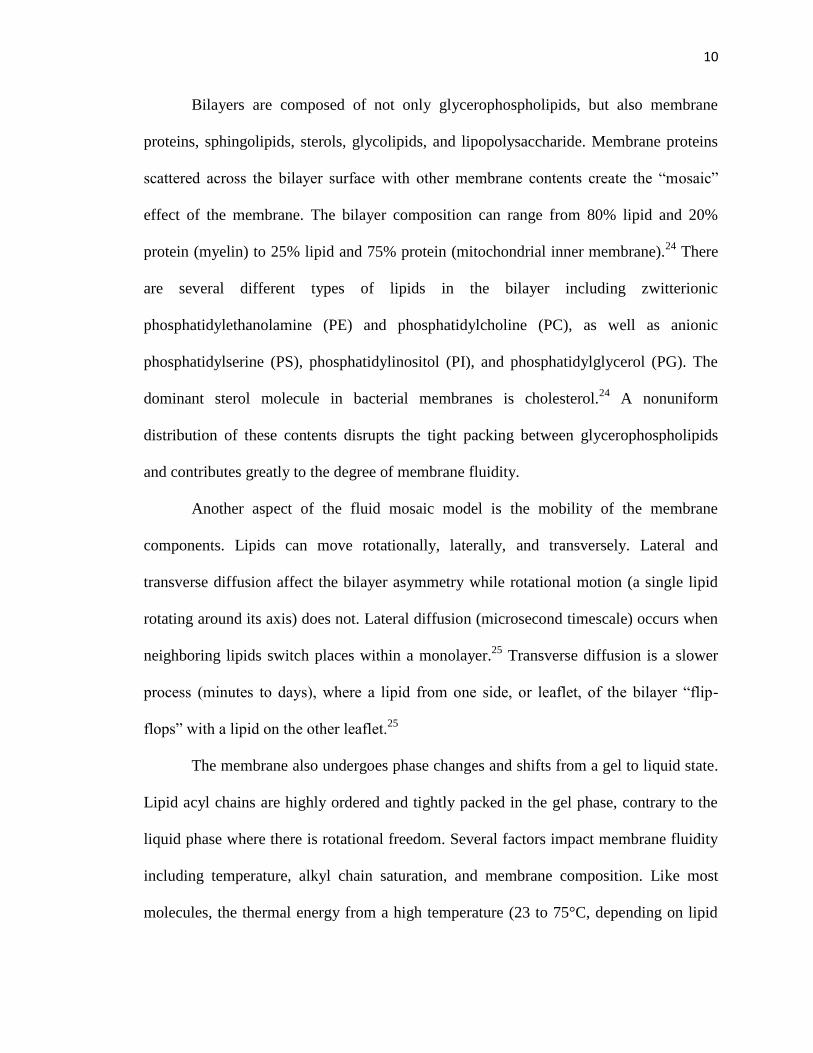
Bilayers are composed of not only glycerophospholipids, but also membrane
proteins, sphingolipids, sterols, glycolipids, and lipopolysaccharide. Membrane proteins
scattered across the bilayer surface with other membrane contents create the “mosaic”
effect of the membrane. The bilayer composition can range from 80% lipid and 20%
protein (myelin) to 25% lipid and 75% protein (mitochondrial inner membrane).24
There
are several different types of lipids in the bilayer including zwitterionic
phosphatidylethanolamine (PE) and phosphatidylcholine (PC), as well as anionic
phosphatidylserine (PS), phosphatidylinositol (PI), and phosphatidylglycerol (PG). The
dominant sterol molecule in bacterial membranes is cholesterol.24
A nonuniform
distribution of these contents disrupts the tight packing between glycerophospholipids
and contributes greatly to the degree of membrane fluidity.
Another aspect of the fluid mosaic model is the mobility of the membrane
components. Lipids can move rotationally, laterally, and transversely. Lateral and
transverse diffusion affect the bilayer asymmetry while rotational motion (a single lipid
rotating around its axis) does not. Lateral diffusion (microsecond timescale) occurs when
neighboring lipids switch places within a monolayer.25
Transverse diffusion is a slower
process (minutes to days), where a lipid from one side, or leaflet, of the bilayer “flip-
flops” with a lipid on the other leaflet.25
The membrane also undergoes phase changes and shifts from a gel to liquid state.
Lipid acyl chains are highly ordered and tightly packed in the gel phase, contrary to the
liquid phase where there is rotational freedom. Several factors impact membrane fluidity
including temperature, alkyl chain saturation, and membrane composition. Like most
molecules, the thermal energy from a high temperature (23 to 75°C, depending on lipid

11
tail length) causes an increase in lipid motion, resulting in a more liquid state.26
The
degree of saturation of the acyl chains affects how closely they can interact via van der
Waals forces. A cis-double bond introduces a kink in the carbon tails, which affects how
closely they can associate, decreasing melting temperature (Tm). Changes in the
membrane composition affect membrane fluidity in several ways. An increase in acyl
chain length allows more van der Waals interactions between each lipid, increasing Tm.26
Cholesterol regulates fluidity for both gel and liquid states. The large molecule stabilizes
and increases the rigidity of the membrane, ordering the lipids at higher temperatures.27
The sterol also separates the phospholipids, partitions into the densely packed lipids, and
reduces lipid ordering.28
1.3.3. The bacterial inner membrane
Gram-negative bacterial cells contain both an inner and outer membrane,
separated by the periplasmic space. Unlike eukaryotic cells that contain intracellular
organelles such as the endoplasmic reticulum and mitochondria that perform a number of
essential membrane-associated cellular processes, bacteria lack organelles, and
consequently, all of these essential functions occur at the bacterial inner membrane (IM).
Energy production, protein secretion, lipid biosynthesis, transport, and cellular signaling
events all take place within the inner membrane.29
The IM is a phospholipid bilayer; in E.
coli, the primary phospholipids present are PE and PG, but there are lesser amounts of PS
and cardiolipin.29
1.3.4. The bacterial outer membrane
The outer membrane provides resistance to toxic host molecules and a
permeability barrier between the cell and the extracellular environment.30
The bilayer is

12
highly asymmetric, with the inner leaflet consisting of glyerophospholipids (70-80% PE
and 20-30% PG lipids) and cardiolipin while the outer leaflet is primarily composed of
LPS (Figure 1.4).31
LPS contains three parts: the hydrophobic anchor, Lipid A, the core
oligosaccharide, and the O-antigen polysaccharide. Lipid A interacts with phospholipids
of the inner leaflet via van der Waals forces, forming the 30 Å thick bilayer. Unlike
phospholipids in the inner leaflet, all carbon chains of lipid A are saturated.32
The lipid A
core is modified with several phosphate groups that contribute to the overall negative
charge of the moiety. The O-antigen is a repetitive glycan polymer that interacts with the
extracellular space.32
The O-antigen composition is bacterial strain-specific, but can also
vary within one bacterial strain.32
Modifications to LPS have an impact on the host cell’s
immune response, which will be mentioned below in Section 1.4.2. with PagP function.32
1.4 Functions of membrane proteins
Membrane proteins participate in a variety of functions; the three primary classes
are transporters, receptors, and enzymes. Transport across the membrane can occur in
several ways. Active transport proteins move a molecule or ion against a concentration
gradient. These proteins require one of two primary sources of energy for this function:
energy from the hydrolysis of ATP (primary active transport) or energy provided when a
molecule moving with the concentration gradient is coupled to the transport of a
molecule moving against the gradient (secondary active transport). A well-characterized
active transport protein is the Na+/K+ pump.33
The pump transports two K+ ions into and
three Na+ ions out of the cell with every ATP hydrolyzed. Lactose permease from E. coli
is a secondary active transporter, specifically a symport protein which uses the proton

13
Figure 1.4. Composition of the outer membrane. The outer membrane has an inner leaflet
on the periplasmic face and an outer leaflet that faces the extracellular space. The inner
leaflet contains mostly PG and PE lipids. The outer leaflet contains LPS, which contains
lipid A, the core oligosaccharide composed of 3-deoxy-α-D-mannooctulosonic acid
(KDO) and heptulose (Hep), and the O-antigen polysaccharide comprised of
galactosamine (NGa) and glucosamine (NGc).
14
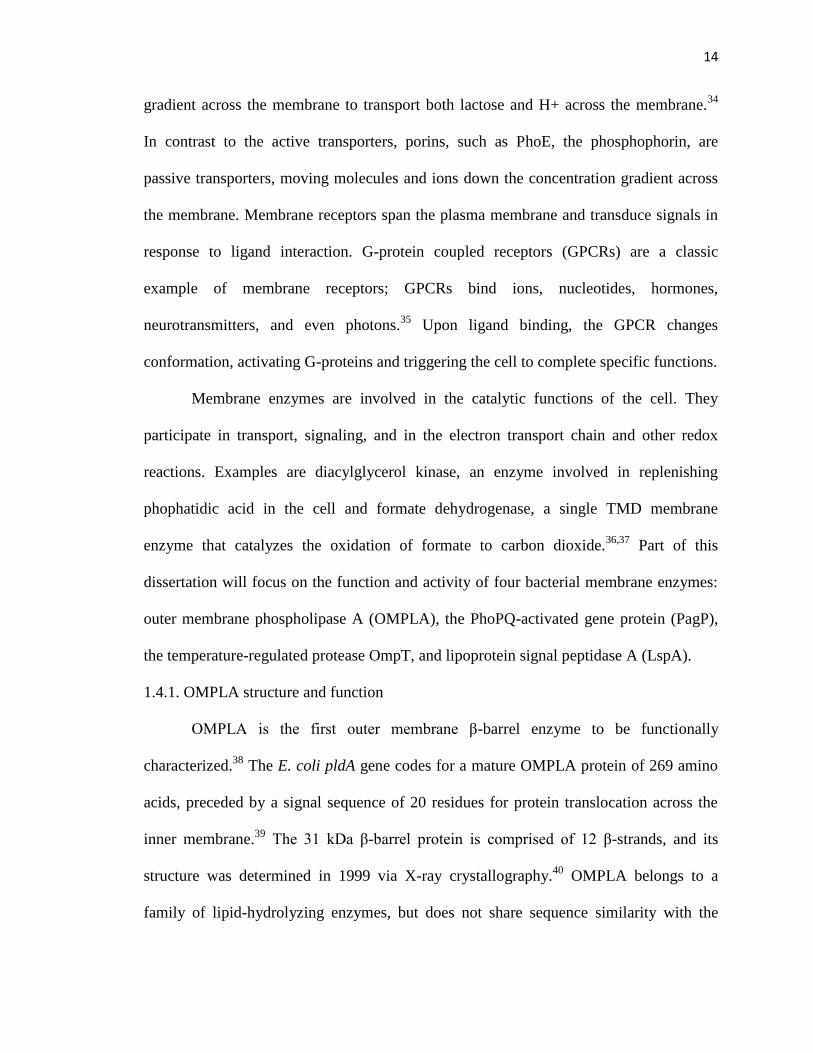
gradient across the membrane to transport both lactose and H+ across the membrane.34
In contrast to the active transporters, porins, such as PhoE, the phosphophorin, are
passive transporters, moving molecules and ions down the concentration gradient across
the membrane. Membrane receptors span the plasma membrane and transduce signals in
response to ligand interaction. G-protein coupled receptors (GPCRs) are a classic
example of membrane receptors; GPCRs bind ions, nucleotides, hormones,
neurotransmitters, and even photons.35
Upon ligand binding, the GPCR changes
conformation, activating G-proteins and triggering the cell to complete specific functions.
Membrane enzymes are involved in the catalytic functions of the cell. They
participate in transport, signaling, and in the electron transport chain and other redox
reactions. Examples are diacylglycerol kinase, an enzyme involved in replenishing
phophatidic acid in the cell and formate dehydrogenase, a single TMD membrane
enzyme that catalyzes the oxidation of formate to carbon dioxide.36,37
Part of this
dissertation will focus on the function and activity of four bacterial membrane enzymes:
outer membrane phospholipase A (OMPLA), the PhoPQ-activated gene protein (PagP),
the temperature-regulated protease OmpT, and lipoprotein signal peptidase A (LspA).
1.4.1. OMPLA structure and function
OMPLA is the first outer membrane β-barrel enzyme to be functionally
characterized.38
The E. coli pldA gene codes for a mature OMPLA protein of 269 amino
acids, preceded by a signal sequence of 20 residues for protein translocation across the
inner membrane.39
The 31 kDa β-barrel protein is comprised of 12 β-strands, and its
structure was determined in 1999 via X-ray crystallography.40
OMPLA belongs to a
family of lipid-hydrolyzing enzymes, but does not share sequence similarity with the

15
other soluble proteins in the group.36
OMPLA is inactive as a monomer, but active as a
reversible dimer (Figure 1.5A). The dimer has calcium-dependent phospholipase A1 and
A2 abilities, cleaving the acyl chain from either carbon 1 or carbon 2 of phospholipids
into lysophospholipids (Figure 1.6).41,42
OMPLA dimerization and calcium-dependent
activity is a response to perturbations of the integrity of the outer membrane. Typically,
the outer leaflet of the outer membrane is composed of only lipopolysaccaride (LPS), a
large lipid and polysaccharide molecule, while the inner leaflet contains phospholipids.
Events such as heat shock, EDTA treatment, and phage-induced lysis negatively affect
this normal lipid asymmetry.38
These disruptions in the membrane integrity cause
phospholipids that normally remain on the inner leaflet of the outer membrane to move to
the outer leaflet, accessing the active site of OMPLA, triggering dimerization, and
resulting in calcium-dependent phospholipase cleavage.
OMPLA has implications in several biological processes. The constitutive
expression of OMPLA suggests that it is a housekeeping enzyme, responding to any
perturbations to the outer membrane integrity in the cell.41
OMPLA cleavage of
phospholipids results in an accumulation of lysophospholipids in the outer membrane.
These amphiphilic molecules often perturb membranes, destabilize blood cell
membranes, and contribute to increased hemolysis.43
Phospholipases also play a role in
the virulence of several pathogenic bacteria. Three bacteria, Proteus mirabilis,
Helicobacter pylori, and Staphylococcus saprophyticus, produce urease, a potent
virulence factor necessary for the pathogens to colonize the gastric mucosa.44,45
Phospholipases degrade the gastric membrane, allowing for the release of ureases into the
16
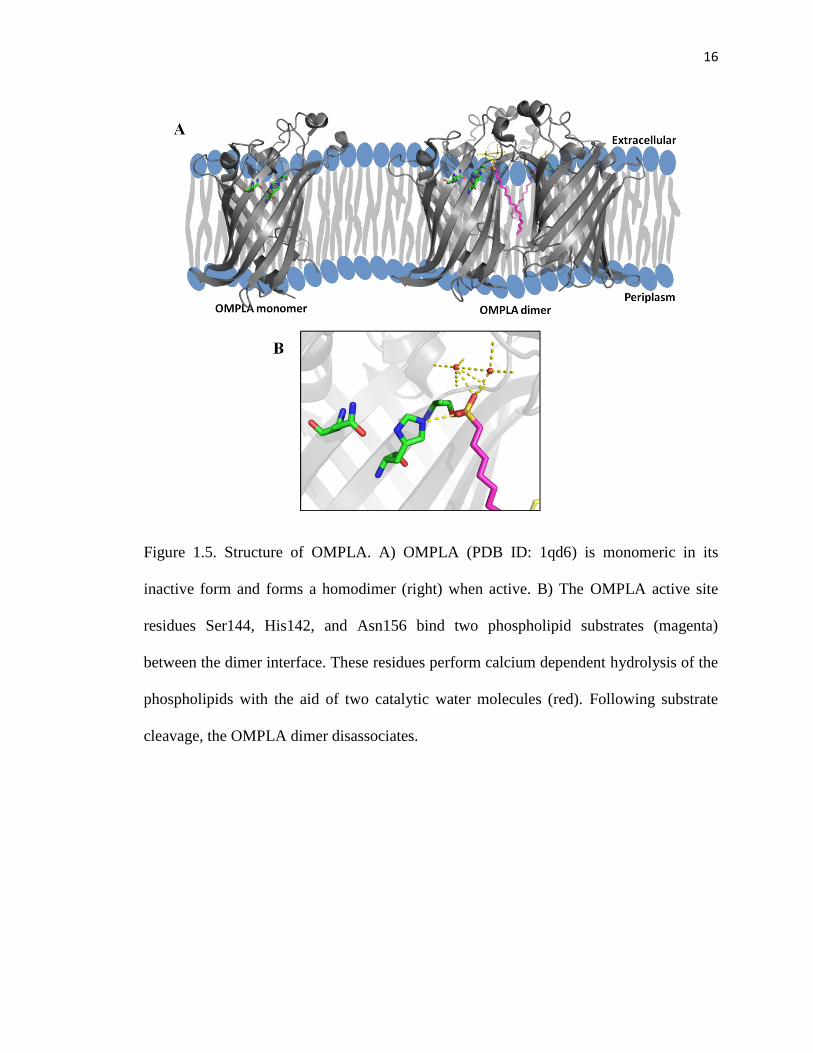
Figure 1.5. Structure of OMPLA. A) OMPLA (PDB ID: 1qd6) is monomeric in its
inactive form and forms a homodimer (right) when active. B) The OMPLA active site
residues Ser144, His142, and Asn156 bind two phospholipid substrates (magenta)
between the dimer interface. These residues perform calcium dependent hydrolysis of the
phospholipids with the aid of two catalytic water molecules (red). Following substrate
cleavage, the OMPLA dimer disassociates.
17
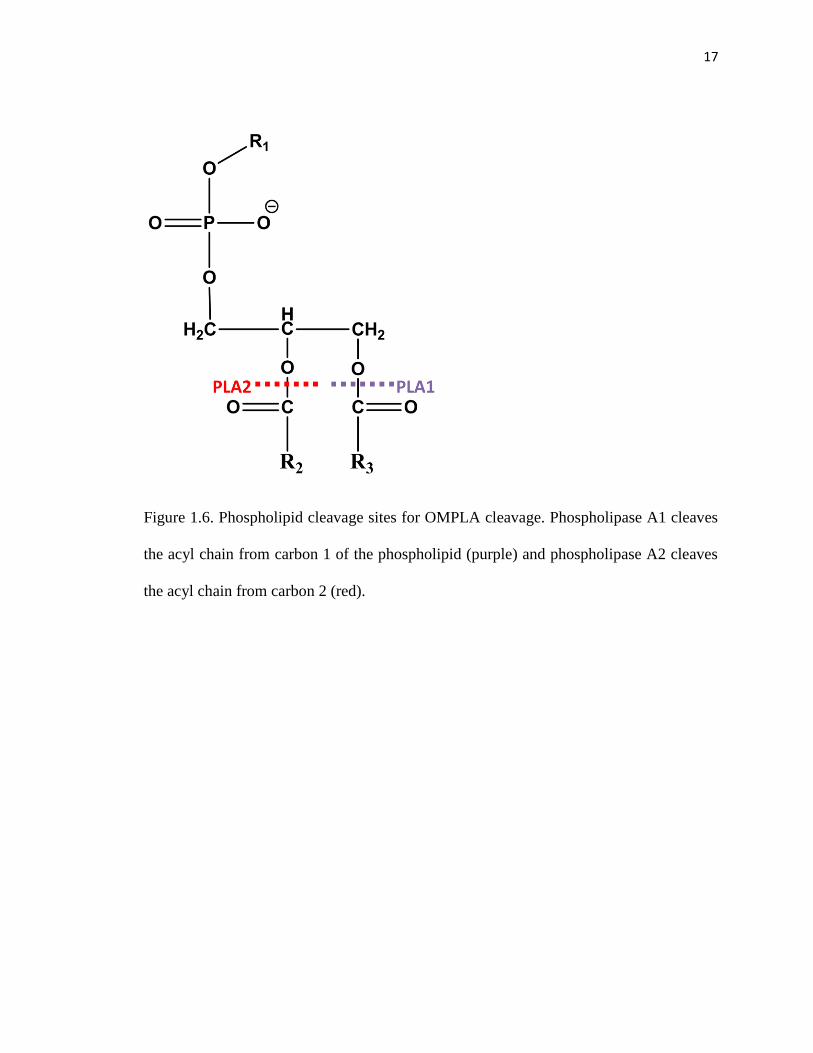
Figure 1.6. Phospholipid cleavage sites for OMPLA cleavage. Phospholipase A1 cleaves
the acyl chain from carbon 1 of the phospholipid (purple) and phospholipase A2 cleaves
the acyl chain from carbon 2 (red).

18
host. Bacterial ureases aid in the colonization of the host by neutralizing gastric acid and
providing ammonia for pathogenic bacterial protein synthesis.46
High amounts of urease
in the stomach are associated with hepatic encephalopathy, peptic ulcers, and infection
stones.47
Bacteriocin-release proteins (BRP) also use OMPLA to secrete colicins through
the outer membrane. The BRP signal peptide, which is not degraded after processing,
accumulates in the cytoplasmic membrane.48
Over expression of BRP accumulates these
peptides in the membrane which in turn, activates the OMPLA dimer, permeabilizes the
cell membrane, and allows colicin release.49
The release of colicins kills other bacteria of
the same species, providing a competitive advantage for nutrient bacteria.50
There are several structural components vital for OMPLA dimerization, substrate
binding, and activity. Monomeric and dimeric OMPLA do not exhibit structural
differences, and both contain a catalytic triad of Ser144, His142, and Asn156 at the
interface of the membrane (Figure 1.5B).40
The Ser144 and His142 have been identified
by chemical modification and site-directed mutagenesis as essential active site residues,
resembling traditional serine hydrolases, while the Asn-156 is less conserved.51-53
The
OMPLA dimer is formed via the association of the flat barrel side of each monomer,
creating the substrate binding pockets: two clefts along the hydrophobic subunit interface
that run down from the two active sites.40
Therefore, the OMPLA monomer is inactive
because of the lack of substrate binding pockets, not due to the absence of the catalytic
residues. Because of the relatively large binding pockets, a broad range of substrates can
interact with the dimer. This includes substrates of with different head groups, multiple
acyl chains, and of various acyl chain lengths.54

19
Reversible dimerization is activated primarily by the binding of the substrate to
the OMPLA catalytic residues. Upon dimerization, the two substrate acyl chain fit into
the clefts created by the monomers and serine hydrolysis of the phospholipid occurs.
Calcium contributes marginally to the dimerization process, but is essential to enzymatic
activity.42
Each monomer has two Ca2+
binding sites, one with high affinity (KD 36 μM)
and one with lower affinity (KD 358 μM).55
In monomeric OMPLA, one calcium binding
site is 10 Å away from the active site. After dimerization, a second calcium binding site,
also known as the catalytic calcium site, is formed at the dimer interface. The calcium is
ligated by Ser-152 and polarizes the two water molecules, creating the oxyanion hole
necessary for serine hydrolysis.41
In summary, there are 3 factors that contribute to the
activity of the enzyme: 1) formation of substrate binding pocket, 2) the oxyanion
stabilization provided by the catalytic calcium, and 3) physical interaction between the
active site and the substrate.36
1.4.2. PagP structure and function
The PhoPQ-activated gene protein, PagP, is an outer membrane
palmitoyltransferase that plays a role in the PhoPQ regulatory system. PagP was
discovered while studying Salmonella and the role of the PhoPQ two-component signal
transduction pathway in the virulence of pathogenic Gram-negative bacteria.56
Upon
invasion of pathogenic bacteria, the pathogen must withstand the host’s defense system:
antimicrobial peptides and macrophage phagosomes. The PhoPQ system regulates
bacterial resistance to the host’s defensive mechanism.57
During pathogenic invasion, the
host stimulates PhoQ, the sensor kinase, causing it to autophosphorylate. This
phosphorylation subsequently transphosphorylates PhoP, the response regulator. Once

20
phosphorylated, PhoP binds DNA and activates the expression of pags (PhoP activated
genes). These gene products allow the pathogenic bacteria to survive inside the host.58
Among the pags is pagP, encoding the PagP membrane enzyme.
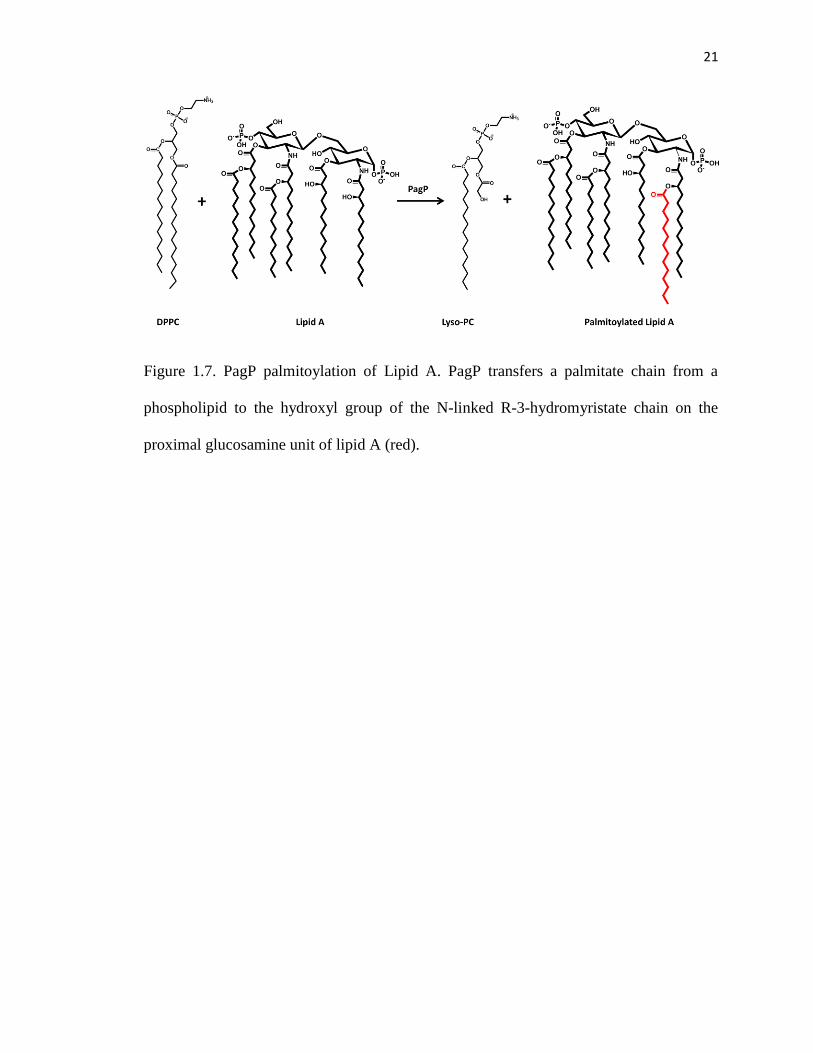
PagP participates in the PhoPQ virulence system by modifying lipid A on the
outer leaflet of the outer membrane. PagP catalyzes the transfer of a palmitate chain from
the sn-1 position of a phospholipid to the hydroxyl group of the N-linked R-3-
hydroxymyristate chain on the proximal glucosamine unit of lipid A (Figure 1.7).56
Modification of lipid A interferes with outer membrane signaling and attenuates its
ability to activate the host’s immune response.59
Therefore, the nature and efficacy of the
host immune response to bacterial infection are dependent on the structural component of
lipid A, which in turn is determined by PagP.60
PagP is expressed in several Gram-negative bacteria, including Salmonella,
Legionella, Bordetella, and Yersinia; however, this project focuses on E. coli PagP.60
The PagP structure was determined by both solution NMR and X-ray crystallography in
2002 and 2004, respectively (Figure 1.8).56,61
The monomeric protein is 19 kDa, with 141
residues forming the 8-stranded antiparallel β-barrel, preceded by a 19-residue short
amphipathic N-terminal helix on the periplasmic side of the membrane.56
The helix
anchors the protein to the membrane, and can facilitate enzymatic activity even under
external stress.59
The barrel has a distinct 25° tilt in respect to the membrane, and is
composed of shorter β-strands than typical outer membrane β-barrels. Although the
21
Figure 1.7. PagP palmitoylation of Lipid A. PagP transfers a palmitate chain from a
phospholipid to the hydroxyl group of the N-linked R-3-hydromyristate chain on the
proximal glucosamine unit of lipid A (red).

22
Figure 1.8. Structure of PagP. PagP is an 8-stranded β-barrel protein with a 25° tilt. PagP
active site residues include Ser77, His33, and Asp76 at the bilayer interface. The protein
was determined in LDAO, FC12, and OG detergents. This figure depicts an LDAO
(magenta) in the PagP binding cavity.

23
catalytic mechanism remains to be elucidated, the tilt of the barrel places the possible
catalytic residues, His33, Asp76, and Ser77, on the extracellular interface of the
membrane, around a high concentration of lipid A (Figure 1.8).56
PagP has a cavity on the inside of the barrel to interact with the phospholipid
palmitate donor and lipid A acceptor. The binding pocket is lined with hydrophobic
residues and extends approximately halfway into the barrel. The extracellular surface of
this cavity contains the three putative active site residues. This binding cavity serves as a
“hydrocarbon ruler,” and transfers, specifically, only 16-carbon palmitate chains from
phospholipids to lipid A.61
This highly precise ruler is dependent on a conserved Gly-88
at the bottom of the cavity, which, if substituted, can result in a broader specificity.62
Weakened hydrogen bonds at the two laterally positioned faces of PagP form two faces
within the protein responsible for the entry and exit of phospholipid and lipid A.63
PagP can adopt its native fold in multiple detergents, including LDAO, FC12,
DDM, OG, and Cyclofos7.61,62
The cavity can also be bound by detergents; both LDAO
and FC12 detergents have shown an inhibitory effect of PagP palmitoylation. Both
detergents have similar properties as the phospholipids and can fit into the interior of
PagP, while other detergents with larger head groups and carbon tails, such as DDM and
Cyclofos-7, do not have the same effect.61
While the PagP barrel remains rigid, the outer loops, especially loop 1 (L1), are
highly mobile (nanoseconds).64
PagP dynamics and conformations were elucidated by
studying the structure of the protein in FC12, OG, and Cyclofos7 micelles. NMR
relaxation experiments suggest that PagP exists in an exchange between two states that
differ significantly in mobility and L1 loop structure.64
The relaxed (R) state is more

24
mobile, potentially for substrate access, while the tense (T) state is rigid, possibly for
catalysis. The detergents play a role in these conformations. The R state conformers for
FC12, OG, and Cyclofos7 PagP protein-detergent complexes (PDC) are similar, but the T
states of the three have distinctly different chemical shifts, suggesting a complete
rearrangement of L1.64
These differences emphasize the necessity to study these
membrane proteins in several environments for a complete understanding of protein
structure, function, and dynamics.
1.4.3. OmpT structure and function
OmpT, the temperature-regulated outer membrane protein, is a part of the omptin
family of proteins found in Gram-negative bacteria. Most omptins are bacterial virulence
factors and function as aspartic proteases.65
Bacterial proteases can affect the immune
response by degrading the host’s antibodies and antimicrobial peptides, impairing the
fibrin clots that prevent bacterial migration through invasion of the host’s epithelial and
phagocytic cells.66
Specifically, the function of OmpT in E. coli is to cleave the
antimicrobial peptide, proteamine, which is excreted by epithelial cells of the urinary
tract.67
With this purpose, OmpT is associated with complicated urinary tract disease.68
OmpT of E. coli is the most characterized member of the omptin family. The
structure of the 297 residue enzyme was determined via X-ray crystallography in 2001
(Figure 1.9).69
The enzyme is a vase-shaped 10-stranded antiparallel β-barrel that extends
about 40 Å above the lipid bilayer with extracellular loops extending near the outer edge
of LPS.62
Extension of the barrel and active site into the extracellular space allows OmpT
to access the substrate peptides for cleavage.

25
Figure 1.9. Structure of OmpT. The OmpT β-barrel extends into the extracellular space,
into the LPS in the outer membrane. OmpT has two catalytic pairings in the extracellular
space, Asp210/His212, and Asp83/Asp85.
26
OmpT degrades antimicrobials by cleaving the bond between two basic amino
acids within peptides. The active site of OmpT lies extracellularly in a groove at the top
of the barrel with two catalytic pairings, Asp210/His212 and Asp83/Asp85 (Figure 1.9).
Based on crystal structure analysis, OmpT shares the catalytic residues of both serine and
aspartate proteases, and is formally classified as an aspartate protease.69
His212 and
Asp83 are bridged by a water molecule that acts as a nucleophile in place of the absent
catalytic serine, and attacks the peptide carbonyl of the substrate.70
Asp83 and Asp85
stabilizes the oxyanion intermediate of the peptide cleavage reaction.65
Several additional factors play a role in OmpT activity. Electrostatic interactions
impact OmpT cleavage specificity and affinity for the substrate. OmpT is highly selective
toward basic peptides due to the negative environment near the active site on the
extracellular membrane surface.69
Increased ionic strength, high pH, and acidic amino
acids near the active site can decrease OmpT-substrate affinity.69
OmpT activity is also
dependent on LPS, as LPS association may ensure OmpT is only active when inserted
into the outer membrane.69
LPS extends far beyond the surface of the OmpT active site,
which can shield other proteins from being degraded by the enzyme. Only cationic
peptides small enough to penetrate the LPS layer of the outer membrane will be targeted
by OmpT.38
1.4.4. LspA structure and function
LspA is an α-helical membrane protein that spans the inner membrane of Gram-
negative and Gram-positive bacteria.71
The E. coli lsp gene codes for a mature LspA
protein of 164 amino acids.72
The 21 kDa protein is comprised of four transmembrane
helices, containing five conserved domains (Figure 1.10).

27
Figure 1.10. LspA topology. LspA is comprised of four transmembrane helices (red) with
5 conserved regions (green, A-E). Catalytic residues (yellow) are in conserved regions C
and E while an important aspartate for protein folding (blue) is in conserved region A.

28
The first conserved region, A, is located in TMD 1 and has a sequence of dxxtk
(uppercase represents strictly conserved residues and lowercase depicts mostly conserved
amino acids). The B. subtilis Asp-14 in this region is critical for protein structure;
mutations of this residue results in misfolding and degradation of LspA by proteases
within the cell.73
Region B is located in the periplasmic loop 1, and has the motif
NxGaaf. The third conserved region, C, contains the sequence iiggaxlgNxxDr, and is
located partially within TMD3. Region D contains the triplet vvd in the periplasmic loop
2 and region E has the consensus sequence FNxAD, in or near the periplasmic space.71
These domains play vital roles in the function of the α-helical protein.
LspA is a type II signal peptidase involved in protein secretion, specifically
cleaving signal peptides from prolipoproteins as they are exported by the Sec pathway
through the bacterial inner membrane.71
Signal peptides play an indispensible role in
protein insertion. Some proteins are translated with short (5 to 30 residue) signal
peptides, or signal sequences, at the N-terminus. These peptides are responsible for
directing the newly synthesized protein to the correct cellular compartment and
facilitating co-translational or post-translational translocation through the inner
membrane. Co-translational translocation occurs during protein translation; once the
signal peptide emerges from the ribosome, it is recognized by the signal-recognition
particle (SRP) which halts further translation.74
The SRP directs the signal peptide-
ribosome-mRNA complex to the SRP receptor at the surface of the inner membrane
where the signal peptide is inserted into the translocon, the ribosome is docked onto the
cytoplasmic face of the translocon, and the protein synthesis into the periplasm or inner
membrane resumes.75
Post-translational translocation is initiated after protein synthesis is
29
completed. The signal peptide is recognized by the SecB chaperone protein which
transfers the protein to the SecA ATPase that pumps the protein through the translocon.75
Once the protein is in its targeted destination, the signal peptides have carried out their
function, and they are cleaved by signal peptidases such as LspA (Figure 1.11).71
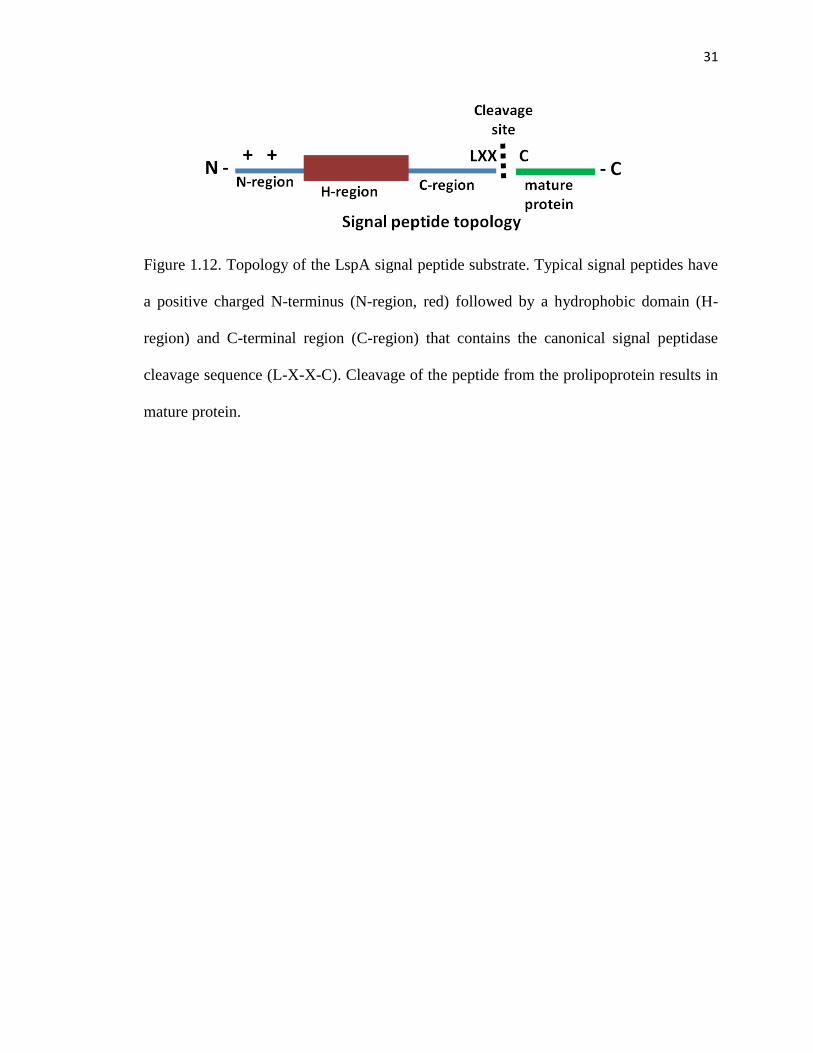
Signal peptides cleaved by LspA generally do not share sequence homology, but
they do have three conserved domains: a positively charged N-terminus (N) region, a
central hydrophobic domain (H-region), and the C-terminal domain that contains the
consensus LspA cleavage sequence, Leu-X-X-Cys (Figure 1.12).71
LspA functions as
aspartate protease to hydrolyze the linkage between signal peptides and mature protein.
Asn99 and Asp102 in the conserved region C and Asp129 in region E of B. subtilis are
critical for activity, with both aspartate residues proposed to compose the catalytic
residues at the active site.76
In vitro LspA activity has been studied with several methods. The cleavage of
radioactively labeled preproteins by LspA has been monitored with SDS-PAGE and
autoradiography as they are synthesized using an E. coli wheat germ transcription
system.77
Synthetic signal peptide cleavage via LspA has also been measured with
fluorescence and HPLC.78
LspA activity is inhibited by globomycin, a cyclic peptide
antibiotic. Globomycin acts as a substrate analog to signal peptides, binding LspA and
interfering with the processing and translocation of prolipoproteins.79
The inhibition of
LspA leads to an accumulation of prolipoprotein in the inner membrane and inhibits
bacterial growth, making globomycin an attractive drug.79

30
Figure 1.11. Simple Sec pathway diagram for protein exportation. Signal peptides (red)
target the protein translocon (blue) in the inner membrane. Upon binding to the
translocon, the proprotein is transported across the membrane. Signal peptidases (yellow)
cleave the signal peptide from the proprotein after the protein has translocated into the
periplasm.
31
Figure 1.12. Topology of the LspA signal peptide substrate. Typical signal peptides have
a positive charged N-terminus (N-region, red) followed by a hydrophobic domain (H-
region) and C-terminal region (C-region) that contains the canonical signal peptidase
cleavage sequence (L-X-X-C). Cleavage of the peptide from the prolipoprotein results in
mature protein.

32
1.5. Thesis objectives
The native lipid bilayer presents a challenge for the biophysical characterization
of membrane proteins. Conducting experiments on membrane proteins require purifying
the protein from the lipid environment, yet when removed from the amphiphilic
environment, the proteins often aggregate in aqueous buffers. To maintain the integrity of
the protein for future experiments, researchers almost always use membrane mimics to
isolate, purify, and/or reconstitute the proteins. During protein purification, the membrane
protein embeds into the membrane mimic, and the new environment can provide the
same stabilization as the bilayer. Although necessary for membrane protein research,
these mimics often perturb the stability and functional fold of the protein. Therefore,
when conducting research on a membrane protein in vitro, there is a generous amount of
time and money spent on finding a suitable membrane mimic for a stable and active
protein. The aim of this work is two-fold: 1) determine the micelle properties important
for stabilizing membrane protein activity in vitro by monitoring the function of four
membrane enzymes (OMPLA, PagP, OmpT, and LspA) folded into varying detergents,
and 2) characterize the physical structure of bicelles. This research will provide guiding
principles for membrane mimics selection for use in future membrane protein research.

33
1.6. References
1. Crick, F. 1970. Central dogma of molecular biology. Nature 227:561-563.
2. Sanger, F. and E. Thompson. 1953. The amino-acid sequence in the glycyl chain of
insulin. Biochem J 53: 353-366.
3. Sanger, F. 1952. The Arrangement of Amino Acids in Proteins. Adv Protein Chem 7:
1-67.
4. Kendrew, J, R. Dickerson, E. Strandberg, R. Hart, D. Davies, D. Phillips, and V.
Shore. 1960. Structure of myoglobin: A three-dimensional fourier synthesis at 2 Å
resolution. Nature 185: 422-427.
5. White, S. and W. Wimley. 1999. Membrane protein folding and stability: physical
principles. Annu Rev Biophys Biomol Struct 28: 319-365.
6. Wimley, W. and S. White. 1996. Experimentally determined hydrophobicity scale for
proteins at membrane interfaces. Nat Struct Mol Biol 3: 842-848.
7. Chamberlain, A., Y. Lee, S. Kim, and J. Bowie. 2004. Snorkeling preferences foster
an amino acid composition bias in transmembrane helices. J Mol Biol 339: 471 – 479.
8. Sipos, L. and G. von Heijne. 1993. Predicting the topology of eukaryotic membrane
proteins. Eur J Biochem 213: 1333-1340.
9. Garrett, L. and C. Grisham. 2008. Biochemistry. 4th ed. Belmont: Brooks Cole.
10. Ippolito, J., R. Alexander, and D. Christianson. 1990. Hydrogen bond stereochemistry
in protein structure and function. J Mol Biol 215: 457-471.
11. de Planque, M., J. Boots, D. Rijkers, R. Liskamp, D. Greathouse, and J. Killian. 2002.
The effects of hydrophobic mismatch between phosphatidylcholine bilayers and

34
transmembrane α-helical peptides depend on the nature of interfacially exposed aromatic
and charged residues. Biochem 41: 8396-8404.
12. Shank, L., J, Broughman, W. Takeguchi, G. Cook, A. Robbins, L. Hahn, G. Radke, T.
Iwamoto, B. Schultz, and J. Tomich. 2006. Redesigning channel-forming peptides.
Biophys J 90: 2138-2150.
13. Elofsson, A. and G. von Heijne. 2007. Membrane protein structure: prediction versus
reality. Annu Rev Biochem 76: 125-140.
14. Papaloukas, C., E. Granseth, H. Viklund, and A. Eloffson. 2008. Estimating the
length of transmembrane helices using Z-coordinate predictions. Protein Sci 17: 271-278.
15. Dalbey, R., P. Wang, and A. Kuhn. 2011. Assembly of Bacterial Inner Membrane
Proteins. Annu Rev Biochem 80: 161-187
16. Wimley, W. 2003. The versatile β-barrel membrane protein. Curr Opin Struct Biol
13: 404-411.
17. Almen, M., K. Nordstrom, R. Fredriksson, and H. Schioth. 2009. Mapping the human
membrane proteome: a majority of the human membrane proteins can be classified
according to function and evolutionary origin. BMC Biol 7: 1-14.
18. Yildirim, M., K. Goh, M. Cusick, A. Barabasi, and M. Vidal. 2007. Drug-target
network. Nat Biotechnol 25: 1119-1126.
19. Rask-Andersen, M., M. Almen, and H. Schioth. 2011. Trends in the exploitation of
novel drug targets. Nat Rev Drug Discov 10: 579-590.
20. Berman, H., J. Westbrook, Z. Feng, G. Gilliland, T. Bhat, I. Shindyalov, P. Bourne.
2000. The protein data bank. Nucl Acid Res 28: 235-242.

35
21. Tanford, C. 1991. The hydrophobic effect: formation of micelles and biological
membranes. Krieger Publishing Company, Malabar, FL.
22. Singer, S. and G. Nicolson. 1972. The fluid mosaic model of the structure of cell
membranes. Sci 175: 720-731.
23. Gorter, E. and F. Grendel. 1925. On biomolecular layers of lipoids on the
chromocytes of the blood. J Exp Med 41: 439-443.
24. Cooper, G. 2000. The cell: a molecular approach. Sinauer Associates: Sunderland,
MA.
25. Hong, C., P. Tieleman, and Y. Wang. 2014. Microsecond molecular dynamics
simulations of lipid mixing. Langmuir 30: 11993-12001.
26. Gennis, R. 1989. Biomembranes: molecular structure and function. Springer: New
York, NY.
27. Lindblom, G. and G. Oradd. 2009. Lipid lateral diffusion and membrane
heterogeneity. Biochim Biophys Acta 1788: 234-244.
28. Heimburg, T. 2007. Thermal biophysics of membranes. Wiley-VCH: Weinhem,
DEU.
29. Silhavy, T., D. Kahne, and S. Walker. 2010. The bacterial cell envelope. Cold Spring
Harb Perspect Biol: 1-17.
30. Nikaido, H. and M. Vaara. 1985. Molecular basis of bacterial outer membrane
permeability. Microbiol Rev 49: 1-32.
31. Caligur, V., R. Gates, G. Lipscomb, L. Masterson, M. Tyson, E. Rathbone, I. Wright,
A. Electricwala, and R. Wohlgemuth. 2016. Glycobiology analysis manual. Sigma-
Aldrich Life Science, St. Louis, MO.

36
32. Lerouge, I. and J. Vanderleyden. 2002. O-antigen structural variation: mechanisms
and possible roles in animal/plant-microbe interactions. FEMS Microbiol Rev 26: 17-47.
33. Morth, J., B. Pedersen, M. Buch-Pedersen, J. Andersen, B. Vilsen, M. Palmgren, and
P. Nissen. 2011. A structural overview of the plasma membrane Na+, K+ - ATPase and
H+-ATPase ion pumps. Nature Rev Mol Cell Biol 12: 60-70.
34. Abramson, J., S. Iwata, and H. Kaback. 2004. Lactose permease as a paradigm for
membrane transport proteins. Mol Membr Biol 21: 227-236.
35. Ji, T., M. Grossmann, and I. Ji. 1998. G-protein coupled receptors: Diversity of
receptor-ligand interactions. J. Biol Chem 273: 17299-17302.
36. Luckey, M. 2008. Membrane Structural Biology with Biochemical and Biophysical
Foundations. Cambridge University Press, New York, NY.
37. Tishkov, V. and V. Popov. 2004. Catalytic mechanism and application of formate
dehydrogenase. Biochem Mosc 69: 1252-1267.
38. Bishop, R. 2008. Structural biology membrane-intrinsic β-barrel enzymes: sentinels
of the bacterial outer membrane. Biochim Biophys Acta 1778: 1881-1896.
39. Dekker, N., K. Merck, J. Tommassen, and H. Verheij. 1995. In vitro folding of
Escherichia coli outer membrane phospholipase A. Eur J Biochem 232: 214-219.
40. Snijder, H., I. Ubarretxena-Belandia, M. Blaauw, H. Verheij, M. Egmond, N. Dekker,
and B. Dijkstra. 1999. Structural evidence for dimerization-regulated activation of an
integral membrane phospholipase. Nature 410: 717-721.
41. Dekker, N. 2000. Outer membrane phospholipase A: known structure, unknown
biological function. Mol Microbiol 35: 711-717.

37
42. Stanley, A., P. Chuawong, T. Hendrickson, and K. Fleming. 2006. Energetics of outer
membrane phospholipase A dimerization. J Mol Biol 358: 120-131.
43. Schmiel, D., E. Wagar, L. Karamanou, D. Weeks, and V. Miller. 1998. Phospholipase
A of Yersinia enterocolitica contributes to pathogenesis in a mouse model. Infect Immun
66: 3941-3951.
44. Berstad, A.E., K. Berstad, and A. Berstad. 2002. pH-activated phospholipase A2: an
important mucosal barrier breaker in peptic ulcer disease. Scand J Gastroenterol 37: 177-
189.
45. Mobley, H, G Mendz, and S Hazell. 2001. Helicobacter pylori: physiology and
genetics. ASM Press, Washington, DC.
46. Mobley, H. 1996. The role of Helicobacter pylori urease in the pathogenesis of
gastritis and peptic ulceration. Aliment Pharmacol Ther 10: 57 – 64.
47. Mobley, H, and R Hausinger. 1989. Microbial ureases: significance, regulation, and
molecular characterization. Microbiol rev 53: 85-108.
48. Van der Wal, F., G. Koningstein, C. ten Hagen, B. Oudega, and J. Luirink. 1998.
Optimization of bacteriocin release protein (BRP)-mediated protein release by
Escherichia coli: random mutagenesis of the pCloDF13-derived BRP gene to uncouple
lethality and quasi-lysis from protein release. Appl Environ Microbiol 64: 392-398.
49. Dekker, N., J. Tommassen, and H. Verheij. 1999. Bacteriocin release protein triggers
dimerization of outer membrane phospholipase A in vivo. J Bacteriol 181: 3281-3283.
50. Mader, A., B. von Bronk, B. Ewald, S. Kesel, K. Schnetz, E. Frey, and M. Opitz.
2015. Amount of colicin release in Escherichia coli is regulated by lysis gene expression
of the colicin E2 operon. PLoS One 10: 1-17.

38
51. Brok, R., I. Belandia, N. Dekker, J. Tommassen, and H. Verheij. 1996. Escherichia
coli outer membrane phospholipase A: role of two serines in enzymatic activity. Biochem
35: 7787-7793.
52. Brok, R., N. Dekker, N. Gerrits, H. Verheij, and J. Tommassen. 1995. A conserved
histidine residue of Escherichia coli outer membrane phospholipase A is important for
activity. Eur J Biochem 234: 934-938.
53. Kingma, R., M. Fragiathaki, H. Snijder, B. Dijkstra, H. Verheij, N. Dekker, and M.
Egmond. 2000. Unusual catalytic triad of Escherichia coli outer membrane
phospholipase A. Biochem 39: 10017-10022.
54. Stanley, A., A. Treubrodt, P. Chuawong, T. Hendrickson, and K. Fleming. 2007.
Lipid chain specificity by outer membrane phospholipase A. J Mol Biol 366: 461-468.
55. Ubarretxena-Belandia, I., J. Boots, and N. Dekker. 1998. Role of cofactor calcium in
the activation of outer membrane phospholipase A. Biochem 37: 16011-16018.
56. Hwang, P., W. Choy, E. Lo, L. Chen, J. Forman-Kay, C. Raetz, G. Prive, R. Bishop,
and L. Kay. 2002. Solution structure and dynamics of the outer membrane enzyme PagP
by NMR. PNAS 99: 13560-13565.
57. Groisman, E., C. Parra-Lopez, M. Salcedo, C. Lipps, and F. Heffron. 1992.
Resistance to host antimicrobial peptides is necessary for Salmonella virulence. Proc Natl
Acad Sci 89: 11939-11943.
58. Vescovi, E., F. Soncini, and E. Groisman. 1996. Mg2+ as an extracellular signal:
environmental regulation of Salmonella virulence. Cell 84: 165-174.

39
59. Huysmans, G., S. Radford, D. Brockwell, and S. Baldwin. 2007. The N-terminal helix
is a post-assembly clamp in the bacterial outer membrane protein PagP. J Mol Biol 373:
529-540.
60. Ramasubramanian, B. and R. Mahalakshmi. 2015. Residue-dependent
thermodynamic cost and barrel plasticity balances activity in the PhoPQ-activated
enzyme PagP of Salmonella typhimurium. Biochem 54: 5712-5722.
61. Ahn, V., E. Lo, C. Engel, L. Chen, P. Hwang, and L. Kay. 2004. A hydrocarbon rule
measures palmitate in the enzymatic acylation of endotoxin. EMBO J 23: 2931-2941.
62. Khan, M., J. Moktar, P. Mott, M. Vu, A. McKie, T. Pinter, F. Hof, and R. Bishop.
2010. Inscribing the perimeter of the PagP hydrocarbon ruler by site-specific chemical
alkylation. Biochem 49: 9046-9057.
63. Khan, M. and R. Bishop. 2009. Molecular mechanism for lateral lipid diffusion
between the outer membrane external leaflet and a β-barrel hydrocarbon ruler. Biochem
48: 9745-9756.
64. Hwang, P. and L. Kay. 2005. Solution structure and dynamics of integral membrane
proteins by NMR: a case study involving the enzyme PagP. Methods Enzymol 394: 335-
350.
65. Hritonenko, V. and C. Stathopoulos. 2007. Omptin proteins: an expanding family of
outer membrane proteases in Gram-negative Enterobacteriaceae. Mol Memb Biol 24:
395-406.
66. Haiko, J., M. Suomalainen, T. Ojala, K. Lahteenmaki, and T. Korhonen. 2009.
Breaking barriers – attack on innate immune defenses by omptin surface proteases of
enterobacterial pathogens. Innate Immune 15: 67-80.

40
67. Stumpe, S., R. Schmid, D. Stephens, G. Georgiou, and E. Bakker. 1998. Identification
of OmpT as the protease that hydrolyzes the antimicrobial peptide proteamine before it
enters growing cells of Escherichia coli. J Bacteriol 180: 4002-4006.
68. Webb, R. and M. Lundigran. 1996. OmpT in Escherichia coli correlates with severity
of disease in urinary tract infections. Med Microbiol Lett 5: 8-14.
69. Vandeputte-Rutten, L., R. Kramer, J. Kroon, N. Dekker, M. Egmond, and P. Gros.
2001. Crystal structure of the outer membrane protease OmpT from Escherichia coli
suggests a novel catalytic site. EMBO J 20: 5033-5039.
70. Baaden, M. and M. Sansom. 2004. OmpT: molecular dynamics simulations on an
outer membrane enzyme. Biophys J 87: 2942-2953.
71. Paetzel, M., A. Karla, N. Strynadka, and R. Dalbey. 2002. Signal peptidases. Chem
Rev 102: 4549-4579.
72. Yu, F., H. Yamada, K. Daishima, and S. Mizushima. 1984. Nucleotide sequence of
the lspA gene, the structural gene for lipoprotein signal peptidase of Escherichia coli.
FEBS Lett 173: 264-268.
73. Tjalsma, H., G. Zanen, G. Venema, S. Bron, and J. van Dijl. 1999. The potential
active site of the lipoprotein-specific (type II) signal peptidase of Bacillus subtilis. J Biol
Chem 274: 28191-28197.
74. Walter, P., I. Ibrahimi, and G. Blobel. 1981. Translocation of proteins across the
endoplasmic reticulum I. Signal recognition protein (SRP) binds to in vitro-assembled
polysomes synthesizing secretory protein. J Cell Biol 91: 545-550.

41
75. Gilmore, R., G. Blobel, and P. Walter. 1982. Protein translocation across the
endoplasmic reticulum I. Detection in the microsomal membrane of a receptor for the
signal recognition particle. J Cell Biol 95: 463-469.
76. Tjalsma, H., G. Zanen, G. Venema, S. Bron, and J. van Dijl. 1999. The potential
active site of the lipoprotein-specific (type II) signal peptidase of Bacillus subtilis. J Biol
Chem 274: 28191-28197.
77. Zwizinski, C. and W. Wickner. 1980. Purification and characterization of leader
(signal) peptidase from Escherichia coli. J Biol Chem 255: 7973-7977.
78. Zhong, W. and S. Benkovic. 1998. Development of an internally quenched
fluorescent substrate for Escherichia coli leader peptidase. Anal Biochem 155: 66-73.
79. Dev, I., R. Harvey, and P. Ray. 1984. Inhibition of prolipoprotein signal peptidase by
globomycin. J BIol Chem 260: 5891-5894.

42
Chapter 2: Membrane mimics
2.1. Detergent micelles
2.1.1. Self-association of detergent monomers
Detergents are amphiphilic surfactants. They typically consist of a nonpolar,
hydrophobic alkyl chain covalently linked to a polar, hydrophilic head group, making
their amphiphilic nature very similar to lipids. There are over 100 synthetic detergents
that are used for membrane protein research. The larger head group surface area to tail
volume ratio gives detergent monomers an overall conical shape. Although this conical
shape prevents bilayer formation, detergents self-associate to form micelles that can be
small spheres, ellipsoids, or long cylindrical rod-like structures.1
Micelle formation occurs above a defined concentration of total detergent
monomers in solution, called the critical micelle concentration (CMC).2 Below the CMC,
detergents exist as individual monomers. Above the CMC, the monomer concentration
remains unchanged while the concentration of micelles increases (Figure 2.1).1 The CMC
is different for every detergent and is dependent on the degree of hydrophobicity of the
detergent. Detergents with longer alkyl tails are more hydrophobic, and have smaller
CMCs. Conversely, less hydrophobic detergents with shorter nonpolar tails have higher
CMCs. Increasing a detergent monomer nonpolar tail by 2 methyl groups results in a
decrease in CMC by an order of magnitude.1
Micelle formation requires an attractive force between hydrocarbon tails. The van
der Waals forces between alkyl tails favor interaction and aggregation of the detergent
monomers while head group repulsions prevent giant micelle formation.1 The number of

43
Figure 2.1. The relationship between monomeric concentration and total concentration of
amphiphiles in solution. The monomeric detergent concentration increases until it reaches
the CMC. Above CMC, the addition of more detergent contributes solely to the
concentration of micelles.
44
detergent monomer within one micelle is called the aggregation number (N). Micelles
formed by amphiphiles with shorter tails, such as FC8, are small (N = 35). As carbons are
added onto the tail, there is more space to accommodate more monomers into the
aggregate, making larger micelles (FC14, N = 110).
There are distinct trends and geometric considerations for the dimensions of
detergent micelles. As earlier alluded, the CMC and N are dependent on the length of the
alkyl tail. An addition of two carbons onto the tail of a detergent will decrease the CMC
by an order of magnitude and increase N by approximately 20 monomers.1 The volume
(V) of the hydrocarbon core is determined using Tanford’s formula:1
V = 27.4 + 26.9*nc [1]
where nc is the number of alkyl chain carbons, V is in cubic Angstroms, and the constants
are derived from the densities of liquid hydrocarbons and Traube’s formula for
calculating molecular volume from each volume constant of the constituent elements of
molecular solutions. Because there is no hole in the interior of the micelle, the maximum
extension of the hydrophobic chain (Lmax) into the core can be derived using the distance
of 2.53 Å between alternate carbon atoms of a fully extended chain with the addition of
the van der Waals radius of the terminal methyl group (2.1 Å). Lmax is represented with
this formula:1
Lmax = 1.5 + 1.265*nc [2]
2.1.2. General detergent micelle categories
Detergents have a variety of head groups and carbon tails whose properties affect
the membrane protein differently. These detergents are categorized by these traits, and
will be briefly discussed in this section, followed by an in-depth discussion of the

45
properties of each of these detergent micelles. Figure 2.2. depicts the structures of these
detergents.
Phosphocholine (FC) detergents have a negatively charged phosphate and a
positively charged choline group in the polar head, resulting in a zwitterionic charge.
Phosphocholine detergent alkyl tail lengths vary between 8 and 16 carbons. FC12 (often
called DPC) is one of the most used phosphocholine detergents. The FC12 nomenclature
derives from the phosphocholine, or foscholine, head group and its 12 carbon alkyl tail.
Cyclofos detergents have a zwitterionic phosphocholine head group with a bulky
cyclohexyl hydrocarbon ring at the end of the tail. These detergents are available with 1
to 7 alkyl carbon tail lengths. Anzergents, also called zwittergents, have polar heads that
consist of a sulfate and choline group. Anzergent 310, 312, 314, 316, and 318, with the
corresponding tail lengths of 10 to 18, are produced by Anatrace.
Glucoside and maltoside detergents have a sugar head group that is covalently
bonded to the hydrophobic alkyl tail. Glucoside detergents have glucose head groups
while maltoside head groups are derived from maltose. Both types of detergents are
available with a broad range of carbon tail lengths (6 to 12 for glucosides and 6 to 16 for
maltosides). Cymal detergents also have the maltose head group, but contain a cyclic ring
at the end of its hydrocarbon tail. Cymal is available with 1 to 7 carbon tail lengths.
Steroid-like detergents include CHAPS, Big CHAPS, and CHAPSO. They all
have a tetracyclic nonpolar tail with a structure similar to the cholesterol that is present in
native membranes. With their large size, these detergents normally form micelles
composed of only a few detergent monomers.4

46
Figure 2.2. Common detergent monomer structures. Detergents are categorized based on
head group type, and have varying alkyl tail lengths (n).

47
There are other extensively used detergents that have not been utilized for the
work completed in this thesis. This includes a highly denaturing anionic detergent,
sodium dodecyl sulfate, other zwitterionic detergents, such as lauryl dimethylamine
oxide, and a variety of polyethylene detergents.5,6
Each detergent is different; therefore,
each detergent micelle has its own properties that affect the membrane protein
differently.
2.1.3. Micelle properties
Micelle properties are derived from the characteristics of individual detergent
monomers, and have a significant effect on membrane proteins. Micelle properties not
only include CMC and N, but also the shape, size, radius of gyration (Rg), shell thickness,
hydrophobic thickness, surface area, volume, and charge. Small angle X-ray scattering
(SAXS) has been used to determine multiple properties of various detergent micelles.7
Core-shell ellipsoid fitting of the SAXS data provided the core and shell volumes as well
as the core axial dimensions (a and b) and the head group shell thickness, t, of the
micelles (Figure 2.3).7 Table 2.1. depicts the specific properties of detergent micelles that
will be discussed in this section.7
2.1.3.1. Effects of head group
In detergent micelles, the polar head group forms a uniform hydrophilic shell
around the micelle hydrocarbon core. Detergents have a variety of head groups with
different structures, thicknesses, and charges that directly impacts the surface area and
shape of the micelle head group shell.
SAXS analysis of FC10, FC12, and FC14 detergents indicate that the
phosphocholine head groups shell has a thickness of approximately 3 Å.7 The Anzergent

48
Figure 2.3. Ellipsoidal model of a micelle. Micelles have a core-shell ellipsoidal model.
The ratio between minor and major axes, a and b, dictates the prolate or oblate micelle
shape. Micelle properties such as the head group shell thickness, radius of gyration,
hydrophobic thickness, and head group to head group distance are depicted.

49
Table 2.1. Properties of detergent micelles. aGlucoside aggregation numbers were derived
from literature, balkyl tail lengths were derived from Tanford’s formula [2],
cvolume was
predicted from Tanford’s formula [3].

50
head groups are assumed to have a similar size; Anzergent polar heads are composed of
similar groups to phosphocholine, a choline and a sulfate group. The glucose head group
on glucoside detergents result in a thicker head group than the phosphocholines at ~ 3.5
Å.7 As expected, the detergents with maltose head groups, such as maltosides and
Cymals, have even larger head group shells of approximately 5.8 Å.7
With their respective chemical structures, the FC, Cyclofos and Anzergent
detergent head groups are zwitterionic while the glucoside, maltoside and Cymal
detergents have nonionic heads. The charge and size of the head group impacts the
surface area and shape of the micelle. Electrostatic repulsions between the charged or
larger head groups increase the surface area of the micelles, preventing tight packing of
the detergent monomers and increasing the surface area.1 An analysis of surface packing
characteristics is described by this dimensionless packing parameter, P:8
[3]
where vc is the carbon chain volume, ao is the optimal head group area, and lc is the
critical chain length, the longest effective length that the chain can be extended in the
micelle. The packing parameter reflects the curvature of the micelle.8 With identical
carbon tails, a micelle with a charged or larger head group would have a larger ao,
decreasing P. A smaller packing parameter represents a highly curved micelle, while a
larger P reflects a less curved aggregate.8
This relationship is reflected in the detergents used in this project. Iyer and
Blankschtein and Dupuy et. al proposed models that predicted the ellipticity and shape of
nonionic micelles based on head group packing.9,10
Independent of tail length, oblate
micelles (aspect ratio a/b < 1) are predicted for small nonionic detergents, but as the head

51
group size increases or electrostatic repulsions occur, prolate micelles (aspect ratio a/b >
1) may be preferred.9 This trend was confirmed by the SAXS results on the ellipticity of
glucoside, maltoside, and the negatively charged lysophosphatidylglycerol (LPG)
micelles.7 The LPG micelles have a more spherical geometry (aspect ratio a/b ~ 1)
compared to the uncharged, oblate glucoside and maltoside micelles. Phosphocholines,
with zwitterionic head groups, also have significant electrostatic repulsions between polar
heads, forming prolate micelles.7
2.1.3.2. Effects of alkyl tail
Detergent monomers have a variety of carbon tail lengths, varying from
approximately 9 to 24 Å.1 These tails have a direct impact on micelle properties such as
the CMC, aggregation number (N), radius of gyration (Rg), head group to head group
distance (L), hydrophobic thickness, and core volume (Figure 2.3). Section 2.1.1
describes the relationships between CMC and N with the alkyl tail lengths; this section
will focus on the influence of the carbon tail on these other characteristics.
As expected, the Rg, L, and hydrophobic core thickness of a micelle increase with
the length of the alkyl carbon tail.7 Rg refers to the distance from the center of mass of an
object. FC10 micelles have an Rg of approximately 26 Å while FC12 and FC14 micelles
have Rg values of 35 and 50 Å, respectively.7 The Rg of glucosides and maltosides follow
the same trend: OG and NG Rg values are 30 and 34 Å, while the Rg of OM, DM, and
DDM micelles are 22, 26, and 32 Å, respectively.7
L represents the head group to head group distance. The L is the length from the
ellipsoidal minor axis from the center of one head group to the center of a head group
directly opposite on the micelle.1 The carbon tail linearly impacts L; every two carbons

52
added to the alkyl chain of phosphocholine, glucoside, or maltoside detergents increases
the L by 2.5 – 3.0 Å, 1.31 Å per carbon.7 This distance corresponds well to Tanford’s
formula [2].1 L values for FC micelles range from 28 to 42 Å depending on tail length,
while glucoside micelle L values differ from 24 to 32 Å and maltoside distances vary
from 28 to 40 Å.7 The hydrophobic core thickness has similar values, subtracting the
contributions from the head groups from L.
The volume also increases with carbon tail length. Using Tanford’s formula for
volume [1], the micelle volume can be predicted for varying micelles.1 FC10, FC12, and
FC14 micelles have volumes of 494, 548, and 602 Å3, respectively.
1 OG, NG, and DG
micelle volumes are estimated at 419, 446, and 472 Å3.1 The volumes of OM, DM, and
DDM micelles are predicted at 590, 644, and 698 Å3.1 The volume of these micelles will
be significantly increased for micelles composed of detergents with a hydrocarbon ring in
the carbon tail, such as Cyclofos and Cymal detergents.
2.1.4. Solubilization, folding, and stabilization of membrane proteins in micelles
Detergents are essential to the successful purification of membrane proteins.
“Solubilization” of membrane proteins in detergent refers to removing the proteins from
the native lipid bilayer and placing them in a new amphiphilic environment. When
removed from the native, amphiphilic environment, membrane proteins often aggregate
upon contact with the aqueous solvent.11
Therefore, extracting the proteins requires using
detergent to dilute and replace the native bilayer for the micellar environment.
Solubilization occurs following a sequence of events:12
1) detergent monomers penetrate
the outer monolayer of the bilayer, 2) equilibration of the detergent monomers with the
native lipids in both monolayers, 3) saturation of the bilayer with excess detergents,

53
resulting in dilution and permeabilization of the membrane, and 4) transition of the
bilayer to micelle.12
β-barrel membrane proteins are often overexpressed in vitro into inclusion bodies,
an insoluble aggregate of misfolded, membrane bound protein.13
Solubilization of the
membrane protein from inclusion bodies involves resuspending the protein in a
denaturant, such as urea or guanidine hydrochloride, and rapidly diluting the resuspended
protein in detergent.13
Rapid dilution of the resuspended protein results in a folded
membrane protein in detergent.13
Some α-helical membrane proteins do not express to
inclusion bodies. These α-helical proteins remain bound to the membrane after bacterial
cell lysis.14
Solubilizng these proteins require pelleting the membrane fraction with high
speed centrifugation and resuspending the membrane-bound protein pellet in detergent.14
Although the solubilizing detergent efficiently removes membrane proteins from
the bilayer, it may not be the suitable detergent for protein characterization. A membrane
protein in an unsuitable detergent can result in protein destabilization, aggregation,
unfolding, or misfolding. An unsuitable detergent could have a head group charge that
affects the protein active site, or a hydrophobic diameter that mismatches the protein.
These issues with protein-detergent complexes (PDCs) are discussed in section 2.3.
Because some effective membrane solubilizers do not necessarily stabilize a
specific protein’s fold, the solubilizing detergent is often exchanged for a different
detergent that conserves the functional fold of the protein. This process often occurs by
immobilizing the affinity tagged membrane protein to an appropriately tagged column,
and washing and eluting the protein in the desired detergent.14
Obtaining a PDC that
contains properly folded and active protein is often an extensive trial-and-error process

54
involving excessive time and money. There also more opportunities for PDC formation;
mixed micelles, micelles composed of two detergents, can be used for membrane protein
research, allowing for more micelles with different properties.
2.1.5. Mixed micelles
Mixing detergents with different characteristics can yield micelles with
intermediate properties, providing additional membrane mimic options for protein
characterization. Ideal detergent mixing occurs when the ratio of detergent components in
the micelle is equal to the ratio of total detergents in solution. Originally, ideal mixing
was only expected when mixing detergents with the same head group and different alkyl
chain lengths, due to the electrostatic repulsions that can occur between different head
groups.8 The first experiments completed on mixed micelles used detergents with the
same head groups: first, mixing two ionic detergents, followed by tests completed by
mixing two nonionic detergents.15,16
These experiments established a relationship
between ideal mixed micelles and the CMC that is currently used:8
Where XA and XB are the mole fractions of each detergent in the mixture, CMCA and
CMCB are the CMCs of the pure detergents, and CMCmix is the resulting CMC of the
newly formed mixed micelle.1
From these earlier experiments, newer detergent
combinations have been utilized to modulate other mixed micelle properties.17
Micelle hydrophobic thickness can be modulated using mixed micelles. There is a
dependence of L on the alkyl chain lengths of the detergents composing the mixed
micelle. As increasing amounts of a shorter tailed detergent (FC10, for example) is added
to a detergent with a longer tail (DDM), a linear decrease in L is observed as the mole

55
fraction of the FC10 increases.17
This trend occurs when forming mixed micelles
composed of detergents with varying head group and tail length.17
The relationship
between the mixed micelle tail lengths and L is linear, enabling a modulation of
hydrophobic thickness by varying the mole fractions of detergent components. Therefore,
a mixed micelle composed of 50% tetradecyl-maltoside and 50% octyl-maltoside forms a
micelle with an L consistent with undecyl-maltoside micelles.17
There are similar trends with micelle volume, size, and shape. The volume of a
micelle mixture of maltosides and phosphocholines varies linearly with the mole fraction
of each component.17
Mixing a larger volume detergent micelle (DDM) with increasing
amounts of a smaller volume detergent micelle (FC12) linearly decreases the core
volume, ultimately becoming the volume of FC12 micelles.17
Unsurprisingly, the overall
ellipsoid size dimensions change similarly when mixing smaller and larger detergents.17
Increasing amounts of prolate FC12 micelles added to oblate maltoside detergent
micelles changes the mixed micelle shape from an oblate ellipsoid to prolate.17
An
addition of anionic lysomyristoylphosphatidylglycerol (LMPG) detergent can also alter
the micelle surface charge, linearly increasing the surface potential as the mole fraction of
the charged component is increased in the mixed micelle.17
These trends with maltoside
and phosphocholine detergents mixtures are useful when trying to generate a micelle with
normally unattainable properties. Mixed micelles also allow a systematic tuning of
micelle properties to test hypotheses about micelles and protein-detergent complexes
(PDC).
2.2. Bicelles
56
Bicelles are model membranes composed of long-chain lipids and short-chain
detergents. The “ideal” bicelle in aqueous solutions is assembled with lipids forming a
planar lipid-rich bilayer and detergents coating the bilayer rim (Figure 2.4).18
These
detergents on the rim stabilize the otherwise exposed lipid hydrocarbon chains. Bicelles
may better model the biological bilayer and are a useful system for biophysical studies.
Bicelles overcome challenges often encountered with membrane proteins in
detergent micelles and liposomes. The bicelle interior is composed of a planar bilayer
region, which is closer to the native environment than the sharp ellipsoid curvature of
micelles.19
This lack of curvature was useful when studying the HIV-1 envelope peptide.
Detergent micelles were confirmed to induce significant strain on the helical peptide
structure in comparison to bicelles as observed with NMR decoupling measurements.20
In
addition, the membrane protein diacylglycerol kinase retains its activity in bicelles, in
contrast to micelles, possibly from changes in the more planar bilayer environment.21
The lipid-detergent complexes also impact protein oligomerization. Sedimentation
equilibrium analytical ultracentrifugation (AUC) and fluorescence resonance energy
transfer (FRET) experiments indicate that the stability of the membrane transporter EmrE
dimer is increased in DLPC/DHPC bicelles as opposed to DDM micelles, but the bicelle
complex has less stability than DLPC liposomes.22
Bicelles are also significantly smaller
and more stable than liposomes, enabling increased biophysical characterization
techniques, such as high resolution NMR structure determination and X-ray
crystallography.20
The first bicelles described were dimyristoylphosphatidylcholine (DMPC) lipid
and CHAPSO detergent mixtures published in 1990.23
Two years later, Sanders and

57
Figure 2.4. Ideal bicelle structure. A) Bicelles are planar bilayers of lipids (red) enclosed
and stabilized by a detergent rim (blue). The most commonly used bicelles are composed
of DMPC lipid and DHPC detergent. B) The bicelle structure depicted with mixing
between detergent and lipid components and the core-shell bicelle model used to fit the
aggregate.
58
Schwonek replaced the non-lipid CHAPSO detergent with dihexanoylphosphocholine
(DHPC) detergents, making the most commonly used DMPC/DHPC bicelle.24
Soon after,
bicelles were first applied to membrane protein research.25
This research led to several
different lipid and detergent compositions and multiple applications in membrane protein
research.
2.2.1. Bicelle composition
Bicelle properties are dependent upon the q-ratio, lipid and detergent mixture,
total amphiphile concentration (CL), and temperature. q is defined as the ratio of lipid and
detergent concentrations:
q has a great impact on the size and shape of the bicelles (Figure 2.5). Lipid rich
bicelles (q > 1) are larger structures, with a shape that is often debated.26
These bicelles
can form larger disks, perforated multi-lamellar sheets, or potentially worm-like micellar
structures, and can also undergo a liquid-crystalline phase change.26
Although lipid-rich
bicelles are more commonly utilized in membrane protein research, detergent-rich
bicelles are also an option for biophysical experiments. Small (q ≤ 0.5) bicelles are ideal
isotropic fast tumbling aggregates for obtaining high-resolution solution-state NMR
spectra as opposed to magnetically aligned high-q bicelles.27,28
The research in this thesis
will discuss detergent-rich bicelles. These bicelles have a low q-ratio, q ≤ 1, and are
smaller discoidal structures. Several methods have been used to characterize these low-q
bicelles including NMR, electron microscopy, fluorescence spectroscopy, dynamic light
scattering, and small angle neutron scattering.29,30
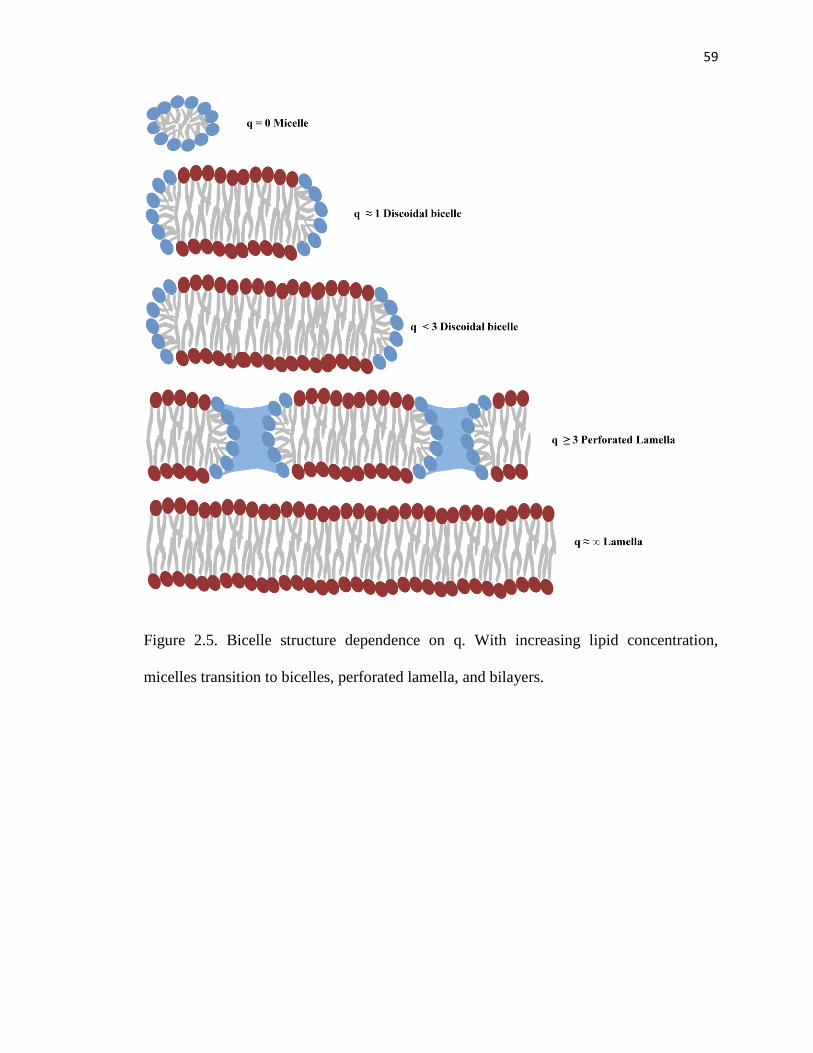
59
Figure 2.5. Bicelle structure dependence on q. With increasing lipid concentration,
micelles transition to bicelles, perforated lamella, and bilayers.

60
While the most common bicelle mixture is DMPC lipid and DHPC detergent,
other combinations have been successful in biophysical research. Lipids with negatively
charged head groups, such as dimyristoylphosphatidylglycerol (DMPG) and
dimyristoylphosphatidylserine (DMPS), have been used in bicelle mixtures with DHPC.
These acidic bicelles were less stable because the negative charged DMPG and DMPS
are less miscible with DHPC than the neutral DMPC lipid.31
Unsaturated lipids such as 1-
palmitoyl-2-oleyl-sn-3-glycerophosphocholine (POPC) destabilize the bicelles as
expected; any degree of unsaturation will result in less packing between lipids.32
Saturated lipids with longer hydrophobic tails such as dipalmitoylphosphatidylcholine
(DPPC) successfully form bicelles, but tumble slower than other bicelle compositions,
making them less useful for NMR experiments.33
The DHPC detergent is often replaced with CHAPS in bicelle compositions. The
rigidity of the CHAPS molecule with DMPC increases bicelle stability.34
Another
detergent used in place of DHPC is Cyclofos-6. Cyclofos-6 has a smaller CMC than
DHPC, and DMPC/Cyclofos-6 bicelles are stable at lower total amphiphile
concentrations. With a bulky ring in the alkyl tail, Cyclofos-6 is also less likely to
partition into the lipid domain of the bicelle, remaining in the rim of the structure and
resulting in a more native structure to use for membrane protein research.35
2.3. Difficulties with protein-mimic investigations
Membrane mimics, such as micelles and bicelles, are often used for the
biophysical characterization of membrane proteins; however, they are not the native
bilayer and pose investigative challenges. Hydrophobic mismatch, aggregation, protein
misfolding, and attenuated function are all possible consequences of an ill-fitting protein-

61
mimic complex. All of these negative consequences emphasize the importance of
understanding the structural properties of these mimics and selecting better mimics for
membrane protein experiments.
2.3.1. Challenges with protein-detergent complexes
Although detergent micelles are one of the standard tools for membrane protein
reconstitution and characterization, there are several pitfalls to using detergents for
membrane protein studies. Sometimes the organization of the hydrocarbon tails cannot
accommodate the membrane protein, resulting in a hydrophobic mismatch.36
There are
several consequences of hydrophobic mismatch which subsequently impact protein
function, including protein aggregation, backbone conformational changes, tilting, and
surface orientation.36-38
Detergents also have a major impact on membrane enzyme kinetics. For example,
enzymatic studies of a membrane rhomboid protease, GlpG, indicate that protein activity
varies depending on the detergent environment.38
GlpG has higher activity when
solubilized in phosphocholine or maltoside detergents with 10 to 12 carbon lengths.38
The
function of the protein is significantly attenuated when folded in detergents with longer
nonpolar tails.38
The substrates for membrane enzymes are often phospholipids or amphiphilic
molecules with structures that are similar to detergent monomers. This can result in two
issues when studying protein function in a PDC: detergent inhibition and substrate-
micelle partitioning. When solubilizing and folding the membrane enzymes in micelles, a
detergent can have an antagonist interaction with the enzyme. The enzyme may bind
detergent monomers due to similar qualities to its substrate, inhibiting the substrate from
62
interacting with the active site residues. An example is the LDAO detergent monomer
present in the binding cavity of PagP described in Chapter 1. PagP activity is inhibited in
LDAO and similar FC12 detergents due to antagonist inhibition.39
Substrate partitioning into the micelle can occur when the amphiphilic substrate
acts as a detergent monomer, interacting with the micelle via alkyl tail van der Waals
interactions and head group repulsions. When this interaction occurs, the substrate may
not reach the active site residues of the enzyme. Substrate partitioning into micelles can
reduce enzymatic activity and cause false-negatives when conducting functional assays in
PDCs. This concern is more pronounced when studying OMPLA, an enzyme that cleaves
phospholipids. The substrate for OMPLA activity is an amphiphilic molecule similar to a
phosphocholine detergent. Therefore, several procedures and controls must be conducted
when assaying OMPLA activity to overcome these issues.
There are many properties of detergent monomers, micelles, and mixed micelles
to note, as well as several advantages and difficulties with characterizing protein-
detergent complexes. A suitable PDC to use for accurate characterization of a membrane
protein would have a minimal denaturing affect on the protein, would not affect protein-
substrate interactions, and the detergent would contain an appropriate hydrophobic
thickness to accommodate the transmembrane domain of the protein. An ideal detergent
would also enable functional studies, with minimal substrate and enzyme active site
interactions. These traits are identified by systematically varying detergent properties and
correlating micelle characteristics with protein function. In this study, the function of four
membrane enzymes will be monitored in different micelles, and these key physical

63
detergent properties for active protein will be identified. Chapters 3 and 4 describe the
results from this study as well as future directions to test these new hypotheses.
2.3.2. Challenges with low-q bicelle structures
Although protein-bicelle complexes are used for the biophysical characterization
of membrane proteins, there are still debates on the structure of the bicelles used for these
investigations.21,26
The ideal bicelle model suggests that low-q bicelles are a disk
consisting of distinctly separated lipid bilayer domain surrounded by a detergent rim.29,40
It is widely accepted that lipid-rich bicelles are more likely to form the ideal bicelle
structure; however, due to the tendency of detergents to form mixed micelles in
detergent-rich conditions, low-q bicelles may have some degree of mixing of the lipid
and detergent components.26,41
Ideal bicelle structures have been proposed and refuted in detergent-rich systems.
Electron microscopy suggests ideal bicelle-like particles using detergent-rich
DMPC/DHPC mixtures of q ≤ 0.5.29
31
P NMR studies also suggest there is little mixing
between the DMPC and DHPC components of q = 0.05 to 0.5 bicelles.29
Contrary to
these studies, similar 31
P NMR experiments indicate that at low-q, mixed micelles are
likely to form.41
Elucidating the structure and composition of detergent-rich bicelles will
impact membrane protein research and guide membrane mimic selection. Membrane
proteins fold and function differently in ideal bicelle systems vs. mixed micelles, and this
can be exploited if using the correct mimic.
The stability and size of low-q bicelles are also dependent on the total
concentration of amphiphiles (CL) in solution and the temperature. The CL studied in
bicelles varies from below 1% to 35% (w/v).34,42
Dynamic light scattering and cryo-

64
transmission electron microscopy were used to measure the size and shape of the
DMPC/DHPC bicelle mixtures with CL of 4%, 8%, and 16% (w/v) at q = 0.5 and 1.43
In
summary, low-q (0.5), low CL bicelles (4% w/v) are smaller, 29 Å micelle-like particles
in which the DMPC and DHPC are more mixed. Bicelles with a CL of 8% and 16% are
slightly larger at 32 Å. An increase in temperature resulted in an enlargement of the low-
q 8% and 16% bicelles, but did not have any effect on the 4% bicelles. This same set of
experiments was repeated with q = 1 bicelle mixtures with similar results. The 4%
bicelles remained smaller and unchanged while the 8% CL bicelles increased in size by
23 Å and the 16% increased by 14 Å. This led to the conclusion that detergent rich, low
CL bicelles are smaller, temperature-independent particles and less stable, larger bicelles
are formed with higher CL.43
These experiments demonstrated the effect of temperature and composition on the
phase separation of bicelles. DMPC lipids are in an ordered gel phase below 23°C with
the hydrocarbon chains closely packed while at higher temperatures the hydrocarbons are
fluid and loosely packed in the liquid crystalline phase. The 8% and 16% CL samples
show temperature dependence, which indicates a bilayered structure of the DMPC within
the bicelle interior that can undergo the typical DMPC lipid phase changes at low and
high temperatures.36
The 4% CL bicelles were unaffected by temperature, suggesting that
there was a higher degree of mixing between the DMPC and DHPC, preventing the gel
phase at low temperatures.36
These observations support the notion that bicelles with low
CL are closer to mixed micelles than the “ideal” bicelle that contains the separate lipid
and detergent components. These results emphasize the importance of choosing the
appropriate lipid and detergent mixtures when designing a suitable membrane mimic.

65
Currently, there are few methods that can resolve the composition and structural
components of bicelles. Small-angle scattering can give structural information on these
low-q bicelles, and specifically, small angle neutron scattering (SANS) can resolve the
internal composition of these mimics. Molecular simulations can also generate actual
low-q bicelle structures. Chapter 5 will discuss small angle scattering and MD
simulations and the bicelle structural information learned from using these techniques.
2.4. References
1. Tanford, C. 1991. The hydrophobic effect: formation of micelles and biological
membranes. Krieger Publishing Company, Malabar, FL.
2. Jones, M. and D. Chapman. 1995. Micelles, monolayers, and biomembranes. Wiley-
Liss, Inc., New York, NY.
3. Cohn, E. and J. Edsall. 1943. Proteins, amino acids, and peptides. Reinhold: New
York, New York.
4. Le Maire, M., P. Champeil, and J. Moller. 2000. Interaction of membrane proteins and
lipids with solubilizing detergents. Biochim Biophys Acta 1508: 86-111.
5. Imamura, T. 2006. Encyclopedia of surface and colloid science. Taylor and Francis:
New York, NY.
6. Tschesche, H. 2012. Methods in protein biochemistry. Walter de Gruyter, Berlin,
Germany.
7. Oliver, R., J. Lipfert, D. Fox, R. Lo, S. Doniach, and L. Columbus. 2013. Dependence
of micelle size and shape on detergent alkyl chain length and head group. PLoS ONE 8:
e62488.

66
8. Isrealachvili, J. 1998. Intermolecular and surface forces. 2nd ed. Harcourt Brace and
Company: New York, NY.
9. Iyer, J. and D. Blankschtein. 2012. Are ellipsoids feasible micelle shapes? An answer
based on a molecular-thermodynamic model of nonionic surfactant micelles. J Phys
Chem B 116: 6443-6454.
10. Dupuy, C., X. Auvray, C. Petipas, R. Anthore, F. Costes, et al. 1996. Small angle X-
ray and neutron scattering study of the micellization of (N-alkylamino)-1-deoxylactitols
in water. Langmuir 12: 3162-3172.
11. Luckey, M. 2008. Membrane protein structural biology with biochemical and
biophysical foundations. Cambridge University Press, New York, NY.
12. Lichtenberg, D., H. Ahyayauch, F. Goni. 2013. The mechanism of detergent
solubilization of lipid bilayers. Biophys J 105: 289-299.
13. Scopes, R. 2001. Strategies for protein purification. Curr Protoc Protein Sci Unit 1.2.
14. Lin, S. and G. Guidotti. 2009. Chapter 35 purification of membrane proteins.
Methods Enzymol 463: 619-629.
15. Clint, J. 1975. Micellization of mixed nonionic surface agents. J Chem Soc Faraday
Trans 71: 1327-1334.
16. Shinoda, K., T. Nakagawa, B. Tamamushi, T. Isemura. 1963. Colloidal surfactants:
some physicochemical properties. Academic Press, New York, NY.
17. Oliver, R., J. Lipfert, D. Fox, R. Lo, J. Kim, S. Doniach, L. Columbus. 2014. Tuning
micelle dimensions and properties with binary surfactant mixtures. Langmiur 30: 13353-
13361.

67
18. Macdonald, R., Q. Saleem, A. Lai, and H. Morales. 2013. NMR methods for
measuring lateral diffusion in membranes. Chem Phys Lipids 166: 31-44.
19. Durr, U., R. Soong, and A. Ramamoorthy. 2013. When detergent meets bilayer: birth
and coming of age of lipid bicelles. Prog Nucl Magn Reson Spectrosc 69: 1-22.
20. Chou, J., J. Kaufman, S. Stahl, P. Wingfield, and A. Bax. 2002. Micelle-induced
curvature in a water-insoluble HIV-1 env peptide revealed by NMR decoupling
measurement in stretched polyacrylamide gel. J Am Chem Soc Comm 124: 2450-2451.
21. Sanders, C., and G. Landis. 1995. Reconstitution of membrane proteins into lipid-rich
bilayered mixed micelles for NMR studies. Biochem 34: 4030-4040.
22. Dutta, S., E. Morrison, and K. Henzler-Wildman. 2014. EmrE dimerization depends
on membrane environment. Biochim Biophys Acta 1838: 1817-1822.
23. Sanders, C. and J. Prestegard. 1990. Magnetically orientable phospholipid bilayers
containing small amounts of a bile salt, CHAPSO. Biophys J 58: 447-460.
24. Sanders, C. and R. Schwonek. Characterization of magnetically orientable bilayers in
mixtures of dihexanoylphosphocholine and dimyristoylphosphocholine by solid-state
NMR. Biochem 31: 8898-8905.
25. Sanders, C., B. Hare, K. Howard, J. Prestegard. 1994. Magnetically oriented
phospholipid micelles as a tool for the study of membrane associated molecules. Prog
Nucl Magn Reson Spectrosc 26:421-444.
26. Gaemers, S. and A. Bax. 2001. Morphology of three lyotropic liquid crystalline
biological NMR media studied by translational diffusion anisotropy. J Am Chem Soc
123: 12343-12352.
68
27. Vold, R., R. Prosser, and A. Deese. 1997. Isotropic solutions of phospholipid bicelles:
a new membrane mimetic for high-resolution NMR studies of polypeptides. J Biomol
NMR 9: 329-335.
28. Kamienska, K., C. Jameson, and W. Schilf. 2013. Nuclear magnetic resonance. Royal
Society of Chemistry, London, United Kingdom.
29. Glover, K., J. Whiles, G. Wu, N. Yu, R. Deems, J. Struppe, R. Stark, E. Komives, and
R. Vold. 2001. Structural evaluation of phospholipid bicelles for solution-state studies of
membrane associated biomolecules. Biophys J 81: 2163-2171.
30. Luchette, P., T. Vetman, R. Prosser, R. Hancock, M. Nieh, C. Glinka, S. Krueger, and
J. Katsaras. 2001. Morphology of fast-tumbling bicelles: a small angle neutron scattering
and NMR study. Biochim Biophys Acta 1513: 83-94.
31. Struppe, J., J. Whiles, and A. Vold. 2000. Acidic phospholipid bicelles: a versatile
model membrane system. Biophys J 78: 281-289.
32. Cho, H., J. Dominick, and M. Spence. 2010. Lipid domains in bicelles containing
unsaturated lipids and cholesterol. J Phys Chem B 114: 9238-9245.
33. Lind, J., J. Nordin, and L. Maler. 2008. Lipid dynamics in fast-tumbling bicelles with
varying lipid bilayer thickness: effect of model transmembrane peptides. Biochim
Biophys Acta 1778: 2526-2534.
34. McKibbin, C., N. Farmer, P. Edwards, C. Villa, and P. Booth. 2009. Urea unfolding
of opsin in phospholipid bilayers. Photochem Photobiol 85: 494-500.
35. Lu, Z., W. Van Horn, J. Chen, S. Mathew, R. Zent, and C. Sanders. 2012. Bicelles at
low concentrations. Mol Pharm 9: 752-761.

69
36. Kerman, A. and V. Ananthanarayanan. 2007. Conformation of a double-membrane-
spanning fragment of a G protein-coupled receptor: effects of hydrophobic environment
and pH. Biochim Biophys Acta 1768: 1199-1210.
37. Killian, J. 1998. Hydrophobic mismatch between proteins and lipids in membranes.
Biochim Biophys Acta 1376: 401-416.
38. Foo, A., B. Harvey, J. Metz, N. Goto. 2015. Influence of hydrophobic mismatch on
the catalytic activity of Escherichia coli GlpG rhomboid protease. Protein Sci 24: 464-
473.
39. Ahn, V., E. Lo, C. Engel, L. Chen, P. Hwang, and L. Kay. 2004. A hydrocarbon ruler
measures palmitate in the enzymatic acylation of endotoxin. EMBO J 23: 2931-2941.
40. Prosser, R., J. Hwang, and R. Vold. 1998. Magnetically aligned phospholipid bilayers
with positive ordering: a new model membrane system. Biophys J 74: 2405-2418.
41. Triba, M., D. Warschawski, and P. Devaux. 2005. Reinvestigation by phosphorus
NMR of lipid distribution in bicelles. Biophys J 88: 1887-1901.
42. Katsaras, J. and T. Gutberlet. 2013. Lipid bilayers: structure and interactions.
Springer Science and Business Media, Berlin, Germany.
43. Ye, W., L. Jesper, J. Eriksson, and L. Maler. 2014. Characterization of the
morphology of fast-tumbling bicelles with varying composition. Langmuir 30: 5488-
5496.

70
Chapter 3: The influence of detergents on the function of β-barrel enzymes
The bilayer mimic selected for membrane protein characterization effect the fold
and function of the protein. Typically, initial detergent selection is based on the overall
project goal. For this study, the size of the protein’s transmembrane domain (TMD) as
well as the detergent head group charge and size are often considered. Choosing a
detergent with short alkyl tails may result in micelles that are smaller than the TMD, and
likewise, selecting a detergent with longer alkyl tails may yield micelles that engulf the
entire protein. Prevention of the protein aggregation that results from this hydrophobic
mismatch is an initial aim for membrane protein researchers. Also, the head group charge
and size will be regarded, especially if the active site residues of the protein are
positioned in the head group region. These considerations are a starting point for
membrane protein investigations; however, detergent selection continues to be an
arduous trial-and-error process. The research in this chapter focuses on monitoring the
influence of different detergents on the activity of membrane proteins. This systematic
variation of detergents will emphasize key detergent properties that are essential in
maintaining active membrane proteins. This chapter will focus on the function of outer
membrane phospholipase A (OMPLA) in varying detergents, along with preliminary data
from other membrane proteins.
3.1. Protein-detergent complex formation with OMPLA
As discussed in Chapter 2, successfully obtaining a protein-detergent complex
(PDC) to characterize is a multi-step process. OMPLA was recombinantly expressed into
insoluble, inactive, and unfolded protein aggregates called inclusion bodies. These
inclusion bodies were isolated by lysing the cells with a high pressure homogenizer and
71
removing the cell debris via centrifugation. The inclusion bodies were washed several
times with buffer to remove contaminants. The unfolded aggregate was resuspended in a
denaturing buffer containing urea to prepare the protein for refolding.
Refolding the protein is required to obtain potentially functional and folded
protein for biophysical characterization. The conditions for refolding are protein specific,
and require detergent to prevent aggregation. The OMPLA refolding procedures were
adapted from Burgess et. al. and optimized by varying the refolding detergent and
incubation temperatures.1 OMPLA was confirmed to refold best in pH 10 borate and
decyl maltoside (DM) detergent buffer at 50°C overnight (Figure 3.1).
Successful refolding does not confirm that the protein is functional. Often, the
refolding detergent is not the optimal detergent to maintain protein stability for long-term
characterization. Thus, the detergent is exchanged for another, typically, via
chromatography. OMPLA detergent exchange occurs by adding the refolded protein to an
ion exchange column with DEAE resin. The protein is immobilized in the resin and is
washed with buffer containing excess amounts of the new detergent, exchanging the
detergents via dilution. OMPLA is eluted in the new PDC with high potassium chloride
concentration and dialyzed to remove the high salt concentration (Figure 3.2). Generally,
the next step is to study the protein with several different biophysical techniques.
However, to study the influence of detergents on the activity of OMPLA, this process of
recombinant expression, inclusion body isolation, refolding, and detergent exchange is
repeated several times, exchanging the DM-refolded OMPLA into over 20 detergents
(Figure 3.3).

72
Figure 3.1. OMPLA refolding optimization in several detergents. SDS-PAGE was used to
confirm OMPLA refolding in several detergents. Several lanes from samples of other
proteins were removed from the gel to focus on the refolded OMPLA samples. The
molecular weight marker is labeled M. Unfolded, boiled OMPLA was used for sample
comparison. OMPLA was refolded overnight in pH 10 borate buffer at 50°C in dodecyl
maltoside (DDM), decyl maltoside (DM), tetradecylphosphocholine (FC14), Anzergent
314 (314), Cyclofos-7, and dodecylphosphocholine (FC12) (not pictured) detergents.
Folded OMPLA runs at a smaller molecular weight than unfolded OMPLA (31 kDa).
DM successfully refolded OMPLA.

73
Figure 3.2. OMPLA purification and detergent exchange fractions. Refolded OMPLA
was immobilized on an ion exchange column for detergent exchange into FC12 micelles.
Fractions from the detergent exchange were analyzed with SDS-PAGE. The lanes of the
gel correspond to unfolded, boiled OMPLA, flowthrough (FT), wash (W), elution (E),
concentrated eluted protein (C), and resin (R). Folded FC12 OMPLA PDCs are
confirmed in lanes 4 and 5.

74
Figure 3.3. OMPLA purified in several detergents. SDS-PAGE was used to confirm the
successful purification of OMPLA in 19 detergents (FC16 not pictured). Folded OMPLA
runs slightly smaller than its molecular weight of 31 kDa. Anzergent 310, OG, and
Cyclofos OMPLA have lower protein concentrations than the other OMPLA PDCs. With
each detergent exchange conducted with the same amount of refolded OMPLA, the lower
protein concentrations after purification may indicate that OMPLA forms less stable
complexes in these detergents.

75
OMPLA exchanged into 310, OG, and Cyclofos 5 detergents were less
concentrated than the other PDCs. Each detergent exchange was conducted with the same
amount of refolded OMPLA; therefore, the lower protein concentrations after purification
for these three PDCs may indicate that OMPLA forms less stable complexes in these
detergents. After confirming OMPLA folding with SDS-PAGE, there are several other
considerations that must be addressed before monitoring OMPLA activity: 1)
confirmation of complete detergent exchange, 2) determination of the detergent and
micelle concentration, and 3) identifying the oligomeric state of the OMPLA.
3.2. Pre-assay biophysical characterization of OMPLA
3.2.1. Detergent exchange verification and concentration determination with NMR
Monitoring detergent exchange and the micelle-to-protein ratio after membrane
protein purification ensures consistent sample preparation and activity assay design. An
effective technique to use for these two tasks is nuclear magnetic resonance (NMR)
spectroscopy. 1-D 1H NMR is often used as a first step in chemical structure
determination.
NMR spectra of a detergent in a PDC before and after detergent exchange are
very different depending on the detergents involved, and comparing the two can confirm
the success of a detergent exchange. For example, NMR spectra for glucoside detergents
have broad chemical shift peaks group between 3 and 4 ppm indicative of the hydroxyl
protons on the head group. A spectrum of the phosphocholine detergents has a sharp peak
at 3.2 ppm, corresponding to the hydrogens on the choline of the head group (Figure 3.4).
The considerable differences between the two PDC spectra allow detergent exchange

76
Figure 3.4. 1-D 1H NMR spectra of OMPLA before and after detergent exchange.
OMPLA in OG detergent (black) was exchanged with FC12 detergent (red). Proton NMR
confirms successful detergent exchange. Peaks between 3 to 4 ppm indicative of the OG
head group (dots) are no longer present after the detergent exchange. A sharp peak at 3.2
ppm is newly present (star), indicative of the hydrogens on the phosphocholine head
group. The integral of a peak at 1.2 ppm (not shown) corresponding to methylene group
on the detergent carbon tails is used for detergent concentration determination.
77
confirmation using NMR. 1H NMR investigations of OMPLA in several steps of the
purification and detergent exchange was conducted, and these spectra confirm an
efficient and complete detergent exchange protocol.
The micelle-to-protein ratio is important when completing membrane protein
activity assays. As described in Chapter 2, the detergent can significantly impact protein
function and substrate performance. Maintaining a low (10:1 to 1:1) micelle-to-protein
ratio can minimize the amount of free micelle able to impact activity assays. Also,
knowing the micelle, and therefore, detergent, concentration, is important when designing
activity assays with proper negative controls. 1-D 1H NMR spectra enable the
determination of detergent concentration. A chemical shift at 1.2 ppm is representative of
the methylene tail of the detergent. Detergent concentrations are measured by comparing
the methylene peak of the PDC with standard samples of known detergent
concentrations. The micelle concentration is calculated from the detergent concentration
with the following formula:
3.2.2. Determination of the OMPLA oligomerization state
An effective technique for the determination of a protein’s oligomeric state is size
exclusion chromatography coupled to multi angle light scattering (SECMALS). Typical
column chromatography of membrane proteins is challenged by the hydrophobic nature
of these proteins. Membrane proteins tend to interact with the mobile and stationary
phases differently than soluble proteins, eluting at retention times that do not reflect the
actual molecular weight of the protein. With SECMALS, the molecular weight of the
protein is not dependent upon retention time, but light scattering, enabling a more

78
accurate molecular mass measurement for membrane proteins. In addition, MALS detects
the detergent micelles, which can allow the determination of the size of the protein-
detergent complexes.2
The SEC component of this technique is solely responsible for fractionating the
solution into distinct peaks that can be analyzed with the detectors. Three detectors
measure the protein absorbance at 280 nm (UV), the refractive index (RI), and the light
scattering (LS). The UV and RI detectors provide information about the concentration of
the protein while the LS detector measures the light scattering and provides a weight-
average molar mass of the species. LS is proportional to the molecular mass (MW) and
the protein concentration with the following equation:2
where Iθ/I0 is the ratio of the intensities of the light scattered at angle θ and the incident
light.2 ΔLS is the difference in light scattered from the protein complex and the
surrounding buffer.2 K is a constant derived from the refractive index of buffer without
protein (n), the wavelength of light used (λ0), the angle between the incident and scattered
light (θ), the distance between the scattering molecule and detector (r), and Avogadro’s
number:2
C is the protein concentration. dn/dc is the specific refractive index of the protein, which
is typically 0.187 ml/g for soluble proteins, but is unknown for membrane proteins in a
PDC complex.2 The dn/dc for membrane proteins can be determined with the following
formula,

79
enabling an accurate calculation of the PDC molecular weight.2 Unfortunately, the
amount of detergent bound to the protein (δ) is unknown, and without knowing dn/dc of
the protein, the ΔLS, and subsequently, the molecular mass of the PDC is unsolvable.2
These difficulties in determining the PDC molecular weight is another example of the
challenges with characterizing membrane proteins. To determine the dn/dc of a
membrane protein, the refractive index of the protein must be measured at 690 nm
wavelength at different protein concentrations in experimental buffer conditions.3
The OMPLA oligomerization state is of interest because the protein forms
reversible dimers when active. Confirmation of the OMPLA homodimer in different
detergents will give implications on the protein’s activity. Currently, SECMALS has
been completed with OMPLA in 7 detergents: Anzergent 312, Anzergent 314, FC12,
FC14, FC16, DM, and DDM (Table 3.1). The expected 62 kDa OMPLA dimer is
confirmed in Anzergent 312, FC12, and FC16 while molecular weight values for
Anzergent 314, DM, and DDM OMPLA are slightly larger and FC14 OMPLA is slightly
smaller. The small increase in the molecular weights of the dimer is likely due to
aggregation. The SECMALS light scattering detector is highly sensitive (1 μg/mL BSA),
and minimal aggregate can have a major effect on the overall molecular weight of the
protein. The smaller molecular weight for FC14 OMPLA could be a result of a less stable
PDC that was partially dissociated by the SEC. Figure 3.5 depicts a SECMALS
chromatogram with DDM OMPLA. Although the peak is narrow and well-defined, the
aggregate had a minor effect on the molecular weight measured.

80
Table 3.1. Molecular weights and aggregation numbers from SECMALS of OMPLA
PDCs. SECMALS was conducted on 7 OMPLA PDCs. The OMPLA dimer (62 kDa) is
confirmed in all of the samples, with DM and DDM PDCs eluting slightly larger and
FC14 PDCs measuring slightly smaller. Large 200 kDa aggregates eluted with the 314,
FC14, and FC16 samples. One FC16 sample eluted an OMPLA monomer peak (Figure
3.5). SECMALS also confirmed micelles with the expected size and aggregation number
in the PDCs without the aggregates. The 312, 314, and FC14 PDCs were analyzed twice,
while the other samples were examined in triplicate. These samples will be repeated for
error determination and completed for all PDCs.

81
Figure 3.5. SECMALS chromatograms with DDM and FC16 OMPLA. SECMALS
conducted on DDM OMPLA eluted well defined peaks for the OMPLA dimer and
detergent micelle. Minimal aggregate was observed. The FC16 OMPLA SECMALS
depict a large aggregate along with the OMPLA dimer and a monomer peak. A micelle
peak is not observed.
82
The FC14, FC16, and Anzergent 314 OMPLA samples have large amounts of an
approximately 200 kDa aggregate that elutes earlier in the SECMALS (Figure 3.5). These
larger aggregates are potentially an effect of solubilizing OMPLA in larger micelles.
FC14, FC16, and Anzergent 314 have the longest carbon tails of the detergents
characterized, and thus, they form the largest micelles sampled. These large micelles
have the capacity to accommodate more protein and may promote aggregation.
The FC16 OMPLA SECMALS experiments were conducted in triplicate; three
separately purified OMPLA PDCs were analyzed with this method. Of the three
experiments, one FC16 OMPLA sample had aggregate, dimer, and monomer present
(Figure 3.5). This was the only PDC to contain OMPLA monomer present, and this may
impact protein activity.
The SECMALS experiments confirm that the OMPLA PDCs are forming dimers
without substrate or calcium present. OMPLA dimerization without these effector
molecules has not been well-characterized in the literature. Cross-linking and equilibrium
analytical ultracentrifugation experiments demonstrate that OMPLA is monomeric until
the addition of substrate or calcium in dodecyl-N,N-dimethyl-1-ammonio-3-
propanesulfonate (12-SB) detergent.4,5
Only minor evidence has depicted OMPLA
dimerization without the presence of calcium or substrate; glutaraldehyde cross-linking
experiments conducted by Kingma et. al. depict 40% OMPLA dimer, and 60% monomer
in the presence of EDTA in FC16 detergent.6 The SECMALS confirmation of OMPLA
dimers in the PDCs could be a result of detergents interacting with the OMPLA active
site, triggering dimerization. This is reasonable because the detergents have similar
characteristics to the phospholipid OMPLA substrate (Figure 2.2).

83
The empty detergent micelle size and aggregation number was also determined
with SECMALS. Contrary to the UV detector at 280 nm, the light scattering instrument
can monitor the detergent micelles during elution. Eluting just after the protein, the
detergent micelle peaks for Anzergent 312, FC12, and DDM were at the molecular
weights expected, 19, 26, and 53 kDa, respectively. The DM micelles had a molecular
weight of approximately 55 kDa, slightly larger than the 43 kDa predicted. With the
expected molecular weights, the aggregation numbers of these micelles were also at the
projected values. The PDCs that formed large aggregates, FC14, FC16, and Anzergent
314, did not elute peaks for the detergent micelles. This is likely due to the detergents
associating with the aggregates, minimizing the amount of empty micelles present for late
elution. With OMPLA PDCs confirmed with two techniques, the activity of this enzyme
was assayed in different micelle environments.
3.3 OMPLA activity assay design
The OMPLA activity assay monitors the calcium-dependent hydrolysis of the
OMPLA substrate, 2-hexadecanoylthio-1-ethylphosphorylcholine (HEPC) (Figure 3.6).7
After hydrolysis of HEPC via OMPLA cleavage, the free sulfur anion on HEPC interacts
with another buffer component, 5,5’-dithio-bis-[2-nitrobenzoic acid] (Ellman’s reagent).
Ellman’s reagent targets the conjugate base, cleaving itself to form a disulfide bond with
the substrate.6 This bond formation yields a stable mixed disulfide and a colored species,
2-nitro-5-thiobenzoic acid (TNB2-
). The increase in color change from TNB reflects
OMPLA hydrolysis activity and is measured spectrophotometrically.7
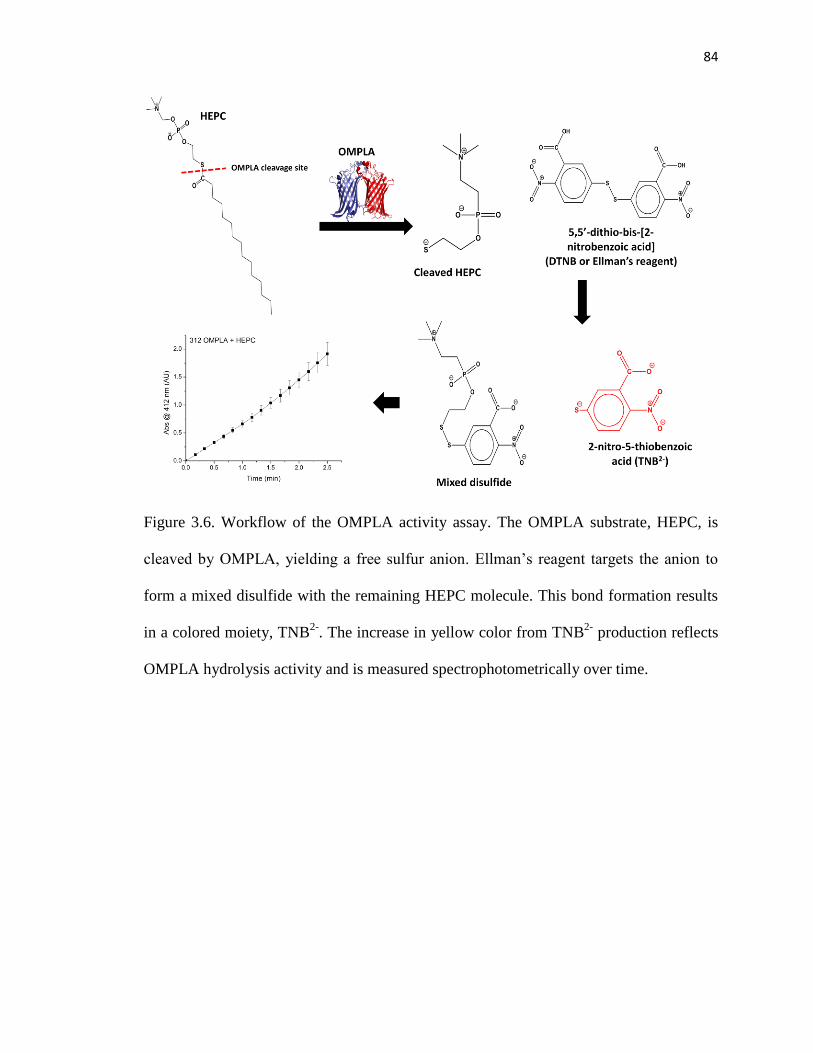
84
Figure 3.6. Workflow of the OMPLA activity assay. The OMPLA substrate, HEPC, is
cleaved by OMPLA, yielding a free sulfur anion. Ellman’s reagent targets the anion to
form a mixed disulfide with the remaining HEPC molecule. This bond formation results
in a colored moiety, TNB2-
. The increase in yellow color from TNB2-
production reflects
OMPLA hydrolysis activity and is measured spectrophotometrically over time.

85
A major consideration for this assay is the HEPC substrate. This substrate is a
phosphatidylcholine analog with a phosphocholine head group and 16-carbon tail. This
molecule is similar to those used in the OMPLA PDCs, especially the phosphocholine
detergents. With those similarities, the HEPC could likely partition into empty detergent
micelles without OMPLA, not interacting with OMPLA dimer active site. Maintaining a
low micelle-to-protein ratio minimizes the chances of this occurring; however, this is
more challenging with detergents that have high CMCs. Substrate-micelle interactions is
a problem often encountered with membrane protein research and functional assays, and
is circumvented with proper controls (reaction mixture + detergent at the appropriate
concentration without OMPLA + substrate) and assay design.
The assay color change is measured at 412 nm every 10 seconds for 2.5 minutes,
and absorbance vs. time is plotted (Figure 3.6). The initial rate of the reaction was
determined using the slope of the line between 0 and 1.5 minutes. The rate of product
formation is determined using these initial rates and the molar extinction coefficient of
the TNB2-
product. By plotting the reaction rate vs. substrate concentration, the curves
were fit using the Michalis-Menten equation:
where ν is the reaction rate, Vmax is the maximum rate of reaction, [S] is the substrate
concentration, and KM is the substrate specificity (Figure 3.7). The Michaelis constant,
KM, is the substrate concentration at which the reaction is at half-maximum, and is an
inverse measurement of the substrate’s affinity for the enzyme. Vmax = kcat[E]0, where

86
Figure 3.7. Example of Michaelis-Menten for OMPLA. OMPLA function was assayed in
OG at different substrate concentrations. The initial reaction rates vs. substrate
concentration were graphed and fit Michaelis-Menten kinetics curves. The maximum
reaction rate (Vmax) and substrate specificity (KM) were determined from these plots;
these values were used to determine the substrate turnover rate (kcat) and enzyme
efficiency (kcat/KM).

87
[E]0 is the initial enzyme concentration. kcat is the substrate turnover rate, the maximum
number of substrate molecules converted to product per enzyme molecule per second.
The catalytic efficiency, kcat/KM, is a measurement of enzyme efficiency and how well
the enzyme converts substrate into a product.
There are a few assumptions made for Michaelis-Menten kinetics.8 First, the
enzyme-substrate (ES) complex is a steady state intermediate—that is, the concentration
of ES remains relatively constant because the complex is being broken down and
produced at the same rate.8 Second, there is no product at the start of the reaction and the
product cannot be converted to substrate.8 Third, the [S] represents the free substrate
concentration, but is assumed to be close to the total substrate concentration.8 This is
valid as long as [E] << [S]. Fourth, the binding and unbinding of substrate to enzyme is
much faster than the release of product.8 The Michaelis-Menten kinetic parameters, KM,
Vmax, kcat, and kcat/KM, were reported for OMPLA activity in different PDCs.
The substrate turnover rate, kcat, is derived from the initial enzyme concentration
and the maximum reaction rate (Vmax). OMPLA kcat values represent the speed in which
OMPLA hydrolyzes HEPC when the system is saturated with enzyme. Trends identified
for OMPLA substrate turnover rates reflect the protein’s overall catalytic function. The
Michaelis constant, KM, is a measurement of the affinity of the substrate for the enzyme.
OMPLA KM values represent how well the substrate binds to the enzyme. Trends with
OMPLA substrate affinity indicates how well the substrate interacts with the protein in
certain detergent conditions and also highlights any possible competitive inhibition from
detergents interacting with the OMPLA binding site. kcat and KM affect one another, and
when used together, the kcat/KM reflects both the OMPLA binding and catalytic events;

88
however, when distinguishing trends with OMPLA activity in detergents, it is more
practical to analyze the values separately.
3.4 Structural considerations for OMPLA activity
OMPLA activity in different PDCs will vary depending on how the detergent
micelle impacts the structure of the protein and its active site. For a complete
commentary on OMPLA function in varying environments, structural features important
in protein function should be highlighted and monitored. Perturbations to these
components can impact both substrate turnover rate and specificity. Examination of the
OMPLA atomic resolution structure elucidates two important structural components for
protein function.
First, OMPLA has an approximate 29 Å tall hydrophobic barrel with the active
site residues located 4 Å from the top of the barrel (Figure 3.8). Typically buried within
the hydrophobic domain of the lipid bilayer, maintaining this hydrophobic environment
around the hydrophobic barrel may be essential to protein activity. Second, the OMPLA
active site residues extend out 4.8 Å from the barrel, potentially interacting with lipid
head groups at the bilayer interface (Figure 3.8). For optimum activity, the placement of
the barrel and active site residues in these micelle mimics must be considered. OMPLA
will likely have more activity in micelles with hydrophobic cores that can encompass the
29Å long barrel length. Increased protein activity may also be observed with OMPLA in
PDCs with thicker head groups that can accommodate the 4.8 Å extension of the active
site residues from the barrel.
3.5. OMPLA activity in varying detergents

89
Figure 3.8. Structural considerations for OMPLA activity. The length of the OMPLA
barrel is ~29 Å with the active site located 4 Å from the extracellular surface. The
extracellular loops of OMPLA extend ~10 Å from the top of the β-barrel. The active site
residues extend from the barrel as far as 4.8 Å. Micelles used for solubilization of
OMPLA should accommodate this bicelle length and active site location and orientation.

90
OMPLA functional assays conducted in different PDCs confirm that OMPLA is
active in 19 different detergent micelles. The detergents studied were the phosphocholine
detergents (FC10, FC12, FC14, and FC16), the Anzergents (310, 312, and 314), the
Cyclofos detergents (CF3, CF5, and CF7), glucosides (7G, OG, and NG), maltosides
(NM, DM, and DDM), and the Cymal detergents (C5, C6, and C7). The numbered
nomenclature is indicative of the carbon tail length – FC12 detergents have a
phosphocholine head and 12-carbon tail, while decyl maltoside (DM) detergents have a
maltoside head and 10-carbon tail. Figure 2.2 has structures for all of these detergents.
All of the OMPLA PDCs had similar activity (kcat), substrate affinity (KM), and
enzymatic efficiency (kcat/KM) (Figures 3.9 and 3.10 and Table 3.2). This confirms that
OMPLA is a highly stable, robust enzyme with the ability to dimerize, properly form the
catalytic active site, bind substrate, and perform calcium-dependent hydrolysis of HEPC
in varying detergent environments. A negative control containing Ellman’s reagent,
HEPC, and the appropriate detergent was subtracted from each triplicate reaction to
remove any contributions from HEPC and detergent without OMPLA.
According to the SECMALS data, the FC14, FC16, and 314 OMPLA PDCs have
some aggregated protein as well as the OMPLA dimer. This aggregation can potentially
impact the measured kcat and KM values. The function of these three PDCs could be
reduced due to this aggregated protein or overestimated. With a portion of the protein
aggregated, the actual concentration of OMPLA dimer, the effective enzyme
concentration, is lowered. This lower [E]0 will reduce the actual kcat. The protein
aggregation complication can be resolved by collecting only the OMPLA dimer fraction
during SECMALS and using that for protein activity assays. Due to this aggregation, the

91
Figure 3.9. Substrate turnover rates (kcat) of OMPLA PDCs. The determined kcat values
from the OMPLA kinetic assays are displayed graphically. All of these assays were
performed in triplicate, and corrected with a negative control (reaction buffer + CaCl2 +
HEPC + detergent, without OMPLA). The results are separated by head group (top).
PDCs with aggregation are denoted with black asterisks. Trends were made with the non-
aggregated PDCs, and are highlighted with the teal lines. Cyclofos5 OMPLA activity (red
asterisk) must be repeated for confirmation of kinetic parameters. Error bars represent
standard deviation (n = 3).

92
Figure 3.10. Substrate specificities (KM) of OMPLA PDCs. The determined KM values
from the OMPLA kinetic assays are displayed graphically. All of these assays were
performed in triplicate, and corrected with a negative control (reaction buffer + CaCl2 +
HEPC + detergent, without OMPLA). The results are separated by head group (top) and
head group type (bottom). Trends are highlighted with the teal line. PDCs with
aggregation are denoted with an asterisk. Error bars represent standard deviation (n = 3).
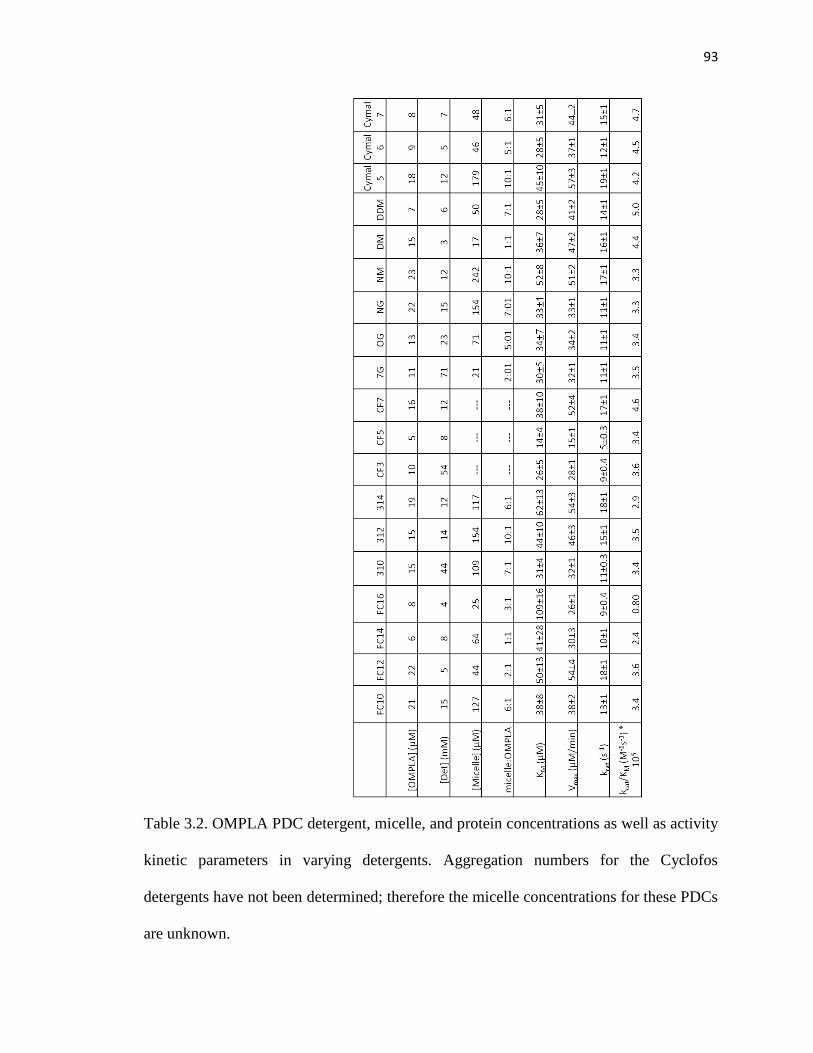
93
Table 3.2. OMPLA PDC detergent, micelle, and protein concentrations as well as activity
kinetic parameters in varying detergents. Aggregation numbers for the Cyclofos
detergents have not been determined; therefore the micelle concentrations for these PDCs
are unknown.

94
trends identified with OMPLA kcat and KM omit contributions from the FC14, FC16, and
314 PDCs.
3.5.1. Effects of detergent micelles on OMPLA substrate turnover rates (kcat)
Although OMPLA has similar activity in all of the detergents, modest trends can
be identified with the detergent head groups. Removing the contributions from the
aggregated samples, the average substrate turnover rate for OMPLA activity was
approximately 13 s-1
. There are eight PDCs with activity above average: FC12, 312,
Cyclofos7, NM, DDM, and Cymal 6. For better understanding of how OMPLA is more
active in these PDCs, the micelle hydrophobic thicknesses and head group thicknesses
are correlated with the dimensions of the OMPLA barrel and the orientation of the
enzymatic active site (Figure 3.11).
The OMPLA PDCs with above average kcat are composed of micelles with larger
hydrophobic and shell thicknesses. The hydrophobic thicknesses of the PDCs with higher
kcat range from 26 to 34 Å with an average of 31 Å and the head group thicknesses
average 4.75 Å. This is compared to the PDCs with lower kcat values that have
hydrophobic thicknesses that range from 21 to 30 Å with an average of 26 Å and head
group thicknesses that average 3.6 Å. This larger micelle core and shell may better
accommodate the 29 Å OMPLA barrel; proteins embedded in smaller micelles may
undergo conformational dynamics that can perturb the enzymatic active site.
OMPLA substrate turnover changes with carbon tail length. For the Cymal and
maltoside detergents, an increased tail length decreases kcat. Cymal 5 and NM provide the
optimum environment necessary for OMPLA function, with the catalytic residues near
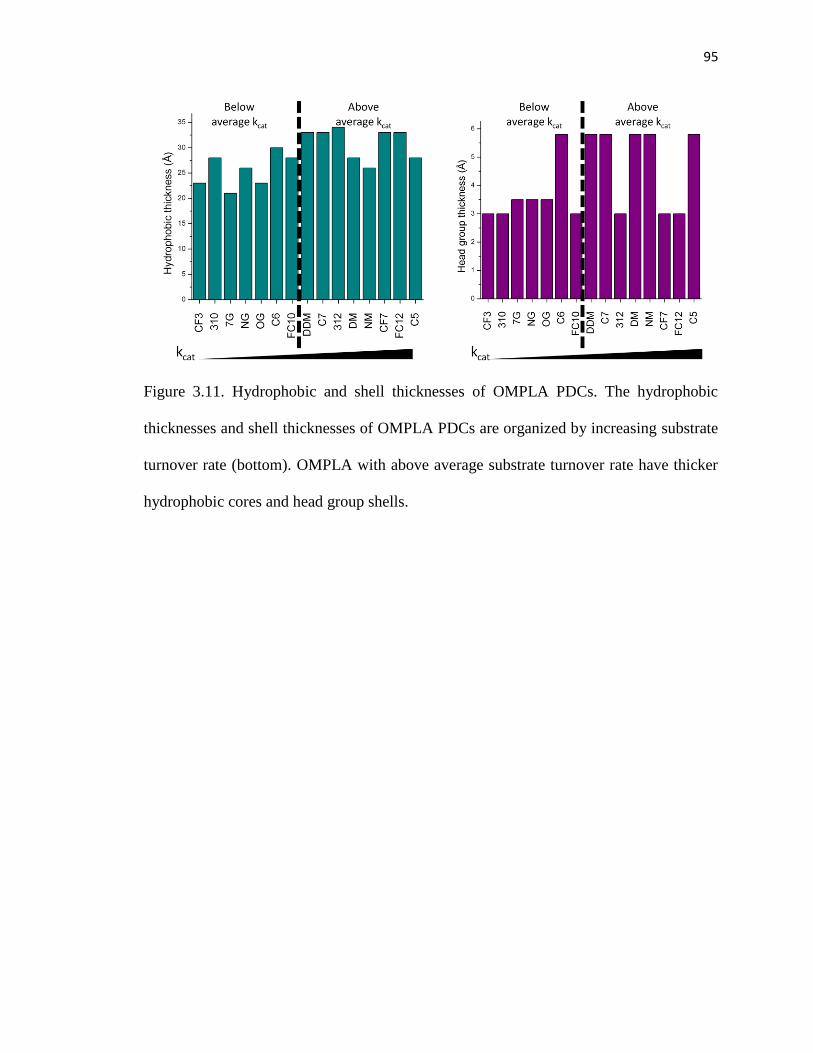
95
Figure 3.11. Hydrophobic and shell thicknesses of OMPLA PDCs. The hydrophobic
thicknesses and shell thicknesses of OMPLA PDCs are organized by increasing substrate
turnover rate (bottom). OMPLA with above average substrate turnover rate have thicker
hydrophobic cores and head group shells.

96
the head group interface of the micelle. An increase in the carbon tails results in a
burying of the active site residues, decreasing catalytic turnover (Figure 3.12A).
The opposite trend is observed with the phosphocholine, Anzergent, and Cyclofos
detergents. Removing the contributions from the aggregated samples and the Cyclofos5
OMPLA outlier, an increase in substrate turnover is observed with detergent tail length.
For these PDCs, the micelles have hydrophobic cores smaller than what may be required
to accommodate the OMPLA barrel and active site, leading to exposed active site
residues and attenuating substrate turnover. (Figure 3.12B).
The substrate turnover rate for the three glucoside detergents are within error of
one another. This is attributed to the three micelles having similar structure. With the
same glucose head group and a minor increase of 5 Å for 7G to NG micelles, the
environment for OMPLA stability and activity remains very similar, resulting in
comparable kcat values for all three PDCs.
3.5.2. Effects of detergent micelles on OMPLA substrate affinity (KM)
OMPLA has similar substrate affinity (KM) in all of the detergent micelles.
Analysis of OMPLA activity in respect to head group highlights modest trends between
the detergent and substrate binding. Removing the contributions of the aggregated
samples, the average KM for the OMPLA PDCs is approximately 35 μM. Four of the
seven OMPLA complexes with below average substrate affinity (FC10, FC12, 312, and
Cyclofos7) are composed of zwitterionic detergents. These zwitterionic detergents have

97
Figure 3.12. Effects of increased detergent carbon tail lengths on the OMPLA active site.
Trends were identified with OMPLA substrate turnover and carbon tail length. (A) For
the OMPLA with an above average kcat, the Cymals and maltoside detergents, the
enzymatic active site was located at the optimum location for Cymal5 and NM PDCs. An
increase in carbon tail length results in a burial of the active site, attenuating the substrate
turnover rate. (B) For OMPLA with below average kcat, such as the phosphocholine,
Anzergent, and Cyclofos detergents, these smaller micelles were enlarged with an
increase in detergent carbon tail length, providing a better environment for the OMPLA
active site and raising the kcat.
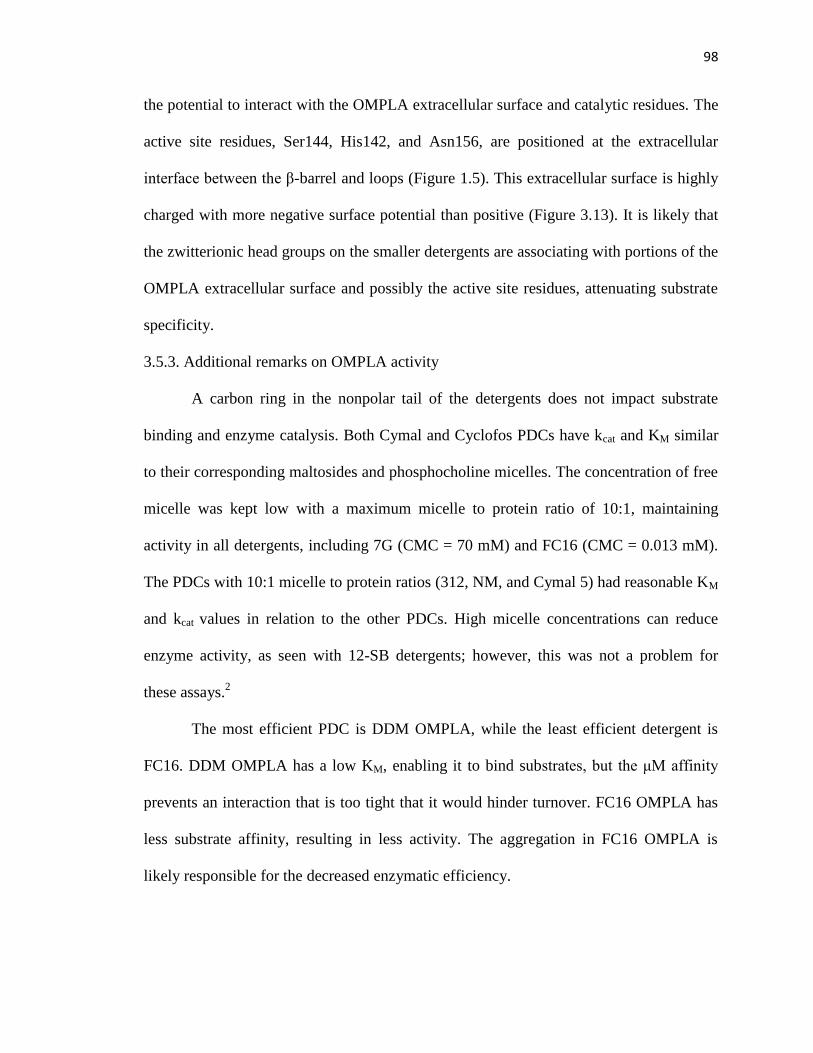
98
the potential to interact with the OMPLA extracellular surface and catalytic residues. The
active site residues, Ser144, His142, and Asn156, are positioned at the extracellular
interface between the β-barrel and loops (Figure 1.5). This extracellular surface is highly
charged with more negative surface potential than positive (Figure 3.13). It is likely that
the zwitterionic head groups on the smaller detergents are associating with portions of the
OMPLA extracellular surface and possibly the active site residues, attenuating substrate
specificity.
3.5.3. Additional remarks on OMPLA activity
A carbon ring in the nonpolar tail of the detergents does not impact substrate
binding and enzyme catalysis. Both Cymal and Cyclofos PDCs have kcat and KM similar
to their corresponding maltosides and phosphocholine micelles. The concentration of free
micelle was kept low with a maximum micelle to protein ratio of 10:1, maintaining
activity in all detergents, including 7G (CMC = 70 mM) and FC16 (CMC = 0.013 mM).
The PDCs with 10:1 micelle to protein ratios (312, NM, and Cymal 5) had reasonable KM
and kcat values in relation to the other PDCs. High micelle concentrations can reduce
enzyme activity, as seen with 12-SB detergents; however, this was not a problem for
these assays.2
The most efficient PDC is DDM OMPLA, while the least efficient detergent is
FC16. DDM OMPLA has a low KM, enabling it to bind substrates, but the μM affinity
prevents an interaction that is too tight that it would hinder turnover. FC16 OMPLA has
less substrate affinity, resulting in less activity. The aggregation in FC16 OMPLA is
likely responsible for the decreased enzymatic efficiency.

99
Figure 3.13. Surface representation of the OMPLA dimer and active site. The OMPLA
catalytic residues as well as the extracellular surface have positive (blue) and negative
(red) potentials that can interact with charged detergent head groups, impacting substrate
specificity.

100
3.6. Future directions
To further explore and test the hypotheses on OMPLA activity, mixed micelles
can be utilized. Mixed micelles enable a measurement of OMPLA activity in micelles
with intermediate properties of both detergents. With mixed micelles, specific
contributions to protein activity can be elucidated, including distinguishing head group or
hydrophobic thickness effects on function. Mixing NM and DDM detergent will tune the
hydrophobic thickness of the micelles, and the protein’s activity as a function of
increased size will provide conclusions on how the core thickness modifies protein
activity. Similar studies can be pursued with head group thickness and surface charge.
SECMALS of OMPLA in mixed micelles can be conducted to not only confirm
that mixed micelles are being formed, but to also monitor trends with protein aggregation
in the larger micelles. 314/310 or FC16/FC12 PDCs can be used to identify the
dependence of OMPLA aggregation on micelle size. Also, SECMALS dimer fractions
without aggregation can be assayed to confirm the determined kcat and KM values.
All of these experiments with mixed micelles will help identify which physical
properties of detergent micelles impact OMPLA activity. In addition to exploring the
influence of detergents on OMPLA function, similar pursuits are currently being
conducted with other membrane proteins. Results from these multiple studies can be
compiled to give a complete picture on how well detergents mimic the bilayer.
3.6.1. PagP purification and activity in detergent micelles
The activity of the PhoPQ-activated gene protein (PagP) 8-stranded β-barrel
membrane enzyme is also being characterized in varying detergent micelles. PagP
expression, refolding, and purification procedures are similar to OMPLA protocols. PagP

101
inclusion bodies were resuspended similarly to OMPLA, but rapid dilution and refolding
occurs in FC12 micelles instead of DM. Refolded PagP is added to a DEAE column for
detergent exchange. PagP has been successfully purified in 15 detergents (Figure 3.14).
PagP functions in the transfer of a palmitate group from a phospholipid to the
hydroxyl group of the N-linked R-3-hydroxymyristate chain on the proximal glucosamine
unit of lipid A (Ref. Chapter 1). The PagP activity assay is designed to mimic the first
step in PagP activity, the cleavage of the palmitate group from the phospholipid. Instead
of a phospholipid, the chromophore p-nitrophenyl phosphate (pNPP) is used as the
substrate (Figure 3.15). Addition of PagP to pNPP in buffer results in the hydrolysis of
the substrate, yielding yellow p-nitrophenol. The absorbance of p-nitrophenol at 405 nm
is measured over time to obtain initial rates of reaction. Preliminary PagP activity assays
indicate that PagP is active in Cyclofos7 PDCs (Figure 3.16). Cyclofos7 detergent was
initially used for PagP assays because the cyclic ring in the tail prevents the detergent
from fitting into and interacting with the PagP binding cavity like other detergents.10
PagP function will continue to be assayed, identifying trends between PagP activity and
micelle properties.
3.6.2. OmpT purification and activity assay design
The β-barrel membrane enzyme OmpT will also be assayed in different detergent
micelles. Functional information on all three β-barrel enzymes will be used to correlate
physical properties of detergents with active membrane proteins. OmpT is expressed and
purified with similar methods as OMPLA and PagP. OmpT is refolded overnight in
FC12, and also applied to a DEAE column for detergent exchange. OmpT has been

102
Figure 3.14. PagP purified in several detergents. SDS-PAGE was used to confirm the
successful purification of PagP in 15 detergents. Folded PagP runs at a molecular weight
of 19 kDa.
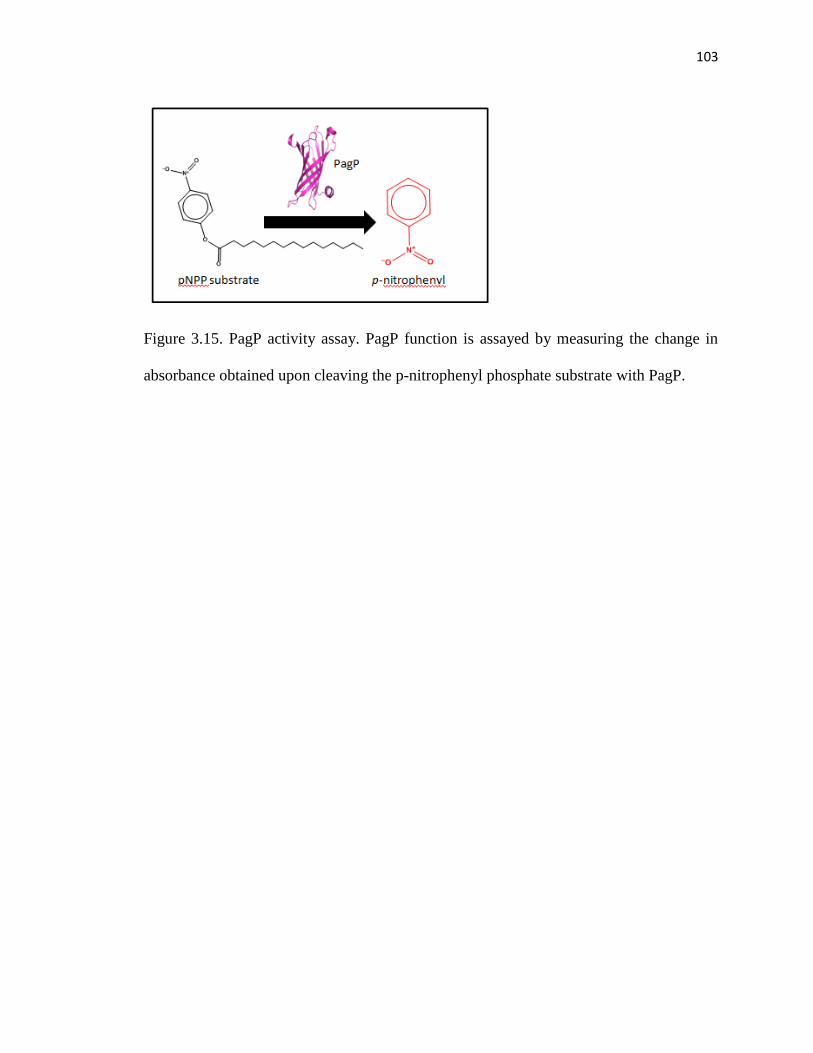
103
Figure 3.15. PagP activity assay. PagP function is assayed by measuring the change in
absorbance obtained upon cleaving the p-nitrophenyl phosphate substrate with PagP.
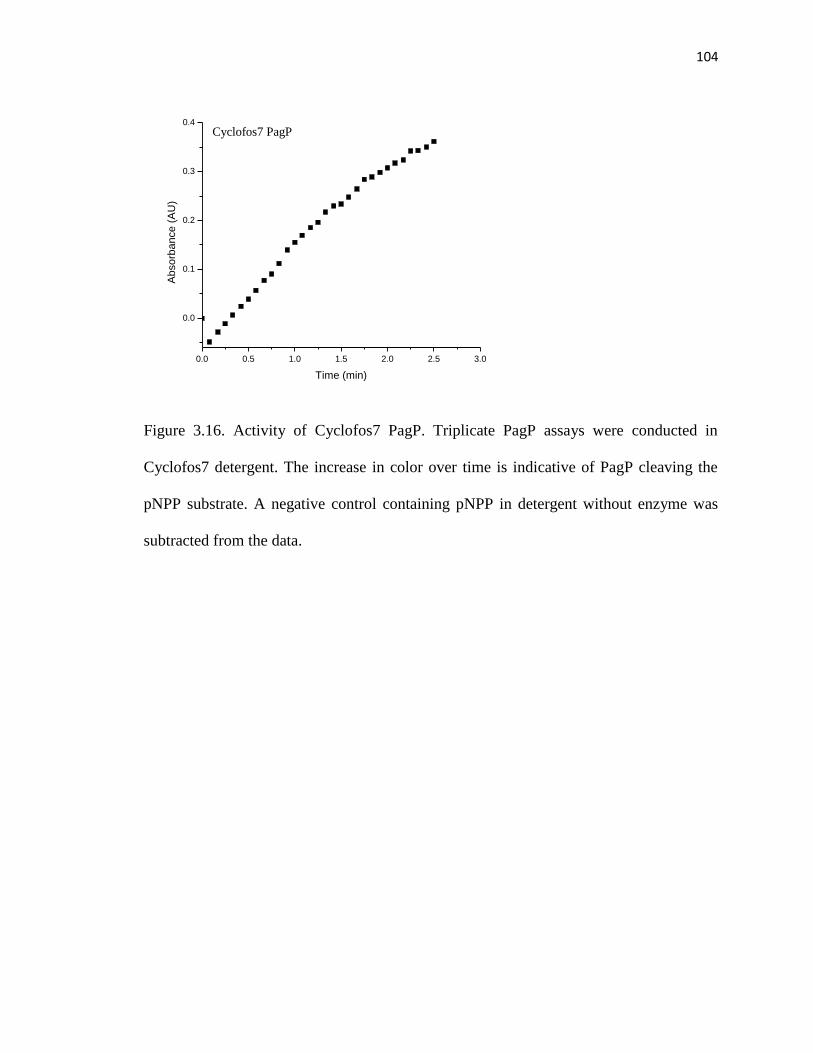
104
0.0 0.5 1.0 1.5 2.0 2.5 3.0
0.0
0.1
0.2
0.3
0.4
Cyclofos7 PagP
Ab
so
rba
nce
(A
U)
Time (min)
Figure 3.16. Activity of Cyclofos7 PagP. Triplicate PagP assays were conducted in
Cyclofos7 detergent. The increase in color over time is indicative of PagP cleaving the
pNPP substrate. A negative control containing pNPP in detergent without enzyme was
subtracted from the data.
105
successfully purified into 16 detergents, but purification optimization is ongoing (Figure
3.17).
The OmpT activity assay is designed to monitor the cleavage of a custom peptide
(Figure 3.18). OmpT cleaves antimicrobial peptides preferentially between two basic
residues. The substrate for OmpT cleavage contains the basic amino acid sequence
required for OmpT hydrolysis (Arg-Arg-Glu) along with an indole-3-acetic acid (IAA)
cap at the N-terminus and the chromophore p-nitroaniline (pNA) at the C-terminus. The
assay is coupled with a second enzyme, aminopeptidase M, an exopeptidase. Upon
cleavage of the custom peptide with OmpT, the free amine group is exposed and
subsequently cleaved by aminopeptidase M. This second hydrolysis releases the pNA
chromophore, yielding a yellow color change that is monitored spectrophotometrically.
3.7. Conclusions
The OMPLA functional studies in varying detergent micelles are a first step
toward elucidating the relationship between detergent characteristics and protein activity.
OMPLA remained active in all 19 detergent micelles, with modest trends in substrate
turnover rate and specificity. The enzyme is more active in detergents with larger,
nonionic head groups such as the glucosides, maltosides, and Cymal detergents. These
nonionic polar heads are less repulsive and form less perturbing interactions with the
charged extracellular surface of OMPLA. An increase in the carbon tail length of the
phosphocholine, maltoside, and glucoside PDCs attenuates substrate turnover, potentially
due to hydrophobic mismatch destabilizing the OMPLA catalytic residues near the
micelle head group – tail interface. Smaller micelles such as 7G, OG, and NG provide
active site accessibility and less electrostatic repulsions at the interface, resulting in PDCs
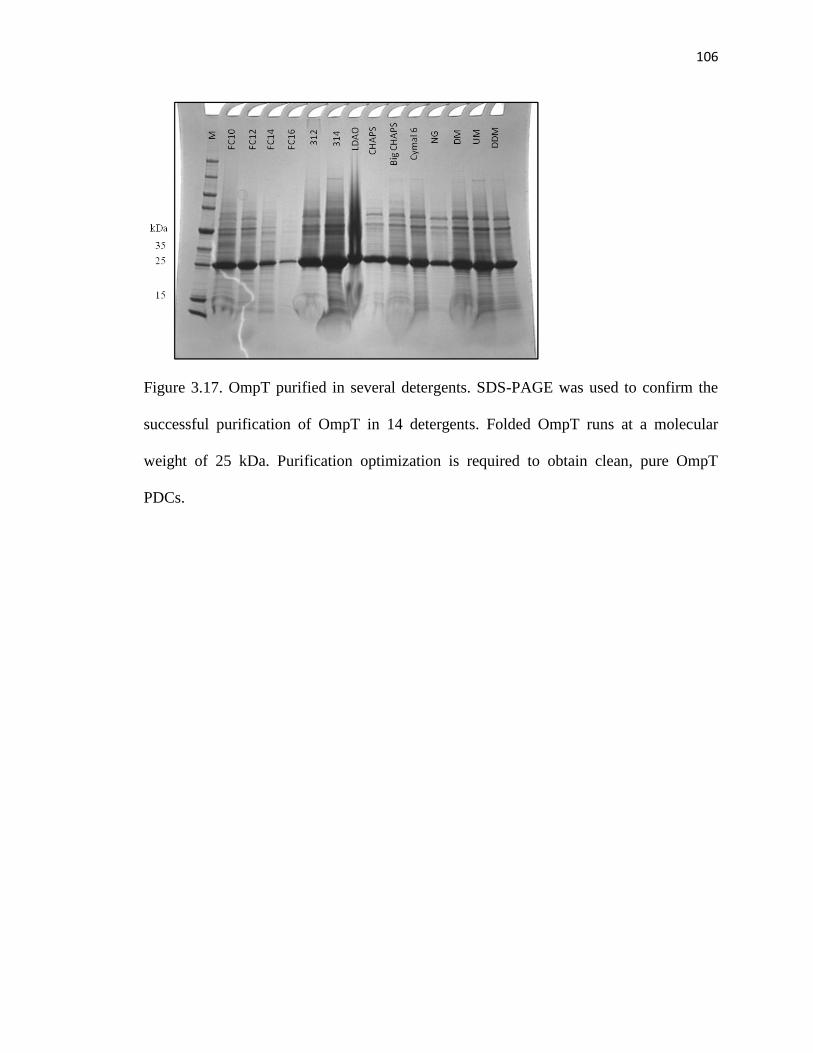
106
Figure 3.17. OmpT purified in several detergents. SDS-PAGE was used to confirm the
successful purification of OmpT in 14 detergents. Folded OmpT runs at a molecular
weight of 25 kDa. Purification optimization is required to obtain clean, pure OmpT
PDCs.

107
Figure 3.18. OmpT activity assay. The custom substrate for the OmpT assay will be
hydrolyzed by OmpT between the two basic arginine residues. Aminopeptidase M targets
the resulting free amine, cleaving the remaining arginine from the p-nitroaniline
chromophore. The released p-nitroaniline is the colored species that occurs as a result of
OmpT cleavage. Spectrophotometric measurements of the assay will yield OmpT
reaction rates.
108
with almost identical kcat and KM. The OMPLA PDCs all bind HEPC at μM affinity, but
protein aggregation may attenuate substrate specificity for the enzyme, as seen with
FC14, FC16, and 314 KM values.
This systematic characterization of activity in respect to detergent micelle
properties is ongoing. PagP and OmpT function in bilayer mimics will be compiled with
OMPLA activity, forming a complete commentary on optimal β-barrel membrane
protein-detergent complexes.
3.7. Materials and Methods
3.7.1. Expression and purification of β-barrel enzymes
OMPLA, PagP, and OmpT genes in pET11a vectors were generously provided by
the Karen Fleming laboratory (Johns Hopkins University, Baltimore, MD). All three
proteins have similar expression and purification procedures. For expression, the
plasmids were transformed into a BL21(DE3) Escherichia coli strain. Cell cultures were
grown to an OD600 ~ 0.7 at 37°C in Luria-Bertani media supplemented with ampicillin
(100 μg/mL). Protein expression to inclusion bodies was induced for 4 hours at the same
temperature with 1 mM isopropyl-β-thio-D-galactoside (IPTG). Cells from 1-L culture
were harvested by centrifugation (6000g, 15 min, 10°C), resuspended with 30 mL lysis
buffer (50 mM tris, pH 8, 40 mM EDTA, 2.5 g lysozyme), and lysed using a
microfluidizer (Microfluidics model 110L, Newton, MA).
The insoluble fraction was pelleted (6000 rpm, 30 min, 4°C), washed with wash
buffer (10 mM tris, pH 8, 2 mM EDTA), and then pelleted again. The proteins were
solubilized from inclusion bodies in 5 mL resuspension buffer (10 mM borate, pH 10, 2
mM EDTA, 8 M urea, 2 mg/mL final protein concentration). 500 μL of the resuspended

109
protein was rapidly diluted into 12.5 mL refolding buffer (10 mM borate, pH 10, 2 mM
EDTA, 1 M urea) with detergent (4.5 mM FC12 for OmpT and PagP, 5.4 mM DM for
OMPLA) and refolded overnight at 50°C with shaking.
The refolded protein was applied to a DEAE resin (Sigma, St. Louis, MO.)
equilibrated with Buffer A (20 mM tris, pH 8.3, 2 mM EDTA) for OMPLA and OmpT
purifications and Buffer B (10 mM Tris, pH 8) for PagP. Detergent exchange was
conducted by washing the column with 50 mL of Buffer A or B with the appropriate
detergent above CMC. The protein was eluted with 15 mL of elution buffer (Buffer A
with 1 M KCl or Buffer B with 1 M NaCl) in the new detergent above CMC. The eluate
was concentrated (MWCO = 10 kDa) to 2 mL volume. Concentration was determined by
measuring the absorbance at 280 nm. The predicted molar extinction coefficients for
OMPLA, PagP, and OmpT are 82280, 82390, and 78270 M-1
cm-1
, respectively. Proteins
were stored at room temperature. Detergent concentrations were measured by 1-D 1H
NMR spectroscopy by comparison of the integrated methyl peak with samples of known
detergent concentrations. To adjust the micelle concentration, the protein was dialyzed in
4 L equilibration buffer for an appropriate time to remove excess detergent.
3.7.2. SECMALS
A Waters 1525 binary pump HPLC and 2489 UV/visible detector was coupled to
a Wyatt technology miniDAWN TREOS light scattering detector and Optilab T-rEX
refractometer for SECMALS. Size exclusion chromatography was performed on a
Superdex 200 Increase 10/300 GL column (GE Healthcare, Uppsala, Sweden)
equilibrated with SECMALS buffer (20 mM tris, pH 8.3, 2 mM EDTA, 150 mM NaCl).
To normalize the Astra V SECMALS software, 1 mg BSA (Sigma, St. Louis, MO.) was
110
separated with SECMALS. Following normalization, 12 to 73 mg OMPLA was separated
for 1 hour in SECMALS buffer (0.45 mL/min flow rate). The light scattering and
refractometer collected data over time to use for molecular weight determination.
3.7.3. OMPLA activity assay
The OMPLA activity assay mixture was a 100 μL volume of 50 mM tris, pH 8.3,
20 mM CaCl2, 0.8 mM DTNB, and 0.05 μM OMPLA. For Michaelis-Menten kinetics,
triplicate assays were conducted with 1, 0.5, 0.3, 0.1, 0.05, 0.03, 0.02, 0.01, 0.005, 0.003,
0.001, 0.0005, 0.0003 mM HEPC substrate concentrations. The absorbance at 412 nm
was measured for 2.5 minutes in 10 second intervals. A negative control containing the
reaction buffer components with the appropriate detergent sans OMPLA was subtracted
from each reaction. Absorbance vs. time was plotted for each assay. The slope of this
data over the first 1.5 minutes was translated into initial reaction rates (ν) using the
extinction coefficient of the TNB2-
product, 13600 M-1
cm-1
. Initial reaction rate vs. [S]
were plotted to determine Michaelis-Menten kinetic parameters.
3.7.4. PagP activity assay
The PagP functional assay was conducted with 45 μM Cyclofos7 PagP in 100 μL
water. A final concentration of 225 μM pNPP substrate was added to the reaction, and the
absorbance over 2.5 minutes was measured spectrophotometrically at 405 nm. The
negative control containing the appropriate concentration of Cyclofos7 detergent in water
with substrate was subtracted from the triplicate PagP assays.
3.8. References
111
1. Burgess, N., T. Dao, A. Stanley, and K. Fleming. 2008. β-barrel proteins that reside in
the Escherichia coli outer membrane in vivo demonstrate varied folding behavior in vitro.
J Biol Chem 283: 26748-26758.
2. Slotboom, D., R. Duurkens, K. Olieman, and G. Erkens. 2008. Static light scattering to
characterize membrane proteins in detergent solution. Methods 46: 73-82.
3. Zhao, H., P. Brown, and P. Schuck. 2011. On the distribution of protein refractive
index increments. Biophys J 100: 2309-2317.
4. Stanley, A., P. Chuawong, T. Hendrickson, and K. Fleming. 2006. Energetics of outer
membrane phospholipase A (OMPLA) dimerization. J Mol Biol 358: 120 – 131.
5. Dekker, N., J. Tommassen, A. Lustig, J. Rosenbusch, and H. Verheij. 1997.
Dimerization regulates the enzymatic activity of Escherichia coli outer membrane
phospholipase A. J Biol Chem 272: 3179 – 3184.
6. Kingma, R., H. Snijder, B. Dijkstra, N. Dekker, and M. Egmond. 2002. Functional
importance of calcium binding sites in outer membrane phospholipase A. Biochim
Biophys Acta 1561: 230 – 237.
7. Stanley, A. and K. Fleming. 2007. The role of a hydrogen bonding network in the
transmembrane β-barrel OMPLA. J Mol Biol 370: 912-924.
8. Luckey, M. 2008. Membrane Structural Biology with Biochemical and Biophysical
Foundations. Cambridge University Press, New York, NY.
9. Oliver, R., J. Lipfert, D. Fox, R. Lo, S. Doniach, and L. Columbus. 2013. Dependence
of micelle size and shape on detergent alkyl chain length and head group. PLoS ONE 8:
e62488.

112
10. Ahn, V., E. Lo, C. Engel, L. Chen, P. Hwang, and L. Kay. 2004. A hydrocarbon rule
measures palmitate in the enzymatic acylation of endotoxin. EMBO J 23: 2931-2941.

113
Chapter 4: The Influence of Detergents on LspA function
Bilayer mimics have different effects on every membrane protein. Monitoring the
influence of detergent micelles on β-barrel membrane enzymes provides an opportunity
to find trends with physical detergent properties and β-barrel enzyme function. This
research targets not only β-barrel membrane enzymes, but aims to correlate function with
all types of proteins, including α-helical bundles. The stability and function of the α-
helical membrane enzyme, lipoprotein signal peptidase A (LspA), in varying detergent
environments is the focus of this chapter.
While α-helical bundles have structural differences from β-barrels, they are
significantly less stable. Entire β-sheets of barrels are stabilized via an internalized
hydrogen bonding network among the backbone carbonyls and amides.1 These β-sheet
interactions are stronger than the local hydrogen bonds formed between individual
residues along the α-helix (Figure 4.1).1,2
The ΔGunf of β-barrels can be as high as 32
kcal/mol compared to ~4 kcal/mol for α-helical bundles.3,4
α-helical proteins differ in
structure, stability, and even native membrane. Therefore, investigations on the stability
and activity of LspA is another interesting strategy to explore protein-mimic complexes.
4.1. Protein-detergent complex formation with LspA
Recombinant LspA from Chlamydia trachomatis was expressed in E.coli cells.
Unlike with the three β-barrel enzymes, LspA did not express into inclusion body pellets.
To isolate the membrane-bound LspA protein, the E. coli cells were lysed with a high
pressure homogenizer and the cell debris was removed via centrifugation. The
supernatant containing the membrane-bound LspA was pelleted using high speed ultra-
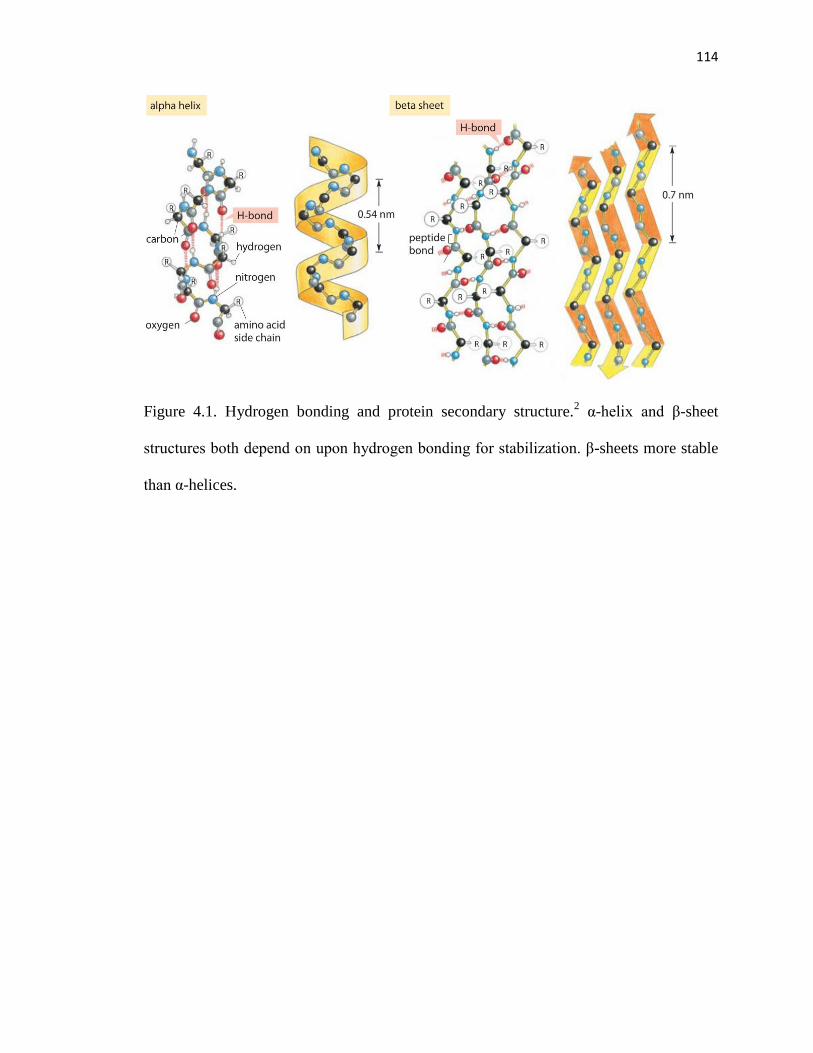
114
Figure 4.1. Hydrogen bonding and protein secondary structure.2 α-helix and β-sheet
structures both depend on upon hydrogen bonding for stabilization. β-sheets more stable
than α-helices.

115
centrifugation (35,000g). To solubilize the protein from the membrane, the pellet was
resuspended in FC12 detergent for 3 hours.
To study LspA in varying detergents, the FC12 was exchanged for several
different detergents via immobilized metal ion affinity chromatography (IMAC).
Recombinant LspA was expressed with a polyhistidine tag for affinity chromatography
purposes. These 6 histidine residues on the N-terminus of the protein interacted with the
Co2+
applied to the IMAC column, immobilizing the protein on the resin. Once
immobilized on the column, the FC12 detergent was exchanged for other detergents,
similar to the OMPLA detergent exchange in Section 3.1 (Figure 4.2). Protein solubility
was monitored 3 days after detergent exchange via centrifugation of the purified protein.
The supernatant and pellet were separated with SDS-PAGE; LspA in the supernatant
indicated stable, solubilized protein, while protein in the pellet suggested that LspA was
unstable and precipitated.
4.1.1. Results: LspA PDC stability in detergent enzymes
LspA detergent exchange was conducted in 27 detergents including
phosphocholines, glucosides, maltosides, Cymals, bile salt derivatives, thiomaltosides, an
Anzergent, and dimethylglycine (Figure 4.3 and Table 4.1). A first difference from the β-
barrel enzymes, LspA was not soluble and stable in many detergents. There were 3
outcomes from detergent exchange depending on the micelle: 1) purification of a stable
PDC, 2) purification of an instable PDC, and 3) protein precipitation during detergent
exchange.
LspA exchanged into the phosphocholine and Anzergent detergents produced
soluble, stable PDCs (Figure 4.4). The maltosides as well as Cymal 3, 4, and 5,

116
Figure 4.2. LspA purification in FC12 detergent micelles. LspA purification and was
immobilized with IMAC for detergent exchange into FC12 micelles. Fractions from the
detergent exchange were analyzed with SDS-PAGE. The gel depicts the column
flowthrough (lane 1), wash 1 (2 & 3), wash 2 (4 & 5), elution (6 & 7), and resin (8 & 9).
The molecular weight of LspA is 21 kDa.

117
Figure 4.3. Structures of dodecylthiomaltoside and dodecyldimethylglycine detergents.
Other detergent structures were depicted in Chapter 1.
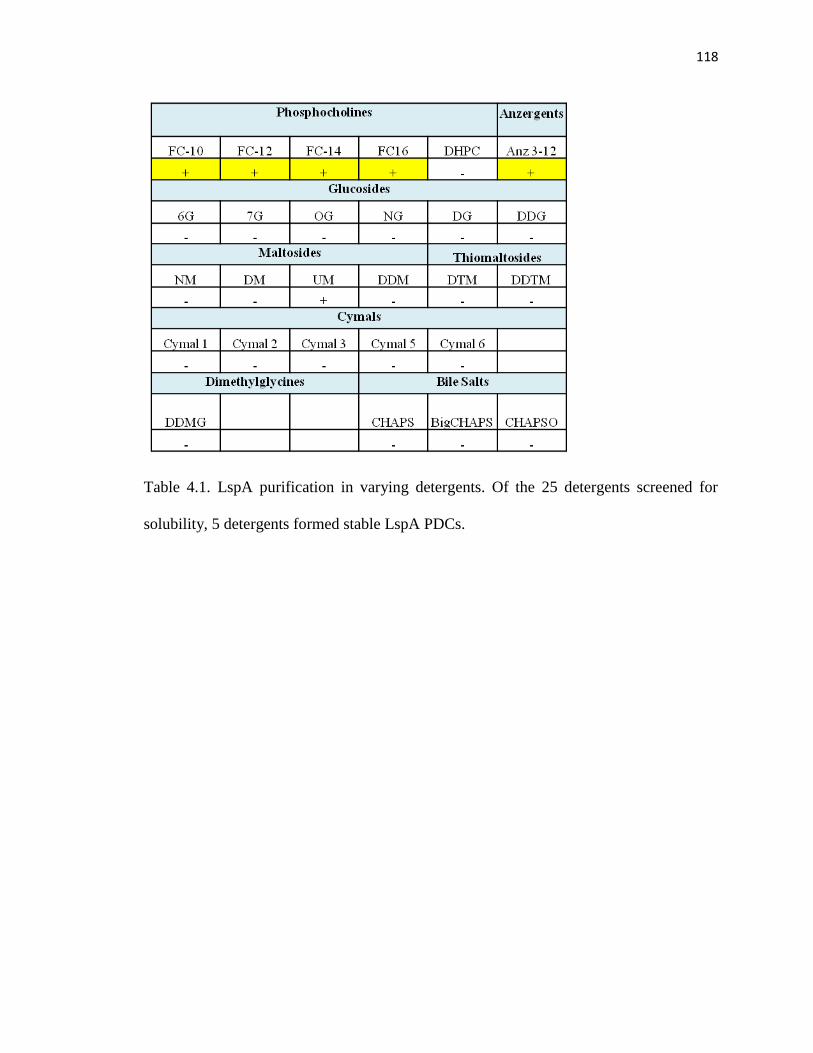
118
Table 4.1. LspA purification in varying detergents. Of the 25 detergents screened for
solubility, 5 detergents formed stable LspA PDCs.

119
Figure 4.4. LspA PDC solubility in phosphocholine and maltoside detergents. LspA
PDCs (21 kDa) were centrifuged and supernatant (S) and pellet (P) were separated on a
protein gel three days after purification to analyze solubility and stability. FC10, FC12,
and FC14 LspA samples were in the supernatant, indicating stable, soluble proteins. NM
was less stable, and precipitated after a few days.
120
solubilized an unstable PDC, as the protein precipitated from the micellar solution just
hours later (Figure 4.4). The protein immediately precipitated on the IMAC column when
exposed to the glucoside, thiomaltoside, bile salt, and dimethylglycine detergents.
This detergent screen suggests that independent of tail length, LspA is more stable
in detergents with the smaller, zwitterionic head groups. This trend can be due to several
reasons. First, the phosphocholine and Anzergent detergents share greater similarities
with the native lipids within the inner membrane (Figure 4.5).5
The phosphocholine and
Anzergent detergents may be close enough mimics to the bilayer to provide the protein
with enough stability and the electrostatic contacts necessary to fold and remain soluble
in these detergents. Second, Asp-14 within the conserved region A of LspA is essential
for protein folding and stability.6 This aspartate residue, potentially near the micelle head
group shell, may be impacted by a bulkier, nonionic head group, causing instability and
protein precipitation on the column or after purification.
Circular dichroism was completed on the successfully exchanged LspA PDCs to
further confirm the protein’s fold. Circular dichroism (CD) is a qualitative spectroscopic
technique that uses the differential absorbance of right and left circular polarized light
when applied to chiral molecules to analyze the secondary structure of proteins.7
Although the change in absorbance is usually measured, CD measurements are often
reported in degrees of ellipticity, which are absorbances corrected for protein
concentration.7 With Beer’s law, the differences in absorbance (ΔA) is converted to Δε,
and the mean residue ellipticity [θ] is determined with the following equation:
[1]

121
Figure 4.5. Structures of similar detergents and lipids. A few of the inner membrane
lipids, PG and PE, have similar head group size and charges as the phosphocholine and
Anzergent detergents.

122
where [θ] are in units of degrees•cm2•dmol
-1.7 CD spectra are depicted in molar ellipticity
vs. wavelength, and have characteristic trends depending on the protein’s secondary
structure (Figure 4.6).7,8
α-helical proteins have CD spectra with two minima, one at 208
nm and the other at 222 nm wavelength.9
CD was performed on the purified LspA, and the spectra have minima at 209 and
222 nm wavelengths, confirming that the protein is forming a α-helical protein fold
(Figure 4.7). LspA stability is not dependent on tail length (FC10 and FC16 produce
stable, folded PDCs); this exemplifies the flexibility within the detergent micelles, as the
carbon tails must shift to accommodate the protein.
4.2. LspA function in detergent micelles
4.2.1. Development of a custom signal peptide substrate for LspA cleavage
LspA activity assays involved monitoring the cleavage of a signal peptide with
two methods: HPLC and fluorescence.10
Designing an optimal custom signal peptide
substrate for LspA cleavage was vital in obtaining reliable, consistent activity results. To
engineer the substrate peptide, sequences for other signal peptide were used as a
template. The sequences included three signal peptides from Chlamydia trachomatis and
three from Bacillus subtilis (Table 4.2).11-13
Analysis of the signal peptides from other
bacteria highlighted several characteristics that the LspA peptide should contain: 1) a
lipobox cleavage sequence of L-X-X-C in the C-terminus, 2) 1 to 3 polar residues at the
N-terminus, and 3) 1 to 3 hydrophobic residues at the N-terminus. Common lipobox
sequences varied from LSSC, LAGC, LAAC, and IAAAC.11-13
With this information, three signal peptide substrates were designed containing
the following sequences: GSALSLSSCDNG (named UVAB2), YSGALAACGN

123
Figure 4.6. Typical circular dichroism spectra.8 Far-UV CD spectra of α-helices, β-sheets,
and random coil structures have characteristic trends. Typical CD spectra for α-helices
contain two minima at 209 and 222 nm wavelength.
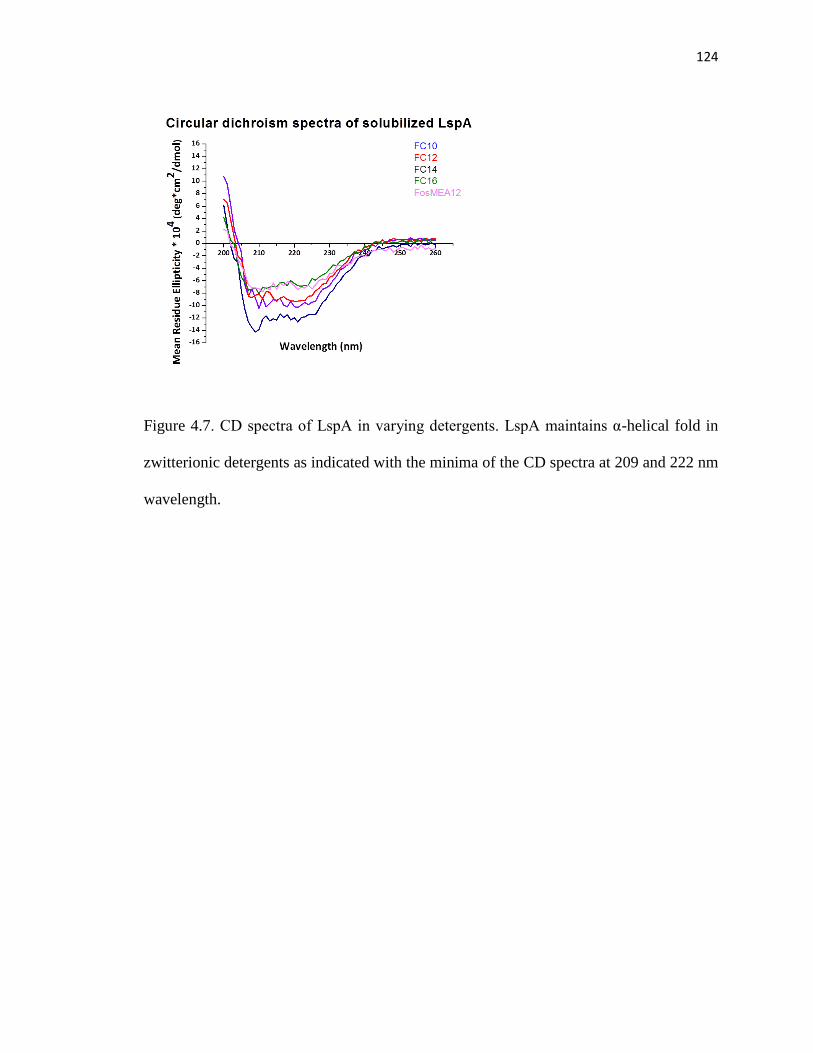
124
Figure 4.7. CD spectra of LspA in varying detergents. LspA maintains α-helical fold in
zwitterionic detergents as indicated with the minima of the CD spectra at 209 and 222 nm
wavelength.
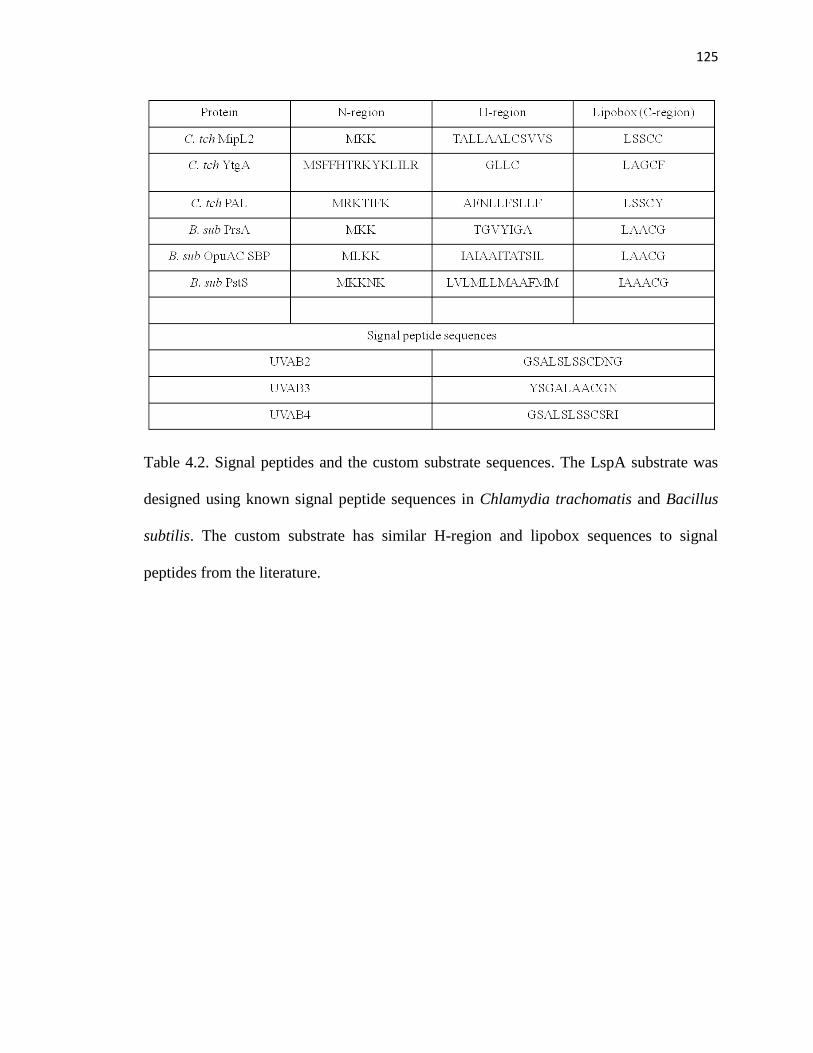
125
Table 4.2. Signal peptides and the custom substrate sequences. The LspA substrate was
designed using known signal peptide sequences in Chlamydia trachomatis and Bacillus
subtilis. The custom substrate has similar H-region and lipobox sequences to signal
peptides from the literature.

126
(UVAB3), and GSALSLSSCSRI (UVAB4). The C-terminal domains were derived from
signal peptides from CccA, MipL, and CRPL2, from C. tch and B. sub (Table 4.2). Each
peptide was tested to confirm cleavage via LspA with HPLC, and the best peptide was
tagged for fluorescence activity assays.
4.2.2. LspA HPLC assay optimization and results
Positive and negative controls for the HPLC and fluorescence activity assays were
required for accurate interpretation of purified LspA function. Cell extract from E. coli
cells transformed with and without lspA in the pET28 vector were used as controls.
pET28b + LspA cell extract was the positive control, and contained LspA in the bacterial
membrane. The negative control was pET28b – LspA, an empty pET28b vector
expressed in E. coli cells. The cell extracts are useful controls; however, the extracts
contain other cell contents and contaminants. Accurate LspA concentrations cannot be
determined with cell extract.
Prior to conducting the LspA activity assays, several controls were completed.
pET28b – LspA and pET28b + LspA cell extracts were monitored with HPLC. The two
chromatograms contained early eluting peaks with retention times between 2 and 4
minutes (Figure 4.8). HPLC runs with peptide only were also completed. The UVAB2, 3,
and 4 all eluted with a single peak at a later retention time (Figure 4.8). Knowing what
retention time to expect the peptide and the cell extract is important when interpreting the
LspA assay results.
The activity assay was designed as follows: prepare a reaction buffer containing
the positive or negative control cell extract, tris buffer at pH 8, EDTA, and DMF. The
substrate is added to the reaction buffer and the mixture is incubated for up to an hour at

127
Figure 4.8. HPLC activity assay controls. The negative and positive controls were
analyzed with HPLC (A & B) along with substrate only samples (C – E). Early eluting
peaks are indicative of the cell extract, this is useful when comparing with other
chromatograms.

128
37°C. This was completed with UVAB2, 3, and 4 to determine which substrates show the
potential to be a viable substrate for these assays. All three peptides showed signs of
cleavage in both the positive and negative controls (Figure 4.9), with smaller fractions
eluting between 3 and 5 minutes. Although these initial controls were inconclusive, the
peptides with more cleavage products, UVAB3 and UVAB4, were generated with
fluorescent tags for use in all of the following HPLC and fluorescent assays.
UVAB3 and UVAB4 signal peptide substrates were tagged with a fluorescent
donor/quencher pair. With the 3-nitrotyrosine donor and aminobenzamide on opposite
ends of the peptide, LspA activity can be quantitated (Figure 4.10). Upon addition of
LspA, the peptide will be cleaved, the donor/quencher pair will be separated, and the
fluorescence will increase. Initial reaction rates can be determined from the change in
fluorescence. The fluorescence and HPLC activity assays allow for a qualitative and
quantitative measurement of LspA function.
4.2.2.1. Results: LspA activity assayed with HPLC
As before, HPLC was completed on the fluorescently tagged UVAB3 and
UVAB4 peptide only samples (Figure 4.11). Upon addition of the positive and negative
controls, the results were significantly different. UVAB3 with pET28b – LspA did not
show any signs of peptide cleavage while UVAB3 with pET28b + LspA showed distinct
cleavage peaks at retention times between 4 and 5 minutes (Figure 4.12). These results
established a viable positive and negative control and substrate (UVAB3) for the purified
LspA samples. Because the UVAB4 substrate chromatograms did not depict any peptide
cleavage fragments in the positive control (Figure 4.12), the remaining LspA activity
assays focused on the cleavage of UVAB3.
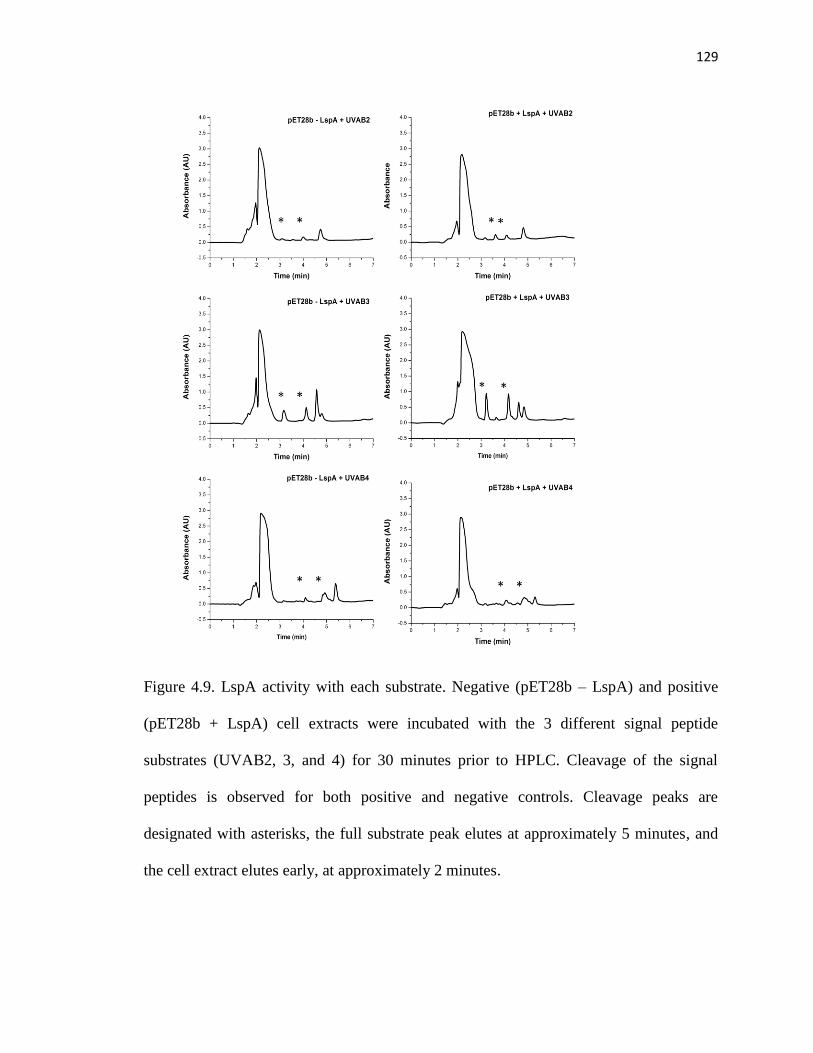
129
Figure 4.9. LspA activity with each substrate. Negative (pET28b – LspA) and positive
(pET28b + LspA) cell extracts were incubated with the 3 different signal peptide
substrates (UVAB2, 3, and 4) for 30 minutes prior to HPLC. Cleavage of the signal
peptides is observed for both positive and negative controls. Cleavage peaks are
designated with asterisks, the full substrate peak elutes at approximately 5 minutes, and
the cell extract elutes early, at approximately 2 minutes.

130
Figure 4.10. UVAB3 engineered with the donor/quencher pair. A 3-nitrotyrosine donor
and aminobenzamide quencher was added to the opposite ends of the UVAB3 peptide.
Upon LspA cleavage, the donor and quencher are separated, resulting in an increase in
fluorescence.

131
Figure 4.11. Fluorogenic signal peptide only chromatograms. UVAB3 and UVAB4 were
analyzed on HPLC as peptide only samples prior to conducting the positive and negative
controls. The peptides eluted as a single peak.
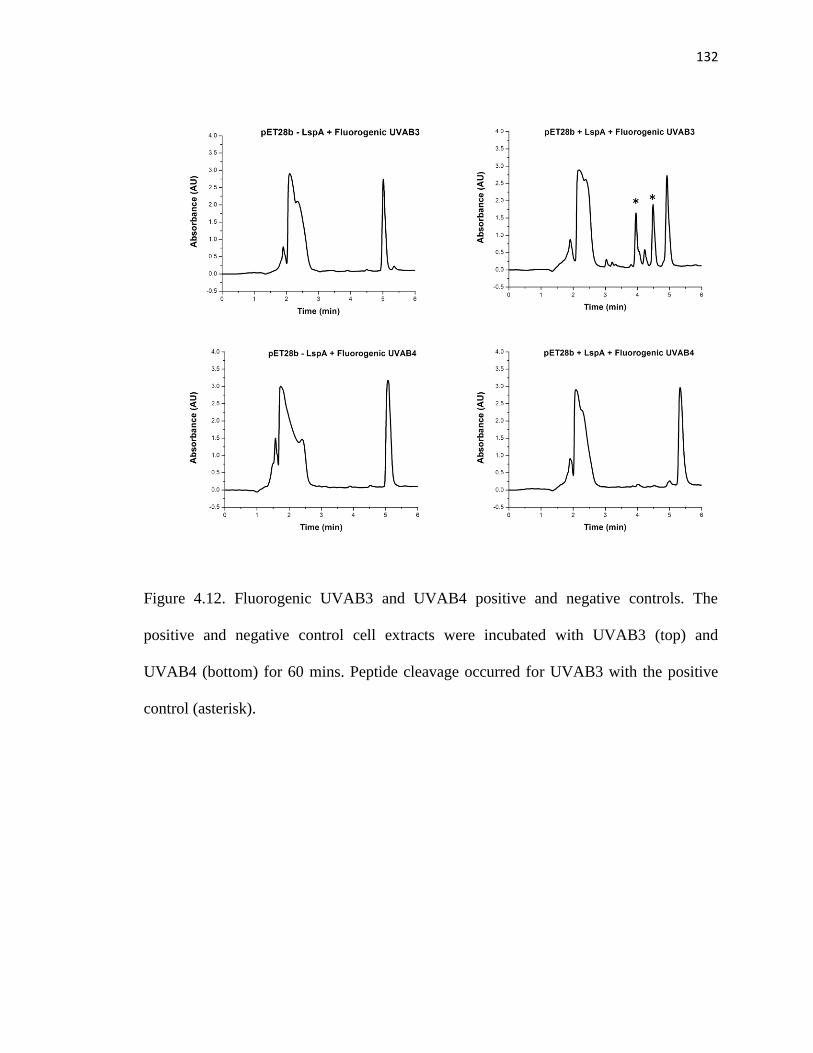
132
Figure 4.12. Fluorogenic UVAB3 and UVAB4 positive and negative controls. The
positive and negative control cell extracts were incubated with UVAB3 (top) and
UVAB4 (bottom) for 60 mins. Peptide cleavage occurred for UVAB3 with the positive
control (asterisk).
133
Purified LspA activity was monitored with HPLC in FC10, FC12, and FC14
PDCs. While HPLC chromatograms contained peaks for both peptide and LspA at ~ 2
and 5 minutes, respectively, there were no cleavage fragments detected, suggesting that
the detergent-solubilized LspA is inactive (Figure 4.13). For confirmation, these reaction
mixtures were incubated for up to 60 minutes prior to applying to the HPLC column.
These results indicate that even as stable PDCs, LspA solubilized in detergent is
inactive. The active site residues that are located within TMDs 3 and 4 are likely
significantly affected by the membrane mimic. With every purified LspA sample
inactive, it is more challenging to determine which specific detergents affect the LspA
functional fold and what key physical micelle properties are disrupting LspA activity.
Before concluding that LspA is inactive in all detergent mimics, fluorescent assays on the
UVAB3 with purified LspA was completed. The results of these assay show promising,
yet contradictory results.
4.2.3. LspA fluorescence assay optimization and results
The LspA fluorescence assay involved exciting the reaction mixture at 340 nm
and measuring the fluorescent emission at 411 nm every 5 minutes for 30 minutes. The
positive and negative cell extract controls were initially assayed with UVAB3. Upon
addition of UVAB3 to both positive and negative controls, there was an increase in
fluorescence. This is expected, as the cell extract contains not only the target protein, but
other proteins and debris that could cleave the signal peptide. With the change in
fluorescence calculated for enzyme specific activity, the pET28b + LspA positive control
has twice the activity of the negative control (Figure 4.14).
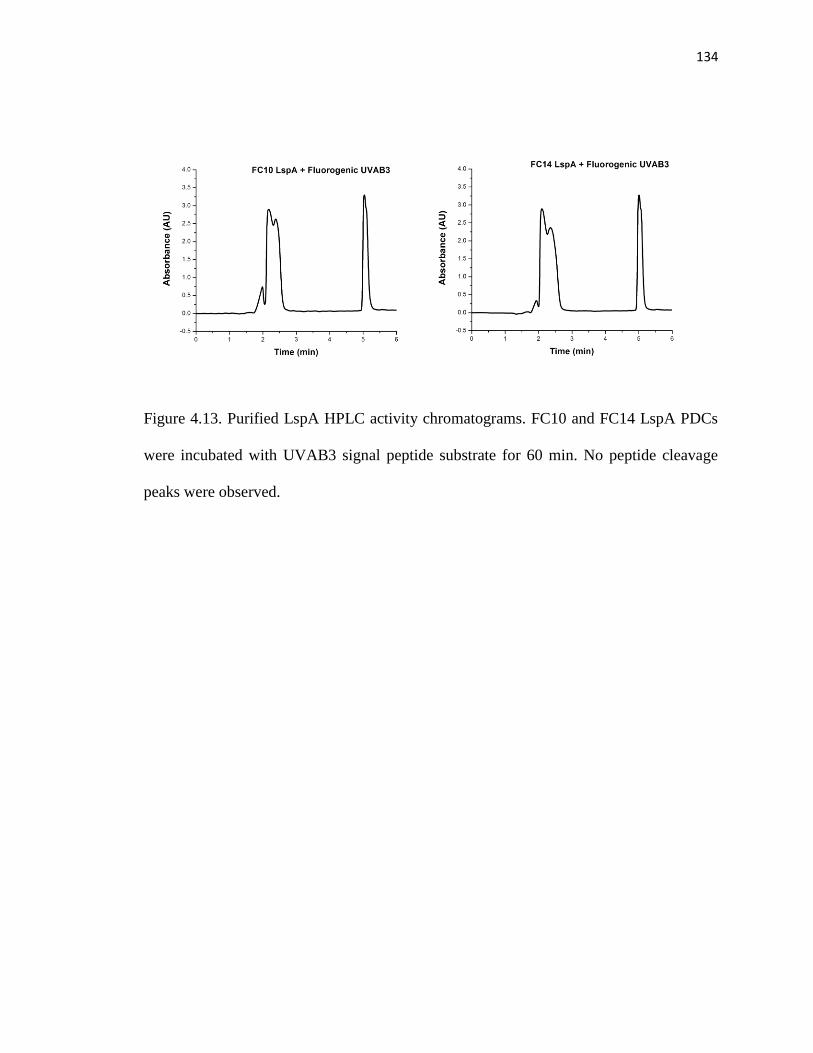
134
Figure 4.13. Purified LspA HPLC activity chromatograms. FC10 and FC14 LspA PDCs
were incubated with UVAB3 signal peptide substrate for 60 min. No peptide cleavage
peaks were observed.
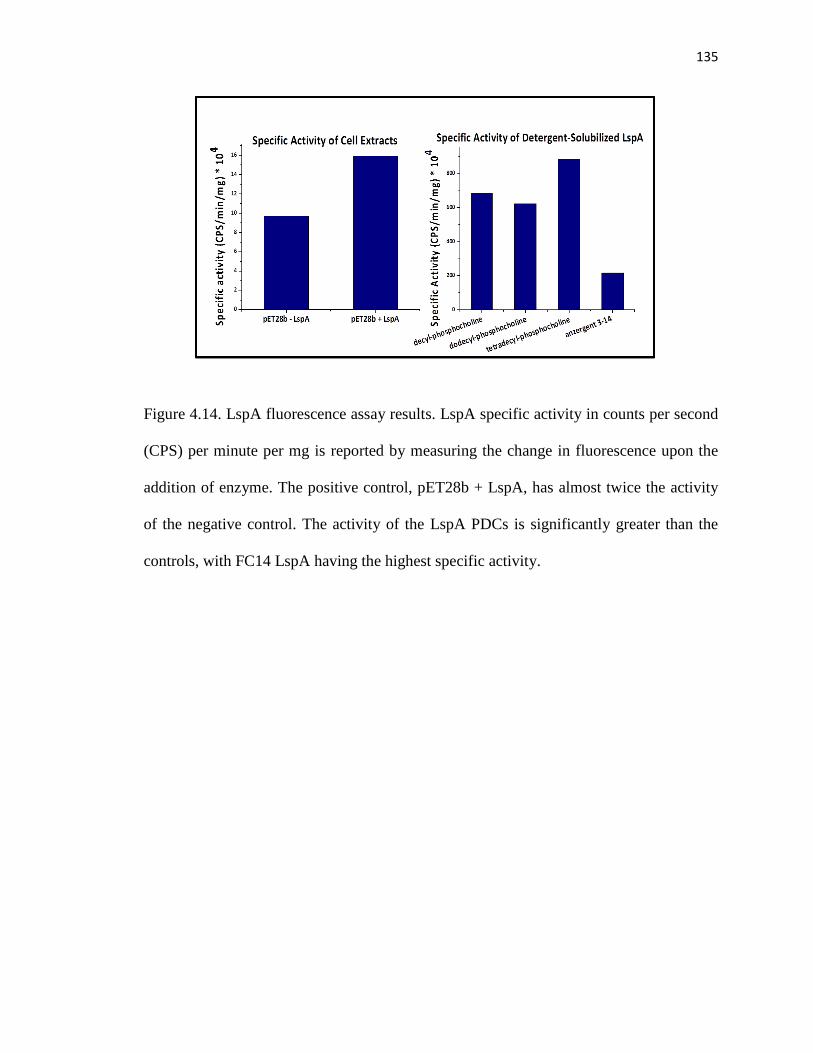
135
Figure 4.14. LspA fluorescence assay results. LspA specific activity in counts per second
(CPS) per minute per mg is reported by measuring the change in fluorescence upon the
addition of enzyme. The positive control, pET28b + LspA, has almost twice the activity
of the negative control. The activity of the LspA PDCs is significantly greater than the
controls, with FC14 LspA having the highest specific activity.

136
4.2.3.1. Results: Purified LspA function assayed with fluorescence
With established controls, fluorescent activity was assayed with the controls,
FC10, FC12, FC14, and Anzergent 314 LspA PDCs. All of the purified LspA PDCs were
active, with specific activities an order of magnitude higher than the positive control
(Figure 4.14 and Table 4.3). Fluorescence methods are 1000x more sensitive than UV
measurements. With increased sensitivity, the fluorescence assay was able to measure
signal peptide cleavage, unlike the HPLC assay. FC14 LspA has the highest activity
while Anzergent 314 has significantly lower activity than the other PDCs.
As with the LspA detergent exchange results, enzyme activity is independent of carbon
tail length. The FC14 and 314 detergents have the same nonpolar carbon tails yet differ
four-fold in specific activity. The phosphocholine and Anzergent head groups have
similar size and charge; however, the charge distribution across the head group shell is
opposite. The positive charge on FC detergents is on the outside of the shell while the
negative charged is closer to the micelle core; Anzergents have an opposite distribution.
The LspA catalytic aspartate residues are located at the micelle interface. There is a
possibility that these residues are interacting with the positive choline on the Anzergent
head group rather than the negative charged phosphate on the phosphocholine detergents.
The electrostatic interactions formed between the LspA catalytic aspartates and the
Anzergent head group could potentially attenuate protein function. Association between
protein and micelle head group not uncommon. NMR experiments suggests hydrogen
bond formation between FC head groups and the arginine side chains of FXYD2, a Na/K-
ATPase as well as association between the protein hormone epidermal growth factor
(EGF) with SDS and FC12 micelles at the surface.14,15

137
Table 4.3. LspA fluorescence assay results. Specific activity values for positive and
negative controls as well as purified LspA.

138
To further explore LspA activity, globomycin, a known LspA inhibitor, was
added to the reaction mixture. The addition of globomycin to FC12 and FC14 LspA
significantly attenuated protein function (Figure 4.15). Globomycin reduced FC12 LspA
activity by approximately 50% and decreased FC14 LspA activity by 70%.
Preliminary LspA fluorescence activities demonstrate reliable negative and
positive controls, active LspA PDCs, and attenuated function with a known inhibitor.
This assay shows great potential for monitoring LspA in varying detergents and
identifying correlations between detergents and protein properties. Typically,
fluorescence sensitivity can be three times higher than that of a UV detector.16
It is
possible that the both HPLC and fluorescence activities were successful, but the
fragments were not resolved with UV.
4.3. Future directions and conclusions
With these promising results, efforts to monitor LspA activity in varying
detergent micelles are ongoing. The preliminary work on this α-helical protein optimized
LspA solubilization, purification, and activity assays. Initial data suggests that LspA is
not stable in all detergents, and its activity is significantly affected by the membrane
mimics. This work exemplifies the arduous trial-and-error detergent screening that is
required for studying a membrane protein and emphasizes the difference between
outwardly similar detergent micelles.
A major drawback to this research is obtaining a reliable signal peptide substrate.
Although the sequences remained as designed, signal peptides synthesized from the same

139
Figure 4.15. LspA PDC activity in the presence of globomycin. Globomycin (GB)
attenuates the specific activity of LspA PDCs. The inhibition is more significant for
FC14-solubilized LspA.

140
and different companies produced very different results in respect to both the HPLC and
fluorescence assay. With the replicability issues, this project will benefit greatly with in-
house peptide synthesis to ensure similar results with every experiment. Peptide synthesis
and substrate production will be a beneficial component added to this research.
In addition to obtaining a more replicable substrate peptide, LspA detergent
exchange and purification will continue; it is likely that there will be more success when
purifying in Anzergent 310, 312, and potentially Cyclofos micelles. Stable PDCs will be
confirmed with circular dichroism and assayed with fluorescence. There is potential for
HPLC to be used to qualitatively confirm LspA cleavage; however, other methods may
be more successful. With a combination of biophysical techniques, the activity of LspA
PDCs will be elucidated.
4.4. Methods
4.4.1. LspA expression and purification
The pET28b plasmids containing the lspA gene was transformed into BL21(DE3)
E. coli cells for protein expression. Cell cultures were grown to an OD600 ~ 0.8 at 37°C in
terrific broth media supplemented with kanamycin (50 μg/mL). Protein expression was
induced for 4 hours at the same temperature with 1 mM IPTG. Cells from 6-L culture
were harvested by centrifugation (6000g, 15 min, 10°C), resuspended with 300 mL lysis
buffer (50 mM tris, pH 8, 150 mM NaCl, 1 μL DNAse, ½ EDTA-free protease inhibitor
pellet (Roche)), and lysed using a microfluidizer (Microfluidics model 110L, Newton,
MA). The cell debris was pelleted with low speed centrifugation (10,000g, 30 min, 4°C)
and discarded. The supernatant containing the membrane bound fraction was pelleted
with high speed centrifugation (35,000g, 90 min, 4°C). The pellet was resuspended in 160

141
mL extraction buffer (20 mM phosphate, pH 7.8, 150 mM NaCl, 4.5 mM FC12, 1
EDTA-free protease inhibitor pellet) for 3 hours at room temperature.
The resuspended protein was applied to cobalt chelating sepharose fast flow resin
(GE Healthcare, Uppsala, Sweden) for detergent exchange. The column was washed with
10 mL wash buffer 1 (20 mM phosphate, pH 7.8, 500 mM NaCl, and the appropriate
detergent), followed by 5 mL wash buffer 2 (20 mM phosphate, pH 7.8. 500 mM NaCl,
45 mM imidazole, and the appropriate detergent). LspA was eluted with 10 mL elution
buffer (20 mM phosphate, pH 7.8, 150 mM NaCl, 600 mM imidazole, and the
appropriate detergent). The eluate was concentrated (MWCO = 10 kDa) to 2 mL volume.
Concentration was determined by measuring the absorbance at 280 nm. The predicted
molar extinction coefficient for LspA is 29973 M-1
cm-1
. To remove imidazole, the protein
was dialyzed in 4 L equilibration buffer for 1 hour, 3 times. Detergent concentrations
were measured by 1-D 1H NMR spectroscopy by comparison of integrated methyl peak
with samples of known detergent concentrations. After a few days, protein solubility was
verified by centrifuging the protein (18,000g, 30 min, 10°C) and analyzing the pellet and
supernatant with SDS-PAGE. For CD, 1 mL of 0.05 mg of dialyzed LspA in varying
detergents was added to a quartz cuvette and the differential absorbance of the sample
was measured at 180 to 260 nm. The CD spectra were background subtracted with
measurements of buffer and detergent.
4.4.2. LspA activity assays
The pET28 – LspA and pET28b + LspA cell extract controls were produced by
transforming the plasmids into BL21(DE3) E. coli cells, expressing bacterial cells in
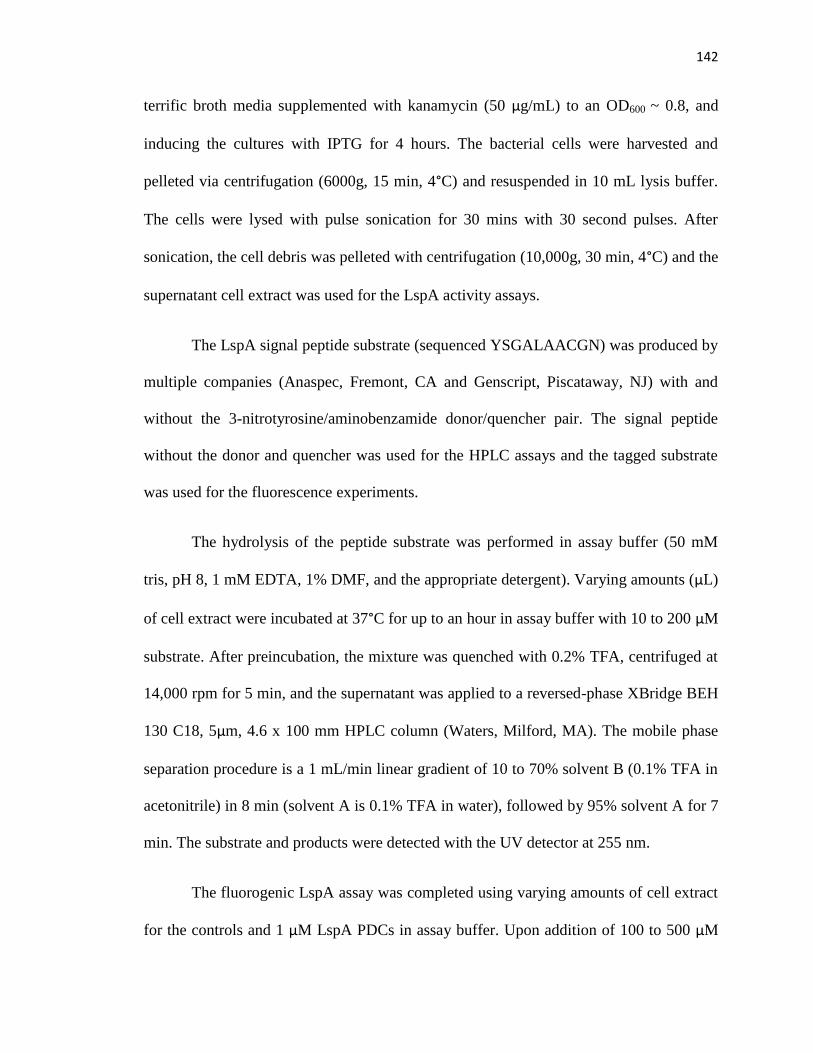
142
terrific broth media supplemented with kanamycin (50 μg/mL) to an OD600 ~ 0.8, and
inducing the cultures with IPTG for 4 hours. The bacterial cells were harvested and
pelleted via centrifugation (6000g, 15 min, 4°C) and resuspended in 10 mL lysis buffer.
The cells were lysed with pulse sonication for 30 mins with 30 second pulses. After
sonication, the cell debris was pelleted with centrifugation (10,000g, 30 min, 4°C) and the
supernatant cell extract was used for the LspA activity assays.
The LspA signal peptide substrate (sequenced YSGALAACGN) was produced by
multiple companies (Anaspec, Fremont, CA and Genscript, Piscataway, NJ) with and
without the 3-nitrotyrosine/aminobenzamide donor/quencher pair. The signal peptide
without the donor and quencher was used for the HPLC assays and the tagged substrate
was used for the fluorescence experiments.
The hydrolysis of the peptide substrate was performed in assay buffer (50 mM
tris, pH 8, 1 mM EDTA, 1% DMF, and the appropriate detergent). Varying amounts (μL)
of cell extract were incubated at 37°C for up to an hour in assay buffer with 10 to 200 μM
substrate. After preincubation, the mixture was quenched with 0.2% TFA, centrifuged at
14,000 rpm for 5 min, and the supernatant was applied to a reversed-phase XBridge BEH
130 C18, 5μm, 4.6 x 100 mm HPLC column (Waters, Milford, MA). The mobile phase
separation procedure is a 1 mL/min linear gradient of 10 to 70% solvent B (0.1% TFA in
acetonitrile) in 8 min (solvent A is 0.1% TFA in water), followed by 95% solvent A for 7
min. The substrate and products were detected with the UV detector at 255 nm.
The fluorogenic LspA assay was completed using varying amounts of cell extract
for the controls and 1 μM LspA PDCs in assay buffer. Upon addition of 100 to 500 μM

143
tagged substrate, the mixture was excited every 5 minutes at 340 nm and the fluorescent
emission at 411 nm was collected over 30 minutes with a Fluoromax-3 fluorometer
(Horiba, Kyoto, Japan). Reaction rates were reported in counts per second (CPS) per
minute. For the LspA PDC inhibition assays, a final concentration of 0.1 μM globomycin
was added to the reaction buffer with enzyme and substrate.
4.5. References
1. Buehler, L. 2015. Cell membranes. Garland Science, New York, New York.
2. Milo, R. 2015. Cell Biology by the Numbers. Garland Science, New York, New York.
3. Moon, C. N. Zaaccai, P. Fleming, D. Gessmann, and K. Fleming. 2013. Membrane
protein thermostability may serve as the energy sink for sorting in the periplasm. Proc
Natl Acad Sci USA 110: 4285-4290.
4. Mayor, U., N. Guydosh, C. Johnson, G. Grossmann, S. Sato, G. Jas, S. Freund, D.
Alonso, V. Daggett, and A. Fersht. 2003. The complete folding pathway of a protein from
nanoseconds to microseconds. Nat 421: 863-867.
5. Silhavy, T., D. Kahne, and S. Walker. 2010. The bacterial cell envelope. Cold Spring
Harb Perspect Biol: 1-17.
6. Tjalsma, H., G. Zanen, G. Venema, S. Bron, and J. van Dijl. 1999. The potential active
site of the lipoprotein-specific (type II) signal peptidase of Bacillus subtilis. J Biol Chem
274: 28191-28197.
7. Greenfield, N. 2006. Using circular dichorism spectra to estimate protein secondary
structure. Nat Protoc 1: 2876-2890.
8. “Circular dichroism.” Alliance Protein Laboratories. 2016. Web. 30. Mar. 2016. <
http://www.ap-lab.com/circular_dichroism.htm>

144
9. Kelly, S. and N. Price. 2000. The use of circular dichroism in the investigation of
protein structure and function. Curr Prot Pept Sci 1: 349-384.
10. Zhong, W. and S. Benkovic. 1998. Development of an internally quenched
fluorescent substrate for Escherichia coli leader peptidase. Anal Biochem 225: 66 – 73.
11. Sutcliffe, I. and D. Harrington. 2002. Pattern searches for the identification of
putative lipoprotein genes in Gram-positive bacterial genomes. Microbiol 148: 2065-
2077.
12. Lundemose, A., D. Rouch, C. Penn, J. Pearce. 1993. The Chlamydia trachomatis
Mip-like protein is a lipoprotein. J Bacteriol 175: 3669-3671.
13. Heinz, E., P. Tischler, T. Rattei, G. Myers, M. Wagner, and M. Horn. 2009.
Comprehensive in silico prediction and analysis of Chlamydiae. BMC Genomics 10: 1-
18.
14. Gong, X., Y. Ding, J. Yu, Y. Yao, and F. Marassi. 2015. Structure of the Na/K-
ATPase regulatory protein FXYD2b in micelles: implication for membrane-water
interfacial arginines. Biochim Biophys Acta 1848: 299-306.
15. Mayo, K., A. De marco, E. Menegatti, and R. Kaptein. 1987. Interaction of epidermal
growth factor with micelles monitored by photochemically induced dynamic nuclear
polarization-1H NMR spectroscopy. J Biol Chem 262: 4899-4904.
16. Aulisa, E. and D. Gilliam. 2015. A practical guide to geometric regulation for
distributed parameter systems. CRC Press, Boca Raton, FL.

145
Chapter 5: Small angle scattering of detergent-rich bicelles
Scattering techniques have been employed for the studies of biological systems
over the last thirty years with the introduction of many powerful X-ray and neutron
facilities around the world.1 Small angle scattering (SAS) can be used to study the
structure, kinetics, and interactions of macromolecules, nanocomposites, alloys, and
synthetic polymers in the 10 to 1000 Å range.2 Common biological structures studied
with these methods are complex macromolecular aggregates, protein assemblies, organic
polymers, and protein-surfactant complexes.
Small angle scattering was introduced in 1930s with the thesis work of Andre
Guinier on metallic alloys.3 Guinier’s early observations in 1938 on the Al-Cu alloy led
to the discovery that the scattering of X-rays at small angles can provide not only
information on the sizes and shapes of particles but also the internal structure of
disordered and partially ordered systems.4 The method gained popularity in the study of
biological systems in solution in the 1960s when low-resolution structural information,
shape, and internal composition of the system could be determined without
crystallography.2 Since the 1970s the construction of large scale facilities, such as high
flux reactors and spallation sources for neutrons and synchrotron radiation X-ray sources,
has been a major advancement for SAS.2
Although there was a decline of interest in SAS with progress in other structural
methods in the 1980s, the 1990s brought another breakthrough in the technique.2 SAS
data analysis methods were greatly improved, allowing ab initio shape and domain
structure determination and detailed modeling of macromolecular complexes.2 The
instrumentation also advanced, with sub-millisecond time resolution achieved on the

146
third generation synchrotron radiation sources.2 Bertram Brockhouse and Clifford Schull
brought SAS to the forefront most recently with their work in the development of neutron
scattering techniques and neutron spectroscopy, winning a Nobel Prize in Physics in
1994.
In this chapter, these advanced SAS methods, specifically, small angle neutron
scattering (SANS), are being utilized for the structural characterization of detergent-rich
bicelles.
5.1. Small angle scattering principles and methodology
5.1.1. Small angle scattering theory
Scattering measurements can be done with X-rays or neutrons. Upon interaction
of the beam with the sample (called the incident) X-rays or neutrons scatter from the
sample. The scattering results from differences in the sample’s electron density in the
case of X-rays, and differences in nuclear density in respect to neutron scattering. While
the fundamental principles of small angle scattering remain the same, there are
differences, benefits, and disadvantages of small angle X-ray scattering (SAXS) vs.
SANS methods that will be discussed in the next section.
X-rays and neutrons have wavelike properties, including amplitude and phase. In
a typical SAS experiment, the X-rays or neutrons are directed toward a dilute,
homogeneous sample in physiological buffer. The sample is then exposed to the
collimated X-ray or neutron beam. Upon interaction, the X-rays or neutrons are scattered
from their original straight trajectory at a small angle, 2θ, of 0.1 to 10° (Figure 5.1) with a
scattering vector of Q (The scattering vector Q is typically lowercased; however, to

147
prevent confusion with the bicelle lipid-to-detergent ratio, q, uppercase Q for the
scattering vector is used in this thesis).2 The light can scatter elastically or inelastically. In
elastic scattering, the kinetic energy of the incoming X-ray or neutron does not change
after being scattered from the sample, resulting in no loss in the magnitude of the wave
vector. With inelastic scattering the kinetic energy of the scattered X-rays or neutrons is
altered from those coming from the beam source. Inelastic scattering changes both the
direction and magnitude of the wave vector. The scattering can also be described with
respect to coherence. Coherent scattering is dependent on the scattering vector, Q, and
can provide structural, spatial correlation, and collective motion information. Incoherent
scattering is Q-independent and contributes to the background scattering noise. It is the
elastic, coherent scattering that provides the useful structural information from small
angle scattering.
The scattering vector, Q, specifically refers to the difference between the incident
wave vector ki and the final wave vector, kf, after sample interaction. Q typically has
units in reciprocal space, nm-1
or Å-1
, and is defined as:
[1]
This equation can be substituted into Bragg’s Law of Diffraction
[2]
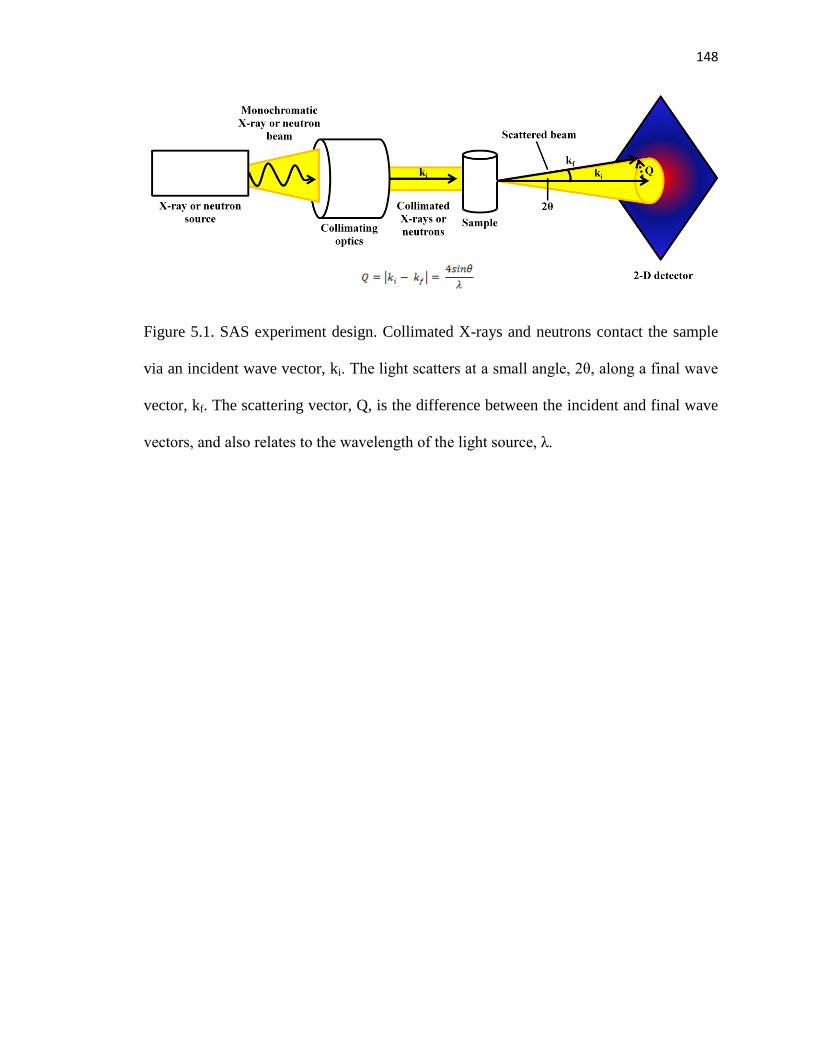
148
Figure 5.1. SAS experiment design. Collimated X-rays and neutrons contact the sample
via an incident wave vector, ki. The light scatters at a small angle, 2θ, along a final wave
vector, kf. The scattering vector, Q, is the difference between the incident and final wave
vectors, and also relates to the wavelength of the light source, λ.

149
to yield a useful expression that relates Q with d, distance.
[3]
Low-Q (0.01 Å-1
) scattering data is indicative of larger interactions (500 Å) and high-Q
(0.3 Å-1
) scattering gives more information about smaller distances (10 Å).1
The most fundamental difference between X-ray and neutron scattering is the
mechanism by which the incident radiation interacts with matter. This interaction can be
described in terms of the scattering length, b, and scattering cross-section, σ. X-rays are
scattered by the electrons surrounding atomic nuclei, and its scattering length is defined
as
[4]
where Z is the number of electrons and r0 = 2.82 x 10⁻¹³
cm is the Thomson electron
radius. Scattering length is typically in units of cm. The X-ray scattering cross-section is
[5]
where the units for σ is cm2. The scattering length and cross-section for SAXS vary in
direct proportion to the number of electrons present, increasing with atomic number.
Contrary to X-ray scattering, the scattering length and cross-section of neutrons
depends on the interaction between the neutron and a given nucleus and varies irregularly
with each element; even isotopes of the same element have different b and σ (Table 5.1).
Herein lies an advantage of SANS over SAXS: hydrogen and deuterium have different b
and σ, and unlike X-rays, neutrons can “see” deuterium and differentiate it from

150
Table 5.1. Neutron scattering lengths and cross-sections. The neutron scattering lengths
(bN) and scattering cross-sections (σ) of different elements, including the isotope
deuterium, is tabled. An advantage of SANS is the differences between the scattering of
hydrogen and deuterium, which can be exploited with contrast variation experiments.

151
hydrogen. This is essential to the benefits of SANS experiments, and will be described in
further detail in the Section 5.1.3.
Regardless of the differences in scattering lengths and cross-sections, both SAXS
and SANS scattering are dependent on the scattering length density (SLD), ρ. SLD is
defined as the scattering length of N atoms divided by the volume of the atoms:
[6]
ΣN is the sum of the scattering length contributions from N atoms and Vm is the molecular
volume. The molecular volume can be computed using the bulk density of the material
(ρm), molecular weight (M), and Avogadro’s constant (NA)
[7]
to yield this solvable equation for SLD with units of Å-1
.
[8]
The SLD difference between the particle and solvent, also known as the net particle
scattering or contrast (Δρ), is essential to SAS experiments. Without this contrast, there is
no scattering.
The basic Rayleigh-Gans-Debye scattering equation defining the scattering
intensity, I(Q), for an ensemble of a randomly oriented macromolecule is:
[9]
152
This equation takes into account the SLD difference in scattering, or contrast (Δρ), the
volume fraction of particles (φP), volume of each particle (VP), form factor (P(Q)), and
structure factor (S(Q)). The form factor accounts for the particle size and shape, while the
structure factor represents particle interactions, interference, or matrix effects. Most
scattering data is plotted in terms of I (Q) vs. Q, or is Fourier transformed into a P(r)
distance distribution function, and these scattering profiles provide structural information
about the sample.
5.1.2. SAXS vs. SANS
SAXS and SANS are advantageous for several reasons. These techniques can
probe structures of 1 nm to 1 μm lengths, providing information on the overall size,
shape, and spatial relationship of the sample. This information can be learned in real
time, allowing for the analysis of the system under a variety of environmental conditions.
As mentioned earlier, SAXS and SANS experiments are distinguished by their
beam source and the process in which the incident radiation interacts with the sample. X-
rays interact with electrons surrounding the atomic nuclei, while neutrons interact with
the nuclei, resulting in more uniform scattering lengths and cross-sections for X-ray
scattering that increases with atomic number in comparison to the random values for
neutron scattering. This irregular scattering pattern for SANS experiments has three
advantages: 1) Identifying light atoms, such as hydrogen, in the presence of heavier ones,
is easier 2) neighboring elements in the periodic table have significantly different
scattering and can be identified, and 3) isotopes of the same element can be
distinguished.2 This difference in hydrogen vs. deuterium scattering is a major advantage

153
for SANS methods. SANS contrast variation experiments use this advantage to
distinguish different components of a sample, i.e. a hydrogenated micelle vs. deuterated
protein. Contrast variation experiments can be completed only with SANS, and will be
described in depth in Section 5.1.3.
Due to its relatively weak interaction with the nucleus, the neutron is a highly
penetrating probe. Therefore, SANS experiments can characterize the interior of a
sample, rather than only the surface layer probed by SAXS. The neutron is also
nondestructive, unlike X-rays, and is suitable for high temperatures. Neutron experiments
are completed over a few hours, while SAXS measurements can be completed in
minutes. SAXS has the superior time resolution as well, with millisecond time-resolved
structural and conformational analysis compared to the second time regime of SANS
experiments.
The major disadvantage of SAXS and SANS is that both methods provide only
low resolution structural information (> 10 Å).1 This low resolution regime gives an idea
of aggregation, conformation, stoichiometry, and particle size and shape. Also, there are
no small laboratory sources available to conduct SANS, and less than 50 SANS
instruments exist worldwide. While SAXS instruments are more common, the higher
resolution data can only be obtained at the few facilities with a high flux synchrotron.
5.1.3. SANS contrast variation and multi-component systems
As stated previously, small angle scattering can only occur when there is contrast,
Δρ, between the scattering length densities of the particle and the solvent. Hydrogen and

154
deuterium have significantly different scattering lengths in SANS; similarly, the SLDs of
H2O and D2O vary considerably (Table 5.2). Contrast variation, or contrast matching,
experiments can be completed that exploit this contrast requirement, using the differences
in hydrogen and deuterium scattering to identify structural features of a system.
Biological SAS methods are typically completed by obtaining the scattering of the
overall system, which is usually a sample (e.g. a protein in a bicelle) in water. These
experiments would not be able to distinguish between the two components, and the
scattering profile would be representative of the entire system. Contrast variation is
completed by deuterating one component of the system (i.e. a perdeuterated protein) and
leaving the other component (i.e. a bicelle) fully hydrogenated (Figure 5.2).
This example of the perdeuterated protein in a hydrogenated bicelle can be used to
describe a typical contrast variation experiment. SANS of the protein-bicelle complex in
water will result in a loss of contrast between the H2O and the hydrogenated bicelle, and
all scattering of this system will only result from the deuterated protein. Inversely, the
scattering of the perdeuterated protein in the bicelle in D2O solvent will only represent
the hydrogenated bicelle. With these contrast variation experiments, each component of
the system can be distinguished depending on the D2O concentration in the solvent. In
addition to the scattering of each system, experiments can be completed to determine the
overall percentage of D2O in the solvent required to eliminate the scattering for the entire
system. This percentage of D2O is called the contrast match point, or CMP.

155
Table 5.2. Scattering length densities (SLD) of water with increasing D2O
concentrations. Water has a different SLD (ρ) than D2O, which is utilized for SANS
contrast variation experiments.

156
Figure 5.2. Example of SANS contrast variation. The perdeuterated protein (purple)
embedded in the fully hydrated bicelle (green) can be dialyzed into buffers with varying
D2O concentrations. When exposed to 0% D2O solvent, contrast is lost between the
hydrated bicelle and the solvent, and resulting scattering is only from the protein. By
dialyzing the complex in 100% D2O buffer, contrast between the protein and solvent is
abolished, and scattering is representative of only the bicelle. There is a CMP between 0
and 100% D2O that matches out the entire complex, and there is no scattering.

157
Typical contrast variation experiments are completed on the same partially
deuterated system at multiple concentrations of D2O in the buffer, called contrast points.
This enables the researcher to obtain systematic snapshot views of the complex. The
scattering observed from this system at each contrast point is described as:
[10]
where I11(q) and I22(q) describe the basic scattering functions originating from each
component, and I12(q) represents the cross-term scattering.
Contrast variation experiments described in this thesis were completed with d54-
DMPC lipids that contained deuterated alkyl tails and hydrogenated phosphocholine head
groups, and fully hydrogenated DHPC detergent. These bicelles represent a three
component system containing: 1) the identical d54-DMPC and DHPC hydrogenated
phosphocholine head groups, 2) the deuterated d54-DMPC carbon tails, and 3) the
hydrogenated DHPC alkyl tails (Figure 5.3).
5.2. Previous work and project motivation
The ideal bicelle is often discussed by researchers as the hybrid between detergent
micelles and liposomes, consisting of distinctly separated lipid bilayer and detergent rim
domains. This notion of complete separation between the bicelle components is often
debated, and yields interesting questions about bicelle formation and composition.

158
Figure 5.3. d54-DMPC/DHPC bicelle SANS contrast variation experimental design. The
three component bicelle composed of deuterated DMPC lipid tails and fully hydrated
DHPC tails surrounded by a hydrated phosphocholine head group shell. Contrast
variation highlights the differences between the ideal bicelle and a “mixed micelle”
bicelle. In 0% D2O solvent, scattering is observed for the lipid core and depicts an
ellipsoidal shape. In 100% D2O, scattering is seen for the hydrated head groups and rim,
forming a shell-like structure. Between 40 and 65% D2O, depending on q-ratio, the CMP
is reached, abolishing scattering from the entire system. With more hydration within the
bicelle core, the CMP for “mixed micelle” bicelles will be slightly lower than the CMP
for ideal bicelles.

159
While biophysical investigations of lipid-rich bicelles confirm ideal bicelle-like
structures, it is less likely that detergent-rich bicelles follow the same trend.5 Detergents
have the propensity to form micelles in aqueous environments; therefore, detergent-rich
bicelles are likely to have some degree of mixing between its amphiphile components,
forming mixed micelles instead of ideal bicelles. To test the validity of the ideal model,
the size and shape of detergent-rich bicelles are being investigated.
SAS techniques are useful tools to probe bicelle structure. Initial bicelle SAXS
experiments by Ryan Oliver were conducted with DMPC and DHPC mixtures of lipid-to-
detergent ratios (q-ratios) from 0.1 to 1.0 in 0.1 increments. These low q-ratios
represented the detergent-rich bicelle regime. Several total amphiphile concentrations,
CL, were studied, including 1.5 and 6% (w/v) at 6, 25, and 40°C. A major observation of
the SAXS data was that an increase in lipid concentration results in the aggregate
transitioning from smaller structures to a larger system. As q was increased from 0.1 to
0.5, each SAXS profile was different, indicating that the DMPC and DHPC are well
mixed and form a different structure with each systematic addition of the lipid component
(Figure 5.4). Scattering profiles from q = 0.5 to 1.0 depict only minor differences,
indicating that the overall size and shape formed by the aggregates are similar.
Radii of gyration (Rg) were measured with Guinier analysis of the data, and L,
the dominant head group to head group distance, was determined by using the position of
the second maximum (L = 2π/Qmax) (Table 5.3). L is measured from the center of one
head group to the center of the opposing head group on the opposite side of the bicelle.

160
Figure 5.4. Experimental SAXS profiles of DMPC/DHPC bicelles. (A) SAXS data
collected for bicelles at incremental q-ratios (0.1 to 1.0) at CL = 6% (w/v) and 25°C.
Dominant head group to head group distance, L, is determined from the position of the
2nd
maximum, Qmax. The Qmax of q = 1.0 bicelles is designated with a dotted line. (B)
Dominant head group to head group distances (L) measured in respect to q-ratio. SAXS
profiles reflect a linear transition from q = 0.1 to 0.5, followed by a plateau from 0.5 to
1.0.

161
Table 5.3. Measured radii of gyration and dominant head group to head group distances
of DMPC/DHPC bicelles. SAXS profiles of DMPC/DHPC bicelles at CL = 6% at 25°C
were analyzed with a Gunier fit to determine Rg. Dominant head group to head group
distance, L, is determined from the position of the 2nd
maximum.
162
Therefore, using carbon bond lengths and the phosphocholine head group size, the
expected L for a pure DMPC bilayer is approximately 44.4 Å and 24.2 Å for a pure
DHPC micelle. The L for the q = 0.1 bicelles is 26.2 Å, and increases until q = 0.5, where
the average L remains approximately 41.8 Å. These values indicate that detergent-rich
bicelles (q = 0.1) form DHPC-like micelles and transition to a DMPC bilayer
morphology with increased lipid concentration. The Rg of the data provided by Guinier
analysis corresponds well to the trends in L. These promising initial results led to the
interest in gaining more structural information about these detergent-rich bicelles.
To capture this transition from micelle-sized aggregates to bicelle-like structures,
SANS was utilized to probe more dimensions of the lipid-detergent mixtures. SANS
contrast variation experiments were completed with q = 0.3 and 0.7 d54-DMPC/DHPC
bicelles at CL = 1.5 and 6% (w/v) and T = 25 and 40°C in solvents with varying D2O
concentrations (Figure 5.5). q = 0.3 and 0.7 were chosen to analyze with SANS because
these structures represent both the mixed micelle and bicelle regimes. Contrast match
points were determined using the x-intercept of a 2nd
order polynomial fit to I(0)/c vs.
fraction of D2O in the solvent. The match point for q = 0.3, CL = 6% bicelles was 34.1%
D2O, slightly less than the 43.6% CMP for q = 0.7 bicelles. Because the deuterated lipid
tails are matched with higher D2O concentration in the solvent, this increase in CMP with
higher Q values was expected. These CMP values did not differ substantially with the CL
= 1.5% bicelles.

163
Figure 5.5. SANS contrast variation series of DMPC/DHPC bicelles. Scattering was
collected at CL = 6% (w/v) and 1.5% (not pictured) and 25°C of a) q = 0.7 and b) q = 0.3
bicelles. D2O concentration in solvent is designated by color.

164
Although preliminary analysis of the scattering data resulted in determining the
Rg, L, and CMP of these low-Q bicelles, the head group shell thickness, overall length,
and radius can be determined by fitting the SANS data with a core-shell bicelle model.
The dimensions obtained from properly fitting the SANS data can confirm a change in
aggregate size with q-ratio and monitor the transition from micelle to bicelle, challenging
the ideal bicelle model for detergent-rich bicelles.
5.3. Structure and composition of d54-DMPC/DHPC bicelles
5.3.1. Core-shell bicelle model
SANS data is analyzed using multiple software packages. SASView facilitates the
fitting of the data to shape-dependent, shape-independent, and custom models. Choosing
the correct model is essential to obtaining accurate dimensions of the bicelles. Because
the d54-DMPC/DHPC aggregates consist of a hydrocarbon core surrounded by an outer
shell of phosphocholine head groups, the model used for the analysis is the core-shell
bicelle model (Figure 5.6). Core-shell models allow for variations in the SLDs for the
shell vs. core. The core-shell bicelle model is a derivative of the cylinder and core-shell
cylinder models. The cylinder model represents a circular cylinder, while the core-shell
cylinder model is almost identical but accounts for an outer shell layer. The difference
between the core-shell cylinder and core-shell bicelle model is that the bicelle shell
parameters are separated into a face-shell and rim-shell, and these values can be varied
for different shell thicknesses and SLDs around the aggregate.

165
Figure 5.6. Core-shell models for SANS fitting. The core-shell bicelle model used to fit
the SANS contrast variation data is derived from the cylinder and core-shell cylinder
models. The addition of the different face and rim shell thicknesses and SLDs distinguish
the core-shell bicelle fit from the other models.

166
The cylinder model provides the form factor for a monodisperse circular cylinder
and is normalized by the particle volume. As mentioned above, the form factor represents
the particle size and shape, and for the cylinder model is calculated as:4
[11]
where
[12]
and
[13]
Vcyl is the volume of the cylinder. α is defined as the angle between the cylinder axis and
the scattering vector, Q. The function f(Q) averages the form factor over all possible
orientations of the cylinder with respect to Q. L is the length of the cylinder and r is the
radius. j1 is a first order Bessel function representing cylindrical symmetry and
coordinates. The returned value is in units of cm-1
on an absolute scale.
The core-shell cylinder form factor is derived from the cylinder model but
includes the contrast between the core and shell and the shell and solvent such that:6
[14]

167
where t is the shell thickness, r is the radius of the core, the outer radius of the shell is
given by r + t, and the total length is given by L + 2t. Vshell is the volume of the outer
shell (i.e. the total volume, including the shell):
[15]
The core-shell bicelle model is a more general case of this core-shell cylinder model form
factor, enabling differences in the face and rim shells.
The core-shell bicelle model allows for the tuning and determination of several
parameters including scale (unit-less), background (cm-1
), radius, length, rim thickness,
and face thickness in Angstroms. SLDs (in units of Å-2
) of the core, rim, face, and solvent
can be altered as well to get a fit to the scattering data (Table 5.4).
5.3.2. Determination of scattering length densities for core-shell bicelle fits
The experimental SANS data for the 0.3 and 0.7 bicelles were fit using the core-
shell bicelle model described above. Although there are 10 parameters that can be
adjusted to obtain the best fit, there are several parameters such as the scattering length
densities (SLDs) that are held constant based on several assumptions placed on the
system. By keeping the SLDs constant, the fitting process is more systematic and allows
for trends in bicelle size and shape to be identified.
SANS contrast variation experiments were utilized by measuring the contrast of
bicelles in solvents with different concentrations of D2O. The solvent SLD was set at
different values depending on this D2O percentage in solution. As demonstrated with
Equation 8, each solution has a different SLD depending on the scattering length of the
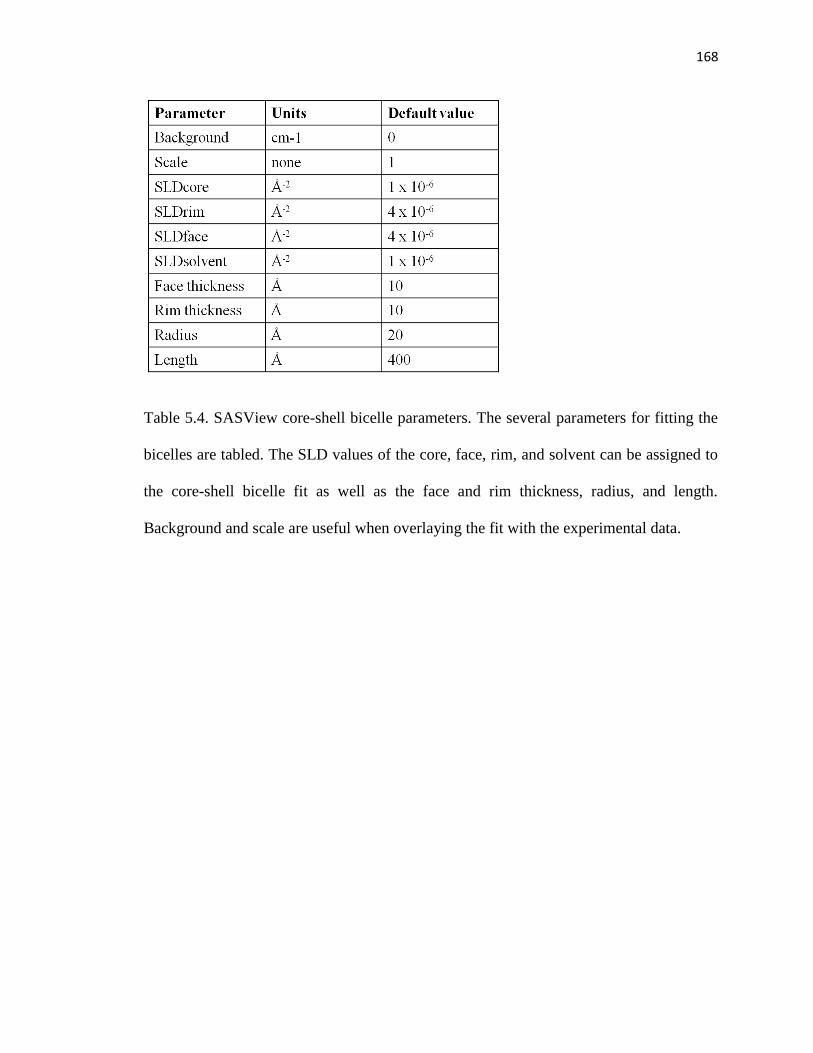
168
Table 5.4. SASView core-shell bicelle parameters. The several parameters for fitting the
bicelles are tabled. The SLD values of the core, face, rim, and solvent can be assigned to
the core-shell bicelle fit as well as the face and rim thickness, radius, and length.
Background and scale are useful when overlaying the fit with the experimental data.

169
molecule and the molecular volume. Therefore, H2O has a smaller SLD (-5.61 x 10⁻⁷
Å-2
)
than D2O (6.33 x 10⁻⁶
Å-2
). Table 5.2 is a table representing all of the SLD values given
to the different experimental solvents.
The face and rim SLDs of the d54-DMPC/DHPC bicelles were determined by
assuming a uniform phosphocholine head group shell around the entire bicelle. To
determine the SLD of the face and rim shells with Eqn. 8, the chemical composition of
the head group (C8H14NOP) was used to estimate the sum of the scattering lengths. The
density of the phosphocholine head group was determined at 1.69 g/cm3 by estimating the
molecular weight and head group volume; this density was used to determine the
molecular volume. The SLD of the phosphocholine head group was estimated with these
values at 2.21 x 10⁻⁶
Å-2
. Preliminary fits of the scattering data constrained the face SLD
and rim SLD to ± 1.0 x 10⁻⁶
Å-2
to get an initial size and shape of the bicelles. As the fits
were refined, this wide range of SLDs was narrowed significantly.
The core SLD was determined using the d54-DMPC and DHPC tail SLDs. Both
tail SLDs were estimated similarly to the SLD of the phosphocholine head groups, using
the molecular volume and the chemical composition. The SLD of d54-DMPC tails is 6.91
x 10-6
Å-2
and the SLD of the DHPC tails is -4.65 x 10⁻⁷
Å-2
. Because of the unknown
degree of mixing between the d54-DMPC and DHPC molecules, preliminary bicelle fits
were completed allowing this wide range of core SLD values. As the fits improved, the
core SLDs of the bicelles were refined.
5.3.3. Systematic generation of bicelle fits
5.3.3.1. Preliminary q = 0.3 bicelle fits

170
Preliminary q = 0.3 bicelle fits contained the fit parameters outlined in Table 5.5.
The initial fits allowed for a wide range of core SLDs, compensating for possible mixing
between the deuterated and hydrated tails. The fits also had a wide range of face and rim
SLDs (2.21 ± 1 x 10⁻⁶
Å-2
) and bicelle size dimensions. The face and rim thickness was
allowed to vary between 5 and 10 Å, the length from 40 to 100 Å, and the radius ranged
from 20 to 35 Å. These preliminary fits were generated for two purposes: 1) gain
familiarity with the software, and 2) to get an idea of the size and shape of the bicelle
without over-constraining the fits.
With widely ranged parameters, trends were identified with initial q = 0.3 bicelle
fits in 0, 20, 60, 80, and 100% D2O solvent (Figure 5.7 and Table 5.6). The fits suggested
a face and rim thickness of 6.5 to 8 Å, a radius between 20 and 30 Å, and a length that
varied from 30 to 60 Å. These values were reasonable, given the dimensions of a
phosphocholine head group size and the lengths of the DMPC tails; however, the wide
values for the core SLD required more constraining to confirm the fit and size
dimensions.
Scattering experiments explore systems in reciprocal space, and the scattering
vector, Q, can act as an inverse yard stick. Thus, low-Q scattering data relates to large
structures and aggregates while high-Q data represents shorter distances. To monitor this
inverse relationship, plots of the face/rim thickness vs. radius, face/rim vs. length, and
radius vs. length were generated using the preliminary q = 0.3 bicelle fits (Figure 5.8). As
expected, alterations in larger bicelle dimensions, such as length and radius, resulted in
vast changes in the low-Q domain of the fits. Differences in the radius also affected the
fits in the mid-Q range, specifically the slope in that region. Changes in the shorter

171
Table 5.5. Four generations of core-shell bicelle fit constrained parameters. Initial bicelle
fits were generated with q = 0.3 bicelles and wide ranges for the SLDs and size
dimensions. As the fits improved, narrowed restraints were placed on the bicelle
parameters to obtain uniform SLDs and constrained dimensions to compare with other q-
ratios.
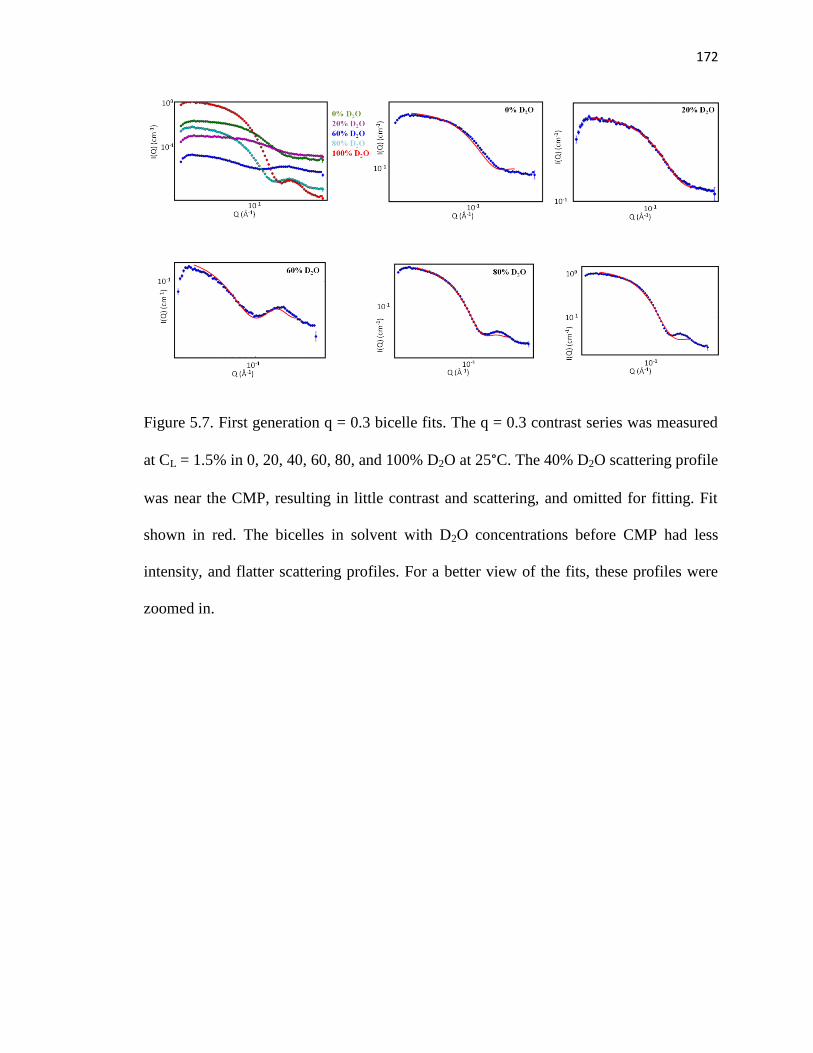
172
Figure 5.7. First generation q = 0.3 bicelle fits. The q = 0.3 contrast series was measured
at CL = 1.5% in 0, 20, 40, 60, 80, and 100% D2O at 25°C. The 40% D2O scattering profile
was near the CMP, resulting in little contrast and scattering, and omitted for fitting. Fit
shown in red. The bicelles in solvent with D2O concentrations before CMP had less
intensity, and flatter scattering profiles. For a better view of the fits, these profiles were
zoomed in.

173
Table 5.6. First generation q = 0.3 bicelle fits. The q = 0.3 bicelles in varying D2O
concentrations were analyzed with the core-shell bicelle fit (Figure 5.8). Because of the
wide range of SLDs allowed for the SLD core, the SLDcore differs greatly between the q
= 0.3 samples. The 1st generation fits identified starting values for the face and rim
thickness, radius, and length.

174
Figure 5.8. Preliminary bicelle fits plotted in respect to radius vs. length. Bicelle
scattering data was collected with q = 0.3 bicelles in 100% D2O at CL = 1.5% (w/v) at 25°
C. With the face and rim thickness at 7.5 Å, the radius and length were varied to monitor
how each parameter contributes to the fit to the data. Face and rim thickness contribute to
changes in the high-Q, while radius and length differences greatly impact the mid to low-
Q range. The best fit to the data is boxed.

175
distances of the face and rim did not have a significant effect on the fits generated as
expected, only producing minor high-Q alterations. Understanding how each dimension
contributes to the bicelle model fits is important when refining and constraining this data.
5.3.3.2. Second and third generation fits of q = 0.3 bicelles
Because the preliminary fit bicelle parameters contained wide ranges and allowed
for a wealth of bicelle sizes, further constraints were put on the parameters to enable a
more accurate depiction of the d54-DMPC/DHPC bicelles (Table 5.5). These constraints
were modified a total of 4 times before achieving reliable fits. Therefore, there are 4
generations of bicelle fits that can be followed to understand the methodological process
in SANS data fitting. The final parameter values are shown in Table 5.5 in comparison
with the initial constraints.
The second and third fit generations resulted in a narrowing of the face and rim
SLDs from the original 2.21 ± 1 x 10⁻⁶
Å-2
to 2.5 and 2.1 ± 0.3 x 10⁻⁶
Å-2
, respectively.
The core SLD kept its wide range, representing the unknown amount of mixing between
the fully hydrogenated detergents and fully deuterated lipid tails. The face and rim
thickness range was widened from 7.5 ± 2.5 Å to 5.5 ± 4.5 Å, to accommodate a thinner
head group shell indicated by the experimental data fits. The radius values were lowered
and the range extended; preliminary fits restricted the radius to 27.5 ± 7.5 Å and 3rd
generation fits allowed radii to extend to 20 ± 15 Å. Bicelle length range also widened
significantly, extending from 70 ± 30 Å to 55 ± 45 Å. Changes in the bicelle parameters
represent the exploration of a possibly smaller structure than what was originally
observed with preliminary fits.

176
5.3.3.3. Final generation bicelle fits
To significantly narrow the range used for the core SLD, the value was calculated
using the mole fraction of the deuterated and hydrated tail SLDs with the following
formula:
SLDχ = (χ(SLDdeut.tails)) + ((1-χ)(SLDhyd.tails))
The core SLDs of the q = 0.3 bicelles was calculated at 1.75 x 10⁻⁶
Å-2
and the q = 0.7
bicelles were estimated similarly, equaling 4.74 x 10⁻⁶
Å-2
. These values were set as
invariable parameters (Table 5.5).
The face and rim SLDs were set to an unchanging 2.1 x 10⁻⁶
Å-2
. This value was
correlates with the expected SLD of a phosphocholine head group. The face and rim
thickness was ultimately restrained to 4.80 ± 0.75 Å, almost the size of a phosphocholine
head group shell thickness (~ 3 Å). The radius was restricted to 20 ± 5 Å, and the length
increased with q-ratio from 24 to 70 ± 4 Å for q = 0.3 and 0.7, respectively. This trend in
increased bicelle length with q-ratio will be further explored in Section 5.2.4. All of these
values were converged upon during previous fits and emphasizes the importance of
conducting systematic SAS data fitting for accurate size and shape values.
5.3.4. Results: SANS-determined bicelle dimensions
SANS scattering profiles for the CL = 1.5%, q = 0.3 and q = 0.7 bicelles fit
relatively well using the core-shell bicelle fit (Figure 5.9 and 10). Bicelle samples in
solvents with 40 to 70% D2O were omitted for a few bicelles systems. Depending on q-
ratio, these D2O concentrations in solvent are near the entire bicelle CMP, and there is

177
Figure 5.9. Small angle neutron scattering profiles of q = 0.3 DMPC/DHPC bicelles.
Contrast variation experiments were conducted on d54-DMPC/DHPC bicelles at q = 0.3,
CL = 1.5% (w/v), 25°C at varying solvent D2O percentages. 40% and 60% D2O scattering
profiles were omitted due to lack of scattering near the contrast match point (40.4%
D2O). (A) SANS contrast variation of d54-DMPC/DHPC bicelles in solvents with 0%,
20%, 80%, and 100% D2O. (B-E) Experimental profiles at varying solvent D2O
concentrations (black) were analyzed with the core-shell bicelle fit (red) at 0.021 < Q <
0.21 for determination of the sizes and dimensions of the detergent-rich complexes.

178
Figure 5.10. Small angle neutron scattering profiles of q = 0.7 DMPC/DHPC bicelles.
Contrast variation experiments were conducted on d54-DMPC/DHPC bicelles at q = 0.7,
CL = 1.5% (w/v), 25°C at varying solvent D2O percentages. 50% and 70% D2O scattering
profiles were omitted due to lack of scattering near the contrast match point (56.0%
D2O). (A) SANS contrast variation of d54-DMPC/DHPC bicelles in solvents with 0%,
10%, 30%, 90%, and 100% D2O. (B-F) Experimental profiles at varying solvent D2O
concentrations (black) were analyzed with the core-shell bicelle fit (red) at 0.021 < Q <
0.21 for determination of the sizes and dimensions of the lipid-rich complexes.

179
minimal scattering to fit. All of the bicelles were analyzed at a low-Q of 0.021 Å-1
to a
high-Q of 0.21 Å-1
.
Bicelle data before the CMP (40.4% and 56.0% D2O for q = 0.3 and 0.7) are
characterized by a smooth curve with a negative slope that flattens out at high Q. This
curve is indicative of a spherical or elliptical globular structure. Data after the CMP is
characterized by a sharp negative slope at low to mid-Q and second maxima in the high-
Q. This difference in lineshape is indicative of a shell structure. The changes in scattering
profiles with D2O concentration are expected. With low D2O concentration in the solvent,
the DHPC tails and all of the PC head groups are matched out, and the only contrast
observed derives from the deuterated lipid core. This core would adopt a more spherical
or ellipsoidal geometry. At higher solvent D2O concentrations, the deuterated lipid core
would be matched out; scattering would only represent the PC head group shell and the
DHPC detergent rim, and this will result in a shell-like pattern in the scattering profile
(Figure 5.4).
The core-shell bicelle model fits the experimental data relatively well. The model
fits the low-Q data better than the high-Q data. The high-Q region depicts more features
indicative of the curvature and shell structure and shorter distances. The core-shell bicelle
model is a derivative of the cylinder model while the complex studied likely has more
curvature. Therefore, these differences in high-Q fit between the data and model are
reasonable.
Error for these fits are determined by identifying the best fit to the scattering
profiles, followed by changing the parameters slightly to identify how far the fit can be
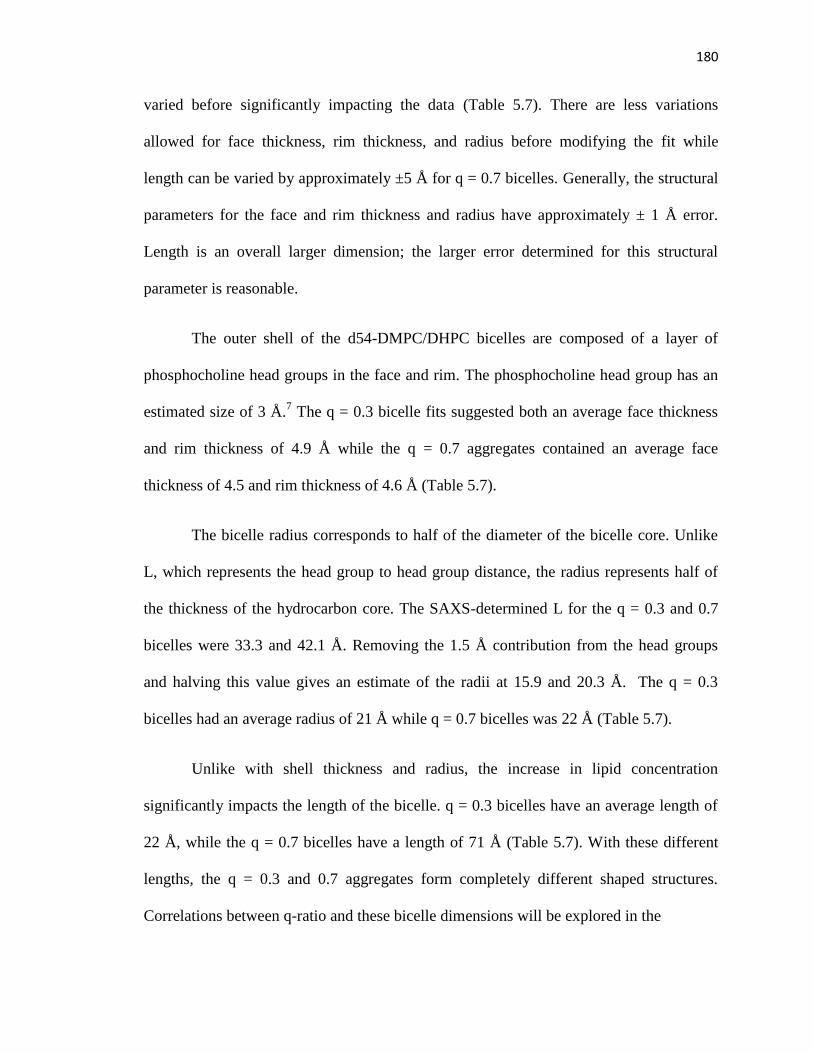
180
varied before significantly impacting the data (Table 5.7). There are less variations
allowed for face thickness, rim thickness, and radius before modifying the fit while
length can be varied by approximately ±5 Å for q = 0.7 bicelles. Generally, the structural
parameters for the face and rim thickness and radius have approximately ± 1 Å error.
Length is an overall larger dimension; the larger error determined for this structural
parameter is reasonable.
The outer shell of the d54-DMPC/DHPC bicelles are composed of a layer of
phosphocholine head groups in the face and rim. The phosphocholine head group has an
estimated size of 3 Å.7 The q = 0.3 bicelle fits suggested both an average face thickness
and rim thickness of 4.9 Å while the q = 0.7 aggregates contained an average face
thickness of 4.5 and rim thickness of 4.6 Å (Table 5.7).
The bicelle radius corresponds to half of the diameter of the bicelle core. Unlike
L, which represents the head group to head group distance, the radius represents half of
the thickness of the hydrocarbon core. The SAXS-determined L for the q = 0.3 and 0.7
bicelles were 33.3 and 42.1 Å. Removing the 1.5 Å contribution from the head groups
and halving this value gives an estimate of the radii at 15.9 and 20.3 Å. The q = 0.3
bicelles had an average radius of 21 Å while q = 0.7 bicelles was 22 Å (Table 5.7).
Unlike with shell thickness and radius, the increase in lipid concentration
significantly impacts the length of the bicelle. q = 0.3 bicelles have an average length of
22 Å, while the q = 0.7 bicelles have a length of 71 Å (Table 5.7). With these different
lengths, the q = 0.3 and 0.7 aggregates form completely different shaped structures.
Correlations between q-ratio and these bicelle dimensions will be explored in the

181
Table 5.7. Final d54-DMPC/DHPC bicelle dimensions. Q = 0.3 and 0.7 bicelle sizes
determined with the core-shell bicelle fitting using constrained core, face, and rim SLD
values in varying solvent D2O concentrations.

182
following discussion section along with implications for the ideal bicelle model.
5.4. Discussion
5.4.1. Dimensions of detergent-rich bicelles
The q = 0.3 and 0.7 bicelles have similar head group shell thicknesses and radii.
The face and rim thicknesses of these two aggregates are approximately 4.7 Å. This value
corresponds well with the 3 Å thickness of a phosphocholine head group. The radii of
both bicelles are 21 to 22 Å, relating with what is expected for half of the thickness of a
DMPC bilayer (~ 21 Å). An increase in q-ratio does not impact the radii and shell
thickness, according to the equivalent values for these dimensions. However, the addition
of lipids to these detergent-rich systems significantly impacts the length of the bicelles,
affecting the overall bicelle shape of the bicelles.
With a length of approximately 22 Å and a radius of 18 Å, the q = 0.3 bicelles
form a shape far different than what is expected of an ideal bicelle. The q = 0.3 bicelle
structure has an ellipsoidal shape, with dimensions similar to a DHPC micelle (Rg = 25
Å). In contrast, the q = 0.7 aggregate adopts a more bicellar shape, with its 22 Å radius
and 71 Å length. This q = 0.3 and 0.7 data suggests remarkable implications for bicelle
formation: 1) the transition from mixed micelle to bicelle with increasing q-ratio occurs
with an increase in the structure length, and 2) the ideal model does not adequately
represent these low-q bicelles.
The transition to bicellar structures occurring predominantly with the bicelle
length suggests that the lipids added to the system partition into the DMPC bilayer,
expanding the aggregate size from the core while retaining the shell thickness and radii

183
sizes (Figure 5.11). This is expected; the change in the length of bicelles as lipid
concentration is altered has been mentioned in the literature. Vold and Prosser reported
the increase in bicelle size with q-ratio in 1996, and this observation was later confirmed
with dynamic light scattering by other researchers.8,9
However, the experimental data
suggests that the q = 0.3 and 0.7 aggregates are not expanding from smaller to larger
bicelles, but are transitioning from mixed micelle to bicelle. This implication contradicts
the ideal bicelle model.
The ideal model implies that lipid and detergent mixtures at any q-ratio forms
bicelles with completed separated bilayer and rim domains. The data presented in this
thesis suggests otherwise for several reasons. First, SANS profiles of the q = 0.3 bicelles
demonstrate that low-q bicelles have an ellipsoidal micelle structure and as q-ratio is
increased, the aggregates adopt a bicelle structure. These micelle-like aggregates do not
contain the bilayer domain that is predicted by the ideal bicelle model. Second, the SAXS
profiles of the q = 0.1 to 0.5 bicelles are very different with each incremental addition of
lipid, suggesting that there is some degree of mixing between the DMPC and DHPC.
Even at low q-ratios, the SAXS profiles of ideal bicelles would have the same L, and
subsequently Qmax, indicative of the 42 Å DMPC bilayer thickness, but the
experimentally determined Qmax and L are different for each q-ratio. Third, the SANS
data was fitted using a core SLD of a mixed complex. The goodness of the fits with this
mixed SLD further suggests that there is mixing of the lipid and detergent components in
solution. To monitor the structure and arrangement of the detergent-rich bicelles,
molecular dynamic simulations in conjunction with experimental studies have been
pursued.
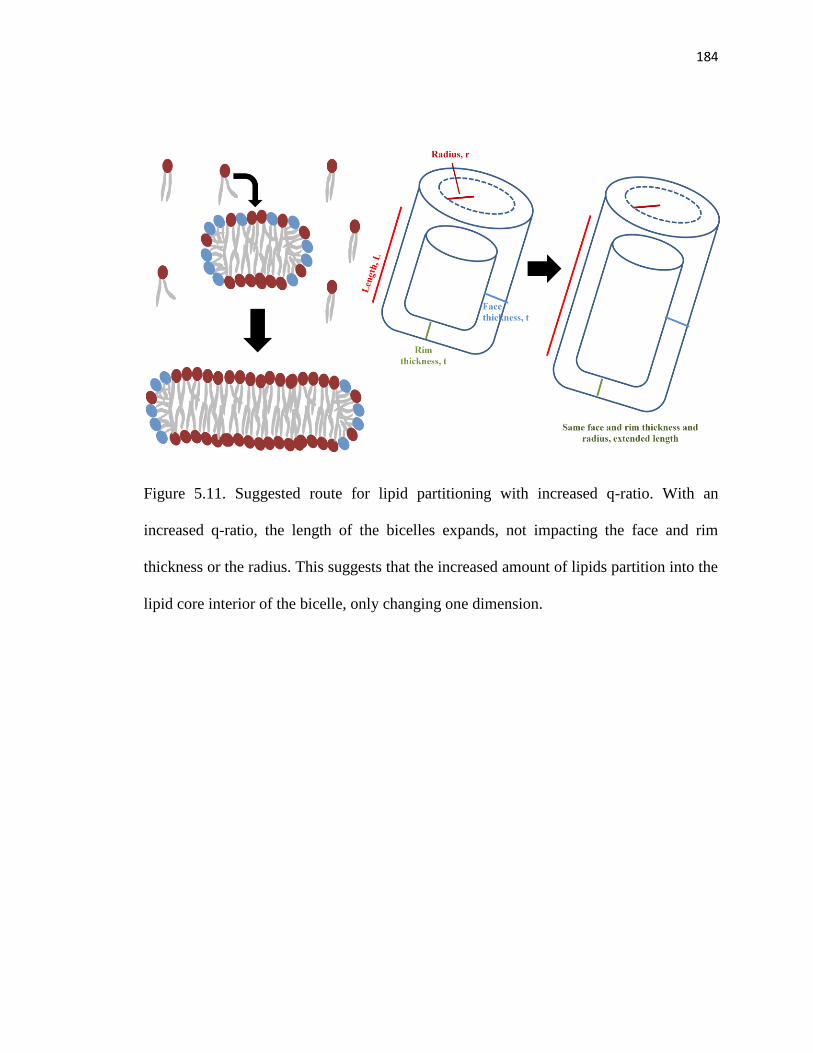
184
Figure 5.11. Suggested route for lipid partitioning with increased q-ratio. With an
increased q-ratio, the length of the bicelles expands, not impacting the face and rim
thickness or the radius. This suggests that the increased amount of lipids partition into the
lipid core interior of the bicelle, only changing one dimension.

185
5.4.2. Utilizing molecular dynamics simulations to observe low-q bicelles
To get a better understanding of the size and shape of these detergent-rich
bicelles, collaborators Svetlana Baoukina and Peter Tieleman at the University of Calgary
generated molecular dynamic (MD) simulations of the DMPC/DHPC bicelles at q = 0.3
and 0.7 (Figure 5.12). The bicelles were simulated over 1 μs with Gromacs v.4.6.5., in a
hydration level of 400 water molecules per amphiphile, and a CL of 100 mM, or 9%
(w/v). The simulations added the bulk q-ratio of lipids and detergents in a box to generate
the aggregates. These simulations were confirmed to have similar sizes to the
experimental bicelles, and therefore, provide an accurate image of actual detergent-rich
bicelles.
5.4.3. Bulk q-ratio vs. actual bicelle q-ratio
An interesting finding from the MD-simulated bicelles focuses on the actual q-
ratios in the bicelle vs. the bulk q-ratio in solution. The generated q = 0.3 and 0.7 bicelles
had different lipid-to-detergent concentrations than the bulk q-ratio in solution (Table
5.8). Although the appropriate ratio of lipids and detergents were added to the MD
simulations, 100% of the bicelle components did not interact to form q = 0.3 and 0.7
bicelles. The complexes formed had different q-ratios, designated q*. The q = 0.3
bicelles had q*-ratios of 0.30 and 0.32 while the q = 0.7 simulated bicelles had a q* =
0.76 and 0.92. Atomic structures of the q* = 0.30 and 0.32 suggested a mixed micelle
shape unlike the q* = 0.76 and 0.92 bicelle-like complexes. This correlates well with the
structures observed with the SAXS and SANS data. This discovery implies

186
Figure 5.12. Simulated DMPC/DHPC bicelles at q-ratios of 0.3 and 0.7. Gromacs v.
4.6.5. was utilized to generate q = 0.3 and 0.7 bicelles at CL = 9% (w/v)Although the
appropriate q-ratio of lipids and detergents were added to the simulation box, these
bicelles formed with slightly different q-ratios, designated q*.

187
Table 5.8. Bicelle dimensions determined from the atomic MD-simulated bicelles. The
simulated complexes at q = 0.3 and 0.7 formed structures with slightly different q-ratios
than the bulk q-ratio introduced to the system. The q-ratios of these generated bicelles are
denoted with q*. An ellipsoid fit of the complexes to the atomic data was used to
calculate the Rg, shell thicknesses, radii, and lengths from averages over 10 time frames.
188
that the mimics designed by researchers may actually be structurally different than
expected.
5.4.4. Dimensions of the simulated bicelles correlate well with experimental data
Before confirming that the MD-simulated bicelles were an accurate depiction of
the low-q bicelles, several steps were taken to ensure that these generated bicelles
represent similar sizes and shapes of the experimental aggregates. The sizes of the
bicelles were determined using calculations from the atomic structures (Table 5.8) as well
as CRYSOL and CRYSON programs in the ATSAS software package.
CRYSOL and CRYSON generate SAXS and SANS profiles from the atomic
PDB files of the simulated bicelles (Figure 5.13 and 5.14). These profiles were analyzed
similarly to the SAXS and SANS data. Guinier analysis and qmax determination of the
generated SAXS profiles measured the Rg and L of the aggregates while core-shell
bicelle model fitting of the generated SANS profiles identified the face and rim thickness,
radius, and length. The Rg and L of the aggregates have similar trends as the SAXS data
(Table 5.9). Considering the error in the experimental data, preliminary CRYSON-
generated SANS profiles of the q = 0.7 bicelles also correlate with the SANS results, with
a shell thickness of approximately 5 Å, radius of 17 Å, and length of 73 Å (Table 5.9).
Although the bicelle sizes are not identical with the experimental results, the
differences in the computational and experimental methods must be considered. The
bicelles used for the computational studies had a total amphiphile concentration of 9%
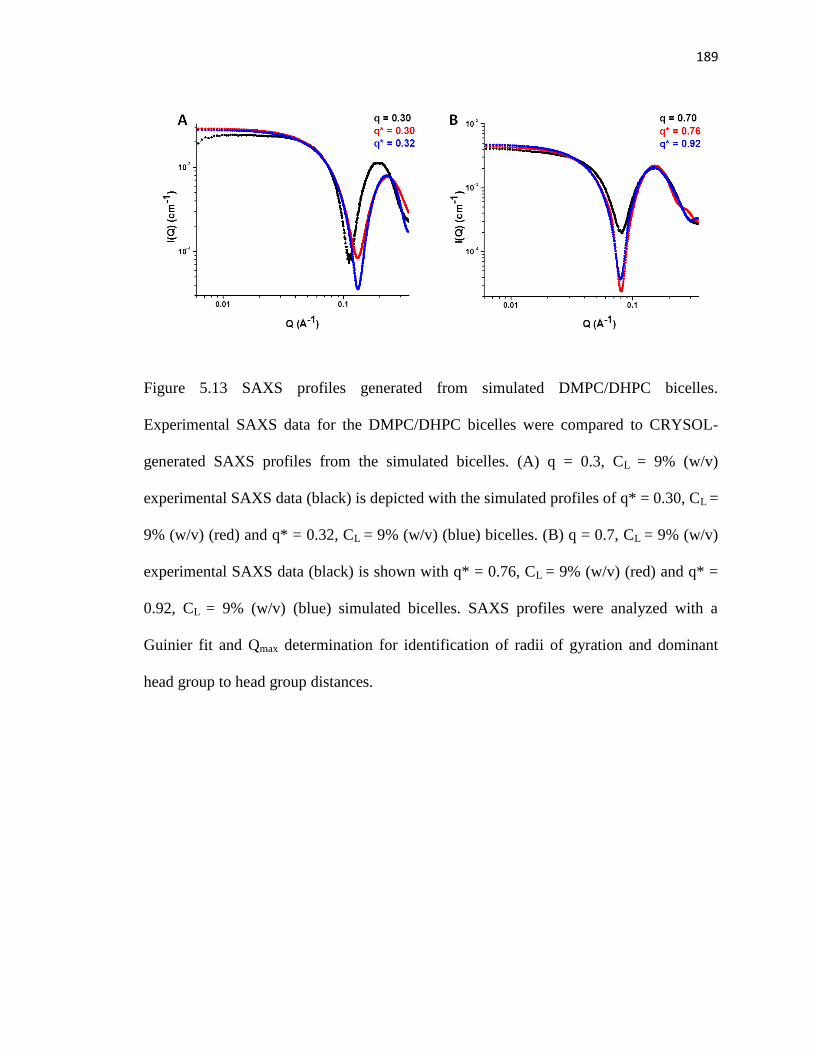
189
Figure 5.13 SAXS profiles generated from simulated DMPC/DHPC bicelles.
Experimental SAXS data for the DMPC/DHPC bicelles were compared to CRYSOL-
generated SAXS profiles from the simulated bicelles. (A) q = 0.3, CL = 9% (w/v)
experimental SAXS data (black) is depicted with the simulated profiles of q* = 0.30, CL =
9% (w/v) (red) and q* = 0.32, CL = 9% (w/v) (blue) bicelles. (B) q = 0.7, CL = 9% (w/v)
experimental SAXS data (black) is shown with q* = 0.76, CL = 9% (w/v) (red) and q* =
0.92, CL = 9% (w/v) (blue) simulated bicelles. SAXS profiles were analyzed with a
Guinier fit and Qmax determination for identification of radii of gyration and dominant
head group to head group distances.

190
Figure 3.14. SANS profiles generated from simulated DMPC/DHPC bicelles. (A)
Experimental SANS data for DMPC/DHPC bicelles at q = 0.7, CL = 9% (w/v) (black) are
depicted with CRYSON-generated SANS profiles from the simulated bicelles at q* =
0.76, CL = 9% (w/v) (red) and q* = 0.92, CL = 9% (w/v) (blue). (B and C) SANS profiles
of the q* = 0.76 and q* = 0.92 bicelles (black) were fit with the core-shell bicelle model
(red) to determine structural parameters of the simulated bicelles

191
Table 5.9. Bicelles dimensions determined from SAXS and SANS profiles of simulated
complexes. SAXS and SANS profiles of the simulated bicelles, with q-ratios denoted q*,
were generated with CRYSOL and CRYSON, respectively. Rg and L of the SAXS
profiles were determined with Guinier analysis and using the position of the 2nd
maximum, Qmax. Core-shell bicelle model fits of the generated q* = 0.76 and 0.92 SANS
data were used to determine structural parameters of the q = 0.7 DMPC/DHPC
complexes.

192
(w/v) while the experimental bicelles had a concentration of 1.5% (w/v). This 10-fold
difference in amphiphile concentrations can impact the comparison between the two
methods. Therefore, comparing the sizes directly is useful, but monitoring the trends with
the two bicelle complexes may also provide helpful information. However, with the
disadvantages, the MD-simulated bicelles provide a reliable depiction of the low-q
bicelles. The trends provided from these simulations can be trusted to reflect the actual
systems.
5.4.5. Detergent-rich bicelles are mixed systems that contradict the ideal bicelle model
The MD-generated bicelles reflect the experimental data well. With that, the
simulated bicelles also give a second confirmation that the ideal bicelle model does not
represent detergent-rich bicelles. The simulated bicelles contain well-mixed DMPC and
DHPC components. Because this well-mixed simulated complex correlates well with the
experimental data, this suggests that the experimental bicelles formed by these mixtures
are also mixed systems. Also, the SANS contrast variation experiments were well fit with
the core-shell bicelle model using a core SLD of a mixed system. The goodness of the fits
with this mixed core SLD also suggests that there is a more mixed arrangement of the
bicelle components.
In addition to the mixed composition, SAXS, SANS, and MD data suggest that
the q = 0.3 bicelles have an ellipsoid micelle-like structure that transitions into a more
bicelle arrangement with an increase in lipid concentration. This contradicts the bicelle
model that insists that the complex has bicellar features throughout the low and high q-

193
ratios. By using a combination of experimental and theoretical methods, the structure and
composition of low-q bicelles has been well-investigated.
5.5. Closing remarks and future directions
This analysis of the SAXS and SANS scattering data in conjunction with MD
simulations demonstrate that the size and shape of bicelles are largely dependent on the
q-ratio, and unlike the ideal bicelle model, detergent-rich bicelles form mixed micelle
structures. Preliminary SAXS data showed a transition from mixed micelle to bicelle with
a q = 0.1 to 0.5 which was supported with neutron scattering data. By increasing the q-
ratio of these systems, more lipids partition into the DMPC bicelle core, extending the
overall length of the structure while retaining the same shell thickness and radius. These
results correlate well to literature reported on these detergent-rich aggregates. MD and
core-shell bicelle model fitting suggest that lipid and detergent domains of the bicelle
have a higher degree of mixing than predicted with the ideal bicelle model, especially in
highly detergent-rich bicelles. Because bicelles are increasingly popular in membrane
protein research, confirming of the size and shape of these detergent-rich structures will
enable researchers to make better choices when selecting an appropriate membrane
mimic for their membrane protein.
To further monitor the transition from mixed micelles to bicelles, experimental
and theoretical pursuits to elucidate the q = 0.5 bicelle structure is in progress. q = 0.5 is
the q-ratio in which the bicelles first adopt the bicelle structure. Therefore, elucidating the
structure of q = 0.5 is challenged with SANS profiles that may represent a hybrid of
micelle and bicelle structure. Preliminary fits of the q = 0.5 bicelles suggests similar shell
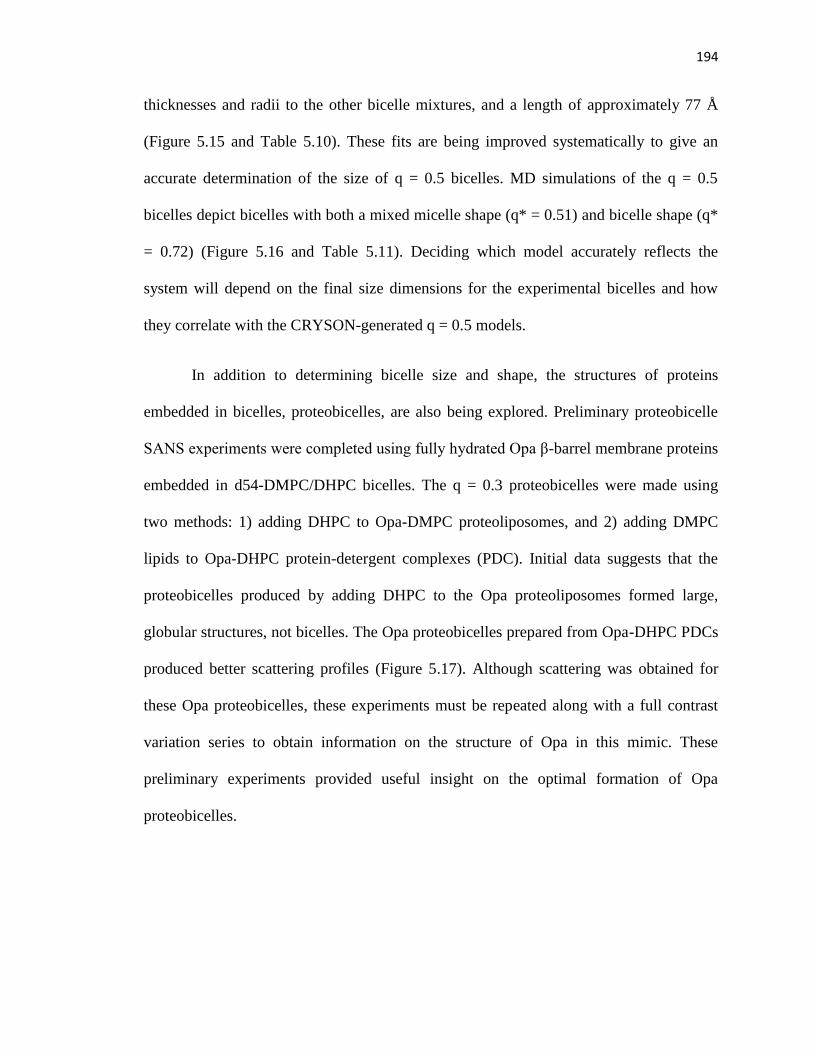
194
thicknesses and radii to the other bicelle mixtures, and a length of approximately 77 Å
(Figure 5.15 and Table 5.10). These fits are being improved systematically to give an
accurate determination of the size of q = 0.5 bicelles. MD simulations of the q = 0.5
bicelles depict bicelles with both a mixed micelle shape (q* = 0.51) and bicelle shape (q*
= 0.72) (Figure 5.16 and Table 5.11). Deciding which model accurately reflects the
system will depend on the final size dimensions for the experimental bicelles and how
they correlate with the CRYSON-generated q = 0.5 models.
In addition to determining bicelle size and shape, the structures of proteins
embedded in bicelles, proteobicelles, are also being explored. Preliminary proteobicelle
SANS experiments were completed using fully hydrated Opa β-barrel membrane proteins
embedded in d54-DMPC/DHPC bicelles. The q = 0.3 proteobicelles were made using
two methods: 1) adding DHPC to Opa-DMPC proteoliposomes, and 2) adding DMPC
lipids to Opa-DHPC protein-detergent complexes (PDC). Initial data suggests that the
proteobicelles produced by adding DHPC to the Opa proteoliposomes formed large,
globular structures, not bicelles. The Opa proteobicelles prepared from Opa-DHPC PDCs
produced better scattering profiles (Figure 5.17). Although scattering was obtained for
these Opa proteobicelles, these experiments must be repeated along with a full contrast
variation series to obtain information on the structure of Opa in this mimic. These
preliminary experiments provided useful insight on the optimal formation of Opa
proteobicelles.
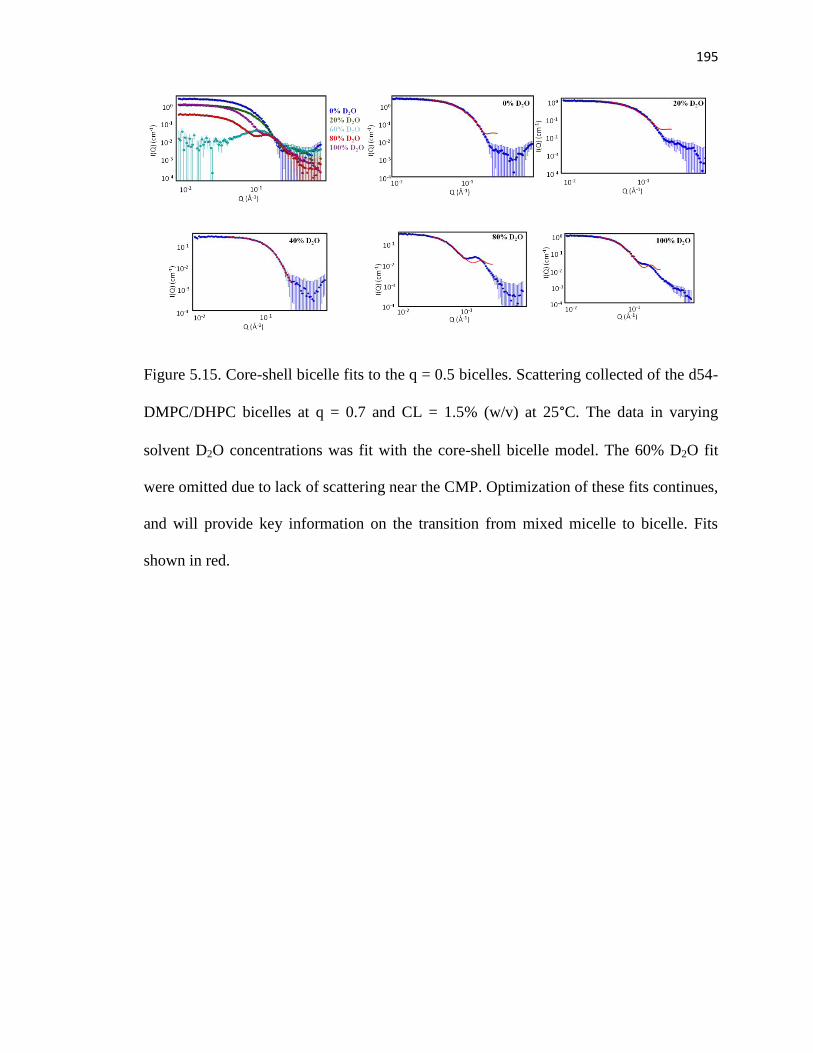
195
Figure 5.15. Core-shell bicelle fits to the q = 0.5 bicelles. Scattering collected of the d54-
DMPC/DHPC bicelles at q = 0.7 and CL = 1.5% (w/v) at 25°C. The data in varying
solvent D2O concentrations was fit with the core-shell bicelle model. The 60% D2O fit
were omitted due to lack of scattering near the CMP. Optimization of these fits continues,
and will provide key information on the transition from mixed micelle to bicelle. Fits
shown in red.
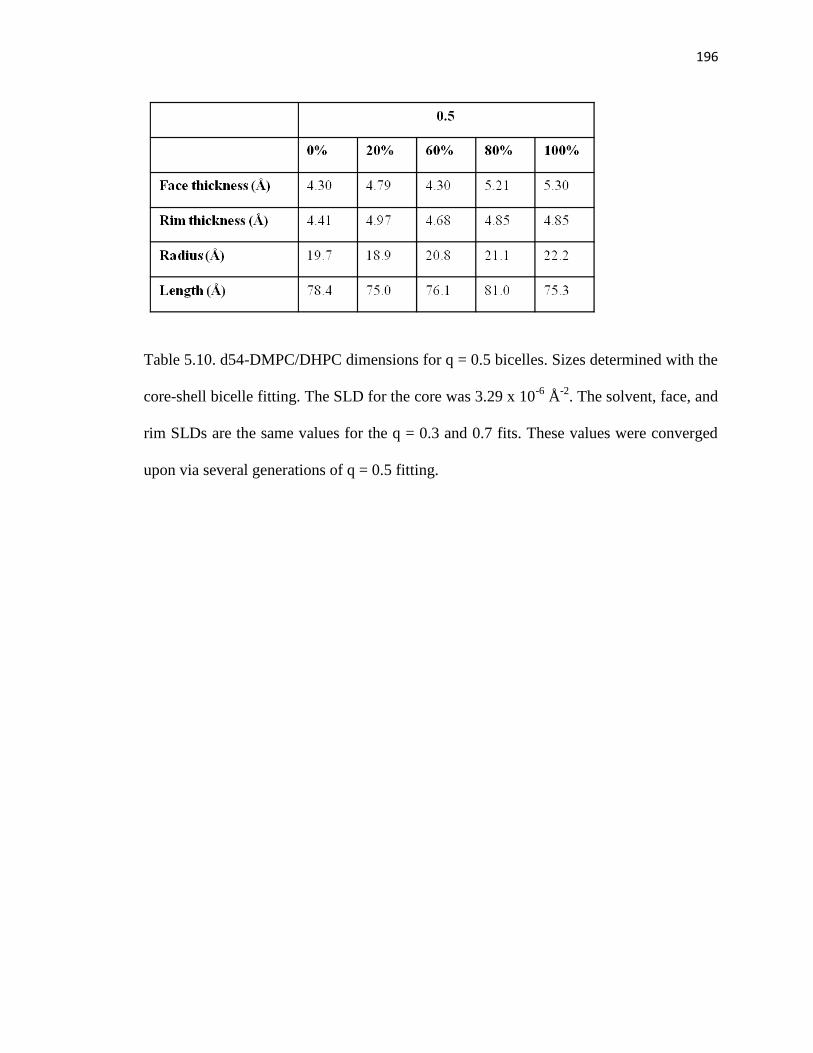
196
Table 5.10. d54-DMPC/DHPC dimensions for q = 0.5 bicelles. Sizes determined with the
core-shell bicelle fitting. The SLD for the core was 3.29 x 10⁻⁶
Å-2
. The solvent, face, and
rim SLDs are the same values for the q = 0.3 and 0.7 fits. These values were converged
upon via several generations of q = 0.5 fitting.
197
Figure 5.16. Simulated DMPC/DHPC bicelle at q = 0.5. Although the appropriate bulk q-
ratio of lipids and detergents were added to the simulation, these bicelles formed with
different structures with varying q-ratios, designated q*.

198
Table 5.11. Size and shape of MD-simulated q = 0.5 bicelles. CL = 9% (w/v), q = 0.5
bicelles were simulated twice over 1 μs. The two q = 0.5 simulated bicelles had different
q*-ratios, representing two different structures. SAXS profiles of the simulated bicelles
were generated with CRYSOL to determine the Rg and L.
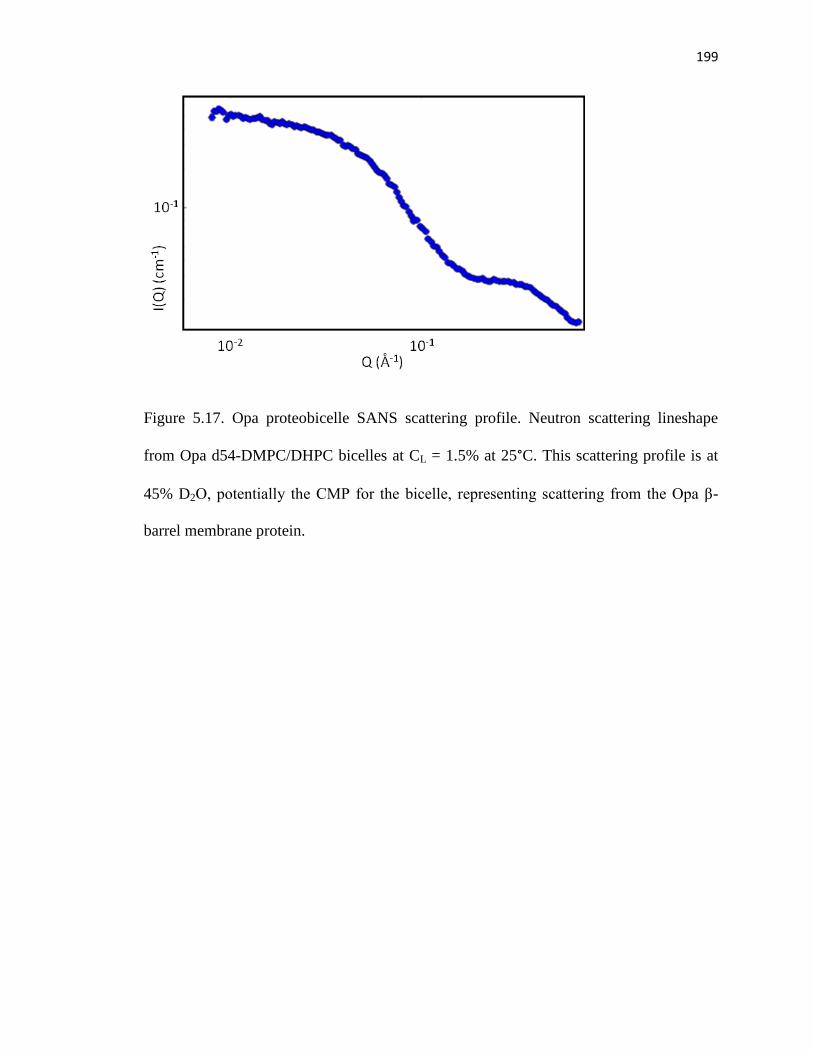
199
Figure 5.17. Opa proteobicelle SANS scattering profile. Neutron scattering lineshape
from Opa d54-DMPC/DHPC bicelles at CL = 1.5% at 25°C. This scattering profile is at
45% D2O, potentially the CMP for the bicelle, representing scattering from the Opa β-
barrel membrane protein.
200
5.6. Methods
5.6.1. Sample preparation
1,2-dihexanoyl-sn-glycero-3-phosphocholine (DHPC), 1,2-dimyristoyl-sn-
glycero-3-phosphocholine (DMPC), 1,2-dimyristoyl-d54-sn-glycero-3-phosphocholine
(d54-DMPC), and 1,2-didecanoyl-sn-glycero-3-phosphocholine (diC10PC) were
purchased from Avanti Polar Lipids. D2O was purchased from Cambridge Isotope Labs
and all other chemicals were obtained from Fisher, unless otherwise noted.
DMPC/DHPC bicelles were prepared by resuspending DMPC with sodium
phosphate buffer containing DHPC to a total amphiphile concentration of 1.5% (w/v).
Three lipid:detergent q-ratios of 0.3, 0.5, and 0.7 were used in these experiments. Freeze-
thaw cycles and vortexing was used until the solutions were clear at room temperature.
Each sample was divided in half. One half was dialyzed in H2O phosphate buffer with 7
mM DHPC and the other half was dialyzed in D2O phosphate buffer with 7 mM DHPC.
The post-exchange buffer was collected for buffer subtraction. Titration of these two
samples was used to produce the ratios of D2O and H2O needed for SANS contrast
variation experiments. Final buffers for all samples consisted of 10 mM phosphate, pH
6.6, and the appropriate D2O/H2O ratio for contrast variation.
Opa proteobicelles were produced with two methods. The first method was
preparing Opa proteobicelles from Opa PDCs. This involved refolding 2.25 mg denatured
Opa into refolding buffer (20 mM sodium phosphate, pH 8.0, 500 mM NaCl) with FC12
detergent for 5 days, immobilizing the refolded protein onto a Co2+
immobilized metal
ion affinity (IMAC) column, and exchanging the FC12 detergent with DHPC via washing

201
the column with three column volumes of wash buffer (20 mM sodium phosphate, pH
7.8, 150 mM NaCl, 20 mM imidazole) with excess DHPC, and eluting with elution buffer
(20 mM sodium phosphate, pH 7.0, 150 mM NaCl, 680 mM imidazole) with DHPC. The
Opa-DHPC PDC was dialyzed for 1 hour to remove excess imidazole and the DHPC
concentration was determined using 1-D 1H NMR. solid d54-DMPC lipid was added to
Opa-DHPC bicelles to obtain a CL of 1.5% and a q-ratio of 0.3.
Opa proteobicelles prepared from Opa proteoliposomes involved adding 4.5 mg
denatured Opa to diC10PC liposomes in borate buffer (20 mM sodium borate, 20 mM
boric acid, 0.5 M EDTA), incubating at 37°C for 3 days, centrifuging the solution at
142,400 x g for 2 hours at 10°C, and resuspending the pellet with d54-DMPC in
resuspension buffer (30 mM Tris, pH 7.3, 150 mM NaCl). The Opa protein and
deuterated lipids were pulse-sonicated for 20 min with 30 s on/off cycles. The appropriate
amount of DHPC was added to the Opa proteoliposomes to obtain a CL of 1.5% and a q-
ratio of 0.3.
5.6.2. SANS data collection and contrast variation
SANS data were measured on the CG-3 Bio-SANS in the High Flux Isotope
Reactor facility of the Oak Ridge National Laboratory (ORNL; Oak Ridge, TN).
Measurements were collected with a 1 x 1 m2
2-D linear position-sensitive detector at a
resolution of 192 x 256 pixels. The samples were measured at 6 Å neutron wavelength
and sample to detector distances of 0.3 and 6 m. Data was collected at 25 and 40°C using
1 mm quartz banjo cells. Exposure time ranges from 300 to 12000 seconds based on the
concentration and solvent D2O content. The usable Q-range was 0.0009 to 0.8 Å-1
.

202
The contrast variation experimental data was reduced using MantidPlot data
reduction software. Buffer subtraction was completed with Primus. SasView was used for
all of the bicelle data fits. CRYSOL and CRYSON were used for generating SAXS and
SANS profiles from the MD atomic structures.
5.7. References
1. Fitter, J., T. Gutberlet, and J. Katsaras. 2006. Neutron scattering in biology: techniques
and applications. Springer, New York, NY.
2. Svergun, D. and M. Koch. 2003. Small-angle scattering studies of biological
macromolecules in solution. Rep Prog Phys 66: 1735-1782.
3. Guinier, A. 1939. La diffraction des rayons X aux tres petits angles; application a
l’etude de phenomenes ultramicroscopiques. Ann Phys (Paris) 12: 161-237.
4. Guinier, A. and G. Fournet. 1955. Small angle scattering of X-rays. Wiley, New York,
NY.
5. Gaemers, S. and A. Bax. 2001. Morphology of three lyotropic liquid crystalline
biological NMR media studied by translational diffusion anisotropy. J Am Chem Soc
123: 12343-12352.
6. Feigin, L. and D. Svergun. 1987. Structure analysis by small angle X-ray and neutron
scattering. Plenum Press, New York, NY.
7. Oliver, R., J. Lipfert, D. Fox, R. Lo, S. Doniach, and L. Columbus. 2013. Dependence
of micelle size and shape on detergent alkyl chain length and head group. PLoS ONE 8:
e62488.
203
8. Glover, K., J. Whiles, G. Wu, N. Yu, R. Deems, J. Struppe, R. Stark, E. Komives, and
R. Vold. 2001. Structural evaluation of phospholipid bicelles for solution-state studies of
membrane associated biomolecules. Biophys J 81: 2163-2171.
9. Vold, R. and R. Prosser. 1996. Magnetically oriented phospholipid bilayered micelles
for structural studies of polypeptides. Does the ideal bicelle exist? J Magn Reson B 113:
267 – 271.