Embed Size (px)
Citation preview
Botanica Marina 2016; 59(2-3): 173–186
*Corresponding author: Michael N. Githaiga, Marine Ecology and Environmental Programme, Kenya Marine and Fisheries Research Institute, P.O. Box 81651, Mombasa, Mombasa City, Kenya; and School of Life, Sport and Social Sciences, Edinburgh Napier University, EH11 4BN, Edinburgh, UK, e-mail: [email protected]. http://orcid.org/0000-0001-7890-1819Linda Gilpin and Mark Huxham: School of Life, Sport and Social Sciences, Edinburgh Napier University, EH11 4BN, Edinburgh, UKJames G. Kairo: Marine Ecology and Environmental Programme, Kenya Marine and Fisheries Research Institute, P.O. Box 81651, Mombasa, Mombasa City, Kenya
Michael N. Githaiga*, Linda Gilpin, James G. Kairo and Mark Huxham
Biomass and productivity of seagrasses in Africa
DOI 10.1515/bot-2015-0075Received 5 September, 2015; accepted 26 April, 2016; online first 25 May, 2016
Abstract: There is growing interest in carbon stocks and flows in seagrass ecosystems, but recent global reviews suggest a paucity of studies from Africa. This paper reviews work on seagrass productivity, biomass and sediment car-bon in Africa. Most work was conducted in East Africa with a major geographical gap in West Africa. The mean above-ground, below-ground and total biomasses from all studies were 174.4, 474.6 and 514 g DW m-2, respectively with a global range of 461–738 g DW m-2. Mean annual pro-duction rate was 913 g DW m-2 year-1 (global range 816–1012 g DW m-2 year-1). No studies were found giving sediment organic carbon, demonstrating a major gap in seagrass blue carbon work. Given the small numbers of relevant papers and the large geographical areas left undescribed in Africa, any conclusions remain tentative and much remains to be done on seagrass studies in Africa.
Keywords: Africa; blue carbon; productivity; seagrasses.
IntroductionUnderstanding the role of vegetated coastal ecosystems in global carbon dynamics is a field of growing interest as knowledge of natural carbon sinks and flows can contribute to effective management of human impacts on the climate. Currently, our understanding of the roles of different ecosys-tems in the global carbon budget is limited by uncertainty about, and ignorance of, both individual ecosystems and their ecological connectivity. Vegetated coastal ecosystems that, in the past, have been relatively neglected have more
recently received considerable attention following the “blue carbon” initiative, which established a clear distinction between the aquatic and terrestrial organic carbon sinks and helped to highlight the high relative efficiency of vegetated coastal sinks (Nellemann et al. 2009, http://the blue carbon initiative.org). Of the three key “blue carbon” habitats – salt marsh, mangrove and seagrass meadows – seagrasses are the most extensive but least studied. Available reviews of seagrass biomass and carbon flows globally (Duarte and Chiscano 1999, Fourqurean et al. 2012) reveal that the major-ity of studies have been done in Western Europe, the Mediter-ranean, the Caribbean, Australia and the American coasts. This is an indication of the relative paucity of information about seagrasses in African waters. Globally, seagrass eco-systems are estimated to store as much as 19.9 Pg of organic carbon and the oceans may bury an estimated 27.4 Tg C year-1 in seagrass meadows ( Fourqurean et al. 2012). The average standing stock of seagrass is estimated at 460 g DW m-2 while the average production is 5.0 g DW m-2 day-1 (Duarte and Chiscano 1999). As these figures have been derived without much contribution from seagrass studies in Africa, estimates of the global seagrass carbon budget may change substantially if sequestration and storage rates in African systems are distinctive. Bearing in mind that seagrasses host a high species diversity globally (Short et al. 2007) and the fact that the role of seagrasses in carbon fluxes is acknowledged (Mateo et al. 2006), there is a need to under-stand variation in biomass and carbon storage across species and sites. The aim of the present study was to carry out a comprehensive assessment of all accessible literature on African seagrass species, to establish the current knowl-edge on biomass stocks and productivity, and to identify the geographic distribution of these data around Africa.
Materials and methodsBoth the primary and gray literature were used. Four search engines – Google Scholar, Yahoo, Science Direct and ISI Web of Science – were used when looking for any available information on seagrass biomass and produc-tivity studies in Africa up to the end of the year 2015. In addition, manual searches from libraries were done espe-cially for the gray literature. Several researchers thought to have been involved in seagrass biomass and carbon studies in Africa were contacted to provide any available
UnauthenticatedDownload Date | 6/11/16 9:49 AM
174 M.N. Githaiga et al.: Biomass and productivity of seagrasses in Africa
information. The search terms used were “seagrass” in combination with one of the following: “above-ground biomass”, “below-ground biomass”, “biomass stocks”, “carbon burial”, “ productivity”, “Africa”, “target sea-grass species” and “names of countries” along the African coasts. Where data on biomass and productivity were given as a range with no means reported, the mid-point was taken as an estimate of the mean from that study. In some cases, relevant information was not given in the text but could be reliably estimated from the figures. Data on biomass and productivity rates for different species at dif-ferent sites were investigated and summarised.
ResultsOf the over 300 abstracts initially found, 32 papers and eight reports or theses gave information on biomass
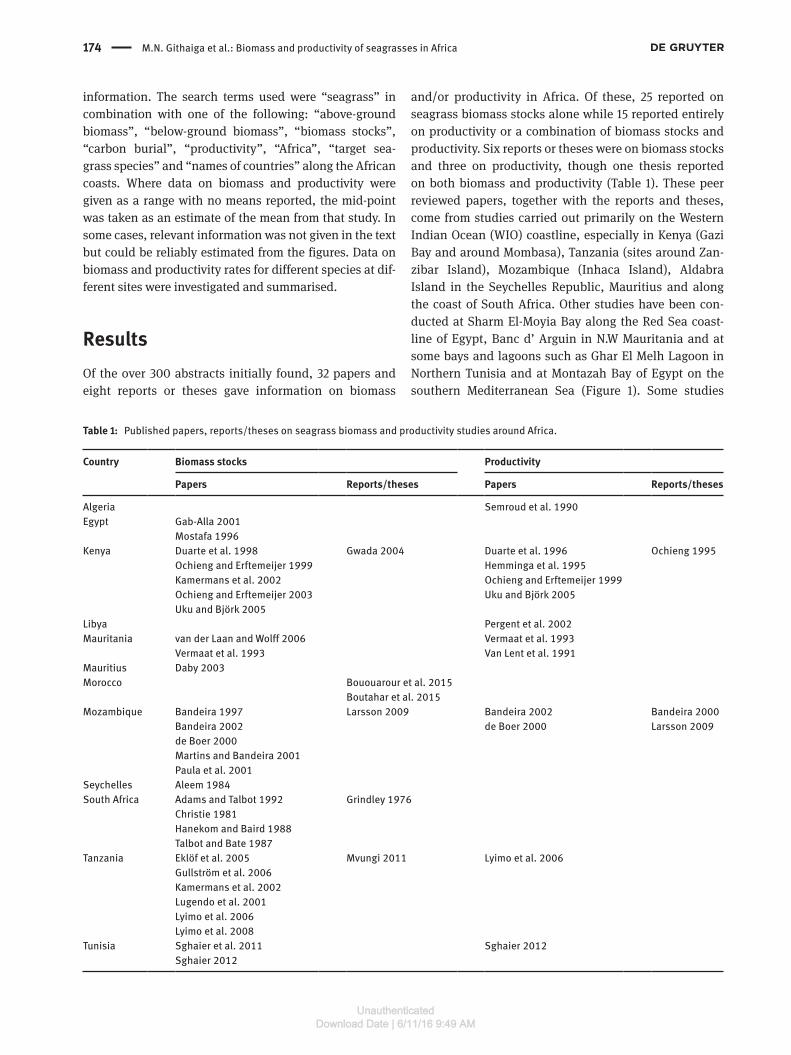
and/or productivity in Africa. Of these, 25 reported on seagrass biomass stocks alone while 15 reported entirely on productivity or a combination of biomass stocks and productivity. Six reports or theses were on biomass stocks and three on productivity, though one thesis reported on both biomass and productivity (Table 1). These peer reviewed papers, together with the reports and theses, come from studies carried out primarily on the Western Indian Ocean (WIO) coastline, especially in Kenya (Gazi Bay and around Mombasa), Tanzania (sites around Zan-zibar Island), Mozambique (Inhaca Island), Aldabra Island in the Seychelles Republic, Mauritius and along the coast of South Africa. Other studies have been con-ducted at Sharm El-Moyia Bay along the Red Sea coast-line of Egypt, Banc d’ Arguin in N.W Mauritania and at some bays and lagoons such as Ghar El Melh Lagoon in Northern Tunisia and at Montazah Bay of Egypt on the southern Mediterranean Sea (Figure 1). Some studies
Table 1: Published papers, reports/theses on seagrass biomass and productivity studies around Africa.
Country Biomass stocks Productivity
Papers Reports/theses Papers Reports/theses
Algeria Semroud et al. 1990Egypt Gab-Alla 2001
Mostafa 1996Kenya Duarte et al. 1998 Gwada 2004 Duarte et al. 1996 Ochieng 1995
Ochieng and Erftemeijer 1999 Hemminga et al. 1995Kamermans et al. 2002 Ochieng and Erftemeijer 1999Ochieng and Erftemeijer 2003 Uku and Björk 2005Uku and Björk 2005
Libya Pergent et al. 2002Mauritania van der Laan and Wolff 2006 Vermaat et al. 1993
Vermaat et al. 1993 Van Lent et al. 1991Mauritius Daby 2003Morocco Bououarour et al. 2015
Boutahar et al. 2015Mozambique Bandeira 1997 Larsson 2009 Bandeira 2002 Bandeira 2000
Bandeira 2002 de Boer 2000 Larsson 2009de Boer 2000Martins and Bandeira 2001Paula et al. 2001
Seychelles Aleem 1984South Africa Adams and Talbot 1992 Grindley 1976
Christie 1981Hanekom and Baird 1988Talbot and Bate 1987
Tanzania Eklöf et al. 2005 Mvungi 2011 Lyimo et al. 2006Gullström et al. 2006Kamermans et al. 2002Lugendo et al. 2001Lyimo et al. 2006Lyimo et al. 2008
Tunisia Sghaier et al. 2011 Sghaier 2012Sghaier 2012
UnauthenticatedDownload Date | 6/11/16 9:49 AM
M.N. Githaiga et al.: Biomass and productivity of seagrasses in Africa 175
Figure 1: Sites along the coastline of the African continent where seagrasses biomass and productivity have been studied.
(unpublished) have recently been reported from Marcha Bay, Jbel Moussa Bay and the Atlantic coast of Morocco (Table 2). Data were available for 14 species, with biomass data available for 13 species (Table 2), while data on sea-grass productivity were available for 10 species (Table 3). Most of the seagrass biomass studies considered mixed stands, but Thalassodendron ciliatum and Thalassia hem-prichii were the most widely studied individual species, each having been a subject of research in nine out of the 35 locations where biomass studies were reported and in five and six locations, respectively, out of the 18 locations for productivity studies. Halodule wrightii, Cymodocea rotundata, Halophila stipulaceae and Halodule uninervis have been studied for biomass stocks in only one loca-tion each. Similarly, with the exception of T. hemprichii and T. ciliatum, a majority of the other species reported in productivity research were studied in only one loca-tion (Table 3). Thalassodendron ciliatum was the only species reported to have been studied for all the pro-ductivity indices (Table 3). Larger seagrass species such
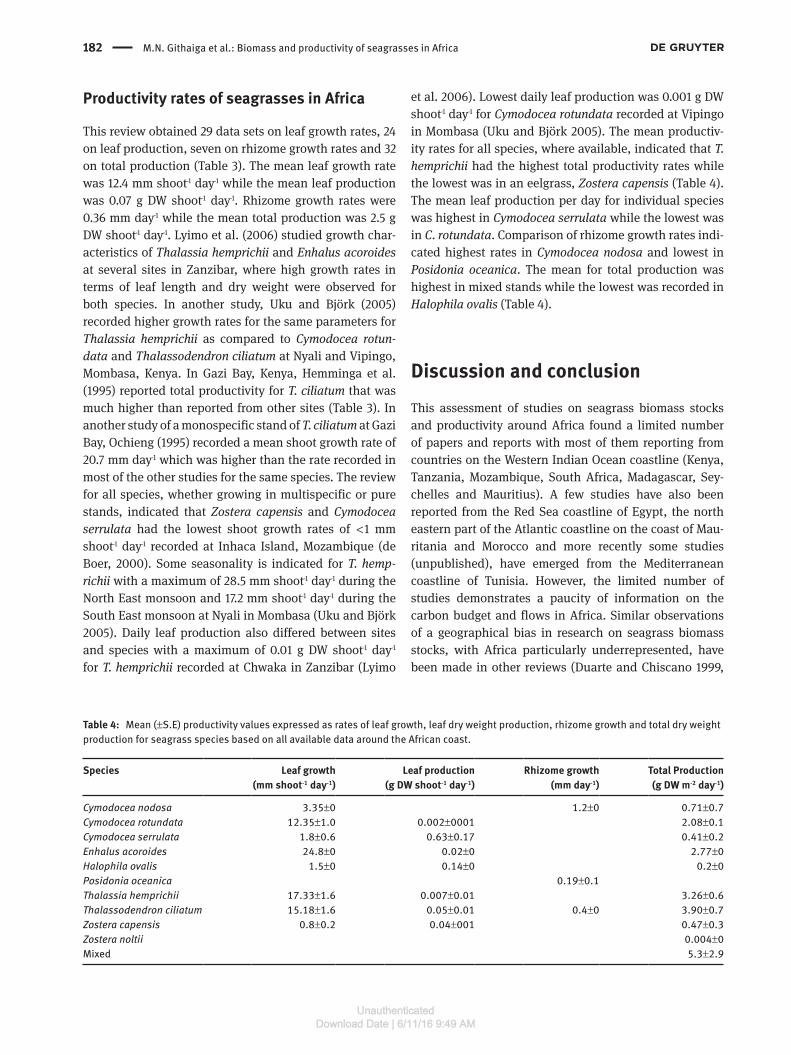
as T. hemprichii and T. ciliatum recorded the highest per unit area biomass while smaller species, such as H. wrightii, recorded the lowest biomass. There was a large range in biomass between the highest and lowest species (Figure 2). The highest number of published biomass and productivity studies in Africa were carried out between 1996 and 2010 accounting for 65.6% of the total, while 62.5% of theses, reports or articles (unpublished or cur-rently under peer review) have emerged between 2010 and 2015 (Figure 3).
Biomass of seagrasses in Africa
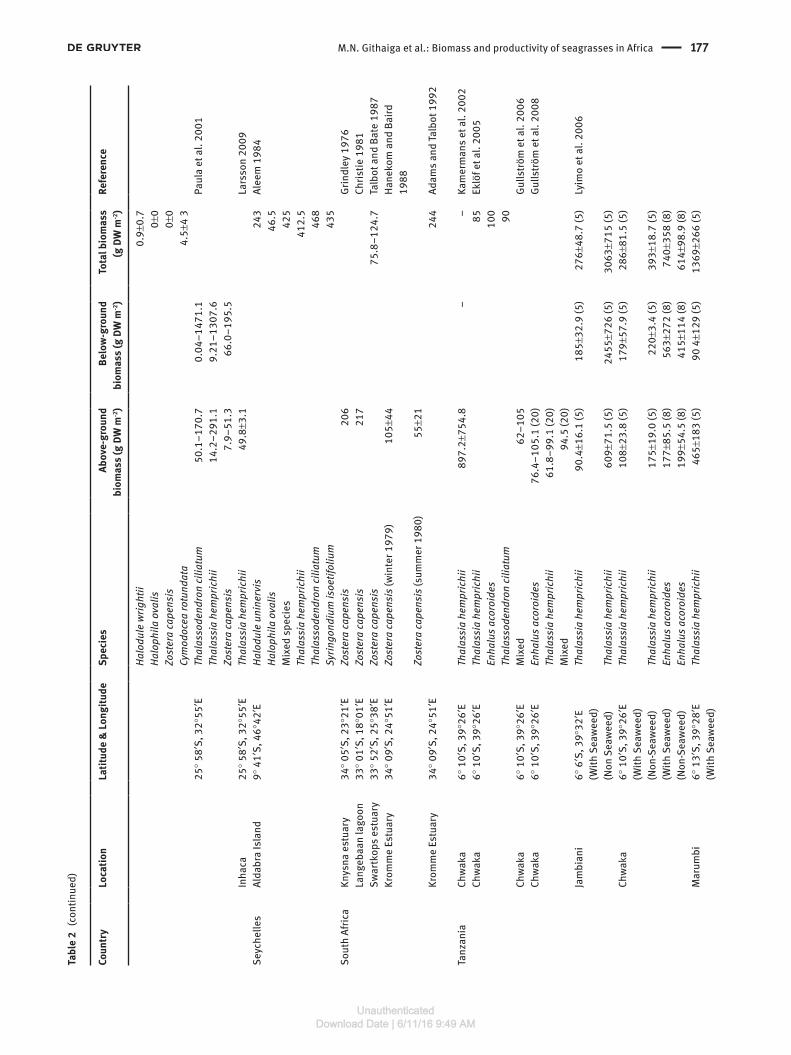
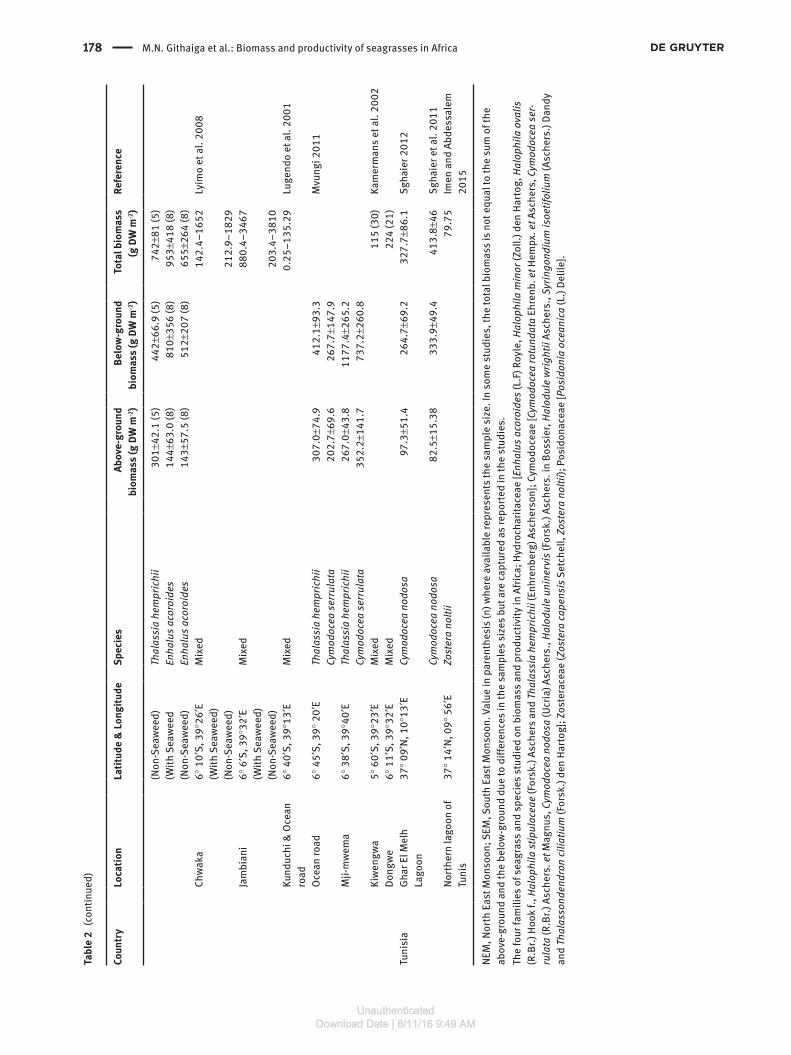
We obtained 47 data sets for both the above- and below-ground biomass and 73 for total biomass contained within the 32 papers and eight reports or theses (Table 1). The total and the above-ground biomass data were each reported in 21 of the 40 papers, reports and theses while below-ground biomass was reported in 15 of those papers,
UnauthenticatedDownload Date | 6/11/16 9:49 AM
176 M.N. Githaiga et al.: Biomass and productivity of seagrasses in Africa
Tabl
e 2:
Mea
n (±
S.E)
valu
es fo
r abo
ve-g
roun
d, b
elow
-gro
und
and
tota
l bio
mas
s re
porte
d fo
r diff
eren
t sea
gras
s sp
ecie
s at
site
s ar
ound
Afri
ca.
Coun
try
Loca
tion
Latit
ude
& L
ongi
tude
Spec
ies
Abov
e-gr
ound
bi
omas
s (g
DW
m-2
)Be
low
-gro
und
biom
ass
(g D
W m
-2)
Tota
l bio
mas
s (g
DW
m-2
)Re
fere
nce
Egyp
tM
onta
zah
Bay
31°1
2′N,
29°
55′E
Cym
odoc
ea n
odos
a28
7M
osta
fa 1
996
Shar
m E
l Moy
ia B
ay27
° 9′N
, 34°
3′E
Halo
phila
stip
ulac
eae
270
Gab-
Alla
200
1Ke
nya
Galu
4°18
′S, 3
9°32
′ETh
alas
sode
ndro
n ci
liatu
m40
.6±4
0.6
Uku
et a
l. 19
96Di
ani
4°18
′S, 1
0°32
′ETh
alas
sode
ndro
n ci
liatu
m27
9.3±
97.6
Uku
et a
l. 19
96Di
ani
4°18
′S, 1
0°32
′EM
ixed
430
(33)
Kam
erm
ans
et a
l. 20
02Ga
zi4°
25′S
, 39°
30′E
Thal
asso
dend
ron
cilia
tum
316.
1±41
368.
1±22
725.
5±25
2.5
Ochi
eng
and
Erfte
mei
jer 2
003
Chal
e la
goon
4° 2
5′S,
39°
30′E
Thal
asso
dend
ron
cilia
tum
243.
4Du
arte
et a
l. 19
98M
omba
sa4°
2′S
, 39°
41′E
Mix
ed47
1.6±
66.7
Kam
erm
ans
et a
l. 20
02Ro
ka1°
36′
S, 3
9°12
′EM
ixed
644
(7)
Kam
erm
ans
et a
l. 20
02M
omba
sa M
arin
e Pa
rk4°
2′S
, 39°
41′E
Mix
ed76
0±96
Ochi
eng
and
Erfte
mei
jer 1
999
Nyal
i4°
03′
S, 3
9°43
′ETh
alas
sode
ndro
n ci
liatu
m–n
orth
Ea
st m
onso
on27
7.4±
36.3
364.
9±83
.5Gw
ada
2004
Thal
asso
dend
ron
cilia
tum
–sou
th
East
mon
soon
269.
5±65
312.
0±12
3
Nyal
i4°
03′
S, 3
9°43
′EM
ixed
604
(33)
Kam
erm
ans
et a
l. 20
02Ke
nyat
ta4°
00′
S, 3
9°44
′EM
ixed
233
(33)
Wat
amu
3° 2
3′S,
39°
59′E
Mix
ed45
7 (3
3)M
aurit
ania
Banc
d’ A
rgui
n20
° 35′
N, 1
6°15
′WM
ixed
335
Verm
aat e
t al.
1993
Mix
ed25
5.0
van
der L
aan
and
Wol
fe
2006
Mau
ritiu
sM
on C
hois
y Ba
y20
° 17′
S, 5
733′
WSy
ringo
ndiu
m is
oetif
oliu
m12
9.3
Daby
200
3Ha
loph
ila o
valis
102.
5M
oroc
coM
arch
a la
goon
40° 3
9′N,
8°4
8′W
Cym
odoc
ea n
odos
a8.
02–6
1.2
10.8
–235
Bout
ahar
et a
l. 20
15At
lant
ic co
ast
23° 3
0′N,
15°
56′W
Zost
era
nolti
i32
–259
21–3
14Bo
uoua
rour
et a
l. 20
15Jb
el M
ouss
a Ba
y30
° 8′N
, 5°2
1′W
Zost
era
nolti
i3.
08±1
.12
7.72
±1.3
8M
ozam
biqu
eIn
haca
25° 5
8′S,
32°
55′E
Thal
asso
dend
ron
cilia
tum
355.
2±11
1.1
792.
4±34
2.9
1148
(30)
Band
eira
199
7Zo
ster
a ca
pens
is (s
umm
er)
15.7
±4.5
173.
4±47
.519
0±51
.2 (1
0)de
Boe
r 200
0Cy
mod
ocea
ser
rula
ta (s
umm
er)
34.1
±18.
638
.6±1
4.0
82.0
±30.
8 (1
0)Ha
lodu
le w
right
ii (s
umm
er)
16.0
±22.
217
.1±1
4.5
22.2
±21.
7 (1
0)Zo
ster
a ca
pens
is (w
inte
r)25
.7±8
.019
8.9±
7521
9.5±
78.1
(10)
Cym
odoc
ea s
erru
lata
(win
ter)
17.6
±15.
227
.0±1
4.4
43.1
±21.
8 (1
0)Ha
lodu
le w
right
ii (w
inte
r)6.
9±5.
518
.1±6
.522
.9±8
.2 (1
0)In
haca
(Nor
ther
n Ba
y)25
° 58′
S, 3
2°55
′ETh
alas
sia
hem
pric
hii
154.
4±22
.763
3.0±
163.
578
7.4±
233.
8M
artin
s an
d Ba
ndei
ra
2001
Halo
dule
wrig
htii
30.7
±11.
9Ha
loph
ila o
valis
0.6±
0.4
Zost
era
cape
nsis
4.8±
2Cy
mod
ocea
rotu
ndat
a39
.9±
18.7
Inha
ca (S
outh
ern
Bay)
25° 5
8′S,
32°
55′E
Thal
assi
a he
mpr
ichi
i14
7.1±
68.6
517
29.7
±495
.25
1876
±389
.4
UnauthenticatedDownload Date | 6/11/16 9:49 AM
M.N. Githaiga et al.: Biomass and productivity of seagrasses in Africa 177
Coun
try
Loca
tion
Latit
ude
& L
ongi
tude
Spec
ies
Abov
e-gr
ound
bi
omas
s (g
DW
m-2
)Be
low
-gro
und
biom
ass
(g D
W m
-2)
Tota
l bio
mas
s (g
DW
m-2
)Re
fere
nce
Halo
dule
wrig
htii
0.9±
0.7
Halo
phila
ova
lis0±
0Zo
ster
a ca
pens
is0±
0Cy
mod
ocea
rotu
ndat
a4.
5±4
325
° 58′
S, 3
2°55
′ETh
alas
sode
ndro
n ci
liatu
m50
.1–1
70.7
0.04
–147
1.1
Paul
a et
al.
2001
Thal
assi
a he
mpr
ichi
i14
.2–2
91.1
9.21
–130
7.6
Zost
era
cape
nsis
7.9–
51.3
66.0
–195
.5In
haca
25° 5
8′S,
32°
55′E
Thal
assi
a he
mpr
ichi
i49
.8±3
.1La
rsso
n 20
09Se
yche
lles
Alda
bra
Isla
nd9°
41′
S, 4
6°42
′EHa
lodu
le u
nine
rvis
243
Alee
m 1
984
Halo
phila
ova
lis46
.5M
ixed
spe
cies
425
Thal
assi
a he
mpr
ichi
i41
2.5
Thal
asso
dend
ron
cilia
tum
468
Syrin
gond
ium
isoe
tifol
ium
435
Sout
h Af
rica
Knys
na e
stua
ry34
° 05′
S, 2
3°21
′EZo
ster
a ca
pens
is20
6Gr
indl
ey 1
976
Lang
ebaa
n la
goon
33° 0
1′S,
18°
01′E
Zost
era
cape
nsis
217
Chris
tie 1
981
Swar
tkop
s es
tuar
y33
° 52′
S, 2
5°38
′EZo
ster
a ca
pens
is75
.8–1
24.7
Talb
ot a
nd B
ate
1987
Krom
me
Estu
ary
34° 0
9′S,
24°
51′E
Zost
era
cape
nsis
(win
ter 1
979)
105±
44Ha
neko
m a
nd B
aird
19
88Zo
ster
a ca
pens
is (s
umm
er 1
980)
55±2
1Kr
omm
e Es
tuar
y34
° 09′
S, 2
4°51
′E24
4Ad
ams
and
Talb
ot 1
992
Tanz
ania
Chw
aka
6° 1
0′S,
39°
26′E
Thal
assi
a he
mpr
ichi
i89
7.2±
754.
8–
–Ka
mer
man
s et
al.
2002
Chw
aka
6° 1
0′S,
39°
26′E
Thal
assi
a he
mpr
ichi
i85
Eklö
f et a
l. 20
05En
halu
s ac
oroi
des
100
Thal
asso
dend
ron
cilia
tum
90Ch
wak
a6°
10′
S, 3
9°26
′EM
ixed
62–1
05Gu
llströ
m e
t al.
2006
Chw
aka
6° 1
0′S,
39°
26′E
Enha
lus
acor
oide
s76
.4–1
05.1
(20)
Gulls
tröm
et a
l. 20
08Th
alas
sia
hem
pric
hii
61.8
–99.
1 (2
0)M
ixed
94.5
(20)
Jam
bian
i6°
6′S
, 39°
32′E
Thal
assi
a he
mpr
ichi
i90
.4±1
6.1
(5)
185±
32.9
(5)
276±
48.7
(5)
Lyim
o et
al.
2006
(With
Sea
wee
d)(N
on S
eaw
eed)
Thal
assi
a he
mpr
ichi
i60
9±71
.5 (5
)24
55±7
26 (5
)30
63±7
15 (5
)Ch
wak
a6°
10′
S, 3
9°26
′ETh
alas
sia
hem
pric
hii
108±
23.8
(5)
179±
57.9
(5)
286±
81.5
(5)
(With
Sea
wee
d)(N
on-S
eaw
eed)
Thal
assi
a he
mpr
ichi
i17
5±19
.0 (5
)22
0±3.
4 (5
)39
3±18
.7 (5
)(W
ith S
eaw
eed)
Enha
lus
acor
oide
s17
7±85
.5 (8
)56
3±27
2 (8
)74
0±35
8 (8
)(N
on-S
eaw
eed)
Enha
lus
acor
oide
s19
9±54
.5 (8
)41
5±11
4 (8
)61
4±98
.9 (8
)M
arum
bi6°
13′
S, 3
9°28
′ETh
alas
sia
hem
pric
hii
465±
183
(5)
90 4
±129
(5)
1369
±266
(5)
(With
Sea
wee
d)
Tabl
e 2
(con
tinue
d)
UnauthenticatedDownload Date | 6/11/16 9:49 AM
178 M.N. Githaiga et al.: Biomass and productivity of seagrasses in Africa
Coun
try
Loca
tion
Latit
ude
& L
ongi
tude
Spec
ies
Abov
e-gr
ound
bi
omas
s (g
DW
m-2
)Be
low
-gro
und
biom
ass
(g D
W m
-2)
Tota
l bio
mas
s (g
DW
m-2
)Re
fere
nce
(Non
-Sea
wee
d)Th
alas
sia
hem
pric
hii
301±
42.1
(5)
442±
66.9
(5)
742±
81 (5
)(W
ith S
eaw
eed
Enha
lus
acor
oide
s14
4±63
.0 (8
)81
0±35
6 (8
)95
3±41
8 (8
)(N
on-S
eaw
eed)
Enha
lus
acor
oide
s14
3±57
.5 (8
)51
2±20
7 (8
)65
5±26
4 (8
)Ch
wak
a6°
10′
S, 3
9°26
′EM
ixed
142.
4–16
52Ly
imo
et a
l. 20
08(W
ith S
eaw
eed)
(Non
-Sea
wee
d)21
2.9–
1829
Jam
bian
i6°
6′S
, 39°
32′E
Mix
ed88
0.4–
3467
(With
Sea
wee
d)(N
on-S
eaw
eed)
203.
4–38
10Ku
nduc
hi &
Oce
an
road
6° 4
0′S,
39°
13′E
Mix
ed0.
25–1
35.2
9Lu
gend
o et
al.
2001
Ocea
n ro
ad6°
45′
S, 3
9° 2
0′E
Thal
assi
a he
mpr
ichi
i30
7.0±
74.9
412.
1±93
.3M
vung
i 201
1Cy
mod
ocea
ser
rula
ta20
2.7±
69.6
267.
7±14
7.9
Mji-
mw
ema
6° 3
8′S,
39°
40′E
Thal
assi
a he
mpr
ichi
i26
7.0±
43.8
1177
.4±2
65.2
Cym
odoc
ea s
erru
lata
352.
2±14
1.7
737.
2±26
0.8
Kiw
engw
a5°
60′
S, 3
9°23
′EM
ixed
115
(30)
Kam
erm
ans
et a
l. 20
02Do
ngw
e6°
11′
S, 3
9°32
′EM
ixed
224
(21)
Tuni
sia
Ghar
El M
elh
Lago
on37
° 09′
N, 1
0°13
′ECy
mod
ocea
nod
osa
97.3
±51.
426
4.7±
69.2
327.
7±86
.1Sg
haie
r 201
2
Cym
odoc
ea n
odos
a82
.5±1
5.38
333.
9±49
.441
3.8±
46Sg
haie
r et a
l. 20
11No
rthe
rn la
goon
of
Tuni
s37
° 14′
N, 0
9° 5
6′E
Zost
era
nolti
i79
.75
Imen
and
Abd
essa
lem
20
15
NEM
, Nor
th E
ast M
onso
on; S
EM, S
outh
Eas
t Mon
soon
. Val
ue in
par
enth
esis
(n) w
here
ava
ilabl
e re
pres
ents
the
sam
ple
size
. In
som
e st
udie
s, th
e to
tal b
iom
ass
is n
ot e
qual
to th
e su
m o
f the
ab
ove-
grou
nd a
nd th
e be
low
-gro
und
due
to d
iffer
ence
s in
the
sam
ples
siz
es b
ut a
re ca
ptur
ed a
s re
porte
d in
the
stud
ies.
The
four
fam
ilies
of s
eagr
ass
and
spec
ies
stud
ied
on b
iom
ass
and
prod
uctiv
ity in
Afri
ca; H
ydro
char
itace
ae [E
nhal
us a
coro
ides
(L.F
) Roy
le, H
alop
hila
min
or (Z
oll.)
den
Har
tog,
Hal
ophi
la o
valis
(R
.Br.)
Hoo
k f.,
Hal
ophi
la st
ipul
acea
e (F
orsk
.) As
cher
s an
d Th
alas
sia
hem
pric
hii (
Enhr
enbe
rg) A
sche
rson
]; Cy
mod
ocea
e [C
ymod
ocea
rotu
ndat
a Eh
renb
. et H
empx
. et A
sche
rs, C
ymod
ocea
ser
-ru
lata
(R.B
r.) A
sche
rs. e
t Mag
nus,
Cym
odoc
ea n
odos
a (U
cria
) Asc
hers
., Ha
lodu
le u
nine
rvis
(For
sk.)
Asch
ers.
in B
ossi
er, H
alod
ule
wrig
htii
Asch
ers.
, Syr
ingo
ndiu
m is
oetif
oliu
m (A
sche
rs.)
Dand
y an
d Th
alas
sond
endr
on ci
liatiu
m (F
orsk
.) de
n Ha
rtog]
; Zos
tera
ceae
(Zos
tera
cape
nsis
Set
chel
l, Zo
ster
a no
ltii);
Pos
idon
acea
e [P
osid
onia
oce
anic
a (L
.) De
lile]
.
Tabl
e 2
(con
tinue
d)
UnauthenticatedDownload Date | 6/11/16 9:49 AM
M.N. Githaiga et al.: Biomass and productivity of seagrasses in Africa 179
Tabl
e 3:
Pro
duct
ivity
valu
es e
xpre
ssed
as
rate
s of
leaf
gro
wth
, lea
f dry
wei
ght p
rodu
ctio
n, rh
izom
e gr
owth
and
tota
l dry
wei
ght p
rodu
ctio
n fo
r diff
eren
t sea
gras
s sp
ecie
s at
site
s ar
ound
Afri
ca.
Coun
try
Loca
tion
Latit
ude
& lo
ngitu
deSp
ecie
sSe
ason
Leaf
gro
wth
(mm
sh
oot-1
day
-1)
Leaf
pro
duct
ion
(g
DW s
hoot
-1 d
ay-1
)Rh
izom
e gr
owth
(m
m d
ay-1
)To
tal p
rodu
ctio
n (g
DW
m-2
day
-1)
Refe
renc
e
Alge
riaM
arsa
35° 5
1′N,
10°
35′E
Posi
doni
a oc
eani
ca0.
02Se
mro
ud e
t al.
1990
Tam
ent f
oust
0.35
Keny
aGa
zi B
ay4°
25′
S, 3
9°30
′ETh
alas
sode
ndro
n ci
liatu
m7.
5He
mm
inga
et a
l. 19
95
4° 2
5′S,
39°
30′E
Thal
asso
dend
ron
cilia
tum
20.7
±0.8
4.43
±2.7
Ochi
eng
1995
4° 2
5′S,
39°
30′E
Mix
ed s
peci
es2.
4±0.
6Oc
hien
g 19
95Ch
ale
lago
on4°
25′
S, 3
9°30
′ETh
alas
sode
ndro
n ci
liatu
m0.
4Du
arte
et a
l. 19
96
Mom
basa
M
arin
e pa
rk4°
2′S
, 39°
41′E
Mix
ed s
peci
es8.
2±2.
8Oc
hien
g an
d Er
ftem
eije
r 199
9Ny
ali
4° 0
3′S,
39°
43′E
Thal
assi
a he
mpr
ichi
iS.
E17
.2±9
.50.
008±
0.00
25.
5±4.
9 (3
0)Uk
u an
d Bj
örk
2005
N.E
28.5
±4.1
0.00
8±0.
006
5.3±
0.5
(30)
Vipi
ngo
3° 4
5′S,
39°
50′E
S.E
17.1
±2.6
0.00
4±0.
001
2.4±
1.04
(30)
N.E
17.1
±2.8
0.00
4±0.
002
3.3±
1.1
(30)
Nyal
i4°
03′
S, 3
9°43
′ETh
alas
sode
ndro
n ci
liatu
mS.
E17
.3±1
.60.
005±
0.00
53.
7±2.
4 (3
0)
N.E
18.8
±5.9
0.00
6±0.
003
3.1±
1.8
(30)
Vipi
ngo
3° 4
5′S,
39°
50′E
S.E
12.4
±5.7
0.00
5±0.
002
2.9±
2.4
(30)
N.E
12.4
±5.3
0.00
4±0.
001
1.8±
1.6
(30)
Nyal
i4°
03′
S, 3
9°43
′ECy
mod
ocea
ro
tund
ata
S.E
12.8
±1.6
0.00
2±0.
0005
2.1±
0.5
(30)
N.E
14.9
±1.8
0.00
2±0.
0002
2.3±
0.5
(30)
Vipi
ngo
3° 4
5′S,
39°
50′E
S.E
10.0
±9.1
0.00
1±0.
0006
2.0±
1.1
(30)
N.E
11.7
±2.0
0.00
1±0.
0005
1.9±
1.0
(30)
Liby
aFa
rwa
lago
on33
° 05′
N, 1
1°44
′E0.
02–0
.1Pe
rgen
t et a
l. 20
02M
aurit
ania
Banc
d’ A
rgui
n20
° 35′
N, 1
6°15
′WCy
mod
ocea
no
dosa
0.00
3Va
n Le
nt e
t al.
1991
Zost
era
nolti
i0.
3Ve
rmaa
t et a
l. 19
93M
ozam
biqu
eIn
haca
Isla
nd25
° 58′
S, 3
2°55
′ETh
alas
sode
ndro
n ci
liatu
m14
.1–1
8.3
Band
eira
199
7
Thal
asso
dend
ron
cilia
tum
7.5–
9.5
Band
eira
200
0
Zost
era
cape
nsis
Sum
mer
0.7±
1.4
0.03
0.18
de B
oer 2
000
UnauthenticatedDownload Date | 6/11/16 9:49 AM
180 M.N. Githaiga et al.: Biomass and productivity of seagrasses in Africa
Coun
try
Loca
tion
Latit
ude
& lo
ngitu
deSp
ecie
sSe
ason
Leaf
gro
wth
(mm
sh
oot-1
day
-1)
Leaf
pro
duct
ion
(g
DW s
hoot
-1 d
ay-1
)Rh
izom
e gr
owth
(m
m d
ay-1
)To
tal p
rodu
ctio
n (g
DW
m-2
day
-1)
Refe
renc
e
Zost
era
cape
nsis
Win
ter
0.6±
1.1
0.02
0.18
Cym
odoc
ea
serr
ulat
aSu
mm
er2.
4±5.
30.
800.
62
Cym
odoc
ea
serr
ulat
aW
inte
r1.
2±1.
50.
460.
20
Halo
dule
wrig
htii
Sum
mer
1.5±
3.8
0.14
0.20
Win
ter
1.1±
2.0
0.08
0.08
Thal
assi
a he
mpr
ichi
i10
.4±0
.90.
004
1.08
±0.0
6La
rsso
n 20
09
Sout
h Af
rica
Krom
me
estu
ary
34° 0
9′S,
24°
51′
EZo
ster
a. ca
pens
is0.
93–1
.98
Hane
kom
and
Bai
rd
1988
Tanz
ania
Mar
umbi
6° 1
3′S,
39°
28′
ETh
alas
sia
hem
pric
hii
13.4
±4.7
0.00
4±0.
002
1.97
±0.8
9Ly
imo
et a
l. 20
06
Chw
aka
6° 1
0′S,
39°
26′
E17
.1±5
.20.
01±0
.01
1.86
±0.6
Jam
bian
i6°
6′S
, 39°
32′
E15
.8±6
.00.
005±
0.00
25.
92±2
.33
Mar
umbi
6° 1
3′S,
39°
28′
E19
.4±7
.10.
02±0
.01
2.05
±0.9
Chw
aka
6° 1
0′S,
39°
26′
EEn
halu
s ac
oroi
des
24.8
±9.4
0.02
±0.0
12.
77±1
.6Tu
nisi
aGh
ar E
l Mel
h La
goon
37° 0
9′N,
10°
13′
ECy
mod
ocea
no
dosa
3.35
(21)
1.2±
1 (2
1)1.
42 (2
0)Sg
haie
r et a
l. 20
11
Taba
rka
36° 5
7′N,
8° 4
5′E
Zost
era
nolti
i0.
36El
Kan
taou
i35
° 51′
N, 1
0° 3
5′E
Posi
doni
a oc
eani
ca0.
14Sg
haie
r et a
l. 20
13
Tabl
e 3
(con
tinue
d)
UnauthenticatedDownload Date | 6/11/16 9:49 AM
M.N. Githaiga et al.: Biomass and productivity of seagrasses in Africa 181
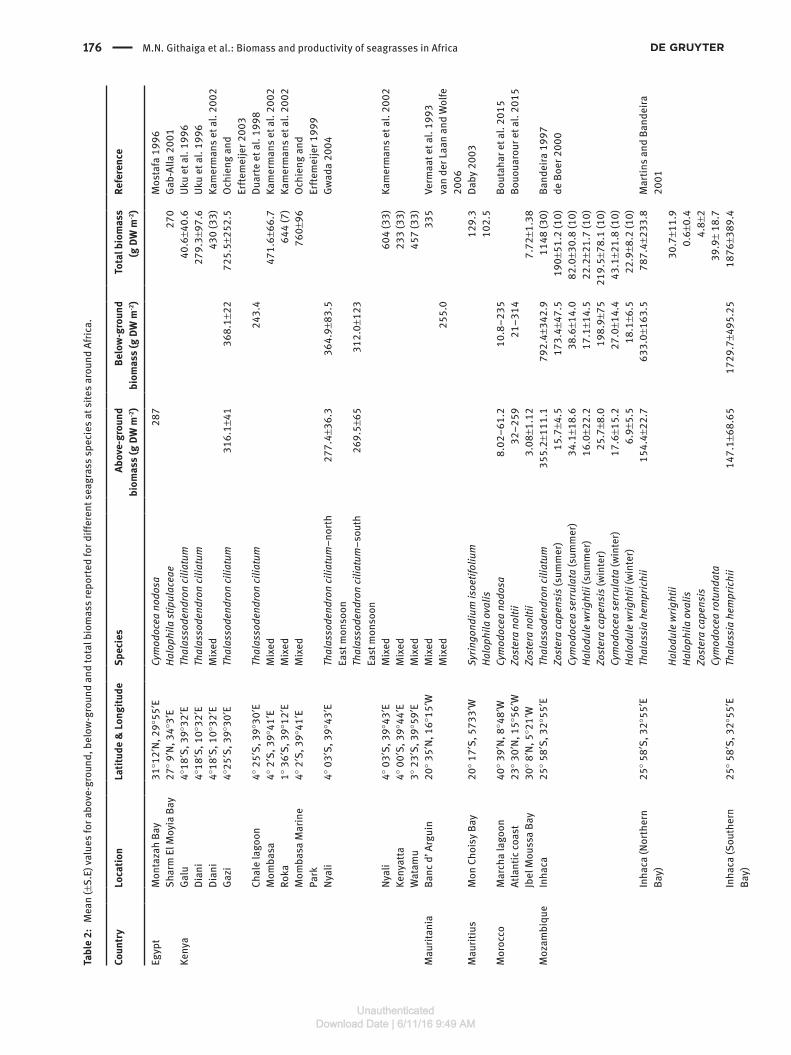
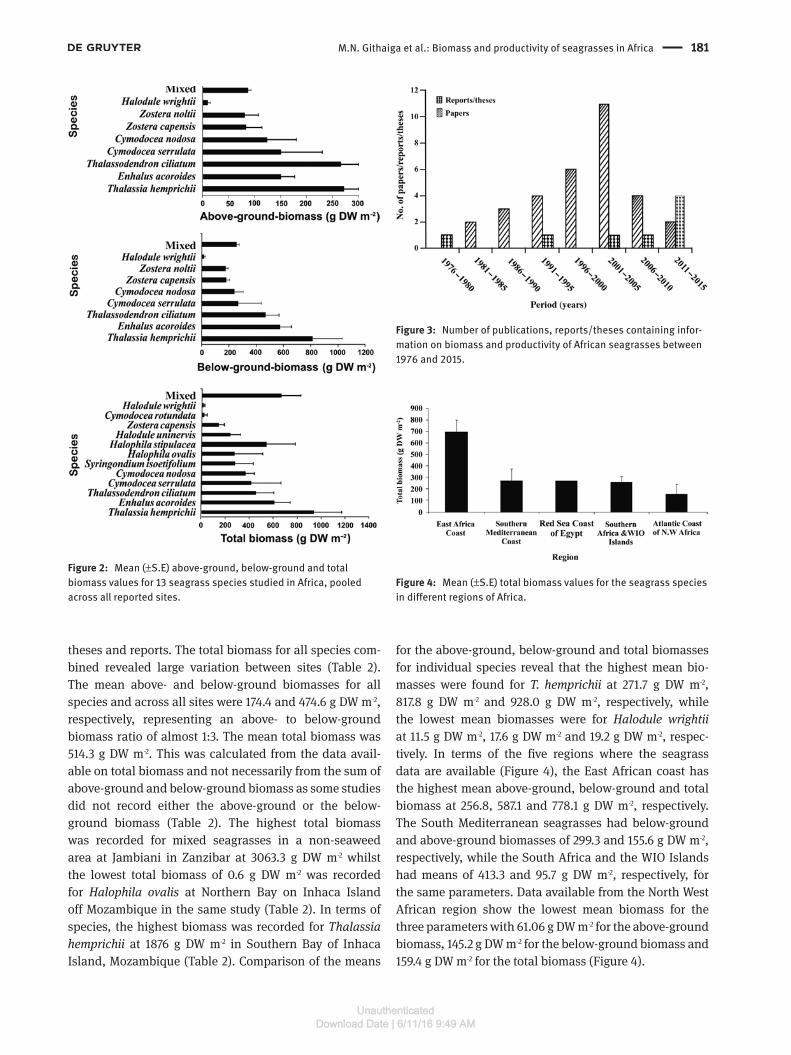
theses and reports. The total biomass for all species com-bined revealed large variation between sites (Table 2). The mean above- and below-ground biomasses for all species and across all sites were 174.4 and 474.6 g DW m-2, respectively, representing an above- to below-ground biomass ratio of almost 1:3. The mean total biomass was 514.3 g DW m-2. This was calculated from the data avail-able on total biomass and not necessarily from the sum of above-ground and below-ground biomass as some studies did not record either the above-ground or the below-ground biomass (Table 2). The highest total biomass was recorded for mixed seagrasses in a non-seaweed area at Jambiani in Zanzibar at 3063.3 g DW m-2 whilst the lowest total biomass of 0.6 g DW m-2 was recorded for Halophila ovalis at Northern Bay on Inhaca Island off Mozambique in the same study (Table 2). In terms of species, the highest biomass was recorded for Thalassia hemprichii at 1876 g DW m-2 in Southern Bay of Inhaca Island, Mozambique (Table 2). Comparison of the means
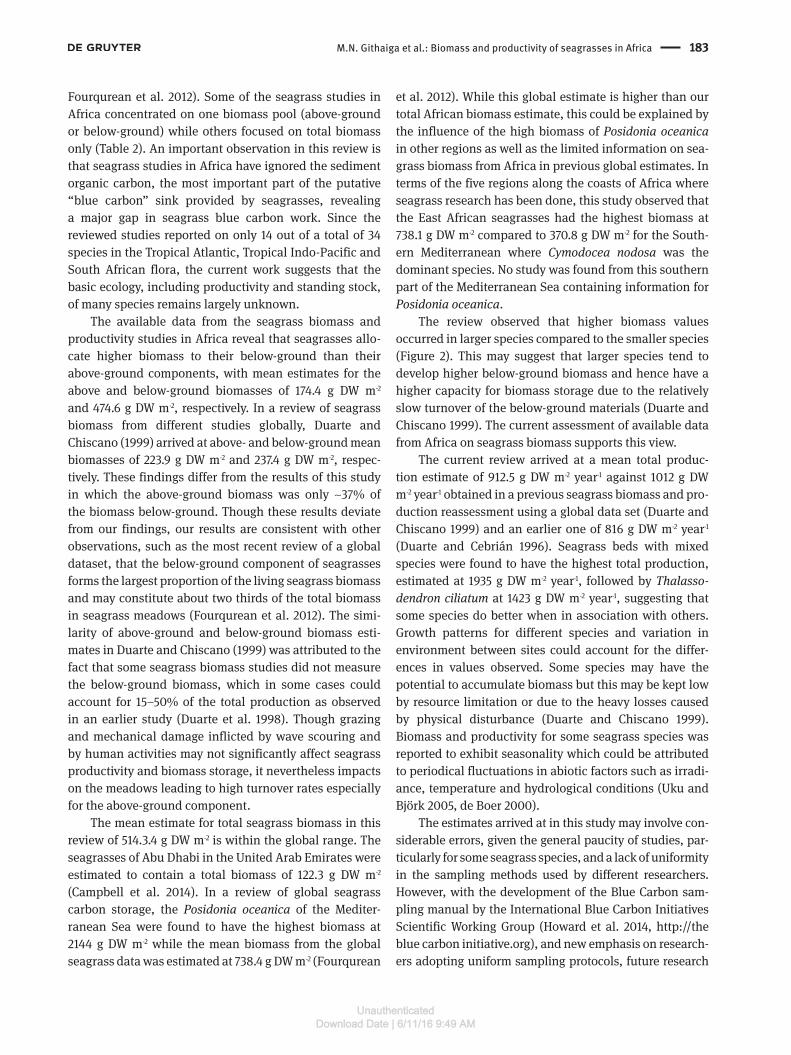
for the above-ground, below-ground and total biomasses for individual species reveal that the highest mean bio-masses were found for T. hemprichii at 271.7 g DW m-2, 817.8 g DW m-2 and 928.0 g DW m-2, respectively, while the lowest mean biomasses were for Halodule wrightii at 11.5 g DW m-2, 17.6 g DW m-2 and 19.2 g DW m-2, respec-tively. In terms of the five regions where the seagrass data are available (Figure 4), the East African coast has the highest mean above-ground, below-ground and total biomass at 256.8, 587.1 and 778.1 g DW m-2, respectively. The South Mediterranean seagrasses had below-ground and above-ground biomasses of 299.3 and 155.6 g DW m-2, respectively, while the South Africa and the WIO Islands had means of 413.3 and 95.7 g DW m-2, respectively, for the same parameters. Data available from the North West African region show the lowest mean biomass for the three parameters with 61.06 g DW m-2 for the above-ground biomass, 145.2 g DW m-2 for the below-ground biomass and 159.4 g DW m-2 for the total biomass (Figure 4).
Figure 2: Mean (±S.E) above-ground, below-ground and total biomass values for 13 seagrass species studied in Africa, pooled across all reported sites.
Figure 3: Number of publications, reports/theses containing infor-mation on biomass and productivity of African seagrasses between 1976 and 2015.
Figure 4: Mean (±S.E) total biomass values for the seagrass species in different regions of Africa.
UnauthenticatedDownload Date | 6/11/16 9:49 AM
182 M.N. Githaiga et al.: Biomass and productivity of seagrasses in Africa
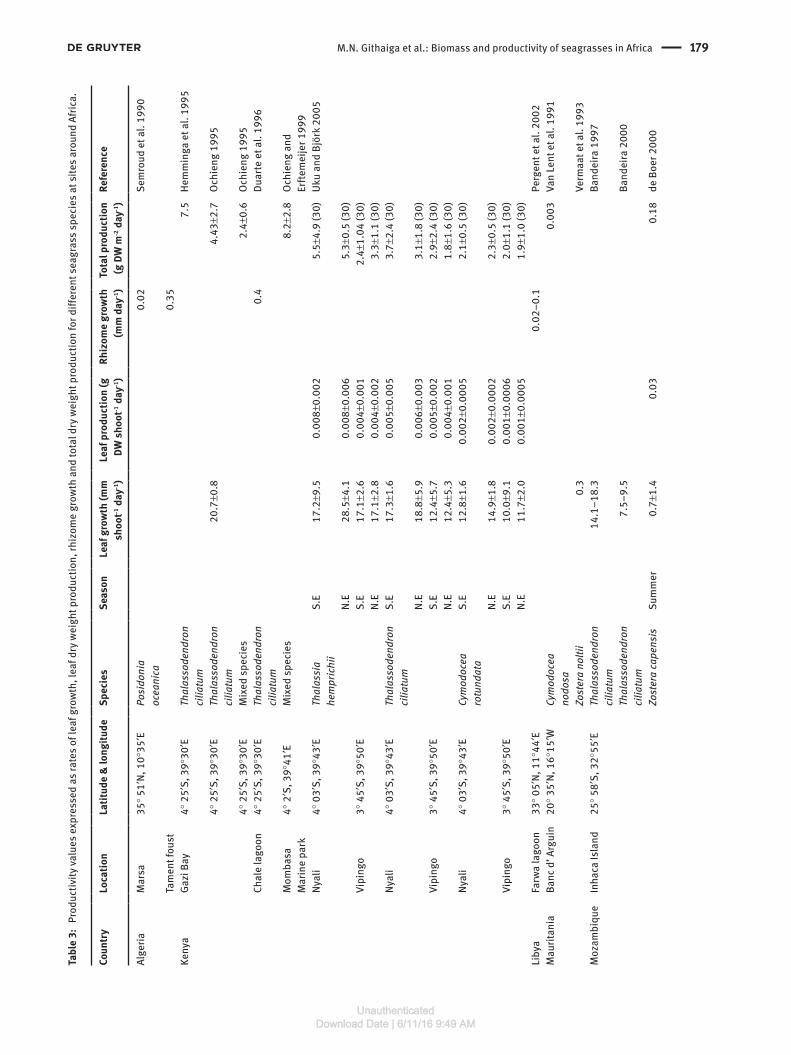
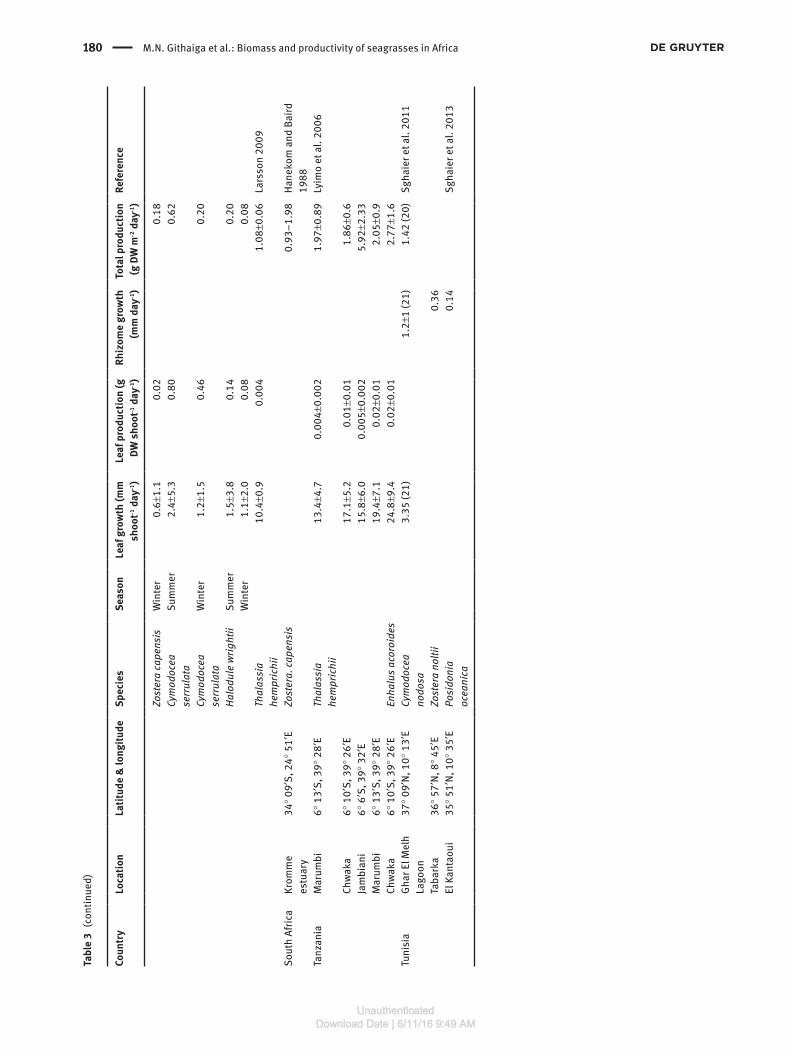
Productivity rates of seagrasses in Africa
This review obtained 29 data sets on leaf growth rates, 24 on leaf production, seven on rhizome growth rates and 32 on total production (Table 3). The mean leaf growth rate was 12.4 mm shoot-1 day-1 while the mean leaf production was 0.07 g DW shoot-1 day-1. Rhizome growth rates were 0.36 mm day-1 while the mean total production was 2.5 g DW shoot-1 day-1. Lyimo et al. (2006) studied growth char-acteristics of Thalassia hemprichii and Enhalus acoroides at several sites in Zanzibar, where high growth rates in terms of leaf length and dry weight were observed for both species. In another study, Uku and Björk (2005) recorded higher growth rates for the same parameters for Thalassia hemprichii as compared to Cymodocea rotun-data and Thalassodendron ciliatum at Nyali and Vipingo, Mombasa, Kenya. In Gazi Bay, Kenya, Hemminga et al. (1995) reported total productivity for T. ciliatum that was much higher than reported from other sites (Table 3). In another study of a monospecific stand of T. ciliatum at Gazi Bay, Ochieng (1995) recorded a mean shoot growth rate of 20.7 mm day-1 which was higher than the rate recorded in most of the other studies for the same species. The review for all species, whether growing in multispecific or pure stands, indicated that Zostera capensis and Cymodocea serrulata had the lowest shoot growth rates of < 1 mm shoot-1 day-1 recorded at Inhaca Island, Mozambique (de Boer, 2000). Some seasonality is indicated for T. hemp-richii with a maximum of 28.5 mm shoot-1 day-1 during the North East monsoon and 17.2 mm shoot-1 day-1 during the South East monsoon at Nyali in Mombasa (Uku and Björk 2005). Daily leaf production also differed between sites and species with a maximum of 0.01 g DW shoot-1 day-1 for T. hemprichii recorded at Chwaka in Zanzibar (Lyimo
et al. 2006). Lowest daily leaf production was 0.001 g DW shoot-1 day-1 for Cymodocea rotundata recorded at Vipingo in Mombasa (Uku and Björk 2005). The mean productiv-ity rates for all species, where available, indicated that T. hemprichii had the highest total productivity rates while the lowest was in an eelgrass, Zostera capensis (Table 4). The mean leaf production per day for individual species was highest in Cymodocea serrulata while the lowest was in C. rotundata. Comparison of rhizome growth rates indi-cated highest rates in Cymodocea nodosa and lowest in Posidonia oceanica. The mean for total production was highest in mixed stands while the lowest was recorded in Halophila ovalis (Table 4).
Discussion and conclusionThis assessment of studies on seagrass biomass stocks and productivity around Africa found a limited number of papers and reports with most of them reporting from countries on the Western Indian Ocean coastline (Kenya, Tanzania, Mozambique, South Africa, Madagascar, Sey-chelles and Mauritius). A few studies have also been reported from the Red Sea coastline of Egypt, the north eastern part of the Atlantic coastline on the coast of Mau-ritania and Morocco and more recently some studies (unpublished), have emerged from the Mediterranean coastline of Tunisia. However, the limited number of studies demonstrates a paucity of information on the carbon budget and flows in Africa. Similar observations of a geographical bias in research on seagrass biomass stocks, with Africa particularly underrepresented, have been made in other reviews (Duarte and Chiscano 1999,
Table 4: Mean (±S.E) productivity values expressed as rates of leaf growth, leaf dry weight production, rhizome growth and total dry weight production for seagrass species based on all available data around the African coast.
Species Leaf growth (mm shoot-1 day-1)
Leaf production (g DW shoot-1 day-1)
Rhizome growth (mm day-1)
Total Production (g DW m-2 day-1)
Cymodocea nodosa 3.35±0 1.2±0 0.71±0.7Cymodocea rotundata 12.35±1.0 0.002±0001 2.08±0.1Cymodocea serrulata 1.8±0.6 0.63±0.17 0.41±0.2Enhalus acoroides 24.8±0 0.02±0 2.77±0Halophila ovalis 1.5±0 0.14±0 0.2±0Posidonia oceanica 0.19±0.1Thalassia hemprichii 17.33±1.6 0.007±0.01 3.26±0.6Thalassodendron ciliatum 15.18±1.6 0.05±0.01 0.4±0 3.90±0.7Zostera capensis 0.8±0.2 0.04±001 0.47±0.3Zostera noltii 0.004±0Mixed 5.3±2.9
UnauthenticatedDownload Date | 6/11/16 9:49 AM
M.N. Githaiga et al.: Biomass and productivity of seagrasses in Africa 183
Fourqurean et al. 2012). Some of the seagrass studies in Africa concentrated on one biomass pool (above-ground or below-ground) while others focused on total biomass only (Table 2). An important observation in this review is that seagrass studies in Africa have ignored the sediment organic carbon, the most important part of the putative “blue carbon” sink provided by seagrasses, revealing a major gap in seagrass blue carbon work. Since the reviewed studies reported on only 14 out of a total of 34 species in the Tropical Atlantic, Tropical Indo-Pacific and South African flora, the current work suggests that the basic ecology, including productivity and standing stock, of many species remains largely unknown.
The available data from the seagrass biomass and productivity studies in Africa reveal that seagrasses allo-cate higher biomass to their below-ground than their above-ground components, with mean estimates for the above and below-ground biomasses of 174.4 g DW m-2 and 474.6 g DW m-2, respectively. In a review of seagrass biomass from different studies globally, Duarte and Chiscano (1999) arrived at above- and below-ground mean biomasses of 223.9 g DW m-2 and 237.4 g DW m-2, respec-tively. These findings differ from the results of this study in which the above-ground biomass was only ~37% of the biomass below-ground. Though these results deviate from our findings, our results are consistent with other observations, such as the most recent review of a global dataset, that the below-ground component of seagrasses forms the largest proportion of the living seagrass biomass and may constitute about two thirds of the total biomass in seagrass meadows (Fourqurean et al. 2012). The simi-larity of above-ground and below-ground biomass esti-mates in Duarte and Chiscano (1999) was attributed to the fact that some seagrass biomass studies did not measure the below-ground biomass, which in some cases could account for 15–50% of the total production as observed in an earlier study (Duarte et al. 1998). Though grazing and mechanical damage inflicted by wave scouring and by human activities may not significantly affect seagrass productivity and biomass storage, it nevertheless impacts on the meadows leading to high turnover rates especially for the above-ground component.
The mean estimate for total seagrass biomass in this review of 514.3.4 g DW m-2 is within the global range. The seagrasses of Abu Dhabi in the United Arab Emirates were estimated to contain a total biomass of 122.3 g DW m-2 (Campbell et al. 2014). In a review of global seagrass carbon storage, the Posidonia oceanica of the Mediter-ranean Sea were found to have the highest biomass at 2144 g DW m-2 while the mean biomass from the global seagrass data was estimated at 738.4 g DW m-2 (Fourqurean
et al. 2012). While this global estimate is higher than our total African biomass estimate, this could be explained by the influence of the high biomass of Posidonia oceanica in other regions as well as the limited information on sea-grass biomass from Africa in previous global estimates. In terms of the five regions along the coasts of Africa where seagrass research has been done, this study observed that the East African seagrasses had the highest biomass at 738.1 g DW m-2 compared to 370.8 g DW m-2 for the South-ern Mediterranean where Cymodocea nodosa was the dominant species. No study was found from this southern part of the Mediterranean Sea containing information for Posidonia oceanica.
The review observed that higher biomass values occurred in larger species compared to the smaller species (Figure 2). This may suggest that larger species tend to develop higher below-ground biomass and hence have a higher capacity for biomass storage due to the relatively slow turnover of the below-ground materials (Duarte and Chiscano 1999). The current assessment of available data from Africa on seagrass biomass supports this view.
The current review arrived at a mean total produc-tion estimate of 912.5 g DW m-2 year-1 against 1012 g DW m-2 year-1 obtained in a previous seagrass biomass and pro-duction reassessment using a global data set (Duarte and Chiscano 1999) and an earlier one of 816 g DW m-2 year-1 (Duarte and Cebrián 1996). Seagrass beds with mixed species were found to have the highest total production, estimated at 1935 g DW m-2 year-1, followed by Thalasso-dendron ciliatum at 1423 g DW m-2 year-1, suggesting that some species do better when in association with others. Growth patterns for different species and variation in environment between sites could account for the differ-ences in values observed. Some species may have the potential to accumulate biomass but this may be kept low by resource limitation or due to the heavy losses caused by physical disturbance (Duarte and Chiscano 1999). Biomass and productivity for some seagrass species was reported to exhibit seasonality which could be attributed to periodical fluctuations in abiotic factors such as irradi-ance, temperature and hydrological conditions (Uku and Björk 2005, de Boer 2000).
The estimates arrived at in this study may involve con-siderable errors, given the general paucity of studies, par-ticularly for some seagrass species, and a lack of uniformity in the sampling methods used by different researchers. However, with the development of the Blue Carbon sam-pling manual by the International Blue Carbon Initiatives Scientific Working Group (Howard et al. 2014, http://the blue carbon initiative.org), and new emphasis on research-ers adopting uniform sampling protocols, future research
UnauthenticatedDownload Date | 6/11/16 9:49 AM
184 M.N. Githaiga et al.: Biomass and productivity of seagrasses in Africa
should produce more reliable and comparable estimates. Whilst the research gap revealed here may be similar to many other areas in which Africa is under-represented, seagrasses perhaps present a particular challenge for research in countries with relatively poor infrastructure and resources, since they may require expensive sampling work utilising specialised skills such as scuba diving.
Considering that the African coastline is extensive with large areas of seagrass cover, the spatial extent of study is very limited. The fact that this review did not find seagrass biomass studies from the West African coast, with the exception of Mauritania which is more to the North West coast, is another clear indication of the paucity of knowledge on seagrass biomass stocks in Africa. A major-ity of the studies have been done on the West Indian Ocean coastline mainly through funding by the West Indian Ocean Marine Sciences Association (WIOMSA) in part-nership with the well-established research Institutions in the region or through partnership with institutions outside Africa. This signifies the importance of strength-ening collaboration between institutions and the need for increased research funding if the knowledge gaps are to be filled. As the first review of seagrass biomass and pro-ductivity in Africa, we hope the current work will generate interest among the scientific community by identifying an important and missed opportunity for research. By con-tributing to a better understanding of the role of seagrass ecosystems in carbon budgets in Africa this may help to support the protection of these valuable ecosystems.
Acknowledgements: This article is based on research undertaken for Coastal Ecosystem Services in East Africa (CESEA) NE/L001535/1 research project and was funded with support from the Ecosystem Services for Poverty Alleviation (ESPA) programme. The ESPA programme is funded by the Department for International Development (DFID), the Economic and Social Research Council (ESRC) and the Natural Environment Research Council (NERC). Additional support was made through Edinburgh Napier University and Kenya Marine and Fisheries Research Insti-tute (KMFRI) to which we are grateful. Finally, we thank the three anonymous reviewers for their constructive com-ments which improved the quality of the manuscript.
ReferencesAdams, J.B. and M.M.B. Talbot. 1992. The influence of river
impoundment on the estuarine seagrass Zostera capensis Setchell. Bot. Mar. 35: 69–76.
Aleem, A.A. 1984. Distribution and ecology of seagrass communi-ties. Deep Sea Res. 31: 919–933.
Bandeira, S.O. 1997. Dynamics, biomass and total rhizome length of the seagrass Thalassodendron ciliatum at Inhaca Island, Mozambique. Plant Ecol. 130: 133–141.
Bandeira, S.O. 2000. High production rates of the seagrass Thalas-sodendron ciliatum from the rocky and sandy habitats in Southern Mozambique: a comparative study In: (Diversity and Ecology of Seagrasses in Mozambique): emphasis on Thalas-sodendron ciliatum. structure, dynamics, nutrients and genetic variability. Ph.D. thesis. Göteborg. University, Sweden. pp. 18.
Bandeira, S.O. 2002. Leaf production rates of Thalassodendron cili-atum from rocky and sandy habitats. Aquat. Bot. 72: 13–24.
Bououarour, O., R. El Kamcha, L. Boutahar, A. Tnoumi, Z. Bendahhou, A. Benhoussa and B. Hocein. 2015. In:(Mediterranean Seagrass Workshop). Spatial patterns of the Zostera noltii meadows across the Atlantic coast of Morocco: is there a latitudinal gradient?-Sardinia, Italy. pp. 81.
Boutahar, L., Y.S. Ramzi, O. Atef, R. El Kamcha, A. Benhoussa, E. Ostale and H. Bazairi. 2015. In: (Mediterranean Seagrass Work-shop). First data on biomass and abundance of two eelgrass (Zostera marina) meadows south to the strait of Gilbraltar Jbel Moussa, Morocco. Sardinia, Italy. pp. 109.
Campbell, J.E., E.A. Lacey, R.A. Decker, S. Crooks and J.W. Fourqu-rean. 2014. Carbon storage in Seagrass Beds of Abu Dhabi, United Arab Emirates. Estuar. Coast. 38: 242–251.
Christie, N.D. 1981. Primary production in the Langebaan Lagoon. In: (J.H. Day. ed.). Estuarine ecology with particular reference to Southern Africa. Cape Town, Balkema. pp. 101–115.
Daby, D. 2003. Effects of seagrass bed removal for tourism purposes in a Mauritian Bay. Environ. Pollut. 125: 313–324.
de Boer, W.F. 2000. Biomass dynamics of seagrasses and the role of mangrove and seagrass vegetation as different nutrient sources for an intertidal ecosystem. Aquat. Bot. 66: 225–239.
Duarte, C.M. M.A. Hemminga, N. Marba. 1996. Growth and population dynamics of Thalassodendron ciliatum in a Kenyan back-reef lagoon. Aquat. Bot. 55: 1–11.
Duarte, C.M. and J. Cebrián. 1996. The fate of marine autotrophic production. Limnol. Oceanogr. 41: 1758–1766.
Duarte, C. and C. Chiscano. 1999. Seagrass biomass and produc-tion: a reassessment. Aquat. Bot. 65: 159–174.
Duarte, C., M.M. Merino, N.S.R. Agawin, J. Uri, M.D. Fortes, M.E. Gallegos, N.Marba and M.A Hemminga. 1998. Root production and below-ground seagrass biomass. Mar. Ecol. Prog. Ser. 171: 97–108.
Eklöf, J.S., M. de la Torre Castro, L. Adelsköld, N.S. Jiddawi and N. Kautsky. 2005. Differences in macrofaunal and seagrass assemblages in seagrass beds with and without seaweed farms. Estuar. Coast. Shelf S. 63: 385–396.
Fourqurean, J.W., C.M. Duarte, H. Kennedy, N. Marbà, M. Holmer, M.A. Mateo and D. Krause-jensen. 2012. Seagrass ecosystems as a globally significant carbon store. Nat. Geo. 5: 1–5.
Gab-Alla, A. 2001. Ecological Status of the Seagrass Community in Sharm El-Moyia Bay (Gulf of Aqaba, Red Sea) after Oil Pollution in 1999. Mar. Sci. 12: 231–239.
Grindley, J.R. 1976. Report on ecology of Knysna Estuary and pro-posed Braamekraal Marina. (Internal Report). School of Environ-mental Studies, University of Cape Town, South Africa. pp. 133.
Gullström, M., B. Lundén, M. Bodin, J. Kangwe, M.C. Öhman, M.S.P. Mtolera and M. Björk. 2006. Assessment of changes in the
UnauthenticatedDownload Date | 6/11/16 9:49 AM
M.N. Githaiga et al.: Biomass and productivity of seagrasses in Africa 185
seagrass-dominated submerged vegetation of tropical Chwaka Bay (Zanzibar) using satellite remote sensing. Estuar. Coast. Shelf S. 67: 399–408.
Gullström, M., M. Bodin, P.G. Nilsson and M.C. Öhman. 2008. Seagrass structural complexity and landscape configuration as determinants of tropical fish assemblage composition. Mar. Ecol. Prog. Ser. 363: 241–255.
Gwada, P. 2004. An assessment of seagrass survival and function-ing in response to manipulations in sediment redox at Nyali Lagoon, Mombasa, Kenya. WIOMSA report. MARG-1. GRANTEE 2001/2002.
Hanekom, N. and D. Baird. 1988. Distribution and variations in seasonal biomass of eelgrass. Zostera capensis in the Kromme estuary, St Francis Bay South Africa. S. Afr. J. Mar. Sci. 7: 51–59.
Hemminga, M.A., P. Gwada, F.J. Slim, P. de Koeyer and J. Kazungu. 1995. Leaf production and nutrient contents of the seagrass Thalassodendron ciliatum in the proximity of a mangrove forest (Gazi Bay, Kenya). Aquat. Bot. 50: 159–170.
Howard, J., S. Hoyt, K. Isensee, M. Telszewski and E. Pidgeon (eds.). 2014. Coastal Blue Carbon Methods for assessing carbon stocks and emmission factors in mangroves, tidal salt marshes and seagrasses. Conservation International, Intergovernmental Oceanographic Commission of UNESCO, International Union for Conservation of Nature, Arlington, Virginia, USA.
Imen, B.S. and S Abdessalem. 2015. In: (Mediterranean Seagrass Workshop). Distribution, biomass and phenology of Zostera noltii meadows in the Northern lagoon of Tunis in the summer of 2014. Sardinia, Italy. pp. 80.
Kamermans, P., M.A. Hemminga, J.F.Tack, M.A. Mateo, N. Marbà, M. Mtolera and Daele, T. Van. 2002. Groundwater effects on diversity and abundance of lagoonal seagrasses in Kenya and on Zanzibar Island (East Africa). Mar. Ecol. Prog. Ser. 231: 75–83.
Larsson, S. 2009. The Production of the Seagrass Thalassia hem-prichii in relation to epiphytic biomass. M.Sc. thesis (unpub-lished). Göteborg. University, Sweden. pp. 12.
Lugendo, B.R., Y. Mgaya and A. Semesi. 2001. The seagrass and associated macroalgae at selected beaches along Dar es Salaam coast. In: (M.D. Richmond and J. Francis, eds.) Marine science development in Tanzania and East Africa. WIOMSA Books Series. pp. 359–374.
Lyimo, T.J., E.F. Mvungi, C. Lugomela and M. Björk. 2006. Seagrass biomass and productivity in Seaweed and Non-Seaweed Farming areas in the East Coast of Zanzibar. WIO J. Mar. Sci., 5: 141–152.
Lyimo, T., E. Mvungi and Y. Mgaya. 2008. Abundance and diversity of seagrass and macrofauna in the intertidal areas with and with-out seaweed farming activities in the east coast of Zanzibar. Tanz. J. Sci. 34: 41–52.
Martins, A. and S. Bandeira. 2001. Biomass distribution and leaf nutrient concentrations and resorption of Thalassia hemprichii at Inhaca Island, Mozambique. Afr. J. Bot. 67: 439–442.
Mateo M.A., J. Cebrian, K. Dunton and T. Mutchler. 2006. Carbon flux in seagrass ecosystem. In: (A. Larkum, R. Orth and C. Duarte. eds). Seagrass biology, ecology and conservation. Springer-Verlag, Netherlands. pp. 159–192.
Mostafa, H.M. 1996. Preliminary observations of the seagrass Cymo-docea nodosa (Ucria) Ascherson in the Mediterranean waters of Alexandria, Egypt. Bull. Natl Inst. Ocea. Fish. 22: 19–28.
Mvungi, E.F. 2011. Seagrasses and eutrophication Interactions between seagrass photosynthesis. Ph.D thesis (unpublished). Stockholm University, Sweden. pp. 44.
Nellemann, C., E. Corcoran, C.M. Duarte, L. Valdes, C. De Young, L. Fonseca and G. Grimsditch. (eds). 2009. Blue carbon. A rapid response assessment. GRID-Arendal. United Nations Environ-mental Programme. ISBN: 978-82-7701-060-1.
Ochieng, C.A. 1995. Productivity of seagrasses with respect to inter-system fluxes Gazi Bay (Kenya). In: Interlinkages between East-ern African Coastal Ecosystems. Contract No. T53-CT92-0114. Final report. pp. 82–86.
Ochieng, C.A. and P.L. Erftemeijer. 1999. Accumulation of seagrass beach cast along the Kenyan coast: a quantitative assessment. Aquat. Bot. 65: 221–238.
Ochieng, C.A. and P.L. Erftemeijer. 2003. Seagrasses of Tanzania and Kenya. In: (E. Green and F. Short, eds.). World atlas of seagrasses. World Conservation Monitoring Centre. University of California Press, USA, Berkely. pp. 93–100.
Paula, J., P.F. Ecosta, A. Martins and D. Gove. 2001. Patterns of abundance of seagrasses and associated infaunal communi-ties at Inhaca Island, Mozambique. Estuar. Coast. Shelf S. 53: 307–318.
Pergent, G., A. Djellouli, A.A. Hamza, K.S. Ettayeb, A.A. El Mansouri, F.M. Talha and F Platini. 2002. Characterization of the benthic vegetation in the Farwà Lagoon (Libya). J. Coast. Cons. 8: 119–126.
Semroud, R., S. Mezegrane and L. Soltane. 1990. Etude lépidochro-nologique de Posidonia oceanica dans la régiond’Alger (Algé-rie): donnéspréliminaires. Rapp. P.V. Réun. Comm. Int. Explor. Sci. Médit. 31: 10.
Sghaier, Y.R. 2012. Seasonal variation of Cymodocea nodosa in the Ghar El Melh lagoon (Tunisia), with reference to insolation, temperature and salinity effects. Bull. Inst. Natl. Sci. Tech. Mede. Salammbõ. 39: 117–125.
Sghaier, Y.R., R. Zakhama-Sraieb and F. Charfi-Cheikhrouh. 2011. Pri-mary production and biomass in a Cymodocea nodosa meadow in the Ghar El Melh lagoon, Tunisia. Bot. Mar. 54: 411–418.
Sghaier, Y.R., R. Zakhama-Sraieb and F. Charfi-Cheikhrouha. 2013. Patterns of shallow seagrass (Posidonia oceanica) growth and flowering along the Tunisian coast. Aquat. Bot. 104: 185–192.
Short, F., T. Carruthers, W. Dennison and M. Waycott. 2007. Global seagrass distribution and diversity: A bioregional model. J. Exp. Mar. Biol. Ecol. 350: 3–20.
Talbot, M.M.B. and G.C. Bate. 1987. The distribution and biomass of the seagrass Zostera capensis in a warm-temperate estuary. Bot. Mar. 30: 91–99.
Uku, J.N. and M. Björk. 2005. Productivity aspects of three tropical seagrass species in areas of different nutrient levels in Kenya. Estuar. Coast. Shelf S. 63: 407–420.
Uku, J.N., E.E. Martens and K.M. Mavuti. 1996. An ecological assess-ment of Littoral Seagrass Communities in Diani and Galu Coastal Beaches, Kenya. M.Sc thesis (unpublished). University of Nairobi. pp. 185.
van der Laan, B.B.P.A. and W.J. Wolff. 2006. Circular pools in the seagrass beds of the Banc d’Arguin, Mauritania, and their possible origin. Aquat. Bot. 84: 93–100.
Van Lent, F., P.H. Nienhuis and J.M. Verschuure. 1991. Production and biomass of the seagrasses Zostera-noltii Hornem and Cymodocea nodosa (Ucria) Aschers at the Banc-Darguin (Mauritania, N.W Africa). A preliminary approach. Aquat. Bot. 41: 353–367.
UnauthenticatedDownload Date | 6/11/16 9:49 AM
186 M.N. Githaiga et al.: Biomass and productivity of seagrasses in Africa
Vermaat, J.E., J.J. Beijer, R. Gijlstra, M.J.M. Hootsmans, C.J.M. Philippart., N.W. van den Brink and W. van Vierssen. 1993. Leaf dynamics and standing stocks of intertidal Zostera noltii Hornem. and Cymodocea nodosa (Ucria) Ascherson on the Banc d’Arguin (Mauritania). Hydrobiologia. 258: 59–72.
Bionotes
Michael N. GithaigaMarine Ecology and Environmental Programme, Kenya Marine and Fisheries Research Institute, P.O. Box 81651, Mombasa, Mombasa Coast, Kenya; and School of Life, Sport and Social Sciences, Edinburgh Napier University, EH11 4BN, Edinburgh, [email protected]
Michael N. Githaiga is a final year PhD student at Edinburgh Napier University. His PhD thesis is titled “Role of seagrass as carbon sinks, Gazi Bay, Kenya”. He graduated with a Bachelor of Education Science degree from Kenyatta University and later on a Master of Science degree (Plant Ecology) from the same University. His MSc research was titled “Structure and biomass accumulation of natural mangroves Forest of Gazi Bay, Kenya”. He has a great interest in marine ecology with a strong focus on carbon accounting in marine ecosystems.
Linda GilpinSchool of Life, Sport and Social Sciences, Edinburgh Napier University, EH11 4BN, Edinburgh, UK
Linda Gilpin is a lecturer in Aquatic Biology at Edinburgh Napier University. She was awarded a PhD in Biogeochemistry by Queen’s
University Belfast, focusing on nitrogen metabolism and went on to study primary productivity and nutrient dynamics in a range of oceanic and coastal systems including the response of the microbial community to changes associated with eutrophication. More recent collaborations have involved the assessment of change in plankton communities.
James G. KairoMarine Ecology and Environmental Programme, Kenya Marine and Fisheries Research Institute, P.O. Box 81651, Mombasa, Mombasa Coast, Kenya
James G. Kairo earned his PhD in Marine Sciences from the Free University of Brussels (VUB) in Belgium. He currently works as Principal Scientist with the Kenya Marine and Fisheries Research Institute, and is a member of both the International Blue Carbon Scientific Working Group and the newly launched Science for Blue Carbon (SBC) working group. Kairo has vast experiences in the conservation, rehabilitation and sustainable utilization of mangrove resources; which has earned him local and international awards. In 2010, Dr Kairo was awarded the Kenya’s Presidential Award of the Moran of the Order of the Burning Spear (MBS) for his exemplary work on marine resources management. He was the lead author in the development of the 2013 supplement of the 2006 IPCC Guide-lines for National Greenhouse Gas Inventories.
Mark HuxhamSchool of Life, Sport and Social Sciences, Edinburgh Napier University, EH11 4BN, Edinburgh, UK
Mark Huxham is Professor of Teaching and Research in Environmen-tal Biology at Edinburgh Napier University. Mark’s main research interests are in the ecology and management of coastal ecosys-tems particularly mangroves and seagrasses. He is Director of the Association for Coastal Ecosystem Services, a charity that helps to administer the world’s first community-based mangrove conserva-tion project funded by the sale of carbon credits.
UnauthenticatedDownload Date | 6/11/16 9:49 AM


![Bernard Gilpin - Houghton Le Spring Heritagehoughtonlespring.org.uk/gilpin/bernard_gilpin.pdf · 2017-07-02 · March 1557 – Bernard Gilpin [40] accepted the offer of Rector for](https://img.pdfslide.net/doc/110x75/5e2d3ac93473f82a7c24c634/bernard-gilpin-houghton-le-spring-heri-2017-07-02-march-1557-a-bernard-gilpin.jpg)


![Službene novine Kraljevine Jugoslavije, br. 15/1944. [Kairo]](https://img.pdfslide.net/doc/110x75/577cc9b21a28aba711a459f6/sluzbene-novine-kraljevine-jugoslavije-br-151944-kairo.jpg)


![Službene novine Kraljevine Jugoslavije, br. 14/1944. [Kairo]](https://img.pdfslide.net/doc/110x75/577cc9b21a28aba711a459e4/sluzbene-novine-kraljevine-jugoslavije-br-141944-kairo.jpg)
![Službene novine Kraljevine Jugoslavije, br. 18/1944. [Kairo]](https://img.pdfslide.net/doc/110x75/577cc9a21a28aba711a441cb/sluzbene-novine-kraljevine-jugoslavije-br-181944-kairo.jpg)

![Službene novine Kraljevine Jugoslavije, br. 13/1943. [Kairo]](https://img.pdfslide.net/doc/110x75/577cc9b21a28aba711a459bf/sluzbene-novine-kraljevine-jugoslavije-br-131943-kairo.jpg)
![Službene novine Kraljevine Jugoslavije, br. 17/1944. [Kairo]](https://img.pdfslide.net/doc/110x75/577cc9a21a28aba711a441a2/sluzbene-novine-kraljevine-jugoslavije-br-171944-kairo.jpg)