Embed Size (px)
Citation preview

The RNA binding protein PTBP1 is necessary for B cell selection in germinal centers
Elisa Monzón-Casanova1,5, Michael Screen1, Manuel D. Díaz-Muñoz1, Richard M. R. Coulson1, Sarah E. Bell1, Greta Lamers1, Michele Solimena2,3,4, Christopher W.J. Smith5, and Martin Turner1,*
1Laboratory of Lymphocyte Signaling and Development, The Babraham Institute, Cambridge, UK
2Univ. Hospital and Faculty of Medicine, TU Dresden, Germany
3Paul Langerhans Institute Dresden of the Helmholtz Center at TU, Dresden, Germany
4Max Planck Institute for Molecular Cell Biology and Genetics, Dresden, Germany
5Department of Biochemistry, University of Cambridge, Cambridge, UK
Abstract
Antibody affinity maturation occurs in germinal centres (GC) where B cells cycle between the
light zone (LZ) and the dark zone. In the LZ GC B cells bearing immunoglobulins with the highest
affinity for antigen receive positive selection signals from T helper cells that promotes their rapid
proliferation. Here we show that the RNA binding protein PTBP1 is necessary for the progression
of GC B cells through late S-phase of the cell cycle and for affinity maturation. PTBP1 is required
for the proper expression of the c-MYC-dependent gene program induced in GC B cells receiving
T cell help and directly regulates the alternative splicing and abundance of transcripts increased
during positive selection to promote proliferation.
Keywords
Alternative splicing; germinal centre; light zone; dark zone; RNA Binding Proteins; cell cycle proliferation; antibody affinity maturation; Polypyrimidine Track Binding Proteins; iCLIP
Users may view, print, copy, and download text and data-mine the content in such documents, for the purposes of academic research, subject always to the full Conditions of use:http://www.nature.com/authors/editorial_policies/license.html#terms*Corresponding author: Martin Turner ([email protected]).
Accession codesGSE100969
Data availabilitymRNAseq and iCLIP data that support the findings of this study have been deposited in GEO with the GSE100969 accession code.
Author ContributionsE.M.-C., M.T. and C.W.J.S. designed experiments. E.M.-C., M.Sc., M.D.D.-M., S.E.B. and G.L., performed experiments and analysed data. E.M.-C. carried out computational analysis. R.M.R.C. ran DaPars. M.So. provided Ptbp1tm1Msol mice and anti-PTBP2 antibody. E.M.-C. and M.T. wrote the manuscript with input from the co-authors.
Competing Financial InterestsThe authors declare no competing financial interests.
Europe PMC Funders GroupAuthor ManuscriptNat Immunol. Author manuscript; available in PMC 2018 July 22.
Published in final edited form as:Nat Immunol. 2018 March ; 19(3): 267–278. doi:10.1038/s41590-017-0035-5.
Europe PM
C Funders A
uthor Manuscripts
Europe PM
C Funders A
uthor Manuscripts

Introduction
Germinal centres (GCs) are specialized areas of secondary lymphoid tissues where B cells
undergo antibody affinity maturation. The GC can be divided into a dark zone (DZ)
characterized by extensive proliferation and somatic hypermutation (SHM) and a light zone
(LZ) where B cells are less proliferative and make contacts with follicular dendritic cells and
T cells. There, B cells are positively selected to survive and undergo further rounds of
proliferation in the DZ1,2. T cell help promotes faster cell cycle progression, a greater
number of cell divisions and increased SHM frequency resulting in increased antibody
affinity maturation3,4. Positive selection in the LZ results in the transient expression of the
transcription factor c-MYC necessary for the progression of selected cells through the cell
cycle5,6. c-MYC also induces the transcription of genes important for anabolic
metabolism3,7. Moreover, mTORC1 activity is increased during positive selection and
promotes the anabolic gene expression program8. In addition to c-MYC, the transcription
factors AP4, FOXO1 and BATF are important during the LZ-DZ transition of GC B cells9–
11. These findings highlight the existence in B cells of relays of transcription factors that are
responsive to T cell help and promote B cell proliferation and mutation.
Alternative splicing (AS), alternative polyadenylation (APA), mRNA decay and translation
have the potential to regulate cell fate. However, we know relatively little about the relevant
changes and regulation of AS during immune responses12–15 and molecular regulation of
APA is only beginning to be appreciated16,17. The impact of RNA binding proteins (RBP)
that have the potential to integrate multiple aspects of gene expression in B cells undergoing
selection in the GC is only emerging13,14.
One class of RBP with pleiotropic function are the Polypyrimidine Tract Binding Proteins
(PTBP)18–20. Most cell types express PTBP1, whereas PTBP2 is abundant in differentiated
neurons. During neuronal differentiation there is a switch between the expression of PTBP1
and PTBP2 which drives changes in AS patterns of genes important for neuronal
function18,21. PTBP3 is highly expressed in hematopoietic cells and previously shown to be
co-expressed with PTBP1 in B lymphocytes22. PTBP1 is both a repressor and an activator
of AS18 and has been implicated in APA, mRNA decay and translational
regulation19,23,24. In CD4 T cells PTBP1 has been shown to enhance CD40L-mRNA
stability25 and in human B cells to be responsive to toll-like receptor 926. Although PTBP1
has the potential to regulate posttranscriptional gene expression programs in lymphocytes its
physiological functions in lymphocyte development and activation are unknown.
Here we show that PTBP1 acts in concert with c-MYC to ensure the selection of B cell
clones with the highest affinity for antigen by promoting the proliferation of GC B cells.
PTBP1 guarantees proper posttranscriptional processing and expression of genes induced as
part of the c-MYC-dependent gene expression program.
Monzón-Casanova et al. Page 2
Nat Immunol. Author manuscript; available in PMC 2018 July 22.
Europe PM
C Funders A
uthor Manuscripts
Europe PM
C Funders A
uthor Manuscripts

Results
PTBP1 expression is increased in positively selected GC B cells
Uniquely amongst Ptb-family members the expression of Ptbp1-mRNA was increased ~1.5-
fold in GC B cells compared to naive B cells (Supplementary Fig. 1a,b). Ptbp2 transcripts
were rare and showed evidence of skipping exon 10 (Supplementary Fig. 1b) generating
mRNAs degraded by nonsense-mediated RNA decay (NMD)27. Ptbp1- but not Ptbp3-mRNA was increased 1.4-fold upon c-MYC expression in LZ B cells (Fig. 1a) and was also
increased in GC B cells that had received the greatest levels of T cell help (Supplementary
Fig. 1c,d). A validated a panel of monoclonal antibodies recognizing PTBP1, PTBP2 and
PTBP3 that were specific for each PTBP and able to detect the proteins by flow cytometry
(Supplementary Fig. 2a,b) detected PTBP1 and PTBP3 but not PTBP2 in B cells (Fig. 1b,
Supplementary Fig. 1f and 2a,b). PTBP1 protein was increased (~1.6-fold) in GC B cells
compared to non-GC B cells (Fig. 1b) and increased ~1.4-fold in GFP-c-MYC reporter
transgene (MycGFP)-positive GC B cells compared to GFP-c-MYC-negative GC B cells
(Fig. 1c). Previous studies showed that PTBP1 expression correlates positively with c-
MYC28 and that c-MYC binds to the promoter of PTBP1 in B cells29. Thus PTBP1 may act
downstream of, or in parallel with c-MYC, in GC B cells responding to T cell help.
PTBP1 is dispensable for B cell development
We validated conditional knockout (cKO) mice targeting Ptbp130 from the pro-B cell stage
by using the Cd79acre allele (Supplementary Fig. 2b,c,d). B cell development was normal in
the absence of PTBP1 (Supplementary Fig. 2c,e,f). Moreover, in lethally-irradiated CD45.1+
B6.SJL mice reconstituted with a 1:1 mixture of bone marrow cells from B6.SJL and
Cd79acre/+Ptbp1fl/fl mice the numbers of follicular B cells arising from the
Cd79acre/+Ptbp1fl/fl cKO bone marrow were not reduced compared to those arising from
B6.SJL bone marrow (Data not shown). In cells that had deleted Ptbp1 the expression of
PTBP2 was evident from the pro-B cell stage onwards (Supplementary Fig. 2d). The loss of
PTBP1 and expression of PTBP2 was confirmed by immuno-blotting (Supplementary Fig.
2a). As expected31, Ptbp1-deficient B cells also contained increased amounts of the long-
isoform of PTBP3 (Supplementary Fig. 2a). This indicates that although PTBP1 is not
necessary for B cell development its deletion is consequential at the molecular level.
PTBP1 in B cells is necessary for the GC B cell response
We immunised Cd79acre/+Ptbp1fl/fl and Cd79a+/+Ptbp1fl/fl mice with 4-hydroxy-3-
nitrophenyl-acetyl conjugated to keyhole limpet hemocyanin (NP-KLH). Seven days later
the proportions and absolute numbers of GC B cells per spleen were reduced (5.9- and 3.9-
fold, respectively) in Cd79acre/+Ptbp1fl/fl cKO compared to Cd79a+/+Ptbp1fl/fl control mice
(Fig. 2a,b). The proportions of GC B cells with a DZ phenotype were reduced in Ptbp1-
deficient GC B cells compared to control GC B cells (Fig. 2a,b) despite efficient depletion of
the protein (Supplementary Fig. 3a). By contrast, Cd79acre/+Ptbp1fl/+ mice immunised with
NP-KLH showed similar GC B cell responses to those of Cd79a+/+Ptbp1fl/fl mice
(Supplementary Fig. 3b,c). The same GC B cell defects were found in Cd79acre/+Ptbp1fl/fl
cKO GC B cells from bone marrow chimeras where B6.SJL mice were reconstituted with a
1:1 mixture of bone marrow cells from CD45.1+ B6.SJL and CD45.2+ Cd79acre/+Ptbp1fl/fl
Monzón-Casanova et al. Page 3
Nat Immunol. Author manuscript; available in PMC 2018 July 22.
Europe PM
C Funders A
uthor Manuscripts
Europe PM
C Funders A
uthor Manuscripts

cKO mice (Supplementary Fig. 3d,e). Therefore, the defect in Ptbp1-deficient GC B cells
was cell-autonomous. These data indicate an indispensable role for PTBP1 function in GC B
cells.
PTBP1 is necessary for antibody affinity maturation
Cd79acre/+Ptbp1fl/fl cKO mice produced reduced amounts of high affinity antibodies
compared to Cd79a+/+Ptbp1fl/fl control mice (Fig. 2c). In Cd79a+/+Ptbp1fl/fl control mice the
ratio of high affinity versus total affinity antibodies increased over time, but this ratio
remained low in Cd79acre/+Ptbp1fl/fl cKO mice (Fig. 2d). Antibodies from mice lacking
Ptbp2 in B cells (Cd79acre/+Ptbp2fl/fl) showed no defect in affinity maturation compared to
Cd79a+/+Ptbp2fl/fl mice (Supplementary Fig. 3f,g). Cd79acre/+Ptbp1fl/fl cKO GC B cells had
switched to IgG1 in vivo at greater frequencies compared to Cd79a+/+Ptbp1fl/fl control GC B
cells (Supplementary Fig. 3h), indicating the presence of functional AID in Ptbp1-deficient
GC B cells. Additionally, mutations were found at similar frequencies in the Jh4-intronic
region of GC B cells sorted from Cd79acre/+Ptbp1fl/fl and Cd79a+/+Ptbp1fl/fl mice
(Supplementary Fig. 3i,j). Thus, PTBP1 is necessary in B cells for optimal antibody affinity
maturation, but this is unlikely to stem from reduced function of AID.
PTBP2 partially compensates for the loss of PTBP1 in GC B cells
The expression of PTBP2 in Ptbp1-deficient GC B cells could compensate for the absence of
PTBP1 in GC cells31,32. To address this in the absence of confounding effects due to the
deletion of genes during the bone marrow stages of B cell development, we introduced
transgenic-Aicda-cre (AicdaTg-cre) to generate Ptbp1 single and Ptbp1:Ptbp2 double
conditional knockout (dcKO) mice. After immunisation with sheep red blood cells (SRBCs)
the numbers and proportions of GC B cells of AicdaTg-cre Ptbp1fl/fl cKO mice were
reduced compared to Ptbp1fl/flPtbp2fl/fl control mice and the remaining GC B cells had the
altered LZ/DZ phenotype seen in Cd79acre/+Ptbp1fl/fl mice (Fig. 3a,b). AicdaTg-cre Ptbp1+/+Ptbp2+/+ mice showed similar LZ and DZ B cell numbers compared to
Ptbp1fl/flPtbp2fl/fl control mice (Supplementary Fig. 3k). Thus, PTBP1 function in B cells is
required subsequent to B cell activation and expression of AID.
Compared to Ptbp1fl/flPtbp2fl/fl control and AicdaTg-cre Ptbp1fl/fl single cKO mice very few
GC B cells were detected in AicdaTg-cre Ptbp1fl/flPtbp2fl/fl dcKO mice (Fig. 3a,b and
Supplementary Fig. 3k). The residual AicdaTg-cre Ptbp1fl/flPtbp2fl/fl dcKO GC B cells had
the phenotype typical of LZ B cells (Fig. 3a,b) and they expressed PTBP3, reduced amounts
of PTBP1 but no PTBP2 (Fig. 3c,d). No NP-specific IgG1 antibody secreting cells were
detected in AicdaTg-cre Ptbp1fl/flPtbp2fl/fl dcKO mice 21 days after immunisation with NP-
KLH (Data not shown). Thus, PTBP2, but not PTBP3, partially compensates for the loss of
PTBP1.
PTBP1 regulates mRNA abundance and alternative splicing in GC B cells
We performed mRNAseq on LZ and DZ B cells of Cd79a+/+Ptbp1fl/fl control and
Cd79acre/+Ptbp1fl/fl cKO (PTBP1 cKO) mice. In addition, we generated a transcriptome-
wide inventory of PTBP1 binding sites in mitogen-activated B cells using individual-
nucleotide resolution Cross-Linking and ImmunoPrecipitation (iCLIP) (Supplementary
Monzón-Casanova et al. Page 4
Nat Immunol. Author manuscript; available in PMC 2018 July 22.
Europe PM
C Funders A
uthor Manuscripts
Europe PM
C Funders A
uthor Manuscripts
Table 1). By combining mRNAseq with PTBP1 iCLIP we can discern direct from indirect
effects of PTBP1 on the transcriptome and, through the consideration of positional
information, deduce the likely mechanism of action of PTBP1. Changes in mRNA
abundance at the whole gene level in control LZ B cells compared to control DZ B cells
were consistent with those seen previously33 and were conserved in Ptbp1-deficient GC B
cells (Fig. 4a, Supplementary Fig. 4a,b and Supplementary Table 2).
Comparison of PTBP1 cKO to control GC B cells revealed 998 and 980 genes with
increased and decreased mRNA abundance, respectively, in the LZ, and 409 and 270 genes
with increased and decreased mRNA abundance, respectively, in the DZ (Fig. 4b,
Supplementary Table 2). The changes in genes that were differentially expressed in LZ and
DZ B cells due to Ptbp1 deletion showed a strong positive correlation (Supplementary Fig.
4c) indicating that the absence of PTBP1 affects the same genes in LZ and DZ B cells.
PTBP1 can increase mRNA stability when bound to 3’UTRs19,23. Amongst genes with
either increased or decreased mRNA abundance the proportions of genes bound by PTBP1
in their 3’UTRs were similar (~20%, Supplementary Fig. 4d). Thus, PTBP1-binding to
3’UTRs does not appear to have a marked preference towards increasing or decreasing
mRNA stability in GC B cells.
We used rMATS to determine inclusion level differences between two conditions for five
different types of AS events (Supplementary Fig. 4e,f). We identified 266 AS events more
skipped and 316 events more included (from 506 genes) with an inclusion level difference
greater than 10% in control LZ compared to control DZ B cells (Fig. 4c, Supplementary
Table 3) indicating extensive AS changes in the transition between LZ and DZ. The changes
in AS due to Ptbp1 deficiency were greater in both the magnitude and the number of events
(Fig. 4d, 856 AS events in LZ and 960 AS events in DZ GC B cells) than the changes seen
between LZ and DZ control B cells (Fig. 4c, 582 events). The 52% overlap of AS events that
change between LZ and DZ in control B cells and those affected by Ptbp1 deletion
(Supplementary Fig. 4g) indicates that PTBP1 affects a substantial proportion of the AS
events that differ between LZ and DZ B cells.
In LZ B cells 379 AS events were more skipped and 477 AS events were more included (in
670 genes) due to Ptbp1 deletion (Fig. 4d, Supplementary Table 3). In DZ B cells, 416 AS
events were more skipped and 544 AS events were more included (in 747 genes) due to
Ptbp1 deletion (Fig. 4d, Supplementary Table 3). The proportions of AS events directly
regulated by PTBP1, inferred from the binding of PTBP1 in the vicinity of the event, varied
depending on the type of AS event and ranged from ~50% in mutually exclusive exons
(MXEs) to ~7% in alternative 3’ splice sites (A3SS) (Supplementary Fig. 4h). The
proportions of skipped and included AS events due to Ptbp1 deletion bound by PTBP1 were
similar (Supplementary Fig. 4h) indicating that PTBP1 both represses and activates AS in
GC B cells. The overlap between genes that have different mRNA abundance and those that
have different AS due to Ptbp1 deletion is 6% in LZ and in 8% DZ (Fig. 4e). Similarly, there
was a small overlap between genes with changes in abundance and AS when control LZ B
cells are compared to control DZ B cells (Fig. 4e). Taken together, our data shows that
PTBP1 is a posttranscriptional regulator in GC B cells where it controls mRNA abundance
and five different types of AS events.
Monzón-Casanova et al. Page 5
Nat Immunol. Author manuscript; available in PMC 2018 July 22.
Europe PM
C Funders A
uthor Manuscripts
Europe PM
C Funders A
uthor Manuscripts

PTBP1 is necessary for the c-MYC-dependent program induced upon positive selection
To determine if PTBP1 regulated changes in annotated gene ontology (GO) pathways we
examined genes with changes at the mRNA abundance or AS level separately. Several GO
terms relevant to the biology of GC B cells were enriched amongst genes with different
mRNA abundance (Supplementary Fig. 5 and Supplementary Table 4). No pathways were
enriched (FDR<0.1) when AS changes were analysed (Supplementary Table 4). Instead,
individual genes of different pathways are regulated by PTBP1 at the AS level.
Pathways involved in nucleotide biosynthesis and cell proliferation were enriched amongst
genes with differential mRNA abundance in LZ and DZ B cells (Supplementary Fig. 5a-c).
In LZ B cells most of the differentially expressed genes within these pathways had
decreased mRNA abundance (Supplementary Fig. 5b). Genes involved in the regulation of
Ras protein signaling were also enriched in LZ B cells, but most of these genes had
increased mRNA abundance (Supplementary Fig. 5b). Pathways implicated in B cell
differentiation, lymphocyte migration, cholesterol metabolism and the regulation of
apoptosis in leukocytes were enriched in DZ B cells (Supplementary Fig. 5a,c). Among the
243 genes with different mRNA abundance that belong to the enriched pathways we found
64 bound by PTBP1 in their 3’UTR and only 10 to be AS in the absence of PTBP1
(Supplementary Fig. 5b,c). Thus PTBP1 directly regulates some of these genes, but also has
an indirect effect on the expression of genes in these pathways. We investigated further how
the lack of PTBP1 affects the expression of genes that are part of the c-MYC hallmark34
and also of genes induced in response to T cell help3,7. In LZ B cells lacking PTBP1 there
was a global decrease in mRNA abundance of the genes induced upon positive selection
compared to control LZ B cells (Fig. 5a). 21% of the genes with reduced mRNA abundance
in LZ B cells due to Ptbp1 deletion are part of the gene expression program induced upon
positive selection (Supplementary Fig. 6a and Supplementary Table 5).
Myc mRNA abundance and AS pattern were the same in Cd79acre/+Ptbp1fl/fl cKO and
Cd79a+/+Ptbp1fl/fl control LZ B cells (Fig. 5b and Supplementary Table 3). The proportions
of GFP-cMYC+ GC B cells and c-MYC protein levels following SRBC immunisation in
Rag2-/- mice reconstituted with Cd79acre/+Ptbp1fl/flMycGFP/GFP bone marrow cells were
similar to those of Rag2–/– mice reconstituted with Cd79a+/+Ptbp1fl/flMycGFP/GFP bone
marrow cells (Fig. 5c,d). Furthermore, Tfap4 mRNA encoding AP4 (Fig. 5b) and the levels
of Ser240/244 phosphorylation of ribosomal protein S6 in Cd79acre/+Ptbp1fl/fl cKO LZ GC
B cells were similar to those of Cd79a+/+Ptbp1fl/fl control LZ GC B cells (Supplementary
Fig. 6b). Additionally, Cxcr4, Cxcr5, Bcl-6, Bach2, Aicda, IL21r, Foxo1 and Batf and had
equivalent expression and AS patterns in Ptbp1-deficient and control GC B cells
(Supplementary Fig. 6c-e and Supplementary Table 3). Thus GC B cells do not require
PTBP1 for the sensing of T cell help or the induced expression of c-MYC.
28% of the mRNAs that are part of the c-MYC-dependent gene expression program induced
upon positive selection and reduced in LZ B cells due to Ptbp1 deletion were bound by
PTBP1 in their 3’UTR (Supplementary Fig. 6a and Supplementary Table 5). This indicates a
direct role of PTBP1 in stabilising a fraction, but not all, of c-MYC-dependent transcripts.
Moreover, 22 genes induced upon positive selection showed differential AS (inclusion level
difference >10%) due to Ptbp1-deletion (Fig. 5e and Supplementary Fig. 6a) and six of these
Monzón-Casanova et al. Page 6
Nat Immunol. Author manuscript; available in PMC 2018 July 22.
Europe PM
C Funders A
uthor Manuscripts
Europe PM
C Funders A
uthor Manuscripts
were bound by PTBP1 near the AS event (Supplementary Table 5). Pkm, Abcb1b, Tspan33, Phb2 and Dkc1 were the only genes with both reduced mRNA abundance and also
differential AS (inclusion level difference >10%) due to the lack of PTBP1. Thus PTBP1
regulates directly and indirectly the expression of the c-MYC-dependent gene expression
program in positively selected GC B cells through regulating mRNA abundance and AS.
PTBP1 regulates proliferation of GC B cells
We analysed if PTBP1 was required for GC B cell proliferation by measuring DNA content
and the incorporation of bromodeoxyuridine (BrdU) into GC B cells in vivo. The
proportions of Cd79acre/+Ptbp1fl/fl cKO GC B cells in late S-phase (BrdU+ with high DNA
content) were reduced compared to control Cd79a+/+Ptbp1fl/fl GC B cells in mice
immunised with NP-KLH (Fig. 6a,b). By contrast, the proportions of cells that were in early
S-phase (BrdU+ with low DNA content) were similar between Cd79acre/+Ptbp1fl/fl cKO and
control Cd79+/+Ptbp1fl/fl GC B cells. Additionally, Cd79acre/+Ptbp1fl/fl cKO GC B cells had
increased proportions of cells in G2/M phases compared to control Cd79a+/+Ptbp1fl/fl GC B
cells (Fig. 6a,b). The proportions of cells in late S-phase were reduced in both LZ (5/5
experiments) and DZ (4/5 experiments) B cells from Cd79acre/+Ptbp1fl/fl cKO mice
compared to Cd79a+/+Ptbp1fl/fl controls (Supplementary Fig. 7a). We also observed a
reduction in the proportion of cells in late S-phase of GC B cells from AicdaTg-cre Ptbp1fl/fl
cKOs compared to AicdaTg-cre Ptbp1+/+Ptbp2+/+ or Ptbp1fl/flPtbp2fl/fl controls immunised
with SRBCs (Supplementary Fig. 7b). The proportions of GC B cells in late S-phase were
also reduced amongst Ptbp1-deficient cells in bone marrow chimeras immunised with NP-
KLH (Supplementary Fig. 7c) showing that this is a cell autonomous defect. In contrast to
GC B cells, the proportions of cells at different stages of the cell cycle were normal in the
highly proliferative early-pre B cells of Cd79acre/+Ptbp1fl/fl cKO mice (Supplementary Fig.
7d). Thus PTBP1 is not universally required in cells that are undergoing cell division but is
necessary for the progression of GC B cells through late S-phase.
Closer examination of the expression of genes important for cell cycle progression revealed
that Ccnd2, Ccnd3 and Ccne2 were unaffected in Cd79acre/+Ptbp1fl/fl cKO GC B cells
compared to Cd79a+/+Ptbp1fl/fl control GC B cells (Supplementary Fig. 7e) suggesting that
the GO enrichment in proliferation and nucleotide biosynthetic pathways does not arise from
a failure to express early cell cycle progression factors. Impaired nucleotide synthesis could
cause replication stress as cells progress through S-phase and cause cell death35. Flow
cytometric analyses using a fixable viability dye to detect non-viable cells showed a higher
proportion of dead cells amongst Cd79acre/+Ptbp1fl/fl compared to Cd79a+/+Ptbp1fl/fl DZ GC
B cells (Fig. 6c,d). By contrast, the proportions of dead cells in LZ B cells were similar
between Ptbp1-deficient and sufficient cells (Fig. 6c,d). PTBP1 is thus necessary for
progression through the S and G2/M phases of the cell cycle and promotes the survival of
DZ cells.
PTBP1 controls alternative splicing of c-Myc target genes that regulate B cell proliferation
Given the impaired proliferation of Ptbp1-deficient GC B cells we looked for evidence of
PTBP1-dependent AS isoforms amongst genes that are part of the c-MYC-dependent gene
expression program that are important for proliferation. The mRNA encoding thymidylate
Monzón-Casanova et al. Page 7
Nat Immunol. Author manuscript; available in PMC 2018 July 22.
Europe PM
C Funders A
uthor Manuscripts
Europe PM
C Funders A
uthor Manuscripts

synthase (Tyms), a c-MYC target gene (Fig. 5a) necessary for de novo nucleotide synthesis,
is 30-fold increased in GC B cells compared to naive B cells and is increased upon positive
selection in GC B cells (Fig. 7a). Tyms mRNA was differentially spliced in the absence of
PTBP1 (Fig. 7b). Ptbp1 deletion resulted in a complex AS pattern with increased inclusion
of exons and retained introns (yellow bins, Fig. 7b) that generate NMD-predicted transcript
isoforms. We quantified the ratio of mRNAseq reads that map to segments generating NMD-
predicted transcripts (NMD yellow bins, Fig. 7b) relative to mRNAseq reads that map to the
first three exons of Tyms which encode the full-length protein (FL blue bins, Fig. 7b). The
ratio of NMD/FL reads was reduced upon positive selection in GC B cells indicating an
increase of protein coding Tyms mRNA in positively selected GC B cells (Fig. 7c). The
NMD/FL read ratio was increased in LZ and DZ B cells (Fig. 7d) and Tyms mRNA
abundance (at the whole gene level) was reduced due to Ptbp1 deletion in LZ B cells (Fig.
7e). TYMS protein was reduced due to Ptbp1 deletion in LZ and DZ B cells (Fig. 7f).
Consistent with a direct role for PTBP1 in regulating these Tyms AS events, iCLIP showed
PTBP1 bound to this region (Fig. 7a). These data indicate that PTBP1 ensures increased
TYMS expression during positive selection by regulating Tyms AS.
M-type pyruvate kinase (Pkm) catalyses the conversion of phosphoenolpyruvate to pyruvate
in glycolysis and is also a c-Myc target28 that is differentially spliced due to Ptbp1 deletion
(Fig. 5e). Pkm encodes two protein isoforms generated from mutually exclusive inclusion of
exon 9 (PKM1) or exon 10 (PKM2). Whereas PKM1 exists only as a highly active
tetrameric form, PKM2 interchanges between less active monomeric and dimeric forms as
well as a fully active tetramer in response to nutrient availability and energy demands36. B
cells express Pkm2 almost exclusively and Pkm2, but not Pkm1, is induced upon positive
selection in GC B cells (Fig. 8a). In the absence of PTBP1 the inclusion level of exon 9 is
increased from 0.05 to 0.2 (Fig. 8b,c). Immunoblot of proteins from naive and mitogen-
activated B cells in vitro revealed that PKM1 was hardly detected in Cd79a+/+Ptbp1fl/fl B
cells but readily detected in Cd79acre/+Ptbp1fl/fl cKO B cells (Fig. 8d). This AS event has
been previously shown to be regulated by PTBP1 in human cell lines to favour the
production of PKM228,31. Our iCLIP data revealed PTBP1 binding close to the intronic 3’
splice site of exon 9 in B cells (Fig. 8c). Thus, PTBP1 promotes skipping of this exon
favouring inclusion of exon 10 and suppression of Pkm1 mRNA in GC B cells (Fig. 8e).
Expression of PKM1 has been shown to impair the proliferation of malignant cells and non-
transformed fibroblasts and the small molecule DASA-58 activates PKM2 tetramerization
and inhibits the proliferation of transformed cells36. DASA-58 reduced the proliferation of
mouse B cells in response to in vitro stimulation with anti-CD40+IL-4+IL-5 or anti-IgM
+IL-4 (Fig. 8f,g). These findings are consistent with the hypothesis that increased activity of
pyruvate kinase, as would be expected upon PKM1 expression, is detrimental for B cell
proliferation.
Discussion
PTBP1 is either induced by and acts downstream of c-MYC, or forms part of a previously
unrecognised pathway that acts in parallel with c-MYC to drive GC B cell proliferation. We
favour the former hypothesis as there is evidence that PTBP1 is a c-MYC-responsive gene in
Monzón-Casanova et al. Page 8
Nat Immunol. Author manuscript; available in PMC 2018 July 22.
Europe PM
C Funders A
uthor Manuscripts
Europe PM
C Funders A
uthor Manuscripts
other cell systems28,29. A proliferation defect of Ptbp1-deficient ES cells and human CD4
T cells with reduced PTBP1 levels has been observed30,37,38 indicating that PTBP1 is
necessary for cell proliferation in other systems but the basis for the reported effects was not
clear. However, the requirement for PTBP1 in proliferation is not universal as the
proliferation of Ptbp1-deficient early-Pre B cells was normal. This difference could reflect
compensatory mechanisms or the distinct environments of the GC compared to the bone
marrow39,40.
PTBP1 controls gene expression by regulating multiple processes in the biogenesis and fate
of mRNA. The mRNA abundance or AS of 213 genes that are part of the c-MYC-dependent
gene expression program induced upon positive selection was PTBP1-dependent, but there
are additional direct and indirect targets of PTBP1 that are not part of the MYC-dependent
program. Amongst these, we observed changes in AS of Sema4d, Pdlim7, Pbrm1, Acly and
Ikzf3. Changes in Semaphorin 4d (CD100, Sema4d) could affect the migration of GC B
cells through the LZ and DZ and interactions with T cells41. Changes in enigma (Pdlim7)
could alter p53 expression42. Altered splicing of ATP citrate lyase (Acly) could have an
impact on lipid biosynthesis43. Polybromo-1 (Pbrm1 or BAF180) is part of the SWI/SNF-B
(PBAF) chromatin-remodelling complex and a c-MYC cofactor which could help propagate
the c-MYC-induced gene expression program44 and alterations in Aiolos (Ikzf3) might
influence plasma cell formation45. Despite the potential for these genes to have roles in GC
B cell biology most of the alternative isoforms found have not been studied before.
Elucidation of the functions of these AS transcripts in GC B cell biology will require careful
examination.
Pkm and Tyms are but two examples of c-MYC regulated genes that are subject to PTBP1-
dependent AS. TYMS inhibition by 5-flurouracil blocks primary T cell46 and B cell
proliferation in vitro (data not shown). Splicing of the retained intron upstream of exon 2
from the full-length Tyms transcript is necessary for increased Tyms mRNA expression in
cultured cells47. Reduced amounts of TYMS could be one limiting factor for the
proliferation of positively selected GC B cells. Other PTBP1 regulated events must also
promote GC B cell proliferation and our results implicate the regulation of PKM activity as
important for B cell proliferation. PTBP1, by regulating Pkm AS, may limit glycolytic flux
and thereby contribute to biosynthetic pathways through the accumulation of glycolytic
intermediates36. Consistent with this, PKM1 expression is growth inhibitory when
expressed in cancer xenograft tumour models36 and B cell proliferation in vitro was
inhibited by PKM2 activators.
Previous studies reported a function of PTBP2 in antibody class switch recombination
(CSR)48. We did not detect PTBP2 expression in GC B cells unless Ptbp1 is deleted, and
antigen-specific IgG1 secretion was unaffected in mice with Ptbp2-deficient B cells.
Therefore it is unlikely that PTBP2 promotes CSR in GC B cells. Nonetheless, the increase
in the frequency of IgG1+ GC B cells in Ptbp1-deficient GC B cells could indicate that, if
expressed, PTBP2 might indeed promote antibody CSR.
There may be additional PTBP1-mediated post-transcriptional processes of importance to
the GC reaction. Changes in alternative polyadenylation (APA) analysed with DaPars found
Monzón-Casanova et al. Page 9
Nat Immunol. Author manuscript; available in PMC 2018 July 22.
Europe PM
C Funders A
uthor Manuscripts
Europe PM
C Funders A
uthor Manuscripts

that Ptbp1 deletion affected the APA of 4 genes in LZ and 7 genes in DZ B cells (Data not
shown), suggesting a limited role of PTBP1 in regulating APA in GC B cells compared to its
roles controlling AS and mRNA abundance. However, to fully address the roles of PTBP1 in
APA analysis of RNAseq libraries specifically targeted at capturing 3’-ends are required. In
the present study we were unable to measure the impact of PTBP1 on the tempo of
translation, e.g. through IRES-mediated regulation, within GC B cells and this must await
improved techniques for measuring translational regulation in rare cell populations.
In summary, we have observed that the regulation of gene expression in B cells by PTBP1 is
necessary for GC B cell proliferation. At the cellular level PTBP1 functions in GC B cells to
promote the rapid progression through the late S-phase of the cell cycle. At the molecular
level we have identified the role of PTBP1 in regulating the quantitative and qualitative
changes in the transcriptome that are part of the c-MYC-dependent gene expression
program. Post-transcriptional regulation by PTBP1 acts in concert with transcription factors
such as c-MYC to integrate anabolic metabolism and cell cycle progression and drive the
production of high affinity antibodies.
Online Methods
Mice
All mice were on a C57BL/6 background. For bone marrow chimera experiments, B6.SJL
were used as recipients. Conditional knockout mice used in this study derive from crossing
the following transgenic strains: Ptbp1fl/fl (Ptbp1tm1Msol)30, Ptbp2fl/fl (Ptbp2tm1.1Dblk)50,
Cd79acre(Cd79atm1(cre)Reth)51 and AicdaTg-cre (Tg(Aicda-cre)9Mbu)52 as specified in the
results section. GFP-c-MYC reporter mice Myctm1Slek53 and Rag2-/- knockout mice
(Rag2tm1Fwa)54 were also used in this study.
Rats
RT7b rats were used for the generation of anti-PTBP3 monoclonal antibodies.
Immunisation Protocols and in vivo BrdU administration
All procedures performed were approved by the Babraham Institute's Animal Welfare and
Experimentation Committee and the UK Home Office and are in compliance with all
relevant ethical regulations. Mice immunised with alum-NP-KLH received 100 μg NP-KLH
(Biosearch Technologies) intraperitoneally (ip). Mice immunised with SRBCs received
2*108 SRBCs ip. For in vivo BrdU incorporation experiments mice received 2 mg BrdU ip
1.5 hours before they were culled. Bone marrow competitive chimeras were generated by
reconstituting lethally irradiated (2 x 500Rad) B6.SJL mice with 3*106 bone marrow cells
derived from B6.SJL in a 1:1 ratio with CD79acre/+Ptbp1fl/fl cKO or CD79a+/+Ptbp1fl/fl
control bone marrow cells administered intravenously. Rag2-/- knockout bone marrow
chimeras were generated by reconstituting sub-lethally irradiated (1x 500Rad) Rag2-/-
knockout mice with 3*106 bone marrow cells from Cd79a+/+ Ptbp1fl/flMycGFP/GFP or
Cd79acre/+Ptbp1fl/flMycGFP/GFP mice administered intravenously. Mice used in
immunisation experiments with different genotypes were sex and age matched. Whenever
possible littermates of the same sex but different genotypes were kept in the same cages to
Monzón-Casanova et al. Page 10
Nat Immunol. Author manuscript; available in PMC 2018 July 22.
Europe PM
C Funders A
uthor Manuscripts
Europe PM
C Funders A
uthor Manuscripts
avoid confounding effects. Male and female mice were used in this study. Except in bone
marrow reconstitution experiments, immunisations were carried out on 8 to 14 week-old
mice. Bone marrow competitive chimeras were immunised 15 weeks post reconstitution.
Rag2-/- knockout bone marrow chimeras were immunised 13 weeks post reconstitution.
Flow cytometry
Single cell suspensions were prepared from tissues by passing the tissues though cell
strainers with 70 and 40 μm pore sizes. After Fc receptors (CD16/32) were blocked with the
monoclonal rat antibody 2.4G2 cells were stained with different antibodies listed in
Supplementary Table 6 table in 1% FCS PBS at 4 °C. Cell viability was assessed by staining
cells with the Fixable Viability Dye eFluor® 780 dye from eBioscience. Unless otherwise
stated, dead cells were always excluded from the analysis. For intracellular staining cells
were fixed and permeabilized with the BD Cytofix/Cytoperm™ Fixation and
Permeabilization Solution from BD Biosciences. Nuclear permeabilization was carried out
with the Permeabilization Buffer Plus from BD Biosciences when cells were prepared from
the spleen or by freezing fixed cells in FCS containing 10% DMSO at -80 °C when cells
were isolated from the bone marrow. Intracellular staining was carried out by incubating
permeabilized cells with combinations of antibodies (listed in Supplementary Table 6)
diluted in BD Perm/Wash Buffer. For some intracellular stains such as for those detecting
PTBP1, the incubation with antibodies was carried out for 4 hours at room temperature.
Foxp3/Transcription Factor Staining Buffer Set from eBioscience was also occasionally
used. BrdU and DNA stainings were carried out using the FITC BrdU Flow Kit from BD
Biosciences. Anti PTBP1, PTBP2 and PTBP3 monoclonal antibodies were directly
conjugated using Alexa Fluor® 488, Alexa Fluor® 647 or Pacific Blue Antibody Labeling
Kits from ThermoFisher Scientific.
Detection of NP specific immunoglobulins
NP-specific antibodies of different affinities were detected as previously described14 using
two different conjugation ratios of NP to BSA. Detection of NP-specific antibodies with low
and high affinity was done by coating ELISA plates with a ratio of at least 20 NP per 1 BSA
molecule (NP20, Biosearch Technologies). Detection of NP-specific antibodies with only
high affinity was performed by coating ELISA plates with a ratio of 2 NP per 1 BSA
molecules. End-point titres were calculated from serial dilutions of serum samples.
Isolation of B cells and ex vivo stimulation
B cells were isolated from spleens of mice after preparing a single cell suspension by MACS
negative depletion with a B cell isolation kit (Cat. # 130-090-862 from Miltenyi). When
stimulated ex vivo B cells were cultured in IMDM media (Cat # 21980, ThermoFisher
Scientific) with L-Glutamine and 25mM HEPES, supplemented with 10% heat inactivated
FCS, 50 μM β-Mercaptoethanol, penicillin and streptomycin (GIBCO). Cells were
stimulated with LPS (10 μg/ml 127:B0, Sigma); anti-CD40 antibody (FGK4.2, 10 μg/ml),
IL-4 (10 ng/ml) and IL-5 (10 ng/ml) or anti-IgM antibody (B7.6, 9 μg/ml) and IL-4 (10 ng/
ml). In proliferation assays B cells were labeled with CellTrace™ Violet (ThermoFisher)
before culturing them. 1.5*105 B cells were added per well in 96 well plates. Cells were
counted using counting beads analysed by flow cytometry. In PKM stimulation experiments
Monzón-Casanova et al. Page 11
Nat Immunol. Author manuscript; available in PMC 2018 July 22.
Europe PM
C Funders A
uthor Manuscripts
Europe PM
C Funders A
uthor Manuscripts

DASA-5855 (MedChem Express, Cat. # HY-19330-1ml) was added to the cultures. The
same amount of DMSO as the highest concentration of DASA-58 was added to the cultures
as vehicle control.
PTBP1 iCLIP
iCLIP reveals the site of direct binding of a RBP to RNA at single nucleotide resolution.
This is achieved first by the covalent binding of the RBP to its cognate RNA in intact cells
by UV irradiation and second, through the truncation of cDNA synthesis when reverse
polymerase encounters residual peptides derived from the RBP at the site of cross-linking to
the RNA56. PTBP1 immunoprecipitations were carried out with the CLONE 1 monoclonal
antibody (ThermoFisher Scientific, Cat. # 32-4800) coupled to protein A/G magnetic beads
(Pierce, Cat. #88802) and UV-cross-linked (150mJ/cm2) cell extracts of primary B cells
stimulated ex vivo for 48h with LPS as described above. B cells were isolated from several
C57BL/6 females and pooled together before stimulation. 30*106 cells were used in each
immunoprecipitation and were lysed in 50 mM Tris-HCL pH7.4, 100mM NaCl, 1% NP-40
and 0.1% SDS lysis buffer. Before immunoprecipitating PTBP1, cell extracts were treated
with Turbo DNAse (Ambion, #AM2239) and low amounts of RNAse I (1.5 to 3 units) from
Ambion (Cat. # AM2294). Immunoprecipitates were run on a SDS-PAGE and RNA-protein
complexes were transferred to a nitrocellulose membrane. Protein-RNA complexes were
isolated from the nitrocellulose membrane after cutting only the areas (from ~75 to ~120
kDa) where PTBP1 was expected to be cross-linked to long RNAs. After protein digestion,
RNA was isolated and cDNA synthetized by reverse transcription. At this time barcoded
primers were used which allow first, the identification of cDNAs generated from the same
RNA molecule (with a random unknown 4 nucleotide barcode) which allows to discriminate
PCR duplicates and second, multiplexing of several samples together. Amplification of
iCLIP cDNA libraries was done with 20 to 27 PCR cycles. We carried out five replicates.
Multiplexed iCLIP cDNA libraries were sequenced on an Illumina HiSeq 2000 platform on
a 50 bp single-ended mode. Negative controls (PTBP1 immunoprecipitations from non-UV
cross-linked lysates and immunoprecipitations with a mouse IgG1 negative isotype control
antibody) resulted in very little isolated RNA, from which no cDNA library could be
generated.
Computational processing of iCLIP data
Identification of transcriptome-wide PTBP1 binding sites was done as previously
described56. Briefly, mapping of cDNAs to the mouse genome (mm10) was carried out with
Bowtie and those reads that mapped to the same location and had the same random 4 nt
barcode were considered PCR duplicates and collapsed as a single cDNA molecule. A
PTBP1 binding site (or X-link site) is the nucleotide before the first nucleotide of a mapped
cDNA molecule. A FDR value, which determines the probability of a X-link site to appear
by chance, was calculated (as described in56) for each X-link site. iCLIP is highly
dependent on RNA abundance and therefore, is not an absolute measurement of RNA-
protein interactions. For this reason we pooled the five replicates together before calculating
FDRs for each X-link site.
Monzón-Casanova et al. Page 12
Nat Immunol. Author manuscript; available in PMC 2018 July 22.
Europe PM
C Funders A
uthor Manuscripts
Europe PM
C Funders A
uthor Manuscripts

Generation of mRNAseq libraries
LZ and DZ GC B cells from CD79acre/+Ptbp1fl/fl cKO or CD79a+/+Ptbp1fl/fl control mice
were FACS-sorted from animals immunised with alum-NP-KLH seven days before. Single
cell suspensions were prepared from spleens of immunised mice. Erythrocytes were lysed
and GC B cells were enriched before FACS sorting by depleting cells stained with
biotinylated anti IgD, CD3e, Gr1 and Ter119 antibodies by MACS. Four biological
replicates were used per condition. In each biological replicate, GC B cell-enriched
splenocytes from 3 to 5 animals of the same genotype and sex were pooled together before
FACS sorting. LZ and DZ GC B cells were sorted from the same GC B cell enriched
samples. LZ and DZ GC B cells from control CD79a+/+Ptbp1fl/fl and CD79acre/+Ptbp1fl/fl
cKO mice were sorted on the same day. Two biological replicates per condition were from
females and two from males.
RNA was prepared using the RNeasy Micro Kit kit from Qiagen (Cat. #74004) from
~25.000 up to ~200.000 cells. RNA quality was analysed on a 2100 Bioanalyzer (Agilent).
RNA integrity numbers ranged from 9.1 to 10. 2 ng of total RNA was used to generate
cDNA from polyadenylated transcripts using the SMART-Seq v4 Ultra low input RNA kit
from Clontech (Cat. #634888). cDNA quality was analysed on a 2100 Bioanalyzer (Agilent).
0.5 ng cDNA were used to prepare the mRNAseq libraries with 8 cycles of PCR using the
Ultra Low library preparation kit v2 from Clontech (Cat. #634899). Compatible barcoded
libraries were multiplexed and sequenced across three lanes on an Illumina HiSeq 2500
platform on a 100bp paired-end mode.
Analysis of mRNAseq libraries generated in this study
Trimming of libraries was carried out with Trimgalore (v0.4.2) using default parameters.
After that, reads were mapped to the mouse Mus_musculus.GRCm38 genome with Hisat257
using -p 7 -t --phred33-quals --no-mixed --no-discordant parameters and providing a known
splice sites file generated from the Mus_musculus.GRCm38.70.gtf annotation. Counting of
reads mapping to all exons of a particular gene was done with HTSeq58 using the
Mus_musculus.GRCm38.84.gtf annotation and default parameters. DESeq2 (v1.12.1)59 was
used to calculate differential RNA abundance between two conditions at the whole gene
level by quantifying differences in RNA complementary to all annotated exons of a
particular gene in the RNAseq data. Information on the genotype and sex of the animals was
included in the design formula in order to control for variation in the data due to the sex
differences in the samples. DESeq2 results were only considered for genes that are
expressed with at least 1 FPKM in any of the conditions. Significant differentially abundant
genes are those that have an adjusted p-value <0.1.
Differential alternative splicing (AS) was analysed with rMATS (v3.2.2)60. rMATS uses an
exon-centric approach to discover both annotated and unannotated AS events in a reference
transcriptome. To compare changes in AS between two conditions rMATS calculates first
inclusion levels (defined as the proportion of transcripts containing that particular AS
segment) for five different types of AS events: skipped exons (SE), mutually exclusive exons
(MXE), alternative 5’ splice sites (A5SS) alternative 3’ splice sites (A3SS) and retained
introns in each of the two conditions (Supplementary Fig. 4e). Subsequently, rMATS
Monzón-Casanova et al. Page 13
Nat Immunol. Author manuscript; available in PMC 2018 July 22.
Europe PM
C Funders A
uthor Manuscripts
Europe PM
C Funders A
uthor Manuscripts

calculates inclusion level differences by subtracting the inclusion levels of condition one
from the inclusion levels of condition two (see Supplementary Fig. 4f). The version used of
rMATS only accepts mapped reads of a particular length. For this reason, libraries trimmed
with Trimgalore as described above were further trimmed with Trimmomatic v0.3561 so that
all reads had a length of 98 bp. Reads shorter than 98 bp were discarded. These reads of only
98bp were then mapped to the mouse genome using Hisat2 as described above. rMATS was
run on a paired mode (-analysis P) to analyse differential AS between two conditions using
the Mus_musculus.GRCm38.84.gtf annotation. Only results obtained with reads that map to
exon-exon junctions were used for further analysis. Genes that have less than 1 FPKM in the
analysed conditions were discarded. Significantly differentially spliced events are those that
have an FDR <0.05. A cut-off of an inclusion level difference greater than 10% (0.1) was
introduced for significant differentially alternatively spliced events.
We assigned PTBP1 binding to the vicinity of a differentially alternatively spliced event if
we found at least a significant PTBP1 binding site in our iCLIP data in the following cases.
Skipped exons (SE) were considered to be bound by PTBP1 if a binding site was identified
on the SE, on the intronic 500 nucleotides upstream and downstream of the SE 3’ splice site
(SS) and 5’SS, respectively; on the upstream flanking constitutive exon and the intronic 500
nucleotides downstream of its 5’SS or on the downstream flanking constitutive exon and the
intronic 500 nucleotides upstream of its 3’SS. Mutually exclusive exons (MXE) were bound
by PTBP1 if a binding site was found on any of the MXE and the intronic 500 nucleotides
upstream and downstream of their 3’SS and 5’SS, respectively; on the upstream flanking
constitutive and the intronic 500 nucleotides downstream of its 5’SS or on the downstream
flanking constitutive exon and the intronic 500 nucleotides upstream of its 3’SS. Alternative
5’ splice sites (A5SS) were bound by PTBP1 if a binding site was found on the longer exon
generated by the A5SS, the intronic 500 nucleotides downstream of the 5SS of the longest
A5SS exon or on the flanking constitutive exon downstream of the A5SS and the intronic
500 nucleotides upstream of its 3SS. Alternative 3’ splice sites (A3SS) were bound by
PTBP1 if a binding site was found on the longer exon generated by the A3SS, the intronic
500 nucleotides upstream of the 3SS of the longest A3SS exon or on the flanking
constitutive exon upstream of the A3SS and the intronic 500 nucleotides downstream of its
5SS. A retained intron was bound by PTBP1 if a binding site was found on the exon
resulting from intron retention.
Differential alternative polyadenylation site usage
Alternative polyadenylation (APA) usage was assessed with the 'Dynamic analysis of
Alternative PolyAdenylation from RNA-Seq' algorithm (DaPars v0.9.162). DaPars computes
first the Percentage of Distal polyadenylation (polyA) site Usage Index (PDUI) and,
subsequently, computes changes in PDUI between two conditions (ΔPDUI). Annotated gene
models were generated from mouse genome build GRCm38/mm10, facilitating the
prediction of proximal de novo APA sites as well as long and short 3′ UTR expression
levels. Bedtools v2.25.0 was used to convert the RNA-seq BAM files to BedGraph format,
and these files were then used as input for DaPars to identify dynamic APA usage between
the control and knockout mice. Differences in APA were considered for those genes with an
absolute change in percentage of distal polyA site usage of >20% (ΔPDUI >|0.2|), an
Monzón-Casanova et al. Page 14
Nat Immunol. Author manuscript; available in PMC 2018 July 22.
Europe PM
C Funders A
uthor Manuscripts
Europe PM
C Funders A
uthor Manuscripts

adjusted P-value of <0.05 and a fitted value of the regression model used to identify the
proximal polyA site > 500.
Analysis of mRNAseq libraries previously published
RNAseq data from Hogenbirk et al.49 was trimmed with Trimgalore (v0.3.8) using default
parameters. Trimmed reads were mapped to the mouse genome using Tophat2(v2.0.12)63
with -p 6 -g 2 parameters and the Mus_musculus.GRCm38.70.gtf annotation. Mapped reads
to exons of a particular gene were counted with HTSeq58 using the
Mus_musculus.GRCm38.73.gtf annotation and default parameters. Differential RNA
abundance was calculated with DESeq2 (v1.4.5).
RNAseq data generated by Gitlin et al.3 was trimmed with Trimgalore (v0.4.1). Trimmed
reads were mapped to the mouse genome with Tophat2 (v2.0.12)63 with -p 6 -g 2
parameters and the Mus_musculus.GRCm38.70.gtf annotation. Mapped reads were counted
with HTSeq using the Mus_musculus.GRCm38.75.gtf annotation and default parameters.
DESeq2 (v1.8.1) was used to analyse differential RNA abundance between GC B cells that
received high levels of T cell help (Anti-DEC-OVA) and GC B cells that did not receive high
levels of T cell help (Anti-DEC-Ctrl). Genes with a p-adjusted value <0.05 were considered
to have significant differential RNA abundance. Genes with a positive log2 fold change
(Anti-DEC-OVA vs Anti-DEC-Ctrl) were chosen as genes that are increased in GC B cells
receiving high levels of T cell help compared to GC B cells that are not receiving high levels
of T cell help (used in Fig. 5).
RNAseq data published by Chou and colleagues7 was trimmed with Trimgalore
(v0.4.2_dev). Trimmed reads were mapped to the mouse genome using Hisat2(v2.0.5)57 and
the Mus_musculus.GRCm38 genome. Reads mapping to all exons of a particular gene were
counted with HTSeq using the Mus_musculus.GRCm38.84.gtf annotation and default
parameters. Differential RNA abundance between two conditions was calculated with
DESeq2 v1.12.4. Genes with an increased RNA abundance in AP4+Myc+ LZ GC B cells
compared to AP4-Myc- LZ GC B cells used in Fig. 5 were defined as genes with a p-
adjusted value <0.05 whose log2 fold change (AP4+ Myc+ LZ GC B cells vs AP4- Myc- LZ
GC B cells) is equal or greater than 1.5.
Calculation of FPKMs
FPKMs (Fragments per kilobase of exon per million reads mapped) were used to compare
expression values of different genes or transcripts and to filter genes based on their
expression level. FPKMs were calculated with the Cuffnorm option of Cufflinks (v2.2.1)64
using the geometric normalisation method and the mapped reads of the different RNAseq
libraries described above. The following annotations were used to calculate FPKMS from
the different studies: Mus_musculus.GRCm38.84.gtf was used with our RNAseq data and
data from Chou et al.7, Mus_musculus.GRCm38.83.gtf was used with the data from
Hogenbirk et al.49 and Mus_musculus.GRCm38.75.gtf was used with data published by
Gitlin et al.3.
Monzón-Casanova et al. Page 15
Nat Immunol. Author manuscript; available in PMC 2018 July 22.
Europe PM
C Funders A
uthor Manuscripts
Europe PM
C Funders A
uthor Manuscripts
GO analysis
Gene ontology terms enrichment analysis was carried out with GOrilla65. A background list
of genes (genes which were expressed with at least 1 FPKM in the conditions analysed) was
included in the analysis. For visualisation purposes when several related terms were
significantly enriched the term which had a higher percentage of significant genes with
different mRNA abundance or AS was chosen to be shown in Supplementary Fig. 5.
RNAseq data visualisation
Sashimi plots, which show RNAseq coverage and reads mapping across exon-exon junctions
were generated using the IGV genome browser.
Analysis of Jh4 mutations
Mutations in the Jh4 intronic region were analysed as previously described4. Briefly,
genomic DNA was isolated from FACS-sorted GC B cells from spleens of mice that were
immunised with alum-NP-KLH 7 days before. GC B cells from 2 to 4 mice of the same
genotype and sex were pooled together. Jh4 intronic regions were amplified with the primers
Jh4-intron Forward and Jh4-intron Reverse in using the PfuUltra II Fusion HS DNA
Polymerase (Agilent Technologies) in a PCR with 35 cycles, 57 °C annealing temperature
and 15 seconds extension time at 72 °C. PCR amplified Jh4 intronic regions were cloned
using the Zero Blunt® TOPO® PCR Cloning Kit (ThermoFischer scientific). Mutation
frequencies were calculated by dividing the total number of mutations identified in each
replicate by the total length of amplified DNA (565 bp per clone analysed, which is the
genomic region amplified by PCR without taking into account the regions complementary to
the primers).
Generation of anti PTBP3 mAb
RT7b rats were immunised with a GST-PTBP3 fusion protein containing amino acids 279 to
359 of the full-length mouse PTBP3 generated in E. coli. After several immunisations
spleens were isolated and fused to the IR983F rat myeloma cell line. Hybridomas were
screened by immunoblot using HEKT cell lysates expressing mouse PTBP3, PTBP1 or
PTBP2-GFP fusion proteins. Two hybridomas secreted IgG2a antibodies specific for
PTBP3: MAC454 and MAC455. Monoclonal antibodies secreted by these two hybridomas
were purified by affinity chromatography using protein G.
Immunoblot
In order to analyse PKM1 and PKM2 expression, 12 μg of proteins extracted from B cells
isolated as described above from individual mice and stimulated or not with LPS for 48h
were run on a 10% SDS-PAGE and transferred to a nitrocellulose membrane. PKM1
detection was carried out with a rabbit monoclonal antibody (clone D30G6, Cell Signalling)
and PKM2 was detected with a rabbit monoclonal antibody (clone D78A4, Cell signalling).
Visualisation of anti PKM1 and PKM2 antibodies was carried out with an HRP-conjugated
goat anti-rabbit antibody (Cat # 2020-10, Dako). Immunoblot analysis of the different
PTBPs was carried out with 15 μg of proteins extracted from B cells isolated as described
above from individual mice run on a 10 % SDS-PAGE and transferred to a nitrocellulose
Monzón-Casanova et al. Page 16
Nat Immunol. Author manuscript; available in PMC 2018 July 22.
Europe PM
C Funders A
uthor Manuscripts
Europe PM
C Funders A
uthor Manuscripts
membrane. Mouse monoclonal primary antibodies were detected with an anti-mouse
TrueBlot HRP-conjugated antibody (eBioscience, Cat. #18-8817-31). Rat monoclonal
primary antibodies were detected with anti-rat goat HRP-conjugated antibodies (Cat.
#P0450, Dako). Rabbit primary antibodies were detected with HRP-conjugated goat anti-
rabbit antibody (Cat. #2020-10, Dako).
Quantification and statistical analysis
Flow cytometry data was analysed using FlowJo (versions 10.0.8r1 or 9.8.3). Analysis and
quantification of RNAseq and iCLIP experiments is detailed in the methods detail section.
Statistical significance of flow cytometry data was assessed using Prism (versions 7 or 6).
The details of the tests used in different experiments can be found in the figure legends).
Data availability
mRNAseq and iCLIP data that support the findings of this study have been deposited in
GEO with the GSE100969 accession code.
Supplementary Material
Refer to Web version on PubMed Central for supplementary material.
Acknowledgments
We thank D. L. Black for the Ptbp2fl/fl mice, M. Reth for the Cd79acre mice, M. Busslinger for the AicdaTg-cre mice, B. P. Sleckman for the MycGFP/GFP mice, and F. W. Alt for the Rag2–/– mice; J. Ule, N. Haberman and T. Curk for help with iCLIP data; G. Butcher for assistance in generating anti-PTBP3 monoclonal antibodies; K. Bates, D. Sanger, A. Davis, the Biological Support Unit, Flow Cytometry and Bioinformatics Facilities for technical assistance; M. Spivakov and members of the Turner and Smith laboratories for helpful discussions. Supported by The Biotechnology and Biological Sciences Research Council (BB/J004472/1 and BB/J00152X/1 to M.T), the Wellcome Trust (200823/Z/16/Z to M.T.) and Bloodwise (14022 to M.T.).
References
1. Mesin L, Ersching J, Victora GD. Germinal Center B Cell Dynamics. Immunity. 2016; 45:471–482. [PubMed: 27653600]
2. Bannard O, Cyster JG. Germinal centers: programmed for affinity maturation and antibody diversification. Current Opinion in Immunology. 2017; 45:21–30. [PubMed: 28088708]
3. Gitlin AD, et al. T cell help controls the speed of the cell cycle in germinal center B cells. Science. 2015; 349:643–646. [PubMed: 26184917]
4. Gitlin AD, Shulman Z, Nussenzweig MC. Clonal selection in the germinal centre by regulated proliferation and hypermutation. Nature. 2014; 509:637–640. [PubMed: 24805232]
5. Calado DP, et al. The cell-cycle regulator c-Myc is essential for the formation and maintenance of germinal centers. Nat Immunol. 2012; 13:1092–1100. [PubMed: 23001146]
6. Dominguez-Sola D, et al. The proto-oncogene MYC is required for selection in the germinal center and cyclic reentry. Nat Immunol. 2012; 13:1083–1091. [PubMed: 23001145]
7. Chou C, et al. The Transcription Factor AP4 Mediates Resolution of Chronic Viral Infection through Amplification of Germinal Center B Cell Responses. Immunity. 2016; 45:570–582. [PubMed: 27566940]
8. Ersching J, et al. Germinal Center Selection and Affinity Maturation Require Dynamic Regulation of mTORC1 Kinase. Immunity. 2017; 46:1045–1058.e6. [PubMed: 28636954]
Monzón-Casanova et al. Page 17
Nat Immunol. Author manuscript; available in PMC 2018 July 22.
Europe PM
C Funders A
uthor Manuscripts
Europe PM
C Funders A
uthor Manuscripts

9. Sander S, et al. PI3 Kinase and FOXO1 Transcription Factor Activity Differentially Control B Cells in the Germinal Center Light and Dark Zones. Immunity. 2015; 43:1075–1086. [PubMed: 26620760]
10. Dominguez-Sola D, et al. The FOXO1 Transcription Factor Instructs the Germinal Center Dark Zone Program. Immunity. 2015; 43:1064–1074. [PubMed: 26620759]
11. Inoue T, et al. The transcription factor Foxo1 controls germinal center B cell proliferation in response to T cell help. Journal of Experimental Medicine. 2017; 214:1181–1198. [PubMed: 28351982]
12. Martinez NM, Lynch KW. Control of alternative splicing in immune responses: many regulators, many predictions, much still to learn. Immunol Rev. 2013; 253:216–236. [PubMed: 23550649]
13. Schaub A, Glasmacher E. Splicing in immune cells - mechanistic insights and emerging topics. Int Immunol. 2017; 29:173–181. [PubMed: 28498981]
14. Diaz-Muñoz MD, et al. The RNA-binding protein HuR is essential for the B cell antibody response. Nat Immunol. 2015; 16:415–425. [PubMed: 25706746]
15. Chang X, Li B, Rao A. RNA-binding protein hnRNPLL regulates mRNA splicing and stability during B-cell to plasma-cell differentiation. Proc Natl Acad Sci USA. 2015; 112:E1888–97. [PubMed: 25825742]
16. Berkovits BD, Mayr C. Alternative 3' UTRs act as scaffolds to regulate membrane protein localization. Nature. 2015; 522:363–367. [PubMed: 25896326]
17. Pioli PD, Debnath I, Weis JJ, Weis JH. Zfp318 regulates IgD expression by abrogating transcription termination within the Ighm/Ighd locus. J Immunol. 2014; 193:2546–2553. [PubMed: 25057009]
18. Keppetipola N, Sharma S, Li Q, Black DL. Neuronal regulation of pre-mRNA splicing by polypyrimidine tract binding proteins, PTBP1 and PTBP2. Critical Reviews in Biochemistry and Molecular Biology. 2012; 47:360–378. [PubMed: 22655688]
19. Sawicka K, Bushell M, Spriggs KA, Willis AE. Polypyrimidine-tract-binding protein: a multifunctional RNA-binding protein. Biochemical Society Transactions. 2008; 36:641–647. [PubMed: 18631133]
20. Gooding C, Kemp P, Smith CWJ. A novel polypyrimidine tract-binding protein paralog expressed in smooth muscle cells. J Biol Chem. 2003; 278:15201–15207. [PubMed: 12578833]
21. Baralle FE, Giudice J. Alternative splicing as a regulator of development and tissue identity. Nature Reviews Molecular Cell Biology. 2017; 825:267.
22. Tan L-Y, et al. Generation of functionally distinct isoforms of PTBP3 by alternative splicing and translation initiation. Nucleic Acids Res. 2015; 43:5586–5600. [PubMed: 25940628]
23. Knoch K-P, et al. Polypyrimidine tract-binding protein promotes insulin secretory granule biogenesis. Nature Cell Biology. 2004; 6:207–214. [PubMed: 15039777]
24. Knoch K-P, et al. PTBP1 is required for glucose-stimulated cap-independent translation of insulin granule proteins and Coxsackieviruses in beta cells. Molecular Metabolism. 2014; 3:518–530. [PubMed: 25061557]
25. Vavassori S, Shi Y, Chen CC, Ron Y, Covey LR. In vivo post-transcriptional regulation of CD154 in mouse CD4+ T cells. European Journal of Immunology. 2009; 39:2224–2232. [PubMed: 19572319]
26. Porter JF, Vavassori S, Covey LR. A Polypyrimidine Tract-Binding Protein-Dependent Pathway of mRNA Stability Initiates with CpG Activation of Primary B Cells. The Journal of Immunology. 2008; 181:3336–3345. [PubMed: 18714005]
27. Boutz PL, et al. A post-transcriptional regulatory switch in polypyrimidine tract-binding proteins reprograms alternative splicing in developing neurons. Genes Dev. 2007; 21:1636–1652. [PubMed: 17606642]
28. David CJ, Chen M, Assanah M, Canoll P, Manley JL. HnRNP proteins controlled by c-Myc deregulate pyruvate kinase mRNA splicing in cancer. Nature. 2010; 463:364–368. [PubMed: 20010808]
29. Sabò A, et al. Selective transcriptional regulation by Myc in cellular growth control and lymphomagenesis. Nature. 2014; 511:488–492. [PubMed: 25043028]
Monzón-Casanova et al. Page 18
Nat Immunol. Author manuscript; available in PMC 2018 July 22.
Europe PM
C Funders A
uthor Manuscripts
Europe PM
C Funders A
uthor Manuscripts
30. Suckale J, et al. PTBP1 is required for embryonic development before gastrulation. PLoS ONE. 2011; 6:e16992. [PubMed: 21423341]
31. Spellman R, Llorian M, Smith CWJ. Crossregulation and functional redundancy between the splicing regulator PTB and its paralogs nPTB and ROD1. Molecular Cell. 2007; 27:420–434. [PubMed: 17679092]
32. Vuong JK, et al. PTBP1 and PTBP2 Serve Both Specific and Redundant Functions in Neuronal Pre-mRNA Splicing. Cell Reports. 2016; 17:2766–2775. [PubMed: 27926877]
33. Victora GD, et al. Identification of human germinal center light and dark zone cells and their relationship to human B-cell lymphomas. Blood. 2012; 120:2240–2248. [PubMed: 22740445]
34. Liberzon A, et al. The Molecular Signatures Database (MSigDB) hallmark gene set collection. Cell Syst. 2015; 1:417–425. [PubMed: 26771021]
35. Zeman MK, Cimprich KA. Causes and consequences of replication stress. Nature Cell Biology. 2013; 16:2–9.
36. Dayton TL, Jacks T, Vander Heiden MG. PKM2, cancer metabolism, and the road ahead. EMBO reports. 2016; 17:e201643300–1730.
37. La Porta J, Matus-Nicodemos R, Valentín-Acevedo A, Covey LR. The RNA-Binding Protein, Polypyrimidine Tract-Binding Protein 1 (PTBP1) Is a Key Regulator of CD4 T Cell Activation. PLoS ONE. 2016; 11:e0158708. [PubMed: 27513449]
38. Shibayama M, et al. Polypyrimidine tract-binding protein is essential for early mouse development and embryonic stem cell proliferation. The FEBS Journal. 2009; 276:6658–6668. [PubMed: 19843185]
39. Boothby M, Rickert RC. Metabolic Regulation of the Immune Humoral Response. Immunity. 2017; 46:743–755. [PubMed: 28514675]
40. Chan LN, et al. Metabolic gatekeeper function of B-lymphoid transcription factors. Nature. 2017; 542:479–483. [PubMed: 28192788]
41. Suzuki K, Kumanogoh A, Kikutani H. Semaphorins and their receptors in immune cell interactions. Nat Immunol. 2008; 9:17–23. [PubMed: 18087252]
42. Jung C-R, et al. Enigma negatively regulates p53 through MDM2 and promotes tumor cell survival in mice. J Clin Invest. 2010; 120:4493–4506. [PubMed: 21060154]
43. Dufort FJ, et al. Glucose-dependent de novo lipogenesis in B lymphocytes a requirement for ATP-citrate lyase in lipopolysaccharide-induced differentiation. J Biol Chem. 2014; 289:7011–7024. [PubMed: 24469453]
44. Hann SR. MYC cofactors: molecular switches controlling diverse biological outcomes. Cold Spring Harb Perspect Med. 2014; 4:a014399–a014399. [PubMed: 24939054]
45. Cortés M, Georgopoulos K. Aiolos Is Required for the Generation of High Affinity Bone Marrow Plasma Cells Responsible for Long-Term Immunity. Journal of Experimental Medicine. 2004; 199:209–219. [PubMed: 14718515]
46. Quéméneur L, et al. Differential control of cell cycle, proliferation, and survival of primary T lymphocytes by purine and pyrimidine nucleotides. The Journal of Immunology. 2003; 170:4986–4995. [PubMed: 12734342]
47. Ke Y, Ash J, Johnson LF. Splicing signals are required for S-phase regulation of the mouse thymidylate synthase gene. Mol Cell Biol. 1996; 16:376–383. [PubMed: 8524318]
48. Nowak U, Matthews AJ, Zheng S, Chaudhuri J. The splicing regulator PTBP2 interacts with the cytidine deaminase AID and promotes binding of AID to switch-region DNA. Nat Immunol. 2011; 12:160–166. [PubMed: 21186367]
49. Hogenbirk MA, et al. Differential programming of B cells in AID deficient mice. PLoS ONE. 2013; 8:e69815. [PubMed: 23922811]
50. Li Q, et al. The splicing regulator PTBP2 controls a program of embryonic splicing required for neuronal maturation. eLife Sciences. 2014; 3:e01201.
51. Hobeika E, et al. Testing gene function early in the B cell lineage in mb1-cre mice. PNAS. 2006; 103:13789–13794. [PubMed: 16940357]
52. Kwon K, et al. Instructive role of the transcription factor E2A in early B lymphopoiesis and germinal center B cell development. Immunity. 2008; 28:751–762. [PubMed: 18538592]
Monzón-Casanova et al. Page 19
Nat Immunol. Author manuscript; available in PMC 2018 July 22.
Europe PM
C Funders A
uthor Manuscripts
Europe PM
C Funders A
uthor Manuscripts
53. Huang C-Y, Bredemeyer AL, Walker LM, Bassing CH, Sleckman BP. Dynamic regulation of c-Myc proto-oncogene expression during lymphocyte development revealed by a GFP-c-Myc knock-in mouse. European Journal of Immunology. 2008; 38:342–349. [PubMed: 18196519]
54. Shinkai Y, et al. RAG-2-deficient mice lack mature lymphocytes owing to inability to initiate V(D)J rearrangement. Cell. 1992; 68:855–867. [PubMed: 1547487]
55. Anastasiou D, et al. Pyruvate kinase M2 activators promote tetramer formation and suppress tumorigenesis. Nature Chemical Biology. 2012; 8:839–847. [PubMed: 22922757]
56. König J, et al. iCLIP reveals the function of hnRNP particles in splicing at individual nucleotide resolution. Nat Struct Mol Biol. 2010; 17:909–915. [PubMed: 20601959]
57. Kim D, Langmead B, Salzberg SL. HISAT: a fast spliced aligner with low memory requirements. Nat Methods. 2015; 12:357–360. [PubMed: 25751142]
58. Anders S, Pyl PT, Huber W. HTSeq--a Python framework to work with high-throughput sequencing data. Bioinformatics. 2015; 31:166–169. [PubMed: 25260700]
59. Love MI, Huber W, Anders S. Moderated estimation of fold change and dispersion for RNA-seq data with DESeq2. Genome Biol. 2014; 15:550. [PubMed: 25516281]
60. Shen S, et al. rMATS: robust and flexible detection of differential alternative splicing from replicate RNA-Seq data. Proc Natl Acad Sci USA. 2014; 111:E5593–601. [PubMed: 25480548]
61. Bolger AM, Lohse M, Usadel B. Trimmomatic: a flexible trimmer for Illumina sequence data. Bioinformatics. 2014; 30:2114–2120. [PubMed: 24695404]
62. Xia Z, et al. Dynamic analyses of alternative polyadenylation from RNA-seq reveal a 3′-UTR landscape across seven tumour types. Nat Comms. 2014; 5:5274.
63. Kim D, et al. TopHat2: accurate alignment of transcriptomes in the presence of insertions, deletions and gene fusions. Genome Biol. 2013; 14:R36. [PubMed: 23618408]
64. Trapnell C, et al. Differential gene and transcript expression analysis of RNA-seq experiments with TopHat and Cufflinks. Nat Protoc. 2012; 7:562–578. [PubMed: 22383036]
65. Eden E, Navon R, Steinfeld I, Lipson D, Yakhini Z. GOrilla: a tool for discovery and visualization of enriched GO terms in ranked gene lists. BMC Bioinformatics. 2009; 10:48. [PubMed: 19192299]
Monzón-Casanova et al. Page 20
Nat Immunol. Author manuscript; available in PMC 2018 July 22.
Europe PM
C Funders A
uthor Manuscripts
Europe PM
C Funders A
uthor Manuscripts

Figure 1. PTBP1 expression is increased in positively selected GC B cells.(a) Ptbp1 and Ptbp3 mRNAseq normalised DESeq2 read counts in sorted GC B cell
populations by c-MYC and AP4 expression7. P***<0.001, P*<0.05 and ns (non-significant)
P >0.1. P-adjusted values were calculated with DESeq2 for the comparisons indicated by the
horizontal lines
(b) Gating strategy for GC and non-GC B cells and expression of different PTBPs within the
gated populations analysed by flow cytometry 7 days after NP-KLH immunisation. Full
Monzón-Casanova et al. Page 21
Nat Immunol. Author manuscript; available in PMC 2018 July 22.
Europe PM
C Funders A
uthor Manuscripts
Europe PM
C Funders A
uthor Manuscripts

gating strategy is shown in Supplementary Fig. 1e. Data shown is representative from three
independent experiments.
(c) Flow cytometry analysis of PTBP1 and PTBP3 in GFP-c-MYC+ and GFP-c-MYC- GC B
cells from MycGFP/GFP mice immunised with SRBC for 6 days. Cytometry plot shows
CXCR4 and CD86 expression of GFP-c-MYC+ (dots) and GFP-c-MYC- (density plot) GC
B cells.
In b and c, graphs show geometric mean fluorescence intensity (gMFI) for each anti-PTBP
antibody after subtraction of background staining determined with isotype control antibodies
as shown in Supplementary Fig. 1f. Each symbol shows data from an individual mouse and
bars represent the mean. Two-tailed paired Student’s t-test. ns (not significant) P>0.1,
**P<0.01 and ***P<0.001. Numbers in cytometry plots show percentages of the gated
populations.
Monzón-Casanova et al. Page 22
Nat Immunol. Author manuscript; available in PMC 2018 July 22.
Europe PM
C Funders A
uthor Manuscripts
Europe PM
C Funders A
uthor Manuscripts

Figure 2. PTBP1 is necessary for GC B cell responses.(a) Representative flow cytometry plots showing gating strategy for GC B cells, DZ and LZ
GC B cells from the spleen of mice immunised with NP-KLH for 7 days. Events shown on
the left have been pre-gated on B220+CD19+ cells. Numbers indicate the percentages of the
gated populations.
(b) Percentages and numbers of GC B cells, DZ and LZ GC B cells identified as shown in a.
Data shown is representative of more than four independent experiments. Bar graphs show
data from individual mice from one experiment and the mean is depicted with the bar. ns
P>0.05, *P<0.05, **P<0.01 from two-tailed unpaired Student’s t-test are shown for the
indicated comparisons.
(c) Anti-NP20 (high + low affinity) or anti-NP2 (high affinity only) IgG1 end-point titers
measured by ELISA in the sera of mice at different days following immunization with NP-
KLH.
(d) High affinity (NP2) vs. high and low affinity (NP20) anti-NP IgG1 ratio calculated from
the data shown in c. Data in c and d are from one out of two independent experiments with
similar results. The experiment shown had 3 Cd79a+/+Ptbp1fl/fl control mice and 6
Cd79acre/+Ptbp1fl/fl cKO mice. Shown is the mean + SD in c and ± SD in d. Differences
between control and cKO mice were analysed with two-way ANOVA plus Sidak’s multiple
comparison test. ns P>0.05, *P≤0.05 and ***P≤0.0002.
Monzón-Casanova et al. Page 23
Nat Immunol. Author manuscript; available in PMC 2018 July 22.
Europe PM
C Funders A
uthor Manuscripts
Europe PM
C Funders A
uthor Manuscripts

Figure 3. PTBP2 is partially redundant with PTBP1 in GC B cells.(a) Representative flow cytometry plots showing gating strategy of for GC B cells, DZ and
LZ GC B cells following SRBC immunisation (day 8). Events shown on the left have been
pre-gated on CD19+ cells. Numbers indicate the percentages of the gated populations.
(b) Percentages and numbers of GC B cells, DZ GC B cells and LZ GC B cells identified as
shown in a from spleens of mice after immunisation with SRBC (day 8). Bar graphs show
data from individual mice and the mean is depicted with the bar. **P<0.01, ***P<0.001
from two-tailed unpaired Student’s t-test are shown for the indicated comparisons. Data in a and b is representative from two independent experiments.
Monzón-Casanova et al. Page 24
Nat Immunol. Author manuscript; available in PMC 2018 July 22.
Europe PM
C Funders A
uthor Manuscripts
Europe PM
C Funders A
uthor Manuscripts

(c) PTBP1, PTBP2 and PTBP3 expression in GC B cells (CD95+CD38lowCD19+) from
spleens of mice 8 days post SRBC immunisation. Numbers shown in plots are the
percentages of cells within the gates.
(d) Geometric mean fluorescence intensity of PTBP1 analysed by flow cytometry in GC B
cells shown in c. Each symbol represents data from a different mouse. **P<0.01,
***P<0.001 from unpaired two-tailed Student’s t-test are shown for the comparisons
indicated.
Monzón-Casanova et al. Page 25
Nat Immunol. Author manuscript; available in PMC 2018 July 22.
Europe PM
C Funders A
uthor Manuscripts
Europe PM
C Funders A
uthor Manuscripts

Figure 4. PTBP1 regulates mRNA abundance and AS in GC B cells.(a) MA plot comparing changes in mRNA abundance at the gene level when comparing LZ
to DZ GC B cells in Cd79a+/+Ptbp1fl/fl (Controls) or Cd79acre/+Ptbp1fl/fl (P1 cKO) mice.
(b) MA plot comparing changes in mRNA abundance at the gene level in LZ and DZ GC B
cells from Cd79a+/+Ptbp1fl/fl (Ctrl) and Cd79acre/+Ptbp1fl/fl (P1 cKO) mice.
In a and b genes with significant (padj value < 0.1) different mRNA abundance and
expressed with at least 1 fragments per kilobase of exon per million reads mapped (FPKM)
in one of the conditions analysed are shown in red, genes with a padj value ≥0.1 are shown
in dark grey. The number of significantly changed genes are given in the right-hand corners
of each plot.
(c) Changes in AS when comparing LZ to DZ GC B cells in controls (Cd79a+/+Ptbp1fl/fl)
and P1 cKO (Cd79acre/+Ptbp1fl/fl) cells for skipped exons (SE), mutually exclusive exons
(MXE), alternative 5’ and 3’ splice sites (A5SS and A3SS, respectively) and retained introns
(RI) (Supplementary Fig. 4e).
(d) Changes in AS due to Ptbp1 deletion in LZ and DZ GC B cells. Ctrl: Cd79a+/+Ptbp1fl/fl
and P1 cKO: Cd79acre/+Ptbp1fl/fl.
Monzón-Casanova et al. Page 26
Nat Immunol. Author manuscript; available in PMC 2018 July 22.
Europe PM
C Funders A
uthor Manuscripts
Europe PM
C Funders A
uthor Manuscripts

c and d show inclusion level differences of significantly (FDR <0.05) differentially AS
events with an inclusion level difference bigger than 10% (≥0.1 or ≤-0.1) for the
comparisons made. Supplementary Fig. 4f shows an example of inclusion level difference
calculation. Numbers in the graphs show the number of events that are differentially
alternatively spliced.
(e) Overlaps of the number of genes with different mRNA abundance (a,b) and different AS
(at any of the event types shown in c,d).
Monzón-Casanova et al. Page 27
Nat Immunol. Author manuscript; available in PMC 2018 July 22.
Europe PM
C Funders A
uthor Manuscripts
Europe PM
C Funders A
uthor Manuscripts

Figure 5. Positive selection gene expression program is reduced due to Ptbp1 deletion.(a) Genes which have different mRNA abundance (DA) in LZ GC B cells due to Ptbp1 deletion which are c-MYC targets (GSEA HALLMARK_MYC_TARGETS_V1), increased
in GC B cells receiving high levels of T cell help compared to CG B cells which do not
receive high levels of T cell help and increased in c-MYC+AP4+ LZ GC B cells compared to
c-MYC-AP4- LZ GC B cells. DS means differentially AS (inclusion level difference >10%).
Numbers in the MA plots indicate the number of genes that are part of the studied gene sets
and have DA in LZ GC B cells due to the lack of PTBP1.
(b) Myc and AP4 (Tfap4) mRNAseq data from LZ and DZ GC B cells.
(c) GFP-c-MYC+ GC B cells gating strategy. Events shown correspond to GC B cells
(CD19+CD38lowCD95high) from spleens of Rag2-/- mice reconstituted with Cd79a+/+
Ptbp1fl/flMycGFP/GFP or Cd79acre/+Ptbp1fl/flMycGFP/GFP bone marrow cells 8 days post
SRBC immunisation.
Monzón-Casanova et al. Page 28
Nat Immunol. Author manuscript; available in PMC 2018 July 22.
Europe PM
C Funders A
uthor Manuscripts
Europe PM
C Funders A
uthor Manuscripts

(d) Percentages of GFP-c-MYC+ cells within GC B cells and c-MYC gMFI of GFP-c-MYC+ GC B cells as shown in c. Dots show data from individual mice. Bars show the means. ns
P>0.05, *P<0.05 from unpaired two-tailed Student’s t-tests are shown.
(e) Differentially AS events (FDR <0.05) with an inclusion level difference greater than 10%
due to Ptbp1 deletion in LZ GC B cells from genes that are part of the gene sets shown in a.
Labels indicate the gene name followed by the type of alternatively spliced event and the
rMATS id number, which can be found in Supplementary Table 3. Genes bound by PTBP1
nearby the AS event can be found in Supplementary Table 5.
Monzón-Casanova et al. Page 29
Nat Immunol. Author manuscript; available in PMC 2018 July 22.
Europe PM
C Funders A
uthor Manuscripts
Europe PM
C Funders A
uthor Manuscripts
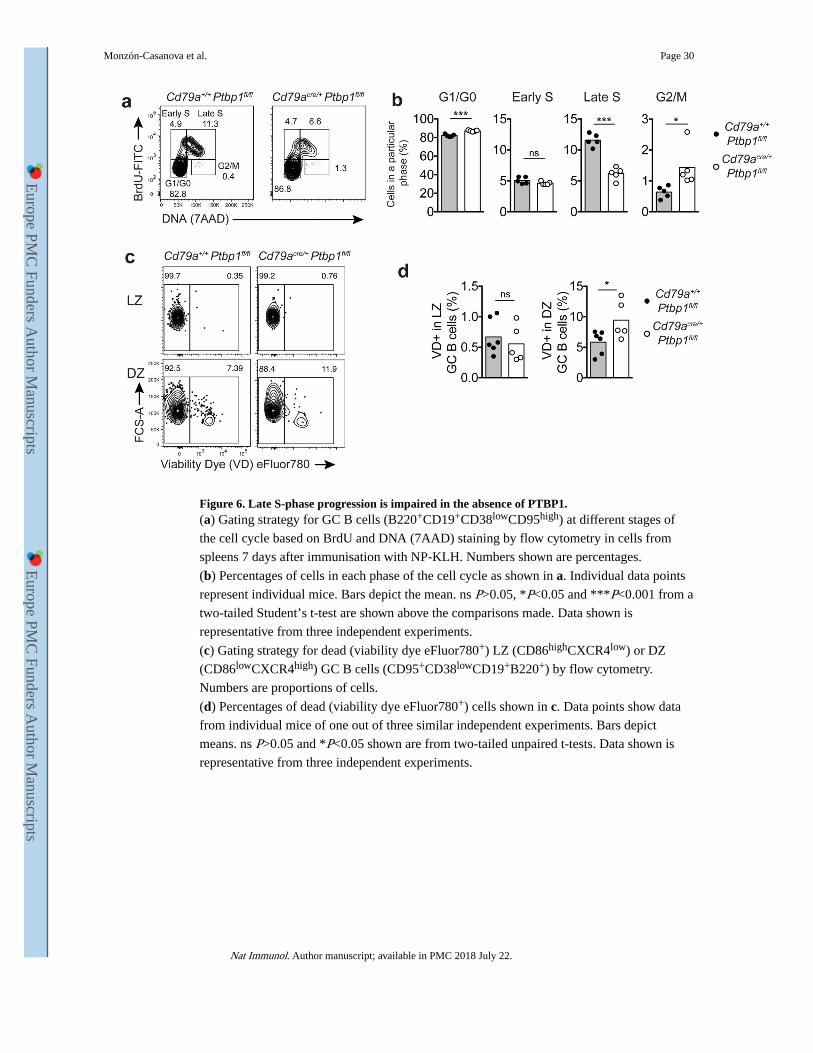
Figure 6. Late S-phase progression is impaired in the absence of PTBP1.(a) Gating strategy for GC B cells (B220+CD19+CD38lowCD95high) at different stages of
the cell cycle based on BrdU and DNA (7AAD) staining by flow cytometry in cells from
spleens 7 days after immunisation with NP-KLH. Numbers shown are percentages.
(b) Percentages of cells in each phase of the cell cycle as shown in a. Individual data points
represent individual mice. Bars depict the mean. ns P>0.05, *P<0.05 and ***P<0.001 from a
two-tailed Student’s t-test are shown above the comparisons made. Data shown is
representative from three independent experiments.
(c) Gating strategy for dead (viability dye eFluor780+) LZ (CD86highCXCR4low) or DZ
(CD86lowCXCR4high) GC B cells (CD95+CD38lowCD19+B220+) by flow cytometry.
Numbers are proportions of cells.
(d) Percentages of dead (viability dye eFluor780+) cells shown in c. Data points show data
from individual mice of one out of three similar independent experiments. Bars depict
means. ns P>0.05 and *P<0.05 shown are from two-tailed unpaired t-tests. Data shown is
representative from three independent experiments.
Monzón-Casanova et al. Page 30
Nat Immunol. Author manuscript; available in PMC 2018 July 22.
Europe PM
C Funders A
uthor Manuscripts
Europe PM
C Funders A
uthor Manuscripts

Figure 7. PTBP1 regulates Tyms mRNA abundance through control of alternative splicing.(a) Tyms FPKMs in GC B cells compared to naïve B cells49, in GC B cells receiving high
levels of T cell help (Anti-DEC-Ctrl) compared to CG B cells which do not (Anti-Dec-
OVA)3 or in LZ and DZ B cells which express c-MYC+AP4+ or not7.
(b) Tyms mRNAseq from LZ GC B cells and PTBP1 iCLIP data. Sashimi plots show read
coverage and the reads that map to exon-exon junctions with arches. The numbers on the
arches are the number of reads that map to that exon-exon junction. Scale on the PTBP1
iCLIP track shows the number of independent X-link sites identified.
(c) NMD/FL read ratio of reads mapping to exons and retained introns which will generate a
NMD Tyms transcript (NMD, yellow bins in b) vs. reads mapping to the first three exons
needed for the full-length Tyms (FL, blue bins in b) of mRNAseq libraries from GC B cells
Monzón-Casanova et al. Page 31
Nat Immunol. Author manuscript; available in PMC 2018 July 22.
Europe PM
C Funders A
uthor Manuscripts
Europe PM
C Funders A
uthor Manuscripts

which receive high levels of T cell help (Anti-Dec-OVA) or not (Anti-DEC-Ctrl)3 and in LZ
and DZ GC B cells which express c-MYC+AP4+ or not7.
(d) NMD/FL read ratio of mRNAseq libraries from LZ and DZ GC B cells.
(e) Tyms DESeq2 normalised read counts. ***Padj value<0.001 is shown. Not significant
(ns) Padj>0.1.
(f) TYMS protein levels analysed by flow cytometry in non-GC B cells (CD19+CD95-
CD38high) and LZ (CD86hiCXCR4low) or DZ (CD86lowCXCR4high) GC B
(CD19+CD95+CD38low) cells from the spleens of mice 8 days after immunisation with
SRBCs. gMFI of TYMS is shown after subtraction of background staining determined with
isotype control staining. Student’s two-tailed t-tests. *P<0.05 and ***P<0.001.
Monzón-Casanova et al. Page 32
Nat Immunol. Author manuscript; available in PMC 2018 July 22.
Europe PM
C Funders A
uthor Manuscripts
Europe PM
C Funders A
uthor Manuscripts
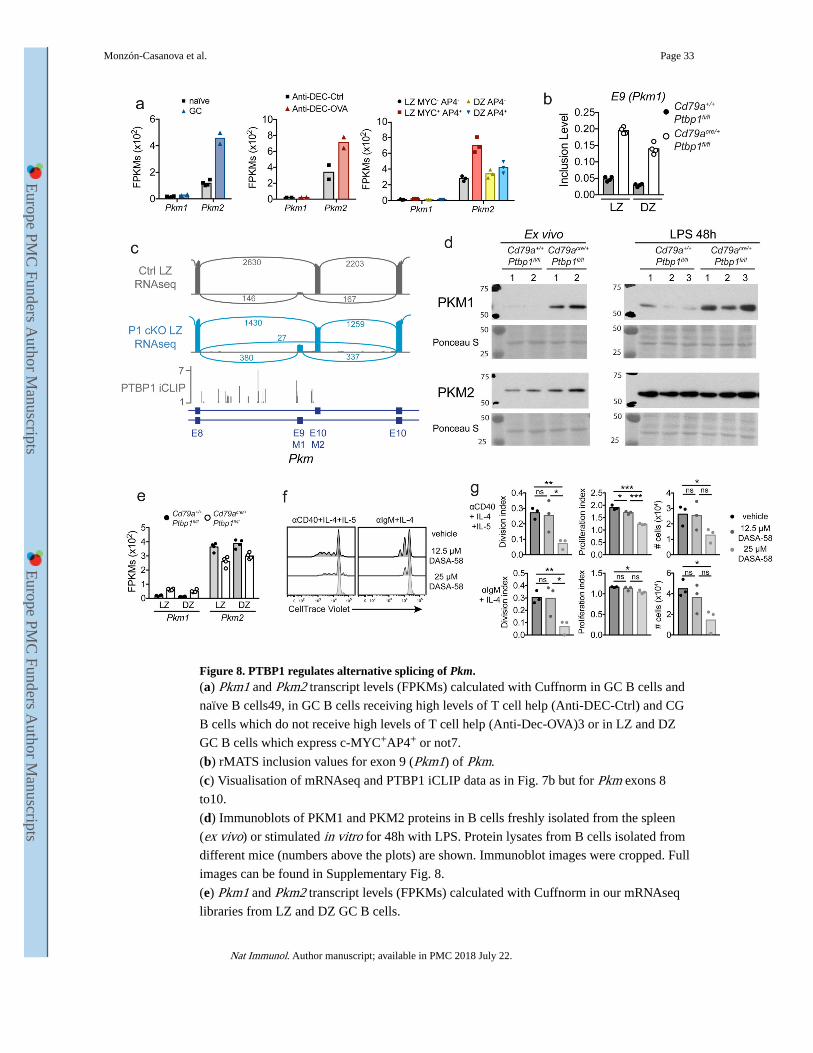
Figure 8. PTBP1 regulates alternative splicing of Pkm.(a) Pkm1 and Pkm2 transcript levels (FPKMs) calculated with Cuffnorm in GC B cells and
naïve B cells49, in GC B cells receiving high levels of T cell help (Anti-DEC-Ctrl) and CG
B cells which do not receive high levels of T cell help (Anti-Dec-OVA)3 or in LZ and DZ
GC B cells which express c-MYC+AP4+ or not7.
(b) rMATS inclusion values for exon 9 (Pkm1) of Pkm.
(c) Visualisation of mRNAseq and PTBP1 iCLIP data as in Fig. 7b but for Pkm exons 8
to10.
(d) Immunoblots of PKM1 and PKM2 proteins in B cells freshly isolated from the spleen
(ex vivo) or stimulated in vitro for 48h with LPS. Protein lysates from B cells isolated from
different mice (numbers above the plots) are shown. Immunoblot images were cropped. Full
images can be found in Supplementary Fig. 8.
(e) Pkm1 and Pkm2 transcript levels (FPKMs) calculated with Cuffnorm in our mRNAseq
libraries from LZ and DZ GC B cells.
Monzón-Casanova et al. Page 33
Nat Immunol. Author manuscript; available in PMC 2018 July 22.
Europe PM
C Funders A
uthor Manuscripts
Europe PM
C Funders A
uthor Manuscripts

(f) CellTrace Violet profile from in vitro stimulated splenic B cells stimulated for 62 hours
as indicated above the histogram overlays in the presence of DASA-58 or vehicle control (as
the highest concentration of DASA-58).
(g) Quantification of the proliferation profiles shown in f and absolute cell numbers
recovered from the cultures. Each dot shows data from B cells isolated from an individual
mouse. Bar graphs depict the mean. ns P>0.05, *P<0.05, **P<0.01 and ***P<0.001 from
unpaired Student’s two-tailed t-tests are shown.
Monzón-Casanova et al. Page 34
Nat Immunol. Author manuscript; available in PMC 2018 July 22.
Europe PM
C Funders A
uthor Manuscripts
Europe PM
C Funders A
uthor Manuscripts


![VIIICertamen - Sitio web del Ayuntamiento de Santa Cruz … · Ángela Mena Muñoz ... [5] LUANA CRISCI DÍAZ ALBA MARÍA VALENZUELA MARTÍN ... Luana Crisci Díaz, nació en Santa](https://img.pdfslide.net/doc/110x75/5ba8e71c09d3f2155e8b9a97/viiicertamen-sitio-web-del-ayuntamiento-de-santa-cruz-angela-mena-munoz.jpg)