Embed Size (px)
Citation preview
106 COMBUSTION ENGINES, No. 2/2011 (145)
1. Introduction
Since the end of the Second World War there has been
a strong and steady growth in the world’s motor vehicle
population. Initially, this growth was focused primarily in
North America but over the past six decades it has gradually
spread, first to Europe and now Asia and to a lesser extent,
Latin America. Vehicles have brought many perceived
improvements to the quality of lives – increased mobility,
jobs, recreational opportunities – to name but a few. But they
have also changed many cities into sprawling conurbations,
developed a so far unquenchable thirst for precious and
limited oil, become a major if not dominant source of urban
air pollution and most recently the most rapidly growing
contributor to climate change.
2. Trends in world motor vehicle production
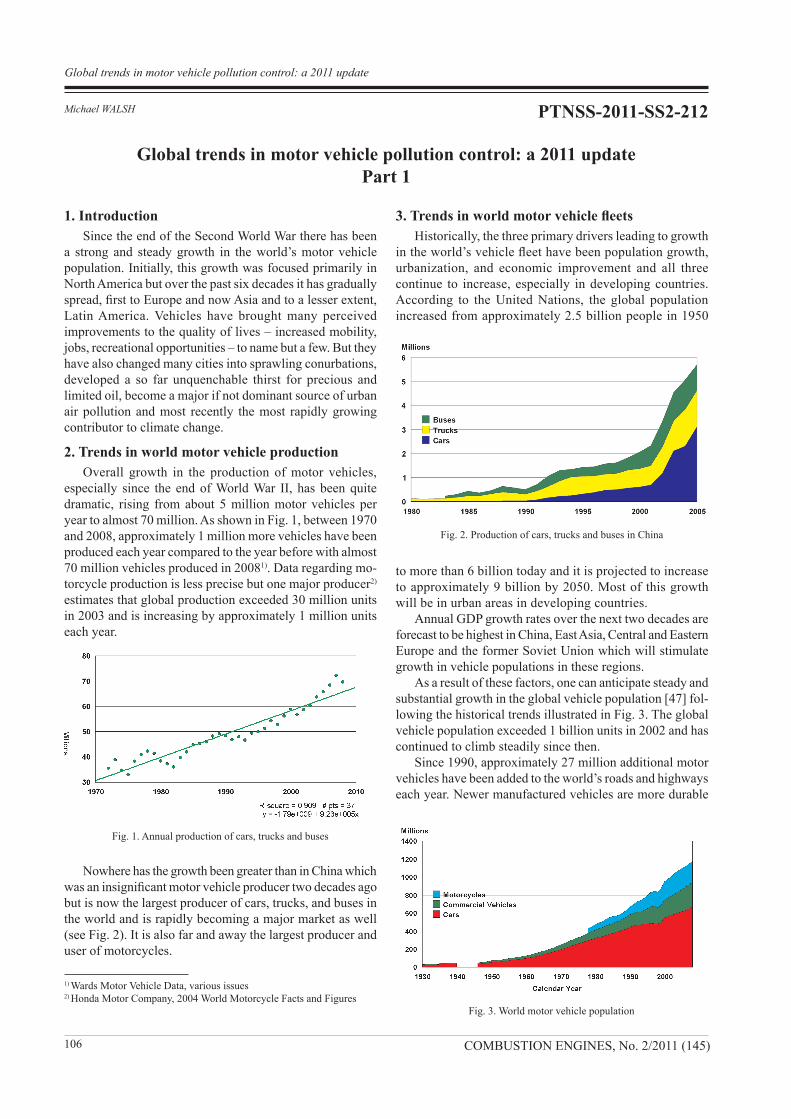
Overall growth in the production of motor vehicles,
especially since the end of World War II, has been quite
dramatic, rising from about 5 million motor vehicles per
year to almost 70 million. As shown in Fig. 1, between 1970
and 2008, approximately 1 million more vehicles have been
produced each year compared to the year before with almost
70 million vehicles produced in 20081). Data regarding mo-
torcycle production is less precise but one major producer2)
estimates that global production exceeded 30 million units
in 2003 and is increasing by approximately 1 million units
each year.
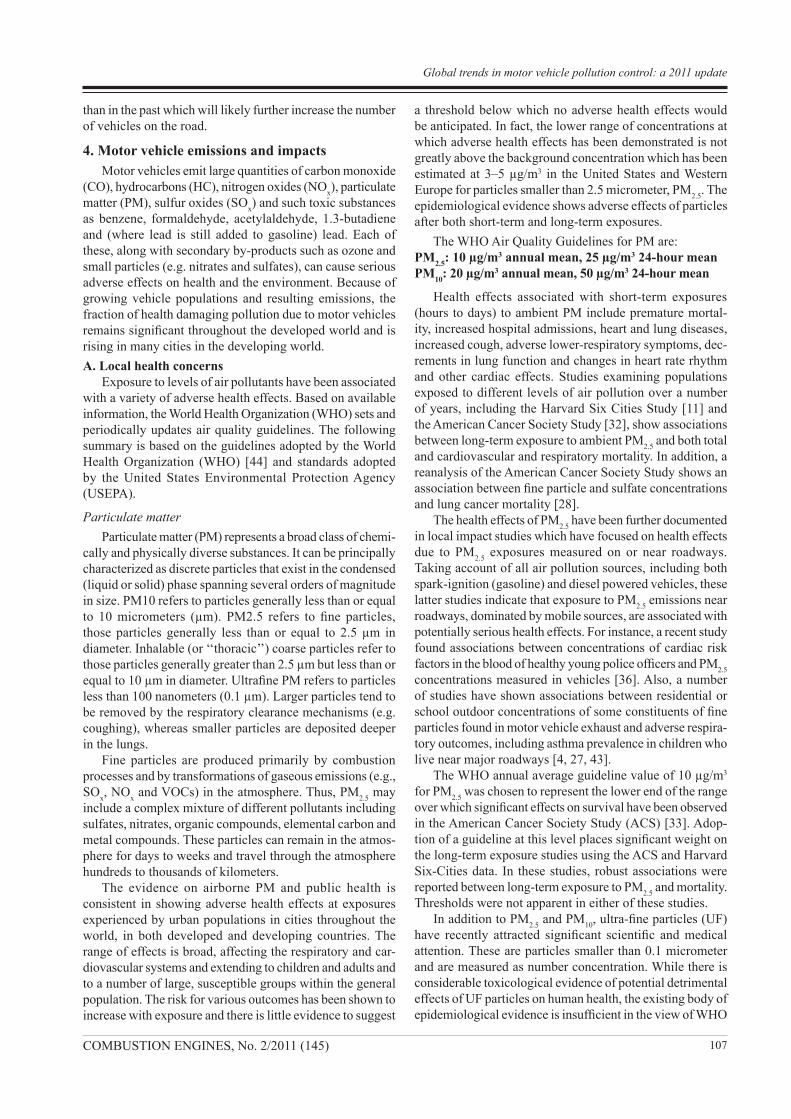
Nowhere has the growth been greater than in China which
was an insignificant motor vehicle producer two decades ago
but is now the largest producer of cars, trucks, and buses in
the world and is rapidly becoming a major market as well
(see Fig. 2). It is also far and away the largest producer and
user of motorcycles.
Michael WALSH
Global trends in motor vehicle pollution control: a 2011 update
Part 1
3. Trends in world motor vehicle fleets
Historically, the three primary drivers leading to growth
in the world’s vehicle fleet have been population growth,
urbanization, and economic improvement and all three
continue to increase, especially in developing countries.
According to the United Nations, the global population
increased from approximately 2.5 billion people in 1950
to more than 6 billion today and it is projected to increase
to approximately 9 billion by 2050. Most of this growth
will be in urban areas in developing countries.
Annual GDP growth rates over the next two decades are
forecast to be highest in China, East Asia, Central and Eastern
Europe and the former Soviet Union which will stimulate
growth in vehicle populations in these regions.
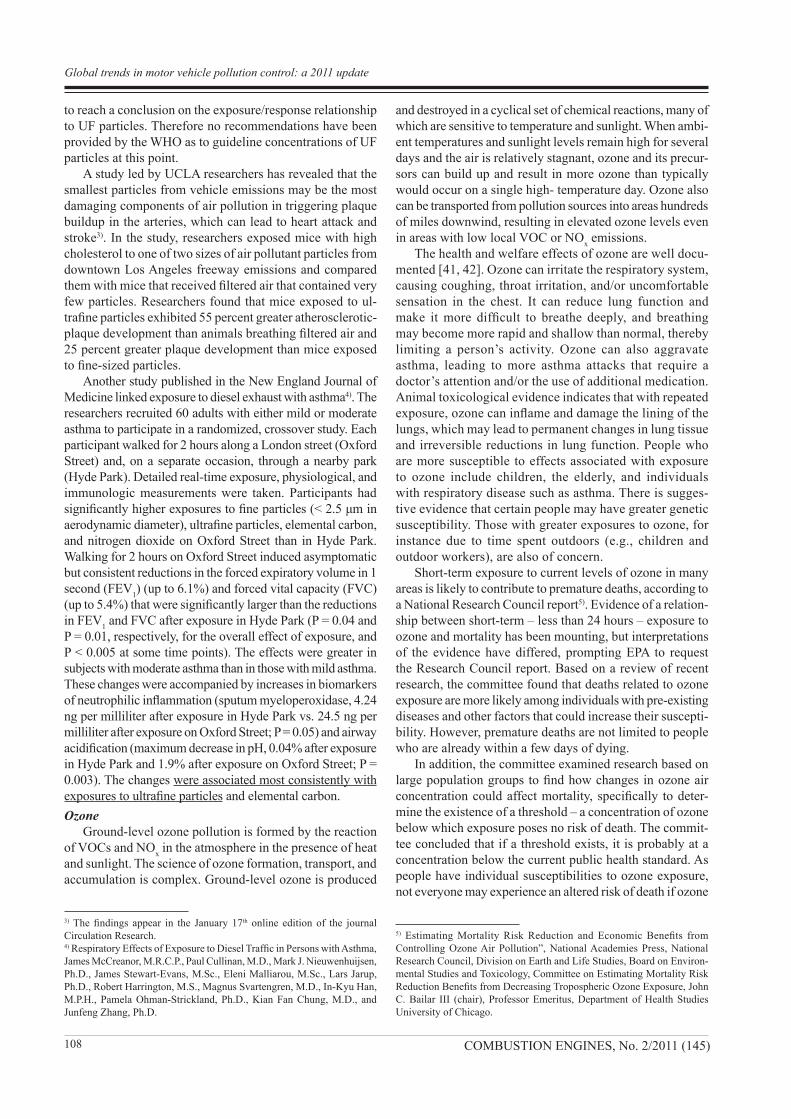
As a result of these factors, one can anticipate steady and
substantial growth in the global vehicle population [47] fol-
lowing the historical trends illustrated in Fig. 3. The global
vehicle population exceeded 1 billion units in 2002 and has
continued to climb steadily since then.
Since 1990, approximately 27 million additional motor
vehicles have been added to the world’s roads and highways
each year. Newer manufactured vehicles are more durable
Fig. 1. Annual production of cars, trucks and buses
Fig. 2. Production of cars, trucks and buses in China
Fig. 3. World motor vehicle population
1) Wards Motor Vehicle Data, various issues2) Honda Motor Company, 2004 World Motorcycle Facts and Figures
PTNSS-2011-SS2-212
Global trends in motor vehicle pollution control: a 2011 update
107COMBUSTION ENGINES, No. 2/2011 (145)
than in the past which will likely further increase the number
of vehicles on the road.
4. Motor vehicle emissions and impacts
Motor vehicles emit large quantities of carbon monoxide
(CO), hydrocarbons (HC), nitrogen oxides (NOx), particulate
matter (PM), sulfur oxides (SOx) and such toxic substances
as benzene, formaldehyde, acetylaldehyde, 1.3-butadiene
and (where lead is still added to gasoline) lead. Each of
these, along with secondary by-products such as ozone and
small particles (e.g. nitrates and sulfates), can cause serious
adverse effects on health and the environment. Because of
growing vehicle populations and resulting emissions, the
fraction of health damaging pollution due to motor vehicles
remains significant throughout the developed world and is
rising in many cities in the developing world.
A. Local health concerns
Exposure to levels of air pollutants have been associated
with a variety of adverse health effects. Based on available
information, the World Health Organization (WHO) sets and
periodically updates air quality guidelines. The following
summary is based on the guidelines adopted by the World
Health Organization (WHO) [44] and standards adopted
by the United States Environmental Protection Agency
(USEPA).
Particulate matter
Particulate matter (PM) represents a broad class of chemi-
cally and physically diverse substances. It can be principally
characterized as discrete particles that exist in the condensed
(liquid or solid) phase spanning several orders of magnitude
in size. PM10 refers to particles generally less than or equal
to 10 micrometers (µm). PM2.5 refers to fine particles,
those particles generally less than or equal to 2.5 µm in
diameter. Inhalable (or ‘‘thoracic’’) coarse particles refer to
those particles generally greater than 2.5 µm but less than or
equal to 10 µm in diameter. Ultrafine PM refers to particles
less than 100 nanometers (0.1 µm). Larger particles tend to
be removed by the respiratory clearance mechanisms (e.g.
coughing), whereas smaller particles are deposited deeper
in the lungs.
Fine particles are produced primarily by combustion
processes and by transformations of gaseous emissions (e.g.,
SOx, NO
x and VOCs) in the atmosphere. Thus, PM
2.5 may
include a complex mixture of different pollutants including
sulfates, nitrates, organic compounds, elemental carbon and
metal compounds. These particles can remain in the atmos-
phere for days to weeks and travel through the atmosphere
hundreds to thousands of kilometers.
The evidence on airborne PM and public health is
consistent in showing adverse health effects at exposures
experienced by urban populations in cities throughout the
world, in both developed and developing countries. The
range of effects is broad, affecting the respiratory and car-
diovascular systems and extending to children and adults and
to a number of large, susceptible groups within the general
population. The risk for various outcomes has been shown to
increase with exposure and there is little evidence to suggest
a threshold below which no adverse health effects would
be anticipated. In fact, the lower range of concentrations at
which adverse health effects has been demonstrated is not
greatly above the background concentration which has been
estimated at 3–5 µg/m3 in the United States and Western
Europe for particles smaller than 2.5 micrometer, PM2.5
. The
epidemiological evidence shows adverse effects of particles
after both short-term and long-term exposures.
The WHO Air Quality Guidelines for PM are:
PM2.5
: 10 µg/m3 annual mean, 25 µg/m3 24-hour mean
PM10
: 20 µg/m3 annual mean, 50 µg/m3 24-hour mean
Health effects associated with short-term exposures
(hours to days) to ambient PM include premature mortal-
ity, increased hospital admissions, heart and lung diseases,
increased cough, adverse lower-respiratory symptoms, dec-
rements in lung function and changes in heart rate rhythm
and other cardiac effects. Studies examining populations
exposed to different levels of air pollution over a number
of years, including the Harvard Six Cities Study [11] and
the American Cancer Society Study [32], show associations
between long-term exposure to ambient PM2.5
and both total
and cardiovascular and respiratory mortality. In addition, a
reanalysis of the American Cancer Society Study shows an
association between fine particle and sulfate concentrations
and lung cancer mortality [28].
The health effects of PM2.5
have been further documented
in local impact studies which have focused on health effects
due to PM2.5
exposures measured on or near roadways.
Taking account of all air pollution sources, including both
spark-ignition (gasoline) and diesel powered vehicles, these
latter studies indicate that exposure to PM2.5
emissions near
roadways, dominated by mobile sources, are associated with
potentially serious health effects. For instance, a recent study
found associations between concentrations of cardiac risk
factors in the blood of healthy young police officers and PM2.5
concentrations measured in vehicles [36]. Also, a number
of studies have shown associations between residential or
school outdoor concentrations of some constituents of fine
particles found in motor vehicle exhaust and adverse respira-
tory outcomes, including asthma prevalence in children who
live near major roadways [4, 27, 43].
The WHO annual average guideline value of 10 µg/m3
for PM2.5
was chosen to represent the lower end of the range
over which significant effects on survival have been observed
in the American Cancer Society Study (ACS) [33]. Adop-
tion of a guideline at this level places significant weight on
the long-term exposure studies using the ACS and Harvard
Six-Cities data. In these studies, robust associations were
reported between long-term exposure to PM2.5
and mortality.
Thresholds were not apparent in either of these studies.
In addition to PM2.5
and PM10
, ultra-fine particles (UF)
have recently attracted significant scientific and medical
attention. These are particles smaller than 0.1 micrometer
and are measured as number concentration. While there is
considerable toxicological evidence of potential detrimental
effects of UF particles on human health, the existing body of
epidemiological evidence is insufficient in the view of WHO
Global trends in motor vehicle pollution control: a 2011 update
108 COMBUSTION ENGINES, No. 2/2011 (145)
to reach a conclusion on the exposure/response relationship
to UF particles. Therefore no recommendations have been
provided by the WHO as to guideline concentrations of UF
particles at this point.
A study led by UCLA researchers has revealed that the
smallest particles from vehicle emissions may be the most
damaging components of air pollution in triggering plaque
buildup in the arteries, which can lead to heart attack and
stroke3). In the study, researchers exposed mice with high
cholesterol to one of two sizes of air pollutant particles from
downtown Los Angeles freeway emissions and compared
them with mice that received filtered air that contained very
few particles. Researchers found that mice exposed to ul-
trafine particles exhibited 55 percent greater atherosclerotic-
plaque development than animals breathing filtered air and
25 percent greater plaque development than mice exposed
to fine-sized particles.
Another study published in the New England Journal of
Medicine linked exposure to diesel exhaust with asthma4). The
researchers recruited 60 adults with either mild or moderate
asthma to participate in a randomized, crossover study. Each
participant walked for 2 hours along a London street (Oxford
Street) and, on a separate occasion, through a nearby park
(Hyde Park). Detailed real-time exposure, physiological, and
immunologic measurements were taken. Participants had
significantly higher exposures to fine particles (< 2.5 μm in
aerodynamic diameter), ultrafine particles, elemental carbon,
and nitrogen dioxide on Oxford Street than in Hyde Park.
Walking for 2 hours on Oxford Street induced asymptomatic
but consistent reductions in the forced expiratory volume in 1
second (FEV1) (up to 6.1%) and forced vital capacity (FVC)
(up to 5.4%) that were significantly larger than the reductions
in FEV1 and FVC after exposure in Hyde Park (P = 0.04 and
P = 0.01, respectively, for the overall effect of exposure, and
P < 0.005 at some time points). The effects were greater in
subjects with moderate asthma than in those with mild asthma.
These changes were accompanied by increases in biomarkers
of neutrophilic inflammation (sputum myeloperoxidase, 4.24
ng per milliliter after exposure in Hyde Park vs. 24.5 ng per
milliliter after exposure on Oxford Street; P = 0.05) and airway
acidification (maximum decrease in pH, 0.04% after exposure
in Hyde Park and 1.9% after exposure on Oxford Street; P =
0.003). The changes were associated most consistently with
exposures to ultrafine particles and elemental carbon.
Ozone
Ground-level ozone pollution is formed by the reaction
of VOCs and NOx in the atmosphere in the presence of heat
and sunlight. The science of ozone formation, transport, and
accumulation is complex. Ground-level ozone is produced
and destroyed in a cyclical set of chemical reactions, many of
which are sensitive to temperature and sunlight. When ambi-
ent temperatures and sunlight levels remain high for several
days and the air is relatively stagnant, ozone and its precur-
sors can build up and result in more ozone than typically
would occur on a single high- temperature day. Ozone also
can be transported from pollution sources into areas hundreds
of miles downwind, resulting in elevated ozone levels even
in areas with low local VOC or NOx emissions.
The health and welfare effects of ozone are well docu-
mented [41, 42]. Ozone can irritate the respiratory system,
causing coughing, throat irritation, and/or uncomfortable
sensation in the chest. It can reduce lung function and
make it more difficult to breathe deeply, and breathing
may become more rapid and shallow than normal, thereby
limiting a person’s activity. Ozone can also aggravate
asthma, leading to more asthma attacks that require a
doctor’s attention and/or the use of additional medication.
Animal toxicological evidence indicates that with repeated
exposure, ozone can inflame and damage the lining of the
lungs, which may lead to permanent changes in lung tissue
and irreversible reductions in lung function. People who
are more susceptible to effects associated with exposure
to ozone include children, the elderly, and individuals
with respiratory disease such as asthma. There is sugges-
tive evidence that certain people may have greater genetic
susceptibility. Those with greater exposures to ozone, for
instance due to time spent outdoors (e.g., children and
outdoor workers), are also of concern.
Short-term exposure to current levels of ozone in many
areas is likely to contribute to premature deaths, according to
a National Research Council report5). Evidence of a relation-
ship between short-term – less than 24 hours – exposure to
ozone and mortality has been mounting, but interpretations
of the evidence have differed, prompting EPA to request
the Research Council report. Based on a review of recent
research, the committee found that deaths related to ozone
exposure are more likely among individuals with pre-existing
diseases and other factors that could increase their suscepti-
bility. However, premature deaths are not limited to people
who are already within a few days of dying.
In addition, the committee examined research based on
large population groups to find how changes in ozone air
concentration could affect mortality, specifically to deter-
mine the existence of a threshold – a concentration of ozone
below which exposure poses no risk of death. The commit-
tee concluded that if a threshold exists, it is probably at a
concentration below the current public health standard. As
people have individual susceptibilities to ozone exposure,
not everyone may experience an altered risk of death if ozone
3) The findings appear in the January 17th online edition of the journal
Circulation Research.4) Respiratory Effects of Exposure to Diesel Traffic in Persons with Asthma,
James McCreanor, M.R.C.P., Paul Cullinan, M.D., Mark J. Nieuwenhuijsen,
Ph.D., James Stewart-Evans, M.Sc., Eleni Malliarou, M.Sc., Lars Jarup,
Ph.D., Robert Harrington, M.S., Magnus Svartengren, M.D., In-Kyu Han,
M.P.H., Pamela Ohman-Strickland, Ph.D., Kian Fan Chung, M.D., and
Junfeng Zhang, Ph.D.
5) Estimating Mortality Risk Reduction and Economic Benefits from
Controlling Ozone Air Pollution”, National Academies Press, National
Research Council, Division on Earth and Life Studies, Board on Environ-
mental Studies and Toxicology, Committee on Estimating Mortality Risk
Reduction Benefits from Decreasing Tropospheric Ozone Exposure, John
C. Bailar III (chair), Professor Emeritus, Department of Health Studies
University of Chicago.
Global trends in motor vehicle pollution control: a 2011 update
109COMBUSTION ENGINES, No. 2/2011 (145)
air concentration also changes. The research on short-term
exposure does not account for all ozone-related mortality,
and the estimated risk of death may be greater than if based
solely on these studies, the committee noted.
The second edition of the WHO AQG [1] set the guideline
value for ozone at 120 µg/m3 for an 8-hour daily average.
Since the mid-1990s there has been no major addition to the
evidence from chamber studies or field studies. There has
however been a marked increase in health effects evidence
from epidemiological time-series studies. Combined evi-
dence from those studies shows convincing, though small,
positive associations between daily mortality and ozone
levels, independent of the effects of particulate matter. Simi-
lar associations have been observed in both North America
and Europe. These time-series studies have shown effects
at ozone concentrations below the previous guideline of
120 µg/m3 without clear evidence of a threshold. Evidence
from both chamber and field studies also indicate that there
is considerable individual variation in response to ozone.
In view of these considerations, there was a good case for
reducing the WHO AQG from the previous level of 120
µg/m3. WHO, therefore, recommended that the air quality
guideline for ozone be set at the level of:
Ozone: 100 µg/m3 for daily maximum 8-hour mean
As concentrations increase above the guideline value,
health effects at the population level become increasingly
numerous and severe. Such effects can occur in places where
concentrations are currently high due to human activities or
during episodes of very hot weather.
Nitrogen dioxide
Evidence from animal toxicological studies indicates that
long-term exposure to NO2 at concentrations above current
ambient concentrations has adverse effects. In population
studies NO2 has been associated with adverse health effects
even when the annual average NO2 concentration complied
with the WHO-2000 annual guideline value of 40 µg/m3.
Also some indoor studies suggest effects on respiratory
symptoms among infants at concentrations below 40 µg/m3.
Together these results support a lowering of the annual NO2
guideline value. However, NO2 is an important constituent of
combustion-generated air pollution and is highly correlated
with other primary and secondary combustion products;
it is unclear to what extent the health effects observed in
epidemiological studies are attributable to NO2 itself or to
other correlated pollutants. The current scientific literature,
therefore, has not accumulated sufficient evidence to change
the WHO 2000 guideline value of 40 µg/m3 for annual NO2
concentrations.
Many short term experimental human toxicology studies
show acute health effects at levels higher than 500 µg/m3, and
one meta-analysis has indicated effects at levels exceeding
200 µg/m3. The current scientific literature has not accu-
mulated evidence to change from the WHO 2000 guideline
value of 200 µg/m3 for 1-hour NO2 concentration.
In conclusion, the WHO guideline values remain un-
changed at the following levels:
NO2 concentration: 40 µg/m3 for annual mean;
NO2 concentration: 200 µg/m
3 for 1-hour mean.
The California Air Resources Board approved staff
recommendations to amend its NO2 standard on February
22, 2007. The recommendations were based on a review
of the scientific literature on the health effects of NO2 that
was conducted by staff from the Air Resources Board and
the Office of Environmental Health Hazard Assessment. On
January 5, 2007, staff recommended lowering the existing
1-hour-average standard for NO2 of 0.25 ppm to 0.18 ppm,
not to be exceeded, and established a new annual-average
standard of 0.030 ppm, not to be exceeded.
An Environmental Protection Agency draft risk assess-
ment finds evidence from recent studies is "sufficient to infer
a likely causal relationship" between short-term exposure
to nitrogen dioxide and adverse effects on the respiratory
system6). According to the draft report, a 30-minute exposure
to nitrogen dioxide concentrations between 0.2 ppm and
0.3 ppm has been shown to irritate airways in asthmatics.
Children, whose lung function continues to develop into
adolescence, and those over the age of 65 are also par-
ticularly susceptible to nitrogen dioxide exposure. The risk
assessment also identified as an at-risk group those whose
jobs require significant periods of driving. Mean nitrogen
dioxide levels inside vehicles are often two to three times
the outdoor concentrations.
Sulfur dioxide
Short-term exposures
Controlled studies with exercising asthmatics indicate
that some of them experience changes in pulmonary function
and respiratory symptoms after periods of exposure as short
as 10 minutes. Based on this evidence, it is recommended
by WHO that a value of 500 µg/m3 should not be exceeded
over averaging periods of 10 minutes. Because exposure
to sharp peaks depends on the nature of local sources and
meteorological conditions, no single factor can be applied to
this value in order to estimate corresponding guideline values
over somewhat longer periods, such as an hour.
Exposure over a 24-hour period and long-term exposure
Day-to-day changes in mortality, morbidity or lung func-
tion related to 24-hour average concentrations of sulfur diox-
ide are necessarily based on epidemiological studies in which
people are in general exposed to a mixture of pollutants, with
little basis for separating the contributions of each to the ef-
fects, which is why guideline values for sulfur dioxide were
linked before 1987 with corresponding values for particulate
matter. This approach led to a guideline value before 1987 of
125 µg/m3 as a 24-hour average, after applying an uncertainty
factor of 2 to the lowest-observed-adverse-effect level. In the
2000 revision, it was noted that recent epidemiological stud-
ies showed separate and independent adverse public health
effects for particulate matter and sulfur dioxide, and this led
to a separate WHO AQG for sulfur dioxide of 125 µg/m3 as
6) EPA published a request for comment on the draft assessment in the
Federal Register on April 14th 2008.
Global trends in motor vehicle pollution control: a 2011 update
110 COMBUSTION ENGINES, No. 2/2011 (145)
a 24-hour average. More recent evidence, beginning with the
Hong Kong study of a major reduction in sulfur content in
fuels over a very short period of time, shows an associated
substantial reduction in health effects (childhood respiratory
disease and all age mortality outcomes) [17]. In time-series
studies on hospital admissions for cardiac disease, there is
no evidence of a concentration threshold within the range
of 5-40 µg/m3 in both Hong Kong and London [46]. Daily
SO2 was significantly associated with daily mortality in 12
Canadian cities with an average concentration of only 5 µg/m3
[6]. If there were an SO2 threshold for either the Burnett et
al. study of daily mortality, or the annual mortality study of
Pope et al. (2002), they would have to be very low. For the
significant associations in the ACS cohort for 1982-1998 in
126 US metropolitan areas, the mean SO2 was 6.7 µg/m3.
Nevertheless, there is still considerable uncertainty as to
whether sulfur dioxide is the pollutant responsible for the
observed adverse effects or, rather, a surrogate for ultra-fine
particles or some other correlated substance. For example, in
Germany [45] and the Netherlands [5] a strong reduction of
SO2 concentrations occurred over a decade. Although mor-
tality also decreased with time, the association of SO2 and
mortality was judged to not be causal and was attributed to a
similar time trend of a different pollutant (PM). In considera-
tion of: (1) the uncertainty of SO2 in causality; (2) the practical
difficulty of reaching levels that are certain to be associated
with no effects; and (3) the need to provide greater degrees of
protection than those provided by the guidelines published in
2000, and assuming that reduction in exposure to a causal and
correlated substance is achieved by reducing sulfur dioxide
concentrations, then there is a basis for revising the 24 hour
guideline downward for sulfur dioxide, and the following
guideline is recommended as a prudent precautionary level:
Sulfur dioxide: 20 µg/m3 for 24-hour mean
500 µg/m3 for 10-minute mean (unchanged)
The WHO has determined that an annual guideline is not
needed, since compliance with the 24-hour level will assure
low levels for the annual average.
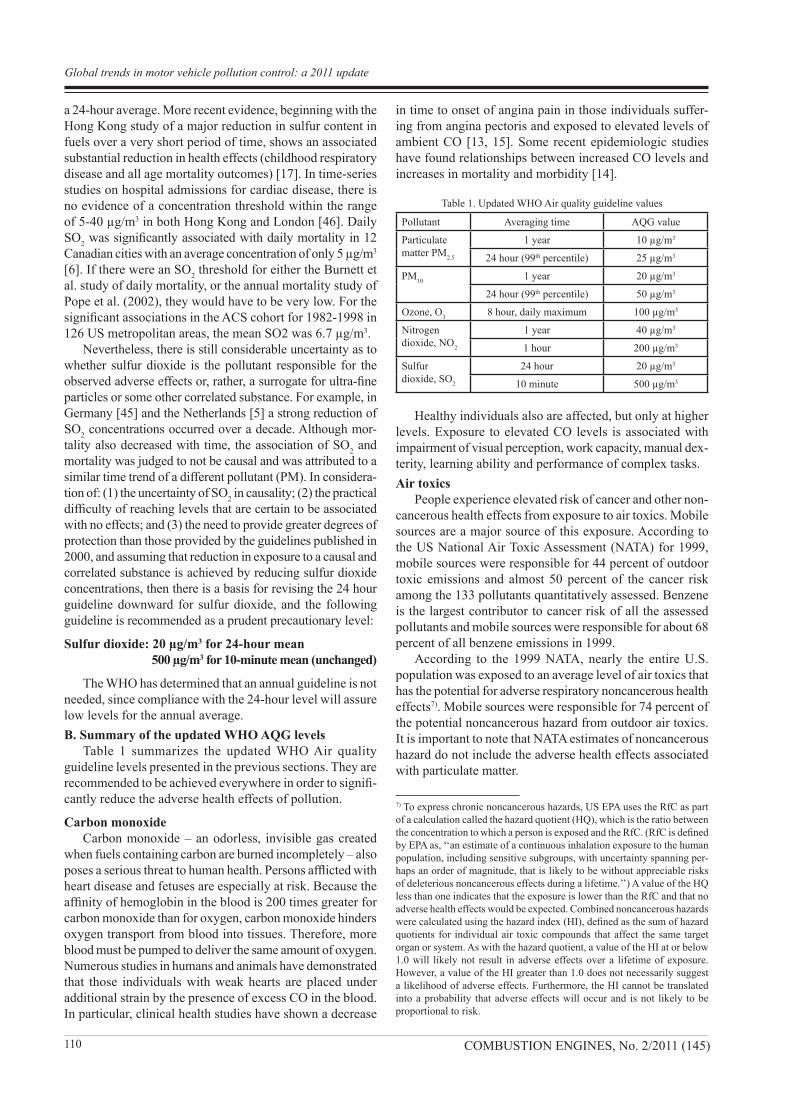
B. Summary of the updated WHO AQG levels
Table 1 summarizes the updated WHO Air quality
guideline levels presented in the previous sections. They are
recommended to be achieved everywhere in order to signifi-
cantly reduce the adverse health effects of pollution.
Carbon monoxide
Carbon monoxide – an odorless, invisible gas created
when fuels containing carbon are burned incompletely – also
poses a serious threat to human health. Persons afflicted with
heart disease and fetuses are especially at risk. Because the
affinity of hemoglobin in the blood is 200 times greater for
carbon monoxide than for oxygen, carbon monoxide hinders
oxygen transport from blood into tissues. Therefore, more
blood must be pumped to deliver the same amount of oxygen.
Numerous studies in humans and animals have demonstrated
that those individuals with weak hearts are placed under
additional strain by the presence of excess CO in the blood.
In particular, clinical health studies have shown a decrease
in time to onset of angina pain in those individuals suffer-
ing from angina pectoris and exposed to elevated levels of
ambient CO [13, 15]. Some recent epidemiologic studies
have found relationships between increased CO levels and
increases in mortality and morbidity [14].
Table 1. Updated WHO Air quality guideline values
Pollutant Averaging time AQG value
Particulate
matter PM2.5
1 year 10 µg/m3
24 hour (99th percentile) 25 µg/m3
PM10
1 year 20 µg/m3
24 hour (99th percentile) 50 µg/m3
Ozone, O3
8 hour, daily maximum 100 µg/m3
Nitrogen
dioxide, NO2
1 year 40 µg/m3
1 hour 200 µg/m3
Sulfur
dioxide, SO2
24 hour 20 µg/m3
10 minute 500 µg/m3
Healthy individuals also are affected, but only at higher
levels. Exposure to elevated CO levels is associated with
impairment of visual perception, work capacity, manual dex-
terity, learning ability and performance of complex tasks.
Air toxics
People experience elevated risk of cancer and other non-
cancerous health effects from exposure to air toxics. Mobile
sources are a major source of this exposure. According to
the US National Air Toxic Assessment (NATA) for 1999,
mobile sources were responsible for 44 percent of outdoor
toxic emissions and almost 50 percent of the cancer risk
among the 133 pollutants quantitatively assessed. Benzene
is the largest contributor to cancer risk of all the assessed
pollutants and mobile sources were responsible for about 68
percent of all benzene emissions in 1999.
According to the 1999 NATA, nearly the entire U.S.
population was exposed to an average level of air toxics that
has the potential for adverse respiratory noncancerous health
effects7). Mobile sources were responsible for 74 percent of
the potential noncancerous hazard from outdoor air toxics.
It is important to note that NATA estimates of noncancerous
hazard do not include the adverse health effects associated
with particulate matter.
7) To express chronic noncancerous hazards, US EPA uses the RfC as part
of a calculation called the hazard quotient (HQ), which is the ratio between
the concentration to which a person is exposed and the RfC. (RfC is defined
by EPA as, ‘‘an estimate of a continuous inhalation exposure to the human
population, including sensitive subgroups, with uncertainty spanning per-
haps an order of magnitude, that is likely to be without appreciable risks
of deleterious noncancerous effects during a lifetime.’’) A value of the HQ
less than one indicates that the exposure is lower than the RfC and that no
adverse health effects would be expected. Combined noncancerous hazards
were calculated using the hazard index (HI), defined as the sum of hazard
quotients for individual air toxic compounds that affect the same target
organ or system. As with the hazard quotient, a value of the HI at or below
1.0 will likely not result in adverse effects over a lifetime of exposure.
However, a value of the HI greater than 1.0 does not necessarily suggest
a likelihood of adverse effects. Furthermore, the HI cannot be translated
into a probability that adverse effects will occur and is not likely to be
proportional to risk.
Global trends in motor vehicle pollution control: a 2011 update
111COMBUSTION ENGINES, No. 2/2011 (145)
The following section provides a brief overview of air
toxics which are associated with vehicles and provides a
discussion of the health risks associated with each.
Diesel exhaust (DE)
Diesel exhaust (DE) is a complex mixture comprised
of carbon dioxide, oxygen, nitrogen, water vapor, carbon
monoxide, nitrogen compounds, sulfur compounds and
numerous low-molecular-weight hydrocarbons. A number
of these gaseous hydrocarbon components are individu-
ally known to be toxic including aldehydes, benzene and
1.3-butadiene. The diesel particulate matter (DPM) present in
diesel exhaust consists of fine particles (< 2.5 µm), including
a subgroup with a large number of ultrafine particles (< 0.1
µm). These particles have a large surface area which makes
them an excellent medium for adsorbing organics and their
small size makes them highly respirable and able to reach
the deep lung. Many of the organic compounds present on
the particles and in the gases are individually known to have
mutagenic and carcinogenic properties. Diesel exhaust var-
ies significantly in chemical composition and particle sizes
between different engine types (heavy-duty, light-duty),
engine operating conditions (idle, accelerate, decelerate),
and fuel formulations (high/low sulfur fuel). After being
emitted, diesel exhaust undergoes chemical and physical
changes in the atmosphere.
(1) Diesel exhaust: potential cancer effects
In the US EPA’s 2002 Diesel Health Assessment Docu-
ment (Diesel HAD) [38], diesel exhaust was classified
as likely to be carcinogenic to humans by inhalation at
environmental exposures, in accordance with the revised
draft 1996/1999 EPA cancer guidelines. A number of other
agencies (National Institute for Occupational Safety and
Health, the International Agency for Research on Cancer,
the World Health Organization, California EPA, and the
U.S. Department of Health and Human Services) have made
similar classifications.
For the Diesel HAD, EPA reviewed 22 epidemiologic stud-
ies on the subject of the carcinogenicity of workers exposed
to diesel exhaust in various occupations, finding increased
lung cancer risk, although not always statistically significant,
in 8 out of 10 cohort studies and 10 out of 12 case- control
studies within several industries, including railroad workers.
Relative risk for lung cancer associated with exposure ranged
from 1.2 to 1.5, although a few studies show relative risks
as high as 2.6. Additionally, the Diesel HAD also relied on
two independent meta-analyses, which examined 23 and 30
occupational studies respectively, which found statistically
significant increases in smoking-adjusted relative lung cancer
risk associated with diesel exhaust, of 1.33 to 1.47. These
meta-analyses demonstrate the effect of pooling many studies
and in this case show the positive relationship between diesel
exhaust exposure and lung cancer across a variety of diesel
exhaust- exposed occupations [2, 29].
The EPA Diesel HAD concluded that environmental risks
from diesel exhaust exposure could range from a low of 10–4
to 10–5 to as high as 10–3, reflecting the range of occupational
exposures that could be associated with the relative and ab-
solute risk levels observed in the occupational studies.
Retrospective health studies of railroad workers have
played an important part in determining that diesel exhaust
is a likely human carcinogen. Key evidence of the diesel
exhaust exposure linkage to lung cancer comes from two
retrospective case-control studies of railroad workers.
(2) Diesel exhaust: other health effects
Noncancerous health effects of acute and chronic expo-
sure to diesel exhaust emissions are also of concern. EPA
derived an RfC from consideration of four well-conducted
chronic rat inhalation studies showing adverse pulmonary
effects [18, 25, 30, 31]. The RfC is 5 µ/m3 for diesel exhaust
as measured by diesel PM. This RfC does not consider al-
lergenic effects such as those associated with asthma or im-
munologic effects even though there is growing evidence that
exposure to diesel exhaust can exacerbate these effects.
Other Air Toxics
Vehicles contribute to ambient levels of other air toxics
known or suspected as human or animal carcinogens, or
that have non-cancer health effects. These other compounds
include benzene, 1,3-butadiene, formaldehyde, acetaldehyde,
acrolein, polycyclic organic matter (POM), and naphthalene.
All of these compounds, except acetaldehyde, were identified
as national or regional risk drivers in the 1999 National-Scale
Air Toxics Assessment (NATA). For a significant portion of
the population, these compounds pose a significant portion
of the total cancer and noncancerous risk from breathing
outdoor air toxics.
Noncancerous health effects resulting from inhalation
exposures include neurological, cardiovascular, liver, kidney,
and respiratory effects as well as effects on the immune and
reproductive systems.
A major new comprehensive study of air pollution and
health in Asia, issued by the Health Effects Institute (HEI)
[37], seems to capture well the health risks associated with
air pollution in developing countries. It found that while
developing Asia has made many promising strides in im-
proving air quality in its cities, susceptibility to the effects
of air pollution can be expected to rise as rates of chronic
cardiovascular and respiratory disease increase in an aging
population. With rapid urbanization, industrialization and
vehicle growth, the number of cases of air-pollution related
illness is likely to grow.
The study, conducted by an international expert panel
of HEI, found that the effects of short term exposure to air
pollution in Asian cities is on a par with those in hundreds of
cities worldwide…and that further improvements in air qual-
ity in Asia would be expected to improve health as they have
elsewhere. With over 530,000 premature deaths occurring
each year in Asian cities due to air pollution levels exceeding
World Health Organization (WHO)’s guidelines, interventions
to improve air quality can be expected to mirror the health
benefits realized in other cities around the world.
Even in Europe serious health concerns related to urban
air pollution remain. For example, using traditional health
impact assessment methods, APHEKOM (Improving
Global trends in motor vehicle pollution control: a 2011 update
112 COMBUSTION ENGINES, No. 2/2011 (145)
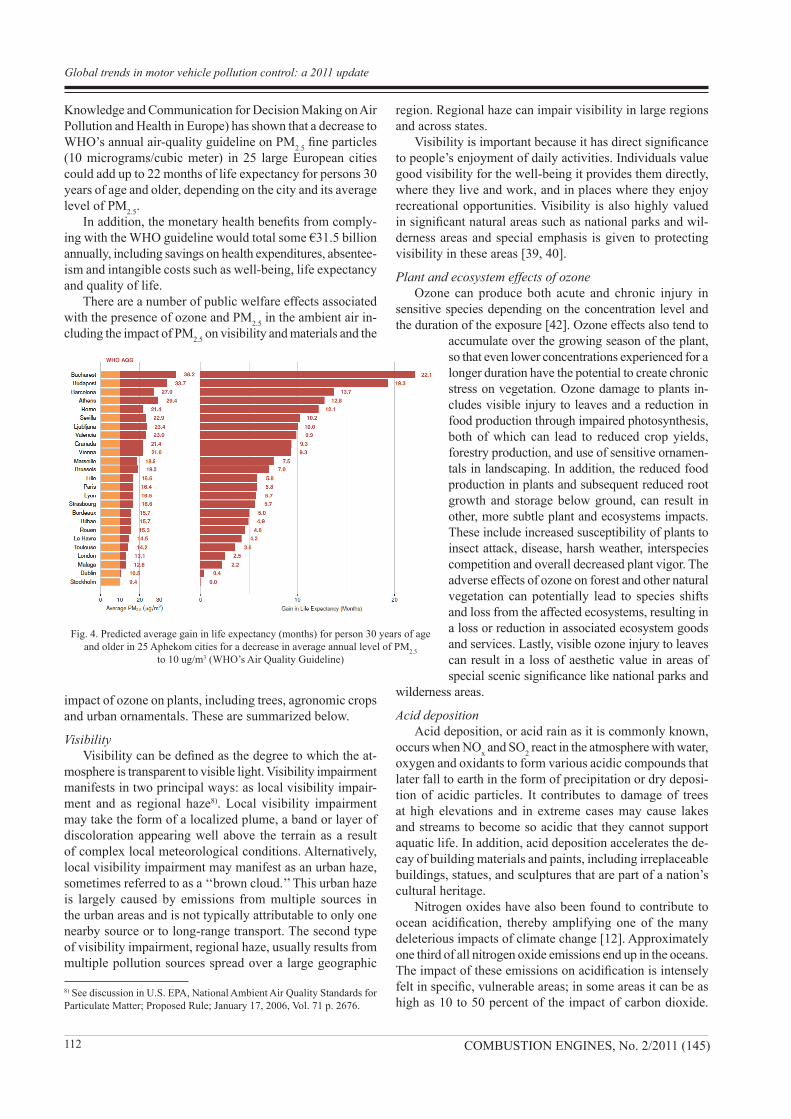
Knowledge and Communication for Decision Making on Air
Pollution and Health in Europe) has shown that a decrease to
WHO’s annual air-quality guideline on PM2.5
fine particles
(10 micrograms/cubic meter) in 25 large European cities
could add up to 22 months of life expectancy for persons 30
years of age and older, depending on the city and its average
level of PM2.5
.
In addition, the monetary health benefits from comply-
ing with the WHO guideline would total some €31.5 billion
annually, including savings on health expenditures, absentee-
ism and intangible costs such as well-being, life expectancy
and quality of life.
There are a number of public welfare effects associated
with the presence of ozone and PM2.5
in the ambient air in-
cluding the impact of PM2.5
on visibility and materials and the
impact of ozone on plants, including trees, agronomic crops
and urban ornamentals. These are summarized below.
Visibility
Visibility can be defined as the degree to which the at-
mosphere is transparent to visible light. Visibility impairment
manifests in two principal ways: as local visibility impair-
ment and as regional haze8). Local visibility impairment
may take the form of a localized plume, a band or layer of
discoloration appearing well above the terrain as a result
of complex local meteorological conditions. Alternatively,
local visibility impairment may manifest as an urban haze,
sometimes referred to as a ‘‘brown cloud.’’ This urban haze
is largely caused by emissions from multiple sources in
the urban areas and is not typically attributable to only one
nearby source or to long-range transport. The second type
of visibility impairment, regional haze, usually results from
multiple pollution sources spread over a large geographic
region. Regional haze can impair visibility in large regions
and across states.
Visibility is important because it has direct significance
to people’s enjoyment of daily activities. Individuals value
good visibility for the well-being it provides them directly,
where they live and work, and in places where they enjoy
recreational opportunities. Visibility is also highly valued
in significant natural areas such as national parks and wil-
derness areas and special emphasis is given to protecting
visibility in these areas [39, 40].
Plant and ecosystem effects of ozone
Ozone can produce both acute and chronic injury in
sensitive species depending on the concentration level and
the duration of the exposure [42]. Ozone effects also tend to
accumulate over the growing season of the plant,
so that even lower concentrations experienced for a
longer duration have the potential to create chronic
stress on vegetation. Ozone damage to plants in-
cludes visible injury to leaves and a reduction in
food production through impaired photosynthesis,
both of which can lead to reduced crop yields,
forestry production, and use of sensitive ornamen-
tals in landscaping. In addition, the reduced food
production in plants and subsequent reduced root
growth and storage below ground, can result in
other, more subtle plant and ecosystems impacts.
These include increased susceptibility of plants to
insect attack, disease, harsh weather, interspecies
competition and overall decreased plant vigor. The
adverse effects of ozone on forest and other natural
vegetation can potentially lead to species shifts
and loss from the affected ecosystems, resulting in
a loss or reduction in associated ecosystem goods
and services. Lastly, visible ozone injury to leaves
can result in a loss of aesthetic value in areas of
special scenic significance like national parks and
wilderness areas.
Acid deposition
Acid deposition, or acid rain as it is commonly known,
occurs when NOx and SO
2 react in the atmosphere with water,
oxygen and oxidants to form various acidic compounds that
later fall to earth in the form of precipitation or dry deposi-
tion of acidic particles. It contributes to damage of trees
at high elevations and in extreme cases may cause lakes
and streams to become so acidic that they cannot support
aquatic life. In addition, acid deposition accelerates the de-
cay of building materials and paints, including irreplaceable
buildings, statues, and sculptures that are part of a nation’s
cultural heritage.
Nitrogen oxides have also been found to contribute to
ocean acidification, thereby amplifying one of the many
deleterious impacts of climate change [12]. Approximately
one third of all nitrogen oxide emissions end up in the oceans.
The impact of these emissions on acidification is intensely
felt in specific, vulnerable areas; in some areas it can be as
high as 10 to 50 percent of the impact of carbon dioxide.
Fig. 4. Predicted average gain in life expectancy (months) for person 30 years of age
and older in 25 Aphekom cities for a decrease in average annual level of PM2.5
to 10 ug/m3 (WHO’s Air Quality Guideline)
8) See discussion in U.S. EPA, National Ambient Air Quality Standards for
Particulate Matter; Proposed Rule; January 17, 2006, Vol. 71 p. 2676.
Global trends in motor vehicle pollution control: a 2011 update
113COMBUSTION ENGINES, No. 2/2011 (145)
The hardest hit areas are likely to be those directly around
the release site, so these emissions are especially significant
in and around coastal waters.
Eutrophication and nitrification
Eutrophication is the accelerated production of organic
matter, particularly algae, in a water body. Nitrogen deposi-
tion contributes to eutrophication of watersheds, particularly
in aquatic systems where atmospheric deposition of nitrogen
represents a significant portion of total nitrogen loadings.
This increased growth can cause numerous adverse ecologi-
cal effects and economic impacts, including nuisance algal
blooms, dieback of underwater plants due to reduced light
penetration, and toxic plankton blooms. Algal and plankton
blooms can also reduce the level of dissolved oxygen, which
can adversely affect fish and shellfish populations. In recent
decades, human activities have greatly accelerated nutrient
impacts, such as nitrogen and phosphorus, causing excessive
growth of algae and leading to degraded water quality and
associated impairment of freshwater and estuarine resources
for human uses [9].
Severe and persistent eutrophication often directly im-
pacts human activities. For example, losses in the nation’s
fishery resources may be directly caused by fish kills associ-
ated with low dissolved oxygen and toxic blooms. Declines
in tourism occur when low dissolved oxygen causes noxious
smells and floating mats of algal blooms create unfavorable
aesthetic conditions. Risks to human health increase when
the toxins from algal blooms accumulate in edible fish and
shellfish, and when toxins become airborne, causing respira-
tory problems due to inhalation.
Materials damage and soiling
The deposition of airborne particles can reduce the aes-
thetic appeal of buildings and culturally important structures
through soiling, and can contribute directly (or in conjunction
with other pollutants) to structural damage by means of cor-
rosion or erosion [40]. Particles affect materials principally
by promoting and accelerating the corrosion of metals, by
degrading paints, and by deteriorating building materials
such as concrete and limestone. Particles contribute to these
effects because of their electrolytic, hygroscopic, and acidic
properties, and their ability to adsorb corrosive gases (prin-
cipally sulfur dioxide). The rate of metal corrosion depends
on a number of factors, including the deposition rate and
nature of the pollutant; the influence of the metal protective
corrosion film; the amount of moisture present; variability
in the electrochemical reactions; the presence and concen-
tration of other surface electrolytes; and the orientation of
the metal surface.
Climate change
Finally, there is no longer any scientific dispute that
human production of greenhouse gases, including carbon
dioxide (CO2), methane (CH
4), and nitrous oxide (N
2O), are
responsible for the unprecedented rate of warming observed
over the past century. According to the Intergovernmental
Panel on Climate Change (“IPCC”), “[w]arming of the
climate system is unequivocal, as is now evident from
observations of increases in global air and ocean tempera-
tures, widespread melting of snow and ice, and rising global
average sea level” [24] Moreover, “[m]ost of the observed
increase in global average temperatures since the mid-20th
century is very likely due to the observed increase in anthro-
pogenic greenhouse gas concentrations.” Thus, the world’s
leading scientific body on the subject has now concluded,
with greater than 90 percent certainty, that emissions of
greenhouse gases are responsible for climate change.
Concentrations of the main greenhouse gases in the
atmosphere have reached their highest level since pre-indus-
trial times, the World Meteorological Organization (WMO)
announced recently [48]. Concentrations of the gases con-
tinued to build up in 2009 – the latest year of observations
– despite the economic slowdown, the U.N. agency said in
its latest Greenhouse Gas Bulletin. Total radiative forcing
of all long-lived greenhouse gases – the balance between
radiation coming into the atmosphere and radiation going
out – increased by 1.0 percent in 2009 compared to 2008 and
rose by 27.5 percent from 1990 to 2009, the WMO said.
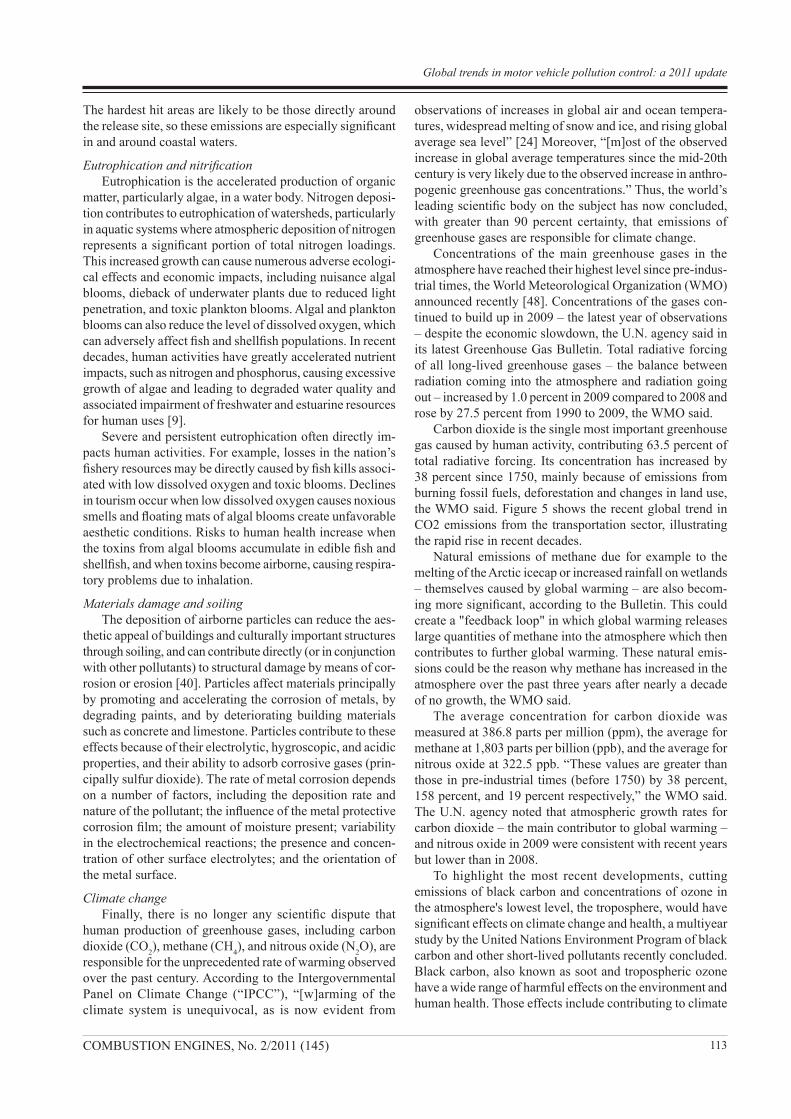
Carbon dioxide is the single most important greenhouse
gas caused by human activity, contributing 63.5 percent of
total radiative forcing. Its concentration has increased by
38 percent since 1750, mainly because of emissions from
burning fossil fuels, deforestation and changes in land use,
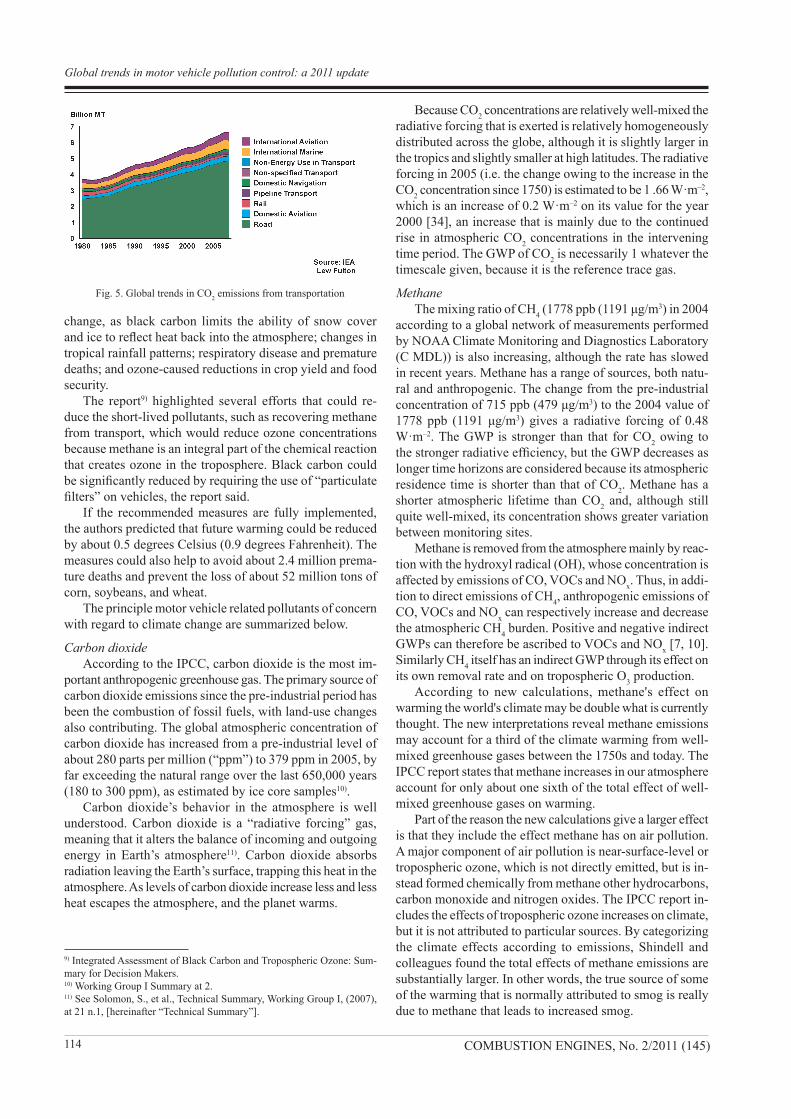
the WMO said. Figure 5 shows the recent global trend in
CO2 emissions from the transportation sector, illustrating
the rapid rise in recent decades.
Natural emissions of methane due for example to the
melting of the Arctic icecap or increased rainfall on wetlands
– themselves caused by global warming – are also becom-
ing more significant, according to the Bulletin. This could
create a "feedback loop" in which global warming releases
large quantities of methane into the atmosphere which then
contributes to further global warming. These natural emis-
sions could be the reason why methane has increased in the
atmosphere over the past three years after nearly a decade
of no growth, the WMO said.
The average concentration for carbon dioxide was
measured at 386.8 parts per million (ppm), the average for
methane at 1,803 parts per billion (ppb), and the average for
nitrous oxide at 322.5 ppb. “These values are greater than
those in pre-industrial times (before 1750) by 38 percent,
158 percent, and 19 percent respectively,” the WMO said.
The U.N. agency noted that atmospheric growth rates for
carbon dioxide – the main contributor to global warming –
and nitrous oxide in 2009 were consistent with recent years
but lower than in 2008.
To highlight the most recent developments, cutting
emissions of black carbon and concentrations of ozone in
the atmosphere's lowest level, the troposphere, would have
significant effects on climate change and health, a multiyear
study by the United Nations Environment Program of black
carbon and other short-lived pollutants recently concluded.
Black carbon, also known as soot and tropospheric ozone
have a wide range of harmful effects on the environment and
human health. Those effects include contributing to climate
Global trends in motor vehicle pollution control: a 2011 update
114 COMBUSTION ENGINES, No. 2/2011 (145)
change, as black carbon limits the ability of snow cover
and ice to reflect heat back into the atmosphere; changes in
tropical rainfall patterns; respiratory disease and premature
deaths; and ozone-caused reductions in crop yield and food
security.
The report9) highlighted several efforts that could re-
duce the short-lived pollutants, such as recovering methane
from transport, which would reduce ozone concentrations
because methane is an integral part of the chemical reaction
that creates ozone in the troposphere. Black carbon could
be significantly reduced by requiring the use of “particulate
filters” on vehicles, the report said.
If the recommended measures are fully implemented,
the authors predicted that future warming could be reduced
by about 0.5 degrees Celsius (0.9 degrees Fahrenheit). The
measures could also help to avoid about 2.4 million prema-
ture deaths and prevent the loss of about 52 million tons of
corn, soybeans, and wheat.
The principle motor vehicle related pollutants of concern
with regard to climate change are summarized below.
Carbon dioxide
According to the IPCC, carbon dioxide is the most im-
portant anthropogenic greenhouse gas. The primary source of
carbon dioxide emissions since the pre-industrial period has
been the combustion of fossil fuels, with land-use changes
also contributing. The global atmospheric concentration of
carbon dioxide has increased from a pre-industrial level of
about 280 parts per million (“ppm”) to 379 ppm in 2005, by
far exceeding the natural range over the last 650,000 years
(180 to 300 ppm), as estimated by ice core samples10).
Carbon dioxide’s behavior in the atmosphere is well
understood. Carbon dioxide is a “radiative forcing” gas,
meaning that it alters the balance of incoming and outgoing
energy in Earth’s atmosphere11). Carbon dioxide absorbs
radiation leaving the Earth’s surface, trapping this heat in the
atmosphere. As levels of carbon dioxide increase less and less
heat escapes the atmosphere, and the planet warms.
Because CO2 concentrations are relatively well-mixed the
radiative forcing that is exerted is relatively homogeneously
distributed across the globe, although it is slightly larger in
the tropics and slightly smaller at high latitudes. The radiative
forcing in 2005 (i.e. the change owing to the increase in the
CO2 concentration since 1750) is estimated to be 1 .66 W·m–2,
which is an increase of 0.2 W·m–2 on its value for the year
2000 [34], an increase that is mainly due to the continued
rise in atmospheric CO2 concentrations in the intervening
time period. The GWP of CO2 is necessarily 1 whatever the
timescale given, because it is the reference trace gas.
Methane
The mixing ratio of CH4 (1778 ppb (1191 μg/m3) in 2004
according to a global network of measurements performed
by NOAA Climate Monitoring and Diagnostics Laboratory
(C MDL)) is also increasing, although the rate has slowed
in recent years. Methane has a range of sources, both natu-
ral and anthropogenic. The change from the pre-industrial
concentration of 715 ppb (479 μg/m3) to the 2004 value of
1778 ppb (1191 μg/m3) gives a radiative forcing of 0.48
W·m–2. The GWP is stronger than that for CO2 owing to
the stronger radiative efficiency, but the GWP decreases as
longer time horizons are considered because its atmospheric
residence time is shorter than that of CO2. Methane has a
shorter atmospheric lifetime than CO2 and, although still
quite well-mixed, its concentration shows greater variation
between monitoring sites.
Methane is removed from the atmosphere mainly by reac-
tion with the hydroxyl radical (OH), whose concentration is
affected by emissions of CO, VOCs and NOx. Thus, in addi-
tion to direct emissions of CH4, anthropogenic emissions of
CO, VOCs and NOx can respectively increase and decrease
the atmospheric CH4 burden. Positive and negative indirect
GWPs can therefore be ascribed to VOCs and NOx [7, 10].
Similarly CH4 itself has an indirect GWP through its effect on
its own removal rate and on tropospheric O3 production.
According to new calculations, methane's effect on
warming the world's climate may be double what is currently
thought. The new interpretations reveal methane emissions
may account for a third of the climate warming from well-
mixed greenhouse gases between the 1750s and today. The
IPCC report states that methane increases in our atmosphere
account for only about one sixth of the total effect of well-
mixed greenhouse gases on warming.
Part of the reason the new calculations give a larger effect
is that they include the effect methane has on air pollution.
A major component of air pollution is near-surface-level or
tropospheric ozone, which is not directly emitted, but is in-
stead formed chemically from methane other hydrocarbons,
carbon monoxide and nitrogen oxides. The IPCC report in-
cludes the effects of tropospheric ozone increases on climate,
but it is not attributed to particular sources. By categorizing
the climate effects according to emissions, Shindell and
colleagues found the total effects of methane emissions are
substantially larger. In other words, the true source of some
of the warming that is normally attributed to smog is really
due to methane that leads to increased smog.
Fig. 5. Global trends in CO2 emissions from transportation
9) Integrated Assessment of Black Carbon and Tropospheric Ozone: Sum-
mary for Decision Makers.10) Working Group I Summary at 2.11) See Solomon, S., et al., Technical Summary, Working Group I, (2007),
at 21 n.1, [hereinafter “Technical Summary”].
Global trends in motor vehicle pollution control: a 2011 update
115COMBUSTION ENGINES, No. 2/2011 (145)
Nitrogen oxides and nitrous oxide
Nitrogen oxides consist of a family of several compounds
containing nitrogen and oxygen in varying amounts. Nitro-
gen oxides play a role in climate change through two primary
means: (1) nitrogen oxides react with other substances to
form the greenhouse gas ozone, and (2) nitrous oxide is itself
a highly potent and long-lived greenhouse gas. Moreover,
nitrogen oxide pollution represents an additional burden on
oceanic pH levels by lowering pH and increasing acidity.
Emissions of nitrogen oxides contribute to the atmospher-
ic concentration of ozone, which the IPCC has determined is
the third most damaging greenhouse gas, after carbon diox-
ide and methane [8]. As nitrogen oxides react with volatile
organic compounds, they create ozone in the lower layer of
the atmosphere, the troposphere. Through the production of
tropospheric ozone, nitrogen oxide emissions contribute to
the warming of the surface-troposphere system.
Nitrous oxide behaves very similarly to carbon dioxide in
that it both directly traps heat in the atmosphere and remains
in existence for many decades once emitted12). However,
nitrous oxide is far more potent, with a global warming
potential 298 times that of carbon dioxide over 100 years.
According to the IPCC, the concentration of nitrous oxide
in the atmosphere in 2005 was 319 parts per billion (ppb),
approximately 18 percent higher than its pre-industrial level.
Moreover, data from ice cores indicate that in the 11,500
years before the Industrial Revolution, the level of nitrous
oxide in the atmosphere varied by less than about ten ppb.
Black carbon
A product of inefficient combustion, black carbon, also
known as soot, consists of microscopic solid particles of
incompletely burned organic matter13). Black carbon is a
potent warmer, exerting effects on the global climate both
while suspended in the atmosphere and when deposited
on snow and ice. In fact, one study estimates that a given
mass of black carbon will warm the air between 360,000
and 840,000 times more than an equal mass of carbon
dioxide [26]. While the quantification is quite variable, a
large number of recent studies have raised serious concerns
regarding the climate impacts of black carbon14). The most
pernicious characteristic of black carbon from a climatic
perspective is its dark color and correspondingly low albedo,
or reflectivity. Because of this dark coloring, black carbon
absorbs heat from sunlight.
When suspended in the air, black carbon warms by trap-
ping heat in the top of the atmosphere. The IPCC estimates
that atmospheric black carbon exerts a positive radiative
forcing effect of +0.2 W/m2 15). This direct warming leads to
feedback effects which magnify the global warming contri-
bution of black carbon [26]. For example, as black carbon
particles absorb sunlight, they warm the air around them,
decreasing the relative humidity of the air and thus the liquid
water content of other particles suspended in the air. The
drying out of these other particles reduces their reflectivity,
and as they absorb more sunlight the air warms even more.
Further, the water evaporated from such particles remains in
the air as water vapor, which is itself a greenhouse gas.
When deposited out of the air onto a lighter surface, the
darker black carbon causes the surface to absorb more of the
sun’s energy. Thus, when deposited on snow or ice, black
carbon can reduce the snow’s reflectivity and accelerate the
melting process [35]. As when suspended in the atmosphere,
black carbon’s deposition onto ice and snow creates positive
feedback effects that lead to even greater warming. For ex-
ample, as snow and ice around them melt away, the deposited
black carbon particles can become even more concentrated
on and near the surface, further reducing the reflectivity of
the remaining snow and ice [16]. Thus, although the IPCC
estimates the radiative forcing effect of black carbon deposi-
tion on snow and ice to be +0.1 W/m2, it acknowledges that
the radiative forcing metric may not accurately capture the
climatic impacts of black carbon deposition on snow and ice.
In the words of the IPCC, “the ‘efficacy’ may be higher” for
black carbon radiative forcing, as it produces a temperature
response 1.7 times greater than an equivalent radiative
forcing due to carbon dioxide [21]. Because the Arctic has
warmed at around twice the rate of the rest of the world over
the last 100 years, controlling and reducing black carbon
emissions is particularly important [22]. The impacts of black
carbon are not limited to the Arctic, however. Black carbon
may be responsible for as much as 25 percent of observed
global warming [19]. Thus, the overall contribution of black
12) E.g., Technical Summary at 27 (discussing the radiative forcing effect
of N2O); at 23-24 (discussing the long atmospheric lifetimes of CO
2, CH
4,
and N2O).
13) See W. Chameides and M. Bergin, Soot Takes Center Stage, 297 Science
2214 (Sept. 27, 2002), (explaining that “BC is produced through incomplete
combustion of biomass, coal, and diesel fuel”).14) Bond TC, Sun H. 2005. Can Reducing Black Carbon Emissions Counter-
act Global Warming? Environ. Sci. Technol. 39(16):5921-5926, Delucchi
MA. 2003. Appendix D: CO2 Equivalency Factors. An Appendix to the
Report, "A Lifecycle Emissions Model (LEM): Lifecycle Emissions from
Transportation Fuels, Motor Vehicles, Transportation Modes, Electricity
Use, Heating and Cooking Fuels, and Materials. Davis, California: Institute
of Transportation Studies, Forster P, Ramaswamy V, Artaxo P, Berntsen TK,
Betts R, Fahey DW, Haywood J, Lean J, Lowe DC, Myrhe G and others.
2007. Changes in Atmospheric Constituents and in Radiative Forcing In:
Solomon S, Qin D, Manning M, Chen Z, Marquis M, Averyt KB, Tignor
M, Miller HL, editors. Climate Change 2007: The Physical Sciences Basis.
Contribution of Working Group I to the Fourth Assessment Report of the
Intergovernmental Panel on Climate Change. Cambridge, UK and New
York, USA, Fuglestvedt JS, Berntsen TK, Godal O, Sausen R, Shine KP,
Skodvin T. 2003. Metrics of Climate Change: Assessing Radiative Forcing
and Emission Indices. Climatic Change 58(3):267-331, Hansen J, Sato M,
Kharecha P, Russell G, Lea DW, Siddall M. 2007. Climate change and trace
gases. Philosophical Transactions of the Royal Society A 365:1925-1954,
Hansen J, Sato M, Ruedy R, Lacis A, Oinas V. 2000. Global Warming in
the 21st Century: An alternative Scenario. Proceedings of the National
Academy of Sciences 97(18):9875-9880, Jacobson MZ. 2007. Testimony
for the Hearing on Black Carbon and Global Warming. House Committee
on Oversight and Government Reform. 110th Congress, First Session ed.
Washington, DC, Jacobson MZ. 2002. Control of fossil-fuel particulate
black carbon and organic matter, possibly the most effective method of
slowing global warming. J Geoph Res 107(D19):16:1-16:22, Ramanathan
V. 2007. Role of Black Carbon on Global and Regional Climate Change.
House Committee on Oversight and Government Reform, 110th Congress,
1st Session. Washington, DC. 15) Technical Summary, at 29.
Global trends in motor vehicle pollution control: a 2011 update
116 COMBUSTION ENGINES, No. 2/2011 (145)
carbon to global warming may be substantial, perhaps second
only to that of carbon dioxide16).
A very recent study indicates that black carbon has a
warming effect in the atmosphere three to four times greater
than prevailing estimates, according to scientists in a review
article in the journal Nature Geoscience [3]. Scripps Institu-
tion of Oceanography at UC San Diego atmospheric scientist
V. Ramanathan and University of Iowa chemical engineer
Greg Carmichael said that soot and other forms of black
carbon could have as much as 60 percent of the current glo-
bal warming effect of carbon dioxide, more than that of any
greenhouse gas besides CO2. In the paper, Ramanathan and
Carmichael integrated observed data from satellites, aircraft
and surface instruments about the warming effect of black
carbon and found that it’s forcing, or warming effect in the
atmosphere, is about 0.9 watts per meter squared.
Ramanathan and Carmichael said the IPCC’s conserva-
tive estimates are based on widely used computer model
simulations that do not take into account the amplification
of black carbon's warming effect when mixed with other
aerosols such as sulfates. The models also do not adequately
represent the full range of altitudes at which the warming
effect occurs. The most recent observations, in contrast, have
found significant black carbon warming effects at altitudes
in the range of 2 kilometers (6,500 feet), levels at which
black carbon particles absorb not only sunlight but also solar
energy reflected by clouds at lower altitudes.
Water vapor
Aircraft are unique in that they also contribute to climate
change by altering cloud cover patterns. They do this by
emitting water vapor which forms condensation trails, or
“contrails,” when released at high altitude. Contrails are vis-
ible line clouds that form in cold, humid atmospheres [23].
In addition, the persistent formation of contrails is associated
with the spread of cirrus clouds [20]. An increase in cirrus
cloud cover tends to warm the surface of the Earth, further
contributing to global warming.
Great progress in reducing emissions of the urban air
pollutants and their precursors from gasoline-fueled cars has
occurred in the major industrialized countries and stringent
requirements for diesel vehicles are starting to be phased
in. However, the vehicle population and vehicle kilometers
traveled are expected to continue to grow rapidly in the future
especially in developing countries which will offset many
of the gains to date [47].
The next section will review the steps necessary to
reduce motor vehicle emissions and the current status in
many countries.
16) Chameides and Bergin, at 2214.
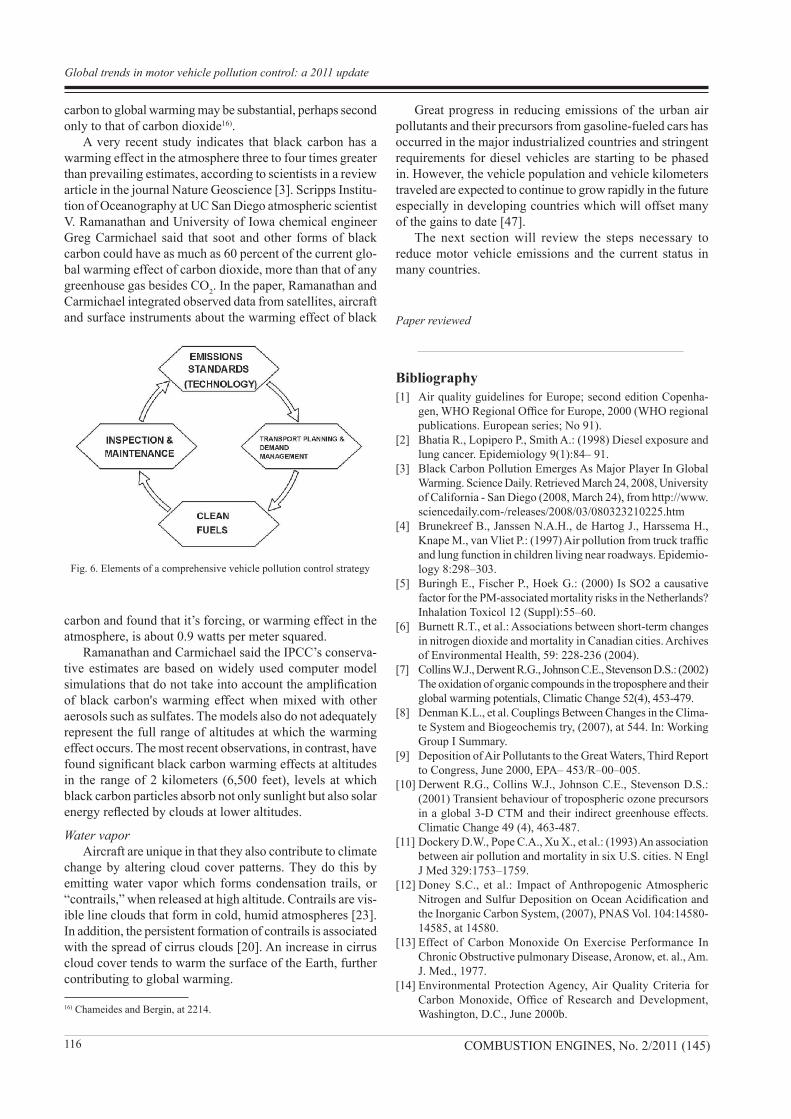
Fig. 6. Elements of a comprehensive vehicle pollution control strategy
Bibliography
[1] Air quality guidelines for Europe; second edition Copenha-
gen, WHO Regional Office for Europe, 2000 (WHO regional
publications. European series; No 91).
[2] Bhatia R., Lopipero P., Smith A.: (1998) Diesel exposure and
lung cancer. Epidemiology 9(1):84– 91.
[3] Black Carbon Pollution Emerges As Major Player In Global
Warming. Science Daily. Retrieved March 24, 2008, University
of California - San Diego (2008, March 24), from http://www.
sciencedaily.com-/releases/2008/03/080323210225.htm
[4] Brunekreef B., Janssen N.A.H., de Hartog J., Harssema H.,
Knape M., van Vliet P.: (1997) Air pollution from truck traffic
and lung function in children living near roadways. Epidemio-
logy 8:298–303.
[5] Buringh E., Fischer P., Hoek G.: (2000) Is SO2 a causative
factor for the PM-associated mortality risks in the Netherlands?
Inhalation Toxicol 12 (Suppl):55–60.
[6] Burnett R.T., et al.: Associations between short-term changes
in nitrogen dioxide and mortality in Canadian cities. Archives
of Environmental Health, 59: 228-236 (2004).
[7] Collins W.J., Derwent R.G., Johnson C.E., Stevenson D.S.: (2002)
The oxidation of organic compounds in the troposphere and their
global warming potentials, Climatic Change 52(4), 453-479.
[8] Denman K.L., et al. Couplings Between Changes in the Clima-
te System and Biogeochemis try, (2007), at 544. In: Working
Group I Summary.
[9] Deposition of Air Pollutants to the Great Waters, Third Report
to Congress, June 2000, EPA– 453/R–00–005.
[10] Derwent R.G., Collins W.J., Johnson C.E., Stevenson D.S.:
(2001) Transient behaviour of tropospheric ozone precursors
in a global 3-D CTM and their indirect greenhouse effects.
Climatic Change 49 (4), 463-487.
[11] Dockery D.W., Pope C.A., Xu X., et al.: (1993) An association
between air pollution and mortality in six U.S. cities. N Engl
J Med 329:1753–1759.
[12] Doney S.C., et al.: Impact of Anthropogenic Atmospheric
Nitrogen and Sulfur Deposition on Ocean Acidification and
the Inorganic Carbon System, (2007), PNAS Vol. 104:14580-
14585, at 14580.
[13] Effect of Carbon Monoxide On Exercise Performance In
Chronic Obstructive pulmonary Disease, Aronow, et. al., Am.
J. Med., 1977.
[14] Environmental Protection Agency, Air Quality Criteria for
Carbon Monoxide, Office of Research and Development,
Washington, D.C., June 2000b.
Paper reviewed
Global trends in motor vehicle pollution control: a 2011 update
117COMBUSTION ENGINES, No. 2/2011 (145)
[15] Ferris: Health Effects of Exposure To Low Levels of Regulated
Air Pollutants, A Critical Review, Journal of The Air Pollution
Control Association, May 1978.
[16] Flanner M.G., et al.: Present-Day Climate Forcing and Respon-
se from Black Carbon in Snow, 112 Journal of Geophysical
Research D1 1202 (2007) at 2.
[17] Hedley A.J., et al.: Cardiorespiratory and all-cause mortality
after restrictions on sulfur content of fuel in Hong Kong: an
intervention study. Lancet, 360: 1646-1652 (2002).
[18] Heinrich U., Fuhst R., Rittinghausen S., et al.: (1995) Chronic
inhalation exposure of Wistar rats and two different strains
of mice to diesel engine exhaust, carbon black, and titanium
dioxide. Inhal. Toxicol. 7:553–556.
[19] International Council on Clean Transportation (ICCT) (Mar.,
2007) Air Pollution and Greenhouse Gas Emissions from
Ocean-Going Ships: Impacts, Mitigation Options and Oppor-
tunities for Managing Growth at 34.
[20] IPCC, Aviation and the Global Atmosphere (1999) at Summary
for Policymakers.
[21] IPCC, Climate Change 2007: The Physical Science Basis,
Contribution of Working Group I to the Fourth Assessment
Report of the Intergovernmental Panel on Climate Change,
Forster, P., et al., Changes in Atmospheric Constituents and
in Radiative Forcing (2007) at 184-85.
[22] IPCC, Climate Change 2007: The Physical Science Basis,
Contribution of Working Group I to the Fourth Assessment
Report of the Intergovernmental Panel on Climate Change,
Trenberth, K.E, et al. Observations: Surface and Atmospheric
Climate Change (2007) at 237.
[23] IPCC, Climate Change 2007: The Physical Science Basis;
Contribution of Working Group I to the Fourth Assessment
Report of the Intergovernmental Panel on Climate Change
(Feb. 2007) at 186, [hereinafter Working Group I Report].
[24] IPCC, Summary For Policymakers: Climate Change 2007:
The Physical Science Basis; Contribution Of Working Group
I To The Fourth Assessment Report Of The Intergovernmental
Panel On Climate Change (Feb. 2007) at 5 [hereinafter Wor-
king Group I Summary].
[25] Ishinishi N., Kuwabara N., Takaki Y., et al.: (1988) Long-term
inhalation experiments on diesel exhaust. In: Diesel exhaust
and health risks. Results of the HERP studies. Ibaraki, Japan:
Research Committee for HERP Studies; pp. 11–84.
[26] Jacobson M.Z.: Control of Fossil-Fuel Particulate Black Car-
bon and Organic Matter, Possibly the Most Effective Method
of Slowing Global Warming, 107 Journal Of Geophysical
Research 4410 (2002) at 10.
[27] Kim J.J., Smorodinsky S., Lipsett M., Singer B.C., Hodgson
A.T., Ostro B.: (2004) Traffic-related air pollution near busy
roads: The East Bay children’s respiratory health study. Am.
J. Respir. Crit. Care Med. 170: 520–526.
[28] Krewski D., et al.: Reanalysis of the Harvard Six Cities Study and
the American Cancer Society Study of Particulate Air Pollution
and Mortality. Health Effects Institute Special Report, July 2000.
[29] Lipsett M., Campleman S.: (1999) Occupational exposure to
diesel exhaust and lung cancer: a meta- analysis. Am J Public
Health 80(7): 1009–1017.
[30] Mauderly J.L., Jones R.K., Griffith W.C., et al.:(1987) Diesel
exhaust is a pulmonary carcinogen in rats exposed chronically
by inhalation. Fundam. Appl. Toxicol. 9:208–221.
[31] Nikula K.J., Snipes M.B., Barr E.B., et al.: (1995) Compara-
tive pulmonary toxicities and carcinogenicities of chronically
inhaled diesel exhaust and carbon black in F344 rats. Fundam.
Appl. Toxicol. 25:80–94.
[32] Pope C.A., Thun M.J., Namboodiri M.M., Docery D.W., Evans
J.S., Speizer F.E., Heath C.W.: (1995) Particulate air pollution
as a predictor of mortality in a prospective study of U.S. adults.
Am J Respir Crit Care Med 151:669–674.
[33] Pope, C.A. et al. Lung cancer, cardiopulmonary mortality, and
long-term exposure to fine particulate air pollution. Journal of
the American Medical Association, 287: 1132–1141 (2002).
[34] Ramaswamy V., Boucher O., Haigh J., Hauglustaine D., Hay-
wood J., Myhre G., Nakajima T., Shi G.Y., Solomon S.: (2001)
Radiative Forcing of Climate Change. In: Climate Change
2001: The Scientific Basis. IPCC Special Report. Ch 6.
[35] Reddy M.S., Boucher O.: Climate Impact of Black Carbon
Emitted from Energy Consumption in the World’s Regions,
34 Geophysical Research Letters L1 1802 (2006) at 1.
[36] Riekider M., Cascio W.E., Griggs T.R., Herbst M.C., Bromberg
P.A., Neas L., Williams R.W., Devlin R.B.: (2003) Particulate Mat-
ter Exposures in Cars is Associated with Cardiovascular Effects in
Healthy Young Men. Am. J. Respir. Crit. Care Med. 169: 934–940.
[37] Special Report 18, Outdoor Air Pollution and Health in the
Developing Countries of Asia: A Comprehensive Review.
[38] U.S. EPA (2002) Health Assessment Document for Diesel
Engine Exhaust. EPA/600/8–90/057F Office of Research and
Development, Washington DC.
[39] U.S. EPA (2004) Air Quality Criteria for Particulate Matter
(Oct 2004), Volume I Document No. EPA600/P–99/002aF and
Volume II Document No. EPA600/P–99/002bF.
[40] U.S. EPA (2005) Review of the National Ambient Air Qu-
ality Standard for Particulate Matter: Policy Assessment of
Scientific and Technical Information, OAQPS Staff Paper.
EPA– 452/R–05–005.
[41] U.S. EPA (2006) Review of the National Ambient Air Quality
Standards for Ozone, Policy Assessment of Scientific and
Technical Information. OAQPS Staff Paper Second Draft.
EPA–452/D–05–002.
[42] U.S. EPA Air Quality Criteria for Ozone and Related Photo-
chemical Oxidants (Final). U.S. Environmental Protection
Agency, Washington, D.C., EPA 600/R–05/004aF–cF, 2006.
[43] Van Vliet P., Knape M., de Hartog J., Janssen N., Harssema
H., Brunekreef B.: (1997) Motor vehicle exhaust and chronic
respiratory symptoms in children living near freeways. Env.
Research 74: 122–132.
[44] WHO Air quality guidelines for particulate matter, ozone,
nitrogen dioxide and sulfur dioxide: Global update 2005,
Summary of risk assessment.
[45] Wichmann H.E., et al.: Daily mortality and fine and ultrafine
particles in Erfurt, Germany part 1: Role of particle number and
particle mass. Research Report 98. Cambridge, MA: Health
Effects Institute (2000).
[46] Wong C.M., et al.: A tale of two cities: effects of air pollution
on hospital admissions in Hong Kong and London compared.
Environmental health perspectives, 110: 67–77 (2002).
[47] World Business Council on Sustainable Development, Mo-
bility 2030: Meeting the Challenges to Sustainability, The
Sustainable Mobility Project, Full Report 2004.
[48] www.wmo.int/pages/mediacentre/press_releases/pr_903_
en.html
Michael Walsh – International Consultant, Board
Chairman, International Council on Clean Trans-
portation, USA.
Michael Walsh – międzynarodowy konsultant,
przewodniczący ICCT, USA.
e-mail: [email protected]
Global trends in motor vehicle pollution control: a 2011 update