Embed Size (px)
Citation preview
1
ORC TutorialR®
1
Micro-36 TutorialOpen Research Compiler (ORC): Proliferation of Technologies and
ToolsCo-organizers:
Roy Ju*, Pen-Chung Yew+, Ruiqi Lian**, Lixia Liu*, Tin-Fook Ngai*, Robert Cohn*, Costin Iancu++
*Intel Corp, **Chinese Academy of Science, +Univ. of Minnesota, ++ Lawrence Berkeley Lab
Presented at the 36th International Symposium on Microarchitecture(Micro-36)
San Diego, CADecember 1, 2003
ORC TutorialR®
2
Agenda
• Overview of ORC Features and ORC 2.1• Alias and Dependence Profiling and
Enabled Optimizations• Pin – Binary Instrumentation Tool• Speculative Parallel Threading• Unified Parallel C
2
ORC TutorialR®
3
Overview of ORC
ORC TutorialR®
4
ORC• Achieved objective: be a leading open source
IPF (IA-64) compiler to the research community• Initiated by Intel Microprocessor Research Labs
(MRL) in Q3 ‘00• Joint efforts between Intel MRL and Chinese
Academy of Sciences• To download at http://ipf-orc.sourceforge.net/• User community and support:
[email protected]@lists.sourceforge.net
* IPF for Itanium Processor Family in this presentation
3
ORC TutorialR®
5
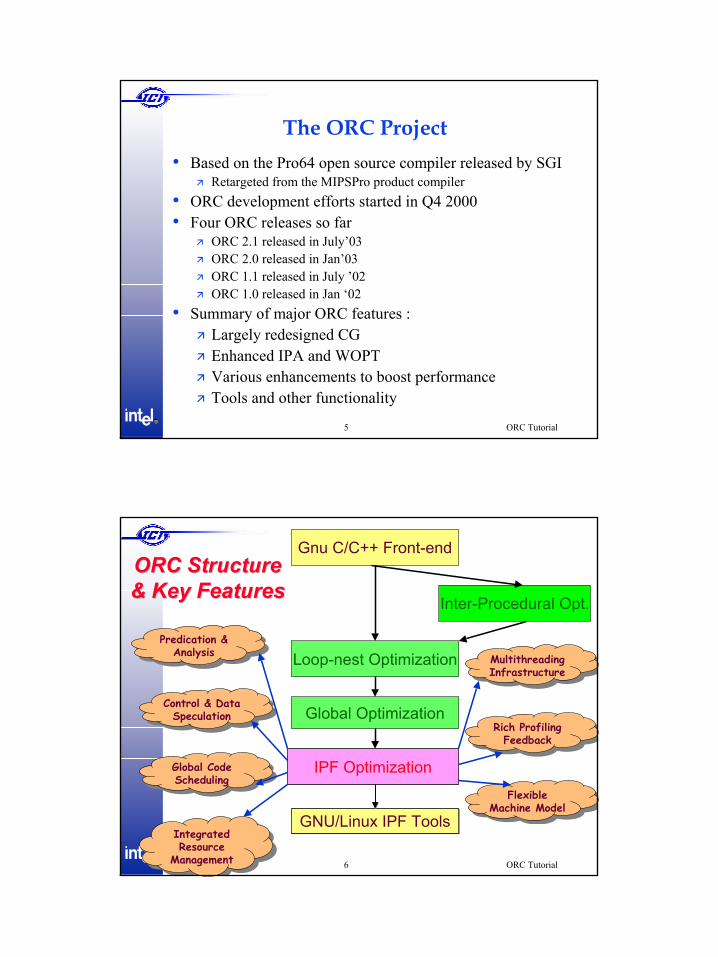
The ORC Project• Based on the Pro64 open source compiler released by SGI
Retargeted from the MIPSPro product compiler• ORC development efforts started in Q4 2000• Four ORC releases so far
ORC 2.1 released in July’03ORC 2.0 released in Jan’03ORC 1.1 released in July ’02ORC 1.0 released in Jan ‘02
• Summary of major ORC features :Largely redesigned CGEnhanced IPA and WOPTVarious enhancements to boost performanceTools and other functionality
ORC TutorialR®
6
Gnu C/C++ Front-end
Loop-nest Optimization
Inter-Procedural Opt.
Global Optimization
IPF Optimization
ORC Structure ORC Structure & Key Features& Key Features
GNU/Linux IPF ToolsGNU/Linux IPF Tools
Multithreading InfrastructureMultithreading Infrastructure
Rich ProfilingFeedback
Rich ProfilingFeedback
Flexible Machine Model
Flexible Machine Model
Predication & Analysis
Predication & Analysis
Control & Data Speculation
Control & Data Speculation
Global CodeScheduling
Global CodeScheduling
Integrated Resource
Management
Integrated Resource
Management
4
ORC TutorialR®
7
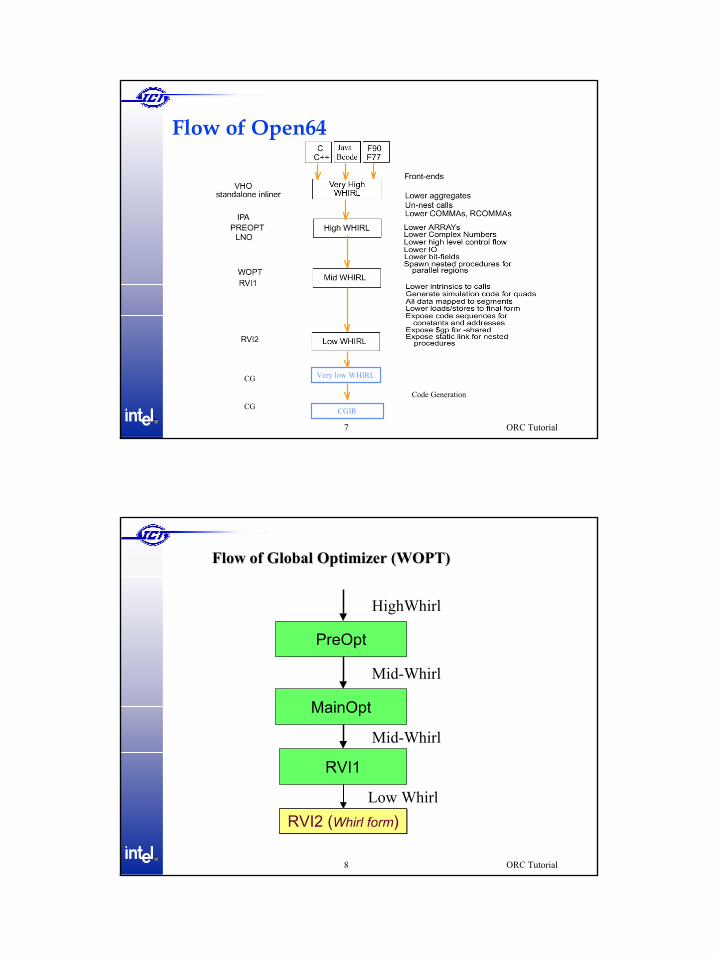
Flow of Open64
Very low WHIRLCG
CGIRCGCode Generation
ORC TutorialR®
8
PreOpt
MainOpt
RVI1
RVI2 (Whirl form)RVI2 (Whirl form)
HighWhirl
Mid-Whirl
Low Whirl
Flow of Global Optimizer (WOPT)Flow of Global Optimizer (WOPT)
Mid-Whirl
5
ORC TutorialR®
9
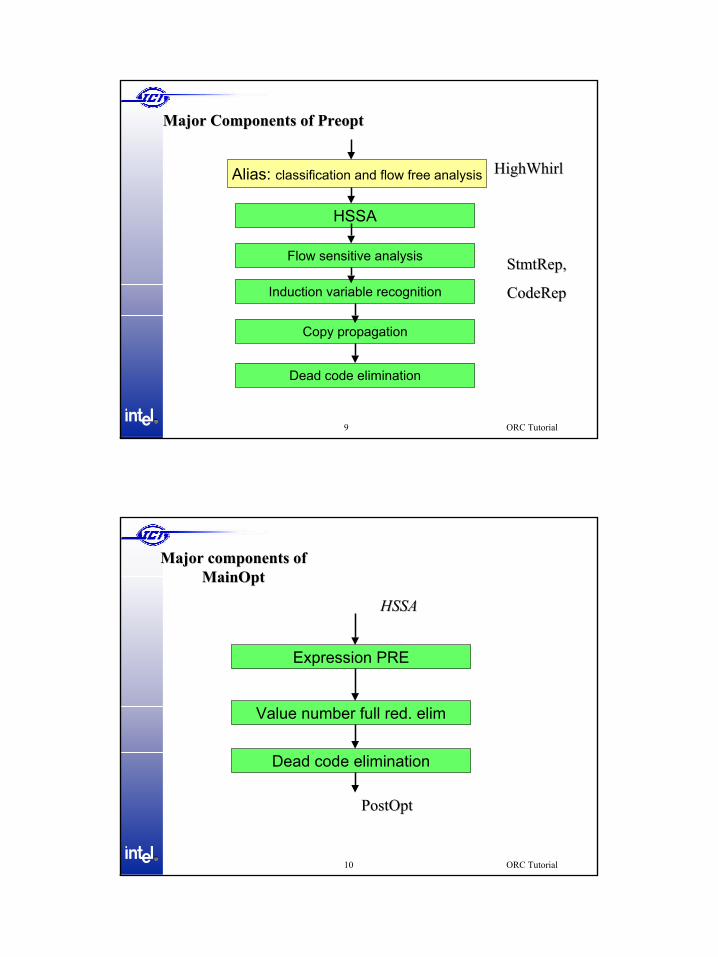
Alias: classification and flow free analysis
Major Components of Major Components of PreoptPreopt
Flow sensitive analysis
HSSA
Induction variable recognition
Copy propagation
Dead code elimination
HighWhirlHighWhirl
StmtRepStmtRep, ,
CodeRepCodeRep
ORC TutorialR®
10
Major components of Major components of MainOptMainOpt
Value number full red. elim
Dead code elimination
Expression PRE
HSSAHSSA
PostOptPostOpt
6
ORC TutorialR®
11
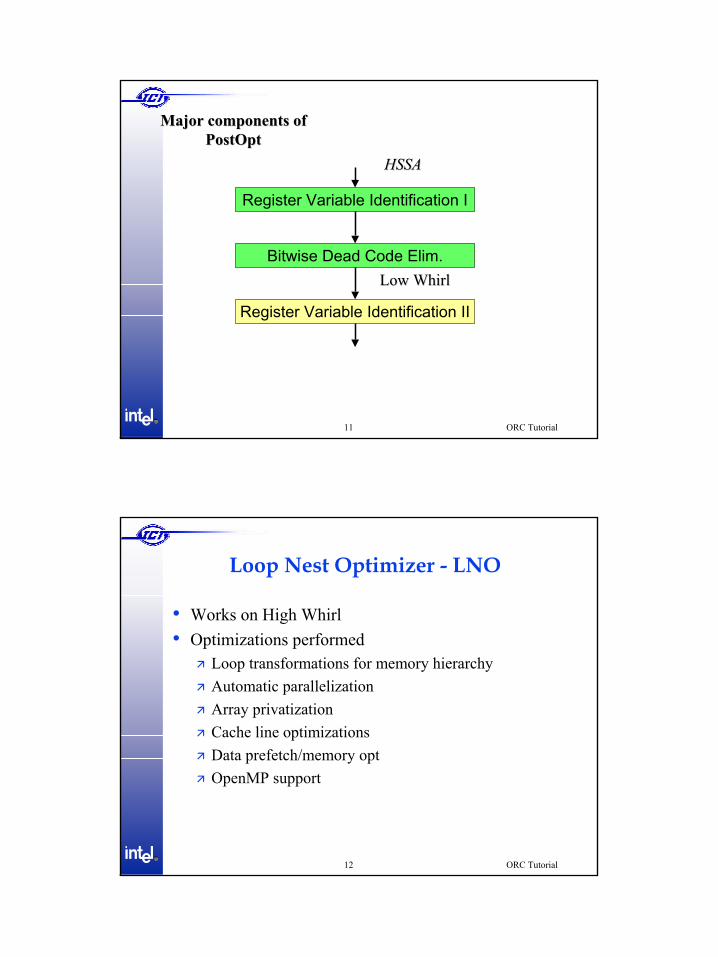
Major components of Major components of PostOptPostOpt
Register Variable Identification II
Register Variable Identification I
Bitwise Dead Code Elim.
HSSAHSSA
Low WhirlLow Whirl
ORC TutorialR®
12
Loop Nest Optimizer - LNO
• Works on High Whirl• Optimizations performed
Loop transformations for memory hierarchyAutomatic parallelizationArray privatizationCache line optimizationsData prefetch/memory optOpenMP support
7
ORC TutorialR®
13
Loop Nest Optimization
• Assumes “preopt” to normalize loops and code preparation
• Fast and efficient array data dependency analysis• Based on unimodular transformations• Passes array dependency information to code
generation phase through “MAP”
ORC TutorialR®
14
IPA - Analysis
• Build combined global symbol and type table• Build call graph• Dead function elimination• Global symbol attribute analysis• Array padding/splitting analysis• Inline cost analysis and decision heuristics• Jump function data flow solver• Array sectioning data flow solver
8
ORC TutorialR®
15
IPA - Optimizations
• Perform transformation based onInfo collected during analysis• Data promotion• Constant propagation• Indirect call to direct call• Assigned once globals
Decisions made during analysis• Inlining• Common padding and splitting
ORC TutorialR®
16
Code Generation• Has been a major focus in ORC and has been largely
redesigned from Open64• Research infrastructure features:
Region-based compilationRich profiling supportParameterized machine descriptions
• IPF optimizations:If-conversion and predicate analysisControl and data speculation with recovery code generationGlobal instruction scheduling with resource management
• Other enhancements
9
ORC TutorialR®
17
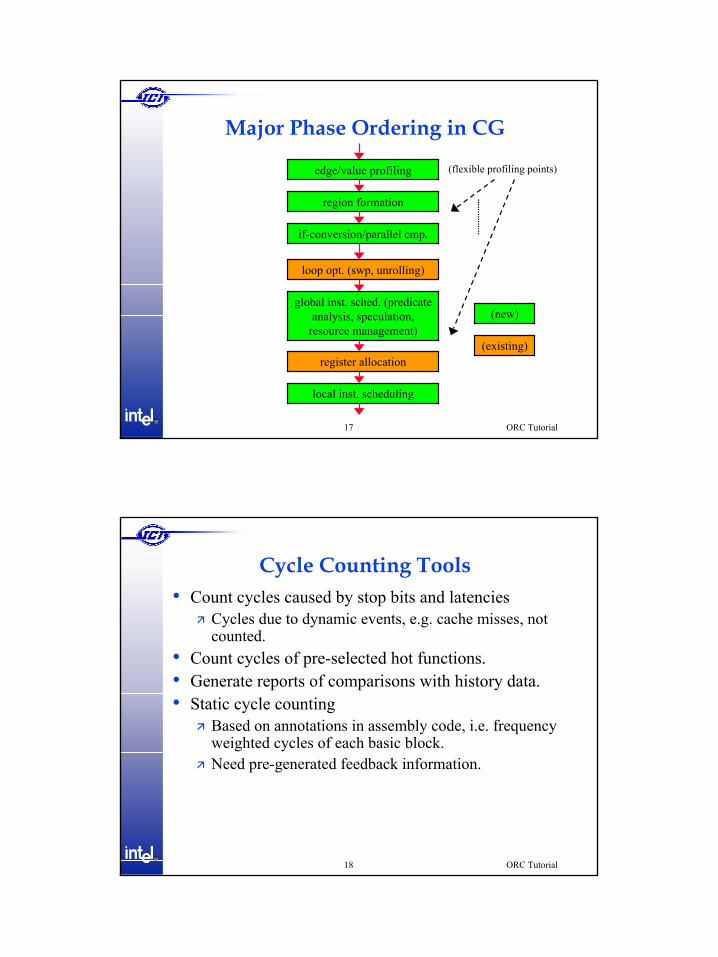
Major Phase Ordering in CG
edge/value profiling
region formation
if-conversion/parallel cmp.
loop opt. (swp, unrolling)
global inst. sched. (predicate analysis, speculation,
resource management)
register allocation
local inst. scheduling
(new)
(existing)
(flexible profiling points)
ORC TutorialR®
18
Cycle Counting Tools• Count cycles caused by stop bits and latencies
Cycles due to dynamic events, e.g. cache misses, not counted.
• Count cycles of pre-selected hot functions.• Generate reports of comparisons with history data.• Static cycle counting
Based on annotations in assembly code, i.e. frequency weighted cycles of each basic block.Need pre-generated feedback information.
10
ORC TutorialR®
19
Hot Path Enumeration Tool – hpe.pl
• Motivation:Analyzing assembly code of large PUs is tedious.Focusing on hot paths only is more effective.
• Uses of the tool:Find performance hot spots / defects.Comparison between different compilers.Comparison between different versions of same compiler.
ORC TutorialR®
20
ORC 2.1 Features
• Focusing on Itanium2-specific optimizations• Tuning existing optimizations for Itanium2• Inter-procedural allocation stacked registers
Published at ICS ’03• Pin – an IPF binary instrumentation tool
11
ORC TutorialR®
21
Itanium2 Optimizations
• More resources and more flexible dispersal rule• Shorter latency and smaller penalty • Cache optimization
Bank ConflictCache Line ConflictPrefetch distance
• Single Cycle LoopUnrolling
• Speculation of predicated chk
ORC TutorialR®
22
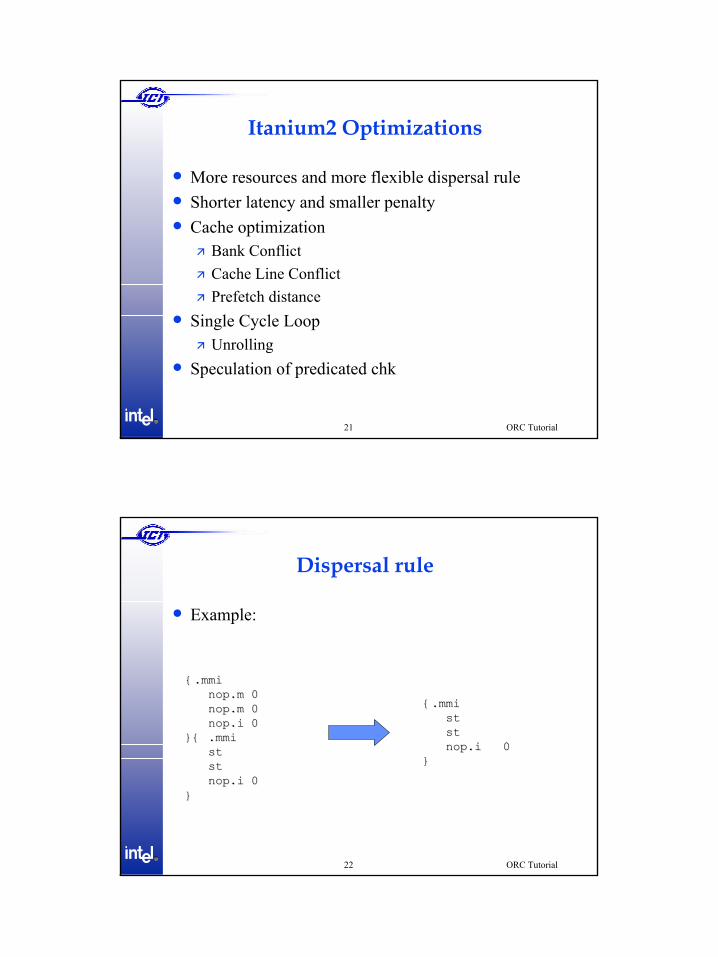
Dispersal rule
• Example:
{.{.mmimminopnop.m 0.m 0nopnop.m 0.m 0nopnop.i 0 .i 0
}{ .}{ .mmi mmi ststststnopnop.i 0.i 0
}}
{.{.mmi mmi ststststnopnop.i 0.i 0
}}
12
ORC TutorialR®
23
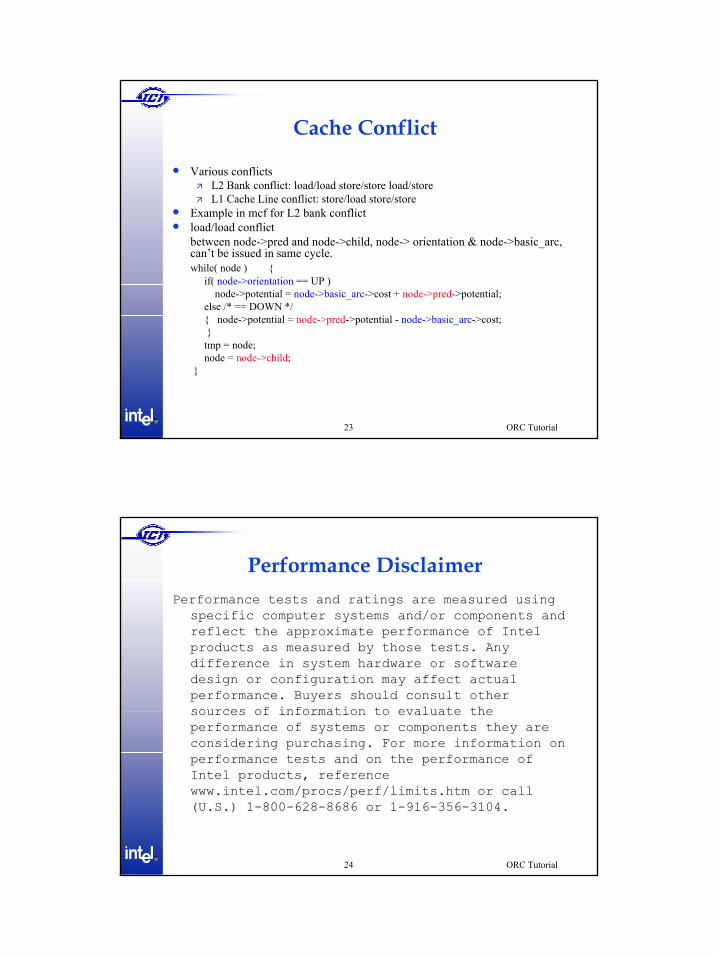
Cache Conflict
• Various conflictsL2 Bank conflict: load/load store/store load/storeL1 Cache Line conflict: store/load store/store
• Example in mcf for L2 bank conflict• load/load conflict
between node->pred and node->child, node-> orientation & node->basic_arc, can’t be issued in same cycle.while( node ) {
if( node->orientation == UP )node->potential = node->basic_arc->cost + node->pred->potential;
else /* == DOWN */{ node->potential = node->pred->potential - node->basic_arc->cost;}tmp = node;node = node->child;
}
ORC TutorialR®
24
Performance DisclaimerPerformance tests and ratings are measured using
specific computer systems and/or components and reflect the approximate performance of Intel products as measured by those tests. Any difference in system hardware or software design or configuration may affect actual performance. Buyers should consult other sources of information to evaluate the performance of systems or components they are considering purchasing. For more information on performance tests and on the performance of Intel products, reference www.intel.com/procs/perf/limits.htm or call (U.S.) 1-800-628-8686 or 1-916-356-3104.
13
ORC TutorialR®
25
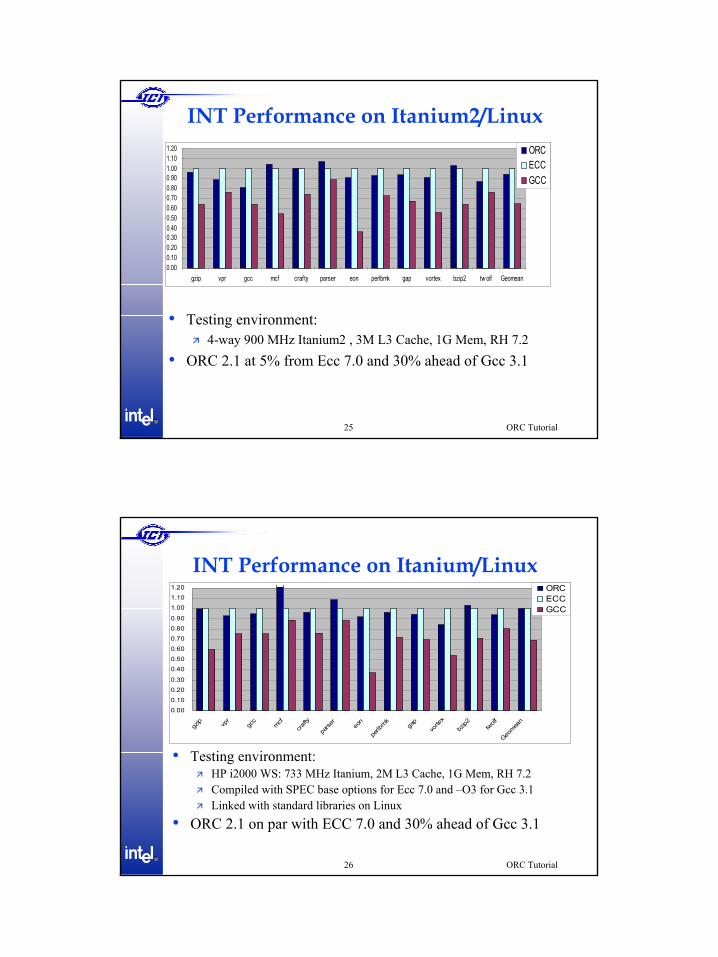
INT Performance on Itanium2/Linux
• Testing environment:4-way 900 MHz Itanium2 , 3M L3 Cache, 1G Mem, RH 7.2
• ORC 2.1 at 5% from Ecc 7.0 and 30% ahead of Gcc 3.1
0.000.100.200.300.400.500.600.700.800.901.001.101.20
gzip vpr gcc mcf crafty parser eon perlbmk gap vortex bzip2 tw olf Geomean
ORCECCGCC
ORC TutorialR®
26
INT Performance on Itanium/Linux
• Testing environment:HP i2000 WS: 733 MHz Itanium, 2M L3 Cache, 1G Mem, RH 7.2Compiled with SPEC base options for Ecc 7.0 and –O3 for Gcc 3.1Linked with standard libraries on Linux
• ORC 2.1 on par with ECC 7.0 and 30% ahead of Gcc 3.1
0.000.100.200.30
0.400.500.600.700.800.90
1.001.101.20
gzip vp
rgc
cmcf
crafty
parse
reo
n
perlb
mkga
pvo
rtex
bzip2 tw
olf
Geomea
n
ORCECCGCC
14
ORC TutorialR®
27
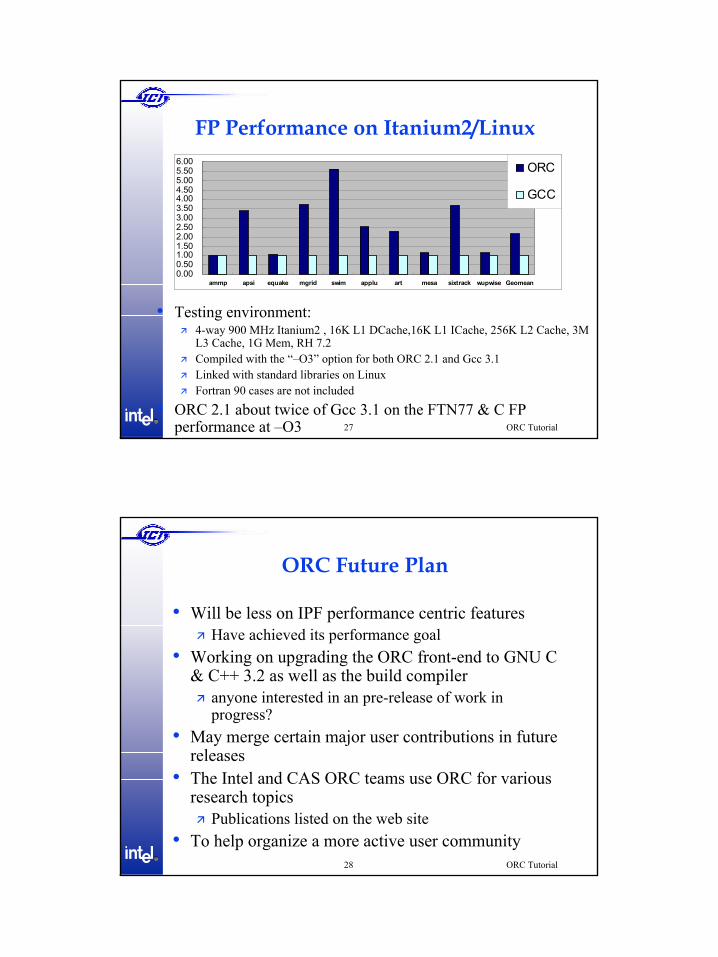
FP Performance on Itanium2/Linux
• Testing environment:4-way 900 MHz Itanium2 , 16K L1 DCache,16K L1 ICache, 256K L2 Cache, 3M L3 Cache, 1G Mem, RH 7.2Compiled with the “–O3” option for both ORC 2.1 and Gcc 3.1Linked with standard libraries on LinuxFortran 90 cases are not included
• ORC 2.1 about twice of Gcc 3.1 on the FTN77 & C FP performance at –O3
0.000.501.001.502.002.503.003.504.004.505.005.506.00
ammp apsi equake mgrid swim applu art mesa sixtrack wupwise Geomean
ORC
GCC
ORC TutorialR®
28
ORC Future Plan
• Will be less on IPF performance centric featuresHave achieved its performance goal
• Working on upgrading the ORC front-end to GNU C & C++ 3.2 as well as the build compiler
anyone interested in an pre-release of work in progress?
• May merge certain major user contributions in future releases
• The Intel and CAS ORC teams use ORC for various research topics
Publications listed on the web site• To help organize a more active user community
15
ORC TutorialR®
29
Open64/ORC User Activities
• > 4000 downloads since ORC 1.0• A worldwide Open64/ORC user community• Adopted by many academic research groups worldwide
Visible in publications• Regular tutorials & user forums
Micro34, PLDI02, PACT02, Micro35, CGO03, Micro36• Prof. G. Gao organizing another user forum in ’04• Looking for funding to better organize the community
and establish the mechanism to coordinate contributions
1
1
Alias and Data Dependence Profiling
Pen-Chung YewDepartment of Computer Science and
EngineeringUniversity of Minnesota
2
Outline
• Instrumentation-based alias profiling• Instrumentation-based data dependence profiling• Techniques to reduce profiling overhead• Data speculation using profiling information• Summary
2
3
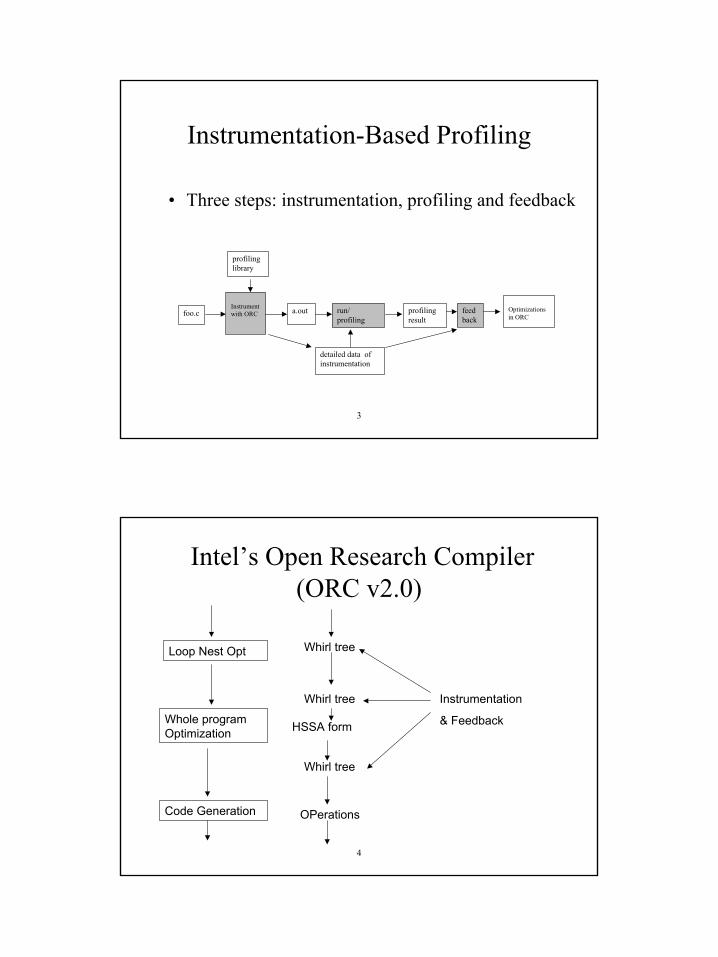
Instrumentation-Based Profiling
Instrument with ORC
foo.c a.out profiling result
profiling library
Optimizations in ORC
run/ profiling
feedback
detailed data of instrumentation
• Three steps: instrumentation, profiling and feedback
4
Intel’s Open Research Compiler (ORC v2.0)
Loop Nest Opt
Whole program Optimization
Code Generation
Whirl tree
HSSA form
Whirl tree
OPerations
Whirl tree Instrumentation
& Feedback
3
5
Alias Profiling
• Target set for indirect references– variables or heap blocks
• Read/write set for function calls• Additional information about a target
– Probability: (# occurrences of a target)/(# occurrences of this reference)
– Field tag– Calling context
6
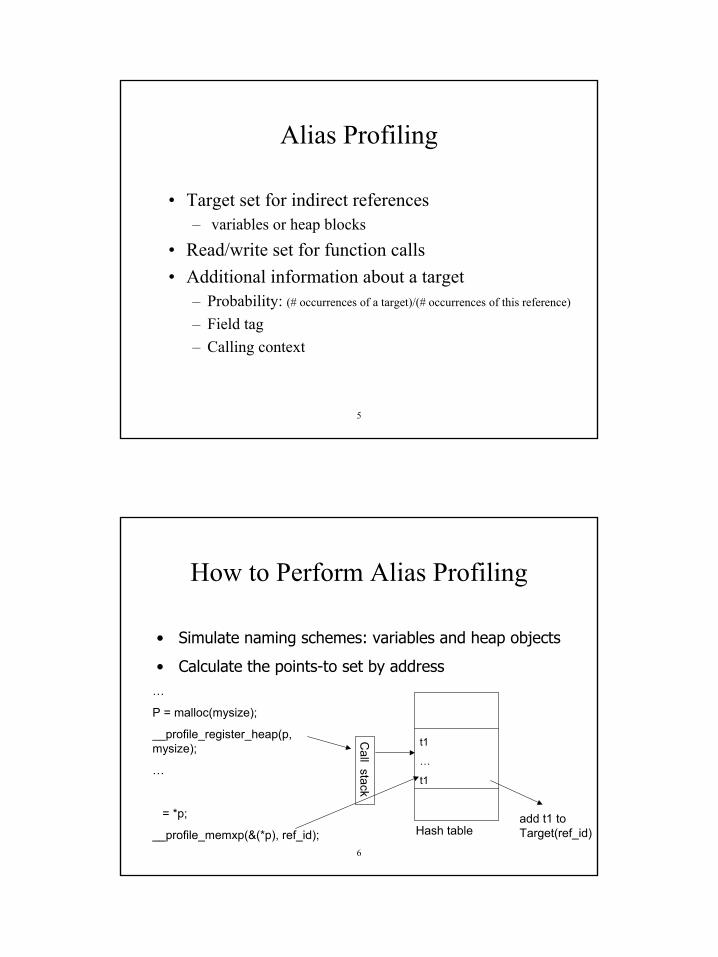
How to Perform Alias Profiling
…
P = malloc(mysize);
__profile_register_heap(p, mysize);
…
= *p;
__profile_memxp(&(*p), ref_id); Hash tableadd t1 to Target(ref_id)
Call stack
t1
…
t1
• Simulate naming schemes: variables and heap objects
• Calculate the points-to set by address
4
7
Feedback of Alias Profiling
• Whirl nodes are mapped back by the traversal order of procedure body
• Variables are also mapped back by the traversal order of symbol table
• Target sets of references are recorded with references
8
Determine Aliases Using Profile
• Alias relation based on profile can be determined by checking the intersection of the target sets – un-reached references: unknown – Further infer the probabilitytarget (ref) = {(vi, pi), i= 0, n}, where vi is the variable and pi is its
probabilityIs_Aliased_by_Profile(ref1, ref2) =
min (sum_p (ref1, ref2), sum_p(ref2, ref1));sum_p (ref1, ref2) =
∑pi, where, (vi, pi) ∈ target(ref1) and (vi, x) ∈ target(ref2)
5
9
Example of Feedback
Assume:two references, WN *ref1, *ref2Target(ref1) = {(a, 10%), (b, 80%), (c, 10%)}Target(ref2) = {(b, 20%), (c, 20%), (d, 60%)}
Result:sump(ref1, ref2) = 80%+10% = 90%sum_p(ref2, ref1) = 20%+20% = 40% Is_Alias_by_Profile(ref1, ref2) = 40%
10
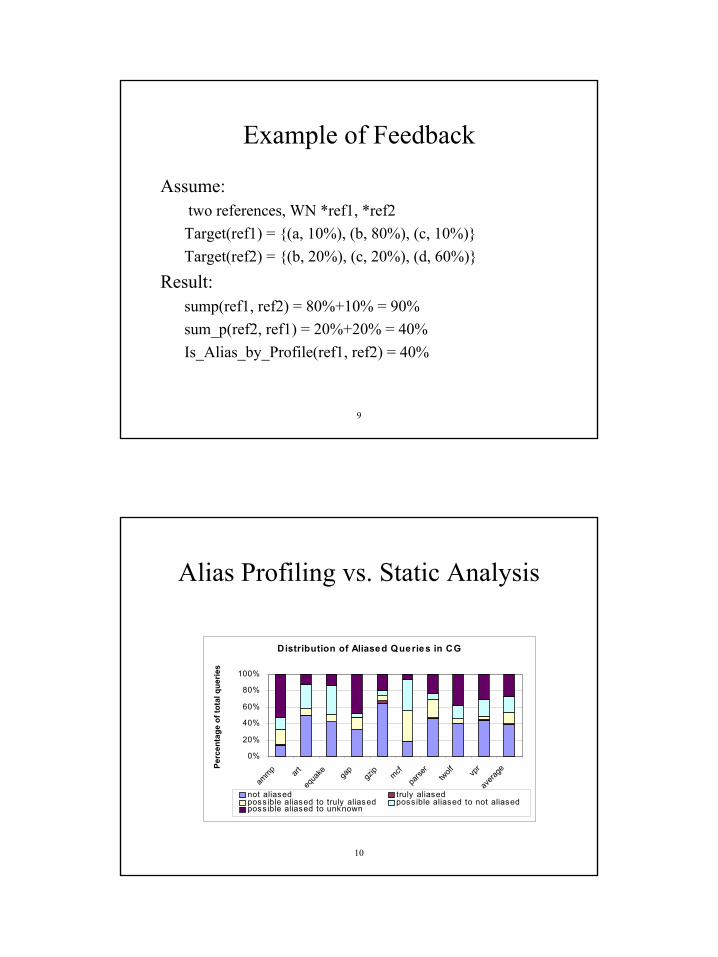
Alias Profiling vs. Static Analysis
Distribution of Aliased Queries in CG
0%
20%
40%
60%
80%
100%
ammp art
equa
ke gap
gzip mcf
parse
rtw
olf vpr
avera
ge
Perc
enta
ge o
f tot
al q
uerie
s
not aliased truly aliasedposs ible aliased to truly aliased poss ible aliased to not aliasedposs ible aliased to unknown
6
11
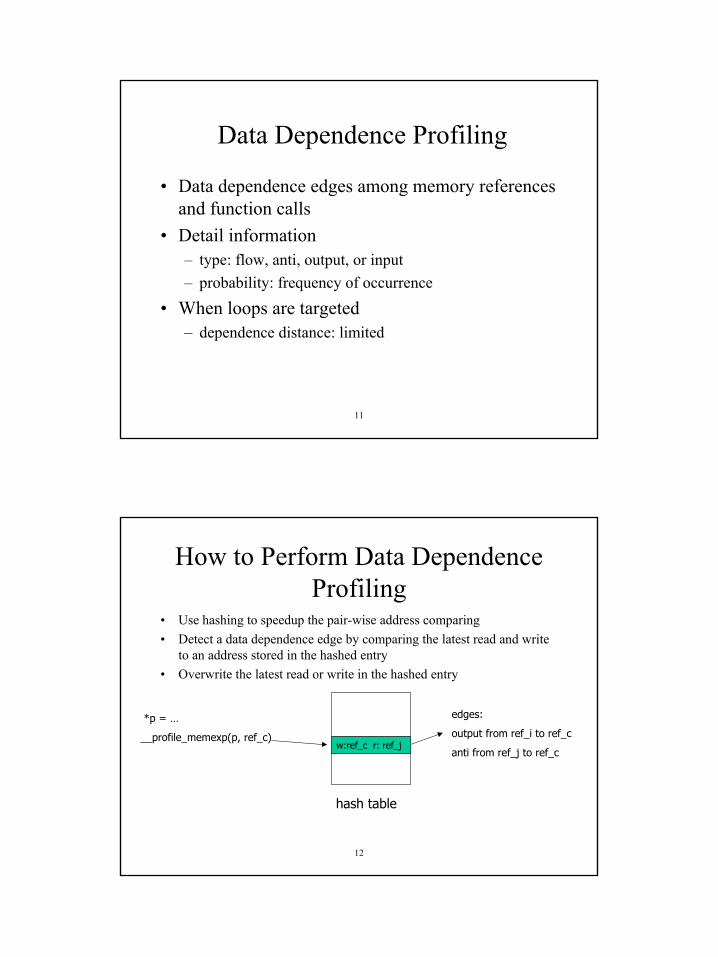
Data Dependence Profiling
• Data dependence edges among memory references and function calls
• Detail information– type: flow, anti, output, or input– probability: frequency of occurrence
• When loops are targeted– dependence distance: limited
12
How to Perform Data Dependence Profiling
• Use hashing to speedup the pair-wise address comparing• Detect a data dependence edge by comparing the latest read and write
to an address stored in the hashed entry• Overwrite the latest read or write in the hashed entry
*p = …
__profile_memexp(p, ref_c) w:ref_i r:ref_j
edges:
output from ref_i to ref_c
anti from ref_j to ref_cw:ref_c r: ref_j
hash table
7
13
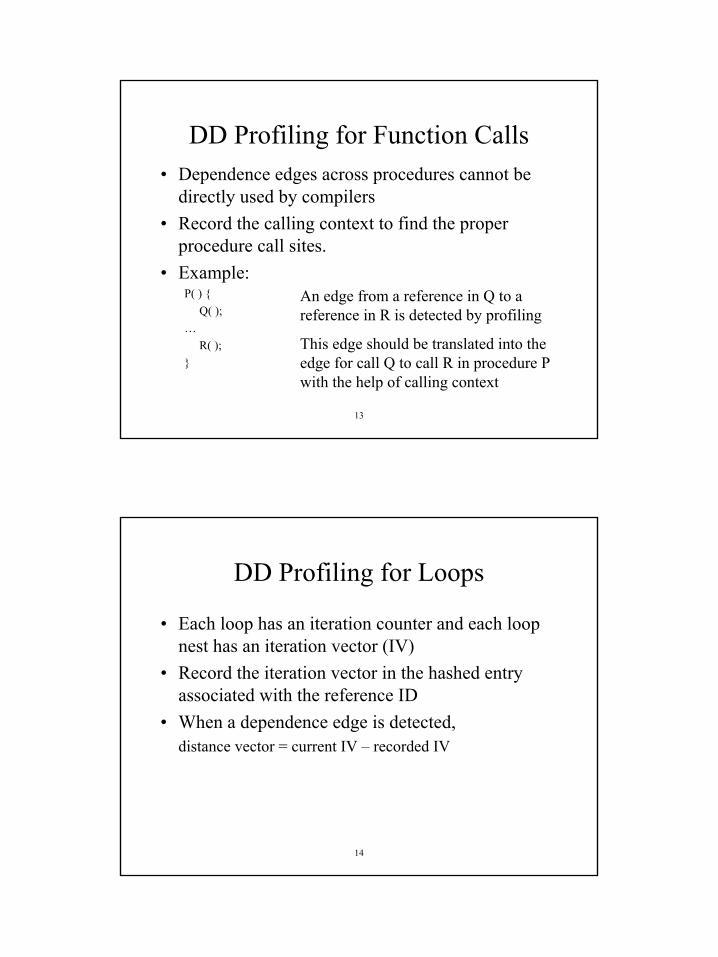
DD Profiling for Function Calls• Dependence edges across procedures cannot be
directly used by compilers• Record the calling context to find the proper
procedure call sites. • Example:
P( ) {Q( );
…R( );
}
An edge from a reference in Q to a reference in R is detected by profiling
This edge should be translated into the edge for call Q to call R in procedure P with the help of calling context
14
DD Profiling for Loops
• Each loop has an iteration counter and each loop nest has an iteration vector (IV)
• Record the iteration vector in the hashed entry associated with the reference ID
• When a dependence edge is detected, distance vector = current IV – recorded IV
8
15
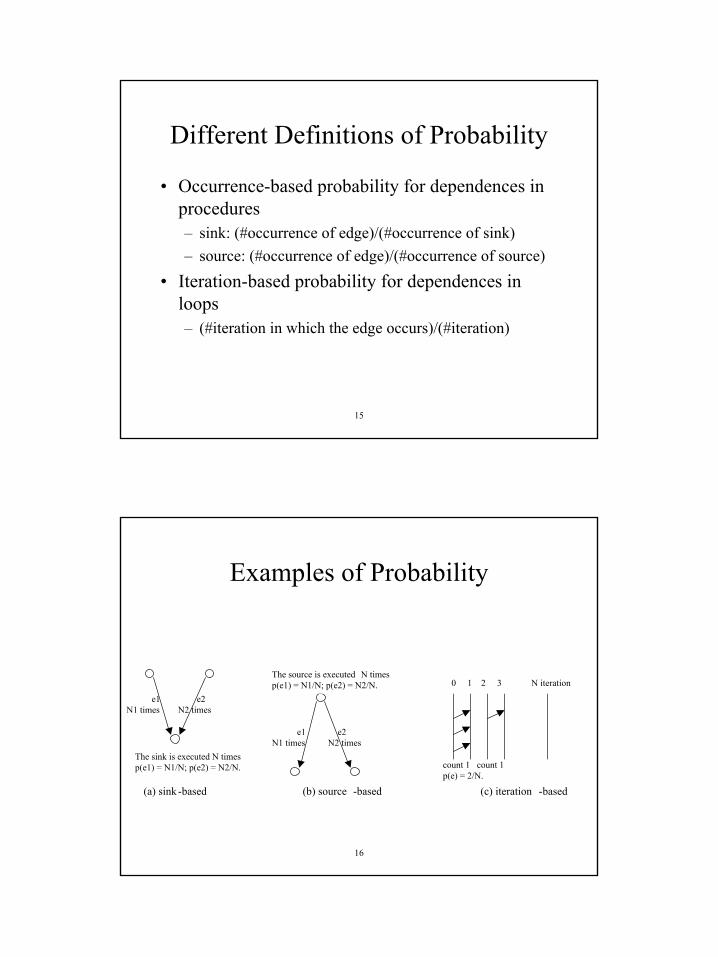
Different Definitions of Probability
• Occurrence-based probability for dependences in procedures– sink: (#occurrence of edge)/(#occurrence of sink)– source: (#occurrence of edge)/(#occurrence of source)
• Iteration-based probability for dependences in loops– (#iteration in which the edge occurs)/(#iteration)
16
Examples of Probability
e1 e2 N1 times N2 times
e1 e2 N1 times N2 times
The sink is executed N times p(e1) = N1/N; p(e2) = N2/N.
The source is executed N times p(e1) = N1/N; p(e2) = N2/N.
count 1 count 1 p(e) = 2/N.
0 1 2 3 N iteration
(a) sink -based (b) source -based (c) iteration -based
9
17
Alias Profiling vs. DD Profiling
• Output: points-to set vs. dependence edges• Representation: location factor SSA-form vs.
dependence graph or statement factor SSA-form• Precision: name based vs. address based• Maintenance: easy vs. difficult• Complexity: linear vs. square
18
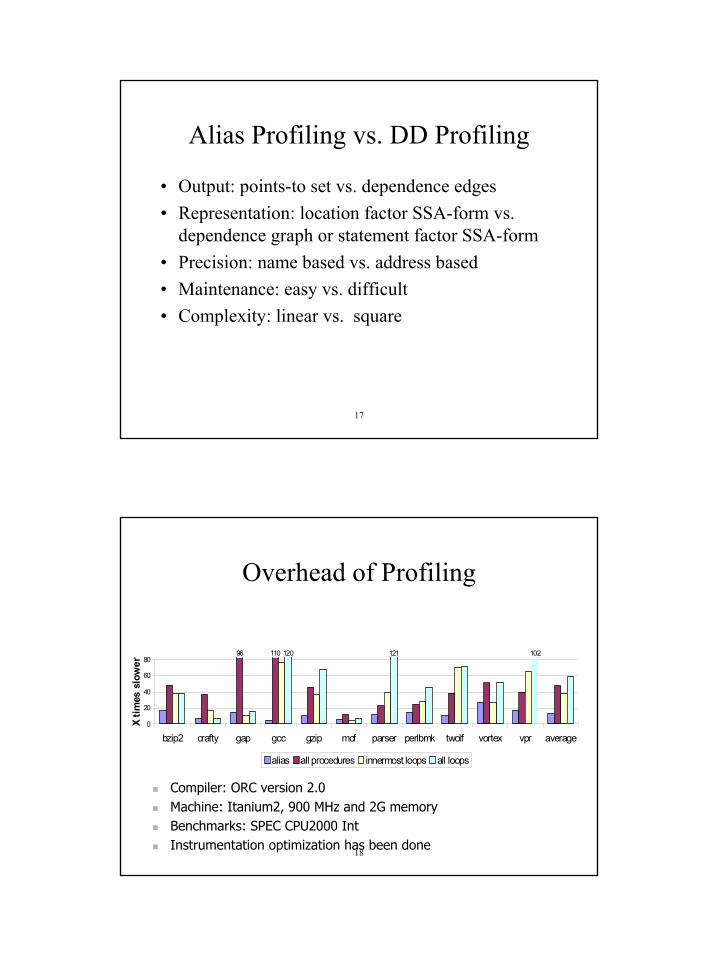
Overhead of Profiling
96 110 102121120
0
20
40
60
80
bzip2 crafty gap gcc gzip mcf parser perlbmk twolf vortex vpr average
X tim
es s
low
er
alias all procedures innermost loops all loops
Compiler: ORC version 2.0Machine: Itanium2, 900 MHz and 2G memoryBenchmarks: SPEC CPU2000 IntInstrumentation optimization has been done
10
19
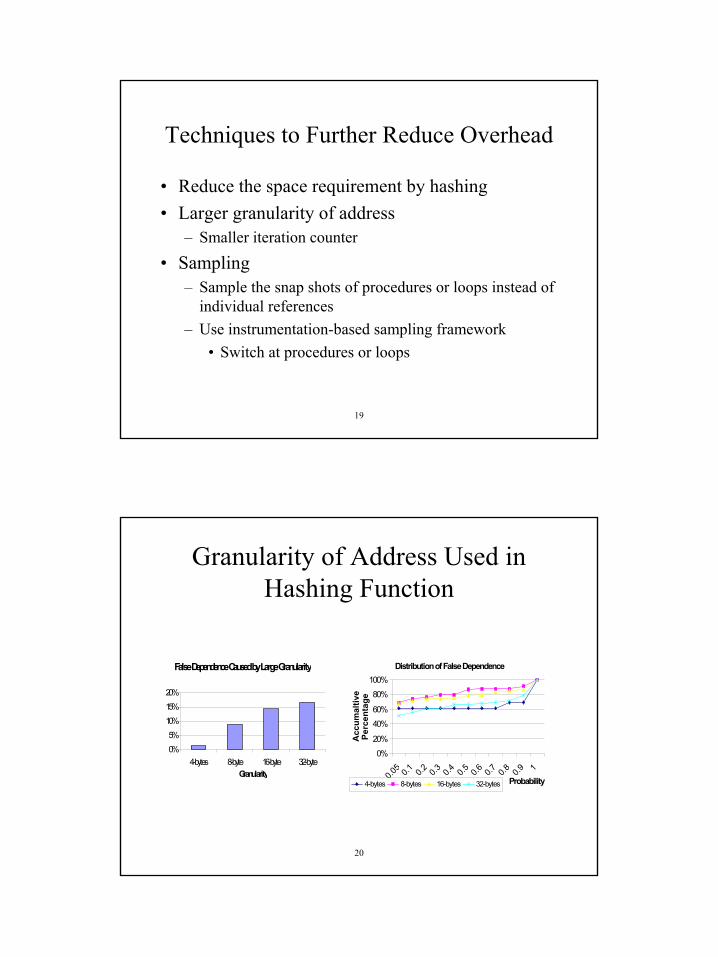
Techniques to Further Reduce Overhead
• Reduce the space requirement by hashing• Larger granularity of address
– Smaller iteration counter
• Sampling– Sample the snap shots of procedures or loops instead of
individual references– Use instrumentation-based sampling framework
• Switch at procedures or loops
20
Granularity of Address Used in Hashing Function
False Dependence Caused by Large Granularity
0%5%
10%15%20%
4-bytes 8-byte 16-byte 32-byteGranularity
Distribution of False Dependence
0%20%
40%60%
80%100%
0.05 0.1 0.2 0.3 0.4 0.5 0.6 0.7 0.8 0.9 1
Probability
Acc
umal
tive
Perc
enta
ge
4-bytes 8-bytes 16-bytes 32-bytes
11
21
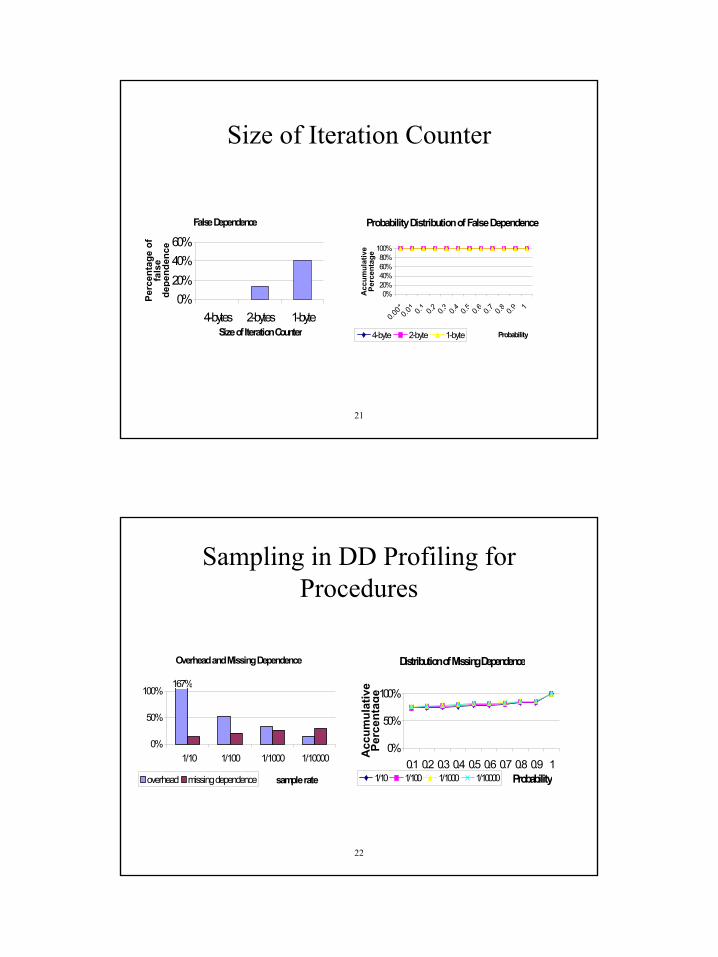
Size of Iteration Counter
False Dependence
0%20%40%60%
4-bytes 2-bytes 1-byteSize of Iteration Counter
Perc
enta
ge o
f fa
lse
depe
nden
ce
Probability Distribution of False Dependence
0%20%40%60%80%
100%
0.0010.0
1 0.1 0.2 0.3 0.4 0.5 0.6 0.7 0.8 0.9 1
Probability
Acc
umul
ativ
e Pe
rcen
tage
4-byte 2-byte 1-byte
22
Sampling in DD Profiling for Procedures
Overhead and Missing Dependence
167%
0%
50%
100%
1/10 1/100 1/1000 1/10000
sample rateoverhead missing dependence
Distribution of Missing Dependence
0%
50%
100%
0.1 0.2 0.3 0.4 0.5 0.6 0.7 0.8 0.9 1Probability
Acc
umul
ativ
e Pe
rcen
tage
1/10 1/100 1/1000 1/10000
12
23
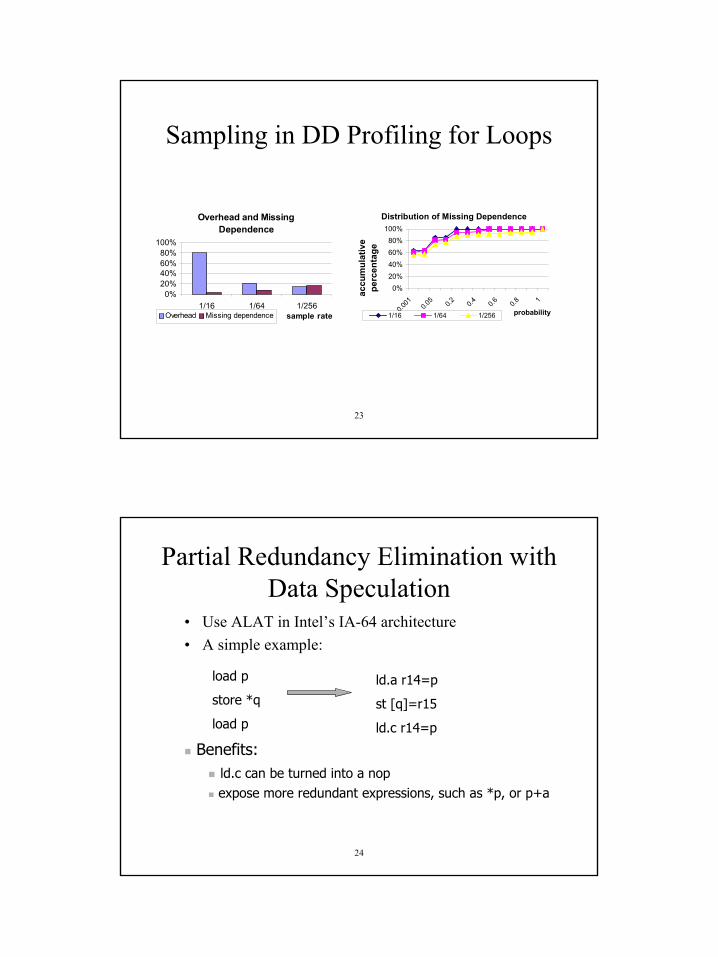
Sampling in DD Profiling for Loops
Overhead and Missing Dependence
0%20%40%60%80%
100%
1/16 1/64 1/256sample rateOverhead Missing dependence
Distribution of Missing Dependence
0%20%40%60%80%
100%
0.001 0.0
5 0.2 0.4 0.6 0.8 1
probability
accu
mul
ativ
e pe
rcen
tage
1/16 1/64 1/256
24
Partial Redundancy Elimination with Data Speculation
• Use ALAT in Intel’s IA-64 architecture• A simple example:
load p
store *q
load p
ld.a r14=p
st [q]=r15
ld.c r14=p
Benefits:ld.c can be turned into a nopexpose more redundant expressions, such as *p, or p+a
13
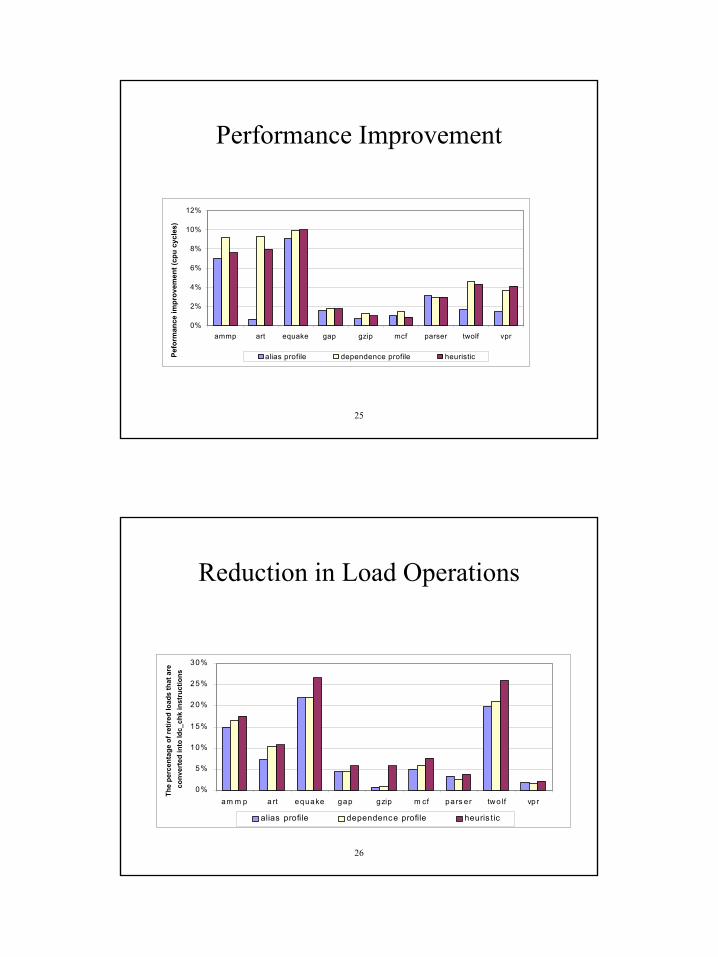
25
Performance Improvement
0%
2%
4%
6%
8%
10%
12%
ammp art equake gap gzip mcf parser twolf vpr
Pefo
rman
ce im
prov
emen
t (cp
u cy
cles
)
alias profile dependence profile heuristic
26
Reduction in Load Operations
0%
5%
10%
15%
20%
25%
30%
am m p art equake gap gzip m cf pars er tw o lf vpr
The
perc
enta
ge o
f ret
ired
load
s th
at a
re
conv
erte
d in
to ld
c_ch
k in
stru
ctio
ns
alias profile dependence profile heuris tic
14
27
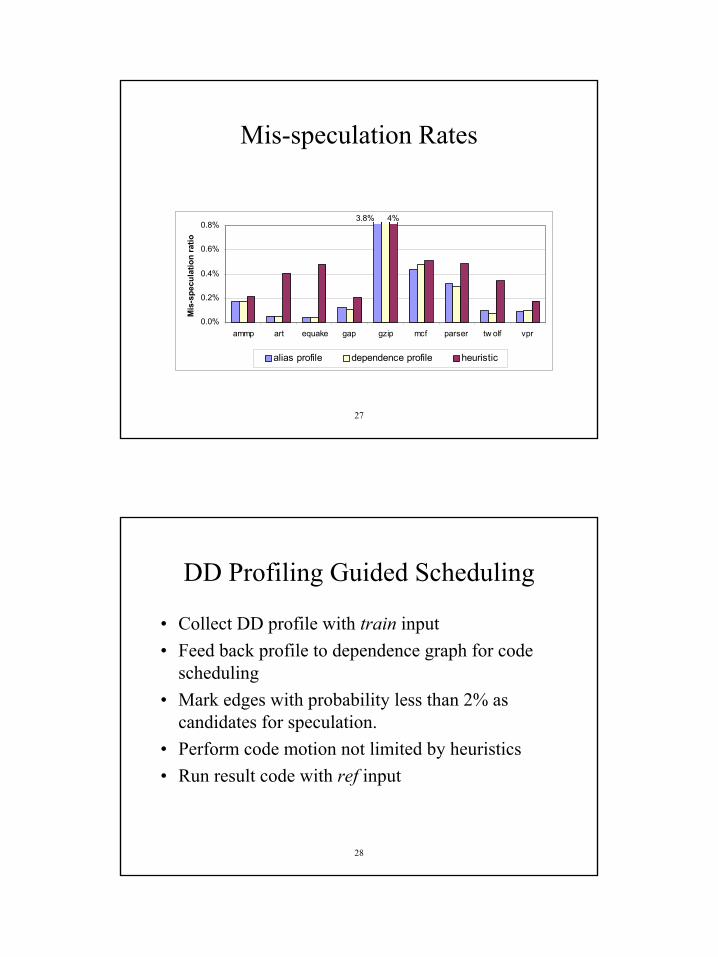
Mis-speculation Rates
3.8% 4%
0.0%
0.2%
0.4%
0.6%
0.8%
ammp art equake gap gzip mcf parser tw olf vpr
Mis
-spe
cula
tion
ratio
alias profile dependence profile heuristic
28
DD Profiling Guided Scheduling
• Collect DD profile with train input• Feed back profile to dependence graph for code
scheduling• Mark edges with probability less than 2% as
candidates for speculation.• Perform code motion not limited by heuristics• Run result code with ref input
15
29
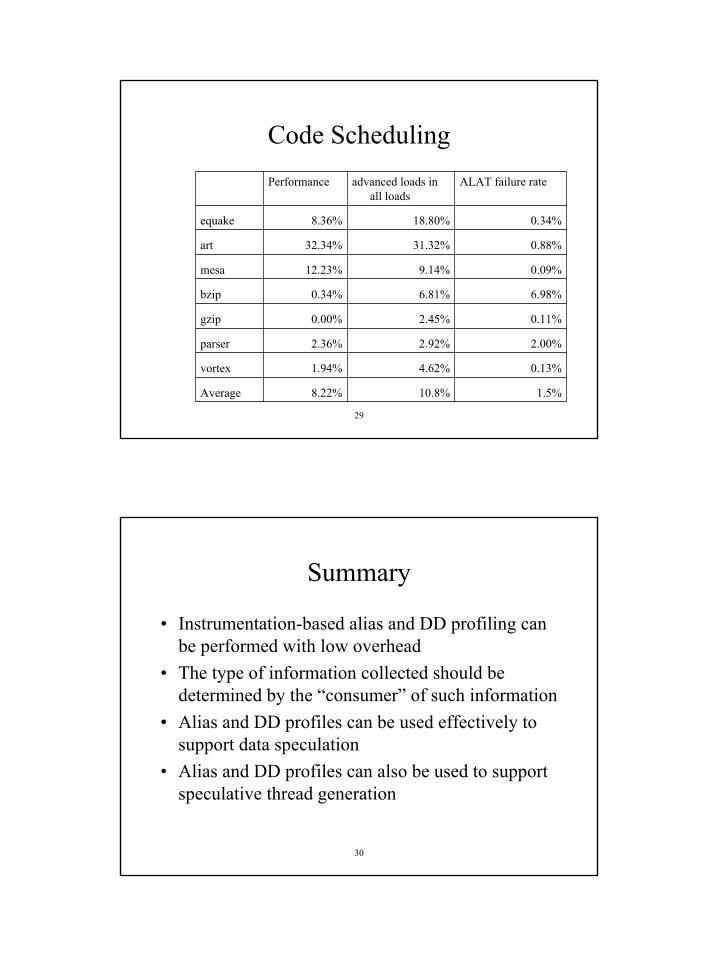
Code Scheduling
1.5%10.8%8.22%Average
0.13%4.62%1.94%vortex
2.00%2.92%2.36%parser
0.11%2.45%0.00%gzip
6.98%6.81%0.34%bzip
0.09%9.14%12.23%mesa
0.88%31.32%32.34%art
0.34%18.80%8.36%equake
ALAT failure rateadvanced loads in all loads
Performance
30
Summary
• Instrumentation-based alias and DD profiling can be performed with low overhead
• The type of information collected should be determined by the “consumer” of such information
• Alias and DD profiles can be used effectively to support data speculation
• Alias and DD profiles can also be used to support speculative thread generation
1
1
Instrumentation of IPF/Linux Programs with Pin
http://www.intel.com/software/products/opensource/tools1/inst/
Robert CohnMMDC
Intel
2
What Does Pin Stand For?
• Pin Is Not an acronym• Pin is based on the post link optimizer
spike– Use dynamic code generation to make a less
intrusive profile guided optimization and instrumentation system
– Pin is a small spike
2
3
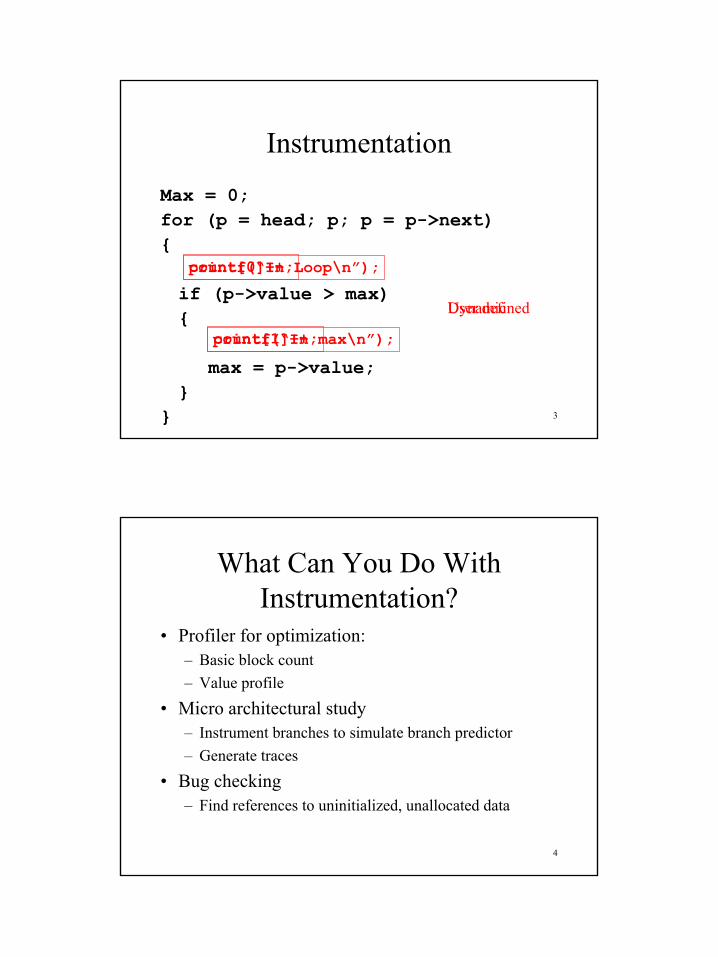
Instrumentation
Max = 0;for (p = head; p; p = p->next){
if (p->value > max){
max = p->value;}
}
count[0]++;
count[1]++;
printf(“In Loop\n”);
printf(“In max\n”);
User definedDynamic
4
What Can You Do With Instrumentation?
• Profiler for optimization:– Basic block count– Value profile
• Micro architectural study– Instrument branches to simulate branch predictor– Generate traces
• Bug checking– Find references to uninitialized, unallocated data
3
5
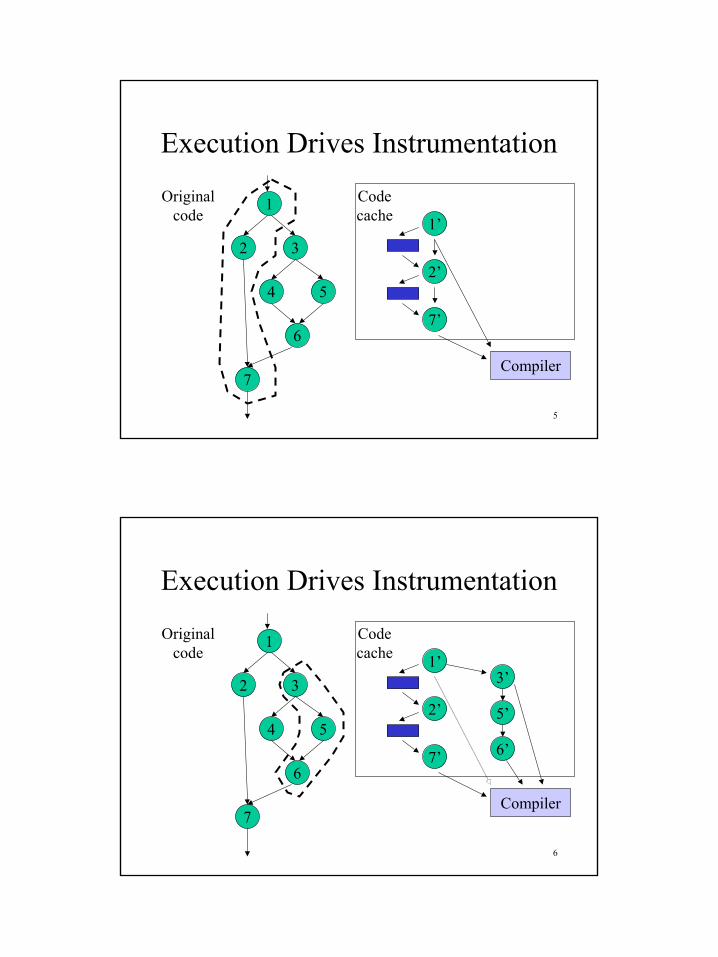
Execution Drives Instrumentation
2 3
1
7
4 5
67’
2’
1’
Compiler
Originalcode
Codecache
6
Execution Drives Instrumentation
2 3
1
7
4 5
67’
2’
1’
Compiler
Originalcode
Codecache
3’
5’
6’
4
7
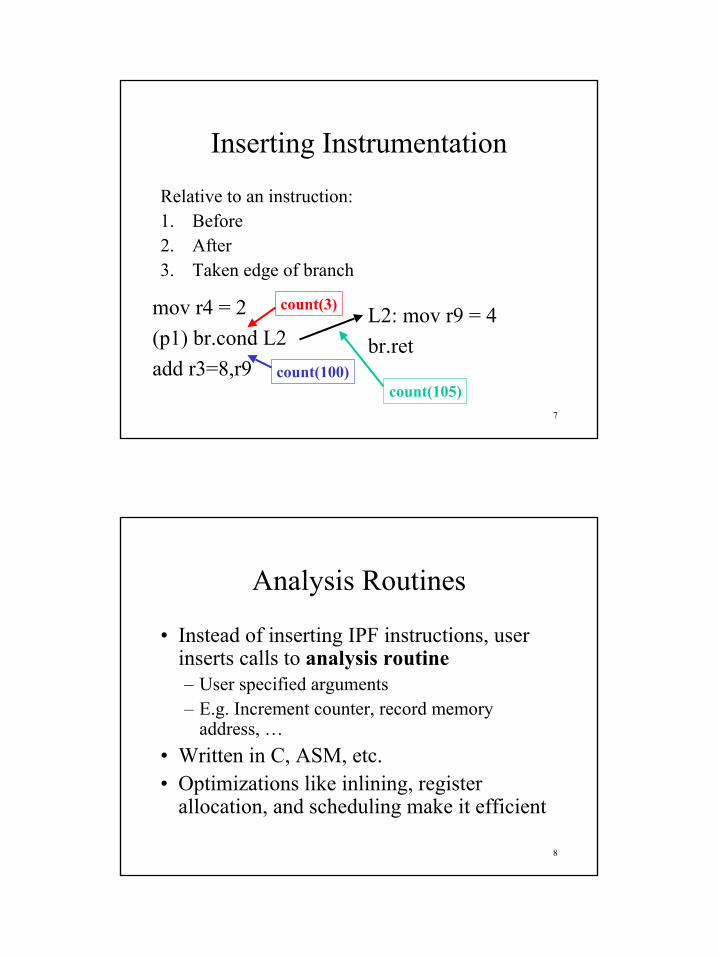
Inserting Instrumentation
Relative to an instruction:1. Before2. After3. Taken edge of branch
L2: mov r9 = 4br.ret
count(3)
count(100)count(105)
mov r4 = 2(p1) br.cond L2add r3=8,r9
8
Analysis Routines
• Instead of inserting IPF instructions, user inserts calls to analysis routine– User specified arguments– E.g. Increment counter, record memory
address, …• Written in C, ASM, etc.• Optimizations like inlining, register
allocation, and scheduling make it efficient
5
9
Instrumentation Routines
• Instrumentation routine walks list of instructions, and inserts calls to analysis routines
• User writes instrumentation routine• Pin invokes instrumentation routine when
placing new instructions in code cache• Repeated execution uses already
instrumented code in code cache
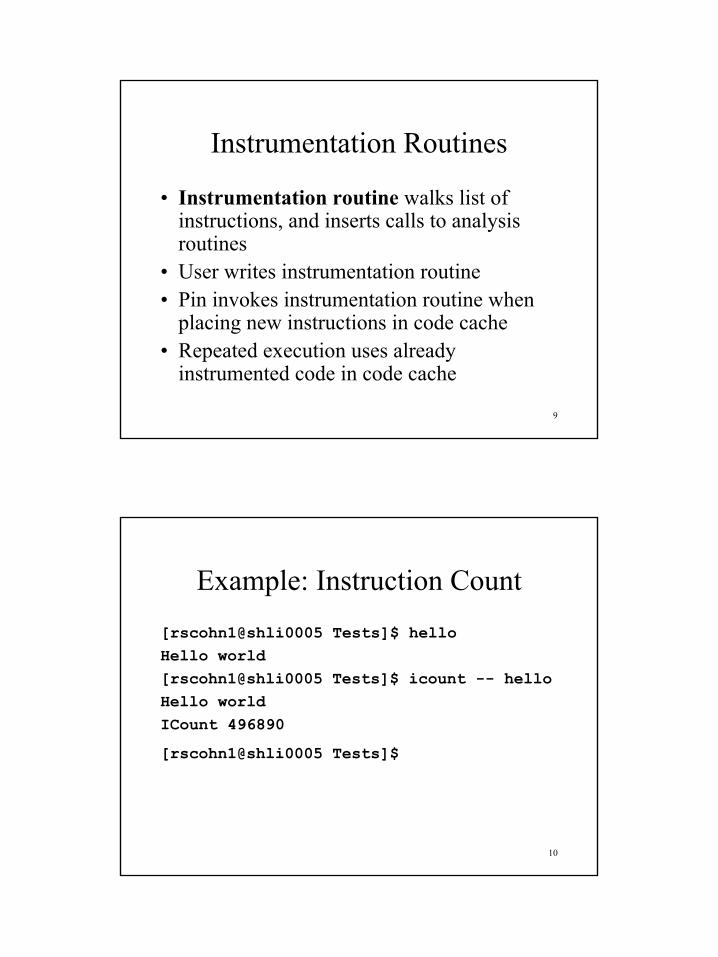
10
Example: Instruction Count[rscohn1@shli0005 Tests]$ helloHello world[rscohn1@shli0005 Tests]$ icount -- helloHello worldICount 496890
[rscohn1@shli0005 Tests]$
6
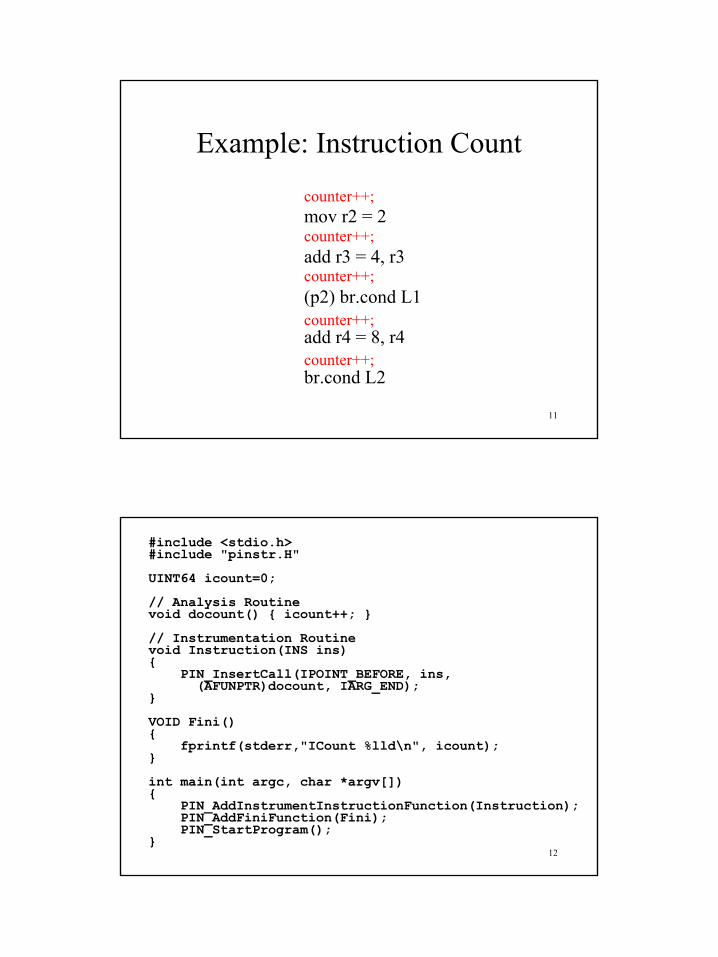
11
Example: Instruction Count
mov r2 = 2
add r3 = 4, r3
(p2) br.cond L1
add r4 = 8, r4
br.cond L2
counter++;
counter++;
counter++;
counter++;
counter++;
12
#include <stdio.h>#include "pinstr.H"
UINT64 icount=0;
// Analysis Routinevoid docount() { icount++; }
// Instrumentation Routinevoid Instruction(INS ins){
PIN_InsertCall(IPOINT_BEFORE, ins, (AFUNPTR)docount, IARG_END);
}
VOID Fini(){
fprintf(stderr,"ICount %lld\n", icount);}
int main(int argc, char *argv[]){
PIN_AddInstrumentInstructionFunction(Instruction);PIN_AddFiniFunction(Fini);PIN_StartProgram();
}
7
13
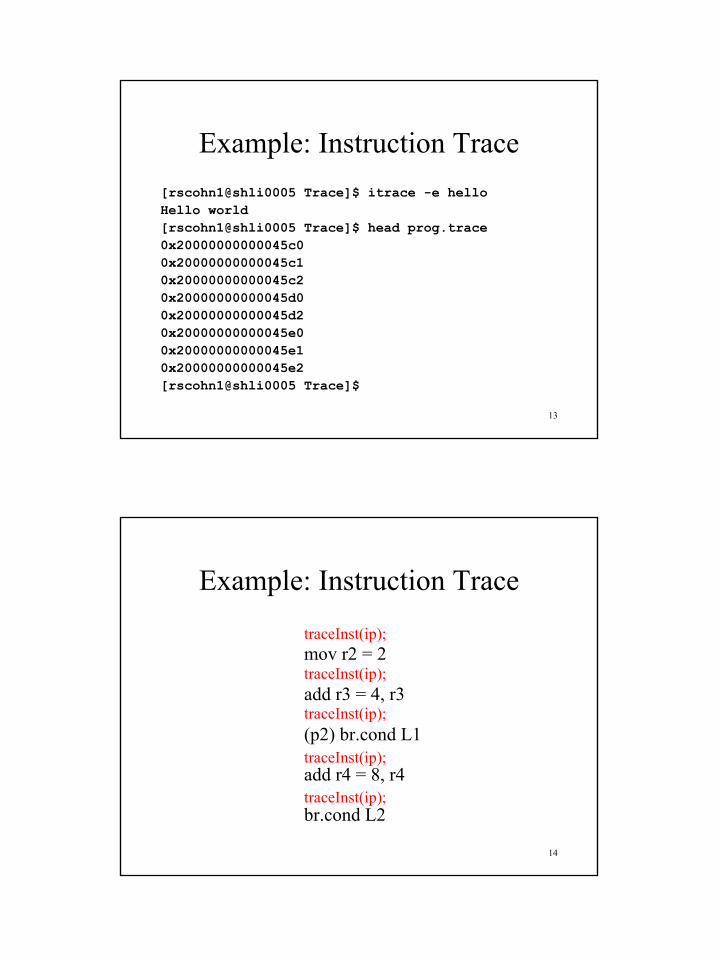
Example: Instruction Trace[rscohn1@shli0005 Trace]$ itrace -e helloHello world[rscohn1@shli0005 Trace]$ head prog.trace0x20000000000045c00x20000000000045c10x20000000000045c20x20000000000045d00x20000000000045d20x20000000000045e00x20000000000045e10x20000000000045e2[rscohn1@shli0005 Trace]$
14
Example: Instruction Trace
mov r2 = 2
add r3 = 4, r3
(p2) br.cond L1
add r4 = 8, r4
br.cond L2
traceInst(ip);
traceInst(ip);
traceInst(ip);
traceInst(ip);
traceInst(ip);
8
15
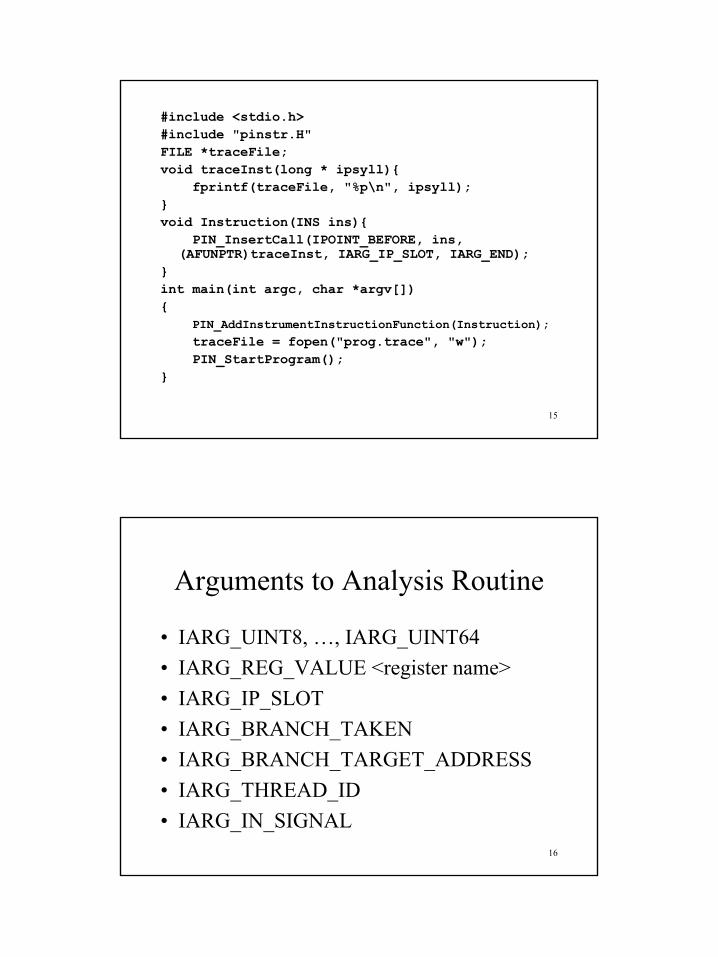
#include <stdio.h>#include "pinstr.H"FILE *traceFile;void traceInst(long * ipsyll){
fprintf(traceFile, "%p\n", ipsyll);}void Instruction(INS ins){
PIN_InsertCall(IPOINT_BEFORE, ins, (AFUNPTR)traceInst, IARG_IP_SLOT, IARG_END);
}int main(int argc, char *argv[]){
PIN_AddInstrumentInstructionFunction(Instruction);traceFile = fopen("prog.trace", "w");PIN_StartProgram();
}
16
Arguments to Analysis Routine
• IARG_UINT8, …, IARG_UINT64• IARG_REG_VALUE <register name>• IARG_IP_SLOT• IARG_BRANCH_TAKEN• IARG_BRANCH_TARGET_ADDRESS• IARG_THREAD_ID• IARG_IN_SIGNAL
9
17
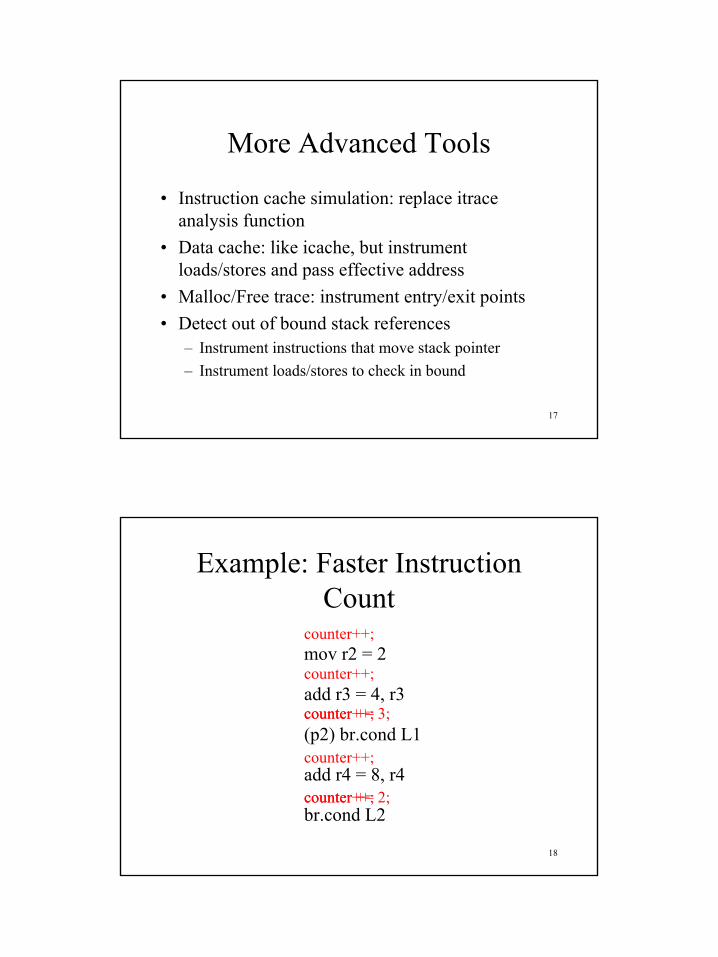
More Advanced Tools
• Instruction cache simulation: replace itrace analysis function
• Data cache: like icache, but instrument loads/stores and pass effective address
• Malloc/Free trace: instrument entry/exit points• Detect out of bound stack references
– Instrument instructions that move stack pointer– Instrument loads/stores to check in bound
18
Example: Faster Instruction Count
mov r2 = 2
add r3 = 4, r3
(p2) br.cond L1
add r4 = 8, r4
br.cond L2
counter++;
counter++;
counter++;
counter++;
counter++;
counter += 3;
counter += 2;
10
19
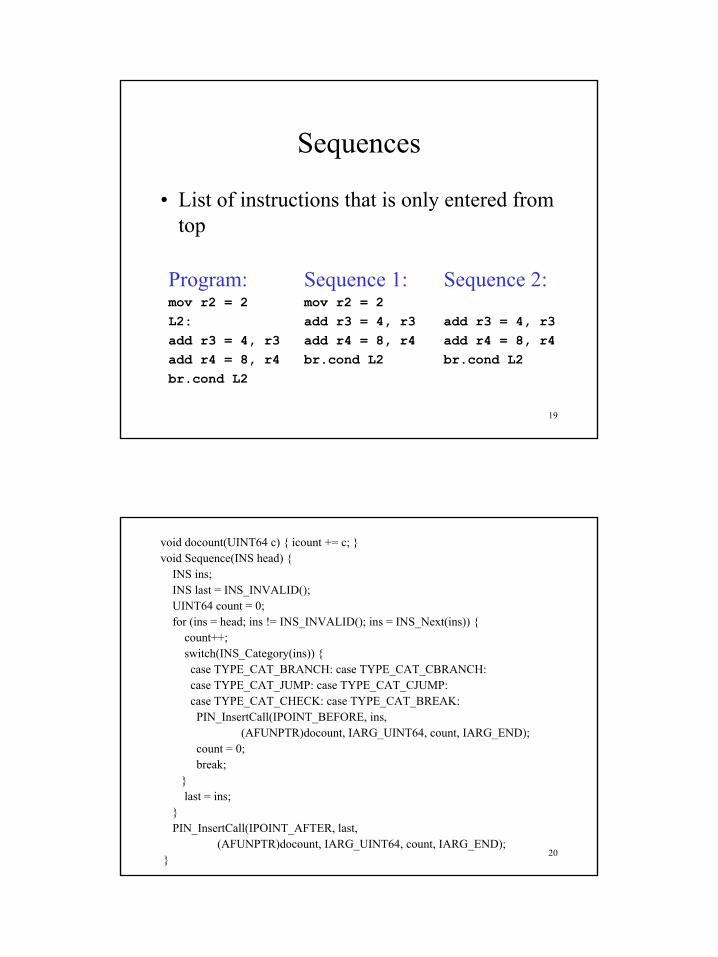
Sequences
• List of instructions that is only entered from top
Program:mov r2 = 2L2:add r3 = 4, r3add r4 = 8, r4br.cond L2
Sequence 1:mov r2 = 2add r3 = 4, r3add r4 = 8, r4br.cond L2
Sequence 2:
add r3 = 4, r3add r4 = 8, r4br.cond L2
20
void docount(UINT64 c) { icount += c; }void Sequence(INS head) {
INS ins;INS last = INS_INVALID();UINT64 count = 0;for (ins = head; ins != INS_INVALID(); ins = INS_Next(ins)) {
count++;switch(INS_Category(ins)) {case TYPE_CAT_BRANCH: case TYPE_CAT_CBRANCH:case TYPE_CAT_JUMP: case TYPE_CAT_CJUMP:case TYPE_CAT_CHECK: case TYPE_CAT_BREAK:
PIN_InsertCall(IPOINT_BEFORE, ins,(AFUNPTR)docount, IARG_UINT64, count, IARG_END);
count = 0;break;
}last = ins;
}PIN_InsertCall(IPOINT_AFTER, last,
(AFUNPTR)docount, IARG_UINT64, count, IARG_END);}
11
21
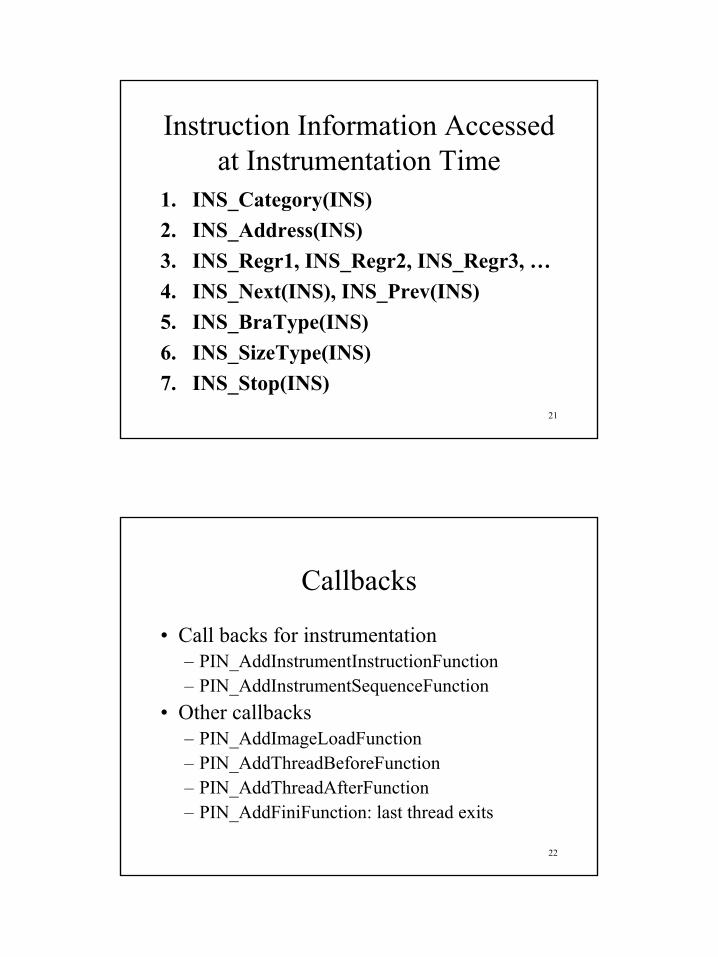
Instruction Information Accessed at Instrumentation Time
1. INS_Category(INS)2. INS_Address(INS)3. INS_Regr1, INS_Regr2, INS_Regr3, …4. INS_Next(INS), INS_Prev(INS)5. INS_BraType(INS)6. INS_SizeType(INS)7. INS_Stop(INS)
22
Callbacks
• Call backs for instrumentation– PIN_AddInstrumentInstructionFunction– PIN_AddInstrumentSequenceFunction
• Other callbacks– PIN_AddImageLoadFunction– PIN_AddThreadBeforeFunction– PIN_AddThreadAfterFunction– PIN_AddFiniFunction: last thread exits
12
23
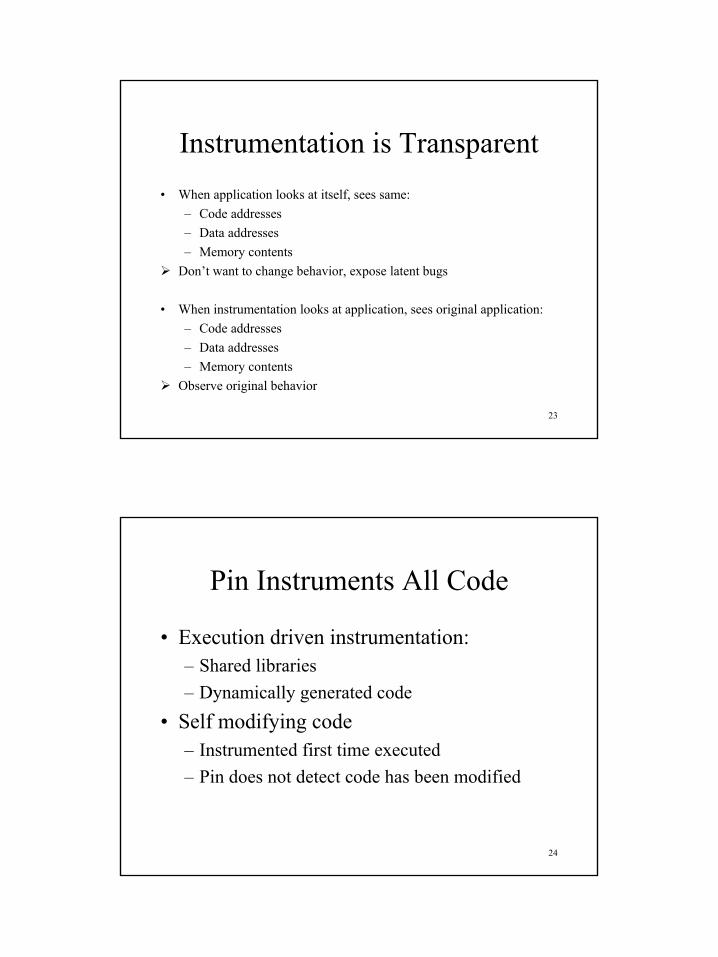
Instrumentation is Transparent• When application looks at itself, sees same:
– Code addresses– Data addresses– Memory contents
Don’t want to change behavior, expose latent bugs
• When instrumentation looks at application, sees original application:– Code addresses– Data addresses– Memory contents
Observe original behavior
24
Pin Instruments All Code
• Execution driven instrumentation:– Shared libraries– Dynamically generated code
• Self modifying code– Instrumented first time executed– Pin does not detect code has been modified
13
25
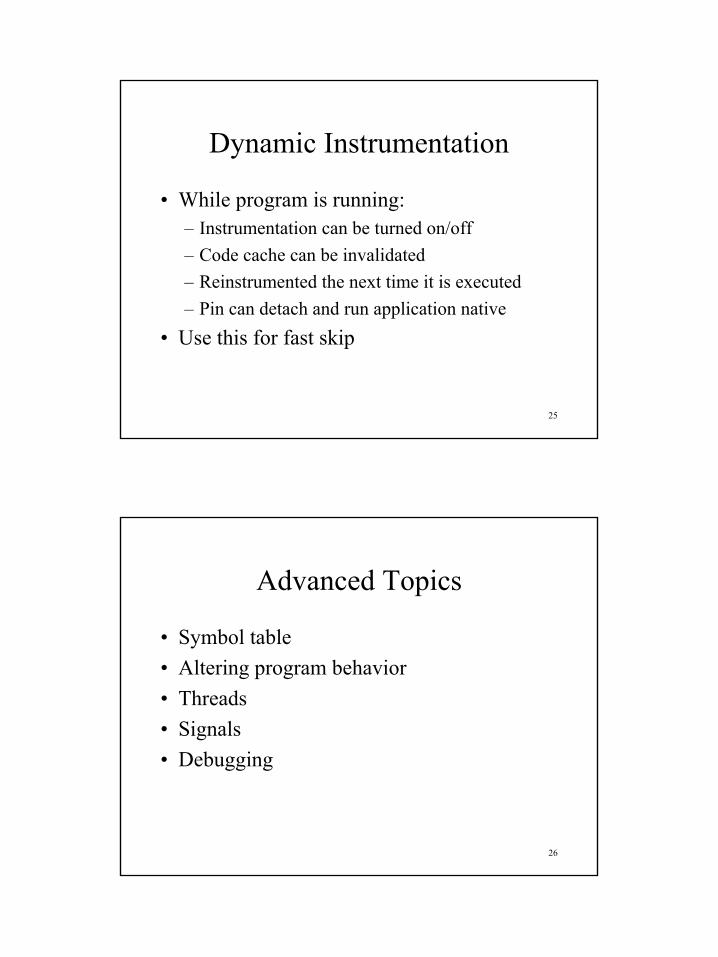
Dynamic Instrumentation
• While program is running:– Instrumentation can be turned on/off– Code cache can be invalidated– Reinstrumented the next time it is executed– Pin can detach and run application native
• Use this for fast skip
26
Advanced Topics
• Symbol table• Altering program behavior• Threads• Signals• Debugging
14
27
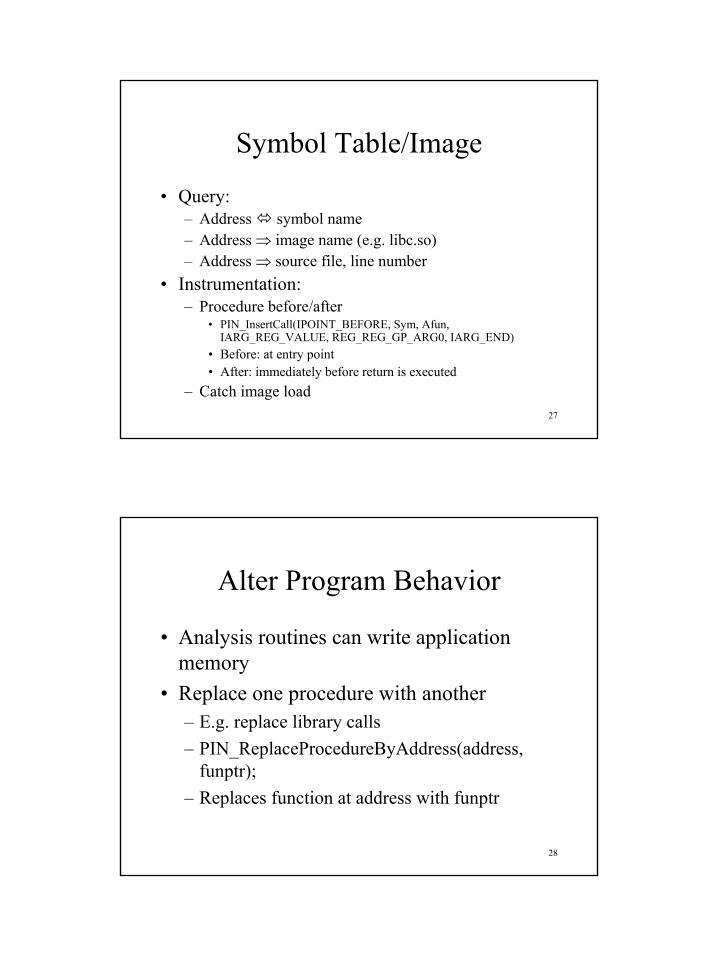
Symbol Table/Image
• Query:– Address symbol name– Address ⇒ image name (e.g. libc.so)– Address ⇒ source file, line number
• Instrumentation:– Procedure before/after
• PIN_InsertCall(IPOINT_BEFORE, Sym, Afun, IARG_REG_VALUE, REG_REG_GP_ARG0, IARG_END)
• Before: at entry point• After: immediately before return is executed
– Catch image load
28
Alter Program Behavior
• Analysis routines can write application memory
• Replace one procedure with another– E.g. replace library calls– PIN_ReplaceProcedureByAddress(address,
funptr);– Replaces function at address with funptr
15
29
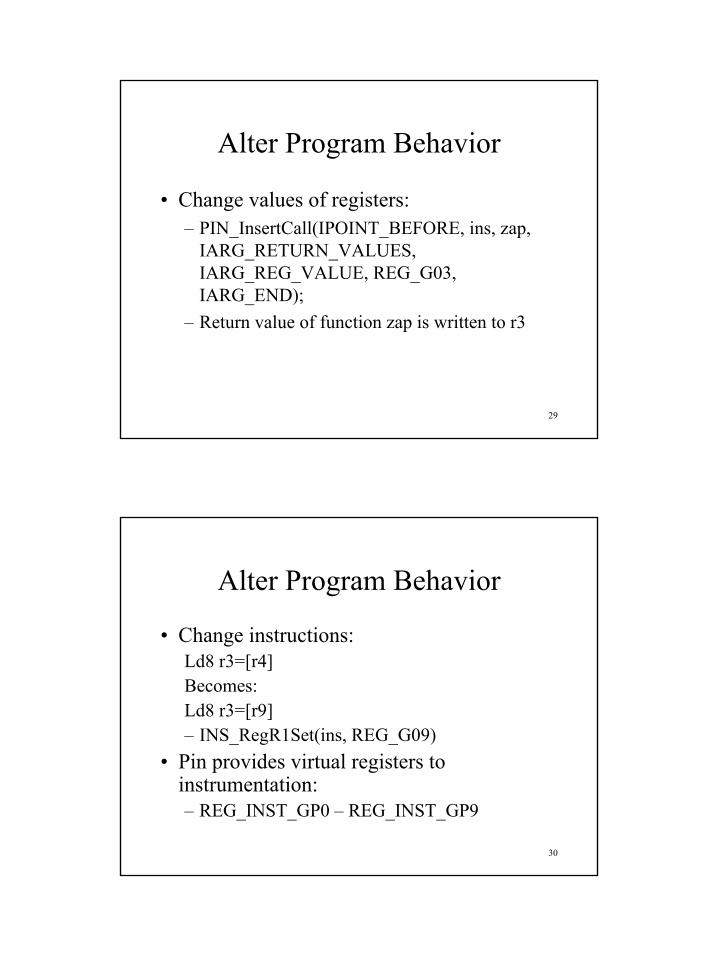
Alter Program Behavior
• Change values of registers: – PIN_InsertCall(IPOINT_BEFORE, ins, zap,
IARG_RETURN_VALUES, IARG_REG_VALUE, REG_G03, IARG_END);
– Return value of function zap is written to r3
30
Alter Program Behavior
• Change instructions:Ld8 r3=[r4]Becomes:Ld8 r3=[r9]– INS_RegR1Set(ins, REG_G09)
• Pin provides virtual registers to instrumentation:– REG_INST_GP0 – REG_INST_GP9
16
31
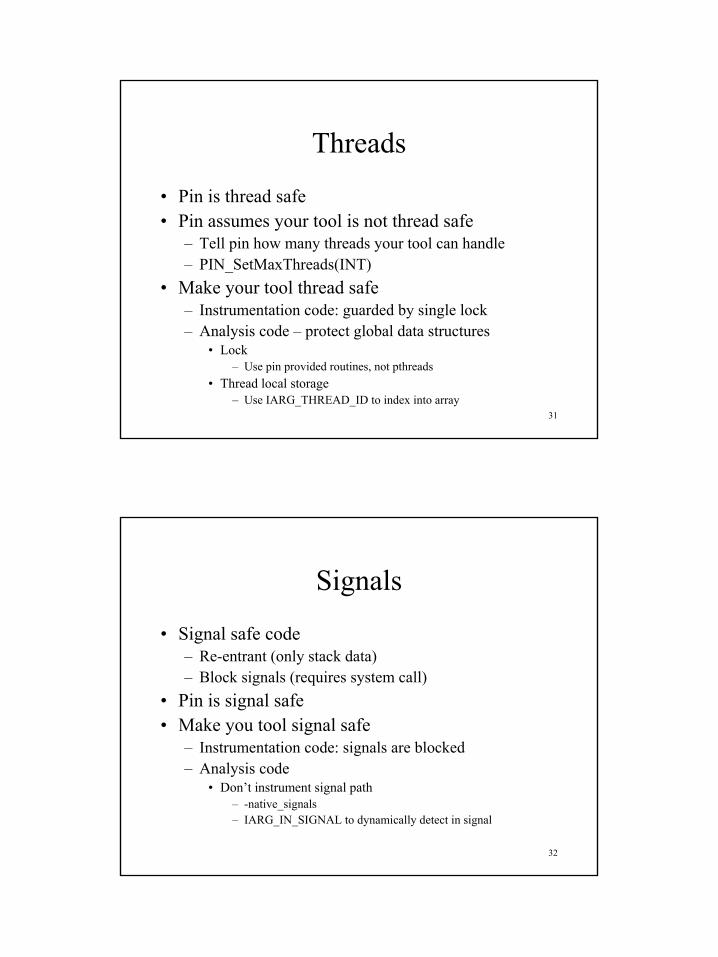
Threads
• Pin is thread safe• Pin assumes your tool is not thread safe
– Tell pin how many threads your tool can handle– PIN_SetMaxThreads(INT)
• Make your tool thread safe– Instrumentation code: guarded by single lock– Analysis code – protect global data structures
• Lock– Use pin provided routines, not pthreads
• Thread local storage– Use IARG_THREAD_ID to index into array
32
Signals
• Signal safe code– Re-entrant (only stack data)– Block signals (requires system call)
• Pin is signal safe• Make you tool signal safe
– Instrumentation code: signals are blocked– Analysis code
• Don’t instrument signal path– -native_signals– IARG_IN_SIGNAL to dynamically detect in signal
17
33
Debugging
• Instrumentation code– Use gdb
• Analysis code– Pin dynamically optimizes analysis code to
reduce cost of instrumentation (up to 10x)– Disable optimization to use gdb
• icount –p pin –O0 -- /bin/ls
– Otherwise, use printf
1
ORC TutorialR®
1
Speculative Parallel ThreadingCompiler
Tin-Fook Ngai *
William Chen, Zhao-Hui Du, Xiao-Feng Li, Chu-Choew Lim*, Chen Yang, Qingyu Zhao
Intel China Research Center* Microprocessor Technology Labs
Intel Corporation
ORC TutorialR®
2
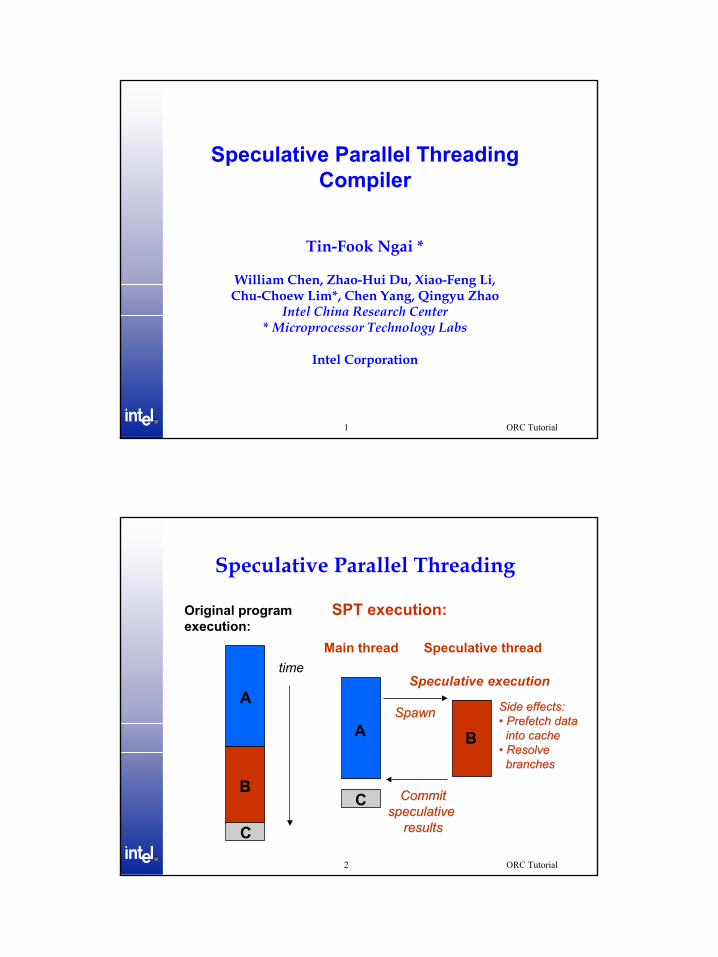
Speculative Parallel Threading
SPT execution:Original programexecution:
time
A
B
C
Main thread Speculative thread
SpawnSpawn
CommitCommitspeculative speculative
resultsresults
C
BASide effects:Side effects:•• Prefetch dataPrefetch data
into cache into cache •• ResolveResolve
branches branches
Speculative execution
2
ORC TutorialR®
3
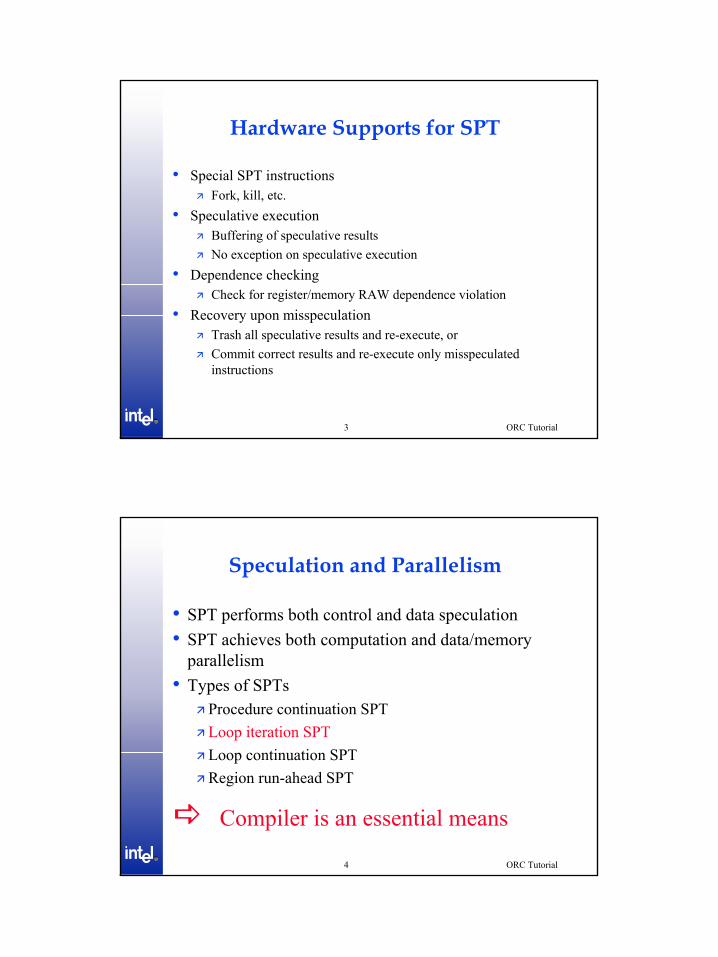
Hardware Supports for SPT
• Special SPT instructionsFork, kill, etc.
• Speculative execution Buffering of speculative results No exception on speculative execution
• Dependence checkingCheck for register/memory RAW dependence violation
• Recovery upon misspeculationTrash all speculative results and re-execute, or Commit correct results and re-execute only misspeculated instructions
ORC TutorialR®
4
Speculation and Parallelism
• SPT performs both control and data speculation• SPT achieves both computation and data/memory
parallelism• Types of SPTs
Procedure continuation SPTLoop iteration SPTLoop continuation SPT Region run-ahead SPT
Compiler is an essential means
3
ORC TutorialR®
5
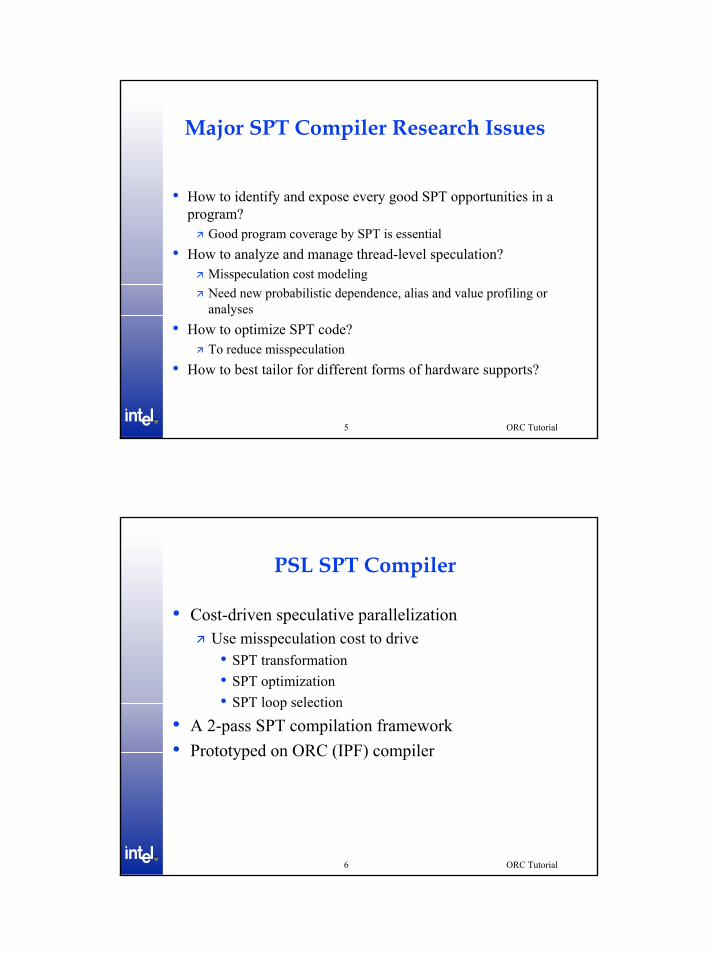
Major SPT Compiler Research Issues
• How to identify and expose every good SPT opportunities in a program?
Good program coverage by SPT is essential• How to analyze and manage thread-level speculation?
Misspeculation cost modelingNeed new probabilistic dependence, alias and value profiling or analyses
• How to optimize SPT code?To reduce misspeculation
• How to best tailor for different forms of hardware supports?
ORC TutorialR®
6
PSL SPT Compiler
• Cost-driven speculative parallelizationUse misspeculation cost to drive • SPT transformation • SPT optimization • SPT loop selection
• A 2-pass SPT compilation framework• Prototyped on ORC (IPF) compiler
4
ORC TutorialR®
7
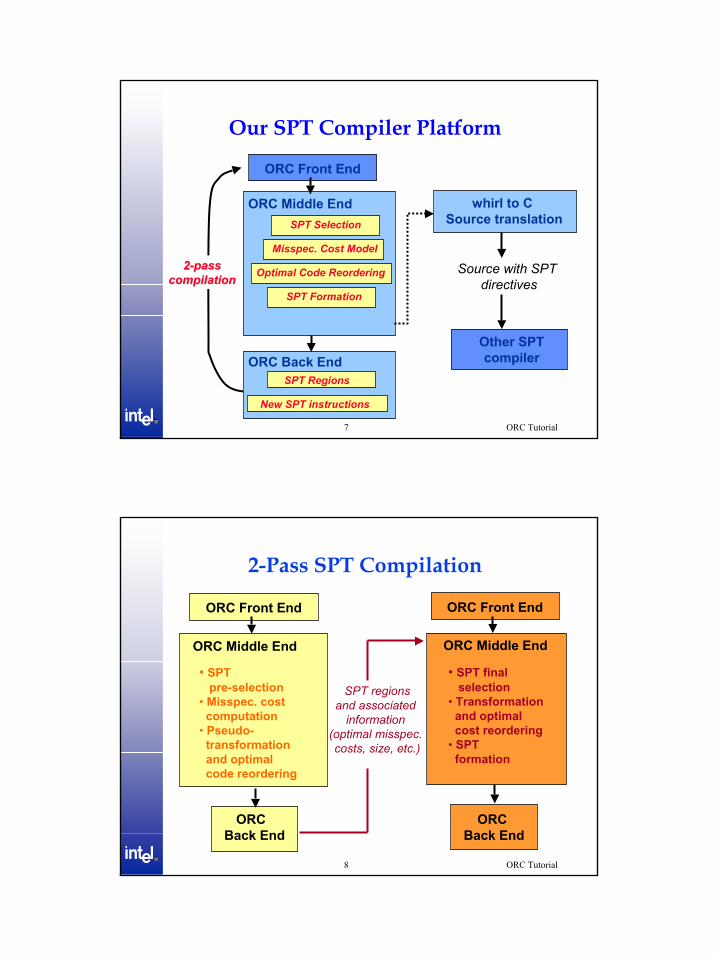
Our SPT Compiler Platform
ORC Back End
whirl to C Source translation
Other SPTcompiler
Source with SPT directives
ORC Middle End
Misspec. Cost Model
Optimal Code Reordering
SPT Formation
SPT Selection
ORC Front End
SPT Regions
New SPT instructions
22--passpasscompilationcompilation
ORC TutorialR®
8
2-Pass SPT Compilation
ORC Back End
ORC Front End
ORC Middle End
• SPT pre-selection
• Misspec. costcomputation
• Pseudo-transformationand optimalcode reordering
ORC Back End
ORC Front End
ORC Middle End
• SPT finalselection
• Transformationand optimal cost reordering
• SPT formation
SPT regionsand associated
information (optimal misspec. costs, size, etc.)
5
ORC TutorialR®
9
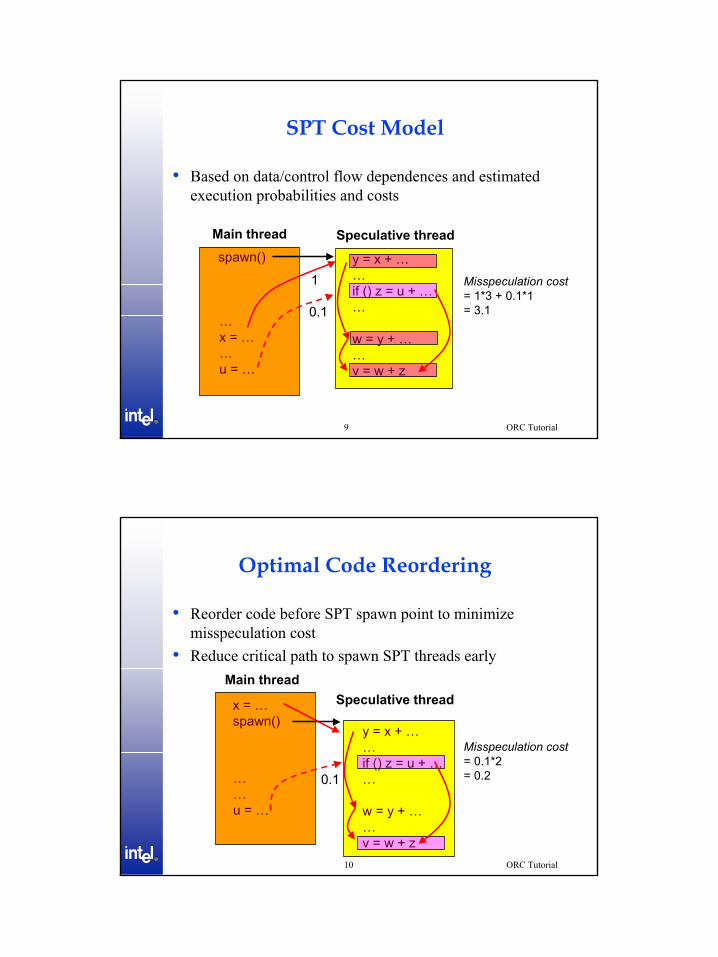
• Based on data/control flow dependences and estimated execution probabilities and costs
SPT Cost Model
Misspeculation cost= 1*3 + 0.1*1= 3.1
Main thread Speculative thread
y = x + ……if () z = u + ……
w = y + … …v = w + z
…x = ……u = …
spawn()
1
0.1
ORC TutorialR®
10
Optimal Code Reordering
• Reorder code before SPT spawn point to minimize misspeculation cost
• Reduce critical path to spawn SPT threads early Main thread
……u = …
x = …spawn()
Speculative thread
y = x + ……if () z = u + ……
w = y + … …v = w + z
0.1
Misspeculation cost= 0.1*2= 0.2
6
ORC TutorialR®
11
SPT Loop Selection
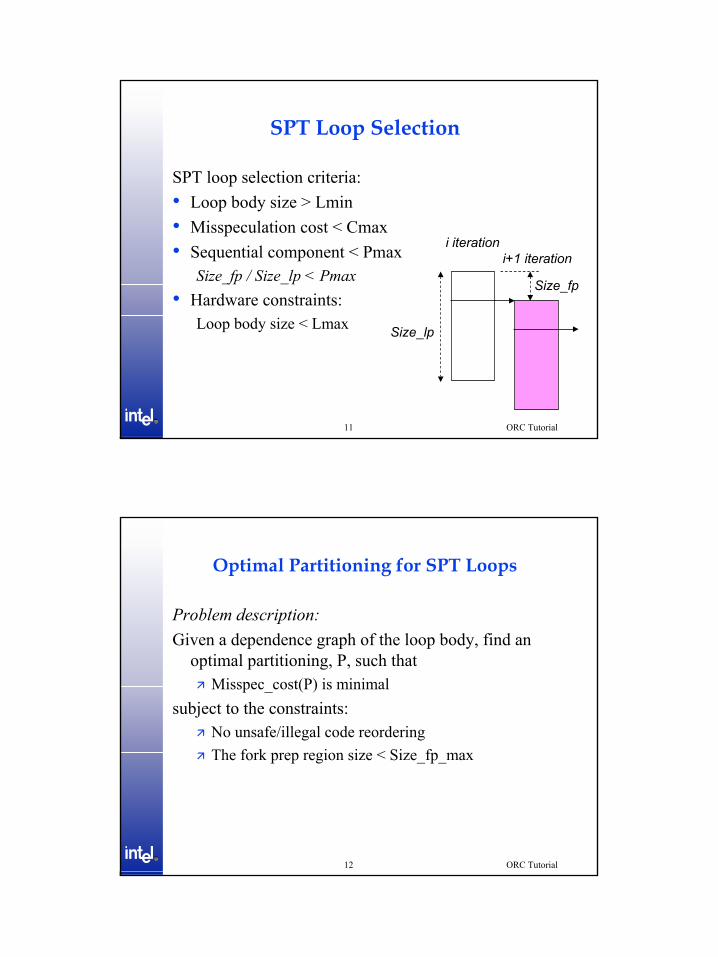
SPT loop selection criteria:• Loop body size > Lmin• Misspeculation cost < Cmax• Sequential component < Pmax
Size_fp / Size_lp < Pmax• Hardware constraints:
Loop body size < Lmax
Size_fp
Size_lp
i iterationi+1 iteration
ORC TutorialR®
12
Optimal Partitioning for SPT Loops
Problem description: Given a dependence graph of the loop body, find an
optimal partitioning, P, such that Misspec_cost(P) is minimal
subject to the constraints:No unsafe/illegal code reordering The fork prep region size < Size_fp_max
7
ORC TutorialR®
13
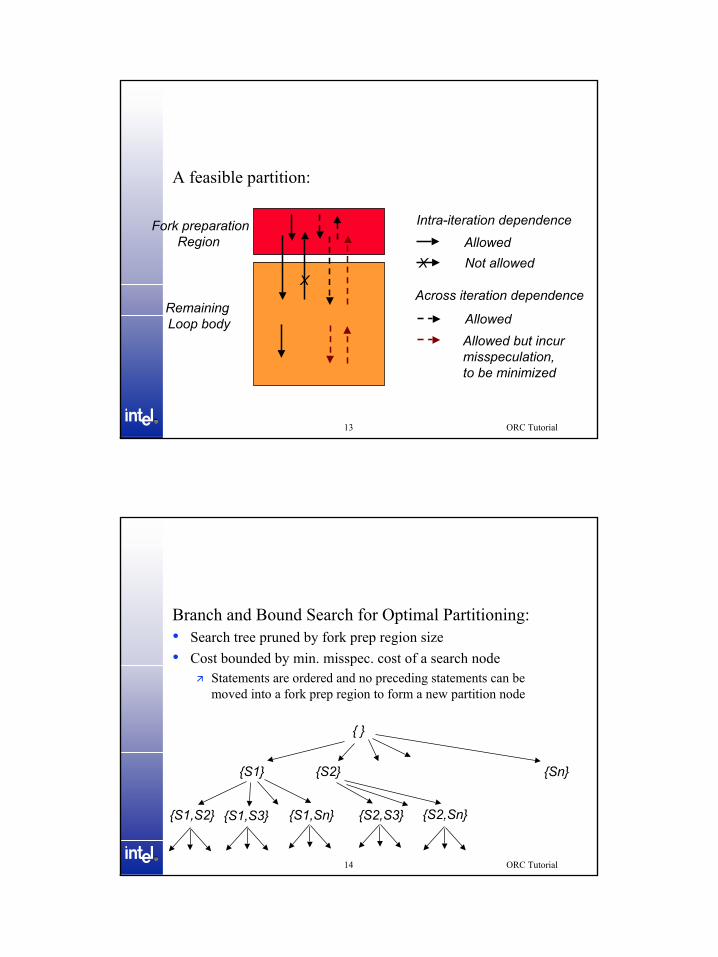
A feasible partition:
Fork preparationRegion
Remaining Loop body
XAcross iteration dependence
X
Intra-iteration dependenceAllowedNot allowed
AllowedAllowed but incurmisspeculation, to be minimized
ORC TutorialR®
14
Branch and Bound Search for Optimal Partitioning:• Search tree pruned by fork prep region size• Cost bounded by min. misspec. cost of a search node
Statements are ordered and no preceding statements can be moved into a fork prep region to form a new partition node
{ }
{S1} {S2} {Sn}
{S1,S2} {S1,S3} {S2,S3} {S2,Sn}{S1,Sn}
8
ORC TutorialR®
15
Other Enabling Techniques
• Loop unrolling To increase loop size of small loops
• Dependence profilingTo obtain more accurate dependence probabilities
• Software value predictionTo predict and use critical values w/o hardware support
ORC TutorialR®
16
Dependence Profiling
• Dependence probabilities are essential information for good speculation
Used in our misspeculation cost computationProfiling provides a convenient and reliable means to obtain accurate dependence probabilities
• Use the dependence profiling tool provided by U. of Minnesota
Instrument and profile every memory references in loops and function callsFeedback profiling information and annotate the dependence graph with dependence probabilities
9
ORC TutorialR®
17
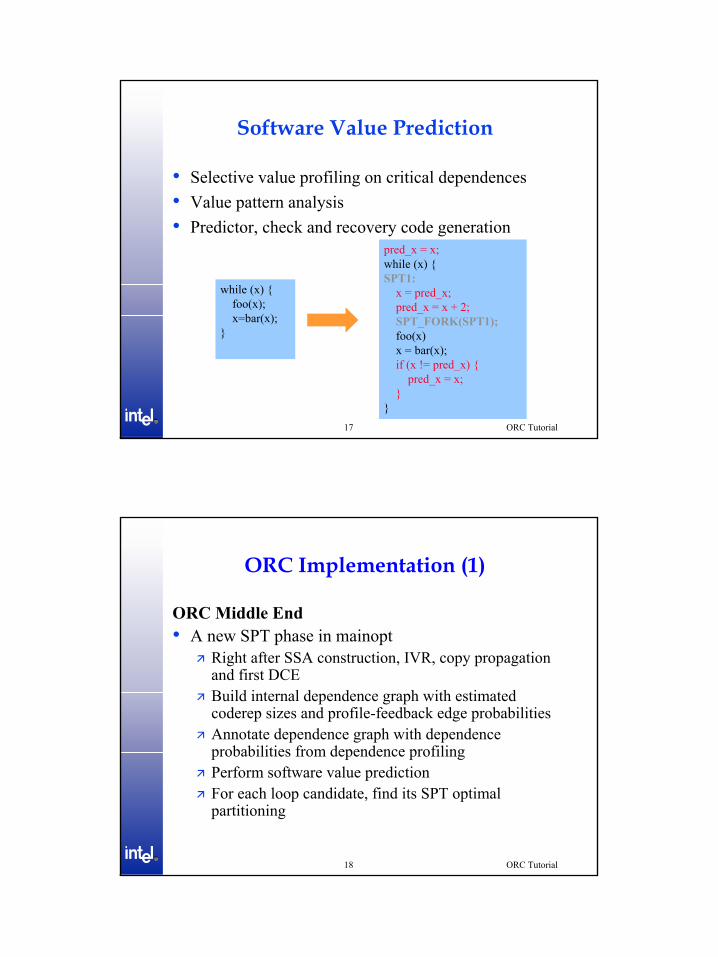
Software Value Prediction
• Selective value profiling on critical dependences• Value pattern analysis • Predictor, check and recovery code generation
while (x) {foo(x);x=bar(x);
}
pred_x = x;while (x) {SPT1:
x = pred_x;pred_x = x + 2;SPT_FORK(SPT1);foo(x)x = bar(x);if (x != pred_x) {
pred_x = x;}
}
ORC TutorialR®
18
ORC Implementation (1)
ORC Middle End• A new SPT phase in mainopt
Right after SSA construction, IVR, copy propagation and first DCEBuild internal dependence graph with estimated coderep sizes and profile-feedback edge probabilities Annotate dependence graph with dependence probabilities from dependence profilingPerform software value prediction For each loop candidate, find its SPT optimal partitioning
10
ORC TutorialR®
19
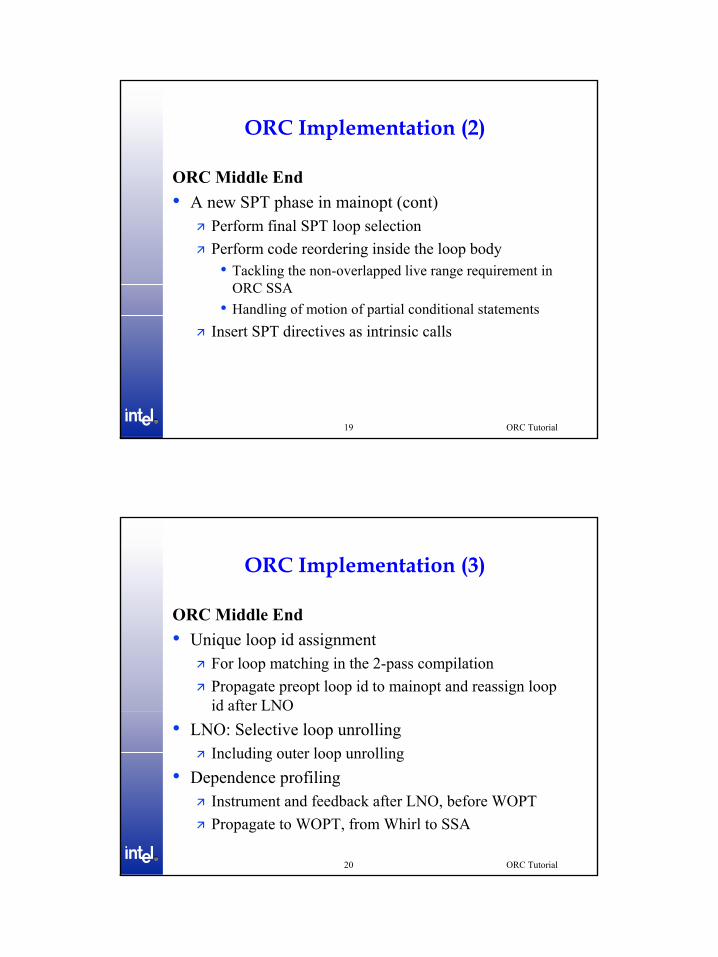
ORC Implementation (2)
ORC Middle End• A new SPT phase in mainopt (cont)
Perform final SPT loop selection Perform code reordering inside the loop body • Tackling the non-overlapped live range requirement in
ORC SSA• Handling of motion of partial conditional statements
Insert SPT directives as intrinsic calls
ORC TutorialR®
20
ORC Implementation (3)
ORC Middle End• Unique loop id assignment
For loop matching in the 2-pass compilationPropagate preopt loop id to mainopt and reassign loop id after LNO
• LNO: Selective loop unrollingIncluding outer loop unrolling
• Dependence profilingInstrument and feedback after LNO, before WOPTPropagate to WOPT, from Whirl to SSA
11
ORC TutorialR®
21
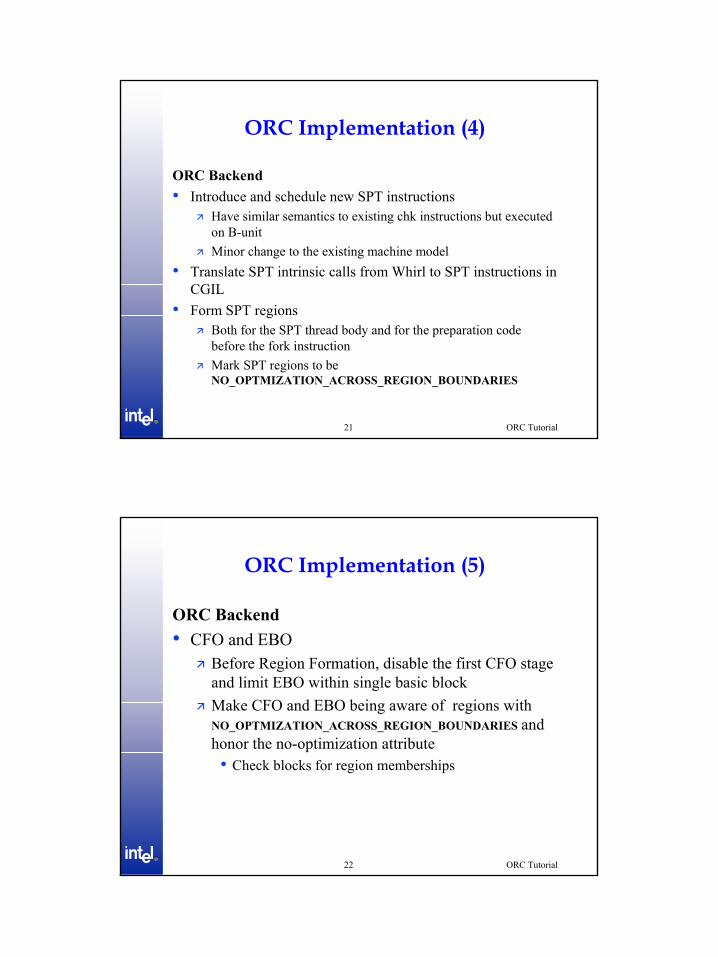
ORC Implementation (4)
ORC Backend• Introduce and schedule new SPT instructions
Have similar semantics to existing chk instructions but executedon B-unitMinor change to the existing machine model
• Translate SPT intrinsic calls from Whirl to SPT instructions in CGIL
• Form SPT regionsBoth for the SPT thread body and for the preparation code before the fork instructionMark SPT regions to be NO_OPTMIZATION_ACROSS_REGION_BOUNDARIES
ORC TutorialR®
22
ORC Implementation (5)
ORC Backend• CFO and EBO
Before Region Formation, disable the first CFO stage and limit EBO within single basic blockMake CFO and EBO being aware of regions with NO_OPTMIZATION_ACROSS_REGION_BOUNDARIES and honor the no-optimization attribute• Check blocks for region memberships
12
ORC TutorialR®
23
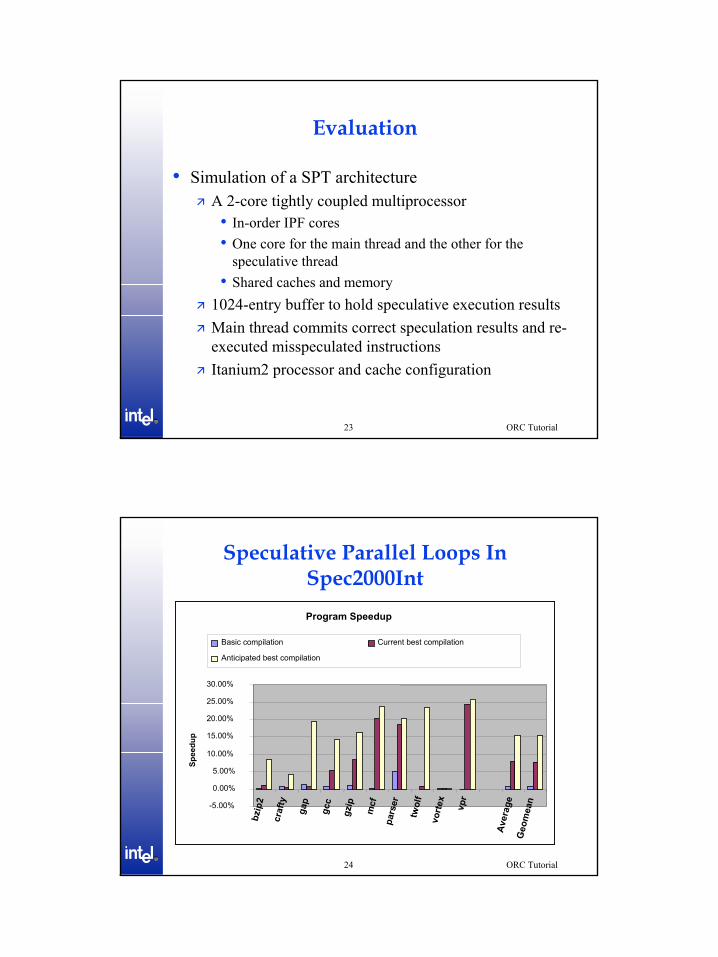
Evaluation
• Simulation of a SPT architectureA 2-core tightly coupled multiprocessor• In-order IPF cores• One core for the main thread and the other for the
speculative thread• Shared caches and memory
1024-entry buffer to hold speculative execution resultsMain thread commits correct speculation results and re-executed misspeculated instructions Itanium2 processor and cache configuration
ORC TutorialR®
24
Speculative Parallel Loops In Spec2000IntProgram Speedup
-5.00%
0.00%
5.00%
10.00%
15.00%
20.00%
25.00%
30.00%
bzip
2
craf
ty
gap
gcc
gzip
mcf
pars
er
twol
fvo
rtex
vpr
Aver
age
Geo
mea
n
Spee
dup
Basic compilation Current best compilation
Anticipated best compilation
1
Office of Science
U.S. Department of Energy
Implementing UPC in ORCImplementing UPC in ORC
Costin IancuLawrence Berkeley National Laboratory
Office of Science
U.S. Department of Energy
OverviewOverview
• UPC Language Features• UPC implementation in ORC• UPC Specific Optimizations• Rants and gripes
2
Office of Science
U.S. Department of Energy
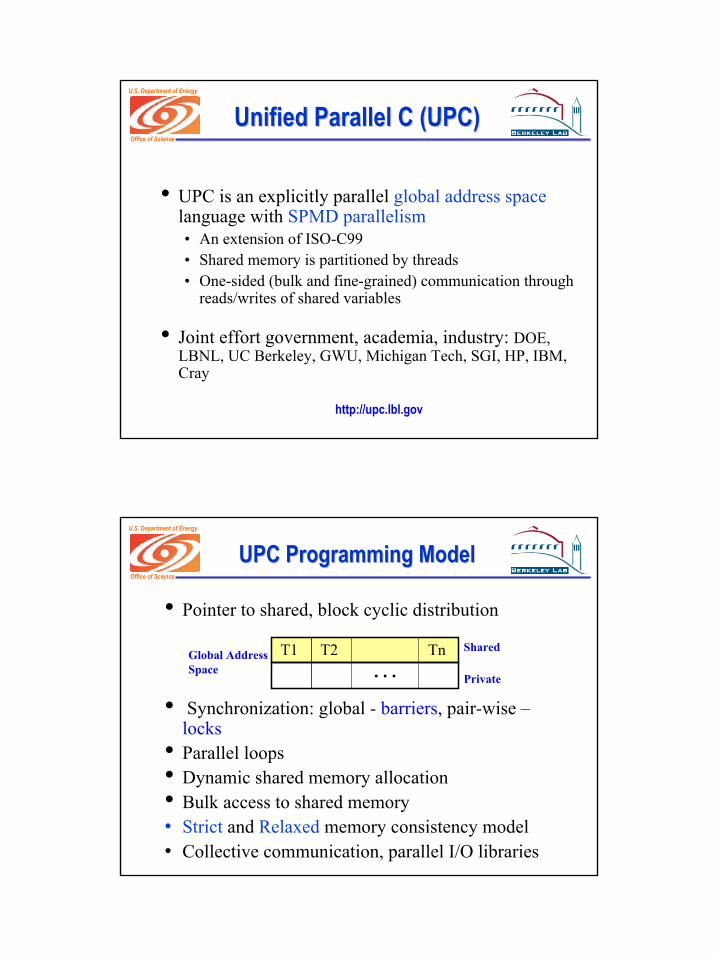
Unified Parallel C (UPC)Unified Parallel C (UPC)
• UPC is an explicitly parallel global address spacelanguage with SPMD parallelism• An extension of ISO-C99• Shared memory is partitioned by threads• One-sided (bulk and fine-grained) communication through
reads/writes of shared variables
• Joint effort government, academia, industry: DOE, LBNL, UC Berkeley, GWU, Michigan Tech, SGI, HP, IBM, Cray
http://upc.lbl.gov
Office of Science
U.S. Department of Energy
UPC Programming Model UPC Programming Model
• Pointer to shared, block cyclic distribution
• Synchronization: global - barriers, pair-wise –locks
• Parallel loops• Dynamic shared memory allocation• Bulk access to shared memory• Strict and Relaxed memory consistency model• Collective communication, parallel I/O libraries
T1 T2 Tn…
Shared
Private
Global AddressSpace
3
Office of Science
U.S. Department of Energy
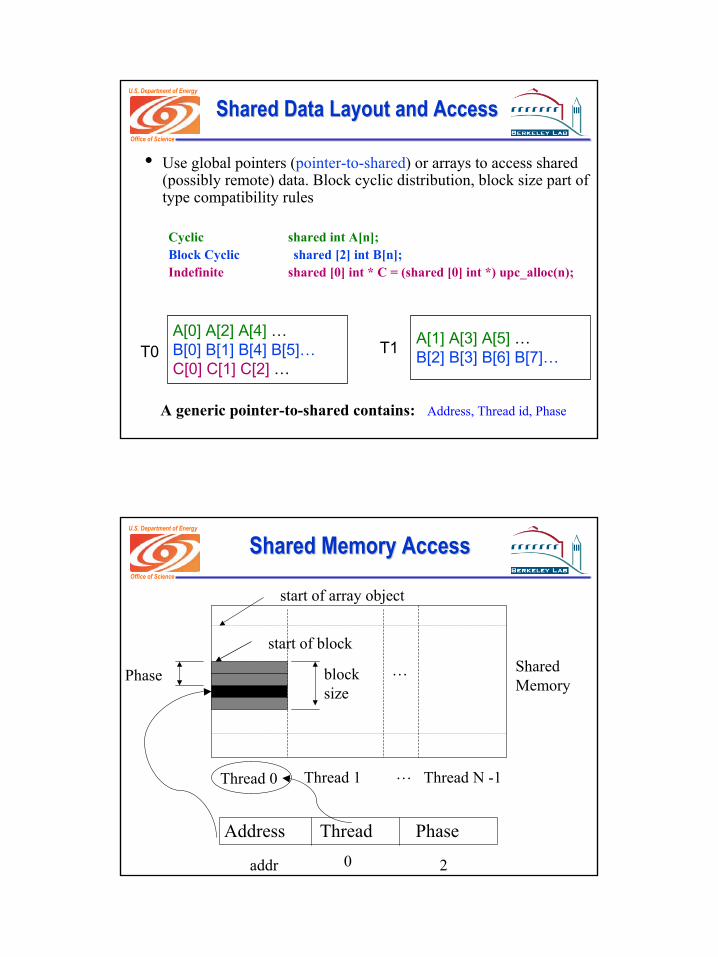
Shared Data Layout and AccessShared Data Layout and Access
• Use global pointers (pointer-to-shared) or arrays to access shared (possibly remote) data. Block cyclic distribution, block size part of type compatibility rules
Cyclic shared int A[n];Block Cyclic shared [2] int B[n];Indefinite shared [0] int * C = (shared [0] int *) upc_alloc(n);
A[0] A[2] A[4] …B[0] B[1] B[4] B[5]…C[0] C[1] C[2] …
A[1] A[3] A[5] …B[2] B[3] B[6] B[7]…T0 T1
A generic pointer-to-shared contains: Address, Thread id, Phase
Office of Science
U.S. Department of Energy
Shared Memory AccessShared Memory Access
2addr
Thread 1 Thread N -1
Address Thread Phase0
Phase SharedMemory
Thread 0
block size
start of array object
…
…
start of block
4
Office of Science
U.S. Department of Energy
PointerPointer--toto--Shared RepresentationShared Representation
• A pointer needs a “phase” to keep track of where it is in a block• Source of overhead for pointer arithmetic
• Special case for “phaseless” pointers: Cyclic + Indefinite• Cyclic pointers always have phase 0• Indefinite pointers only have one block• Don’t need to keep phase in pointer operations for cyclic and
indefinite• Don’t need to update thread id for indefinite pointer arithmetic
Office of Science
U.S. Department of Energy
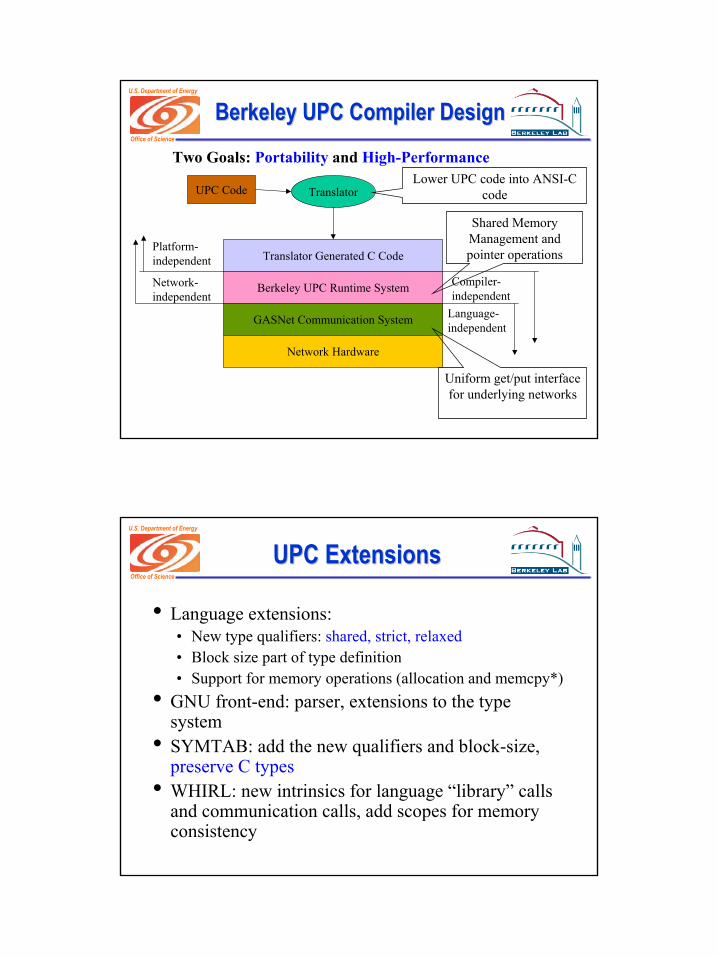
Berkeley UPC Design GoalsBerkeley UPC Design Goals• Portability
• Source-to-source translation (UPC to C)• Support for most high speed network APIs in use (GM, ELAN,
LAPI, Shmem, MPI)• Runtime and communication libraries with a layered design and
a small core• High-Performance:
• Native C compiler optimizes serial code• Translator can perform high-level communication optimizations• Direct runtime access to network hardware
• Reuse of Open64 optimization infrastructure - LNO and WOPT
5
Office of Science
U.S. Department of Energy
Berkeley UPC Compiler DesignBerkeley UPC Compiler Design
TranslatorUPC Code
Translator Generated C Code
Berkeley UPC Runtime System
GASNet Communication System
Network Hardware
Platform-independent
Network-independent
Compiler-independent
Language-independent
Two Goals: Portability and High-PerformanceLower UPC code into ANSI-C
code
Shared Memory Management and pointer operations
Uniform get/put interface for underlying networks
Office of Science
U.S. Department of Energy
UPC ExtensionsUPC Extensions
• Language extensions: • New type qualifiers: shared, strict, relaxed• Block size part of type definition• Support for memory operations (allocation and memcpy*)
• GNU front-end: parser, extensions to the type system
• SYMTAB: add the new qualifiers and block-size, preserve C types
• WHIRL: new intrinsics for language “library” calls and communication calls, add scopes for memory consistency
6
Office of Science
U.S. Department of Energy
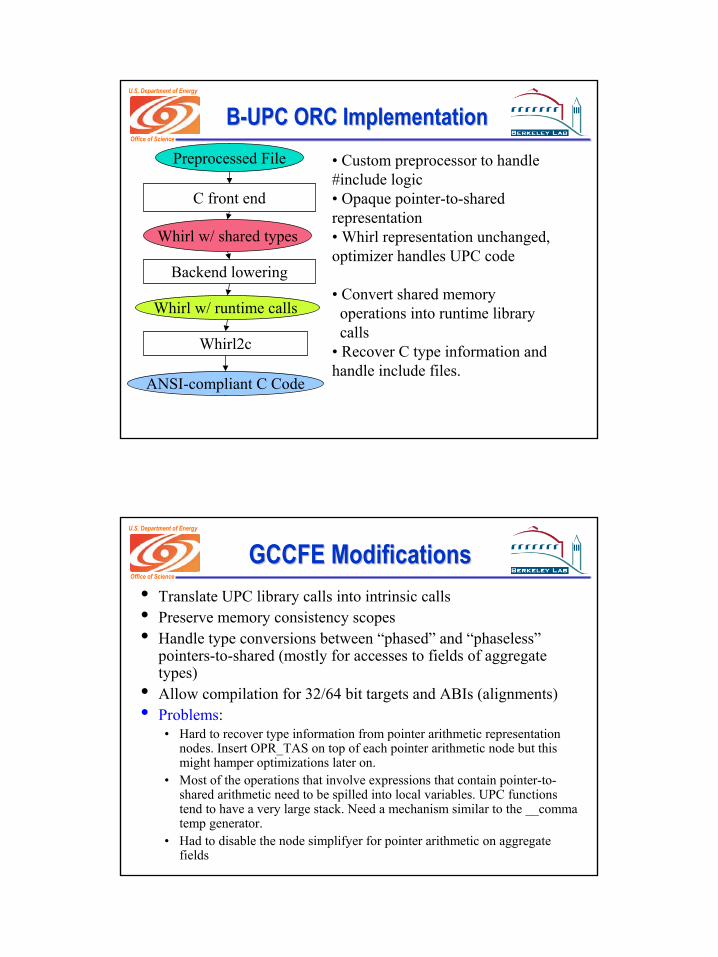
BB--UPC ORC ImplementationUPC ORC ImplementationPreprocessed File
C front end
Whirl w/ shared types
Backend lowering
Whirl w/ runtime calls
Whirl2c
ANSI-compliant C Code
• Custom preprocessor to handle #include logic• Opaque pointer-to-shared representation• Whirl representation unchanged, optimizer handles UPC code
• Convert shared memory operations into runtime library calls
• Recover C type information and handle include files.
Office of Science
U.S. Department of Energy
GCCFE Modifications GCCFE Modifications • Translate UPC library calls into intrinsic calls• Preserve memory consistency scopes • Handle type conversions between “phased” and “phaseless”
pointers-to-shared (mostly for accesses to fields of aggregate types)
• Allow compilation for 32/64 bit targets and ABIs (alignments)• Problems:
• Hard to recover type information from pointer arithmetic representation nodes. Insert OPR_TAS on top of each pointer arithmetic node but this might hamper optimizations later on.
• Most of the operations that involve expressions that contain pointer-to-shared arithmetic need to be spilled into local variables. UPC functions tend to have a very large stack. Need a mechanism similar to the __comma temp generator.
• Had to disable the node simplifyer for pointer arithmetic on aggregate fields
7
Office of Science
U.S. Department of Energy
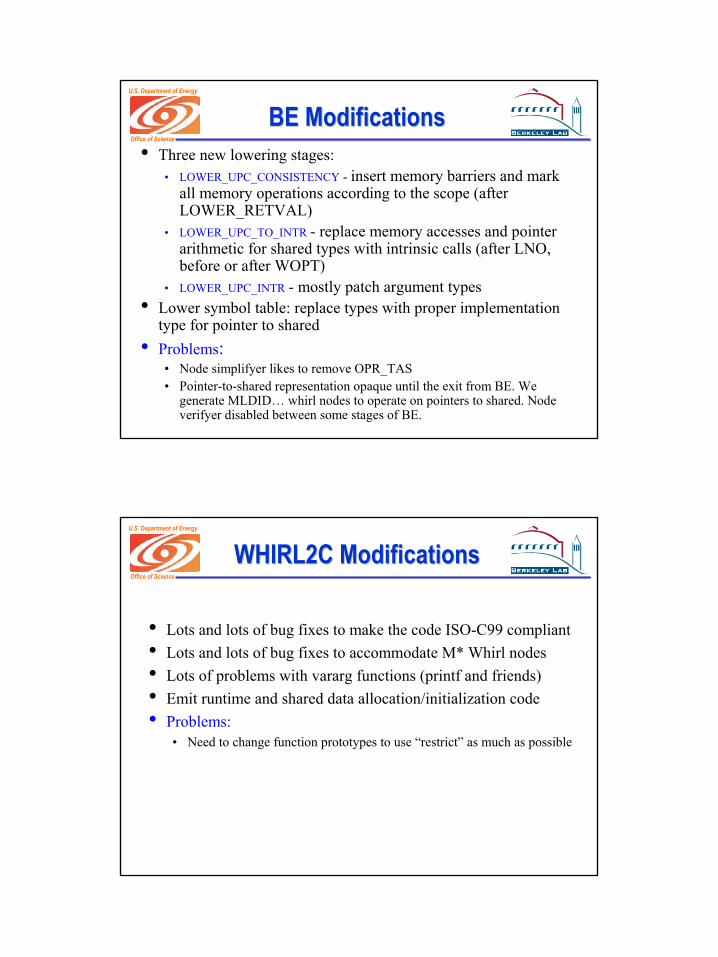
BE ModificationsBE Modifications• Three new lowering stages:
• LOWER_UPC_CONSISTENCY - insert memory barriers and mark all memory operations according to the scope (after LOWER_RETVAL)
• LOWER_UPC_TO_INTR - replace memory accesses and pointer arithmetic for shared types with intrinsic calls (after LNO, before or after WOPT)
• LOWER_UPC_INTR - mostly patch argument types • Lower symbol table: replace types with proper implementation
type for pointer to shared• Problems:
• Node simplifyer likes to remove OPR_TAS• Pointer-to-shared representation opaque until the exit from BE. We
generate MLDID… whirl nodes to operate on pointers to shared. Nodeverifyer disabled between some stages of BE.
Office of Science
U.S. Department of Energy
WHIRL2C ModificationsWHIRL2C Modifications
• Lots and lots of bug fixes to make the code ISO-C99 compliant• Lots and lots of bug fixes to accommodate M* Whirl nodes• Lots of problems with vararg functions (printf and friends) • Emit runtime and shared data allocation/initialization code• Problems:
• Need to change function prototypes to use “restrict” as much as possible
8
Office of Science
U.S. Department of Energy
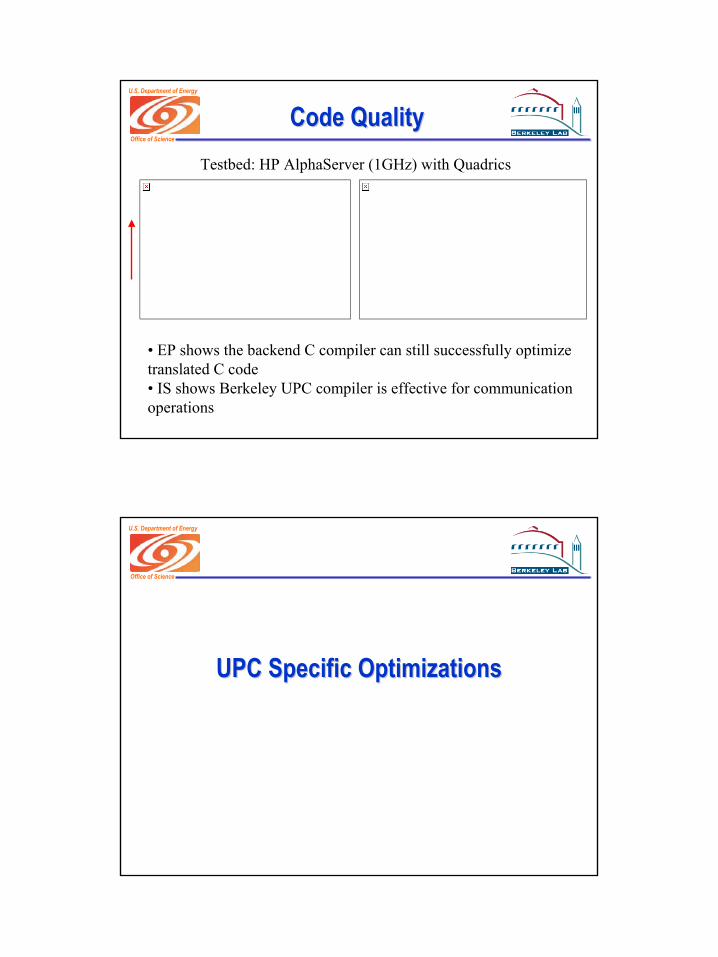
Code QualityCode Quality
• EP shows the backend C compiler can still successfully optimize translated C code• IS shows Berkeley UPC compiler is effective for communication operations
Testbed: HP AlphaServer (1GHz) with Quadrics
Office of Science
U.S. Department of Energy
UPC Specific OptimizationsUPC Specific Optimizations
9
Office of Science
U.S. Department of Energy
UPC Optimizations UPC Optimizations -- ProblemsProblems
• Shared pointer - logical tuple (addr, thread, phase){void *addr; int thread; int phase;}
• Expensive pointer arithmetic and address generationp+i -> p.phase=(p.phase+i)%Bp.thread=(p.thread+(p.phase+i)/B)%T
• Overhead of fine grained communication can become prohibitive
• Parallelism expressed by forall and affinity test - large loop initiation overhead
Office of Science
U.S. Department of Energy
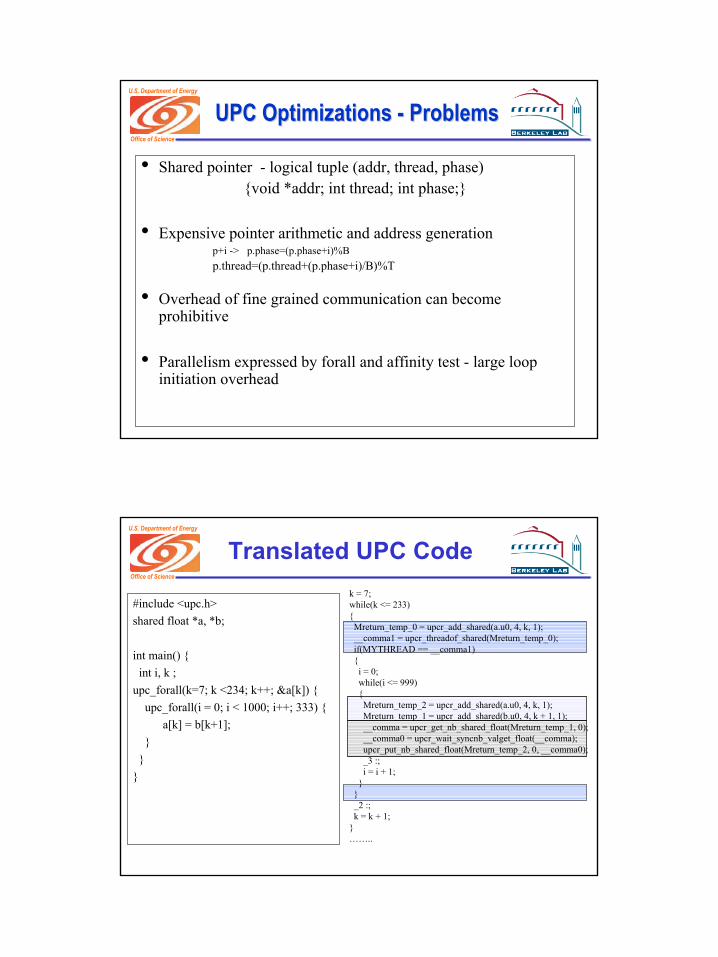
k = 7;while(k <= 233){Mreturn_temp_0 = upcr_add_shared(a.u0, 4, k, 1);__comma1 = upcr_threadof_shared(Mreturn_temp_0);if(MYTHREAD == __comma1){i = 0;while(i <= 999){Mreturn_temp_2 = upcr_add_shared(a.u0, 4, k, 1);Mreturn_temp_1 = upcr_add_shared(b.u0, 4, k + 1, 1);__comma = upcr_get_nb_shared_float(Mreturn_temp_1, 0);__comma0 = upcr_wait_syncnb_valget_float(__comma);upcr_put_nb_shared_float(Mreturn_temp_2, 0, __comma0);_3 :;i = i + 1;
}}_2 :;k = k + 1;
}……..
#include <upc.h>shared float *a, *b;
int main() {int i, k ;
upc_forall(k=7; k <234; k++; &a[k]) {upc_forall(i = 0; i < 1000; i++; 333) {
a[k] = b[k+1];}
}}
Translated UPC Code
10
Office of Science
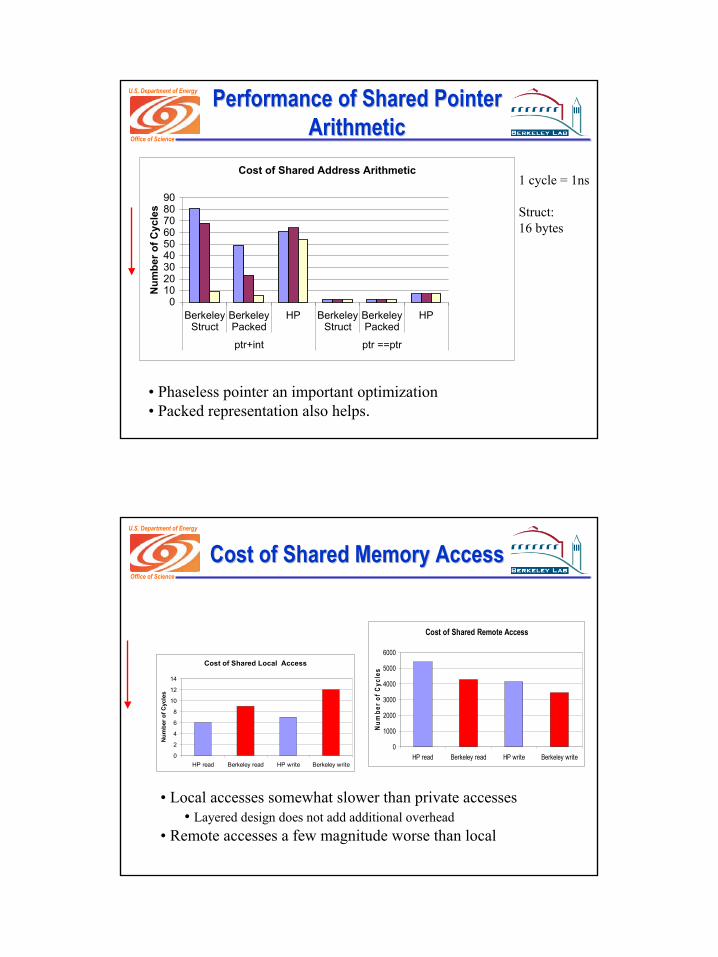
U.S. Department of Energy Performance of Shared Pointer Performance of Shared Pointer ArithmeticArithmetic
• Phaseless pointer an important optimization• Packed representation also helps.
1 cycle = 1ns
Struct: 16 bytes
Cost of Shared Address Arithmetic
0102030405060708090
BerkeleyStruct
BerkeleyPacked
HP BerkeleyStruct
BerkeleyPacked
HP
ptr+int ptr ==ptr
Num
ber o
f Cyc
les
Office of Science
U.S. Department of Energy
Cost of Shared Memory AccessCost of Shared Memory Access
• Local accesses somewhat slower than private accesses• Layered design does not add additional overhead
• Remote accesses a few magnitude worse than local
Cost of Shared Local Access
0
2
4
6
8
10
12
14
HP read Berkeley read HP write Berkeley write
Num
ber o
f Cyc
les
Cost of Shared Remote Access
0
1000
2000
3000
4000
5000
6000
HP read Berkeley read HP write Berkeley write
Num
ber o
f Cyc
les
11
Office of Science
U.S. Department of Energy
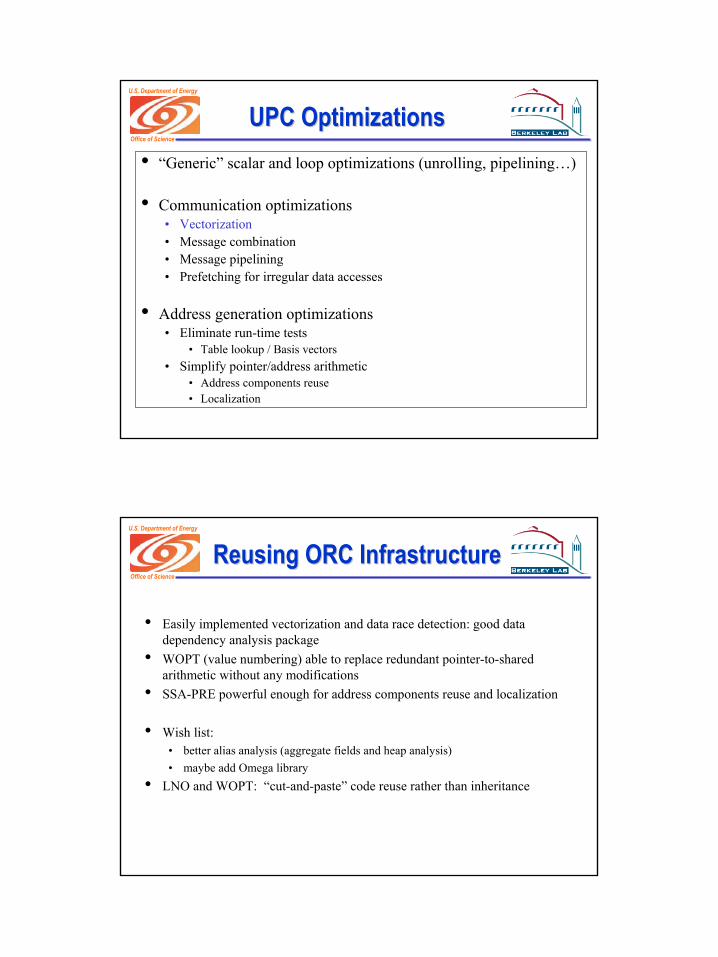
UPC OptimizationsUPC Optimizations• “Generic” scalar and loop optimizations (unrolling, pipelining…)
• Communication optimizations• Vectorization• Message combination• Message pipelining• Prefetching for irregular data accesses
• Address generation optimizations• Eliminate run-time tests
• Table lookup / Basis vectors• Simplify pointer/address arithmetic
• Address components reuse• Localization
Office of Science
U.S. Department of Energy
Reusing ORC InfrastructureReusing ORC Infrastructure
• Easily implemented vectorization and data race detection: good data dependency analysis package
• WOPT (value numbering) able to replace redundant pointer-to-shared arithmetic without any modifications
• SSA-PRE powerful enough for address components reuse and localization
• Wish list:• better alias analysis (aggregate fields and heap analysis)• maybe add Omega library
• LNO and WOPT: “cut-and-paste” code reuse rather than inheritance

12
Office of Science
U.S. Department of Energy Case Study:Case Study:Message Strip MiningMessage Strip Mining
• Message vectorization is the optimization with highest impact
• Computation loop has to wait for completion of message transfer• Idea: decompose transfer into a sequence of sub-transfers and
skew loop execution to overlap communication with computation(Wakatani&Wolfe)
• Can combine with loop unrolling for better overlap
shared [] float *p;…for(i=0; i < N; i++)
…= p[i];
shared [] float *p;float *buf…get(buf,p,N*8);for(i=0;i<N;i++)…=buf[i];
Office of Science
U.S. Department of Energy
Message Strip MiningMessage Strip Mining
h0 = nbget(buf, p, S);for(i=0; i < N; i+=S)h1 = nbget(buf+S*(i+1),p+S*(i+1),S);sync(h0);for(ii=i; ii < min(...); ii++)
...=buf[ii];h0=h1;
h[0] = nbget(buf,p,S)for(i=0; i < N; i += S*U)
h[1] = nbget(...,S);...h[U] = nbget(..., S);sync(h[0]);for(ii=i; ii < S; ii++)...=buf[ii];
.....sync(h[U-1]);for(....)h[0] = h[U];
Message strip mined loopCombining loop unrolling withmessage strip mining
13
Office of Science
U.S. Department of Energy
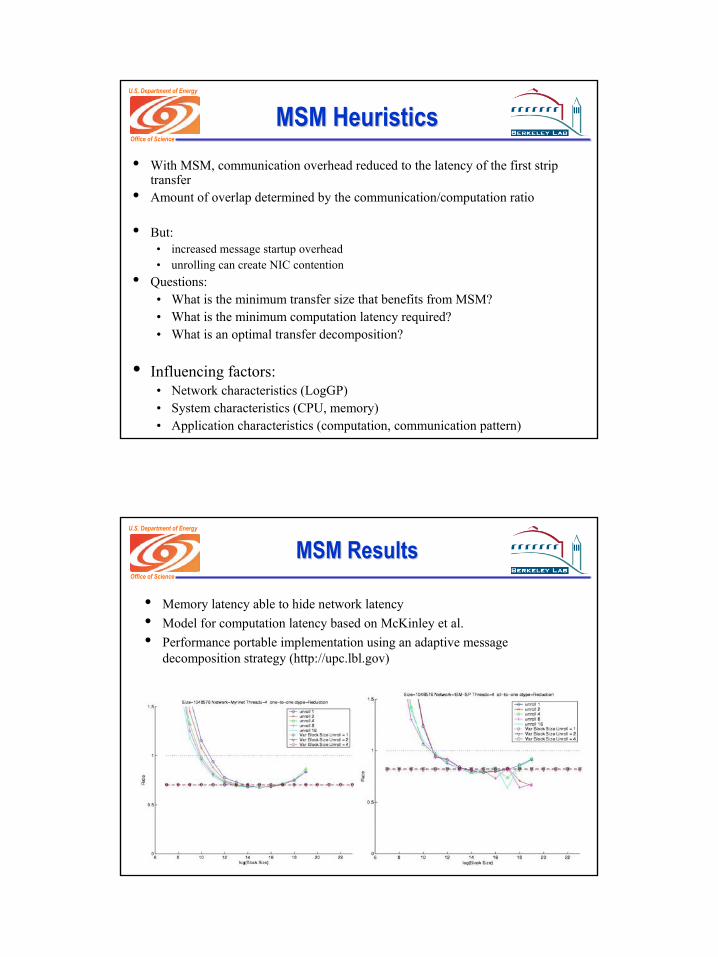
MSM HeuristicsMSM Heuristics• With MSM, communication overhead reduced to the latency of the first strip
transfer• Amount of overlap determined by the communication/computation ratio
• But:• increased message startup overhead• unrolling can create NIC contention
• Questions:• What is the minimum transfer size that benefits from MSM?• What is the minimum computation latency required?• What is an optimal transfer decomposition?
• Influencing factors:• Network characteristics (LogGP)• System characteristics (CPU, memory)• Application characteristics (computation, communication pattern)
Office of Science
U.S. Department of Energy
MSM ResultsMSM Results
• Memory latency able to hide network latency• Model for computation latency based on McKinley et al.• Performance portable implementation using an adaptive message
decomposition strategy (http://upc.lbl.gov)