Embed Size (px)
Citation preview
HAL Id: inserm-00622568https://www.hal.inserm.fr/inserm-00622568
Submitted on 12 Sep 2011
HAL is a multi-disciplinary open accessarchive for the deposit and dissemination of sci-entific research documents, whether they are pub-lished or not. The documents may come fromteaching and research institutions in France orabroad, or from public or private research centers.
L’archive ouverte pluridisciplinaire HAL, estdestinée au dépôt et à la diffusion de documentsscientifiques de niveau recherche, publiés ou non,émanant des établissements d’enseignement et derecherche français ou étrangers, des laboratoirespublics ou privés.
Micro computed tomography for vascular exploration.Lyubomir Zagorchev, Pierre Oses, Zhen Zhuang, Karen Moodie, Mary
Mulligan-Kehoe, Michael Simons, Thierry Couffinhal
To cite this version:Lyubomir Zagorchev, Pierre Oses, Zhen Zhuang, Karen Moodie, Mary Mulligan-Kehoe, et al.. Microcomputed tomography for vascular exploration.. Journal of Angiogenesis Research, 2010, 2 (1), pp.7.<10.1186/2040-2384-2-7>. <inserm-00622568>

REVIEW Open Access
Micro computed tomography forvascular explorationLyubomir Zagorchev1,2,3,4, Pierre Oses5,6, Zhen W Zhuang7, Karen Moodie1,2, Mary Jo Mulligan-Kehoe1,8,
Michael Simons7, Thierry Couffinhal5,6*
Abstract
Vascular exploration of small animals requires imaging hardware with a very high spatial resolution, capable of
differentiating large as well as small vessels, in both in vivo and ex vivo studies. Micro Computed Tomography
(micro-CT) has emerged in recent years as the preferred modality for this purpose, providing high resolution 3D
volumetric data suitable for analysis, quantification, validation, and visualization of results. The usefulness of
micro-CT, however, can be adversely affected by a range of factors including physical animal preparation, numeri-
cal quantification, visualization of results, and quantification software with limited possibilities. Exacerbating these
inherent difficulties is the lack of a unified standard for micro-CT imaging. Most micro-CT today is aimed at particu-
lar applications and the software tools needed for quantification, developed mainly by imaging hardware manufac-
turers, lack the level of detail needed to address more specific aims. This review highlights the capabilities of
micro-CT for vascular exploration, describes the current state of imaging protocols, and offers guidelines and
suggestions aimed at making micro-CT more accurate, replicable, and robust.
IntroductionMicro Computed Tomography (micro-CT) presents
unique opportunities for highly quantitative three
dimensional imaging of models of disease implanted or
induced in animal models. It is a structural imaging
modality that can differentiate contrast-enhanced tissues
or structures with high attenuation factors from non-
enhanced soft tissues. Traditional use of micro-CT
includes in vivo and ex vivo imaging applications such
as screening for anatomical abnormalities and detection
and quantification of anatomical changes in live animals
or tissue samples removed from sacrificed animals.
Micro-CT also plays an increasingly important role in
the study of angiogenesis, a process that occurs naturally
during development, tissue repair or abnormally in
pathologic diseases.
Studying vascular development or the mechanisms of
neovascularisation (angiogenesis, arteriogenesis or vascu-
logenesis) and evaluating the effects of pro or anti-
angiogenic strategies require complete and accurate ana-
lysis of the neoformed vascular network. However,
methods of assessment, such as histology with confocal
or two-photon microscopy, laser Doppler, microangio-
graphy, fluorescent microspheres, magnetic resonance
angiography, positron emission tomography, are not
always precise or quantitative; they focus on a limited
area of study, reveal capillary density primarily in 2
dimensions, and represent superficial blood flow (for
details see review [1]). Currently, micro-CT is the only
structural imaging modality that provides a high resolu-
tion volumetric representation of vascular structures
that directly reflects the level of angiogenesis or inhibi-
tion/development of neo-vasculature. In combination
with functional information from other imaging modal-
ities such as fNMR, MicroPET, Ultrasound, or micro-
scopy, micro-CT has the potential to advance the
angiogenesis related research even further [2].
The spatial resolution of micro-CT volumes strictly
depends on the X-ray source/detector geometry, which
is dictated by the type of scanner. Currently, typical in
vivo micro-CT scanners have resolutions ranging from
100 to 30 μm, while ex vivo scanners have resolutions
from 30 to 1 μm.
In this review, mainly focused on micro-CT analysis of
angiogenesis, we will describe standard protocols for
animal preparation and the properties of contrast agents
* Correspondence: [email protected] U828, Plateforme d’Innovation Biotechnologique de Xavier Arnozan,
Université Victor Ségalen Bordeaux 2, Pessac, France
Zagorchev et al. Journal of Angiogenesis Research 2010, 2:7
http://www.jangiogenesis.com/content/2/1/7 JOURNAL OF
ANGIOGENESIS RESEARCH
© 2010 Zagorchev et al; licensee BioMed Central Ltd. This is an Open Access article distributed under the terms of the CreativeCommons Attribution License (http://creativecommons.org/licenses/by/2.0), which permits unrestricted use, distribution, andreproduction in any medium, provided the original work is properly cited.
and vehicles to properly visualize vessels. The successive
steps of image analysis, traps, and difficulties of quantifi-
cation will be thoroughly detailed. Current limitations of
micro-CT in vascular research will be addressed. We
will also discuss other vascular applications and uses of
micro-CT and perspective of its vascular application.
Standard protocols for animal preparationAs with all imaging methods, animal positioning and
preparation (pressure and or volume of infused con-
trast and solutions) should be as uniform as possible.
In general, the animal is heparinized (100 IU/Kg ip)
and deeply anesthetized (Ketamine/Xylazine 100 mg/
kg/10 mg/kg). The animal is fixed into position on its
back. When filling vessels for hindlimb ischemia or
flank tumor analysis, the chest is opened and a cannula
is sutured into the descending aorta with the tip of the
needle facing the tail. The inferior vena cava is cut to
allow infused solutions to exit the body. When filling
the aorta for imaging of vasa vasorum, we have found
that placing the cannula into the left ventricle and into
the ascending aorta followed by a suture to hold this
in place and prevent contrast from leading backwards
works well. It may be helpful to notch the cannula cir-
cumferentially to hold the suture in place on the ves-
sel. Filling of the heart vessels may be done by placing
the cannula retrograde into the thoracic aorta. The
contrast does not enter the left ventricle with an intact
aortic valve, yielding a cleaner image. Saline solution
(37°C, containing vasodilating agents such as adenosine
and papaverin) is infused at 100 mmHg for 3 minutes
to clear the specimen of blood and dilate the vessels to
assist in maximum filling. At this point fixation with
2-4% paraformaldehyde may be desired. Fixation will
allow for specimen preservation but may shrink vessels
thus reducing filling of smaller vessels. The specimen
is then ready for contrast infusion. Care should be
taken to minimize bubbles in the fluid line as this may
block filling of smaller vessels. For complete filling of
vessels (arteries and veins), it is desirable to continue
infusion of contrast past the point when it can be seen
exiting the vena cava. If arterial filling alone is desired,
it is necessary to administer a controlled volume of
contrast agent and to use an agent that can be solidi-
fied rapidly when the agent has filled the desired vas-
culature. Also, it is important to limit the vessels that
are damaged during animal preparation as the contrast
will leak out of severed vessels changing the pressure
and volume that are required for complete filling.
Once the vasculature is filled and the contrast solidi-
fied, the specimen can be imaged immediately. Alter-
natively, the specimen may be placed in a suitable
fixative (10% formalin, PFA Zinc, etc.).
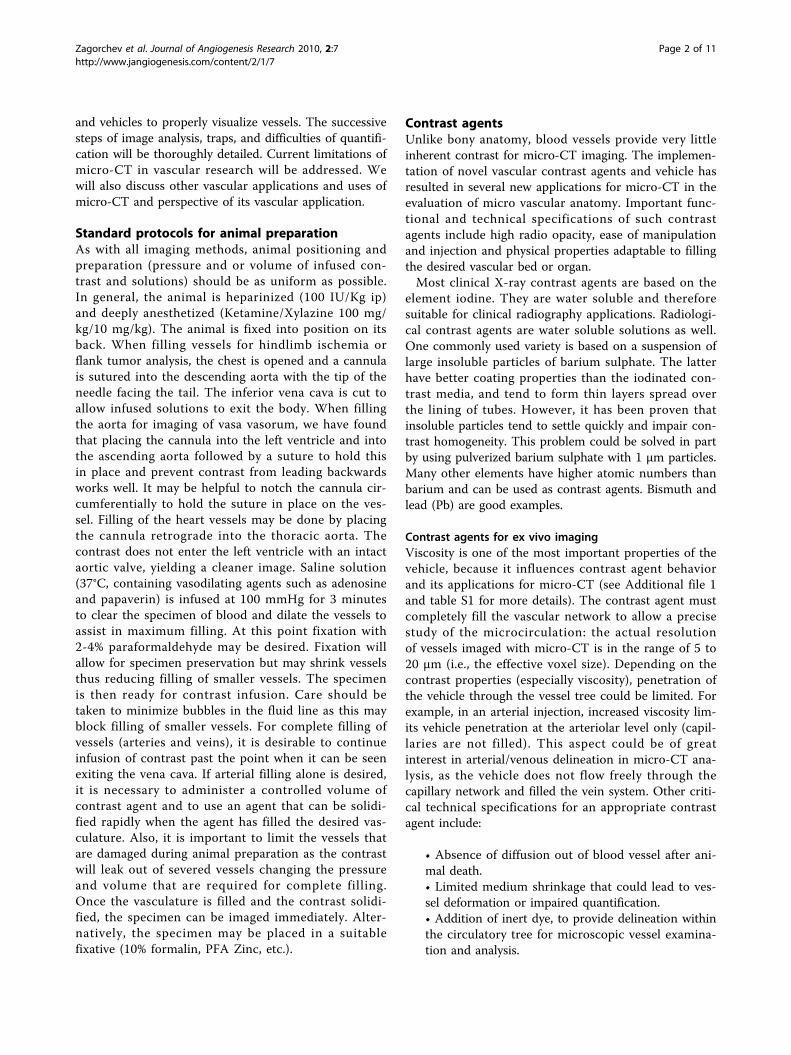
Contrast agentsUnlike bony anatomy, blood vessels provide very little
inherent contrast for micro-CT imaging. The implemen-
tation of novel vascular contrast agents and vehicle has
resulted in several new applications for micro-CT in the
evaluation of micro vascular anatomy. Important func-
tional and technical specifications of such contrast
agents include high radio opacity, ease of manipulation
and injection and physical properties adaptable to filling
the desired vascular bed or organ.
Most clinical X-ray contrast agents are based on the
element iodine. They are water soluble and therefore
suitable for clinical radiography applications. Radiologi-
cal contrast agents are water soluble solutions as well.
One commonly used variety is based on a suspension of
large insoluble particles of barium sulphate. The latter
have better coating properties than the iodinated con-
trast media, and tend to form thin layers spread over
the lining of tubes. However, it has been proven that
insoluble particles tend to settle quickly and impair con-
trast homogeneity. This problem could be solved in part
by using pulverized barium sulphate with 1 μm particles.
Many other elements have higher atomic numbers than
barium and can be used as contrast agents. Bismuth and
lead (Pb) are good examples.
Contrast agents for ex vivo imaging
Viscosity is one of the most important properties of the
vehicle, because it influences contrast agent behavior
and its applications for micro-CT (see Additional file 1
and table S1 for more details). The contrast agent must
completely fill the vascular network to allow a precise
study of the microcirculation: the actual resolution
of vessels imaged with micro-CT is in the range of 5 to
20 μm (i.e., the effective voxel size). Depending on the
contrast properties (especially viscosity), penetration of
the vehicle through the vessel tree could be limited. For
example, in an arterial injection, increased viscosity lim-
its vehicle penetration at the arteriolar level only (capil-
laries are not filled). This aspect could be of great
interest in arterial/venous delineation in micro-CT ana-
lysis, as the vehicle does not flow freely through the
capillary network and filled the vein system. Other criti-
cal technical specifications for an appropriate contrast
agent include:
• Absence of diffusion out of blood vessel after ani-
mal death.
• Limited medium shrinkage that could lead to ves-
sel deformation or impaired quantification.
• Addition of inert dye, to provide delineation within
the circulatory tree for microscopic vessel examina-
tion and analysis.
Zagorchev et al. Journal of Angiogenesis Research 2010, 2:7
http://www.jangiogenesis.com/content/2/1/7
Page 2 of 11

• Ease of manipulation and injection in small
animals.
• Homogeneity of contrast agent solution
Silicone rubber has been extensively used as a filling
agent to study micro-vasculature, because of its inert
properties. A lead-containing radiopaque silicone rubber
called Microfil (Microfil, Flow Tech, Carver, MA) has
been widely reported in micro-CT studies [3]. It has a
low viscosity that allows it to fill completely the vascular
compartments with little resistance [4,5]. Coming from
different reports, this compound completely fills the
arterial vasculature when perfused at physiological pres-
sure and flows freely from the veins [6,7]. The hydro-
phobic properties of silicone rubber keep it contained
within the vascular compartment, and extravasation has
only been reported in situations such as inflammation
where physical leaks are present [6].
Neoprene latex 671 (Dupont de Nemours) is a liquid
synthetic rubber composed of polychloroprene homopo-
lymer with high tensile strength, high elongation, excel-
lent film formation without curing, and considerable
resistance to degradation from chemical or environmen-
tal exposure. Because of its low viscosity, this compound
fills the arterial vasculature down to 20 μm size vessels
when it is perfused at physiological pressure. In our
experiments, we never observed any extravasation of
latex in tissue or any vessel damage due to neoprene
polymerization [8].
Gelatin at 5 to 10% concentration has also been used
as a vehicle compound with bismuth or barium sulfate
[9,10]. This enabled complete filling of entire microvas-
culature under physiologically relevant perfusion pres-
sure [11]. Other groups have used Batson’s No. 17
polymethylmethacrylate with an added lead pigment [9].
Contrast agents for in vivo imaging
It is not uncommon for in vivo studies to take 30-120
minutes. Such long scan times necessitate either a long-
circulating contrast agent or continuous infusion of con-
trast material. Contrast agents used for in vivo imaging
can be administered repeatedly to the animal, eliminat-
ing the need to sacrifice and assay multiple animals at
various time points in longitudinal studies.
Different groups report the use of conventional iodi-
nated vascular contrast agent encapsulated within poly-
ethylene glycol-stabilized liposomes, showing stable
enhancement of the intravascular space for more than 3
hr [12]. The Fenestra product line is based on iodinated
triglycerides contained in the lipophilic cores of oil-in-
water lipid emulsions similar to the naturally-occurring
chylomicron remnants. It provides long-lasting visualiza-
tion of vascular systems with micro-CT. Others have
used pluronic F127 and a naturally iodinated compound,
Lipiodol to form radiopaque nanoreservoir structures
with good success [13].
Collectively, the vasculature can be efficiently explored
with a combination of contrast agent and vehicle. Nota-
bly, it should be pointed out that the ease of handling is
another critical parameter. Investigators could modulate
the viscosity of the injected compound depending on
the target organ and the vascular bed that require filling.
Image analysisWith the help of contrast agents, micro-CT scanners
provide high resolution structural 3D information of
blood vessels and offer unique opportunities for ima-
ging, quantification, and analysis of various vascular
structures. A number of examples demonstrating the
resolution and capabilities of micro-CT are shown in
Figures 1 and 2. Image analysis of micro-CT involves
techniques such as registration, segmentation, quantifi-
cation, and visualization.
Image registration
Image registration computes a transformation or a
deformation field that can be applied to one volume to
align with another [14-18]. Specifically, functional ima-
ging modalities such as microPET or SPECT reveal
valuable insights into biochemical, physiological, and
pharmacological processes in vivo. Their major limita-
tion, however, is the lack of high spatial resolution and
detailed anatomical or vascular information. This pro-
blem that can be easily alleviated by using complemen-
tary information provided by micro-CT and image
registration. As illustrated in Figure 3, functional activity
can be overlaid with structural information from micro-
CT for more detailed analysis and validation of results.
Segmentation
Segmentation is an image processing technique that par-
titions an image into meaningful regions or structures of
interest. The goal of segmentation is to separate the
image points representing a particular object from the
rest of the image. Similar to registration, it is another
fundamental machine vision task that prepares an image
for subsequent quantification and analysis [18]. Among
the most common applications of segmentation for
micro-CT are studies aimed at anatomical structures,
vasculature, and pathologic diseases.
The result of image segmentation is a set of image
points representing one or multiple objects. The image
points are clustered together based on some common
property such as intensity or variation of its rate of
change over an image region. Depending on the
approach, segmentation could be performed directly on
the raw image data or during its visualization and
volume rendering. Depending on the user interaction
Zagorchev et al. Journal of Angiogenesis Research 2010, 2:7
http://www.jangiogenesis.com/content/2/1/7
Page 3 of 11

and implementation, it could be either manual or auto-
matic. In manual segmentation, the user interactively
traces contours in 2D micro-CT slices to delineate a
region of interest and stack the 2D slices in 3D to form
the segmented volume. Although this is a very robust
approach that works well even with low image quality
and little contrast between image structures, it is a
tedious and time consuming task better suited for
convex or round shaped objects. An automated and
robust approach to segmentation is required for more
complex objects, such as blood vessels or vascular vessel
trees. Thresholding is an image processing technique
that tries to separate an object based on its intensity
values by setting all image points below and/or above a
threshold of certain intensity [18]. It is simple and
works well if there is a sharp change of intensity on the
Figure 2 Examples of different micro-CT applications: A) atherosclerotic plaque and vasa vasorum in the descending aorta in mice, and
B) vascular tree of a mouse kidney.
Figure 1 Micro-CT imaging of a pancreatic tumor vasculature. Micro-CT images of a pancreatic tumor harvested from the flank of an
athymic mouse. The mouse was perfused with Microfil and imaged at 6.5 microns. A. Capillary blood vessels appear in white on the three
orthogonal cross-sections of the volume. B) Surface rendering of the micro-CT volume.
Zagorchev et al. Journal of Angiogenesis Research 2010, 2:7
http://www.jangiogenesis.com/content/2/1/7
Page 4 of 11

boundary of the object and the surrounding image
points. It is not very reliable in cases where the object’s
intensity values merge with the background. One way to
increase the contrast of blood vessels in micro-CT is to
adjust the concentration of contrast agent. Denser con-
trast agents result in higher intensity, which differenti-
ates vessels from background, and vice versa. More
complex techniques based on partial differential equa-
tions modeling physical processes and deformable
shapes have also been developed [18]. The best
approach depends mainly on the quality of the micro-
CT volume. Factors that should be considered are: how
well the object of interest stands out from the back-
ground, complexity of the structure of interest, reliability
and repeatability of the approach.
Quantification
Since its introduction, software post processing for pre-
clinical micro-CT has posed the widespread acceptance
of the need for objective, accurate, and reproducible
quantification of results rather than manual
measurement.
General techniques for quantification of micro-CT
volumes include combinations of morphometric and
fractal analysis. Morphometry is the quantitative mea-
surement of structures. Morphometric parameters such
as volume, area, connectivity, thickness, and degree of
anisotropy are standard for analysis of trabecular bone
microstructure [19,20], and were recently applied for
quantification of blood vessels [10,21-23]. The morpho-
metric parameters are primarily computed after dimen-
sional reduction of the 3D micro-CT volumes to 2D
sections [10,21,23]. Basic morphometric parameters,
such as vessel volume, have also been computed directly
from the 3D micro-CT volumes [22]. Depending on
how the 2D sections are obtained, the resulting morpho-
metric parameters can be used to reconstruct the mor-
phometric parameters in 3D, which provides a 3D
interpretation of the planar sections [23] or direct quan-
titative measures from 2D [10,21]. The measurement of
morphometric parameters is relatively simple and is
generally carried out as an arithmetical operation over a
thresholded binary image that yields information on the
properties of the structure of interest.
Fractal analysis has also been used to quantify com-
plex geometric structures in micro-CT volumes [24,25].
A fractal is a quantity that provides a measure of the
“self-similarity” of an object at different scales. The
more complex the object, the more space it fills. An
excellent review of the technique is provided by Baish et
al [26]. The calculation of the fractal dimension in
micro-CT is straightforward and is performed by thresh-
olding the micro-CT volume to segment out the object
of interest and counting the number of voxels represent-
ing the object at different scales. A multi-scale fractal
analysis of microvascular networks in the brain showed
that normal cortical vascular networks have scale-invar-
iant fractal properties on a small local scale as described
by Risser et al [27].
Quantification of neovasculature with Micro-CT
Development of therapeutic angiogenesis/arteriogenesis
is a frequent goal for ischemic disease research pro-
grams, therefore, effort has been put forward in recent
years to develop various methods for quantification of
Figure 3 PET-CT image reconstruction: effect of image registration. Micro-CT combined with micro-PET before image registration (panel A)
and after (Panel B).
Zagorchev et al. Journal of Angiogenesis Research 2010, 2:7
http://www.jangiogenesis.com/content/2/1/7
Page 5 of 11

neovascularization [21,22,28]. Radiological quantification
of angiogenesis/arteriogenesis provides a significant
improvement in the tools available for studying and
understanding the mechanism of neovascularization.
Unfortunately, as illustrated in Figure 4, commercially
available in vivo contrast agents do not provide enough
contrast necessary to visualize small angiogenic vessels,
even at the high special resolution of in vivo micro-CT
scanners. While in vivo experiments are a key goal in
vascular imaging, ex vivo experiments at present result
in much more meaningful data, a consequence of better
contrast agents, longer acquisition times, and higher
X-ray doses. Specimen micro-CT scanners have a high
spatial resolution, which combined with ex vivo contrast
agents provides a robust methodology for evaluation of
intact vascular networks [21,22,29]. Although 3D locali-
zation and visualization are important, the power of vas-
cular imaging methods lies in their quantitative analysis,
which includes characterization and measurement of dif-
ferent parameters, such as connectivity, anisotropy,
thickness distribution, as well as cross-sectional area
and volume.
2D serial section analysis
Due to large volume size (108-1010 voxels), processing,
transmitting, and archiving of micro-CT data as well as its
intelligent analysis within a reasonable time frame is a real
challenge. An efficient 2D serial section analysis method
was initially proposed by Li W, et al [21]. A global thresh-
old to visualize 2D vasculature and eliminate bone using a
modified Image Pro-Plus 5.0 algorithm (Media Cyber-
netics, Silver Spring, MD) was applied to 500 serial slices
from the upper limb and 250 serial slices from the lower
limb to segment and expressed the data as vascular seg-
ment number and volume. The algorithm was built within
the AutoPro programming language (Visual Basic SAX
engine) inside Image-Pro Plus. They summed up serial 2D
imaging information to the 3D volume.
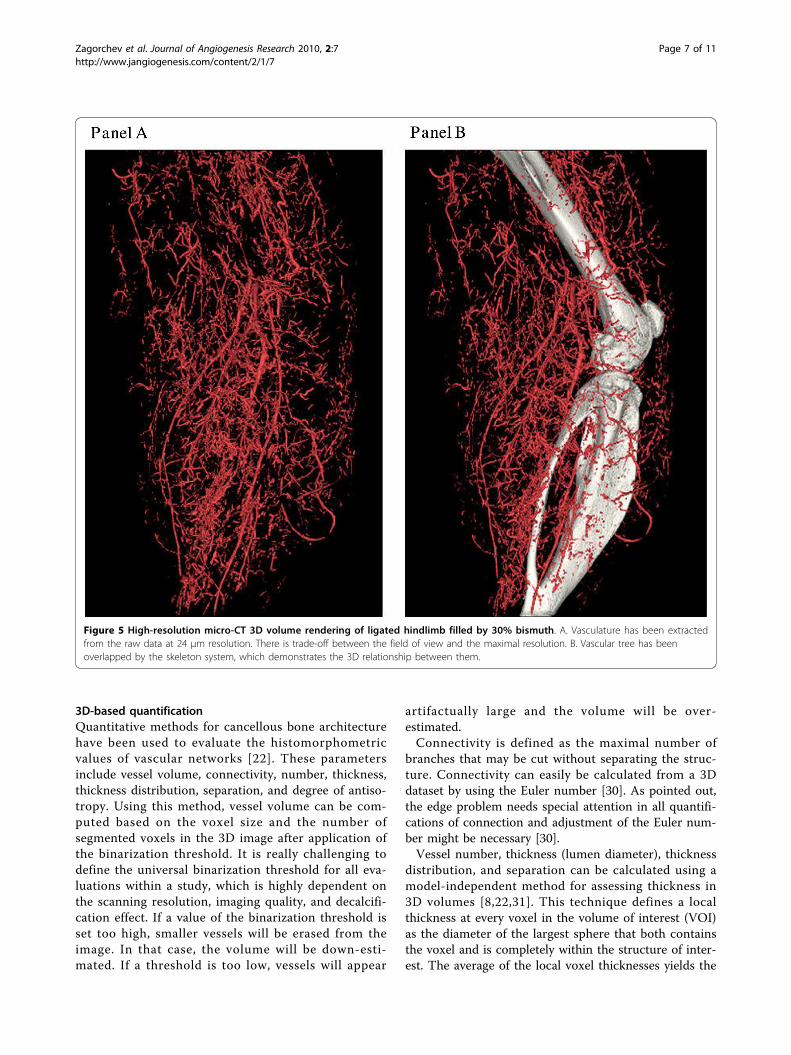
As illustrated in Figure 5, Zhuang and colleagues have
successfully established the dynamic 3D geometry of the
entire peripheral arterial tree in a mouse hindlimb [28].
The major focus now is to develop an automated algo-
rithm to extract detailed morphometric data such as the
diameters, area, number of vessels, and distributions of
different size of vessels. Ideally, such methods for vascu-
lar analysis of micro-CT would involve five principle
steps: 1) segmentation of arteries from bone and con-
taminated venous system; 2) re-creation of the 3D vas-
cular tree according to a re-orientated central line along
the long axis of the major vessels (femoral or anterior
tibial artery); 3) evaluation of the mean diameter and
cross-sectional area of the segmented branches in each
slice; 4) estimation of the distribution of the diameter of
blood vessels into different groups; and 5) computation
of the total area and volume in the serial slices of both
upper and lower limbs.
Figure 4 In vivo micro-CT of a mouse injected with 0.4 mL of Fenestra VC. A maximum intensity projection is shown in A and its volume
rendering in B. The contrast is not sufficinet to visualize small vessels.
Zagorchev et al. Journal of Angiogenesis Research 2010, 2:7
http://www.jangiogenesis.com/content/2/1/7
Page 6 of 11
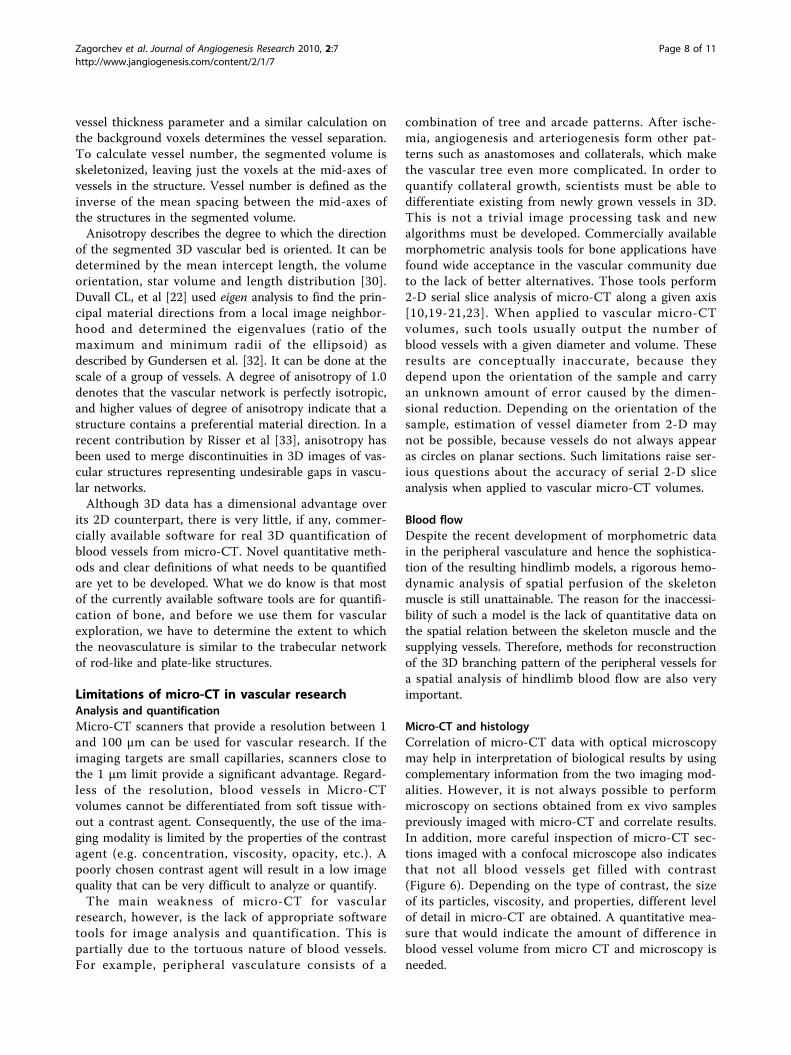
3D-based quantification
Quantitative methods for cancellous bone architecture
have been used to evaluate the histomorphometric
values of vascular networks [22]. These parameters
include vessel volume, connectivity, number, thickness,
thickness distribution, separation, and degree of antiso-
tropy. Using this method, vessel volume can be com-
puted based on the voxel size and the number of
segmented voxels in the 3D image after application of
the binarization threshold. It is really challenging to
define the universal binarization threshold for all eva-
luations within a study, which is highly dependent on
the scanning resolution, imaging quality, and decalcifi-
cation effect. If a value of the binarization threshold is
set too high, smaller vessels will be erased from the
image. In that case, the volume will be down-esti-
mated. If a threshold is too low, vessels will appear
artifactually large and the volume will be over-
estimated.
Connectivity is defined as the maximal number of
branches that may be cut without separating the struc-
ture. Connectivity can easily be calculated from a 3D
dataset by using the Euler number [30]. As pointed out,
the edge problem needs special attention in all quantifi-
cations of connection and adjustment of the Euler num-
ber might be necessary [30].
Vessel number, thickness (lumen diameter), thickness
distribution, and separation can be calculated using a
model-independent method for assessing thickness in
3D volumes [8,22,31]. This technique defines a local
thickness at every voxel in the volume of interest (VOI)
as the diameter of the largest sphere that both contains
the voxel and is completely within the structure of inter-
est. The average of the local voxel thicknesses yields the
Figure 5 High-resolution micro-CT 3D volume rendering of ligated hindlimb filled by 30% bismuth. A. Vasculature has been extracted
from the raw data at 24 μm resolution. There is trade-off between the field of view and the maximal resolution. B. Vascular tree has been
overlapped by the skeleton system, which demonstrates the 3D relationship between them.
Zagorchev et al. Journal of Angiogenesis Research 2010, 2:7
http://www.jangiogenesis.com/content/2/1/7
Page 7 of 11
vessel thickness parameter and a similar calculation on
the background voxels determines the vessel separation.
To calculate vessel number, the segmented volume is
skeletonized, leaving just the voxels at the mid-axes of
vessels in the structure. Vessel number is defined as the
inverse of the mean spacing between the mid-axes of
the structures in the segmented volume.
Anisotropy describes the degree to which the direction
of the segmented 3D vascular bed is oriented. It can be
determined by the mean intercept length, the volume
orientation, star volume and length distribution [30].
Duvall CL, et al [22] used eigen analysis to find the prin-
cipal material directions from a local image neighbor-
hood and determined the eigenvalues (ratio of the
maximum and minimum radii of the ellipsoid) as
described by Gundersen et al. [32]. It can be done at the
scale of a group of vessels. A degree of anisotropy of 1.0
denotes that the vascular network is perfectly isotropic,
and higher values of degree of anisotropy indicate that a
structure contains a preferential material direction. In a
recent contribution by Risser et al [33], anisotropy has
been used to merge discontinuities in 3D images of vas-
cular structures representing undesirable gaps in vascu-
lar networks.
Although 3D data has a dimensional advantage over
its 2D counterpart, there is very little, if any, commer-
cially available software for real 3D quantification of
blood vessels from micro-CT. Novel quantitative meth-
ods and clear definitions of what needs to be quantified
are yet to be developed. What we do know is that most
of the currently available software tools are for quantifi-
cation of bone, and before we use them for vascular
exploration, we have to determine the extent to which
the neovasculature is similar to the trabecular network
of rod-like and plate-like structures.
Limitations of micro-CT in vascular researchAnalysis and quantification
Micro-CT scanners that provide a resolution between 1
and 100 μm can be used for vascular research. If the
imaging targets are small capillaries, scanners close to
the 1 μm limit provide a significant advantage. Regard-
less of the resolution, blood vessels in Micro-CT
volumes cannot be differentiated from soft tissue with-
out a contrast agent. Consequently, the use of the ima-
ging modality is limited by the properties of the contrast
agent (e.g. concentration, viscosity, opacity, etc.). A
poorly chosen contrast agent will result in a low image
quality that can be very difficult to analyze or quantify.
The main weakness of micro-CT for vascular
research, however, is the lack of appropriate software
tools for image analysis and quantification. This is
partially due to the tortuous nature of blood vessels.
For example, peripheral vasculature consists of a
combination of tree and arcade patterns. After ische-
mia, angiogenesis and arteriogenesis form other pat-
terns such as anastomoses and collaterals, which make
the vascular tree even more complicated. In order to
quantify collateral growth, scientists must be able to
differentiate existing from newly grown vessels in 3D.
This is not a trivial image processing task and new
algorithms must be developed. Commercially available
morphometric analysis tools for bone applications have
found wide acceptance in the vascular community due
to the lack of better alternatives. Those tools perform
2-D serial slice analysis of micro-CT along a given axis
[10,19-21,23]. When applied to vascular micro-CT
volumes, such tools usually output the number of
blood vessels with a given diameter and volume. These
results are conceptually inaccurate, because they
depend upon the orientation of the sample and carry
an unknown amount of error caused by the dimen-
sional reduction. Depending on the orientation of the
sample, estimation of vessel diameter from 2-D may
not be possible, because vessels do not always appear
as circles on planar sections. Such limitations raise ser-
ious questions about the accuracy of serial 2-D slice
analysis when applied to vascular micro-CT volumes.
Blood flow
Despite the recent development of morphometric data
in the peripheral vasculature and hence the sophistica-
tion of the resulting hindlimb models, a rigorous hemo-
dynamic analysis of spatial perfusion of the skeleton
muscle is still unattainable. The reason for the inaccessi-
bility of such a model is the lack of quantitative data on
the spatial relation between the skeleton muscle and the
supplying vessels. Therefore, methods for reconstruction
of the 3D branching pattern of the peripheral vessels for
a spatial analysis of hindlimb blood flow are also very
important.
Micro-CT and histology
Correlation of micro-CT data with optical microscopy
may help in interpretation of biological results by using
complementary information from the two imaging mod-
alities. However, it is not always possible to perform
microscopy on sections obtained from ex vivo samples
previously imaged with micro-CT and correlate results.
In addition, more careful inspection of micro-CT sec-
tions imaged with a confocal microscope also indicates
that not all blood vessels get filled with contrast
(Figure 6). Depending on the type of contrast, the size
of its particles, viscosity, and properties, different level
of detail in micro-CT are obtained. A quantitative mea-
sure that would indicate the amount of difference in
blood vessel volume from micro CT and microscopy is
needed.
Zagorchev et al. Journal of Angiogenesis Research 2010, 2:7
http://www.jangiogenesis.com/content/2/1/7
Page 8 of 11

Other vascular applications and uses of micro-CTNeo-angiogenesis associated with more advanced stages
of human atherosclerosis is found in plaque and the
vasa vasorum [34]. Studies utilizing micro-CT and
immunohistochemistry techniques demonstrate that the
presence and extent of vasa vasorum correlate with
atherosclerotic lesion size and lumen diameter in
hypercholesterolemic animal models [35]; inhibition of
neovascularization in the vasa vasorum is associated
with reduced plaque progression [36].
Advancements in micro-CT technology and image
reconstruction software have enabled more in depth
exploration of the vasa vasorum to result in identifica-
tion of anatomically different types of vasa vasorum and
their origin, measurement of density, branching pattern
and blood flow through the vasa vasorum (Figure 6)
[4,37]. These advancements provide a means of examin-
ing the role of the vasa vasorum in the context of
atherosclerosis, abdominal aortic aneurysm, restenosis
following angioplasty, metabolic syndrome, type 2 dia-
betes mellitus as well as studying the effects of drug-
eluting stents [38].
Calcification or hemorrhage within the arterial wall
during atherosclerosis process or tissue damage have
been accurately assessed by micro-CT [39,40]. Basic
micro-architectural structures of lungs and pulmonary-
vascular system have been successfully visualized and
quantitated in small rodent by micro-CT [41].
Perspective in micro-CT improvementSingle-energy micro-CT is still limited in cases where
two different materials share similar grey-scale intensity
values. Contrast among soft tissue components could be
increased using the implementation of dual energy x-ray
subtraction algorithms. X-ray diffraction technique, wide
angle X-ray scattering, refraction-based imaging could
Figure 6 Imaging the vasa vasorum. Micro CT and confocal microscopy were used to image the vasa vasorum (A) Mice were anesthetized,
heparinized and perfused. A silicone rubber compound, Microfil Blue, was infused through the aortic cannula. Descending aortas with a wide
adventitial margin were removed after polymerization was complete, then scanned with a GE eXplore Locus SP microCT scanner at 6.5 micron
resolution. Three-dimensional volumetric images were reconstructed from acquired two dimensional projections without averaging, yielding a
final voxel size of 6.5 microns (B) Reconstructed images were rotated to obtain luminal images from mice. Descending aorta cross sections
probed for smooth muscle actin (green) and lectin (red) were imaged by confocal microscopy (C) adventitia, (D) vessel wall, (E) plaque. To
visualize blood vessels in the (F) adventitia, (G) vessel wall and (H) plaque the reconstructed Z-stacks were manually segmented to represent
co-localized probes in consecutive axial slices. The obtained contours were modeled and stacked in 3-D for volumetric surface representation.
Zagorchev et al. Journal of Angiogenesis Research 2010, 2:7
http://www.jangiogenesis.com/content/2/1/7
Page 9 of 11
also increase the contrast [40,42]. Highest resolution with
voxel < 1 μm3 imaging cellular or sub-cellular feature can
be achieved with synchrotron radiation-based scanners
(high energy and narrow bandwidth). The use of multi x-
ray source/detector array scanners can increase scan
speed for application to living animals [40].
ConclusionMicro-CT is one of the most promising imaging modal-
ities for vascular exploration. Its extremely high spatial
resolution presents a unique opportunity for studying
the structure, organization, and, to some extent, even
the function of blood vessels. The imaging process is
not straightforward and spans over a number of differ-
ent areas ranging from animal handling and preparation
to image processing and quantification. Successful
Micro-CT imaging requires perfection at each step. Bet-
ter contrast agents and delivery vehicles are needed for
more detailed exploration of small angiogenic vessels.
Robust image processing techniques that can facilitate
accurate quantification of micro-CT data in 3D have to
be developed. Correlation of microscopy with micro-CT
for interpretation of results is also very important.
Additional file 1: Contrast agents for ex vivo and in vivo imaging.
this paragraph gives more details on contrast agents properties and use
than the section in the manuscript.
Click here for file
[ http://www.biomedcentral.com/content/supplementary/2040-2384-2-7-
S1.DOC ]
Acknowledgements
We would like to thank members of Angiogenesis Research Center at
Dartmouth Medical School and, in particular, Dr Ebo De Muinck, for support
and helpful discussions, and Daniel R. Deneen for editorial help with the
manuscript. This works has been supported, in part, by grants, from the
Dartmouth-Phillips Research Consortium (M J Mulligan-Kehoe), NIH HL 53793
(MS) and HL69948 (MJMK), from the ANR (grant 07 physio-010-02), from the
Fondation de France (grant 2006005678), from the Fondation pour la
Recherche Médicale.
Author details1Heart and Vascular Research Center, Dartmouth Medical School, Lebanon,
NH, USA. 2Cardiology Section, Dartmouth Medical School, Lebanon, NH, USA.3Radiology, Dartmouth Medical School, Lebanon, NH, USA. 4Clinical Sites
Research Program, Philips Research North America, Briarcliff Manor, NY, USA.5Inserm U828, Plateforme d’Innovation Biotechnologique de Xavier Arnozan,
Université Victor Ségalen Bordeaux 2, Pessac, France. 6Pôle Cardiothoracique,
CHU de Bordeaux, Université Victor Ségalen Bordeaux 2, France. 7Yale
University School of Medicine, New Haven CT, USA. 8Departments of
Surgery, Vascular Section, Dartmouth Medical School, Lebanon, NH, USA.
Authors’ contributions
LZ carried out mCT image analysis, and wrote the “image analysis” and
“limitations” sections. PO carried out the experiments comparing different
animal preparations and contrast agents. ZWZ carried out most of the
animal experiments. KM was expert in animal preparation and wrote the
“animal preparation “ section. MJMK carried out the experiments on vasa-
vasorum and histological analysis and proofread the manuscript. MS and TC
conceived of the study and coordinated the writing.
All authors read and approved the final manuscript
Competing interests
The authors declare that they have no competing interests.
Received: 27 November 2009
Accepted: 5 March 2010 Published: 5 March 2010
References
1. Couffinhal T, Dufourcq P, Barandon L, Leroux L, Duplaa C: Mouse models
to study angiogenesis in the context of cardiovascular diseases. Front
Biosci 2009, 14:3310-3325.
2. Zagorchev L, Mulligan-Kehoe MJ: Molecular imaging of vessels in mouse
models of disease. Eur J Radiol 2009, 70:305-311.
3. Cheema AN, Hong T, Nili N, Segev A, Moffat JG, Lipson KE, Howlett AR,
Holdsworth DW, Cole MJ, Qiang B, Kolodgie F, Virmani R, Stewart DJ,
Strauss BH: Adventitial microvessel formation after coronary stenting and
the effects of SU11218, a tyrosine kinase inhibitor. J Am Coll Cardiol 2006,
47:1067-1075.
4. Kwon HM, Sangiorgi G, Ritman EL, Lerman A, McKenna C, Virmani R,
Edwards WD, Holmes DR, Schwartz RS: Adventitial vasa vasorum in
balloon-injured coronary arteries: visualization and quantitation by a
microscopic three-dimensional computed tomography technique. J Am
Coll Cardiol 1998, 32:2072-2079.
5. Kwon HM, Sangiorgi G, Ritman EL, McKenna C, Holmes DR Jr,
Schwartz RS, Lerman A: Enhanced coronary vasa vasorum
neovascularization in experimental hypercholesterolemia. J Clin Invest
1998, 101:1551-1556.
6. Bentley MD, Ortiz MC, Ritman EL, Romero JC: The use of microcomputed
tomography to study microvasculature in small rodents. Am J Physiol
Regul Integr Comp Physiol 2002, 282:R1267-1279.
7. Langheinrich AC, Leithauser B, Rau WS, Bohle RM: [Cardio-pulmonary
vascular system. Three-dimensional quantitative evaluation by
microcomputed tomography]. Pathologe 2004, 25:135-140.
8. Oses P, Renault MA, Chauvel R, Leroux L, Allieres C, Seguy B, Lamaziere JM,
Dufourcq P, Couffinhal T, Duplaa C: Mapping 3-dimensional neovessel
organization steps using micro-computed tomography in a murine
model of hindlimb ischemia-brief report. Arterioscler Thromb Vasc Biol
2009, 29:2090-2092.
9. Marxen M, Thornton MM, Chiarot CB, Klement G, Koprivnikar J, Sled JG,
Henkelman RM: MicroCT scanner performance and considerations for
vascular specimen imaging. Med Phys 2004, 31:305-313.
10. Tirziu D, Moodie KL, Zhuang ZW, Singer K, Helisch A, Dunn JF, Li W,
Singh J, Simons M: Delayed arteriogenesis in hypercholesterolemic mice.
Circulation 2005, 112:2501-2509.
11. Toyota E, Fujimoto K, Ogasawara Y, Kajita T, Shigeto F, Matsumoto T,
Goto M, Kajiya F: Dynamic changes in three-dimensional architecture and
vascular volume of transmural coronary microvasculature between
diastolic- and systolic-arrested rat hearts. Circulation 2002, 105:621-626.
12. Mukundan S Jr, Ghaghada KB, Badea CT, Kao CY, Hedlund LW,
Provenzale JM, Johnson GA, Chen E, Bellamkonda RV, Annapragada A: A
liposomal nanoscale contrast agent for preclinical CT in mice. AJR Am J
Roentgenol 2006, 186:300-307.
13. Ho Kong W, Jae Lee W, Yun Cui Z, Hyun Bae K, Gwan Park T, Hoon Kim J,
Park K, Won Seo S: Nanoparticulate carrier containing water-insoluble
iodinated oil as a multifunctional contrast agent for computed
tomography imaging. Biomaterials 2007, 28:5555-5561.
14. Zagorchev L, Goshtasby A: A comparative study of transformation
functions for nonrigid image registration. IEEE Trans Image Process 2006,
15:529-538.
15. Goshtasby A: 2D and 2D Image Registration: for Medical, Remote
Sensing, and Industrial Applications. Wiley-Interscience 2005.
16. Zitova B, Flusser J: Image registration methods: a survey. Image and Vision
Computing 2003, 21:977-1000.
17. Hajnal JV, Hill DLG, Hawkes DJ: Medical Image Registration. CRC Press
2001.
18. Yoo T: Insight into Images. AK Peters 2004.
19. Hildebrand T, Laib A, Muller R, Dequeker J, Ruegsegger P: Direct three-
dimensional morphometric analysis of human cancellous bone:
microstructural data from spine, femur, iliac crest, and calcaneus. J Bone
Miner Res 1999, 14:1167-1174.
20. Tamada T, Sone T, Jo Y, Imai S, Kajihara Y, Fukunaga M: Three-dimensional
trabecular bone architecture of the lumbar spine in bone metastasis
Zagorchev et al. Journal of Angiogenesis Research 2010, 2:7
http://www.jangiogenesis.com/content/2/1/7
Page 10 of 11

from prostate cancer: comparison with degenerative sclerosis. Skeletal
Radiol 2005, 34:149-155.
21. Li W, Shen W, Gill R, Corbly A, Jones B, Belagaje R, Zhang Y, Tang S,
Chen Y, Zhai Y, Wang G, Wagle A, Hui K, Westmore M, Hanson J, Chen YF,
Simons M, Singh J: High-resolution quantitative computed tomography
demonstrating selective enhancement of medium-size collaterals by
placental growth factor-1 in the mouse ischemic hindlimb. Circulation
2006, 113:2445-2453.
22. Duvall CL, Taylor WR, Weiss D, Guldberg RE: Quantitative microcomputed
tomography analysis of collateral vessel development after ischemic
injury. Am J Physiol Heart Circ Physiol 2004, 287:H302-310.
23. Litzlbauer HD, Neuhaeuser C, Moell A, Greschus S, Breithecker A, Franke FE,
Kummer W, Rau WS: Three-dimensional imaging and morphometric
analysis of alveolar tissue from microfocal X-ray-computed tomography.
Am J Physiol Lung Cell Mol Physiol 2006, 291:L535-545.
24. Mawatari T, Miura H, Higaki H, Kurata K, Moro-oka T, Murakami T,
Iwamoto Y: Quantitative analysis of three-dimensional complexity and
connectivity changes in trabecular microarchitecture in relation to
aging, menopause, and inflammation. J Orthop Sci 1999, 4:431-438.
25. Uhoda I, Pierard GE, Pierard-Franchimont C, Arrese JE, Goffin V, Nikkels A,
Paquet P, Quatresooz P: Vascularity and fractal dimension of the dermo-
epidermal interface in guttate and plaque-type psoriasis. Dermatology
2005, 210:189-193.
26. Baish JW, Jain RK: Fractals and cancer. Cancer Res 2000, 60:3683-3688.
27. Risser L, Plouraboue F, Steyer A, Cloetens P, Le Duc G, Fonta C: From
homogeneous to fractal normal and tumorous microvascular networks
in the brain. J Cereb Blood Flow Metab 2007, 27:293-303.
28. Zhuang ZW, Gao L, Murakami M, Pearlman JD, Sackett TJ, Simons M, de
Muinck ED: Arteriogenesis: noninvasive quantification with multi-detector
row CT angiography and three-dimensional volume rendering in
rodents. Radiology 2006, 240:698-707.
29. Jorgensen SM, Demirkaya O, Ritman EL: Three-dimensional imaging of
vasculature and parenchyma in intact rodent organs with X-ray micro-
CT. Am J Physiol 1998, 275:H1103-1114.
30. Odgaard A: Three-dimensional methods for quantification of cancellous
bone architecture. Bone 1997, 20:315-328.
31. Hildebrand T, Rüegsegger P: A new method for the model independent
assessment of thickness in three-dimensional images. J Microsc 1997,
185:67-75.
32. Gundersen HJ, Jensen TB, Osterby R: Distribution of membrane thickness
determined by lineal analysis. J Microsc 1978, 113:27-43.
33. Risser L, Plouraboue F, Descombes X: Gap filling of 3-D microvascular
networks by tensor voting. IEEE Trans Med Imaging 2008, 27:674-687.
34. Virmani R, Kolodgie FD, Burke AP, Finn AV, Gold HK, Tulenko TN, Wrenn SP,
Narula J: Atherosclerotic plaque progression and vulnerability to rupture:
angiogenesis as a source of intraplaque hemorrhage. Arterioscler Thromb
Vasc Biol 2005, 25:2054-2061.
35. Langheinrich AC, Michniewicz A, Bohle RM, Ritman EL: Vasa vasorum
neovascularization and lesion distribution among different vascular beds
in ApoE-/-/LDL-/- double knockout mice. Atherosclerosis 2007, 191:73-81.
36. Drinane M, Mollmark J, Zagorchev L, Moodie K, Sun B, Hall A, Shipman S,
Morganelli P, Simons M, Mulligan-Kehoe MJ: The antiangiogenic activity of
rPAI-1(23) inhibits vasa vasorum and growth of atherosclerotic plaque.
Circ Res 2009, 104:337-345.
37. Gossl M, Rosol M, Malyar NM, Fitzpatrick LA, Beighley PE, Zamir M,
Ritman EL: Functional anatomy and hemodynamic characteristics of vasa
vasorum in the walls of porcine coronary arteries. Anat Rec A Discov Mol
Cell Evol Biol 2003, 272:526-537.
38. Maiellaro K, Taylor WR: The role of the adventitia in vascular
inflammation. Cardiovasc Res 2007, 75:640-648.
39. Langheinrich AC, Bohle RM, Greschus S, Hackstein N, Walker G, von
Gerlach S, Rau WS, Holschermann H: Atherosclerotic lesions at micro CT:
feasibility for analysis of coronary artery wall in autopsy specimens.
Radiology 2004, 231:675-681.
40. Ritman EL: Small-animal CT - Its Difference from, and Impact on, Clinical
CT. Nucl Instrum Methods Phys Res A 2007, 580:968-970.
41. Ritman EL: Micro-computed tomography of the lungs and pulmonary-
vascular system. Proc Am Thorac Soc 2005, 2:477-480.
42. Granton PV, Pollmann SI, Ford NL, Drangova M, Holdsworth DW:
Implementation of dual- and triple-energy cone-beam micro-CT for
postreconstruction material decomposition. Med Phys 2008, 35:5030-5042.
doi:10.1186/2040-2384-2-7Cite this article as: Zagorchev et al.: Micro computed tomography forvascular exploration. Journal of Angiogenesis Research 2010 2:7.
Submit your next manuscript to BioMed Centraland take full advantage of:
• Convenient online submission
• Thorough peer review
• No space constraints or color figure charges
• Immediate publication on acceptance
• Inclusion in PubMed, CAS, Scopus and Google Scholar
• Research which is freely available for redistribution
Submit your manuscript at www.biomedcentral.com/submit
Zagorchev et al. Journal of Angiogenesis Research 2010, 2:7
http://www.jangiogenesis.com/content/2/1/7
Page 11 of 11