Embed Size (px)
Citation preview

Chapter 5 Copyright ©2010 by South-Western, a division of Cengage Learning. All rights reserved 1
ECON
Designed by
Amy McGuire, B-books, Ltd.
McEachern 2010-2011
5CHAPTERElasticity of Demand and Supply
Micro

Chapter 5 Copyright ©2010 by South-Western, a division of Cengage Learning. All rights reserved 2
Price Elasticity of Demand
LO1
Elasticity
– Responsiveness
Price elasticity of demand
– Consumers’
responsiveness to a
change in price
– Percentage change in
quantity demanded
divided by percentage
change in price

Chapter 5 Copyright ©2010 by South-Western, a division of Cengage Learning. All rights reserved 3
Price Elasticity of Demand
LO1
Law of demand
ED negative
Absolute value of ED positive
2/)'(2/)'(
%
%
pp
p
qE
p
qE
D
D

Chapter 5 Copyright ©2010 by South-Western, a division of Cengage Learning. All rights reserved 4
LO1Demand Curve for Tacos
D
10595 Thousands per day0
0.90
Price p
er
taco
$1.10
b
a
If the price of tacos drops from
$1.10 to $0.90, the quantity
demanded increases from
95,000 to 105,000.
Exhibit 1

Chapter 5 Copyright ©2010 by South-Western, a division of Cengage Learning. All rights reserved 5
Categories of ED
LO1
If %∆q < %∆p
– ED between 0 and 1
– Inelastic D
If %∆q > %∆p
– ED greater than 1
– Elastic D
If %∆q = %∆p
– ED = 1
– Unit elastic D

Chapter 5 Copyright ©2010 by South-Western, a division of Cengage Learning. All rights reserved 6
Elasticity and Total Revenue
LO1
Total revenue = price *
quantity demanded at
this price
TR= p * q
As p decreases
If D elastic,
TR increases
If D inelastic,
TR decreases
If D unit elastic,
TR unchanged

Chapter 5 Copyright ©2010 by South-Western, a division of Cengage Learning. All rights reserved 7
Price Elasticity and the
Linear D Curve
LO1
Linear D curve
– Constant slope
– Different elasticity
– D becomes less elastic as we move
downward
D upper half: elastic
D lower half: inelastic
D midpoint: unit elastic
Chapter 5 Copyright ©2010 by South-Western, a division of Cengage Learning. All rights reserved 8
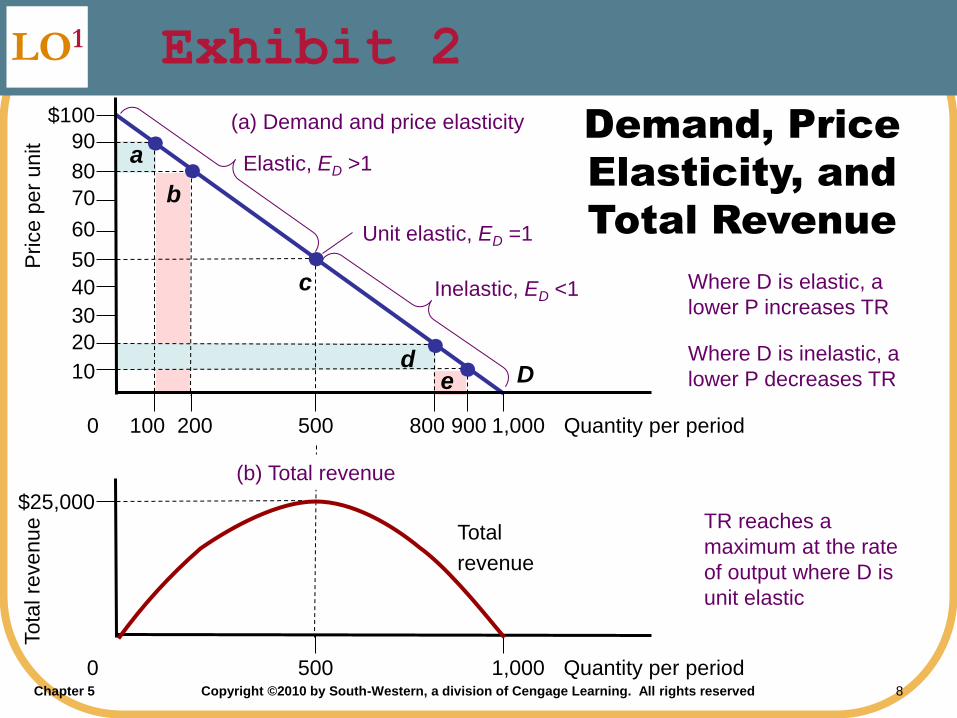
LO1
Demand, Price
Elasticity, and
Total Revenue
Where D is elastic, a
lower P increases TR
Where D is inelastic, a
lower P decreases TR
TR reaches a
maximum at the rate
of output where D is
unit elastic
Exhibit 2
D
90
60
10
70
Price p
er
un
it
$100
80
50
40
30
20
b
a
de
800500200100 Quantity per period1,0000 900
Tota
l re
venu
e
$25,000
500 Quantity per period1,0000
(a) Demand and price elasticity
(b) Total revenue
Total
revenue
Unit elastic, ED =1
Elastic, ED >1
Inelastic, ED <1c

Chapter 5 Copyright ©2010 by South-Western, a division of Cengage Learning. All rights reserved 9
Constant-Elasticity
Demand Curves
LO1
Perfectly elastic D curve
– Horizontal; ED = ∞
– Consumers don’t tolerate P increases
Perfectly inelastic D curve
– Vertical; ED = 0
– ‘Price is no object’
Unit-elastic D curve
– %∆p causes an exact opposite %∆q

Chapter 5 Copyright ©2010 by South-Western, a division of Cengage Learning. All rights reserved 10
LO1
Constant-Elasticity Demand Curves
0 Quantity per period
Price p
er
unit
pED = ∞
(a) Perfectly elastic
D
Price p
er
unitED’’ = 0
(b) Perfectly inelastic
ED ’’ = 1
(c) Unit elastic
D’
0 Quantity
per period
Q
Price p
er
unit
$10
6
0 Quantity
per period
60 100
D’’
a
Consumers demand all quantity
offered for sale at p, but demand
nothing at a price above pConsumers demand Q
regardless of price
Total revenue is the same
for each p-q combination
b
Exhibit 3

Chapter 5 Copyright ©2010 by South-Western, a division of Cengage Learning. All rights reserved 11
LO1
Summary of Price Elasticity of Demand
Effects of a 10 Percent Increase in Price
Exhibit 4

Chapter 5 Copyright ©2010 by South-Western, a division of Cengage Learning. All rights reserved 12
Determinants of Price
Elasticity of D
LO2
ED is greater:
– The greater the availability of substitutes,
and the more similar the substitutes
– The more important the good as a share of
the consumer’s budget
– The longer the period of adjustment (time)
Chapter 5 Copyright ©2010 by South-Western, a division of Cengage Learning. All rights reserved 13
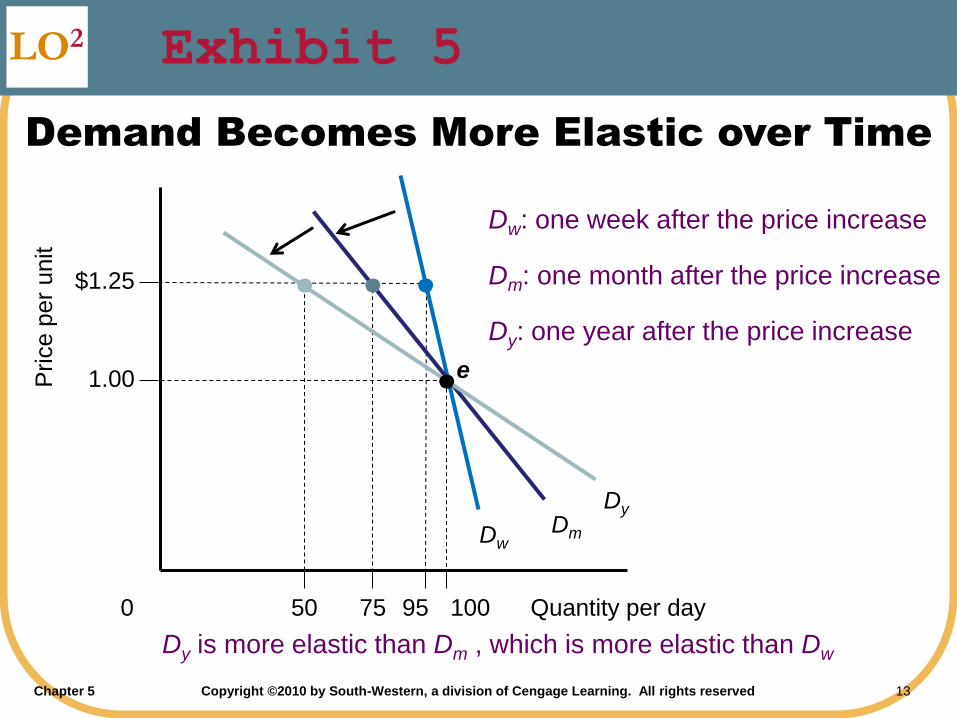
LO2
Demand Becomes More Elastic over Time
Dw
Price p
er
unit
$1.25
1.00
Dm
Quantity per day95 10075500
Dy
e
Dy is more elastic than Dm , which is more elastic than Dw
Dw: one week after the price increase
Dm: one month after the price increase
Dy: one year after the price increase
Exhibit 5

Chapter 5 Copyright ©2010 by South-Western, a division of Cengage Learning. All rights reserved 14
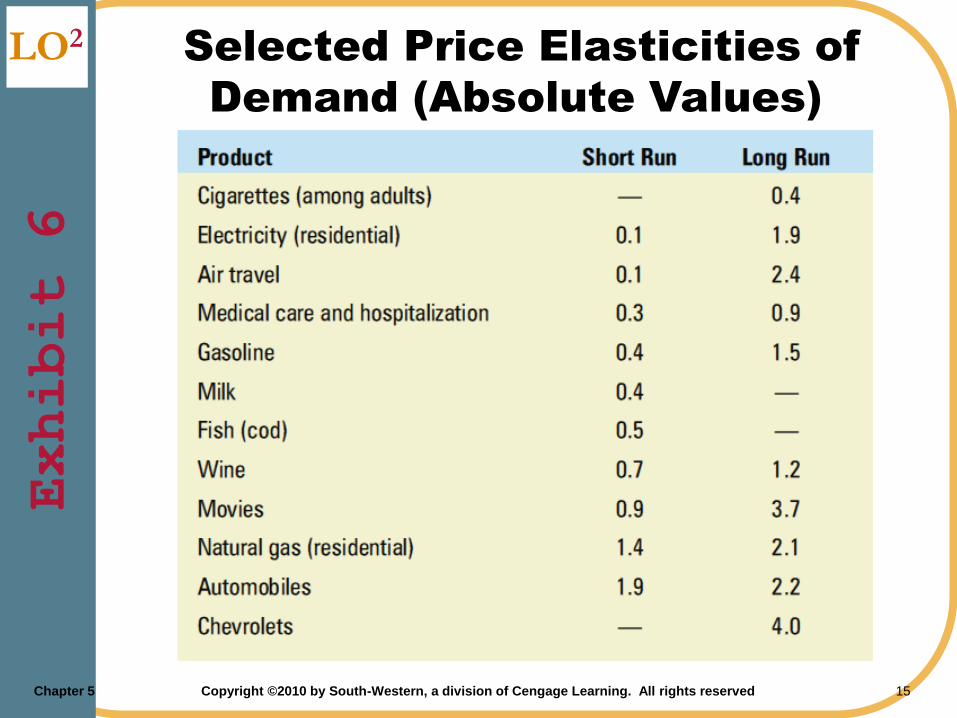
Elasticity Estimates
LO2
Short run
– Consumers have little time to adjust
Long run
– Consumers can fully adjust to a price change
Demand is more elastic in the long run
Chapter 5 Copyright ©2010 by South-Western, a division of Cengage Learning. All rights reserved 15
LO2 Selected Price Elasticities of
Demand (Absolute Values)
Exhibit 6

Chapter 5 Copyright ©2010 by South-Western, a division of Cengage Learning. All rights reserved 16
LO2Cas
e Stu
dyDeterring Young Smokers
Health hazard
Kills 440,000 Americans a year
Lung cancer; Heart disease;
Emphysema; Stroke
Cost to society
$7.18 per pack sold
Higher health cost
Lost worker
productivity
Total: $150 billion a year
$3,400 per smoker
per year

Chapter 5 Copyright ©2010 by South-Western, a division of Cengage Learning. All rights reserved 17
LO2Cas
e Stu
dyDeterring Young Smokers
Discouraging smoking
Prohibit the sale of cigarettes to minors
Higher cigarette tax
ED is higher for teens
Big share of budget
Less peer pressure
Not an addiction yet
Reduces teen smoking
Change consumer tastes

Chapter 5 Copyright ©2010 by South-Western, a division of Cengage Learning. All rights reserved 18
Price Elasticity of Supply
LO3
Elasticity
– Responsiveness
Price elasticity of supply
– Producers’ responsiveness to a change
in price
– Percentage change in quantity supplied
divided by percentage change in price

Chapter 5 Copyright ©2010 by South-Western, a division of Cengage Learning. All rights reserved 19
Price Elasticity of Supply
LO3
Law of supply
ES positive
2/)'(2/)'(
%
%
pp
p
qE
p
qE
S
S
Chapter 5 Copyright ©2010 by South-Western, a division of Cengage Learning. All rights reserved 20
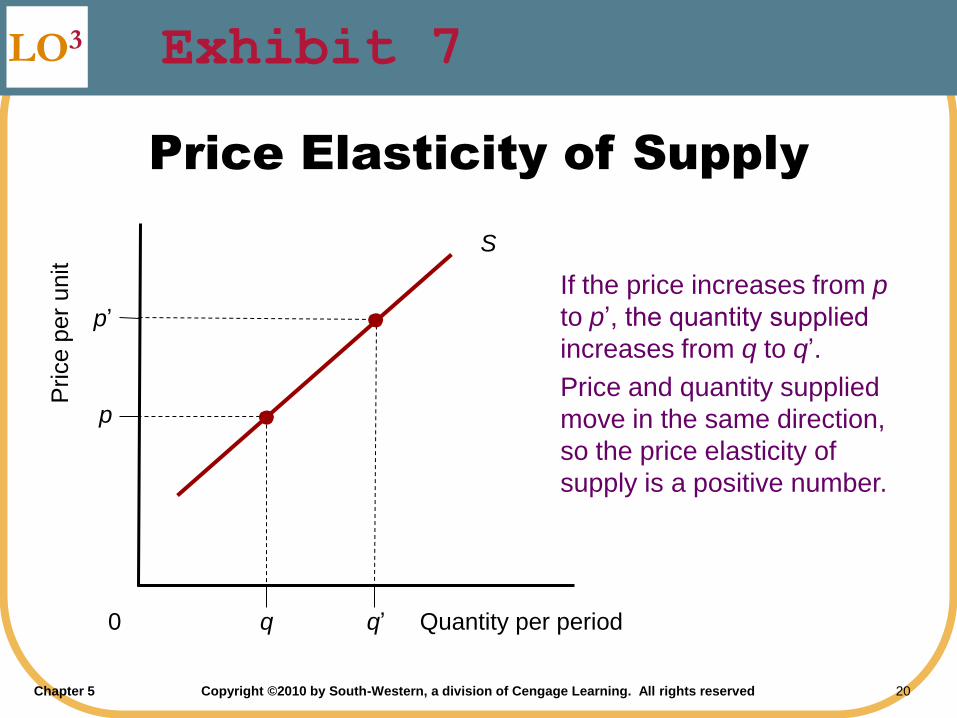
LO3
Price Elasticity of Supply
S
Price p
er
unit
p
p’
Quantity per periodq q’0
If the price increases from p
to p’, the quantity supplied
increases from q to q’.
Price and quantity supplied
move in the same direction,
so the price elasticity of
supply is a positive number.
Exhibit 7

Chapter 5 Copyright ©2010 by South-Western, a division of Cengage Learning. All rights reserved 21
Categories of ES
LO3
If %∆q < %∆p
– ES between 0 and 1
– Inelastic S
If %∆q > %∆p
– ES greater than 1
– Elastic S
If %∆q = %∆p
– ES = 1
– Unit elastic S

Chapter 5 Copyright ©2010 by South-Western, a division of Cengage Learning. All rights reserved 22
Constant-Elasticity Supply Curves
LO3
Perfectly elastic S curve
– Horizontal; ES = ∞
– Producers supply 0 at a price below P
Perfectly inelastic S curve
– Vertical; ES = 0
– Goods in fixed supply
Unit-elastic S curve
– %∆p causes an exact opposite %∆q
– S curve is a ray from the origin

Chapter 5 Copyright ©2010 by South-Western, a division of Cengage Learning. All rights reserved 23
LO3
Constant-Elasticity Supply Curves
0 Quantity
per period
Price p
er
unit
pES = ∞
(a) Perfectly elastic
S
Price p
er
unitES’ = 0
(b) Perfectly inelastic
ES’’ = 1
(c) Unit elastic
S’
0 Quantity
per period
Q
Price p
er
unit
$10
5
0 Quantity
per period
10 20
S’’
Firms supply any amount of
output demanded at p, but
supply 0 at prices below p.
Quantity supplied is
independent of the price
Any %∆p results in the
same %∆q supplied.
Exhibit 8

Chapter 5 Copyright ©2010 by South-Western, a division of Cengage Learning. All rights reserved 24
Determinants of Supply Elasticity
LO3
ES is greater:
– If the marginal cost
rises slowly as
output expands
– The longer the
period of
adjustment (time)

Chapter 5 Copyright ©2010 by South-Western, a division of Cengage Learning. All rights reserved 25
LO3
Supply Becomes More Elastic over Time
Sw
Price p
er
unit
1.00
$1.25
Quantity per day110 2000 100 140
Sm
Sy
Sw: one week after the
price increase
Sm: one month after the
price increase
Sy: one year after the
price increase
Sw is less elastic than Sm, which is less elastic than Sy
Exhibit 9

Chapter 5 Copyright ©2010 by South-Western, a division of Cengage Learning. All rights reserved 26
Income Elasticity
of Demand
LO4
Demand responsiveness to a change in
consumer income
Percentage change in demand divided by
the percentage change in income that
caused it
Inferior goods
– Negative income elasticity
Normal goods
– Positive income elasticity
Chapter 5 Copyright ©2010 by South-Western, a division of Cengage Learning. All rights reserved 27
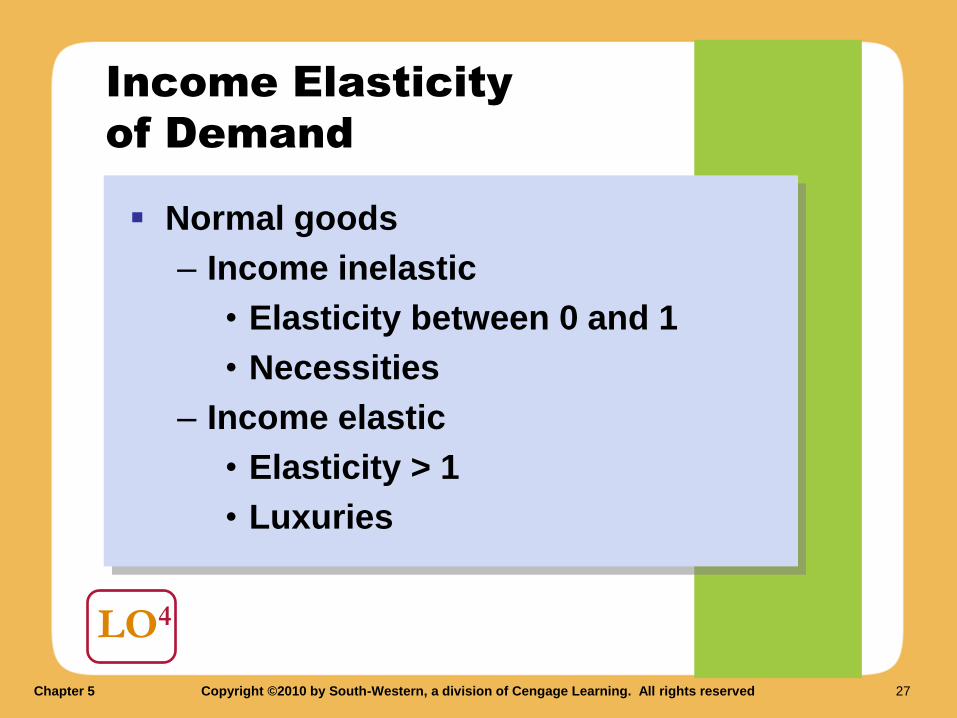
Income Elasticity
of Demand
LO4
Normal goods
– Income inelastic
• Elasticity between 0 and 1
• Necessities
– Income elastic
• Elasticity > 1
• Luxuries

Chapter 5 Copyright ©2010 by South-Western, a division of Cengage Learning. All rights reserved 28
LO4
Selected Income Elasticities of Demand
Exhibit 10

Chapter 5 Copyright ©2010 by South-Western, a division of Cengage Learning. All rights reserved 29
LO4Cas
e Stu
dyThe Market for Food and ‘The Farm Problem’
1950: 10 million family farms
Today: less than 3 million
Demand
Price inelastic
Total revenue falls
when P falls
Income inelastic
D increases
Technological improvements
S increases
Chapter 5 Copyright ©2010 by South-Western, a division of Cengage Learning. All rights reserved 30
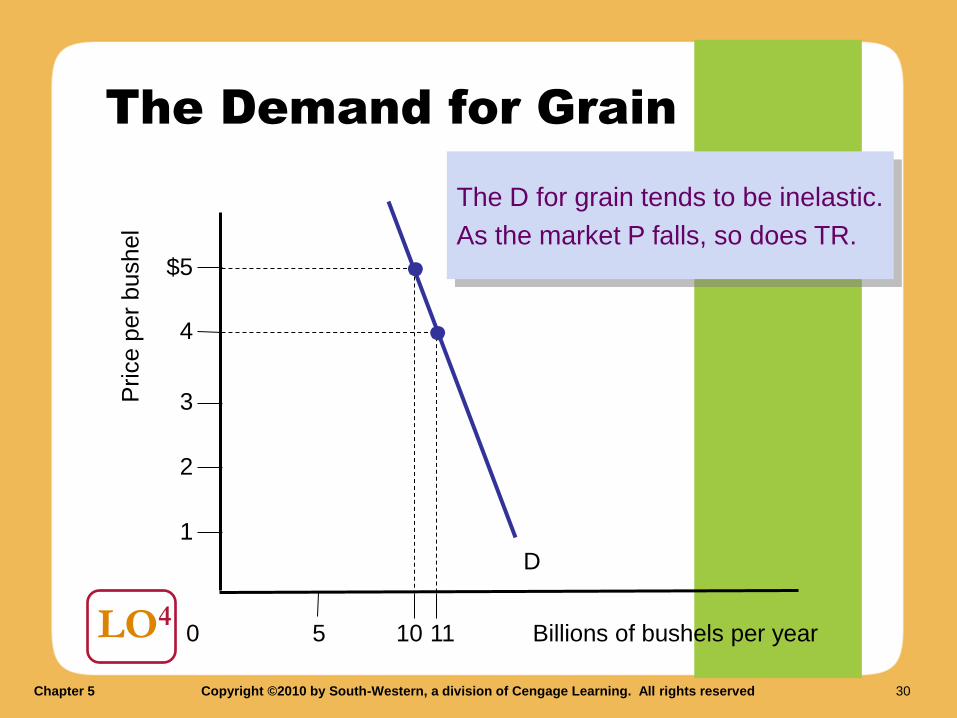
The Demand for Grain
LO4
D
5 10 11 Billions of bushels per year0
Price p
er
bushel
$5
4
3
2
1
The D for grain tends to be inelastic.
As the market P falls, so does TR.

Chapter 5 Copyright ©2010 by South-Western, a division of Cengage Learning. All rights reserved 31
LO4 The Effect on Increases in Demand and
Supply on Farm Revenue
S’
D’
D
5 10 14
Billions of bushels per year
0
Price p
er
bushel
$8
4
S
Technological advance
- sharp increase in S
Increase in consumer income
- small increase in D
Drop in P
Drop in total revenue
Exhibit 11

Chapter 5 Copyright ©2010 by South-Western, a division of Cengage Learning. All rights reserved 32
Cross-Price Elasticity
of Demand
LO4
Responsiveness of D for one good to
changes in P of another good
%∆ in demand for one good divided by
%∆ in price of another good
– If positive: substitutes
– If negative: complements
– If zero: unrelated

Chapter 5 Copyright ©2010 by South-Western, a division of Cengage Learning. All rights reserved 33
Price Elasticity and Tax
Incidence
Appendix
Tax
– Decrease in S by the amount of tax
Tax incidence
– Consumers: high P
– Producers: net-of-tax receipt

Chapter 5 Copyright ©2010 by South-Western, a division of Cengage Learning. All rights reserved 34
Price Elasticity and Tax
Incidence
Appendix
The more price elastic the D:
– The more tax producers pay
– The less tax consumers pay
The more elastic the S:
– The less tax producers pay
– The more tax consumers pay
Chapter 5 Copyright ©2010 by South-Western, a division of Cengage Learning. All rights reserved 35
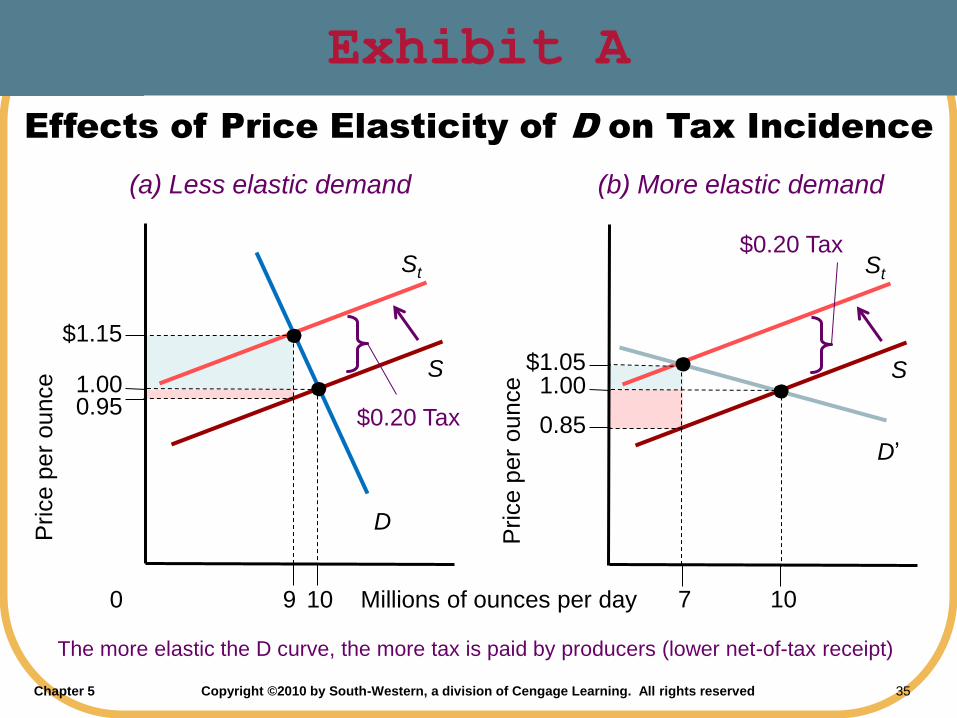
Effects of Price Elasticity of D on Tax Incidence
St
S
D’
St
S
D
$0.20 Tax
Price p
er
ounce
$1.15
1.000.95
Millions of ounces per day1090
$0.20 Tax
107
Price p
er
ounce
$1.051.00
0.85
(a) Less elastic demand (b) More elastic demand
The more elastic the D curve, the more tax is paid by producers (lower net-of-tax receipt)
Exhibit A

Chapter 5 Copyright ©2010 by South-Western, a division of Cengage Learning. All rights reserved 36
Effects of Price Elasticity of Supply on Tax Incidence
St’
S’
D’’
$0.20 Tax
Price p
er
ounce
$1.15
1.00
0.95
(a) More elastic supply
St”S”
D’’
$0.20 Tax
109
Price p
er
ounce
$1.051.00
0.85
(b) Less elastic supply
Millions of ounces per day1080
The more elastic the S curve, the more tax is paid by consumers as a higher price.
Exhibit B