Embed Size (px)
Citation preview
TSpace Research Repository tspace.library.utoronto.ca
Microfluidic and nanofluidic phase behaviour
characterization for industrial CO2, oil and gas
Bo Bao, Jason Riordon, Farshid Mostowfi and David Sinton
Version Post-print/accepted manuscript
Citation
(published version)
Bao, Bo, Jason Riordon, Farshid Mostowfi, and David Sinton.
"Microfluidic and nanofluidic phase behaviour characterization for industrial CO 2, oil and gas." Lab on a Chip 17, no. 16 (2017): 2740-
2759. DOI: 10.1039/C7LC00301C
How to cite TSpace items
Always cite the published version, so the author(s) will receive recognition through services that track
citation counts, e.g. Scopus. If you need to cite the page number of the author manuscript from TSpace because you cannot access the published version, then cite the TSpace version in addition to the published
version using the permanent URI (handle) found on the record page.
This article was made openly accessible by U of T Faculty.
Please tell us how this access benefits you. Your story matters.
Received 00th January 20xx,
Accepted 00th January 20xx
Microfluidic and nanofluidic phase behaviour characterization for energy applications
Bo Bao,a Jason Riordon,b Farshid Mostowfic and David Sinton*b
Microfluidic systems that leverage unique micro-scale phenomena have been developed to provide rapid, accurate and
robust analysis, predominantly for biomedical applications. These attributes, in addition to the ability to access high
temperatures and pressures, have motivated recent expanded applications in phase measurements relevant to energy
applications. We here present a comprehensive review of this exciting new field, separating microfluidic and nanofluidic
approaches. Microfluidics is practical, and provides similar phase properties analysis to established bulk methods with
advantages in speed, control and sample size. Nanofluidic phase behaviour can deviate from bulk measurements, which is
of particular relevance to emerging unconventional oil and gas production from nanoporous shale. In short, microfluidics
offers a practical, compelling replacement of current bulk phase measurement systems, whereas nanofluidics is not
practical, but uniquely provides insight into phase change phenomena at nanoscales. Challenges, trends and opportunities
for phase measurements at both scales are highlighted.
1. Introduction
Fluid phase characterization is crucial to a wide range of
processes, including protein crystallization, polymer analysis,
surfactant screening, chemical reactor engineering, the
transport and storage of natural gas and carbon dioxide,
supercritical fluid processing and extraction, and of particular
interest to this review, oil and gas operations. Fluid phase
behaviour is obtained through either theory/simulation or
experimental methods. Theory/simulation approaches
calculate the thermodynamic properties of fluid mixtures using
the equation of state. Performing direct measurement of fluid
phase, however, remains an expensive and time-consuming
proposition. Energy-relevant fluid processes are governed by
microscale fundamentals in terms of viscosity, wetting
behaviour, surface tension and capillary effects. The inherent
technical challenges associated with informing these processes
using conventional reservoir fluid analysis include complex
small-scale transport phenomenon, complex microscale phase
behaviours, intensive capital investment, high labour costs and
long run times.
Microfluidic approaches are particularly well suited to
perform phase behaviour analysis: fluid properties are generally
similar to bulk systems, with benefits in rapid heat and mass
transfer, lab-on-a-chip processing, optical access for
visualization, potential for multiplexing, and precise control of
temperatures, pressures and compositions. Microfluidic
technologies have been widely investigated and developed for
sample preparation, separation, sensing, detection and fluid
manipulation. Successful applications include, but are not
limited to, point-of-care diagnostics, cell analysis, drug
metabolism, omics and environmental analysis.1 In recent
years, microfluidic techniques have been increasingly applied to
energy applications, with applications in enhanced oil recovery,
heavy oil/bitumen production, shale and tight gas/oil
production, carbon transport and storage, reservoir fluid
analysis and other petrochemical processes.
The advancement of fabrication techniques in the last two
decades, paired with the recent boom in unconventional and
gas recovery from nanoporous shale and tight oil reservoirs, has
led to increased interest in nanofluidic phase characterization
devices. These systems are designed to visualize fluid behaviour
in nanoconfinement, which is typically distinct from micro- and
macroscale behaviour. Nanofluidic behaviour is a deviation
from microfluidic approaches where the data is generally
readily applicable to the larger scales and the small operating
scale offers speed and simplification. Although not as
established as microfluidics-based phase measurements,
nanofluidic phase measurements are rapidly emerging.
1.1 Complementary reviews and our focus
Microscale phase characterization. Several review papers
include various aspects of microscale phase characterization.
Thome reviewed boiling phenomena in microchannels,
addressing topics such as flow regimes (e.g. bubble flow, slug
flow, annular flow and mist flow), heat transfer coefficients and
evaporation models.2 Tibirica et al. conducted a comprehensive
literature review on how boiling in microchannels has
progressed over the last two decades. The authors nicely review
macro-to-micro transition, flow regimes, pressure drop, heat
transfer coefficients, critical heat flux, superficial void fraction
and liquid entrainment.3 Later, microscale phase behaviours
were reviewed in the context of chemical and material
synthesis. Guenther et al. reviewed transport characteristics of
multiphase flows, and systematically addressed the
characterization techniques, multiphase flow instability, flow
regimes and interfacial shapes of gas-liquid flows, liquid-liquid
flows, phase separation and coalescence, mixing and
dispersion, and applications to chemical and material
synthesis.4
As compared to foundational work in biomedicine, energy
systems represent a much more recent application of
microfluidic phase behaviour characterization and have
required new innovations. In an early article, Sinton et al.
provided a brief overview of the early successes and potential
opportunities of microfluidics in energy, including solar energy
(photocatalysis and photosynthesis), electrochemical energy
a. Interface Fluidics, 11421 Saskatchewan Dr. NW, Edmonton, Alberta, Canada b. Department of Mechanical and Industrial Engineering, University of Toronto, 5
King's College Road, Toronto, Canada. Tel: +1 (416) 978 1623; E-mail: [email protected]
c. Schlumberger-Doll Research, Cambridge, USA Electronic Supplementary Information (ESI) available: [details of any supplementary information available should be included here]. See DOI: 10.1039/x0xx00000x
(fuel cell and battery), oil and gas (reservoir fluid analysis and
micromodels informing sub-surface operations), and carbon
management.5 Marre et al. summarized high-temperature and
high-pressure supercritical microfluidic applications in terms of
reactor material, packaging techniques, flow characteristics for
flow-through chemistry and material synthesis applications.6
Lifton later provided a comprehensive review of microfluidics
for enhanced oil recovery, covering visualization technologies,
and modelling of a suite of hydrocarbon recovery processes,
e.g. water/surfactant flooding, polymer flooding, nanoparticle
flooding, foam flooding, microbial enhanced oil recovery, heavy
oil extraction and carbon sequestration.7
Nanoscale phase characterization. Fluid phase behaviour in
nanometer-confined geometries (< 100nm) is a topic of
increasing interest, with applications spanning biology,
chemistry, physics and engineering, as highlighted originally in
an elegant review by Eijkel et al.8 The nanometer length scale
leads to unique fluid behaviour which is very different from the
bulk scale. Bocquet et al. conducted an in-depth review in
continuum validity, characteristic length scales (e.g. molecular
length, Debye length of electrostatic diffuse layer and slip
length), associated transport phenomena and practical
applications.9 A few years later, Bocquet et al. highlighted
current challenges and recent progress of emerging nanofluidic
approaches, and applications to membranes (used for
separation, desalination and energy harvesting), gene
sequencing, super hydrophobic surfaces, and unconventional
oil and gas.10
Nanofluidic devices have been fabricated by (i)
nanolithography such as electron beam lithography and
focused ion beam techniques; (ii) standard micro-electro-
mechanical-systems (MEMS) techniques such as etching and
bonding; and (iii), nanomaterial-based methods such as
nanoporous substances and nanowires, as presented in a
comprehensive review by Duan et al.11 Napoli et al. summarized
the nanofluidic studies in biomolecule applications, including
biomolecule separation, interaction kinetics, concentration and
detection.12 Segerink et al. presented state-of-the-art
nanofluidic techniques in point of care applications using single
nanopores, nanoporous membrane, nano-confinement and
concentration polarization.13 Sparreboom et al. focused on the
transport aspect of nanofluidics and systematically discussed
the applications, including flow detection, pumping,
electrokinetic control of molecules, energy conversion, and
molecule separation.14 Cole et al. conducted a review on
adsorption-desorption mechanisms of hydrocarbons within
nanopores of mineral surfaces.15 Barsotti et al. performed a
systematic review of capillary condensation in nanoporous
media and pointed to potential applications in hydrocarbon
recovery from tight reservoirs.16
Here we critically review both microfluidic and emerging
nanofluidic phase behaviour characterization methods for
energy applications. The focus is on applications that have been
most pursued and those rapidly emerging, specifically:
microfluidic pressure-volume-temperature (PVT) systems that
probe fluid phase transitions, dew/bubble/critical points and
phase diagrams (P-T, P-x, T-x); microfluidic solubility, diffusivity,
miscibility (one phase is mixed into the other or dispersed
phases are merged into a homogeneous phase), microfluidic
precipitation (generation of a solid phase from a liquid phase,
e.g. precipitation of asphaltene, wax and salt); and, recent
advancements in nanofluidic phase visualization methods.
2. Current phase characterization methods
2.1 Traditional pressure-volume-temperature (PVT) systems
Traditionally, fluid phase measurements are conducted in a PVT
cell with a transparent window for visualization, and the
majority of such instruments are dedicated to oil and gas. When
crude oil travels from a reservoir to the surface, the oil
experiences significant changes in pressure and temperature
which result in significant changes in thermophysical properties.
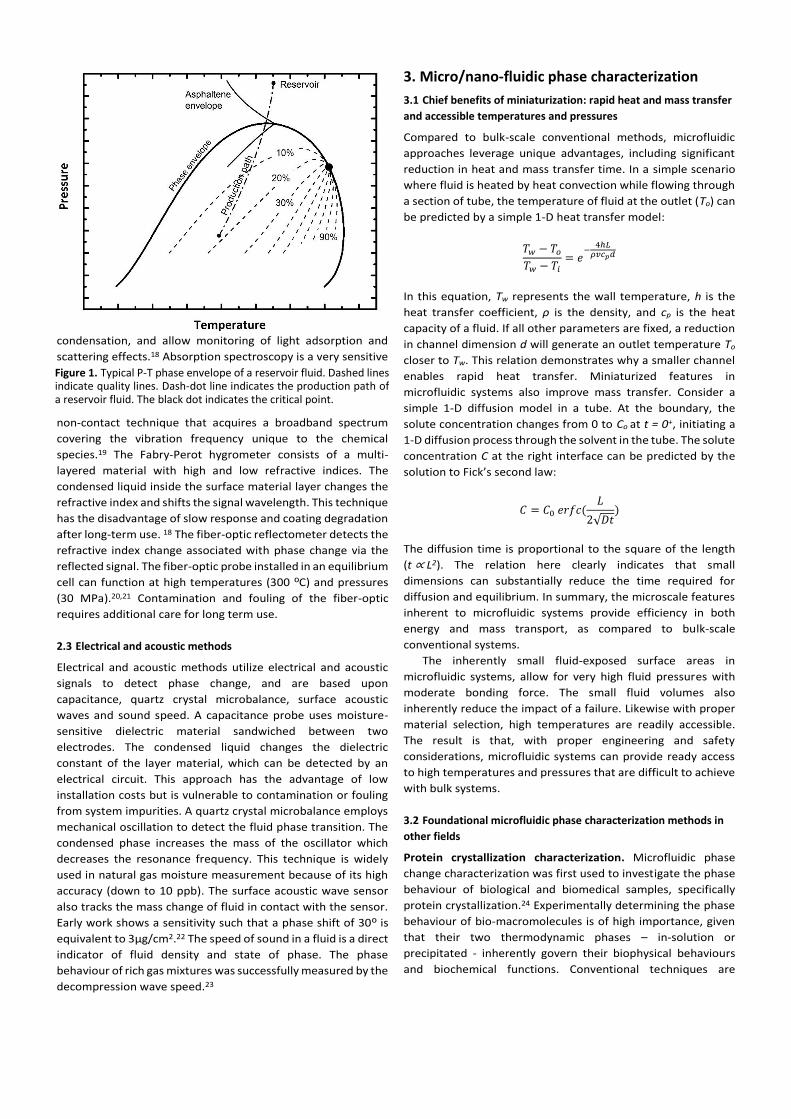
The fluid may also cross one or more phase boundaries. Fig. 1
depicts the typical phase behaviour of crude oil. The fluid is
initially in liquid form at reservoir conditions but as the fluid
travels along the production path, its pressure and temperature
drop. Furthermore, other phases – gaseous and solid phases in
this case - may appear as the fluid travels to the surface. A main
purpose of a PVT apparatus is to recreate the desired conditions
which the fluid experiences while traveling to the surface. A
conventional PVT cell is an apparatus designed for measuring
thermophysical properties of reservoir fluids such as saturation
pressure (bubble or dew point), and gas/liquid volume ratio at
different pressures. PVT measurements provide experimental
data points for tuning and validating the equation of state of the
crude oil.
A typical PVT cell has a volume of 100 ml to 1L, sustains
pressure up to 60 MPa and temperatures up to 175 ºC. Routine
PVT experiments include constant-composition expansion,
differential liberation, constant-volume depletion, and multi-
stage separator tests. All of these experiments are aimed at
emulating the production process in a reservoir through natural
depletion. In addition, other properties such as chemical
composition can be obtained by adding analysis units such as
chromatography tools to the PVT system. Consequently,
current PVT systems are the mainstream technology for fluid
phase behaviour studies in the energy and environmental
industries.17 A typical PVT system, however, requires several
hours to establish a single data point due to large heat and mass
transfer times within the large cell volume. Moreover,
purchasing and operating a commercial PVT system is
expensive, with capital costs in the hundreds of thousands of
dollars. Long wait time and high expenses have motivated
research in alternate phase behaviour characterization
technologies.
2.2 Optical methods
Optical methods offer unique advantages of high sensitivity, in-
situ measurement, automatic detection and potential for
distributed sensing over long distances. Optical methods
employ a variety of principles, namely, chilled mirror,
absorption spectroscopy, Fabry-Perot hygrometry and fiber-
optic reflectometry. A chilled mirror measures the dew point
temperature by using a cooled mirror surface to induce
condensation, and allow monitoring of light adsorption and
scattering effects.18 Absorption spectroscopy is a very sensitive
non-contact technique that acquires a broadband spectrum
covering the vibration frequency unique to the chemical
species.19 The Fabry-Perot hygrometer consists of a multi-
layered material with high and low refractive indices. The
condensed liquid inside the surface material layer changes the
refractive index and shifts the signal wavelength. This technique
has the disadvantage of slow response and coating degradation
after long-term use. 18 The fiber-optic reflectometer detects the
refractive index change associated with phase change via the
reflected signal. The fiber-optic probe installed in an equilibrium
cell can function at high temperatures (300 ºC) and pressures
(30 MPa).20,21 Contamination and fouling of the fiber-optic
requires additional care for long term use.
2.3 Electrical and acoustic methods
Electrical and acoustic methods utilize electrical and acoustic
signals to detect phase change, and are based upon
capacitance, quartz crystal microbalance, surface acoustic
waves and sound speed. A capacitance probe uses moisture-
sensitive dielectric material sandwiched between two
electrodes. The condensed liquid changes the dielectric
constant of the layer material, which can be detected by an
electrical circuit. This approach has the advantage of low
installation costs but is vulnerable to contamination or fouling
from system impurities. A quartz crystal microbalance employs
mechanical oscillation to detect the fluid phase transition. The
condensed phase increases the mass of the oscillator which
decreases the resonance frequency. This technique is widely
used in natural gas moisture measurement because of its high
accuracy (down to 10 ppb). The surface acoustic wave sensor
also tracks the mass change of fluid in contact with the sensor.
Early work shows a sensitivity such that a phase shift of 30º is
equivalent to 3µg/cm2.22 The speed of sound in a fluid is a direct
indicator of fluid density and state of phase. The phase
behaviour of rich gas mixtures was successfully measured by the
decompression wave speed.23
3. Micro/nano-fluidic phase characterization
3.1 Chief benefits of miniaturization: rapid heat and mass transfer
and accessible temperatures and pressures
Compared to bulk-scale conventional methods, microfluidic
approaches leverage unique advantages, including significant
reduction in heat and mass transfer time. In a simple scenario
where fluid is heated by heat convection while flowing through
a section of tube, the temperature of fluid at the outlet (To) can
be predicted by a simple 1-D heat transfer model:
𝑇𝑤 − 𝑇𝑜
𝑇𝑤 − 𝑇𝑖= 𝑒
−4ℎ𝐿
𝜌𝑣𝑐𝑝𝑑
In this equation, Tw represents the wall temperature, h is the
heat transfer coefficient, ρ is the density, and cp is the heat
capacity of a fluid. If all other parameters are fixed, a reduction
in channel dimension d will generate an outlet temperature To
closer to Tw. This relation demonstrates why a smaller channel
enables rapid heat transfer. Miniaturized features in
microfluidic systems also improve mass transfer. Consider a
simple 1-D diffusion model in a tube. At the boundary, the
solute concentration changes from 0 to Co at t = 0+, initiating a
1-D diffusion process through the solvent in the tube. The solute
concentration C at the right interface can be predicted by the
solution to Fick’s second law:
𝐶 = 𝐶0 𝑒𝑟𝑓𝑐(𝐿
2√𝐷𝑡)
The diffusion time is proportional to the square of the length
(t ∝ L2). The relation here clearly indicates that small
dimensions can substantially reduce the time required for
diffusion and equilibrium. In summary, the microscale features
inherent to microfluidic systems provide efficiency in both
energy and mass transport, as compared to bulk-scale
conventional systems.
The inherently small fluid-exposed surface areas in
microfluidic systems, allow for very high fluid pressures with
moderate bonding force. The small fluid volumes also
inherently reduce the impact of a failure. Likewise with proper
material selection, high temperatures are readily accessible.
The result is that, with proper engineering and safety
considerations, microfluidic systems can provide ready access
to high temperatures and pressures that are difficult to achieve
with bulk systems.
3.2 Foundational microfluidic phase characterization methods in
other fields
Protein crystallization characterization. Microfluidic phase
change characterization was first used to investigate the phase
behaviour of biological and biomedical samples, specifically
protein crystallization.24 Experimentally determining the phase
behaviour of bio-macromolecules is of high importance, given
that their two thermodynamic phases – in-solution or
precipitated - inherently govern their biophysical behaviours
and biochemical functions. Conventional techniques are
Figure 1. Typical P-T phase envelope of a reservoir fluid. Dashed lines indicate quality lines. Dash-dot line indicates the production path of a reservoir fluid. The black dot indicates the critical point.
incapable of providing a systematic full-factorial investigation of
these natural complex macromolecules.
Multiplexed microfluidic approaches have been introduced
to reduce sample consumption and measurement time in these
applications. Hansen et al. demonstrated rapid screening of
protein crystallization conditions using a multilayer silicone
elastomer-glass made microfluidic chip with 144 parallel
reactions controlled by on-chip micromechanical valves.24 In a
later study, a microfluidic approach was combined with positive
displacement injection metering, which allowed sequential
injection of precise sample aliquots from a single channel to an
array of reaction chambers. For the first time, large-scale
systematic combinatorial screening enabled rapid mapping of
the crystallization phase diagram, with a 72-fold improvement
in crystallization compared to conventional sparse matrix
screens.25 A phase diagram of twelve protein crystallizations
was generated by massive combinatorial screening.26 In
addition to screening the phase diagram of proteins, kinetic
optimization and protein structures were also experimentally
investigated using micro-reactors exploiting free interface
diffusion.27 Lau et al. upgraded their previous design25 to
include three modules, including a formulation module, a
droplet injector and a two-phase storage module. The
automated chip was used to generate a four-dimensional
solubility phase diagram which included multiple protein
concentrations, precipitant molecular weights, precipitant
concentrations and pH.28
Zheng et al. developed a PDMS microfluidic device to
observe the micrographs of the protein crystals (e.g. lysozyme,
thaumatin, bovine liver catalase and glucose isomerase), where
sample concentration was controlled by varying the flow rates
of dispersed fluids.29 Later, this device was upgraded by
coupling to a glass capillary and performing on-chip X-ray
diffraction to study protein crystallization.30 Gerdts et al. used a
similar principle that combined plug flow induced by flow
focusing and in situ X-ray diffraction to study protein
crystallization.31 Khvostichenko et al. developed a polymer
microfluidic platform using small-angle X-ray scattering to
screen the phase behaviour of lipid mesophases.32
Polymer characterization. An understanding of the phase
diagram of a polymer-solvent mixture is crucial to polymer
preparation, purification and characterization processes.33 Shim
et al. developed a two-layer-structured PDMS phase chip and
leveraged water permeation through PDMS to vary solute
concentration in microdroplets stored in wells, which
successfully measured the concentration-concentration phase
diagram of a mixture of a salt (ammonium sulfate) and a
polymer (poly-ethylene glycol).34 Selimovic developed another
phase chip to screen the temperature-composition phase
diagram of a polymer (ammonium sulfate) system and protein
crystallization (e.g. bovine protein and lysozyme).35 Mao et al.
detected the lower critical solution temperature and
temperature-composition phase diagram of mixed polymer
solutions by introducing temperature gradients in micro-
capillary tubes.36,37 Further, Zhou et al. developed a single-layer
PDMS microchamber to construct the temperature-
composition phase diagram of PNIPAM solutions point by
point.38 Shi et al. continued this work by using the design of the
PDMS microchip with glass capillary 30, and mapping the phase
diagram of PNIPAM solutions under a dark-field microscope.39
Later, Shangguan et al. upgraded the previous device by
replacing PDMS with chemically resistant Teflon and using a
new configuration with low-angle laser scattering to study the
critical temperature and critical concentrations of poly(vinyl
acetate) in solvents of isobutanol and benzene.40
Salt characterization. The precipitation of salts is central to a
wide range of applications. Leng et al. designed a PDMS
microfluidic chip to quantify the crystallization of potassium
chloride (KCl) in water and the temperature-composition phase
diagram of binary systems of docusate sodium salt and
water.41,42 Laval et al. successfully measured the temperature-
concentration phase diagram of adipic acid in water in a PDMS
microfluidic device with temperature gradient set by Peltier
modules and concentration gradients set by varying the flow
rate of solute in dispersed droplets.43 The principle has been
further utilized to study the nucleation kinetics and polymorphs
of an aqueous solution of potassium nitrate.44
Surfactant characterization. Lee et al. successfully generated
the ternary composition phase diagram of a surfactant system
by detecting the fluorescence signal intensity of a mixed fluid
sample in a glass microfluidic chip.45 Blumenschein et al. utilized
magnetic particles as liquid carriers in a microfluidic tube to
detect the phase change of water and surfactant.46
4. Microfluidic phase change characterization for energy
4.1 Microfluidic PVT
PVT systems generally investigate fluids at reservoir conditions
(elevated pressures, high temperatures and harsh chemical
environments) and thus typical microfluidic device materials
(PDMS or PMMA) used for biological applications are no longer
applicable. Marre et al. developed silicon-glass based micro-
reactors and associated packaging hardware for high-pressure
(up to 30 MPa) and high-temperature (up to 400 ºC)
petrochemical applications.47 The flat glass cover allowed clear
visualization of phase and transport behaviour in microchannels
etched in the silicon wafer. Compared to wet-etching (HF) glass-
glass devices, the silicon-glass device demonstrated advantages
in terms of feature resolutions and high depth-to-width ratios
owing to deep reactive ion etching (DRIE). The maximum
pressure depends largely on the total area of the channels,
bonding quality and access wells. The use of overburden cells
has recently enabled pressures up to 86 MPa (Table 1).48,49
While expensive and labour intensive to fabricate, silicon-glass
microfluidics are the norm for microfluidic PVT systems.
Mostowfi et al. developed the first microfluidic PVT system
capable of detecting the bubble point of multi-component
hydrocarbons (Table 1).50 The device was fabricated by
standard silicon lithography, reactive ion etching and anodic
bonding. As shown in Fig. 2a, hydrocarbon mixtures in the liquid
phase flowed into a long serpentine channel which exerted a
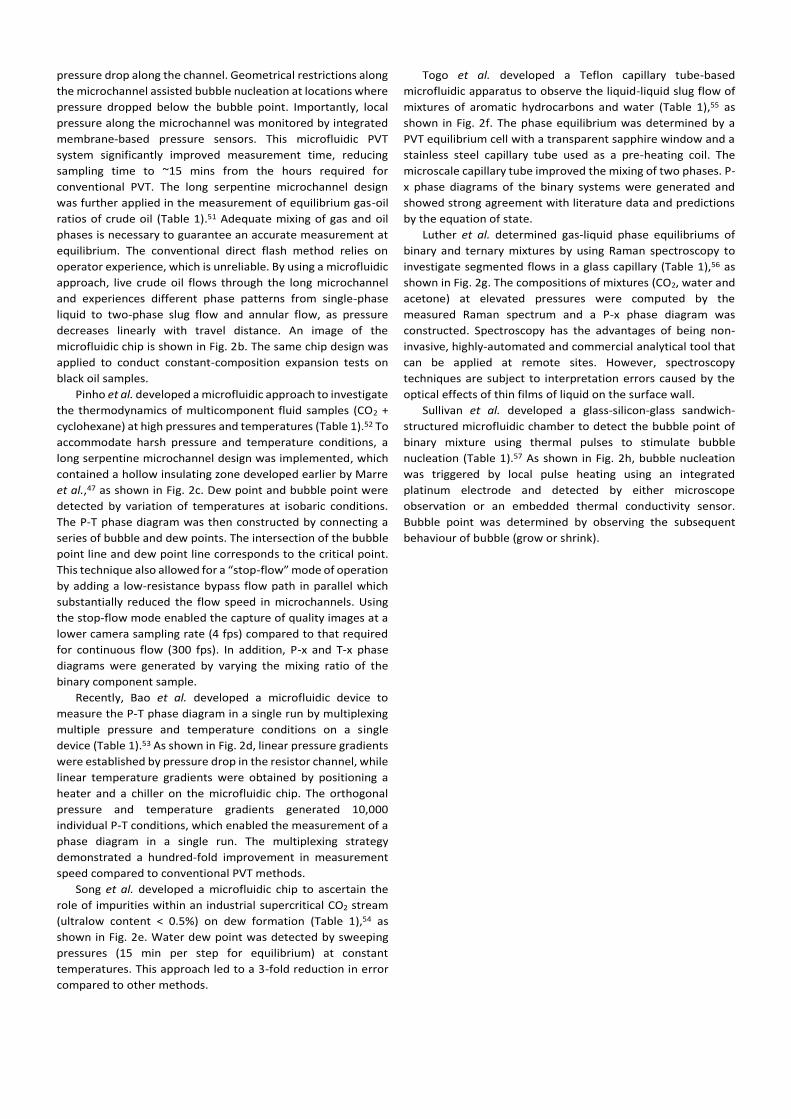
pressure drop along the channel. Geometrical restrictions along
the microchannel assisted bubble nucleation at locations where
pressure dropped below the bubble point. Importantly, local
pressure along the microchannel was monitored by integrated
membrane-based pressure sensors. This microfluidic PVT
system significantly improved measurement time, reducing
sampling time to ~15 mins from the hours required for
conventional PVT. The long serpentine microchannel design
was further applied in the measurement of equilibrium gas-oil
ratios of crude oil (Table 1).51 Adequate mixing of gas and oil
phases is necessary to guarantee an accurate measurement at
equilibrium. The conventional direct flash method relies on
operator experience, which is unreliable. By using a microfluidic
approach, live crude oil flows through the long microchannel
and experiences different phase patterns from single-phase
liquid to two-phase slug flow and annular flow, as pressure
decreases linearly with travel distance. An image of the
microfluidic chip is shown in Fig. 2b. The same chip design was
applied to conduct constant-composition expansion tests on
black oil samples.
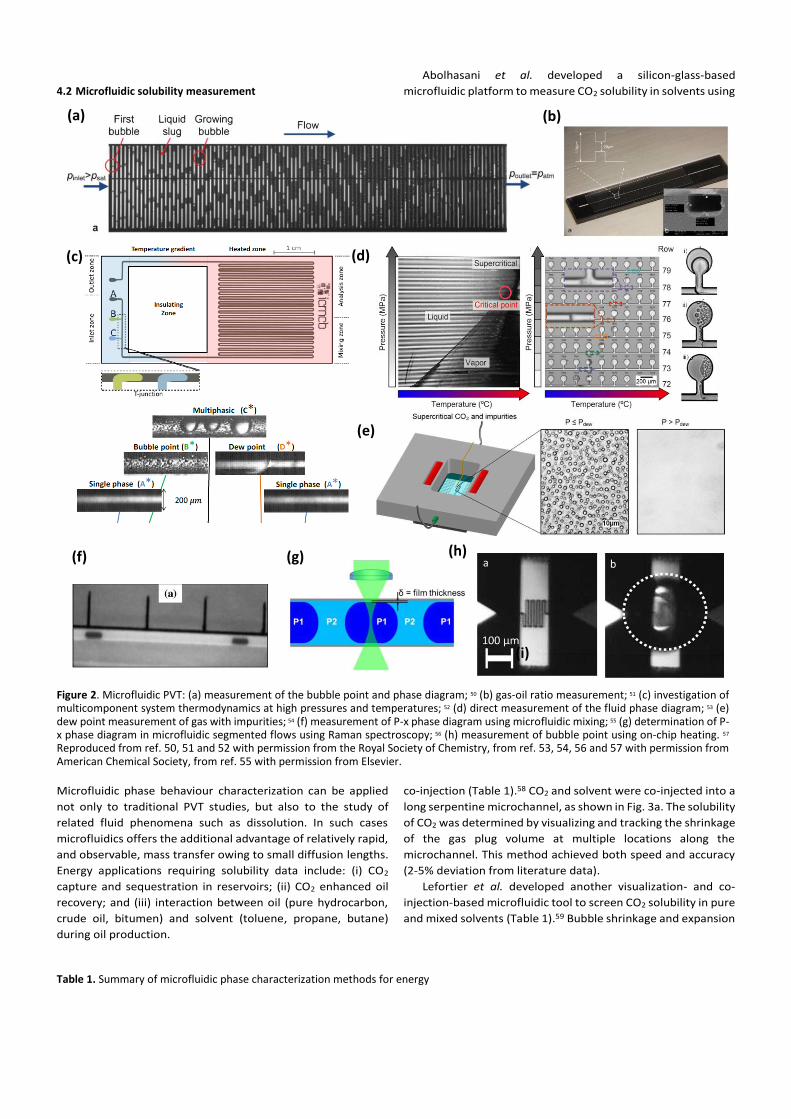
Pinho et al. developed a microfluidic approach to investigate
the thermodynamics of multicomponent fluid samples (CO2 +
cyclohexane) at high pressures and temperatures (Table 1).52 To
accommodate harsh pressure and temperature conditions, a
long serpentine microchannel design was implemented, which
contained a hollow insulating zone developed earlier by Marre
et al.,47 as shown in Fig. 2c. Dew point and bubble point were
detected by variation of temperatures at isobaric conditions.
The P-T phase diagram was then constructed by connecting a
series of bubble and dew points. The intersection of the bubble
point line and dew point line corresponds to the critical point.
This technique also allowed for a “stop-flow” mode of operation
by adding a low-resistance bypass flow path in parallel which
substantially reduced the flow speed in microchannels. Using
the stop-flow mode enabled the capture of quality images at a
lower camera sampling rate (4 fps) compared to that required
for continuous flow (300 fps). In addition, P-x and T-x phase
diagrams were generated by varying the mixing ratio of the
binary component sample.
Recently, Bao et al. developed a microfluidic device to
measure the P-T phase diagram in a single run by multiplexing
multiple pressure and temperature conditions on a single
device (Table 1).53 As shown in Fig. 2d, linear pressure gradients
were established by pressure drop in the resistor channel, while
linear temperature gradients were obtained by positioning a
heater and a chiller on the microfluidic chip. The orthogonal
pressure and temperature gradients generated 10,000
individual P-T conditions, which enabled the measurement of a
phase diagram in a single run. The multiplexing strategy
demonstrated a hundred-fold improvement in measurement
speed compared to conventional PVT methods.
Song et al. developed a microfluidic chip to ascertain the
role of impurities within an industrial supercritical CO2 stream
(ultralow content < 0.5%) on dew formation (Table 1),54 as
shown in Fig. 2e. Water dew point was detected by sweeping
pressures (15 min per step for equilibrium) at constant
temperatures. This approach led to a 3-fold reduction in error
compared to other methods.
Togo et al. developed a Teflon capillary tube-based
microfluidic apparatus to observe the liquid-liquid slug flow of
mixtures of aromatic hydrocarbons and water (Table 1),55 as
shown in Fig. 2f. The phase equilibrium was determined by a
PVT equilibrium cell with a transparent sapphire window and a
stainless steel capillary tube used as a pre-heating coil. The
microscale capillary tube improved the mixing of two phases. P-
x phase diagrams of the binary systems were generated and
showed strong agreement with literature data and predictions
by the equation of state.
Luther et al. determined gas-liquid phase equilibriums of
binary and ternary mixtures by using Raman spectroscopy to
investigate segmented flows in a glass capillary (Table 1),56 as
shown in Fig. 2g. The compositions of mixtures (CO2, water and
acetone) at elevated pressures were computed by the
measured Raman spectrum and a P-x phase diagram was
constructed. Spectroscopy has the advantages of being non-
invasive, highly-automated and commercial analytical tool that
can be applied at remote sites. However, spectroscopy
techniques are subject to interpretation errors caused by the
optical effects of thin films of liquid on the surface wall.
Sullivan et al. developed a glass-silicon-glass sandwich-
structured microfluidic chamber to detect the bubble point of
binary mixture using thermal pulses to stimulate bubble
nucleation (Table 1).57 As shown in Fig. 2h, bubble nucleation
was triggered by local pulse heating using an integrated
platinum electrode and detected by either microscope
observation or an embedded thermal conductivity sensor.
Bubble point was determined by observing the subsequent
behaviour of bubble (grow or shrink).
4.2 Microfluidic solubility measurement
Microfluidic phase behaviour characterization can be applied
not only to traditional PVT studies, but also to the study of
related fluid phenomena such as dissolution. In such cases
microfluidics offers the additional advantage of relatively rapid,
and observable, mass transfer owing to small diffusion lengths.
Energy applications requiring solubility data include: (i) CO2
capture and sequestration in reservoirs; (ii) CO2 enhanced oil
recovery; and (iii) interaction between oil (pure hydrocarbon,
crude oil, bitumen) and solvent (toluene, propane, butane)
during oil production.
Abolhasani et al. developed a silicon-glass-based
microfluidic platform to measure CO2 solubility in solvents using
co-injection (Table 1).58 CO2 and solvent were co-injected into a
long serpentine microchannel, as shown in Fig. 3a. The solubility
of CO2 was determined by visualizing and tracking the shrinkage
of the gas plug volume at multiple locations along the
microchannel. This method achieved both speed and accuracy
(2-5% deviation from literature data).
Lefortier et al. developed another visualization- and co-
injection-based microfluidic tool to screen CO2 solubility in pure
and mixed solvents (Table 1).59 Bubble shrinkage and expansion
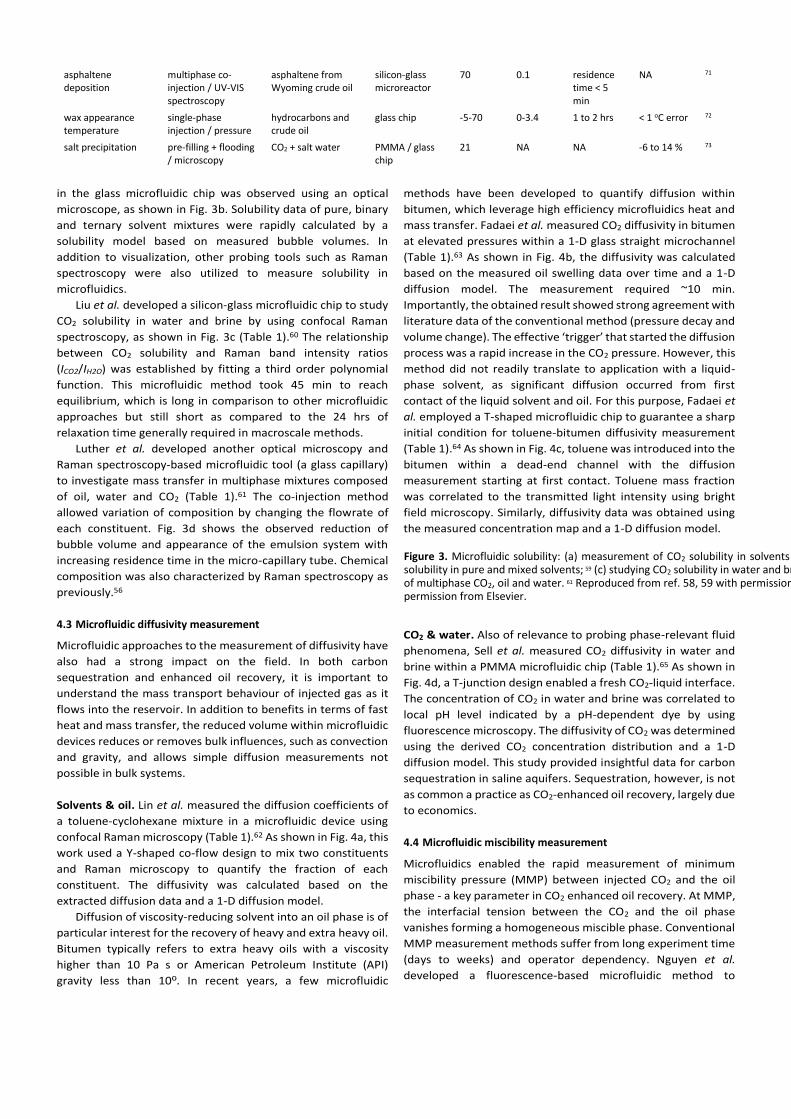
Table 1. Summary of microfluidic phase characterization methods for energy
(c) (d)
(e)
(f) (g)
(i)
(a) (b)
(h)
Figure 2. Microfluidic PVT: (a) measurement of the bubble point and phase diagram; 50 (b) gas-oil ratio measurement; 51 (c) investigation of multicomponent system thermodynamics at high pressures and temperatures; 52 (d) direct measurement of the fluid phase diagram; 53 (e) dew point measurement of gas with impurities; 54 (f) measurement of P-x phase diagram using microfluidic mixing; 55 (g) determination of P-x phase diagram in microfluidic segmented flows using Raman spectroscopy; 56 (h) measurement of bubble point using on-chip heating. 57
Reproduced from ref. 50, 51 and 52 with permission from the Royal Society of Chemistry, from ref. 53, 54, 56 and 57 with permission from American Chemical Society, from ref. 55 with permission from Elsevier.
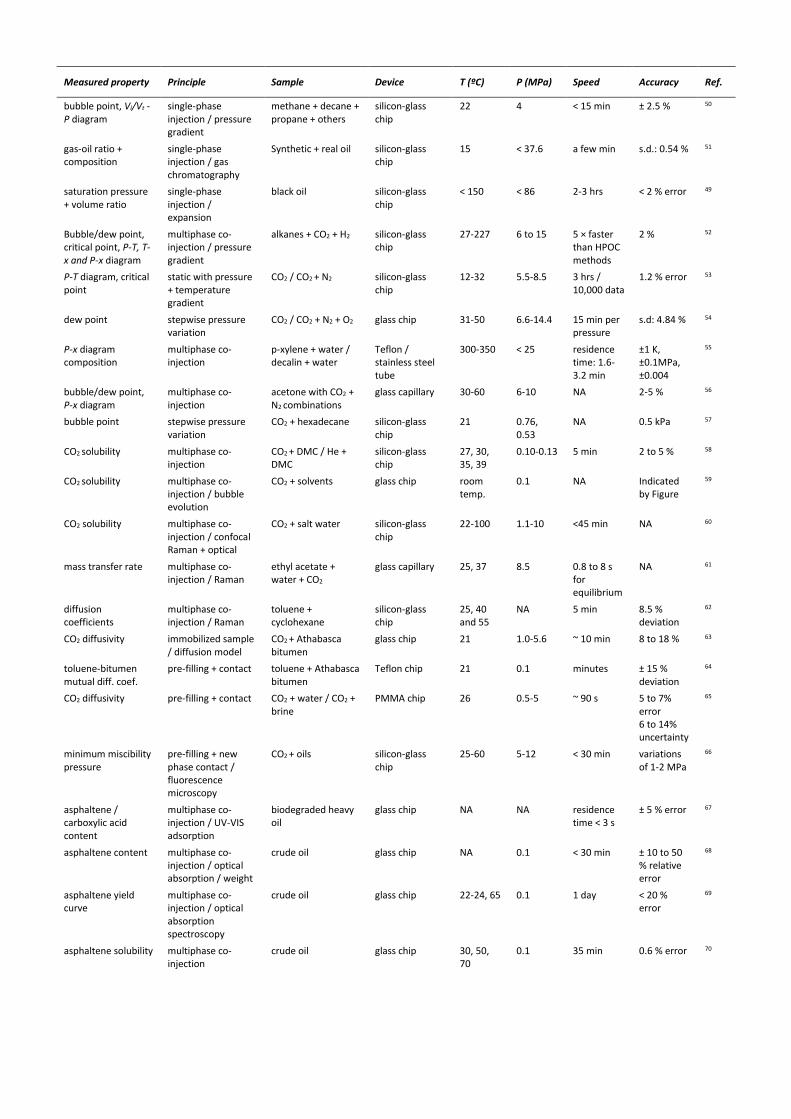
Measured property Principle Sample Device T (ºC) P (MPa) Speed Accuracy Ref.
bubble point, Vl/Vt - P diagram
single-phase injection / pressure gradient
methane + decane + propane + others
silicon-glass chip
22 4 < 15 min ± 2.5 % 50
gas-oil ratio + composition
single-phase injection / gas chromatography
Synthetic + real oil silicon-glass chip
15 < 37.6 a few min s.d.: 0.54 % 51
saturation pressure + volume ratio
single-phase injection / expansion
black oil silicon-glass chip
< 150
< 86
2-3 hrs < 2 % error 49
Bubble/dew point, critical point, P-T, T-x and P-x diagram
multiphase co-injection / pressure gradient
alkanes + CO2 + H2
silicon-glass chip
27-227 6 to 15 5 × faster than HPOC methods
2 % 52
P-T diagram, critical point
static with pressure + temperature gradient
CO2 / CO2 + N2 silicon-glass chip
12-32 5.5-8.5 3 hrs / 10,000 data
1.2 % error 53
dew point stepwise pressure variation
CO2 / CO2 + N2 + O2
glass chip 31-50 6.6-14.4 15 min per pressure
s.d: 4.84 % 54
P-x diagram composition
multiphase co-injection
p-xylene + water / decalin + water
Teflon / stainless steel tube
300-350 < 25 residence time: 1.6-3.2 min
±1 K, ±0.1MPa, ±0.004
55
bubble/dew point, P-x diagram
multiphase co-injection
acetone with CO2 + N2 combinations
glass capillary 30-60 6-10 NA 2-5 % 56
bubble point stepwise pressure variation
CO2 + hexadecane
silicon-glass chip
21 0.76, 0.53
NA 0.5 kPa 57
CO2 solubility multiphase co-injection
CO2 + DMC / He + DMC
silicon-glass chip
27, 30, 35, 39
0.10-0.13 5 min 2 to 5 % 58
CO2 solubility multiphase co-injection / bubble evolution
CO2 + solvents glass chip room temp.
0.1 NA Indicated by Figure
59
CO2 solubility multiphase co-injection / confocal Raman + optical
CO2 + salt water silicon-glass chip
22-100 1.1-10 <45 min NA 60
mass transfer rate multiphase co-injection / Raman
ethyl acetate + water + CO2
glass capillary 25, 37 8.5 0.8 to 8 s for equilibrium
NA 61
diffusion coefficients
multiphase co-injection / Raman
toluene + cyclohexane
silicon-glass chip
25, 40 and 55
NA 5 min 8.5 % deviation
62
CO2 diffusivity immobilized sample / diffusion model
CO2 + Athabasca bitumen
glass chip 21 1.0-5.6 ~ 10 min 8 to 18 % 63
toluene-bitumen mutual diff. coef.
pre-filling + contact toluene + Athabasca bitumen
Teflon chip 21 0.1 minutes ± 15 % deviation
64
CO2 diffusivity pre-filling + contact CO2 + water / CO2 + brine
PMMA chip 26 0.5-5 ~ 90 s 5 to 7% error 6 to 14% uncertainty
65
minimum miscibility pressure
pre-filling + new phase contact / fluorescence microscopy
CO2 + oils silicon-glass chip
25-60 5-12 < 30 min variations of 1-2 MPa
66
asphaltene / carboxylic acid content
multiphase co-injection / UV-VIS adsorption
biodegraded heavy oil
glass chip NA NA residence time < 3 s
± 5 % error 67
asphaltene content multiphase co-injection / optical absorption / weight
crude oil glass chip NA 0.1 < 30 min ± 10 to 50 % relative error
68
asphaltene yield curve
multiphase co-injection / optical absorption spectroscopy
crude oil glass chip 22-24, 65 0.1 1 day < 20 % error
69
asphaltene solubility multiphase co-injection
crude oil glass chip 30, 50, 70
0.1 35 min 0.6 % error 70
asphaltene deposition
multiphase co-injection / UV-VIS spectroscopy
asphaltene from Wyoming crude oil
silicon-glass microreactor
70 0.1 residence time < 5 min
NA 71
wax appearance temperature
single-phase injection / pressure
hydrocarbons and crude oil
glass chip -5-70 0-3.4 1 to 2 hrs < 1 oC error 72
salt precipitation pre-filling + flooding / microscopy
CO2 + salt water PMMA / glass chip
21 NA NA -6 to 14 % 73
in the glass microfluidic chip was observed using an optical
microscope, as shown in Fig. 3b. Solubility data of pure, binary
and ternary solvent mixtures were rapidly calculated by a
solubility model based on measured bubble volumes. In
addition to visualization, other probing tools such as Raman
spectroscopy were also utilized to measure solubility in
microfluidics.
Liu et al. developed a silicon-glass microfluidic chip to study
CO2 solubility in water and brine by using confocal Raman
spectroscopy, as shown in Fig. 3c (Table 1).60 The relationship
between CO2 solubility and Raman band intensity ratios
(ICO2/IH2O) was established by fitting a third order polynomial
function. This microfluidic method took 45 min to reach
equilibrium, which is long in comparison to other microfluidic
approaches but still short as compared to the 24 hrs of
relaxation time generally required in macroscale methods.
Luther et al. developed another optical microscopy and
Raman spectroscopy-based microfluidic tool (a glass capillary)
to investigate mass transfer in multiphase mixtures composed
of oil, water and CO2 (Table 1).61 The co-injection method
allowed variation of composition by changing the flowrate of
each constituent. Fig. 3d shows the observed reduction of
bubble volume and appearance of the emulsion system with
increasing residence time in the micro-capillary tube. Chemical
composition was also characterized by Raman spectroscopy as
previously.56
4.3 Microfluidic diffusivity measurement
Microfluidic approaches to the measurement of diffusivity have
also had a strong impact on the field. In both carbon
sequestration and enhanced oil recovery, it is important to
understand the mass transport behaviour of injected gas as it
flows into the reservoir. In addition to benefits in terms of fast
heat and mass transfer, the reduced volume within microfluidic
devices reduces or removes bulk influences, such as convection
and gravity, and allows simple diffusion measurements not
possible in bulk systems.
Solvents & oil. Lin et al. measured the diffusion coefficients of
a toluene-cyclohexane mixture in a microfluidic device using
confocal Raman microscopy (Table 1).62 As shown in Fig. 4a, this
work used a Y-shaped co-flow design to mix two constituents
and Raman microscopy to quantify the fraction of each
constituent. The diffusivity was calculated based on the
extracted diffusion data and a 1-D diffusion model.
Diffusion of viscosity-reducing solvent into an oil phase is of
particular interest for the recovery of heavy and extra heavy oil.
Bitumen typically refers to extra heavy oils with a viscosity
higher than 10 Pa s or American Petroleum Institute (API)
gravity less than 10º. In recent years, a few microfluidic
methods have been developed to quantify diffusion within
bitumen, which leverage high efficiency microfluidics heat and
mass transfer. Fadaei et al. measured CO2 diffusivity in bitumen
at elevated pressures within a 1-D glass straight microchannel
(Table 1).63 As shown in Fig. 4b, the diffusivity was calculated
based on the measured oil swelling data over time and a 1-D
diffusion model. The measurement required ~10 min.
Importantly, the obtained result showed strong agreement with
literature data of the conventional method (pressure decay and
volume change). The effective ‘trigger’ that started the diffusion
process was a rapid increase in the CO2 pressure. However, this
method did not readily translate to application with a liquid-
phase solvent, as significant diffusion occurred from first
contact of the liquid solvent and oil. For this purpose, Fadaei et
al. employed a T-shaped microfluidic chip to guarantee a sharp
initial condition for toluene-bitumen diffusivity measurement
(Table 1).64 As shown in Fig. 4c, toluene was introduced into the
bitumen within a dead-end channel with the diffusion
measurement starting at first contact. Toluene mass fraction
was correlated to the transmitted light intensity using bright
field microscopy. Similarly, diffusivity data was obtained using
the measured concentration map and a 1-D diffusion model.
CO2 & water. Also of relevance to probing phase-relevant fluid
phenomena, Sell et al. measured CO2 diffusivity in water and
brine within a PMMA microfluidic chip (Table 1).65 As shown in
Fig. 4d, a T-junction design enabled a fresh CO2-liquid interface.
The concentration of CO2 in water and brine was correlated to
local pH level indicated by a pH-dependent dye by using
fluorescence microscopy. The diffusivity of CO2 was determined
using the derived CO2 concentration distribution and a 1-D
diffusion model. This study provided insightful data for carbon
sequestration in saline aquifers. Sequestration, however, is not
as common a practice as CO2-enhanced oil recovery, largely due
to economics.
4.4 Microfluidic miscibility measurement
Microfluidics enabled the rapid measurement of minimum
miscibility pressure (MMP) between injected CO2 and the oil
phase - a key parameter in CO2 enhanced oil recovery. At MMP,
the interfacial tension between the CO2 and the oil phase
vanishes forming a homogeneous miscible phase. Conventional
MMP measurement methods suffer from long experiment time
(days to weeks) and operator dependency. Nguyen et al.
developed a fluorescence-based microfluidic method to
Figure 3. Microfluidic solubility: (a) measurement of CO2 solubility in solvents by evaluating gas plug sizes; 58 (b) rapid screening of CO2 solubility in pure and mixed solvents; 59 (c) studying CO2 solubility in water and brine using confocal Raman spectroscopy; 60 (d) investigation of multiphase CO2, oil and water. 61 Reproduced from ref. 58, 59 with permission from the Royal Society of Chemistry, from ref. 60, 61 with permission from Elsevier.
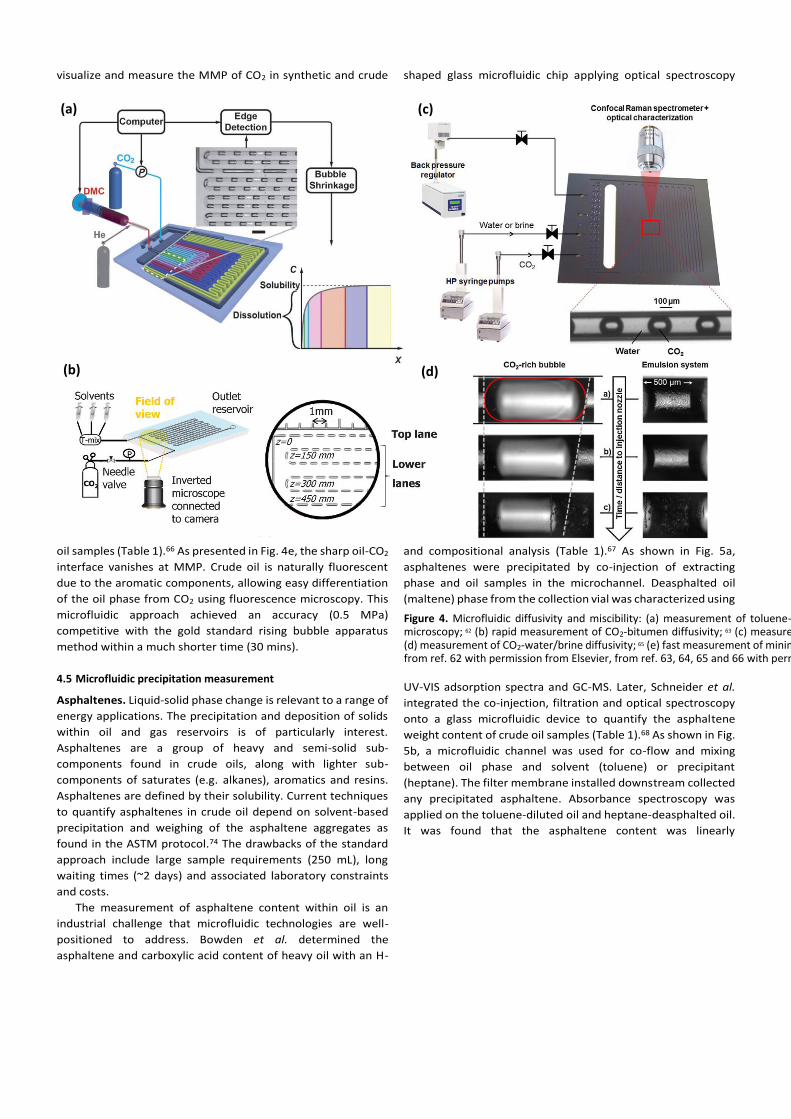
visualize and measure the MMP of CO2 in synthetic and crude
oil samples (Table 1).66 As presented in Fig. 4e, the sharp oil-CO2
interface vanishes at MMP. Crude oil is naturally fluorescent
due to the aromatic components, allowing easy differentiation
of the oil phase from CO2 using fluorescence microscopy. This
microfluidic approach achieved an accuracy (0.5 MPa)
competitive with the gold standard rising bubble apparatus
method within a much shorter time (30 mins).
4.5 Microfluidic precipitation measurement
Asphaltenes. Liquid-solid phase change is relevant to a range of
energy applications. The precipitation and deposition of solids
within oil and gas reservoirs is of particularly interest.
Asphaltenes are a group of heavy and semi-solid sub-
components found in crude oils, along with lighter sub-
components of saturates (e.g. alkanes), aromatics and resins.
Asphaltenes are defined by their solubility. Current techniques
to quantify asphaltenes in crude oil depend on solvent-based
precipitation and weighing of the asphaltene aggregates as
found in the ASTM protocol.74 The drawbacks of the standard
approach include large sample requirements (250 mL), long
waiting times (~2 days) and associated laboratory constraints
and costs.
The measurement of asphaltene content within oil is an
industrial challenge that microfluidic technologies are well-
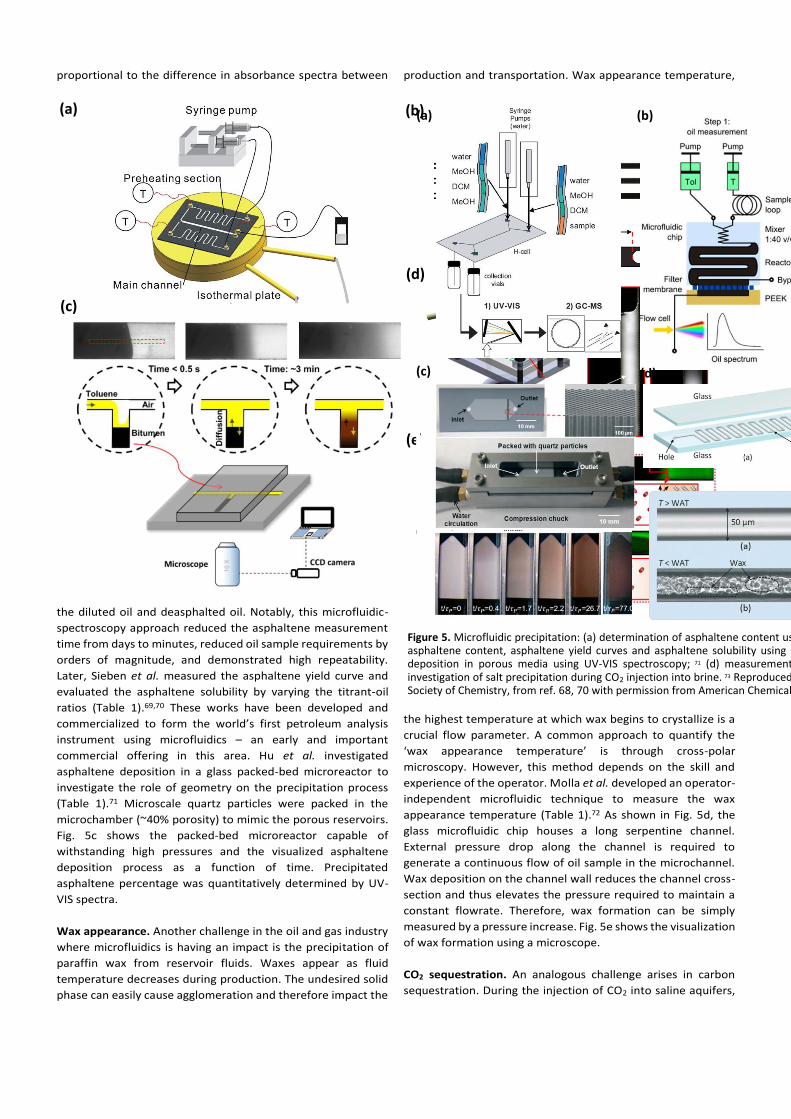
positioned to address. Bowden et al. determined the
asphaltene and carboxylic acid content of heavy oil with an H-
shaped glass microfluidic chip applying optical spectroscopy
and compositional analysis (Table 1).67 As shown in Fig. 5a,
asphaltenes were precipitated by co-injection of extracting
phase and oil samples in the microchannel. Deasphalted oil
(maltene) phase from the collection vial was characterized using
UV-VIS adsorption spectra and GC-MS. Later, Schneider et al.
integrated the co-injection, filtration and optical spectroscopy
onto a glass microfluidic device to quantify the asphaltene
weight content of crude oil samples (Table 1).68 As shown in Fig.
5b, a microfluidic channel was used for co-flow and mixing
between oil phase and solvent (toluene) or precipitant
(heptane). The filter membrane installed downstream collected
any precipitated asphaltene. Absorbance spectroscopy was
applied on the toluene-diluted oil and heptane-deasphalted oil.
It was found that the asphaltene content was linearly
(a) (c)
(b) (d)
Figure 4. Microfluidic diffusivity and miscibility: (a) measurement of toluene-cyclohexane diffusion coefficients using confocal Raman microscopy; 62 (b) rapid measurement of CO2-bitumen diffusivity; 63 (c) measurement of bitumen-toluene mutual diffusion coefficients; 64 (d) measurement of CO2-water/brine diffusivity; 65 (e) fast measurement of minimum miscibility pressure of CO2 in crude oils. 66 Reproduced from ref. 62 with permission from Elsevier, from ref. 63, 64, 65 and 66 with permission from American Chemical Society.
proportional to the difference in absorbance spectra between
the diluted oil and deasphalted oil. Notably, this microfluidic-
spectroscopy approach reduced the asphaltene measurement
time from days to minutes, reduced oil sample requirements by
orders of magnitude, and demonstrated high repeatability.
Later, Sieben et al. measured the asphaltene yield curve and
evaluated the asphaltene solubility by varying the titrant-oil
ratios (Table 1).69,70 These works have been developed and
commercialized to form the world’s first petroleum analysis
instrument using microfluidics – an early and important
commercial offering in this area. Hu et al. investigated
asphaltene deposition in a glass packed-bed microreactor to
investigate the role of geometry on the precipitation process
(Table 1).71 Microscale quartz particles were packed in the
microchamber (~40% porosity) to mimic the porous reservoirs.
Fig. 5c shows the packed-bed microreactor capable of
withstanding high pressures and the visualized asphaltene
deposition process as a function of time. Precipitated
asphaltene percentage was quantitatively determined by UV-
VIS spectra.
Wax appearance. Another challenge in the oil and gas industry
where microfluidics is having an impact is the precipitation of
paraffin wax from reservoir fluids. Waxes appear as fluid
temperature decreases during production. The undesired solid
phase can easily cause agglomeration and therefore impact the
production and transportation. Wax appearance temperature,
the highest temperature at which wax begins to crystallize is a
crucial flow parameter. A common approach to quantify the
‘wax appearance temperature’ is through cross-polar
microscopy. However, this method depends on the skill and
experience of the operator. Molla et al. developed an operator-
independent microfluidic technique to measure the wax
appearance temperature (Table 1).72 As shown in Fig. 5d, the
glass microfluidic chip houses a long serpentine channel.
External pressure drop along the channel is required to
generate a continuous flow of oil sample in the microchannel.
Wax deposition on the channel wall reduces the channel cross-
section and thus elevates the pressure required to maintain a
constant flowrate. Therefore, wax formation can be simply
measured by a pressure increase. Fig. 5e shows the visualization
of wax formation using a microscope.
CO2 sequestration. An analogous challenge arises in carbon
sequestration. During the injection of CO2 into saline aquifers,
(a) (b)
(c)
(d)
(e)
(b)(a)
(c) (d) (e)
Figure 5. Microfluidic precipitation: (a) determination of asphaltene content using UV-VIS spectroscopy and GC-MS; 67 (b) measurement of asphaltene content, asphaltene yield curves and asphaltene solubility using optical spectroscopy; 68, 69, 70 (c) investigation of asphaltene deposition in porous media using UV-VIS spectroscopy; 71 (d) measurement of wax appearance temperature of hydrocarbons; 72 (e) investigation of salt precipitation during CO2 injection into brine. 73 Reproduced from ref. 67, 69, 71, 72, 73 with permission from the Royal Society of Chemistry, from ref. 68, 70 with permission from American Chemical Society.
the drying effect of the CO2 results in salt precipitation that
blocks pores within the media and thus slows or even stops the
process. Considering the complexity of porous media, it is
challenging to characterize the salt precipitation using existing
laboratory analysis. Kim et al. investigated pore-scale salt
precipitation dynamics using a transparent plastic microfluidic
chip (Table 1).73 As shown in Fig. 5e, a random 2D channel
network was patterned on the PMMA-made chip where CO2
was injected to the pre-filled brine solution. Salt crystal growth
was observed by using bright-field and fluorescence
microscopy. It was found that porosity decreased ~15% to ~25%
after CO2 flooding.
5. Nanofluidic phase change visualization
In contrast to microfluidic systems, research in phase behaviour
at the nanoscale has not been motivated by ease of use, speed
or relevance-to-bulk but rather applicability to nanoporous
systems, and buoyed by the boom in unconventional oil and gas
resources.75,76,77 The vast amount of hydrocarbons reside in
pores with sizes ranging from one to hundreds of
nanometers.78,79 Nanofluidic phenomena also play a central role
in, for instance, the transpiration and ascent of sap in trees,
drying stresses in soil and concrete, smart drug delivery
strategies, hydrodynamic cavitation in hydraulic valves and
around propeller blades and transport in synthetic trees.10
Models based on the equation of state can accommodate
factors such as capillary pressure, critical point shift, and solid-
fluid interactions.80,81,82,83,84,85 The Peng-Robinson equation of
state can be combined with engineering density functional
theory to study the phase behaviour of pure substances and
mixtures.86 Molecular dynamics simulations are also a powerful
tool to study adsorption and the transport of fluids near
surfaces under nano-confinement. Density at a position of few
molecular layers next to a wall has been found to be typically
higher than in the centre of nanopores, which is indicative of
the role of adsorption phenomena in nanopores.87,88,89,90 These
studies have predicted that fluid phase behaviour under nano-
sized confinement deviates from that in the bulk state. These
models, each using different factors, inevitably have led to
disagreeing predictions.80,81,82,83,84,85 Molecular dynamic
simulations compute molecular interactions and predict
molecular distributions in nanoconfined environments,
however, they are incapable of modelling complicated solid-
fluid interactions, surface roughness and surface wettability. A
gap exists between these models and practical operation. There
is an urgent need for measurements to verify these models and
inform onsite production. Recent studies on fluid phase
behaviour at the nanoscale are primarily motivated by
understanding the fundamentals of specific thermodynamic
processes, such as evaporation, cavitation, boiling,
condensation, adsorption and desorption.
5.1 Current nanofluidic phase change visualization approaches
Nanopores. Nagashima et al. achieved bubble nucleation in an
electrolyte solution within a nanopore with extreme
superheating by Joule heating using an electrical pulse.91
Witharana et al. measured the bubble nucleation temperature
of water in nano- and micro-sized cavities and posts and found
measurements agreed with predictions by the Young-Laplace
equation. The overall trend indicated that boiling in confined
geometries requires a higher superheating temperature.92
Nanoporous networks. Vincent et al. investigated the drying-
induced cavitation in porous media of nanometer-sized pores
and found that fluid dynamics were governed by the interaction
of deterministic mass transport and a stochastic nucleation
process.93 He et al. validated surfactant performance in oil
displacement experiment using a nanofluidic device with both
homogeneous and heterogeneous pore structures. Weakly
emulsifying surfactant was found to yield higher oil recovery
than a non-surfactant-bearing control fluid.94 Recently, Kelly et
al. developed a micro/nanofluidic 2D network that resembles
the granular and fractured nanoporous media of shale rock.95
An imbibition experiment was conducted on IPA-water and air
and visualized by differential interference contrast microscopy.
Gruener et al. studied the imbibition dynamics of alkanes in
nanometer-sized cylindrical pores.96
Packed beds and consolidated porous media. Ally et. al
visualized the condensation of propane and CO2 in packed beds
(Table 2).97 As shown in Fig. 6a, a silicon-glass microfluidic chip
was filled with silica particles (150 nm diameter) which formed
a packed bed of pore throats with an average diameter of 15
nm. Direct observation of the colour and appearance of the
packed beds was enabled by optical microscopy. The bottom
part of Fig. 6a shows the colour change in the packed bed during
propane condensation under isothermal pressurization. The
results indicate that capillary condensation depends on pore
geometry and wettability, and that complete pore filling occurs
at a meniscus radius much below the interstitial pore radii of
the packed bed.
There has also been recent work in nano-scale capillary-
driven flow and imbibition triggered by capillary condensation
using a 3D porous silicon layer.98,99 3D porous silicon layer
represents an important 3D structure for future nanofluidic
phase studies.
Nanochannels. Nanofluidic visualization experiments have
enabled direct observation of flow behaviours in nanochannels,
including capillary filling, imbibition, pressure-driven flow and
multiphase displacement measurements. Duan et al. conducted
an evaporation-induced cavitation experiment in nanochannels
and found a unique phenomenon, where water menisci
remained pinned at the entrance while vapour columns expand
inside.100 Eijkel et al. found that corner flow effects can strongly
accelerate the drying process in nanochannels.101 Tas et al.
studied the capillary filling of water in 100-nm deep channels. It
was found that fluid filling in nanochannels behaved as
predicted by the Washburn model. However, apparent viscosity
was elevated due to electro-viscous effects at the boundary
surface.102 Phan et al. investigated the capillary filling in dead-
end nanochannels and observed two distinct stages.103 Wu et
al. studied pressure-driven flow and observed stratified flow
and annular flow in the liquid and gas displacement experiment
in 100 nm deep channels.104 Liu et al. studied oil/water
displacement in 500 nm deep channels using epi-fluorescence
and confocal microscopy. A residual water phase was found in
the oil phase that can increase superficial velocity and
potentially affect the permeability.105 Chauvet et al. examined
the roles of trapped gas bubbles in capillary filling of
nanoslits.106
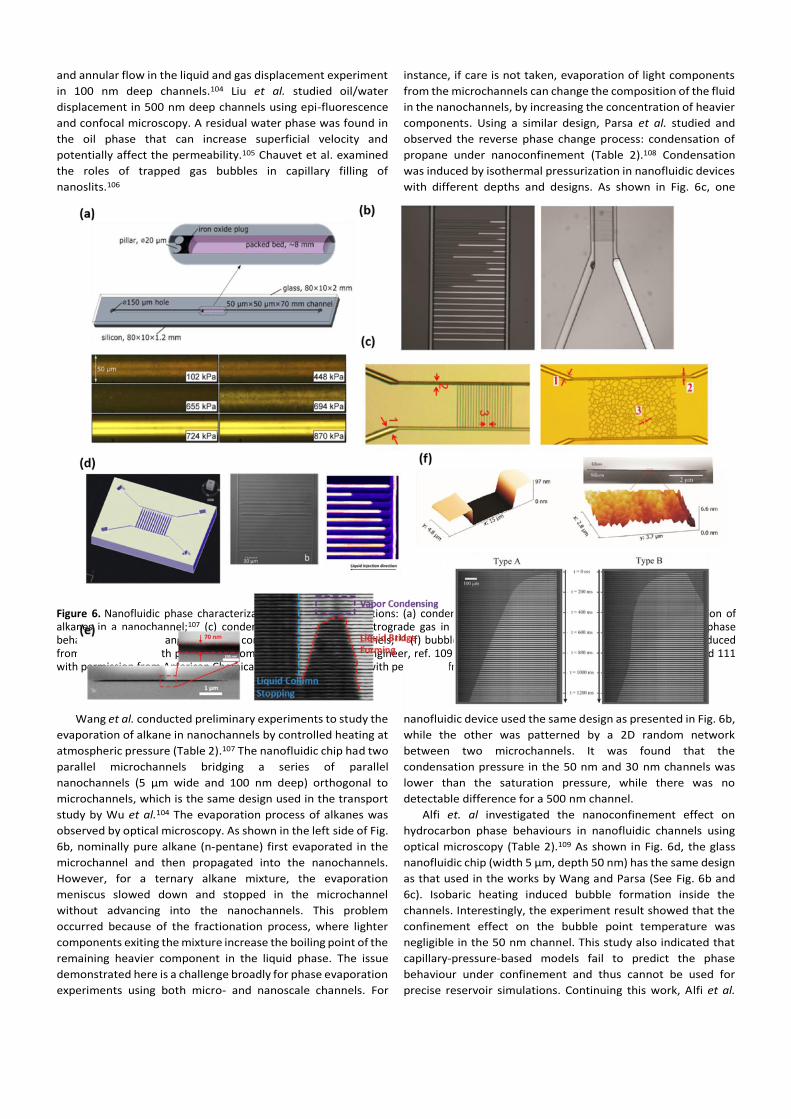
Wang et al. conducted preliminary experiments to study the
evaporation of alkane in nanochannels by controlled heating at
atmospheric pressure (Table 2).107 The nanofluidic chip had two
parallel microchannels bridging a series of parallel
nanochannels (5 μm wide and 100 nm deep) orthogonal to
microchannels, which is the same design used in the transport
study by Wu et al.104 The evaporation process of alkanes was
observed by optical microscopy. As shown in the left side of Fig.
6b, nominally pure alkane (n-pentane) first evaporated in the
microchannel and then propagated into the nanochannels.
However, for a ternary alkane mixture, the evaporation
meniscus slowed down and stopped in the microchannel
without advancing into the nanochannels. This problem
occurred because of the fractionation process, where lighter
components exiting the mixture increase the boiling point of the
remaining heavier component in the liquid phase. The issue
demonstrated here is a challenge broadly for phase evaporation
experiments using both micro- and nanoscale channels. For
instance, if care is not taken, evaporation of light components
from the microchannels can change the composition of the fluid
in the nanochannels, by increasing the concentration of heavier
components. Using a similar design, Parsa et al. studied and
observed the reverse phase change process: condensation of
propane under nanoconfinement (Table 2).108 Condensation
was induced by isothermal pressurization in nanofluidic devices
with different depths and designs. As shown in Fig. 6c, one
nanofluidic device used the same design as presented in Fig. 6b,
while the other was patterned by a 2D random network
between two microchannels. It was found that the
condensation pressure in the 50 nm and 30 nm channels was
lower than the saturation pressure, while there was no
detectable difference for a 500 nm channel.
Alfi et. al investigated the nanoconfinement effect on
hydrocarbon phase behaviours in nanofluidic channels using
optical microscopy (Table 2).109 As shown in Fig. 6d, the glass
nanofluidic chip (width 5 μm, depth 50 nm) has the same design
as that used in the works by Wang and Parsa (See Fig. 6b and
6c). Isobaric heating induced bubble formation inside the
channels. Interestingly, the experiment result showed that the
confinement effect on the bubble point temperature was
negligible in the 50 nm channel. This study also indicated that
capillary-pressure-based models fail to predict the phase
behaviour under confinement and thus cannot be used for
precise reservoir simulations. Continuing this work, Alfi et al.
Figure 6. Nanofluidic phase characterization for energy applications: (a) condensation in nanoporous packed beds;97 (b) evaporation of alkanes in a nanochannel;107 (c) condensation of petroleum retrograde gas in nanochannels;108 (d) role of nanoconfinement on phase behavior and contact angle;109,110 (e) condensation in nanochannels;111 (f) bubble nucleation and growth in nanochannels.112 Reproduced from ref. 107, 108 with permission from Society of Petroleum Engineer, ref. 109 with permission from Elsevier, from ref. 97, 110 and 111 with permission from American Chemical Society, from ref. 112 with permission from Royal Society of Chemistry.
studied the nanoconfinement effect on contact angles using
the same device but with a shallower depth (10 nm) (Table 2).110
The authors attempted to measure the contact angle, and made
observations. However, we would question the validity of the
contact angle measurement here. This work highlights another
challenge of nanofluidic phase-based measurements, namely
that the contact angle observed in-plane (i.e. that imaged using
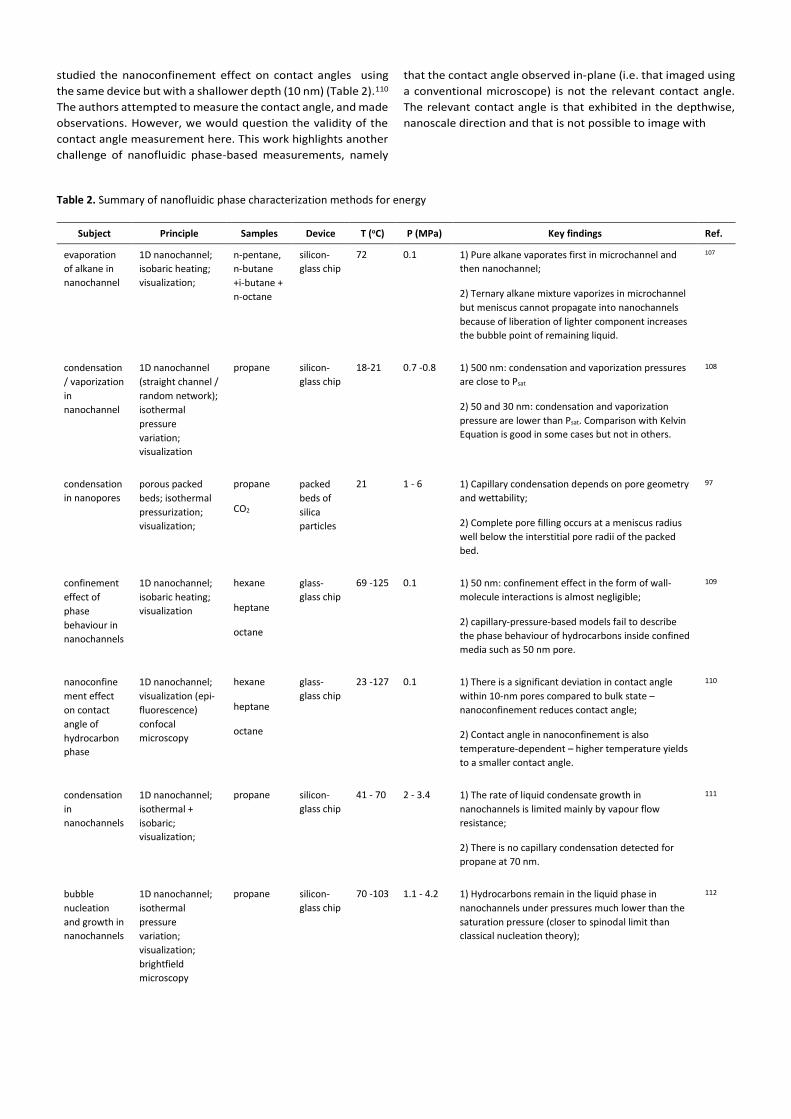
a conventional microscope) is not the relevant contact angle.
The relevant contact angle is that exhibited in the depthwise,
nanoscale direction and that is not possible to image with
Table 2. Summary of nanofluidic phase characterization methods for energy
Subject Principle Samples Device T (oC) P (MPa) Key findings Ref.
evaporation
of alkane in
nanochannel
1D nanochannel;
isobaric heating;
visualization;
n-pentane,
n-butane
+i-butane +
n-octane
silicon-
glass chip
72 0.1 1) Pure alkane vaporates first in microchannel and
then nanochannel;
2) Ternary alkane mixture vaporizes in microchannel
but meniscus cannot propagate into nanochannels
because of liberation of lighter component increases
the bubble point of remaining liquid.
107
condensation
/ vaporization
in
nanochannel
1D nanochannel
(straight channel /
random network);
isothermal
pressure
variation;
visualization
propane silicon-
glass chip
18-21 0.7 -0.8 1) 500 nm: condensation and vaporization pressures
are close to Psat
2) 50 and 30 nm: condensation and vaporization
pressure are lower than Psat. Comparison with Kelvin
Equation is good in some cases but not in others.
108
condensation
in nanopores
porous packed
beds; isothermal
pressurization;
visualization;
propane
CO2
packed
beds of
silica
particles
21 1 - 6 1) Capillary condensation depends on pore geometry
and wettability;
2) Complete pore filling occurs at a meniscus radius
well below the interstitial pore radii of the packed
bed.
97
confinement
effect of
phase
behaviour in
nanochannels
1D nanochannel;
isobaric heating;
visualization
hexane
heptane
octane
glass-
glass chip
69 -125 0.1 1) 50 nm: confinement effect in the form of wall-
molecule interactions is almost negligible;
2) capillary-pressure-based models fail to describe
the phase behaviour of hydrocarbons inside confined
media such as 50 nm pore.
109
nanoconfine
ment effect
on contact
angle of
hydrocarbon
phase
1D nanochannel;
visualization (epi-
fluorescence)
confocal
microscopy
hexane
heptane
octane
glass-
glass chip
23 -127 0.1 1) There is a significant deviation in contact angle
within 10-nm pores compared to bulk state –
nanoconfinement reduces contact angle;
2) Contact angle in nanoconfinement is also
temperature-dependent – higher temperature yields
to a smaller contact angle.
110
condensation
in
nanochannels
1D nanochannel;
isothermal +
isobaric;
visualization;
propane silicon-
glass chip
41 - 70 2 - 3.4 1) The rate of liquid condensate growth in
nanochannels is limited mainly by vapour flow
resistance;
2) There is no capillary condensation detected for
propane at 70 nm.
111
bubble
nucleation
and growth in
nanochannels
1D nanochannel;
isothermal
pressure
variation;
visualization;
brightfield
microscopy
propane silicon-
glass chip
70 -103 1.1 - 4.2 1) Hydrocarbons remain in the liquid phase in
nanochannels under pressures much lower than the
saturation pressure (closer to spinodal limit than
classical nucleation theory);
112
2) Depending on the initial nucleation location –
along the channel or at the end – two types of
bubble growth dynamics were observed.
existing methods. While there may be ways to deduce wetting
aspects from the in-plane measurement, it is critical that
researchers differentiate that observation from that of the
dominant contact angle in the nanoscale dimension.
To avoid the fractionation problem encountered by Wang
(see Fig. 6b), new strategies have been developed to ensure
phase change occurs in nanochannel (and not neighbouring
microchannels) by introducing local temperature controls.
Zhong et al. conducted a propane condensation experiment in
a dead-end nanochannel (70 nm deep, 5.5 μm wide) by cooling
the nanochannel while heating the service microchannel (Table
2).111 shown in Fig. 6e, an interesting condensation
phenomenon was observed, where a liquid bridge formed in the
vapour phase. Importantly, it was found that the condensate
growth rate in nanochannels was limited mainly by vapour flow
resistance. This study also claimed that capillary condensation
was absent in 70 nm confinement.
Bao et al. studied bubble nucleation and growth, in a series
of dead-end nanochannels (88 nm deep, 7 μm wide) (Table
2).112 Similarly, nanochannel regions were locally heated at a
controlled temperature while the service microchannel was
cooled. This local heating ensured that bubble nucleation
initially occurred only in the nanochannels. Fig. 6f presents the
observed bubble nucleation and growth in channels under the
isothermal pressure drawdown process, which mimics the
production path with decreased pressures. This work claimed
that propane remains in the liquid phase in nanochannels under
pressures much lower than the saturation pressure. The
nucleation conditions in terms of temperature and pressure
were found to be closer to the spinodal limit than classical
nucleation theory. Additionally, two types of bubble growth
dynamics were observed depending on the initial nucleation
location, either along the channel or at the channel end.
6. Challenges and future directions
6.1 Achieving promised multiplexing
To date, micro/nano-fluidic phase visualization approaches
have not demonstrated the extent of multiplexing possible
within the planar area of chips, let alone the third dimension.
Instead single channels are employed in the majority of cases.
Recent work with 10,000 phase measurement wells address this
issue partially, in the context of temperature and pressure, but
the challenge of precisely multiplexing concentration in such a
manner remains.53 Here the community can look to low
temperature, low pressure gradient generator methods for
some inspiration. Other such methods, such as hydrogel
gradients, are not likely to be applicable here.
6.2 Simplifying supporting hardware
Microfluidic phase measurements suffer from the same
criticisms of many biomedical microfluidics in that large
supporting infrastructure is generally required. The resulting
systems are not as portable as one would hope given the scale
of the device features. This criticism is even more applicable to
microfluidics for energy applications to date as the hardware
required is significantly larger, and often an order of magnitude
more expensive (i.e. traditional microfluidic syringe pumps
~1,000 USD, vs high-pressure, high-temperature pumps
~10,000 USD).
6.3 Developing products for an energy market
It is important to recognize that the market for phase
measurements is very different from that of most biomedical
diagnostics. The market is necessarily more niche, the cost-per-
test ceiling is higher, and the volume of tests is lower. Unlike
many microfluidic tests which ultimately aim for widespread
application by unexperienced users, microfluidic phase
measurements will generally be performed by specialists for
specialists. There are additional opportunities, however, for
distributed testing in energy applications, for instance regular
testing of hydrocarbons on pipelines or distribution networks.
6.4 Exploring new chip materials
To achieve commercial success, the development of new
microfluidic phase characterization devices will require faster,
low cost prototyping methods. Whereas other microfluidic
fields have leveraged low-cost materials such as plastics,
silicone polymers (PDMS), glass or paper, energy studies have
largely focused on strong materials capable of withstanding the
harsh physical and chemical conditions required for oil and gas
samples. Whereas silicon-glass-based microfluidic devices have
emerged as the standard for energy microfluidics, work is
needed to improve the efficiency of the microfabrication
process, which requires delicate cleanroom fabrication over
several days using photolithography and etching processes. For
certain applications, micromachining and laser ablation may
represent acceptable alternatives: micro-milling has been used
to manufacture 50 µm features on metal substrates and laser
cutting (vector and raster) has been demonstrated on silicon
wafers (Oxford lasers). While the quality and feature size are
inferior, the resolution may be sufficient for some applications.
Likewise, the community would benefit from exploring
alternative materials that – while not as robust as silicon-glass –
may provide sufficient resilience for a given application.
6.5 Further expanding pressures and temperature ranges
The harsh environments associated with energy applications
have led to the development of highly customized microfluidic
systems, capable of not-only withstanding high temperatures
and pressures, but providing an optical window on phase
behaviour. Silicon-glass and custom enclosures have enabled
studies at temperatures and pressures up to 400 ºC and 86 MPa,
respectively. Further improvements in experimental design,
however, will be necessary to achieve even more extreme
pressures and temperatures. Natural gas transportation in
northern environments, for example, will require phase studies
at low temperatures. Achieving either very high or very low
pressures and temperatures for micro/nano-fluidic phase
studies will require more robust materials as well as better
manifolds and infrastructure (O-rings, transducers, long
working-distance objectives). Likewise the deep off-shore oil
wells and deep hydraulic fracturing operations can exceed ~ 100
MPa in pressure. Studying such systems is not possible with
current micro and nanofluidic approaches.
6.6 Shifting from 2D to 3D
Constrained by fabrication processes and standard microscopy
methods, current microfluidic devices for phase
characterization are limited to 2D planar patterns. Typical
microfluidic fabrication methods including soft lithography and
hot-embossing (e.g. plastics), wet etching (e.g. glass), ion-
reactive etching (e.g. silicon), micromachining (e.g. steel) and
imprinting (e.g. paper), cannot produce complex 3D structures.
Current microfluidic studies that use 3D geometries are mostly
in natural porous media, packed particle beds, or composites
with regular shapes and cyclical patterns. Hydrocarbons,
however, reside in a highly heterogeneous 3D network. There is
a need to characterize phase properties inside 3D porous
structures with representative reservoir features.113 Additive
manufacturing, or 3D printing, is an emerging technique that
may contribute in this regard – particularly the now
commercially available and increasingly capable two-photon
printing capabilities. Alternatively, incorporating porous
substrates into microfluidic systems for study is a promising
approach, demonstrated for instance with nanoporous
silicon.98,99
6.7 Characterizing natural gas
In the context of energy applications, microfluidic phase
characterization techniques have been studied intensively in
CO2, alkanes, and other hydrocarbons, but not in natural gas or
methane. Such a gap in knowledge is ever more striking given
the rich phase change phenomena involved in natural gas
processes and their importance to recovery, transport, storage
and utilization. The absence of natural gas phase studies in
literature is in part due to the technical difficulties in reaching
the very low temperatures at which phase change occurs. With
the development of low temperature control systems, we see
potential opportunities in using microfluidic methods to
characterize natural gas phase behaviours to measure
hydrocarbon dew point or water dew point. Demand for such
technologies could stem from chemical plants and refineries
and associated thermophysical models they employ.
6.8 Increasing and improving nanoscale phase data
Given the often conflicting predictions from molecular
dynamics simulations and inherent challenges in properly
modelling surface roughness, wettability and broader solid-fluid
interactions, there is an urgent need to develop controlled
experiments to study nanofluidic phase change. The few
experiments that have been completed at the nanoscale have
shown discrepancies. For example, Parsa claimed that 50 nm
confinement led to a lower condensation pressure as compared
to bulk phase saturation pressure.108 However, Alfi stated that
50 nm confinement was negligible.109 Additionally, Luo declared
that 38 nm confinement played an insignificant role on bubble
point.114 More work in these areas is required to shed light on
important nanofluidic phase change phenomena, elucidate
what differences exist between bulk-scale and nanoscale phase
change behaviour, forge a better link with molecular dynamics
simulations, and explore the critical role of surface roughness,
adsorbed water, multicomponent systems, contact angle and
wettability.
6.9 Exploring sub-10 nm
Nanoscale phase change becomes increasingly interesting as
features are reduced to size of a few molecules. At such a small
scale, surface effects caused by interactions between the
surface and fluid samples are no longer negligible and begin to
change the fluid phase behaviour from what is expected at the
bulk scale. This change in behaviour has been modelled by a
variety of theories with different assumptions and observed by
a few visualization experiments as described previously. Though
they show discrepancy in quantitative result, there is no dispute
on the trend that the confinement effect becomes more
apparent as the scale decreases, especially in the sub-10 nm
regime. The molecular size of common substances of interest
range from sub-nanometer to a few nanometers (ex: water ~
0.3 nm, methane ~ 0.4 nm, decane ~ 1 nm 115 and hexadecane
~ 2.3 nm 116), further highlighting the interest in exploring
devices near that size. So far there has been no experimental
study on sub-10 nanometer phase behaviour using nanofluidic
devices (the closest work explored ion transport in 2 nm
channels).117 There is a need to explore the phase behaviour of
fluids in the sub-10 nm regime, and a great opportunity for tight
partnership between experimentalists and the molecular
modelling community, as the scales on which they work begin
to overlap.
7. Conclusion
This review paper comprehensively covers and assesses the
emerging field of microfluidics- and emerging nanofluidics-
based phase characterization studies for energy applications.
Microfluidic methods are generally motivated by improving the
time efficiency of fluid phase measurements, with a focus on
practical applications and displacing or informing traditional
methods. In contrast, nanofluidic approaches are motivated to
quantify and explain the fundamental physics of fluid behaviour
in nanoconfinement.
Recent developments in microfluidic PVT systems probing
liquid/vapour/supercritical phase transitions as well as
dew/bubble/critical points and phase diagrams (P-T, P-x, T-x)
were discussed. Related phase research areas, namely
microfluidic solubility, diffusivity, miscibility and precipitation
studies, were also explored. Lastly, developments in nanofluidic
phase measurements were discussed, where experiments are
pushing further and further into the nano-realm. Challenges
and trends within both the microfluidic and nanofluidic fields
were highlighted and discussed. There are tremendous
opportunities in the near future, particularly where researchers
can take advantage of the full microfluidic and nanofluidic tool
kits as well as expertise from adjacent fields such as
thermodynamics and molecular simulations. This space also
offers excellent opportunities for engagement with industry
and the development of spin-off companies.
Acknowledgements
The authors gratefully acknowledge support from the Natural
Sciences and Engineering Council of Canada through the
Collaborative Research and Development Grant Program, and
on-going funding through the Discovery Grants program,
Discovery Accelerator Supplement, the Canada Research Chairs
program, and the E.W.R. Steacie Memorial Fellowship (DS). The
authors also acknowledge support from Schlumberger Canada
Ltd and Alberta Innovates-Energy and Environment Solutions,
as well as infrastructure support through the Canada
Foundation for Innovation and Ontario Research Fund.
Notes and references
1 P. N. Nge, C. I. Rogers and A. T. Woolley, Chem. Rev., 2013,
113, 2550–2583.
2 J. R. Thome, Int. J. Heat Fluid Flow, 2004, 25, 128–139.
3 C. B. Tibiriçá and G. Ribatski, Int. J. Refrig., 2013, 36, 301–
324.
4 A. Günther and K. F. Jensen, Lab Chip, 2006, 6, 1487–1503.
5 D. Sinton, Lab Chip, 2014, 14, 3127–3134.
6 S. Marre, Y. Roig and C. Aymonier, J. Supercrit. Fluids, 2012,
66, 251–264.
7 V. A. Lifton, Lab Chip, 2016, 1–43.
8 J. C. T. Eijkel and A. van den Berg, Microfluid. Nanofluidics,
2005, 1, 249–267.
9 L. Bocquet and E. Charlaix, Chem. Soc. Rev., 2010, 39,
1073–1095.
10 L. Bocquet and P. Tabeling, Lab Chip, 2014, 14, 3143–3158.
11 C. Duan, W. Wang and Q. Xie, Review article: Fabrication of
nanofluidic devices, 2013, vol. 7.
12 M. Napoli, J. C. T. Eijkel and S. Pennathur, Lab Chip, 2010,
10, 957–985.
13 L. I. Segerink and J. C. T. Eijkel, Lab Chip, 2014, 14, 3201–5.
14 W. Sparreboom, A. Van Den Berg and J. C. T. Eijkel, New J.
Phys., 2010, 12, 1–23.
15 D. R. Cole, S. Ok, A. Striolo and A. Phan, Rev. Mineral.
Geochemistry, 2013, 75, 495–545.
16 E. Barsotti, S. P. Tan, S. Saraji, M. Piri and J. H. Chen, Fuel,
2016, 184, 344–361.
17 K. S. Pedersen, P. L. Christensen and J. A. Shaikh, Phase
Behavior of Petroleum Reservoir Fluids, 2015.
18 G. McKeogh, Moisture Measurement Technologies for
Natural Gas, .
19 D. R. Potter, Analytical Devices for the Measurement of
Water Vapor and Hydrocarbon Dew-Point in Natural Gas,
2011.
20 W. Wu, J. Ke and M. Poliakoff, Rev. Sci. Instrum., 2006, 77,
23903.
21 B. Bao, H. Fadaei and D. Sinton, Sensors Actuators B Chem.,
2015, 207, 640–649.
22 D. W. Galipeau, J. D. Stroschine, K. a. Snow, K. a. Vetelino,
K. R. Hines and P. R. Story, Sensors Actuators B Chem.,
1995, 25, 696–700.
23 K. K. Botros, W. Studzinski, J. Geerligs and A. Glover, Can. J.
Chem. Eng., 2004, 82, 880–891.
24 C. L. Hansen, E. Skordalakes, J. M. Berger and S. R. Quake,
Proc. Natl. Acad. Sci. U. S. A., 2002, 99, 16531–6.
25 C. L. Hansen, M. O. A. Sommer and S. R. Quake, Proc. Natl.
Acad. Sci. U. S. A., 2004, 101, 14431–6.
26 M. J. Anderson, C. L. Hansen and S. R. Quake, Proc. Natl.
Acad. Sci. U. S. A., 2006, 103, 16746–51.
27 C. L. Hansen, S. Classen, J. M. Berger and S. R. Quake, J.
Am. Chem. Soc., 2006, 128, 3142–3143.
28 B. T. C. Lau, C. A. Baitz, X. P. Dong and C. L. Hansen, J. Am.
Chem. Soc., 2007, 129, 454–455.
29 B. Zheng, L. S. Roach and R. F. Ismagilov, J. Am. Chem. Soc.,
2003, 125, 11170–11171.
30 B. Zheng, J. D. Tice, L. S. Roach and R. F. Ismagilov, Angew.
Chemie Int. Ed., 2004, 43, 2508–2511.
31 C. J. Gerdts, M. Elliott, S. Lovell, M. B. Mixon, A. J. Napuli, B.
L. Staker, P. Nollert and L. Stewart, Acta Crystallogr. Sect. D
Biol. Crystallogr., 2008, 64, 1116–1122.
32 D. S. Khvostichenko, E. Kondrashkina, S. L. Perry, A. S.
Pawate, K. Brister and P. J. A. Kenis, Analyst, 2013, 138,
5384–95.
33 R. Koningsveld, W. H. Stockmayer and E. Nies, Polymer
Phase Diagrams: A Textbook, Oxford University Press,
2001.
34 J.-U. Shim, G. Cristobal, D. R. Link, T. Thorsen, Y. Jia, K.
Piattelli and S. Fraden, J. Am. Chem. Soc., 2007, 129, 8825–
8835.
35 S. Selimović, F. Gobeaux and S. Fraden, Lab Chip, 2010, 10,
1696–9.
36 H. Mao, C. Li, Y. Zhang, D. E. Bergbreiter and P. S. Cremer,
J. Am. Chem. Soc., 2003, 125, 2850–2851.
37 H. Mao, C. Li, Y. Zhang, S. Furyk, P. S. Cremer and D. E.
Bergbreiter, Macromolecules, 2004, 37, 1031–1036.
38 X. Zhou, J. Li, C. Wu and B. Zheng, Macromol. Rapid
Commun., 2008, 29, 1363–1367.
39 F. Shi, Z. Han, J. Li, B. Zheng and C. Wu, Macromolecules,
2011, 44, 686–689.
40 Y. Shangguan, D. Guo, H. Feng, Y. Li, X. Gong, Q. Chen, B.
Zheng and C. Wu, Macromolecules, 2014, 47, 2496–2502.
41 J. Leng, B. Lonetti, P. Tabeling, M. Joanicot and A. Ajdari,
Phys. Rev. Lett., 2006, 96, 1–4.
42 J. Leng, M. Joanicot and A. Ajdari, Langmuir, 2007, 23,
2315–2317.
43 P. Laval, N. Lisai, J.-B. Salmon and M. Joanicot, Lab Chip,
2007, 7, 829.
44 P. Laval, A. Crombez and J. B. Salmon, Langmuir, 2009, 25,
1836–1841.
45 J. Lee, A. Bose and A. Tripathi, Langmuir, 2006, 22, 11412–
11419.
46 N. A. Blumenschein, D. Han, M. Caggioni and A. J. Steckl,
Appl. Mater. interfaces, 2014, 6, 8066–8072.
47 S. Marre, A. Adamo, S. Basak, C. Aymonier and K. F. Jensen,
Ind. Eng. Chem. Res., 2010, 49, 11310–11320.
48 S. Molla and F. Mostowfi, in SPE 170910 Annual Technical
Conference and Exhibition, 2014.
49 S. Molla and F. Mostowfi, SPE Reserv. Eval. Eng., 2016.
50 F. Mostowfi, S. Molla and P. Tabeling, Lab Chip, 2012, 12,
4381–4387.
51 R. Fisher, M. K. Shah, D. Eskin, K. Schmidt, A. Singh, S.
Molla and F. Mostowfi, Lab Chip, 2013, 13, 2623–2633.
52 B. Pinho, S. Girardon, F. Bazer-Bachi, G. Bergeot, S. Marre
and C. Aymonier, Lab Chip, 2014, 3843–3849.
53 B. Bao, J. Riordon, Y. Xu, H. Li and D. Sinton, Anal. Chem.,
2016, 88, 6986–6989.
54 W. Song, H. Fadaei and D. Sinton, Environ. Sci. Technol.,
2014, 48, 3567–3574.
55 M. Togo, T. Maeda, A. Ito and Y. Shimoyama, J. Chem.
Thermodyn., 2013, 67, 247–252.
56 S. K. Luther, S. Stehle, K. Weihs, S. Will and A. Braeuer,
Anal. Chem., 2015, 87, 8165–8172.
57 M. T. Sullivan and D. E. Angelescu, Energy & Fuels, 2016,
30, 2655–2661.
58 M. Abolhasani, M. Singh, E. Kumacheva and A. Günther,
Lab Chip, 2012, 12, 1611–1618.
59 S. G. R. Lefortier, P. J. Hamersma, A. Bardow and M. T.
Kreutzer, Lab Chip, 2012, 12, 3387–3391.
60 N. Liu, C. Aymonier, C. Lecoutre, Y. Garrabos and S. Marre,
Chem. Phys. Lett., 2012, 551, 139–143.
61 S. K. Luther, J. J. Schuster, A. Leipertz and A. Braeuer, J.
Supercrit. Fluids, 2013, 84, 121–131.
62 Y. Lin, X. Yu, Z. Wang, S. T. Tu and Z. Wang, Anal. Chim.
Acta, 2010, 667, 103–112.
63 H. Fadaei, B. Scarff and D. Sinton, Energy & Fuels, 2011, 25,
4829–4835.
64 H. Fadaei, J. M. Shaw and D. Sinton, Energy & Fuels, 2013,
27, 2042–2048.
65 A. Sell, H. Fadaei, M. Kim and D. Sinton, Environ. Sci.
Technol., 2013, 47, 71–78.
66 P. Nguyen, D. Mohaddes, J. Riordon, H. Fadaei, P. Lele and
D. Sinton, Anal. Chem., 2015, 87, 3160–3164.
67 S. a Bowden, R. Wilson, J. Parnell and J. M. Cooper, Lab
Chip, 2009, 9, 828–832.
68 M. H. Schneider, V. J. Sieben, A. M. Kharrat and F.
Mostowfi, Anal. Chem., 2013, 85, 5153–5160.
69 V. J. Sieben, A. K. Tharanivasan, J. Ratulowski and F.
Mostowfi, Lab Chip, 2015, 15, 4062–4074.
70 V. J. Sieben, A. K. Tharanivasan, S. I. Andersen and F.
Mostowfi, Energy & Fuels, 2016, 30, 1933–1946.
71 C. Hu, J. E. Morris and R. L. Hartman, Lab Chip, 2014, 14,
2014–2022.
72 S. Molla, L. Magro and F. Mostowfi, Lab Chip, 2016, 16,
3795–3803.
73 M. Kim, A. Sell and D. Sinton, Lab Chip, 2013, 13, 2508–
2518.
74 ASTM D6560: Determination of asphaltenes (heptane
insolubles) in crude petroleum and petroleum products,
2001.
75 L. Cueto-Felgueroso and R. Juanes, Proc. Natl. Acad. Sci.,
2013, 110, 19660–19661.
76 A. Yethiraj and A. Striolo, J. Phys. Chem. Lett., 2013, 4, 687–
690.
77 D. Malakoff, Science (80-. )., 2014, 344, 1464–1467.
78 U. Kuila and M. Prasad, Geophys. Prospect., 2013, 61, 341–
362.
79 S. Zargari, K. L. Canter and M. Prasad, Fuel, 2015, 153, 110–
117.
80 L. Travalloni, M. Castier, F. W. Tavares and S. I. Sandler,
Chem. Eng. Sci., 2010, 65, 3088–3099.
81 Y. Ma, L. Jin and A. Jamili, in SPE, 2013.
82 T. W. Teklu, N. Alharthy, H. Kazemi, X. Yin, R. M. Graves
and A. M. AlSumaiti, in SPE, 2014, pp. 396–403.
83 S. P. Tan and M. Piri, Fluid Phase Equilib., 2015, 393, 48–63.
84 A. W. Islam, T. W. Patzek and A. Y. Sun, J. Nat. Gas Sci.
Eng., 2015, 25, 134–139.
85 X. Dong, H. Liu, J. Hou, K. Wu and Z. Chen, Ind. Eng. Chem.
Res., 2016, 55, 798–811.
86 Z. Li, Z. Jin and A. Firoozabadi, in SPE, 2014.
87 B. R. Didar and I. Y. Akkutlu, in SPE, 2013.
88 B. R. Didar and I. Y. Akkutlu, Unconv. Resour. Technol.
Conf., 2015, 2180–2189.
89 Z. Jin and A. Firoozabadi, J. Chem. Phys., 2015, 143.
90 W. R. W. Welch and M. Piri, J. Mol. Model., 2016, 22, 1–9.
91 G. Nagashima, E. V. Levine, D. P. Hoogerheide, M. M. Burns
and J. A. Golovchenko, Phys. Rev. Lett., 2014, 113, 1–8.
92 S. Witharana, B. Phillips, S. Strobel, H. D. Kim, T. McKrell, J.
B. Chang, J. Buongiorno, K. K. Berggren, L. Chen and Y.
Ding, J. Appl. Phys., 2012, 112.
93 O. Vincent, D. A. Sessoms, E. J. Huber, J. Guioth and A. D.
Stroock, Phys. Rev. Lett., 2014, 113, 1–5.
94 K. He, L. Xu, Y. Gao, K. B. Neeves, X. Yin, B. Bai, Y. Ma and J.
Smith, in SPE, 2014.
95 S. A. Kelly, C. Torres-Verdín and M. T. Balhoff, Lab Chip,
2016, 16, 2829–2839.
96 S. Gruener and P. Huber, Phys. Rev. Lett., 2009, 103.
97 J. Ally, S. Molla and F. Mostowfi, Langmuir, 2016, 32, 4494–
4499.
98 O. Vincent, A. Szenicer and A. D. Stroock, Soft Matter,
2016, 12, 6656–6661.
99 O. Vincent, B. Marguet and A. D. Stroock, Langmuir, 2017,
33, 1655–1661.
100 C. Duan, R. Karnik, M.-C. Lu and A. Majumdar, Proc. Natl.
Acad. Sci., 2012, 109, 3688–3693.
101 J. C. T. Eijkel, B. Dan, H. W. Reemeijer, D. C. Hermes, J. G.
Bomer and A. Van Den Berg, Phys. Rev. Lett., 2005, 95.
102 N. R. Tas, J. Haneveld, H. V. Jansen, M. Elwenspoek and A.
Van Den Berg, Appl. Phys. Lett., 2004, 85, 3274–3276.
103 V. N. Phan, N. T. Nguyen, C. Yang, P. Joseph, L. Djeghlaf, D.
Bourrier and A. M. Gue, Langmuir, 2010, 26, 13251–13255.
104 Q. Wu, J. T. Ok, Y. Sun, S. T. Retterer, K. B. Neeves, X. Yin, B.
Bai and Y. Ma, Lab Chip, 2013, 13, 1165–71.
105 S. Liu, Q. Wu, B. Baojun, Y. Ma, M. Wei, X. Yin and K.
Neeves, in SPE, 2014.
106 F. Chauvet, S. Geoffroy, A. Hamoumi, M. Prat and P.
Joseph, Soft Matter, 2012, 8, 10738.
107 L. Wang, E. Parsa, Y. Gao, J. T. Ok, K. Neeves, X. Yin and E.
Ozkan, in SPE, 2014.
108 E. Parsa, X. Yin and E. Ozkan, SPE, 2015.
109 M. Alfi, H. Nasrabadi and D. Banerjee, Fluid Phase Equilib.,
2016, 423, 25–33.
110 M. Alfi, D. Banerjee and H. Nasrabadi, Energy & Fuels,
2016.
111 J. Zhong, S. H. Zandavi, H. Li, B. Bao, A. H. Persad, F.
Mostowfi and D. Sinton, ACS Nano, 2016.
112 B. Bao, S. H. Zandavi, H. Li, J. Zhong, A. Jatukaran, F.
Mostowfi and D. Sinton, Phys. Chem. Chem. Phys., 2017,
19, 8223–8229.
113 A. T. Krummel, S. S. Datta, S. Munster and D. A. Weitz,
AlChE J., 2013, 59, 1022–1029.
114 S. Luo, H. Nasrabadi and J. L. Lutkenhaus, AIChE, 2016, 62,
1772–1780.
115 S. S. Jang, L. Shiang-Tai, P. K. Maiti, M. Blanco, W. A.
Goddard, P. Shuler and Y. Tang, J. Phys. Chem. B, 2004,
108, 12130–12140.
116 F. H. Herbstein, Crystalline Molecular Complexes and
Compounds: Structures and Principles, Oxford University
Press, 2005.
117 C. Duan and A. Majumdar, Nat. Nanotechnol., 2010, 5,
848–852.