Embed Size (px)
Citation preview
Zurich Open Repository and Archive
University of ZurichMain LibraryWinterthurerstr. 190CH-8057 Zurichwww.zora.uzh.ch
Year: 2011
MicroRNA-96 directly inhibits γ-Globin expression inhuman erythropoiesis
Azzouzi, I; Moest, H; Winkler, J; Fauchère, J C; Gerber, A P; Wollscheid, B;Stoffel, M; Schmugge, M; Speer, O
http://dx.doi.org/10.1371/journal.pone.0022838.Postprint available at:http://www.zora.uzh.ch
Posted at the Zurich Open Repository and Archive, University of Zurich.http://www.zora.uzh.ch
Originally published at:Azzouzi, I; Moest, H; Winkler, J; Fauchère, J C; Gerber, A P; Wollscheid, B; Stoffel, M; Schmugge, M;Speer, O (2011). MicroRNA-96 directly inhibits γ-Globin expression in human erythropoiesis. PLoS ONE,6(7):e22838.
MicroRNA-96 directly inhibits γ-Globin expression inhuman erythropoiesis
Abstract
Fetal hemoglobin, HbF (α2γ2), is the main hemoglobin synthesized up to birth, but itsubsequently declines and adult hemoglobin, HbA (α2β2), becomes predominant. Severalstudies have indicated that expression of the HbF subunit γ-globin might be regulatedpost-transcriptionally. This could be confered by ~22-nucleotide long microRNAs thatassociate with argonaute proteins to specifically target γ-globin mRNAs and inhibit proteinexpression. Indeed, applying immunopurifications, we found that γ-globin mRNA wasassociated with argonaute 2 isolated from reticulocytes that contain low levels of HbF (<1%),whereas association was significantly lower in reticulocytes with high levels of HbF (90%).Comparing microRNA expression in reticulocytes from cord blood and adult blood, weidentified several miRNAs that were preferentially expressed in adults, among themmiRNA-96. The overexpression of microRNA-96 in human ex vivo erythropoiesis decreasedγ-globin expression by 50%, whereas the knock-down of endogenous microRNA-96 increasedγ-globin expression by 20%. Moreover, luciferase reporter assays showed that microRNA-96negatively regulates expression of γ-globin in HEK293 cells, which depends on a seedless buthighly complementary target site located within the coding sequence of γ-globin. Based onthese results we conclude that microRNA-96 directly suppresses γ-globin expression and thuscontributes to HbF regulation.
MicroRNA-96 Directly Inhibits c-Globin Expression inHuman ErythropoiesisImane Azzouzi1,2,3, Hansjoerg Moest4, Jeannine Winkler1,2,3, Jean-Claude Fauchere5, Andre P. Gerber6,
Bernd Wollscheid4, Markus Stoffel3,5, Markus Schmugge1,2, Oliver Speer1,2,3*
1 Division of Haematology, University Children’s Hospital, Zurich, Switzerland, 2 Research Center for Children, University Children’s Hospital, Zurich, Switzerland, 3 Zurich
Center for Integrative Human Physiology, University of Zurich, Zurich, Switzerland, 4 Institute of Molecular Systems Biology, ETH Zurich, Zurich, Switzerland, 5 Division of
Neonatology, University Hospital Zurich, Zurich, Switzerland, 6 Institute of Pharmaceutical Sciences, ETH Zurich, Zurich, Switzerland
Abstract
Fetal hemoglobin, HbF (a2c2), is the main hemoglobin synthesized up to birth, but it subsequently declines and adulthemoglobin, HbA (a2b2), becomes predominant. Several studies have indicated that expression of the HbF subunit c-globinmight be regulated post-transcriptionally. This could be confered by ,22-nucleotide long microRNAs that associate withargonaute proteins to specifically target c-globin mRNAs and inhibit protein expression. Indeed, applying immunopurifica-tions, we found that c-globin mRNA was associated with argonaute 2 isolated from reticulocytes that contain low levels ofHbF (,1%), whereas association was significantly lower in reticulocytes with high levels of HbF (90%). Comparing microRNAexpression in reticulocytes from cord blood and adult blood, we identified several miRNAs that were preferentiallyexpressed in adults, among them miRNA-96. The overexpression of microRNA-96 in human ex vivo erythropoiesis decreasedc-globin expression by 50%, whereas the knock-down of endogenous microRNA-96 increased c-globin expression by 20%.Moreover, luciferase reporter assays showed that microRNA-96 negatively regulates expression of c-globin in HEK293 cells,which depends on a seedless but highly complementary target site located within the coding sequence of c-globin. Basedon these results we conclude that microRNA-96 directly suppresses c-globin expression and thus contributes to HbFregulation.
Citation: Azzouzi I, Moest H, Winkler J, Fauchere J-C, Gerber AP, et al. (2011) MicroRNA-96 Directly Inhibits c-Globin Expression in Human Erythropoiesis. PLoSONE 6(7): e22838. doi:10.1371/journal.pone.0022838
Editor: Sebastien Pfeffer, French National Center for Scientific Research - Institut de biologie moleculaire et cellulaire, France
Received February 14, 2011; Accepted June 30, 2011; Published July 28, 2011
Copyright: � 2011 Azzouzi et al. This is an open-access article distributed under the terms of the Creative Commons Attribution License, which permitsunrestricted use, distribution, and reproduction in any medium, provided the original author and source are credited.
Funding: This study was supported by the Roche Foundation for Anemia Research (RoFAR, Meggen, Switzerland) to OS, the Hartmann Muller Foundation(Zurich, Switzerland) to MS, the EMDO Foundation (Zurich, Switzerland) to OS, the Olga Mayenfisch Foundation (Zurich, Switzerland) to OS, an iPhD fellowshipfrom SystemsX.ch (Zurich, Switzerland) to HM, and the Foundation for Research at the Medical Faculty, University of Zurich (Zurich, Switzerland) to IA. The fundershad no role in study design, data collection and analysis, decision to publish, or preparation of the manuscript.
Competing Interests: The authors have declared that no competing interests exist.
* E-mail: [email protected]
Introduction
The major hemoglobin in the fetus is hemoglobin F (HbF; a2c2),
whereas in adult humans mainly hemoglobin A (HbA; a2b2), and,
to a lesser extent, hemoglobin A2 (a2d2) are expressed [1,2]. In
many hemoglobinopathies HbF expression persists or can be
induced by drugs, and it is known that increased HbF expression is
beneficial, as it can compensate for reduced or abnormal HbA
expression [3,4]. In an effort to understand the molecular regula-
tion of HbF expression numerous studies have identified cis-acting
DNA elements flanking the c-globin gene, and several transcrip-
tion factors that bind to these elements have been characterized
[1,5]. They form chromatin-protein complexes activating the
c-globin transcription in fetal-embryonic erythropoiesis, favoring
HbF expression. After birth these complexes are remodeled,
silencing the c-globin loci and activating the b-globin loci, and
hemoglobin expression is switched to HbA [1,2]. Besides such
transcriptional control, several studies have indicated that hemo-
globin expression may also be post-transcriptionally regulated
[6,7,8]. For instance, reticulocytes (immature erythrocytes) isolated
from sickle cell disease patients after treatment with butyrate
showed a significant increase in HbF protein, but no changes in
c-globin mRNA levels [7]. Moreover, c-globin transcription rates
[8] or c-globin mRNA levels [6] were higher than expected from
the low HbF protein levels measured in patients with Corfu
db-thalassemia and b-thalassemia, respectively. Although these
findings indicate that HbF expression in reticulocytes may be post-
transcriptionally regulated, there is no formal proof nor are the
underlying molecular mechanisms known to date.
MicroRNAs (miRNAs or miRs) are small, 19 to 25 nucleotide
long, non-coding RNAs, which target mRNAs in a sequence-
specific manner, inducing translational repression or decay [9,10].
Following nuclear processing, miRNA precursors (pre-miRNAs)
are exported to the cytoplasm and converted into mature miRNAs
by Dicer [11]; one-strand of the duplex is subsequently incor-
porated into miRNA-induced silencing complexes (miRISC)
comprised of a member of the argonaute (AGO) protein family
and importin 8 (Imp8) [12]. This complex assembles with se-
quences located mostly in the 39-UTRs of target mRNAs.
Although the rules of miRNA-target recognition are not yet fully
established, one determinant is the complementarity between the
target site and 6–7 nucleotides at the 59 end of the miRNA (region
known as miRNA ‘‘seed’’ and reviewed in [11]).
In humans, miRNAs have been detected in granulocytes,
monocytes, lymphocytes, platelets [13,14], during erythropoiesis
[15], and in red blood cells (RBCs) [16,17]. In both types of
PLoS ONE | www.plosone.org 1 July 2011 | Volume 6 | Issue 7 | e22838
enucleated cells (platelets and RBCs), miRNAs have been shown
to regulate cell-type specific proteins [14,16]. More than 200
miRNAs have been identified in RBCs [16,18]. In reticulocytes,
miR-320 was shown to regulate the expression of the transferrin
receptor CD71 [16]. Additionally, elevated miR-210 levels have
been studied in the context of elevated c-globin levels in two cases
of hereditary persistence of HbF [19], while the let-7 family has
been associated with hemoglobin switching [18]. Recently, two
miRNAs, miR-221 and miR-222, have been identified to regulate
HbF expression in erythropoietic cells via regulation of the kit
receptor [20]. Further indirect regulation of HbF expression by
miRNAs was shown in trisomy 13 cases, in which miR-15 and
miR-16 levels were elevated, resulting in an enhanced down-
regulation of MYB, an inhibitor of the c-globin gene transcrip-
tion [21]. Nevertheless, whether c-globin mRNAs could also be
directly targeted by certain miRNAs has not been reported yet.
First, we demonstrate that c-globin mRNA is bound by AGO2-
containing miRISC in reticulocytes from adults with 0.5% HbF,
but less so in reticulocytes from umbilical cord blood with 90%
HbF. Secondly, we report that miRNA-96, miRNA-146a, let-7a,
miR-888 and miR-330a-3p are significantly more abundant in
reticulocytes obtained from adults than from umbilical cord blood.
Thirdly, we show that ectopic expression of miR-96 during ex-vivo
erythropoiesis suppresses HbF expression, whereas knockdown of
miR-96 increases HbF expression. Finally, we demonstrate that
miRNA-96 directly targets the ORF of c-globin mRNA. These
findings demonstrate that miRNAs contribute to HbF regulation
by the post-transcriptional inhibition of c-globin expression during
adult erythropoiesis.
Results
c-globin mRNA is bound by AGO2Reticulocytes (immature erythrocytes) synthesize up to 20% of
their hemoglobin content after extrusion of the nucleus and release
from the bone marrow [22]. Several studies have indicated that
HbF expression in reticulocytes might be regulated post-transcrip-
tionally [6,7,23]. Although miRNA expression profiling showed a
number of miRNAs to be present in reticulocytes [16,18], to our
knowledge, no study has reported whether miRNAs regulate HbF
expression during erythropoiesis or in reticulocytes. In order to
clarify whether globin mRNAs might be targeted by miRNAs
respectively bound my miRISC, we decided to compare in a first
step the miRISC composition in reticulocytes from umbilical cord
blood (CB) expressing high HbF (90.361.0%) with reticulocytes
from healthy adult blood (AB) expressing low HbF (0.960.3%)
levels.
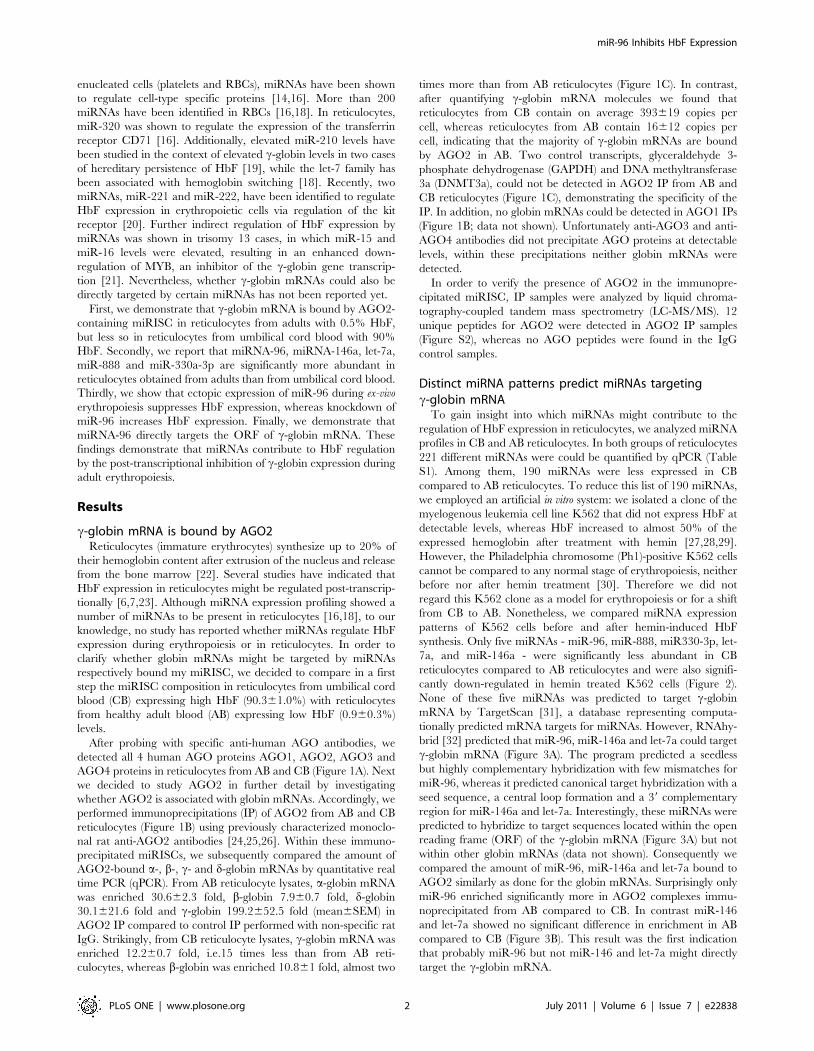
After probing with specific anti-human AGO antibodies, we
detected all 4 human AGO proteins AGO1, AGO2, AGO3 and
AGO4 proteins in reticulocytes from AB and CB (Figure 1A). Next
we decided to study AGO2 in further detail by investigating
whether AGO2 is associated with globin mRNAs. Accordingly, we
performed immunoprecipitations (IP) of AGO2 from AB and CB
reticulocytes (Figure 1B) using previously characterized monoclo-
nal rat anti-AGO2 antibodies [24,25,26]. Within these immuno-
precipitated miRISCs, we subsequently compared the amount of
AGO2-bound a-, b-, c- and d-globin mRNAs by quantitative real
time PCR (qPCR). From AB reticulocyte lysates, a-globin mRNA
was enriched 30.662.3 fold, b-globin 7.960.7 fold, d-globin
30.1621.6 fold and c-globin 199.2652.5 fold (mean6SEM) in
AGO2 IP compared to control IP performed with non-specific rat
IgG. Strikingly, from CB reticulocyte lysates, c-globin mRNA was
enriched 12.260.7 fold, i.e.15 times less than from AB reti-
culocytes, whereas b-globin was enriched 10.861 fold, almost two
times more than from AB reticulocytes (Figure 1C). In contrast,
after quantifying c-globin mRNA molecules we found that
reticulocytes from CB contain on average 393619 copies per
cell, whereas reticulocytes from AB contain 16612 copies per
cell, indicating that the majority of c-globin mRNAs are bound
by AGO2 in AB. Two control transcripts, glyceraldehyde 3-
phosphate dehydrogenase (GAPDH) and DNA methyltransferase
3a (DNMT3a), could not be detected in AGO2 IP from AB and
CB reticulocytes (Figure 1C), demonstrating the specificity of the
IP. In addition, no globin mRNAs could be detected in AGO1 IPs
(Figure 1B; data not shown). Unfortunately anti-AGO3 and anti-
AGO4 antibodies did not precipitate AGO proteins at detectable
levels, within these precipitations neither globin mRNAs were
detected.
In order to verify the presence of AGO2 in the immunopre-
cipitated miRISC, IP samples were analyzed by liquid chroma-
tography-coupled tandem mass spectrometry (LC-MS/MS). 12
unique peptides for AGO2 were detected in AGO2 IP samples
(Figure S2), whereas no AGO peptides were found in the IgG
control samples.
Distinct miRNA patterns predict miRNAs targetingc-globin mRNA
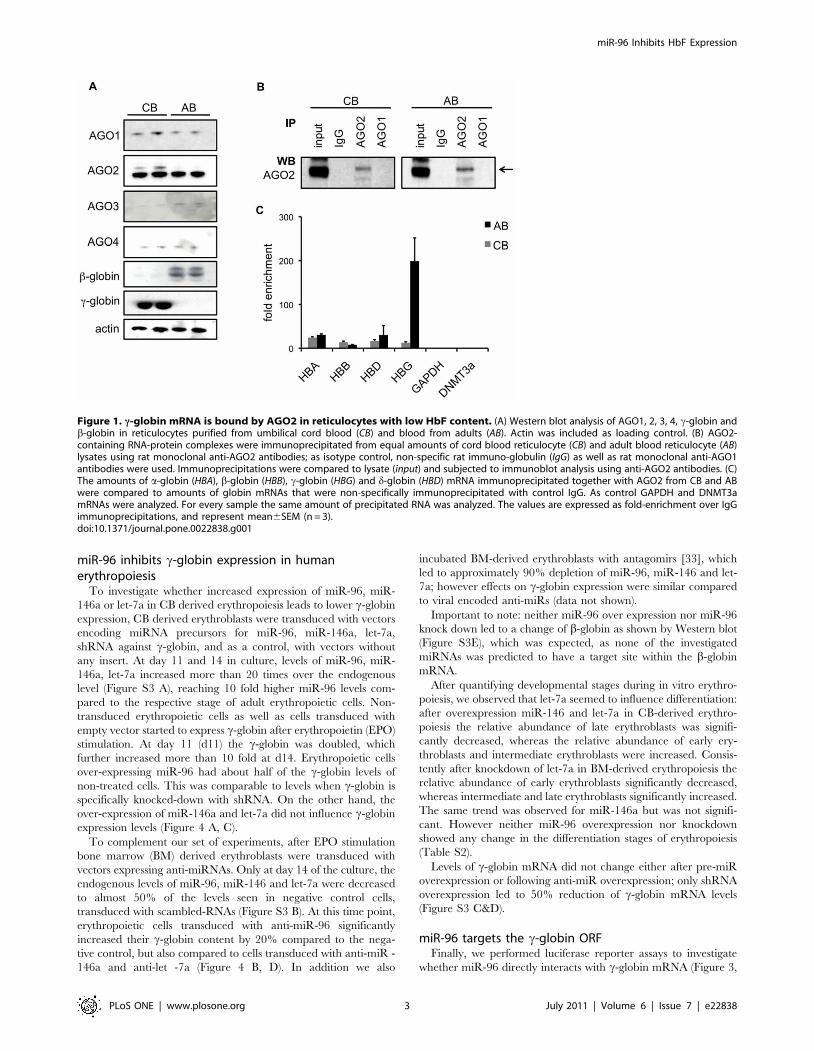
To gain insight into which miRNAs might contribute to the
regulation of HbF expression in reticulocytes, we analyzed miRNA
profiles in CB and AB reticulocytes. In both groups of reticulocytes
221 different miRNAs were could be quantified by qPCR (Table
S1). Among them, 190 miRNAs were less expressed in CB
compared to AB reticulocytes. To reduce this list of 190 miRNAs,
we employed an artificial in vitro system: we isolated a clone of the
myelogenous leukemia cell line K562 that did not express HbF at
detectable levels, whereas HbF increased to almost 50% of the
expressed hemoglobin after treatment with hemin [27,28,29].
However, the Philadelphia chromosome (Ph1)-positive K562 cells
cannot be compared to any normal stage of erythropoiesis, neither
before nor after hemin treatment [30]. Therefore we did not
regard this K562 clone as a model for erythropoiesis or for a shift
from CB to AB. Nonetheless, we compared miRNA expression
patterns of K562 cells before and after hemin-induced HbF
synthesis. Only five miRNAs - miR-96, miR-888, miR330-3p, let-
7a, and miR-146a - were significantly less abundant in CB
reticulocytes compared to AB reticulocytes and were also signifi-
cantly down-regulated in hemin treated K562 cells (Figure 2).
None of these five miRNAs was predicted to target c-globin
mRNA by TargetScan [31], a database representing computa-
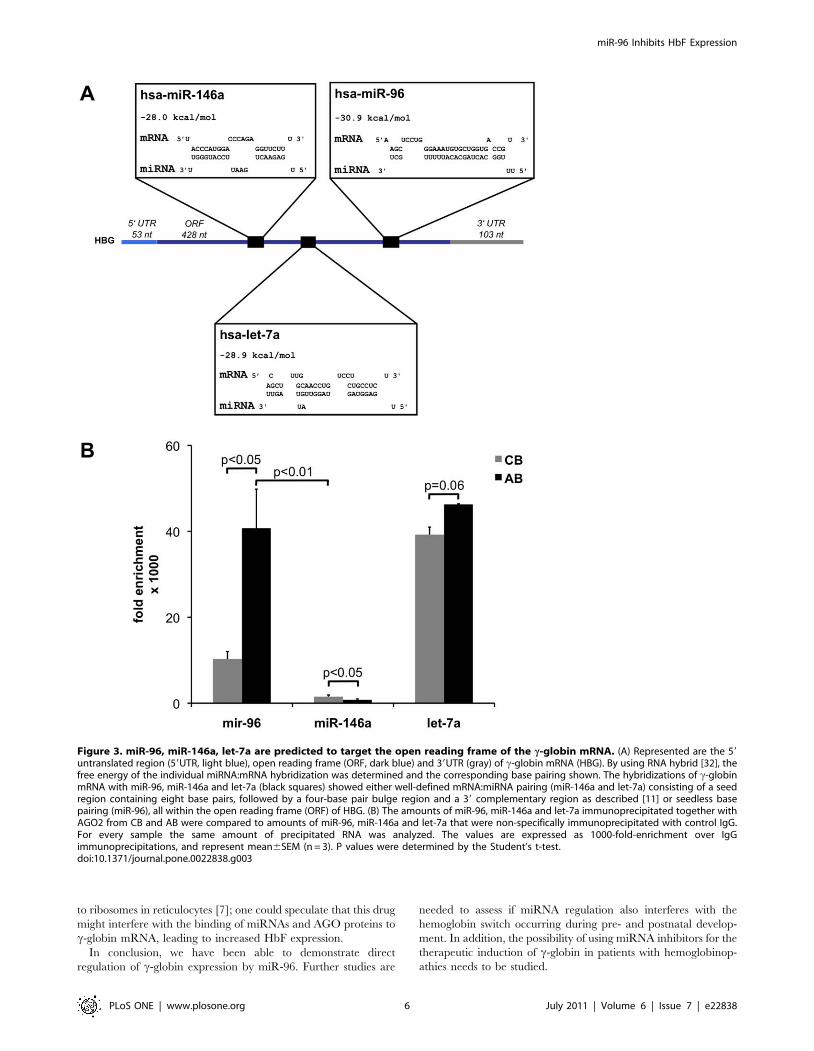
tionally predicted mRNA targets for miRNAs. However, RNAhy-
brid [32] predicted that miR-96, miR-146a and let-7a could target
c-globin mRNA (Figure 3A). The program predicted a seedless
but highly complementary hybridization with few mismatches for
miR-96, whereas it predicted canonical target hybridization with a
seed sequence, a central loop formation and a 39 complementary
region for miR-146a and let-7a. Interestingly, these miRNAs were
predicted to hybridize to target sequences located within the open
reading frame (ORF) of the c-globin mRNA (Figure 3A) but not
within other globin mRNAs (data not shown). Consequently we
compared the amount of miR-96, miR-146a and let-7a bound to
AGO2 similarly as done for the globin mRNAs. Surprisingly only
miR-96 enriched significantly more in AGO2 complexes immu-
noprecipitated from AB compared to CB. In contrast miR-146
and let-7a showed no significant difference in enrichment in AB
compared to CB (Figure 3B). This result was the first indication
that probably miR-96 but not miR-146 and let-7a might directly
target the c-globin mRNA.
miR-96 Inhibits HbF Expression
PLoS ONE | www.plosone.org 2 July 2011 | Volume 6 | Issue 7 | e22838
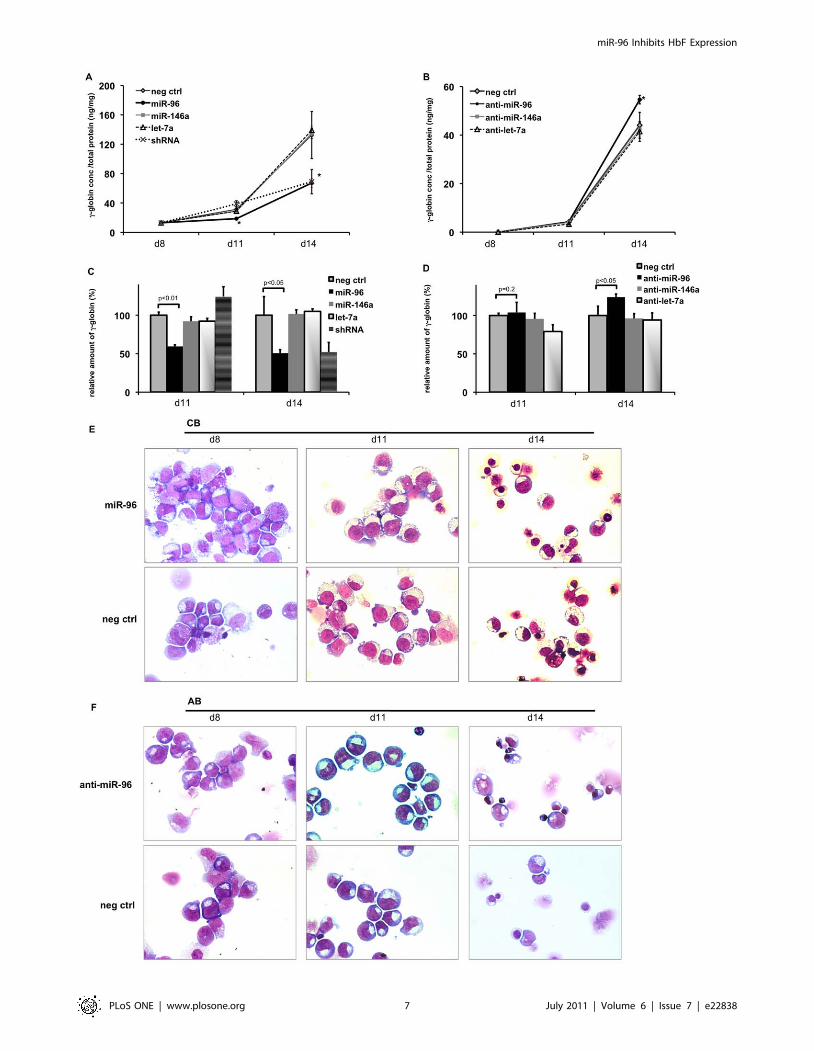
miR-96 inhibits c-globin expression in humanerythropoiesis
To investigate whether increased expression of miR-96, miR-
146a or let-7a in CB derived erythropoiesis leads to lower c-globin
expression, CB derived erythroblasts were transduced with vectors
encoding miRNA precursors for miR-96, miR-146a, let-7a,
shRNA against c-globin, and as a control, with vectors without
any insert. At day 11 and 14 in culture, levels of miR-96, miR-
146a, let-7a increased more than 20 times over the endogenous
level (Figure S3 A), reaching 10 fold higher miR-96 levels com-
pared to the respective stage of adult erythropoietic cells. Non-
transduced erythropoietic cells as well as cells transduced with
empty vector started to express c-globin after erythropoietin (EPO)
stimulation. At day 11 (d11) the c-globin was doubled, which
further increased more than 10 fold at d14. Erythropoietic cells
over-expressing miR-96 had about half of the c-globin levels of
non-treated cells. This was comparable to levels when c-globin is
specifically knocked-down with shRNA. On the other hand, the
over-expression of miR-146a and let-7a did not influence c-globin
expression levels (Figure 4 A, C).
To complement our set of experiments, after EPO stimulation
bone marrow (BM) derived erythroblasts were transduced with
vectors expressing anti-miRNAs. Only at day 14 of the culture, the
endogenous levels of miR-96, miR-146 and let-7a were decreased
to almost 50% of the levels seen in negative control cells,
transduced with scambled-RNAs (Figure S3 B). At this time point,
erythropoietic cells transduced with anti-miR-96 significantly
increased their c-globin content by 20% compared to the nega-
tive control, but also compared to cells transduced with anti-miR -
146a and anti-let -7a (Figure 4 B, D). In addition we also
incubated BM-derived erythroblasts with antagomirs [33], which
led to approximately 90% depletion of miR-96, miR-146 and let-
7a; however effects on c-globin expression were similar compared
to viral encoded anti-miRs (data not shown).
Important to note: neither miR-96 over expression nor miR-96
knock down led to a change of b-globin as shown by Western blot
(Figure S3E), which was expected, as none of the investigated
miRNAs was predicted to have a target site within the b-globin
mRNA.
After quantifying developmental stages during in vitro erythro-
poiesis, we observed that let-7a seemed to influence differentiation:
after overexpression miR-146 and let-7a in CB-derived erythro-
poiesis the relative abundance of late erythroblasts was signifi-
cantly decreased, whereas the relative abundance of early ery-
throblasts and intermediate erythroblasts were increased. Consis-
tently after knockdown of let-7a in BM-derived erythropoiesis the
relative abundance of early erythroblasts significantly decreased,
whereas intermediate and late erythroblasts significantly increased.
The same trend was observed for miR-146a but was not signifi-
cant. However neither miR-96 overexpression nor knockdown
showed any change in the differentiation stages of erythropoiesis
(Table S2).
Levels of c-globin mRNA did not change either after pre-miR
overexpression or following anti-miR overexpression; only shRNA
overexpression led to 50% reduction of c-globin mRNA levels
(Figure S3 C&D).
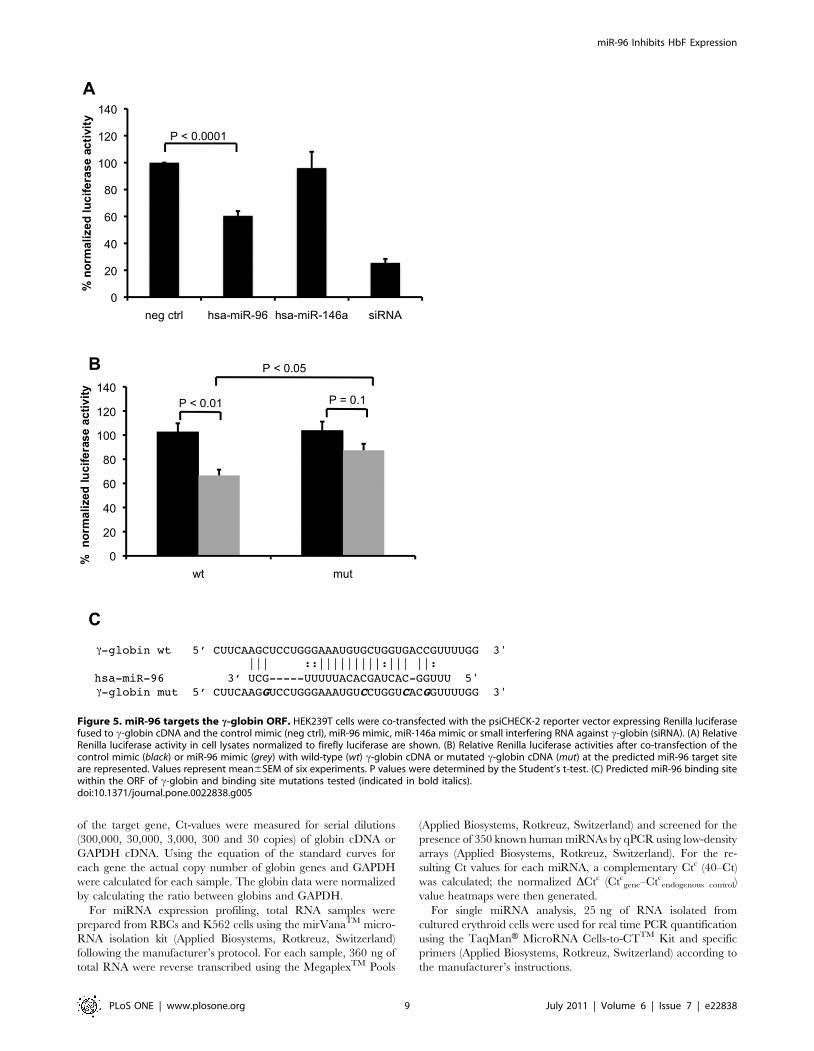
miR-96 targets the c-globin ORFFinally, we performed luciferase reporter assays to investigate
whether miR-96 directly interacts with c-globin mRNA (Figure 3,
Figure 1. c-globin mRNA is bound by AGO2 in reticulocytes with low HbF content. (A) Western blot analysis of AGO1, 2, 3, 4, c-globin andb-globin in reticulocytes purified from umbilical cord blood (CB) and blood from adults (AB). Actin was included as loading control. (B) AGO2-containing RNA-protein complexes were immunoprecipitated from equal amounts of cord blood reticulocyte (CB) and adult blood reticulocyte (AB)lysates using rat monoclonal anti-AGO2 antibodies; as isotype control, non-specific rat immuno-globulin (IgG) as well as rat monoclonal anti-AGO1antibodies were used. Immunoprecipitations were compared to lysate (input) and subjected to immunoblot analysis using anti-AGO2 antibodies. (C)The amounts of a-globin (HBA), b-globin (HBB), c-globin (HBG) and d-globin (HBD) mRNA immunoprecipitated together with AGO2 from CB and ABwere compared to amounts of globin mRNAs that were non-specifically immunoprecipitated with control IgG. As control GAPDH and DNMT3amRNAs were analyzed. For every sample the same amount of precipitated RNA was analyzed. The values are expressed as fold-enrichment over IgGimmunoprecipitations, and represent mean6SEM (n = 3).doi:10.1371/journal.pone.0022838.g001
miR-96 Inhibits HbF Expression
PLoS ONE | www.plosone.org 3 July 2011 | Volume 6 | Issue 7 | e22838
miR-96 Inhibits HbF Expression
PLoS ONE | www.plosone.org 4 July 2011 | Volume 6 | Issue 7 | e22838
4). Therefore, a vector was constructed harboring the c-globin
cDNA downstream of the Renilla luciferase ORF (psiCHECK-2-c-
globin). A second reporter gene, firefly luciferase, present in
psiCHECK-2 allowed the normalization of Renilla luciferase
activity. Human embryonic kidney (HEK) cells were co-transfect-
ed with the reporter construct, and with pre-miRs for either miR-
96 or miR-146a. For miR-96, but not for miR-146a, a significant
decrease in the relative levels of Renilla luciferase activity
compared to those of Firefly luciferase activity was measured
(Figure 5A). In addition, the disruption of the predicted miR-96
target site within the c-globin coding sequence revealed luciferase
activity levels equal to those of the negative control samples,
indicating that miR-96 directly and sequence specifically targets
the ORF of c-globin mRNA at the predicted target site
(Figure 5B&C).
Discussion
In the present study we identified miR-96 as a direct inhibitor of
c-globin expression. Initially, we found that in CB reticulocytes,
the amount of c-globin mRNA bound by AGO2 miRISC was 15
times less compared to AGO2 miRISC from AB reticulocytes. On
the basis of these results, we speculate that miRISC binds residual
c-globin mRNAs that are still transcribed during erythropoiesis in
adult after the globin switch has been completed, thus leading to
an inhibition of c-globin expression.
Since c-globin mRNA is associated with miRISC in AB
reticulocytes and therefore likely interacts with miRNAs, we
investigated miRNA expression patterns in CB and AB. We were
able to identify miR-96, miR-146a, let-7a, 330-3p and miR-888 as
being present in significantly higher amounts in AB reticulocytes
compared to those from CB and therefore as being potential
inhibitors of c-globin expression. Consistently, a previous report
on miRNA expression profiling in CB and AB also identified miR-
96 and let-7a as being significantly less expressed in reticulocytes
from CB [18]. However only miR-96 was enriched significantly
more in immunoprecipitated AGO2 complexes from adult
reticulocytes compared to cord blood; let-7a did not show this
pattern, indicating that it might be less probable, that let-7a
directly targets c-globin mRNAs.
In addition we were able to elucidate the role of these miRNAs
for the HbF expression in further detail. In primary erythroid
cultures, only overexpression of miR-96 led to a 50% decrease of
c-globin protein expression in CB-derived erythropoietic cells
expressing high amounts of c-globin protein. Even more impor-
tant, the knockdown of the physiological miR-96 levels in BM-
derived erythropoietic cells, expressing low amounts of c-globin
mRNA and thus low amounts of HbF, led to a significant increase
of 20% in c-globin protein expression. Neither overexpression nor
knock down of the other miRNAs led to a change of c-globin
expression.
Further experiments then allowed us to demonstrate that miR-
96 in complex with AGO2 binds to a seedless but highly com-
plementary target site within the open reading frame of c-globin
mRNA. Although most miRNAs are believed to target mRNAs in
their 39-UTRs, both seedless target sites and target sites located
within the ORF have been previously reported [34,35,36,37,38].
To date, miR-96 has been shown to be crucial for the
development of the inner ear and hearing [39,40], and to inhibit
the expression of the platelet protein VAMP8 [41]. In addition up-
regulation of miR-96 has been associated with the transformation
or maintenance of breast cancer cells through the expression
inhibition of the transcription factor FOXO1 [42].
During the postnatal globin switch, chromatin remodeling of
the b-globin locus leads to an almost complete change from
c-globin transcription to b-globin transcription. A number of
transcription factors such as GATA-1 [43], EKLF [44,45], cMYB
[46], or BCL11A [47] have been described as being required for
the transcriptional switch from c-globin to b-globin expression.
Further, c-kit ligand activity has been shown to play a role in
the HbF switching: a recent study from Gabbianelli et al. [20]
reported a gradual increase in miR-221 and miR-222 expression
from pre-term to full-term CB to adult hematopoietic progenitor
cells which down-modulates c-kit. In support of this report we
identified miR-222 to be significantly 20 times less abundant in
reticulocytes from CB compared to AB (Figure 3).
However in adult erythropoiesis after the switch some residual
amounts of c-globin mRNAs are still transcribed and can be
detected in reticulocytes [48,49]. Here we demonstrate that these
few copies of c-globin mRNA in AB reticulocytes, about 40 times
less than in CB, are targeted by miR-96 leading to a further
repression of HbF expression.
Our study seems to be limited by the relative small changes of c-
globin expression after knock-down of endogenous miRNAs.
However, the transduction with anti-miRs led only to a decrease of
50% of endogenous miR-96. Therefore we speculate that the
residual endogenous miR-96 most likely continues to inhibit
c-globin expression. In addition, a study on the role of miRNAs for
the erythropoietic enucleation showed also changes of 15–25%
after miRNA depletion [50]. Relatively small but significant
changes can be expected by manipulating single miRNAs, as not
yet identified miRNAs might also target the c-globin mRNA.
Thus, the concerted knock-down of several miRNAs could lead to
a more pronounced increase of c-globin expression. To investigate
effects of microRNAs in complex with AGO2 on the globin
expression, AGO2 knock downs in erythropoietic cells could have
been investigated. However we refrained from knocking down
AGO2 as it was well documented that AGO2 is essential for a
normal erythropoiesis [51] Nonetheless, our results suggest that
translation of residual c-globin mRNA in adult erythropoiesis is
repressed by miR-96 in complex with AGO2, adding a fine-tuning
mechanism of globin gene regulation.
Our finding that expression of HbF is repressed by miR-96
raises intriguing questions as to what extent this regulation con-
tributes to the phenotypic heterogeneity observed in b-thalassemia
and sickle cell disease. Currently, we are studying the possibility
that altered miRNA expression, including that of miR-96, might
contribute to different HbF levels observed among patients. Along
these lines, our preliminary data on RBCs from a small cohort of
sickle cell patients (Azzouzi et al. unpublished data) indicate that
miR-96 expression levels inversely correlate with HbF content,.
Moreover, a recent study with sickle cell disease patients after
butyrate treatment showed increased binding of c-globin mRNA
Figure 2. miRNA expression-patterns in cells expressing high HbF-levels differ from cells with low HbF-levels. Total RNA isolated fromreticulocytes from cord blood (CB) (n = 3), adult blood (AB) (n = 3), K562 cells treated with hemin (n = 3) and untreated K562 cells (n = 3) was used togenerate miRNA expression profiles. Red color indicates higher expression and blue color lower expression compared to the global mean. miRNAswere classified into three groups: miRNAs significantly less expressed in cells with high HbF content, i.e. CB compared to AB and K562 cells treatedwith hemin compared to untreated K562 cells (down), miRNAs significantly less expressed in CB compared to AB (downregulated in CB), miRNAs lessexpressed in cells with high HbF content (upregulated in CB). The relative quantification (RQ) values, representing the fold enrichment, and thecorresponding p values (determined by two tailed Student’s t-test) are presented.doi:10.1371/journal.pone.0022838.g002
miR-96 Inhibits HbF Expression
PLoS ONE | www.plosone.org 5 July 2011 | Volume 6 | Issue 7 | e22838
to ribosomes in reticulocytes [7]; one could speculate that this drug
might interfere with the binding of miRNAs and AGO proteins to
c-globin mRNA, leading to increased HbF expression.
In conclusion, we have been able to demonstrate direct
regulation of c-globin expression by miR-96. Further studies are
needed to assess if miRNA regulation also interferes with the
hemoglobin switch occurring during pre- and postnatal develop-
ment. In addition, the possibility of using miRNA inhibitors for the
therapeutic induction of c-globin in patients with hemoglobinop-
athies needs to be studied.
Figure 3. miR-96, miR-146a, let-7a are predicted to target the open reading frame of the c-globin mRNA. (A) Represented are the 59untranslated region (59UTR, light blue), open reading frame (ORF, dark blue) and 39UTR (gray) of c-globin mRNA (HBG). By using RNA hybrid [32], thefree energy of the individual miRNA:mRNA hybridization was determined and the corresponding base pairing shown. The hybridizations of c-globinmRNA with miR-96, miR-146a and let-7a (black squares) showed either well-defined mRNA:miRNA pairing (miR-146a and let-7a) consisting of a seedregion containing eight base pairs, followed by a four-base pair bulge region and a 39 complementary region as described [11] or seedless basepairing (miR-96), all within the open reading frame (ORF) of HBG. (B) The amounts of miR-96, miR-146a and let-7a immunoprecipitated together withAGO2 from CB and AB were compared to amounts of miR-96, miR-146a and let-7a that were non-specifically immunoprecipitated with control IgG.For every sample the same amount of precipitated RNA was analyzed. The values are expressed as 1000-fold-enrichment over IgGimmunoprecipitations, and represent mean6SEM (n = 3). P values were determined by the Student’s t-test.doi:10.1371/journal.pone.0022838.g003
miR-96 Inhibits HbF Expression
PLoS ONE | www.plosone.org 6 July 2011 | Volume 6 | Issue 7 | e22838
miR-96 Inhibits HbF Expression
PLoS ONE | www.plosone.org 7 July 2011 | Volume 6 | Issue 7 | e22838
Materials and Methods
Blood sampling and reticulocyte purificationThe institutional ethics board of the University Children’s
Hospital, Zurich and of the Canton of Zurich approved the study
protocol, and all subjects provided written informed consent to
participate in accordance with the Declaration of Helsinki. The
venous blood samples were collected during routine blood tests.
For the venipuncture, a cream composed of 5% lidocaine and 5%
prilocaine (EMLA; Astra Zug, Switzerland) was applied. Five to
10 ml of venous blood was collected into heparin. The blood was
washed three times with 10 ml of phosphate-buffered saline
containing 2 mM Ethylenediaminetetraacetic acid (EDTA) and
separated in a Ficoll-Hypaque gradient (GE Healthcare, Glatt-
brug, Switzerland) to remove mononuclear cells and platelets.
Reticulocytes were then filtered through a leuko-depletion filter
(Purecell Neo; Pall, Basel, Switzerland) (Figure S1 A). The
leukodepleted reticulocytes were washed and resuspended in
phosphate-buffered saline/EDTA. The purity grade of reticulo-
cytes was assessed by an automated blood cell analyzer (Sysmex
Digitana, Horgen, Switzerland), as well as by flow cytometry for
surface expression of CD45 with fluorescence-labeled antibodies
(Becton Dickinson, Rotkreuz, Switzerland) (Figure S1 B). In
addition, depletion of leukocytes and platelets, and enrichment of
reticulocytes was analyzed by quantitative real time PCR (qPCR)
of the pan-leukocyte marker CD45 as well as of mRNAs encoding
different hemoglobin subunits (Figure S1 C).
Cell culturesErythroid cells were cultured using a 2-phase liquid system.
Mononuclear cells isolated from umbilical cord blood and bone
marrow (Stemcell Technologies, Grenoble, France) and cultured
for 7 days in phase I medium consisting of serum-free StemSpan
(Stem Cell Technologies, Vancouver, BC) supplemented with
100 ng/ml fetal liver tyrosine kinase 3 ligand, 100 ng/ml throm-
bopoietin and 100 ng/ml stem cell factor (ProSpec, Rehovot,
Israel). Cells were incubated at 37uC, 5% CO2. After 7 days,
nonadherent cells were collected and reseeded at a concentration
of 56105 cells/ml in phase II medium (StemSpan supplemented
with 50 ng/ml insulin-like growth factor-1, 50 ng/mL stem cell
factor, and 3 U/ml human recombinant erythropoietin (Merck,
Darmstadt, Germany). Cell samples were collected from phase II
cultures after 8, 11 and 14 days of culture.
K562 and HEK293T were grown in IMDM (PAA, Coelbe,
Germany) supplemented with 10% fetal bovine serum, 4 mM
glutamine, and 16 Antibiotic-Antimycotic reagent (Invitrogen
AG, Basel, Switzerland). HbF induction in K562 cells was
performed, as described [27,28,29] with minor modifications, by
adding 50 mM of hemin (Sigma, Buchs, Switzerland) to the
medium for two days.
AGO co-immunoprecipitationCo-immunoprecipitation experiments were performed as de-
scribed [25,52] with modifications: 500 ml of packed RBCs were
lysed with 1.5 ml of lysis buffer (20 mM Tris-HCl pH 7.5,
150 mM NaCl, 0.5% IGEPAL, 2 mM EDTA, 0.5 mM DTT,
heparin 0.2 mg/ml, one tablet protease inhibitor (Roche,
Rotkreuz, Switzerland), 50 U/ml RNase OUTTM (Invitrogen
AG, Basel, Switzerland), 50 U/ml SuperaseNINTM (Applied Bio-
systems, Rotkreuz, Switzerland)). Lysates were cleared by centri-
fugation at 14,000 g for 10 minutes three times. Twenty mg of cell
extract protein were used for each experiment. AGO2 monoclonal
antibody-containing hybridoma (11A9) supernatant (2.5 ml) was
coupled to 50 ml protein G-Sepharose (GE Healthcare, Switzer-
land) overnight at 4uC. Coupled beads were washed three times
with NT2 buffer (50 mM Tris-HCl pH 7.5, 300 mM NaCl,
5 mM MgCl2, 0.05% IGEPAL) and resuspended in NT2-RIP
(NT2 buffer supplemented with 12.5 ml RNase OUTTM (50 U/
ml), 25 ml SuperaseNINTM (50 U/ml), 20 ml 1 M DTT (2 mM),
4 ml heparin 0.02 mg/ml). Beads were then incubated with RBC
lysates for six hours at 4uC. IP samples were washed three times
with NT2 buffer and proteins were eluted with SDS-EDTA
solution (50 mM Tris pH 8, 100 mM NaCl, 10 mM EDTA, 1%
SDS) at 65uC for 15 minutes. An aliquot of each eluate was kept
for immunoblotting and the remainder was used for RNA isolation
using the mirVanaTM microRNA isolation kit (Applied Biosys-
tems, Rotkreuz, Switzerland).
Following electrophoresis by SDS-PAGE the gel slices corre-
sponding to the size of AGO2 (100 kDa) were cut out and
dehydrated in 100% acetonitrile. Proteins were in-gel digested
using Sequencing Grade trypsin (Promega, Dubendorf, Switzer-
land) as described by Shevchenko [53]. The peptide samples were
then analyzed on an Agilent 1100 micro HPLC system (Agilent,
Morges, Switzerland) coupled to an LTQ linear ion trap mass
spectrometer (Thermo Electron, San Jose, CA) equipped with a
nanoelectrospray ion source (Thermo Electron, San Jose, CA).
Peptides were separated on an RP-HPLC column (10 cm length
and 75 mm inner diameter) packed with C18 resin (Magic C18 AQ
3 mm; Michrom Bioresources) with a linear gradient from 95%
buffer A (water, 0.1% formic acid) and 5% buffer B (water, 0.1%
formic acid and 90% Acetonitrile) to 60% buffer A and 40%
buffer B at a flow rate of 0.5 mL/min. The data acquisition mode
was set to acquire one MS scan followed by three collision induced
dissociation MS/MS scans. The MS full scans were recorded over
a mass range of 400–1600 m/z. The normalized collision energy
was set to 35%.
Acquired raw data files were converted with ReAdW into
mzXML files [54] which were searched with Sorcerer-SEQUEST
[55] against the human protein database of the UniProtKB/Swiss-
Prot Protein Knowledgebase (Version 57.15). The Trans-Proteo-
mic Pipeline TPP [56] v4.0 JETSTREAM rev 2 including
PeptideProphet [57] and ProteinProphet [58] was used for the
statistical analysis of the search results. The false discovery rate was
set to 1%, corresponding to a ProteinProphet probability score of
0.9. The remaining set of proteins was evaluated manually and
common contaminations were eliminated.
Quantitation of mRNAs and miRNAsa-, b- d- and c-globin mRNAs, as well as control GAPDH
mRNA, were quantified using the TaqManH Gene Expression
Cells-to-CTTM Kit and specific primers (Applied Biosystems,
Rotkreuz, Switzerland). To determine the mRNA copy numbers
Figure 4. miR-96 inhibits c-globin expression in human erythropoiesis. (A,C,E) Cord blood-derived erythroid cultures (CB) were transducedwith miRNA precursors; (B,D,F) Adult bone marrow-derived erythroid cultures (BM) were transduced with anti-miRNAs. Cells were harvested andanalyzed at day 8 (d8), 11 (d11) and 14 (d14). (A–B) Specific amounts of c-globin per total protein concentration and (C–D) relative amounts of c-globin compared to negative control, which was set to 100%, were measured by ELISA. Values represent mean 6 SEM of 3 experiments (n = 3). Pvalues were determined by the Student’s t-test. * p,0.05. (E–F) Representative cytospins of erythroid cells on d8, d11 and d14. The cytospins werestained with May Grunwald Giemsa and images were acquired with a Zeiss Axioskop2 microscope equipped with a Zeiss Plan-Apochromat 636/1.4oil immersion objective lens and a Zeiss AxioCam MRc digital camera. Images were recorded using Zeiss AxioVision AC release 4.5.0 software.doi:10.1371/journal.pone.0022838.g004
miR-96 Inhibits HbF Expression
PLoS ONE | www.plosone.org 8 July 2011 | Volume 6 | Issue 7 | e22838
of the target gene, Ct-values were measured for serial dilutions
(300,000, 30,000, 3,000, 300 and 30 copies) of globin cDNA or
GAPDH cDNA. Using the equation of the standard curves for
each gene the actual copy number of globin genes and GAPDH
were calculated for each sample. The globin data were normalized
by calculating the ratio between globins and GAPDH.
For miRNA expression profiling, total RNA samples were
prepared from RBCs and K562 cells using the mirVanaTM micro-
RNA isolation kit (Applied Biosystems, Rotkreuz, Switzerland)
following the manufacturer’s protocol. For each sample, 360 ng of
total RNA were reverse transcribed using the MegaplexTM Pools
(Applied Biosystems, Rotkreuz, Switzerland) and screened for the
presence of 350 known human miRNAs by qPCR using low-density
arrays (Applied Biosystems, Rotkreuz, Switzerland). For the re-
sulting Ct values for each miRNA, a complementary Ctc (40–Ct)
was calculated; the normalized DCtc (Ctcgene–Ctcendogenous control)
value heatmaps were then generated.
For single miRNA analysis, 25 ng of RNA isolated from
cultured erythroid cells were used for real time PCR quantification
using the TaqManH MicroRNA Cells-to-CTTM Kit and specific
primers (Applied Biosystems, Rotkreuz, Switzerland) according to
the manufacturer’s instructions.
Figure 5. miR-96 targets the c-globin ORF. HEK239T cells were co-transfected with the psiCHECK-2 reporter vector expressing Renilla luciferasefused to c-globin cDNA and the control mimic (neg ctrl), miR-96 mimic, miR-146a mimic or small interfering RNA against c-globin (siRNA). (A) RelativeRenilla luciferase activity in cell lysates normalized to firefly luciferase are shown. (B) Relative Renilla luciferase activities after co-transfection of thecontrol mimic (black) or miR-96 mimic (grey) with wild-type (wt) c-globin cDNA or mutated c-globin cDNA (mut) at the predicted miR-96 target siteare represented. Values represent mean6SEM of six experiments. P values were determined by the Student’s t-test. (C) Predicted miR-96 binding sitewithin the ORF of c-globin and binding site mutations tested (indicated in bold italics).doi:10.1371/journal.pone.0022838.g005
miR-96 Inhibits HbF Expression
PLoS ONE | www.plosone.org 9 July 2011 | Volume 6 | Issue 7 | e22838
Immunoblotting and ELISARBC lysates in protein extraction buffer (4 mM CaCl2, 4 mM
MgCl2, 1% Triton, 20 mM HEPES, 2 mM PMSF) or eluates from
AGO co-immunoprecipitation were used for immunoblotting.
Protein samples were resolved on NuPAGE 4–12% Bis-Tris
polyacrylamide gels (Invitrogen AG, Basel, Switzerland), transferred
to PVDF membrane and blocked with 5% non-fat dried milk in
Tris-buffered saline (20 mM Tris, 150 mM NaCl, pH 7.4) with
0.1% Tween-20. Membranes were incubated with the following
primary antibodies: rat anti-human AGO1, AGO2, AGO3, AGO4
[12,24,26], b-globin, c-globin, b-actin (Santa Cruz Biotechnology,
Heidelberg, Germany), followed by HRP-conjugated secondary
antibodies (Jackson Immunology, Newmarket, UK) and developed
with ECL reagent (GE Healthcare, Switzerland).
c-globin ELISA was performed using cell lysates in ELISA lysis
buffer (50 mM Tris-HCl pH 7.5, 150 mM NaCl, 0.5% IGEPAL)
with the Human Fetal Hemoglobin ELISA Quantification kit
(Bethyl, Montgomery, TX, USA) according to the manufacturer’s
protocol.
miRNA overexpression and miRNA knockdownPseudoviral particles were generated using lentivector-based
miRNA precursor and miRZIPTM lentivector-based anti-miRNA
constructs following the manufacturer’s instructions (System
Biosciences, Mountain View, CA). Retroviral particles were
prepared from a mixture of 4 HuSH 29mer shRNA constructs
against the c-globin mRNA (Origene Technologies, Inc., Rock-
ville, MD, USA) and used as control. To achieve stable expression
during erythropoiesis primary erythroid cultures were transduced
with pseudoviral particles (10/cell) containing vectors coding for
miRNA precursors or anti-miRNAs after 8 days of culture. A
transduction efficiency of 90% was achieved.
Luciferase reporter assayThe c-globin cDNA was subcloned from the TrueClone
NM_000559.2 vector (Origene, Rockville, MD, USA) into the
psiCHECK-2 vector (Promega AG, Duebendorf, Switzerland). The
c-globin mir-96 mutant reporter was constructed with PhusionTM
Site-Directed Mutagenesis (Finnzymes, Espoo, Finland), which
created a four base pair change in the mir-96 target site (bold
and underlined) (AAGCUCCUGGGAAAUGUGCUGGUGACCGU to
replace AAGGUCCUGGGAAAUGUCCUGGUCACGGU).
To evaluate the effect of miR-96 and miR-146a on c-globin
activity, we used precursor miRNA (Applied Biosystems, Rotk-
reuz, Switzerland). HEK293T cells were co-transfected with 10 ng
psiCHECK reporter and 500 nM of miRNA precursors for each
experiment, using siPORT NeoFX Transfection Agent (Applied
Biosystems, Rotkreuz, Switzerland). After 24 hours, the transfect-
ed cells were washed and lysed with passive lysis buffer (Promega
AG, Duebendorf, Switzerland). The luciferase activities (firefly and
Renilla) were then determined by a luminometer (Berthold
Technology, Regensdorf, Switzerland) using the Dual luciferase
reporter assay kit (Promega AG, Duebendorf, Switzerland). The
relative reporter activities were calculated by normalization of
firefly to the Renilla luciferase activities determined in the same
lysates. To confirm the target site of miR-96 on the c-globin
cDNA, its target site was cloned into the psiCHECK-2 vector as
well as the mutated target site.
Supporting Information
Figure S1 Purification of reticulocyte. (A) The venous
blood or umbilical cord blood samples were collected into heparin
and leukodepleted by Ficoll density gradient and filtration. (B) The
purity of reticulocytes was assessed by flow cytometry and (C) by
real-time PCR. (B) Following leukodepletion, cells were stained
with an antibody against CD45, which is specific to leukocytes. No
CD45-positive cells were detected after leukodepletion by flow
cytometry. (C) The analysis of purified reticulocytes at the mRNA
level showed no CD45 mRNA after leukodepletion, whereas all
globin mRNAs were detected. All subsequent experiments were
perform with reticulocytes containing both reticulocytes and
mature erythrocytes, in order not to lose any reticulocytic RNA
from the relatively small blood samples. HBA, a-globin; HBB, b-
globin; HBD, d-globin; HBG, c-globin; PBMC, peripheral blood
mononuclear cells; reti, leukodepleted reticulocytes; WB, whole
blood.
(TIF)
Figure S2 Analysis of immunopurified AGO2 by LC-MS/MS. (A) Amino acid sequence of human AGO2. Tryptic
peptides identified by LC-MS/MS are highlighted. (B) Represen-
tative MS/MS spectrum, amino acid sequence and annotated
fragment ions from an identified human AGO2 peptide.
(TIF)
Figure S3 RNA and protein levels in erythroid cellcultures after overexpression and knockdown of miR-NAs. (A) Relative quantification of miRNAs after transduction of
miRNA-precursors and (B) after transduction of anti-miRNAs.
miRNA levels in erythropoietic cells transduced with negative
control were given a relative value of 1.0. All levels of over-
expressed miRNAs were expressed as n-fold change compared
with the negative control. (C) Quantification of c-globin mRNA
after transduction of miRNA-precursors and (D) after transduction
of anti-miRNAs. All c-globin mRNA quantities were expressed as
copy numbers per cell. Cells were harvested and analyzed at day 8
(d8), 11 (d11) and 14 (d14). Values represent three independent
experiments (n = 3). (E) Western blot analysis of c-globin and
b-globin in CB-derived erythroid cultures transduced with
miR-96 precursors (miR-96) and BM-derived erythroid cultures
transduced with anti-miR-96. As negative control (neg ctrl), cells
were transduced with empty vector. Actin was included as loading
control.
(TIF)
Table S1 Ct values obtained by real time PCR.
(XLS)
Table S2 Quantification of morphological development stages
of erythropoietic cells.
(PDF)
Acknowledgments
We thank Karin Zurbriggen, Marlis Schmid and Alexandra Forderer for
excellent technical assistance. We thank Dr. Gunter Meister for the kind
gift of AGO1, AGO2, AGO3, AGO4 and Imp8 antibodies, and Dr.
Alessia Galgano for advice regarding the IP procedure. We thank Dr.
Heather Murray for editing the manuscript.
Author Contributions
Conceived and designed the experiments: IA HM APG M. Schmugge OS.
Performed the experiments: IA HM JW OS. Analyzed the data: IA HM
OS. Contributed reagents/materials/analysis tools: J-CF M. Stoffel BW
APG M. Schmugge. Wrote the paper: IA M. Schmugge OS. Attended and
enrolled patients: M. Schmugge. Provided umbilical cord blood samples: J-
CF.
miR-96 Inhibits HbF Expression
PLoS ONE | www.plosone.org 10 July 2011 | Volume 6 | Issue 7 | e22838
References
1. Bank A (2006) Regulation of human fetal hemoglobin: new players, new
complexities. Blood 107: 435–443.
2. Schechter AN (2008) Hemoglobin research and the origins of molecular
medicine. Blood 112: 3927–3938.
3. Bunn HF (1997) Pathogenesis and treatment of sickle cell disease. N Engl J Med
337: 762–769.
4. Platt OS, Orkin SH, Dover G, Beardsley GP, Miller B, et al. (1984)
Hydroxyurea enhances fetal hemoglobin production in sickle cell anemia.J Clin Invest 74: 652–656.
5. Sankaran VG, Xu J, Orkin SH (2010) Advances in the understanding of
haemoglobin switching. Br J Haematol 149: 181–194.
6. Efremov DG, Dimovski AJ, Sukarova E, Schiliro G, Zisovski N, et al. (1994)
gamma-mRNA and Hb F levels in beta-thalassaemia. Br J Haematol 88:311–317.
7. Weinberg RS, Ji X, Sutton M, Perrine S, Galperin Y, et al. (2005) Butyrateincreases the efficiency of translation of gamma-globin mRNA. Blood 105:
1807–1809.
8. Chakalova L, Osborne CS, Dai YF, Goyenechea B, Metaxotou-Mavromati A,
et al. (2005) The Corfu deltabeta thalassemia deletion disrupts gamma-globin
gene silencing and reveals post-transcriptional regulation of HbF expression.Blood 105: 2154–2160.
9. Ambros V (2004) The functions of animal microRNAs. Nature 431: 350–355.
10. Bartel DP (2004) MicroRNAs: genomics, biogenesis, mechanism, and function.
Cell 116: 281–297.
11. Filipowicz W, Bhattacharyya SN, Sonenberg N (2008) Mechanisms of post-
transcriptional regulation by microRNAs: are the answers in sight? Nat Rev
Genet 9: 102–114.
12. Weinmann L, Hock J, Ivacevic T, Ohrt T, Mutze J, et al. (2009) Importin 8 is a
gene silencing factor that targets argonaute proteins to distinct mRNAs. Cell136: 496–507.
13. Merkerova M, Belickova M, Bruchova H (2008) Differential expression ofmicroRNAs in hematopoietic cell lineages. Eur J Haematol 81(4): 304–10.
14. Landry P, Plante I, Ouellet DL, Perron MP, Rousseau G, et al. (2009) Existenceof a microRNA pathway in anucleate platelets. Nat Struct Mol Biol 16:
961–966.
15. Zhan M, Miller CP, Papayannopoulou T, Stamatoyannopoulos G, Song CZ(2007) MicroRNA expression dynamics during murine and human erythroid
differentiation. Exp Hematol 35: 1015–1025.
16. Chen SY, Wang Y, Telen MJ, Chi JT (2008) The genomic analysis of
erythrocyte microRNA expression in sickle cell diseases. PLoS ONE 3: e2360.
17. Wang B, Love TM, Call ME, Doench JG, Novina CD (2006) Recapitulation of
short RNA-directed translational gene silencing in vitro. Mol Cell 22: 553–560.
18. Noh SJ, Miller SH, Lee YT, Goh SH, Marincola FM, et al. (2009) Let-7
microRNAs are developmentally regulated in circulating human erythroid cells.
J Transl Med 7: 98.
19. Bianchi N, Zuccato C, Lampronti I, Borgatti M, Gambari R (2009) Expression
of miR-210 during erythroid differentiation and induction of gamma-globingene expression. BMB Rep 42: 493–499.
20. Gabbianelli M, Testa U, Morsilli O, Pelosi E, Saulle E, et al. (2010) Mechanismof human Hb switching: a possible role of the kit receptor/miR 221–222
complex. Haematologica 95: 1253–1260.
21. Sankaran VG, Menne TF, Scepanovic D, Vergilio JA, Ji P, et al. (2011)
MicroRNA-15a and -16-1 act via MYB to elevate fetal hemoglobin expression in
human trisomy 13. Proc Natl Acad Sci U S A 108: 1519–1524.
22. Skadberg O, Brun A, Sandberg S (2003) Human reticulocytes isolated from
peripheral blood: maturation time and hemoglobin synthesis. Lab Hematol 9:198–206.
23. Smetanina NS, Gu LH, Simjanovska L, Momirovska A, Petkov GH, et al. (1997)Alpha-, beta-, and gamma-mRNA levels in beta-thalassemia; transcriptional and
translational differences in heterozygotes, homozygotes, and compound
heterozygotes. Hemoglobin 21: 27–39.
24. Rudel S, Flatley A, Weinmann L, Kremmer E, Meister G (2008) A
multifunctional human Argonaute2-specific monoclonal antibody. Rna 14:1244–1253.
25. Beitzinger M, Peters L, Zhu JY, Kremmer E, Meister G (2007) Identification ofhuman microRNA targets from isolated argonaute protein complexes. RNA Biol
4: 76–84.
26. Ender C, Krek A, Friedlander MR, Beitzinger M, Weinmann L, et al. (2008) A
human snoRNA with microRNA-like functions. Mol Cell 32: 519–528.
27. Villeval JL, Pelicci PG, Tabilio A, Titeux M, Henri A, et al. (1983) Erythroidproperties of K562 cells. Effect of hemin, butyrate and TPA induction. Exp Cell
Res 146: 428–435.
28. Testa U, Thomopoulos P, Vinci G, Titeux M, Bettaieb A, et al. (1982)
Transferrin binding to K562 cell line. Effect of heme and sodium butyrateinduction. Exp Cell Res 140: 251–260.
29. Testa U, Vainchenker W, Beuzard Y, Rouyer-Fessard P, Guerrasio A, et al.
(1982) Hemoglobin expression in clones of K562 cell line. Eur J Biochem 121:649–655.
30. Sutherland JA, Turner AR, Mannoni P, McGann LE, Turc JM (1986)Differentiation of K562 leukemia cells along erythroid, macrophage, and
megakaryocyte lineages. J Biol Response Mod 5: 250–262.31. Friedman RC, Farh KK, Burge CB, Bartel DP (2009) Most mammalian
mRNAs are conserved targets of microRNAs. Genome Res 19: 92–105.32. Rehmsmeier M, Steffen P, Hochsmann M, Giegerich R (2004) Fast and effective
prediction of microRNA/target duplexes. Rna 10: 1507–1517.
33. Krutzfeldt J, Rajewsky N, Braich R, Rajeev KG, Tuschl T, et al. (2005)Silencing of microRNAs in vivo with ‘antagomirs’. Nature 438: 685–689.
34. Lal A, Navarro F, Maher CA, Maliszewski LE, Yan N, et al. (2009) miR-24Inhibits cell proliferation by targeting E2F2, MYC, and other cell-cycle genes via
binding to ‘‘seedless’’ 39UTR microRNA recognition elements. Mol Cell 35:
610–625.35. Elcheva I, Goswami S, Noubissi FK, Spiegelman VS (2009) CRD-BP protects
the coding region of betaTrCP1 mRNA from miR-183-mediated degradation.Mol Cell 35: 240–246.
36. Qin W, Shi Y, Zhao B, Yao C, Jin L, et al. (2010) miR-24 regulates apoptosis by
targeting the open reading frame (ORF) region of FAF1 in cancer cells. PLoSONE 5: e9429.
37. Tay Y, Zhang J, Thomson AM, Lim B, Rigoutsos I (2008) MicroRNAs toNanog, Oct4 and Sox2 coding regions modulate embryonic stem cell
differentiation. Nature 455: 1124–1128.38. Duursma AM, Kedde M, Schrier M, le Sage C, Agami R (2008) miR-148
targets human DNMT3b protein coding region. Rna 14: 872–877.
39. Lewis MA, Quint E, Glazier AM, Fuchs H, De Angelis MH, et al. (2009) AnENU-induced mutation of miR-96 associated with progressive hearing loss in
mice. Nat Genet 41: 614–618.40. Mencia A, Modamio-Hoybjor S, Redshaw N, Morin M, Mayo-Merino F, et al.
(2009) Mutations in the seed region of human miR-96 are responsible for
nonsyndromic progressive hearing loss. Nat Genet 41: 609–613.41. Kondkar AA, Bray MS, Leal SM, Nagalla S, Liu DJ, et al. (2009) VAMP8/
Endobrevin is over expressed in hyperreactive human platelets: suggested rolefor platelet micro-RNA. J Thromb Haemost 8: 369–378.
42. Guttilla IK, White BA (2009) Coordinate regulation of FOXO1 by miR-27a,miR-96, and miR-182 in breast cancer cells. J Biol Chem 284: 23204–23216.
43. Vakoc CR, Letting DL, Gheldof N, Sawado T, Bender MA, et al. (2005)
Proximity among distant regulatory elements at the beta-globin locus requiresGATA-1 and FOG-1. Mol Cell 17: 453–462.
44. Borg J, Papadopoulos P, Georgitsi M, Gutierrez L, Grech G, et al. (2010)Haploinsufficiency for the erythroid transcription factor KLF1 causes hereditary
persistence of fetal hemoglobin. Nat Genet 42: 801–805.
45. Zhou D, Liu K, Sun CW, Pawlik KM, Townes TM (2010) KLF1 regulatesBCL11A expression and gamma- to beta-globin gene switching. Nat Genet 42:
742–744.46. Jiang J, Best S, Menzel S, Silver N, Lai MI, et al. (2006) cMYB is involved in the
regulation of fetal hemoglobin production in adults. Blood 108: 1077–1083.47. Sankaran VG, Menne TF, Xu J, Akie TE, Lettre G, et al. (2008) Human fetal
hemoglobin expression is regulated by the developmental stage-specific repressor
BCL11A. Science 322: 1839–1842.48. Goh SH, Josleyn M, Lee YT, Danner RL, Gherman RB, et al. (2007) The
human reticulocyte transcriptome. Physiol Genomics 30: 172–178.49. Oneal PA, Gantt NM, Schwartz JD, Bhanu NV, Lee YT, et al. (2006) Fetal
hemoglobin silencing in humans. Blood 108: 2081–2086.
50. Zhang L, Flygare J, Wong P, Lim B, Lodish HF (2011) miR-191 regulates mouseerythroblast enucleation by down-regulating Riok3 and Mxi1. Genes Dev 25:
119–124.51. O’Carroll D, Mecklenbrauker I, Das PP, Santana A, Koenig U, et al. (2007) A
Slicer-independent role for Argonaute 2 in hematopoiesis and the microRNApathway. Genes Dev 21: 1999–2004.
52. Galgano A, Forrer M, Jaskiewicz L, Kanitz A, Zavolan M, et al. (2008)
Comparative analysis of mRNA targets for human PUF-family proteins suggestsextensive interaction with the miRNA regulatory system. PLoS ONE 3: e3164.
53. Shevchenko A, Tomas H, Havlis J, Olsen JV, Mann M (2006) In-gel digestionfor mass spectrometric characterization of proteins and proteomes. Nat Protoc 1:
2856–2860.
54. Pedrioli PG, Eng JK, Hubley R, Vogelzang M, Deutsch EW, et al. (2004) Acommon open representation of mass spectrometry data and its application to
proteomics research. Nat Biotechnol 22: 1459–1466.55. Eng J, McCormack AL, Yates JR, 3rd (1994) An approach to correlate tandem
mass spectral data of peptides with amino acid sequences in a protein database.
Journal of the American Society for Mass Spectrometry 5: 976–989.56. Keller A, Eng J, Zhang N, Li XJ, Aebersold R (2005) A uniform proteomics
MS/MS analysis platform utilizing open XML file formats. Mol Syst Biol 1:2005 0017.
57. Keller A, Nesvizhskii AI, Kolker E, Aebersold R (2002) Empirical statisticalmodel to estimate the accuracy of peptide identifications made by MS/MS and
database search. Anal Chem 74: 5383–5392.
58. Nesvizhskii AI, Keller A, Kolker E, Aebersold R (2003) A statistical model foridentifying proteins by tandem mass spectrometry. Anal Chem 75: 4646–4658.
miR-96 Inhibits HbF Expression
PLoS ONE | www.plosone.org 11 July 2011 | Volume 6 | Issue 7 | e22838


![Limited Number of Globin Genes in HumanDNA10-7, or 0.198 ngof globin DNA.FromEq. [1] wecan calculate the %hybridization, P, expected for anynumberof globin gene copiespresent.Forexample,inExp.1,](https://img.pdfslide.net/doc/110x75/60e570f3b76c9678502ef0c0/limited-number-of-globin-genes-in-humandna-10-7-or-0198-ngof-globin-dnafromeq.jpg)