Embed Size (px)
Citation preview
Microscopic Simulation Approach to Capacity Analysis of BRT Corridors
181
Microscopic Simulation Approach to Capacity Analysis of
Bus Rapid Transit CorridorsAbdul Jabbar Siddique, Ata M. Khan
Carleton University
Abstract
While a transitway can be built as an access-controlled, two-way rapid transit facility outside the Central Business District (CBD), in the CBD, initially, the Bus Rapid Transit (BRT) service has to be based on exclusive bus lanes due to right-of-way, monetary, and other constraints. The strategy of providing Bus Rapid Transit on exclusive bus lanes in urban corridors is receiving policy attention. However, detailed studies on exclusive bus lane capacity for BRT operation in the CBD of a city have been scarce. In this research, using NETSIM as a microsimulator, BRT corridors in Ottawa (Canada) were investigated in terms of their capacity to handle high volumes of transit buses. For these corridors, scenarios incorporating 2021 traffic were analyzed for choke con-dition and the results were compared with the base case condition representing year 2001 traffic environment. Based on the results of network performance, conclusions were drawn on the capacity of BRT corridors.
IntroductionBusRapidTransit(BRT)isincreasinglyviewedasanaffordableandeffectivemodetoincreasemobility(BRTnewsLane2005).BRToftenbenefitsfromanexclusivebusway (also called a transitway), which can be provided in a number of waysoutside the Central Business District (CBD). The transitway can be built on its

Journal of Public Transportation, 2006 BRT Special Edition
182
ownright-of-way,oritcanbeaccommodatedinafreewaycorridor.ToexpediteBRTdevelopment,thetransitwaycanbebuiltoutsidetheCBDfirst.IntheCBD,duetomanyconstraintsincludingspaceandmoney,theBRTservicecanbepro-videdonexclusivelanes.ThisBRTdevelopmentstrategywasfollowedinOttawa(Canada).
Realizing the importanceof transitoperation in the futuregrowthofOttawa’sdowntown(CityofOttawa2003),averyimportantquestionforCitypolicymak-ersandtransportationplannersisdeterminingthestatebeyondwhichthrough-putoftransitbusesinexclusivebuslanesofBRTcorridorscouldnotbeincreasedwithout making facility design changes. However, reliable and well researchedinformation on capacity and service factors of BRT operation on exclusive buslanesinadowntownenvironmentisscarce.Therefore,thisresearchwasdesignedtoanswerthisveryquestion.
Study Area and Research ChallengeFigure 1 shows a part of the Ottawa downtown street network including twoimportant public transit corridors. The study area encompasses these transitcorridors,i.e.,AlbertandSlaterstreets,thatfacilitateWest-andEast-boundBRToperation,respectively.Thesecorridorsofferone-waytrafficoperationwithsinglebus-only lanes inamixedtrafficenvironmentandconnectwithEastandWesttransitwaysoutsidetheCBD.Thelink/nodediagram(Figure2)showsthestreetswith transit lanes and eight crossing streets. Total length of transit corridorsbetweenElginandBronson(i.e.,intheEast-Westdirection)is1.3km.blocklengthsinthenorth-southdirection,i.e.,betweenAlbertandSlaterstreets,approximately80m.However, intheeast-westdirection, itvariesbetween135mand255m,approximately.
Theresearchchallengewastodeterminethechokelevelofbustrafficforexclusivelanes,whichisdefinedinthisresearchasastateinwhichthroughputoftransitbusescouldnotbeincreasedfurtherundergiventrafficoperatingconditions.Inessence,chokelevelisthemaximumthroughputorcapacityunderprevailingcon-ditions.FortheOttawaCBDcase,itwasintendedtofindmaximumthroughputofbusesthatcanbeaccommodatedonexclusivebuslanesofBRTcorridorsundervariousscenariosthatreflect2021trafficoperatingconditions.

Microscopic Simulation Approach to Capacity Analysis of BRT Corridors
183
InadditiontofindinganswersfortheOttawaCBDbuscorridors,itisofresearchinteresttoprovidesufficientinformationonthistopicsothatotherjurisdictionscanusethemethodologyandfindings.
Figure 1. Study Area and the Street Network in Downtown Ottawa
State of Knowledge in Bus Corridor CapacityLiteraturereviewshowslittleinformationonbusflowcapacityofanarterialwithanexclusivebuslaneforBRToperationintheCBDofacity.ThisdeficiencywasaddressedtosomeextentbySt.JacquesandLevinson(1997)inastudy“Opera-tionalAnalysisofBusLanesonArterials,”whichcontainsguidelinesforestimatingbuslanecapacitiesandspeedsalongarterials.Kittelson&Associates(1999)con-tributeddefinitions,principles,practices,andproceduresintheTransitCapacityandQualityofServiceManual(TCQSM).
Afewauthorsprovidedobservationsonbuslanecapacityorbusheadways,mostlyforuninterruptedflowconditions.Forexample, incaseofNew Jersey’sLincolnTunnel,735busesarereportedtohaveoperatedonexclusiveright-of-wayduringmorningpeakhourinpeakdirection(Kittelson&Associates1999a).
Some South American cities reported bus volumes for exclusive lanes (City ofBogotá1996,CityofCarolina2002).However,theoperationalfeaturesofthecor-ridorswerenotclearlydescribed.Forinstance,intheCityofBogotá,Columbia,ahighervolumeofbuses(630buses/hrintwolanes)wasreportedthanthemaxi-mumnumberofbusescalculatedfromsimulationresults(CityofBogotá1996).In

Journal of Public Transportation, 2006 BRT Special Edition
184
Figu
re 2
. Li
nks
and
Nod
es in
the
Net
wor
k

Microscopic Simulation Approach to Capacity Analysis of BRT Corridors
185
thecaseofOttawa,theBRTisoperatingbelowcapacityintheCBDcorridorsaswellasoutsidetheCBD.The2001highestbusvolumeintheCBDpartofBRTwas225buses/hr.Also,225buses/hrhavebeenreportedontheWestTransitway.
Inshort,reallifeNorthAmericanexamplesofBRToperationonexclusivebuslanesininterruptedflowenvironmentoperatingatorabovecapacityarenotavailable.Fromacapacityanalysisperspective,thereislittleinformationonhighvolumesof buses operating in the form of a platoon in a CBD environment. Regardingcapacityofabuslane,thereisnotmuchliteratureavailableexcepttheoneitemreferencedearlier(St.JacquesandLevinson1997),inwhichtheauthorsnotedthepracticalproblemsassociatedwithhighvolumetransitoperationsthatneedtoberesolvedwhilecalculatingcapacityofabuslaneoperatingunderinterruptedflowconditionsinaCBD.
TheHighwayCapacityManual(HCM2000)procedure,dueto itsrathercoarsenature,isoflimiteduseinthestudyofcapacityandlevelofserviceofbustransitcorridorsinaCBDenvironment.
Study Methodology: The Microsimulation ApproachDue to the level of detailed analysis that was essential for finding answers, thedynamic microscopic analysis approach was adopted. Past research concludedthatthereisaneedfortheuseofamicrosimulationapproachtostudyBRTplan-ning,designandoperationalproblems(Multisystems,Inc.2000).Asimulationtoolisconsideredidealforpublicpresentation,evaluationofbeforeandafterstudies,androutineplanningandoperationsanalysis. Itoffersuserstheopportunitytoobserveanimatedtrafficconditionsandevaluatealternativescenariosforroad-wayandsignalsystemimprovementsinvarioustrafficenvironments.Further,itisconsideredmorepracticalthanafieldexperiment(FederalHighwayAdministra-tion2001).
In this research, NETSIM, a stochastic microscopic traffic simulation tool (ver-sion 5.1) was employed to model and simulate BRT system operations in thedowntown ofOttawa. This simulator can update the state of each vehicle andthesystemunderstudyonasecond-by-secondbasis(Liuetal.1996).Behaviorofvehicles isgovernedbycar-following,queuedischargeandlaneswitchinglogics(Transportation Research Board 2000). NETSIM has the capability to simulatetransitbusoperationsuptoamaximumof2,000buses.Awealthofdatainthe
Journal of Public Transportation, 2006 BRT Special Edition
186
formofmeasures-of-effectiveness(MOE)isaccumulatedattheendofeachsimu-lationrun.
InNETSIM,thecar-followinglogicdifferentiatestheoperationofprivatevehiclesfromapublictransitbusthat issupposedtoservicepassengersatbusstations.Kinematicpropertiesofeachvehiclesuchasspeedandaccelerationaswellasitsstatus(i.e.,whetheritisinaqueueormoving)arealsodetermined.Delayscausedtotheturningvehiclesatintersectionsduetopedestriantrafficarealsomodelledinthenetworktorepresentrealtimetrafficoperations.
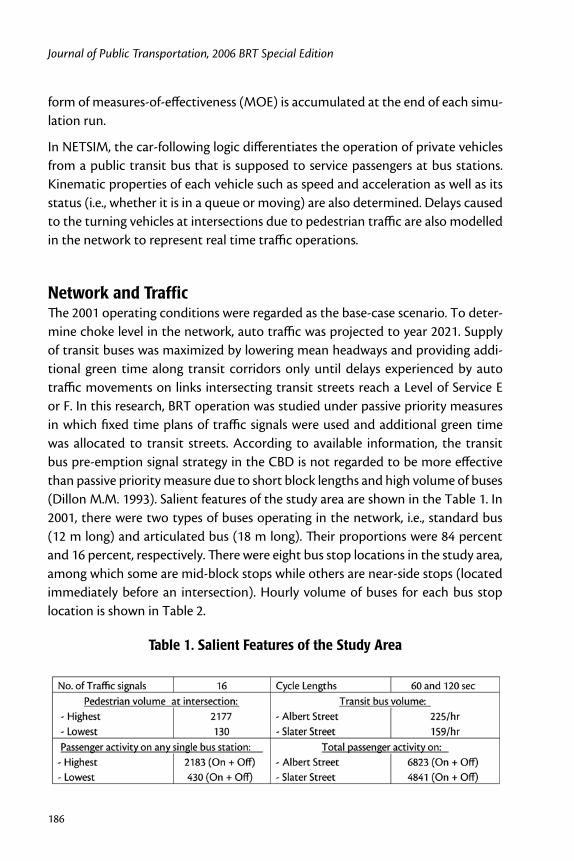
Network and TrafficThe2001operatingconditionswereregardedasthebase-casescenario.Todeter-minechokelevelinthenetwork,autotrafficwasprojectedtoyear2021.Supplyoftransitbuseswasmaximizedbyloweringmeanheadwaysandprovidingaddi-tional green time along transit corridors only until delays experienced by autotrafficmovementsonlinksintersectingtransitstreetsreachaLevelofServiceEorF.Inthisresearch,BRToperationwasstudiedunderpassiveprioritymeasuresinwhichfixedtimeplansoftrafficsignalswereusedandadditionalgreentimewas allocated to transit streets. According to available information, the transitbuspre-emptionsignalstrategyintheCBDisnotregardedtobemoreeffectivethanpassiveprioritymeasureduetoshortblocklengthsandhighvolumeofbuses(DillonM.M.1993).SalientfeaturesofthestudyareaareshownintheTable1.In2001,thereweretwotypesofbusesoperatinginthenetwork,i.e.,standardbus(12mlong)andarticulatedbus(18mlong).Theirproportionswere84percentand16percent,respectively.Therewereeightbusstoplocationsinthestudyarea,amongwhichsomearemid-blockstopswhileothersarenear-sidestops(locatedimmediatelybeforean intersection).Hourlyvolumeofbuses foreachbus stoplocationisshowninTable2.
Table 1. Salient Features of the Study Area

Microscopic Simulation Approach to Capacity Analysis of BRT Corridors
187
Table 2. Hourly Volume of Buses at Bus Stations
DwellTimedataarecollectedregularlybyOC-TranspousingAutomaticPassen-gerCounters(APC)installedonvarioustransitbuses.ThesedatawereutilizedtosimulateBaseCaseandotherscenariosofbusoperationacrosstransitcorridors.Table3showsaveragedwelltimesatrespectivebusstoplocations.
Table 3. Dwell Time (sec) of Buses at Bus Stations
Note:Datashownintablesaboveareforyear2001AMpeakhour(7:30amto8:30am)
Description of ScenariosThreetypesofscenariosweredefined,asshowninFigure3.CaseArepresentstheBaseCasescenario(2001trafficoperatingconditions).InCaseB,autotrafficwasprojectedtoyear2021butsignalcontrolsettingswerekeptthesameasinthebasecase.Thesupplyoftransitbuseswasincreaseduntilchokeconditionsappearedinthenetwork.InCaseC,2021autotrafficwasassumed,andadditionalgreentimewasassignedtotransitstreets.Thesupplyoftransitbuseswasagainmaximizeduntilchokeconditionsappearwithinthenetwork.Figures4and5showgreen/cycle(g/C)ratiosforCasesA,BandCateachintersectionalongAlbertandSlaterStreets,respectively.TheMOEobtainedfromCasesB&CwerecomparedwithBaseCaseAcondition.

Journal of Public Transportation, 2006 BRT Special Edition
188
Figure 3. Scenario Categories and Description
Figure 4. (g/C) Ratios along Albert Street in Cases A, B and C
Figure 5. (g/C) Ratios along Slater Street in Cases A, B and C.

Microscopic Simulation Approach to Capacity Analysis of BRT Corridors
189
Simulation ProcessBecauseofthestochasticnatureofthesimulator(NETSIM),theMOEobtainedfromasimulationrunaretheoutcomeofaspecificsetofrandomnumberseeds.Aparticularsetofrandomnumberseedsmayyieldveryconservativeoravant-garderesults.Therefore, simplyrelyingontheresultsofasinglesimulationrunof a scenario might be misleading. To gain a better understanding of networkperformance,eachscenariowassimulated10times,usingdifferentsetsofrandomnumberseeds.Theresultsofallthesimulationswereaveragedandusedforfurthercalculationsandanalysis.
Simulation Results Thenumberofbusesgeneratedinallthethreecasescenariosreflectstheexclu-sivebuslaneoperationintheCBDofOttawa.Asnotedearlier, inCaseB,whilekeepingalltheoperatingcharacteristicssameasinCaseA,supplyofbusesalongtransitcorridorswasmaximizedbyreducingthemeanheadway.Ananalysisofbusoperationatmeanheadwayof8secondssuggestedthatchokeconditiondidnotoccur.Therefore,theheadwaywasreducedto7seconds/bus.Atameanheadwayof7seconds/busforCaseB,chokeconditionsappearedatupstreamsideofAlbertandSlaterstreets,showninFigure2bylinks(101-1)and(151-9),respectively.Atthisheadway level, throughputofbuseswasrecordedas442/hrand449/hronupstreamlinksofAlbertandSlaterstreets,respectively.TheseareshowninFigure6alongwithbasecasescenario(CaseA).
Figure 6. Number of Transit Buses on Albert and Slater Streets in Cases A and B
*Note: Symbol‘I’showninthisarticlerepresentsStandardDeviationof10simulationresults.

Journal of Public Transportation, 2006 BRT Special Edition
190
ItisimportanttonotethatinCaseB,intheoryata7-second/busmeanheadway,514buses/hr(3600/7)weresupposedtobegeneratedduringonehoursimula-tionperiod.Similarly,inCaseC,atameanheadwayof5sec/busalongwithasig-nificantlyhighgreentime(50secaddedtothebasecase)alongAlbertandSlatercorridors,thenumberofbusesdischargedattheupstreamlinksofthesecorridorswereonly486and494, respectively, asopposedto720buses (i.e.3600/5) thatweresupposedtobegeneratedinaone-hourperiod.AccordingtoTCRPReport26 (1997), this is an indicationof thechokepointand is explained in thenextparagraph.
Figure7showsacomparisonofbusesgeneratedinCaseBvs.CaseCatdifferentadditionalgreentimes.ThetotaldischargebeingwellbelowtheflowrateofbusesdefinedasinputinbothCaseBandCaseCsuggestedthatthecapacityofexclusivebuslaneineachcasewasreached.ThisobservationisinaccordancewiththeTCRPReport26(St.JacquesandLevinson1997).Theauthorsstatethat,“Twomeasuresof performance output indicated the point at which capacity was reached: (1)simulatedaveragebusspeedsdroppedsignificantlyand(2)thenumberofbusesservicedatthebusstopwaslessthanthenumberofbusesinputasthebusflowrate.Thesetwomeasuresindicatedapointatwhichnogreaterflowrateofbuseswouldbeachievedalongthearterialandwherebusesqueuedexcessivelyatthebusstoporatupstreamsignals.”
WhenanimationresultsgeneratedbyNETSIMforthesecaseswereobservedonscreen,itindicatedalongqueueofbusesonupstreamlinks(101–1)and(151
Figure 7. Transit Buses on Albert and Slater Streets at Different Green Times

Microscopic Simulation Approach to Capacity Analysis of BRT Corridors
191
–9).Onehoursimulationresultsalsoshowedtheaveragequeueontheselinksas10and8vehicles,respectively.Thesequeuesofbuseswereunabletobeservedcompletelyduringagreenphaseofsignalcycle.Thus,trafficflowwasadverselyaffected,resultinginlowerspeed,andhigherdelayandtraveltime.Itisimportanttomentionthattheseupstreamlinksareservingasamainsupplysourceoftran-sitbusestoAlbertandSlaterstreets.Iftheseupstreamlinksoperateatcapacity,thesupplyoftransitbusescannotbeincreasedatthedownstreamsideoftransitcorridors.
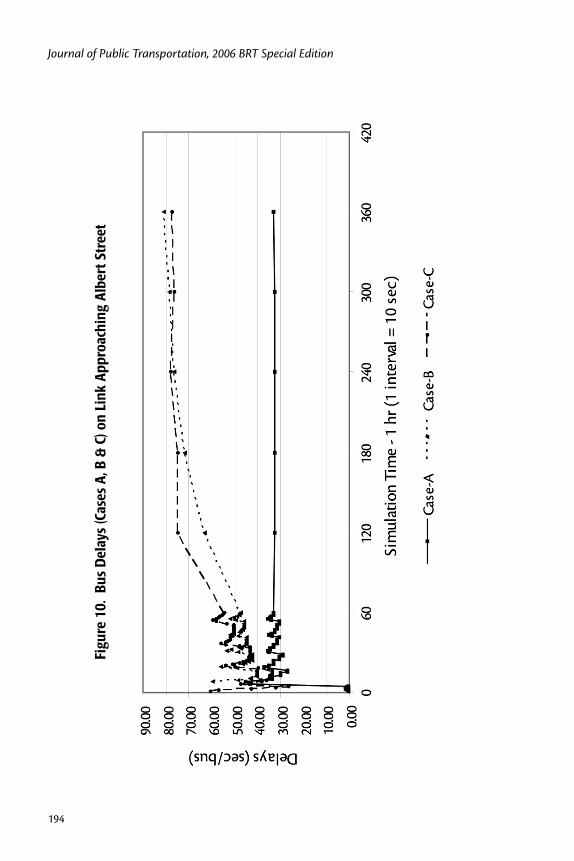
Analysis of ResultsTo further understand the saturated stateofbus transit operation in exclusivelanesatupstreamlinksofAlbertandSlaterstreets,resultsgeneratedbyNETSIMinallthreecasescenarioswereanalyzed.Amongthemeasuresselectedforanaly-sisandcomparisonwereaveragespeed,averagedelays,traveltime(sec/bus)andaverageandmaximumqueues.Thesearecommonlyusedmeasuresforestimatingeffectivenessatsignalizedintersections(Roess,Prassas,andMcShane2004).Duetospacelimitations,onlyspeedanddelayresultsareshowninFigures8to11.
Resultsshownineachofthesefiguresrepresentoutputintwodifferentpatterns.Underthefirstpattern,resultsarecompiledandshownforthefirst10-minuteperiodinwhichoutputdataarecollectedatevery10-secinterval.Inthisway,wegetacompleteunderstandingofthefluctuationshappeningintransitoperationduetothepresenceofcontrolsignalsinthenetwork.Inthesecondpattern,resultsarecompiledforrestofthe50-minutesimulationperiodinwhichdataaregath-eredatevery10-minuteinterval.
ItcanbeobservedfromFigures8and9that,inCaseA,averagebusspeedalongupstreamlinks(101-1)onAlbertand(151-9)onSlaterstreetsgetstabilizedwithinfirstthree/fourminutesperiodandcontinuetooperateataround29km/hrand26km/hr,respectively,throughouttheonehoursimulationperiod.
Thesamephenomenacanbeobserved(inCaseA)forbustotaldelaysshowninFigures10and11.However,inCasesBandC,busoperationisentirelyoppositetoCaseAandasuddendropinaveragebusspeedisseenduringthefirst10-minuteperiod.TheoveralldecreaseinaveragespeedsinCasesBandCismorethan70percent (as compared to the base case) on both Albert and Slater streets. Theobviousoutcomeofthisreductioninaveragespeedsishigherdelaysandlongertraveltimes.

Journal of Public Transportation, 2006 BRT Special Edition
192
Figu
re 8
. Bus
Mea
n Sp
eed
(Cas
es A
, B &
C) o
n Li
nk A
ppro
achi
ng A
lber
t Str
eet

Microscopic Simulation Approach to Capacity Analysis of BRT Corridors
193
Figu
re 9
. Bus
Mea
n Sp
eed
(Cas
es A
, B &
C) o
n Li
nk A
ppro
achi
ng S
late
r St
reet
Journal of Public Transportation, 2006 BRT Special Edition
194
Figu
re 1
0. B
us D
elay
s (C
ases
A, B
& C
) on
Link
App
roac
hing
Alb
ert S
tree
t

Microscopic Simulation Approach to Capacity Analysis of BRT Corridors
195
Figu
re 1
1. B
us D
elay
s (C
ases
A, B
& C
) on
Link
App
roac
hing
Sla
ter
Stre
et

Journal of Public Transportation, 2006 BRT Special Edition
196
Itisimportanttonotethatthequeuesofbusesgeneratedhadalreadyoccupiedtheentirelengthdefinedforupstreamlinks(101-1)onAlbertand(151–9)onSlater streets.Regardingbusdelays,wecannotice fromFigures10and11 thatthese are continuing to increase with the passage of time in Cases B and C asopposedtoCaseA.Asimilarpatternwasobservedinbustraveltimes(notshownhereduetospacelimitations).
Speedresultswerealsoplottedagainstbusdelaysaswellasbustraveltimes.Aregressionanalysiswasalsocarriedoutineachofthesecases.Theregressionequa-tions and correlation coefficients (r) between two parameters (speed and busdelaysorbustraveltime)werecalculated.Asexpected,anegativeslopeofregres-sionlinesshowedaninverserelationshipbetweenthetwoparameters.Highvaluesof“r”werefound,whichsuggestastrongcorrelationbetweenthetwoparameters.Thespeedvs.delayplotsandregressionequationsarenotshowninthispaperduetospacelimitations.
Fromanetworkperspective, it isuseful toassess the impactsof increasingbusvolumeattheexpenseofothertrafficinthenetwork.ThiscanbeachievedbythestudyofadvantagesofCaseBoverCaseC(Table4).TheseresultsindicatethatascomparedtoCaseB,inCaseChigherbusthroughputsareachievedattheexpenseofadverseeffectsontheoverallnetworkoperations.
Table 4. Comparative advantage of Case-B over Case-C (at Network Level)
MOE:MeasureofEffectiveness

Microscopic Simulation Approach to Capacity Analysis of BRT Corridors
197
Conclusions Followingarethemainconclusionsofthisresearch.
1. CaseBcanaccommodate442and449busesinexclusivebuslanesonAlbertandSlatercorridors,respectively,alongwithyear2021autotraffictraversingthroughotherlanesofthesecorridors.Atthisvolumelevel,exclusivebuslaneswillsaturateatupstreamsidesofAlbertandSlaterstreetsrepresentedby links(101–1)at intersection#1andlink(151–9)at intersection#9,respectively.
2. InCaseC,anincreaseingreentimesofupto+30sec(inadditiontooriginalsignaltimes)alongtransitcorridorsattractslessthan6percentofadditionalbusvolumeontransitcorridors,ascomparedtoCaseB(withnoadditionalgreentimeontransitstreets).Similarly,increaseingreentimesupto+50sec(inadditiontooriginalsignaltimes)accommodates486and494busesonAlbertandSlaterstreets,respectively,i.e.,anincreaseof10percentoneachofthestreets.AtthispointmostofthetrafficmovementsonlinksintersectingtransitstreetswillbeoperatingataLOSEorF,representingchokeconditionsinthenetwork.
3. Capacityestimatesofexclusivebuslaneobtainedfromsimulationresultsvis-à-visfromtheHighwayCapacityManual(HCM)2000procedureshowmuchdifference.InCaseB,capacityresultingfrommicrosimulationis55percentand35percenthigheronAlbertandSlaterstreets,respectively,ascomparedtothefigurescalculatedfromHCM2000.Similarly,inCaseC,itis22percentand11percenthigheronAlbertandSlaterstreets,ascomparedtoHCM2000results.
4. Atsaturatedconditions,averagespeedsonupstreamlink(101–1)alongAlbertStreetinCasesBandCwilldropby75percent,bustotaldelaysandbus travel time will increase by more than 135 percent and 96 percent,respectively, and average queue length will rise by 400 percent. Further,maximumqueueswillgrowfrom8to15orhigheronsamelinks.Similarlyonupstreamlink(151–9)alongSlaterStreet,inCasesBandC,averagebusspeedwillreducebymorethan72percent,totalbusdelaysandbustraveltimewillincreasebymorethan578percentand264percent,respectively,andmaximumqueueswillriseby450percent.Further,averagebusqueueswillgrowfrom0to8busesonsamelink.
5. Basedonyear2001averageoccupancyfiguresoftransitbuses,whichis32.5persons/busattheupstreamlinksofAlbertandSlaterStreets,upto28,960

Journal of Public Transportation, 2006 BRT Special Edition
198
passengersinCaseBand31,850passengersinCaseCcanbetransportedtothedowntowncorethroughtransitoperationonAlbertandSlaterstreetsonly.
6. OperationaladvantagesofCaseBoverCaseCsuggestthat,ifBRThastooperateonexclusivelanesintheCBD,allocationofadditionalgreentimetobusstreetsattheexpenseofothertrafficisnoteffectivefromtheoverallsystemperspective.Here,allthevehiclesandthestudyareanetworkdefinethesystem.Effectivenesswasgaugedusinganumberofmeasuresincludingspeed,time,delay,kmtraversed,fuelconsumption,andemissions.
Recommendations1. AlthoughthesimulatorNETSIMused in this research is reasonablywell
developed,furtherimprovementcanbemade.
(a) Averagedwelltimeofbusesateachbusstationmayvaryfromrealtimesituations,asmanybuseshavedifferentdwelltimes.Routeswithhigherdwelltimeimpedetransittrafficatupstreamside.InNETSIM,aprovisionshouldbedevelopedsothatdwelltimesaredefinedaccordingtotheroutedemandsinsteadofanaveragedwelltimevalueapplicabletoallroutesinthesystem.
(b) InNETSIM,optionoftwoormoreexclusivebuslanesshouldalsobeprovided.
2. SinceincreaseingreentimealongtransitcorridorasinCaseCisnotsignifi-cantlyincreasingthethroughputoftransitbusesascomparedtoCaseB,ratheritiscausingexcessivelyhighdelaystotrafficmovementsonintersect-ingstreets,itis,therefore,recommendedtocontinuetransitoperationsatexistingcyclelengths.
3. Anotheranalysisincorporatingtwobuslanesandadditionalbusstationslocatedatsuitablepointsacrossthewidthofthecorridorshouldbecar-riedout.
4. SkipStopstrategycanbeappliedinfuturebutitneedsfurtherstudyregard-ingtheeffectondwelltimes(whichmightincreaseonsomebusstops)andhowtoeducatepeople,etc.
5. Allhigh-floorbusescanbereplacedwithlow-floorbuses,andanautomatedfarecollectionsystemcanbeusedinordertospeedupdwelltimes

Microscopic Simulation Approach to Capacity Analysis of BRT Corridors
199
6. Thisstudycanbefurtherextendedtoexaminetheprospectsofusingalargershareofthefleetcomprisedoflargervehicles.SuchastudymayprovidetheplannersaninsightintotherelativevehicleperformanceofstandardsizedversuslargeBRTvehicles.
Acknowledgements
TheNaturalSciencesandEngineeringResearchCouncilofCanada(NSERC)pro-videdfinancialsupportforresearchreportedinthisarticle.TheauthorsgratefullyacknowledgetheavailabilityofOCTranspodatausedinthisresearch.Theviewsarethoseoftheauthors.
References
BRTnewsLane.2005.BRTyearinreview:Lookingbackon2005.Vol.4,No.5,West-Start-CALSTART,supportedbytheFederalTransitAdministration,USA.
CityofBogotá.1996.MasterTransportationPlanforBogotá,(JICA)
CityofCarolina.2001-2002.DepartmentofCityandRegionalPlanning.CarolinaTransportationProgram,Report.
CityofOttawa.2003OttawaTransportationMasterPlan.
DillonM.M.1993.ReviewofthetrafficsignaloperationontheCentralAreaTran-sitway.FinalReport,Ottawa.
FederalHighwayAdministration(FHWA).2001.CORSIMUser’sGuide–version5.0.OfficeofOperationsResearch,DevelopmentandTechnology,Washing-ton,D.C.
InstituteofTransportationEngineers.1986.Urbantrafficcongestion:WhatDoestheFuturehold?ITE Publication No. IR-040,Washington,D.C.
KittelsonandAssociates,Inc.1999.TCRP web document 6 – Transit capacity and quality of service manual.PreparedforTransitCooperativeResearchProgram,TransportationResearchBoard,NationalResearchCouncil.
Kittelson and Associates, Inc. 1999a. TCRP web document 6 – Transit capacity and quality of service manual(Chapter-2).PreparedforTransitCooperativeResearchProgram,TransportationResearchBoard,NationalResearchCoun-cil.

Journal of Public Transportation, 2006 BRT Special Edition
200
Liu,R.,andD.V.Vliet,.1996DRACULA–adynamicmicroscopicmodelofroadtraffic.ProceedingsoftheInternationalTransportSymposium,Beijing:160-170.
Multisystems,Inc.2000.BusRapidTransitSimulationModelResearchandDevel-opment.FinalProjectSummaryReportforUSDOT/SBIRPhase1.
Roess,R.P.,E.S.Prassas,andW.R.McShane.2004.Traffic Engineering,ThirdEdition.PearsonPrenticeHall.
St.Jacques,K.andH.S.Levinson.1997.Operational Analysis of Bus Lanes on Arteri-als,TCRPReport26.SponsoredbyTheFederalTransitAdministrationandpublishedbyTransportationResearchBoard,NationalResearchCouncil.
Transportation Research Board. 2000a. Traffic Analysis Software Tools, Circular Number E-C014.NationalResearchCouncil.
TransportationResearchBoard.2000b.Highway Capacity Manual 2000:Chapter14–TransitConcepts.NationalResearchCouncil.
About the Authors
Abdul Jabbar Siddique ([email protected]) isaPh.D. student intheDepartmentofCivilandEnvironmentalEngineeringatCarletonUniversity,Ottawa, Canada, where he earned his M.A.Sc Degree in 2003. He is working atCarletonUniversityasaResearchandTeachingassistant.His research interestsarepublictransitoperations,trafficnetworkmodellingandsimulationsandtrafficimpactstudies.
Ata M. Khan([email protected])receivedhisdoctoratefromtheUniver-sityofWaterloo(Canada)incivilengineering(transportation).Heisaprofessorin the Department of Civil and Environmental Engineering and director of theTransportationResearchCentre,CarletonUniversity(Canada).