Embed Size (px)
Citation preview

Impacts of the Hiawatha Light Rail Line on Commercial and Industrial Property Values in Minneapolis
CTS Report 10-05
Program Sponsors:
Anoka County
Hennepin County
Minnesota Department of Transportation
Ramsey County
University Metropolitan Consortium, University of Minnesota
Washington County
In cooperation with:
Center for Transportation Studies, University of Minnesota
Center for Urban and Regional Affairs, University of Minnesota
City of Minneapolis
City of Saint Paul
Dakota County
Federal Transit Administration
Metropolitan Council/Metro Transit
State and Local Policy Program, Hubert H. Humphrey Institute of Public Affairs, University of Minnesota
Report #4 in the series Transitway Impacts Research Program
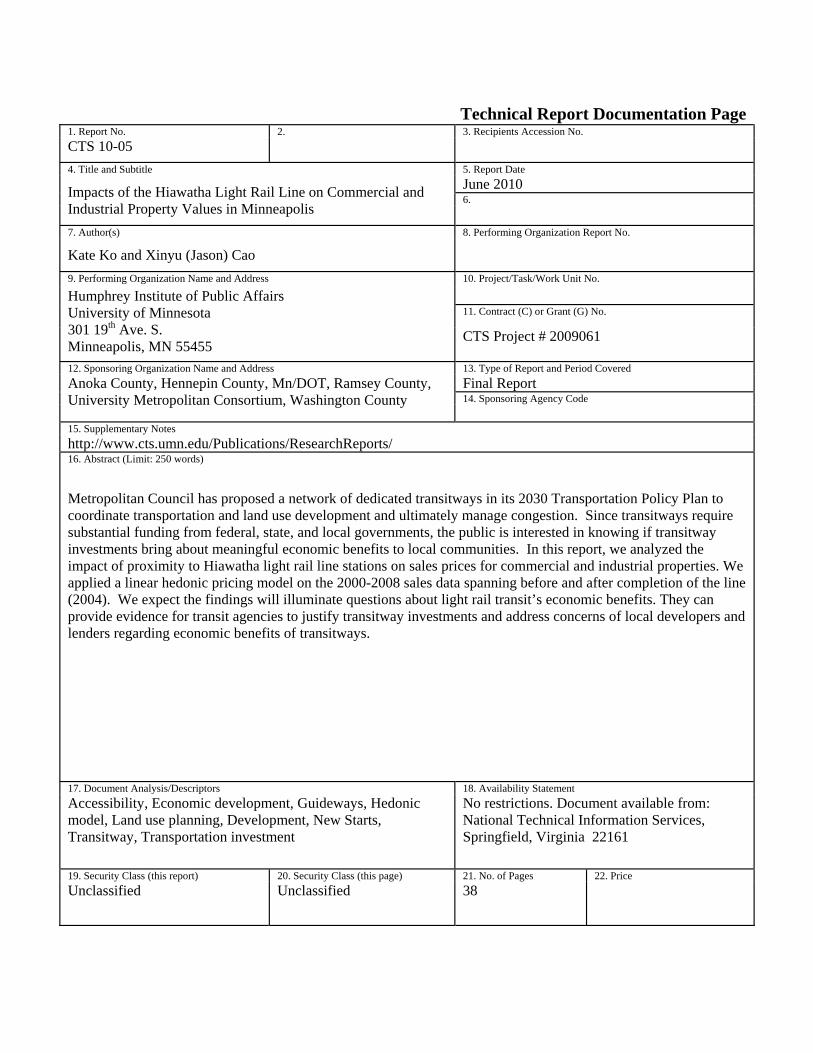
Technical Report Documentation Page 1. Report No. 2. 3. Recipients Accession No. CTS 10-05 4. Title and Subtitle 5. Report Date
Impacts of the Hiawatha Light Rail Line on Commercial and Industrial Property Values in Minneapolis
June 2010 6.
7. Author(s) 8. Performing Organization Report No.
Kate Ko and Xinyu (Jason) Cao
9. Performing Organization Name and Address 10. Project/Task/Work Unit No. Humphrey Institute of Public Affairs University of Minnesota 301 19th Ave. S. Minneapolis, MN 55455
11. Contract (C) or Grant (G) No.
CTS Project # 2009061
12. Sponsoring Organization Name and Address 13. Type of Report and Period Covered Anoka County, Hennepin County, Mn/DOT, Ramsey County, University Metropolitan Consortium, Washington County
Final Report 14. Sponsoring Agency Code
15. Supplementary Notes http://www.cts.umn.edu/Publications/ResearchReports/ 16. Abstract (Limit: 250 words)
Metropolitan Council has proposed a network of dedicated transitways in its 2030 Transportation Policy Plan to coordinate transportation and land use development and ultimately manage congestion. Since transitways require substantial funding from federal, state, and local governments, the public is interested in knowing if transitway investments bring about meaningful economic benefits to local communities. In this report, we analyzed the impact of proximity to Hiawatha light rail line stations on sales prices for commercial and industrial properties. We applied a linear hedonic pricing model on the 2000-2008 sales data spanning before and after completion of the line (2004). We expect the findings will illuminate questions about light rail transit’s economic benefits. They can provide evidence for transit agencies to justify transitway investments and address concerns of local developers and lenders regarding economic benefits of transitways.
17. Document Analysis/Descriptors 18. Availability Statement Accessibility, Economic development, Guideways, Hedonic model, Land use planning, Development, New Starts, Transitway, Transportation investment
No restrictions. Document available from: National Technical Information Services, Springfield, Virginia 22161
19. Security Class (this report) 20. Security Class (this page) 21. No. of Pages 22. Price Unclassified Unclassified 38
Impacts of the Hiawatha Light Rail Line on Commercial and Industrial Property Values in Minneapolis
Final Report
Prepared by:
Kate Ko
Department of Applied Economics University of Minnesota
Xinyu (Jason) Cao
Humphrey Institute of Public Affairs
University of Minnesota
June 2010
Published by:
Center for Transportation Studies University of Minnesota
200 Transportation and Safety Building 511 Washington Ave., SE
Minneapolis, Minnesota 55455
This report represents the results of research conducted by the authors and does not necessarily reflect the official views or policies of the Center for Transportation Studies, the University of Minnesota, or the sponsoring organizations of the Transitway Impacts Research Program. The authors, the Center for Transportation Studies, the University of Minnesota, and the sponsoring organizations of the Transitway Impacts Research Program do not endorse products or manufacturers. Any trade or manufacturers’ names that may appear herein do so solely because they are considered essential to this report.

ACKNOWLEDGEMENTS The study was funded by the Transitway Impacts Research Program which includes a mix of funding partners and program supporters, including Anoka County, Center for Transportation Studies, Center for Urban and Regional Affairs, City of Minneapolis, City of St. Paul, Dakota County, Federal Transit Administration, Hennepin County, Humphrey Institute of Public Affairs State and Local Policy Program, Itasca Group, Metropolitan Council, Metro Transit, Minnesota Department of Transportation, Ramsey County, University Metropolitan Consortium and Washington County. Also, we would like to thank the Technical Advisory Group: John Adams, Cecilia Bolognesi, Jack Corkle, Kathie Doty, Andy Gitzlaff, Todd Graham, John Levin, Jan Lucke, Robb Luckow, Lee Munnich, Steve Morris, Sam O'Connell, Libby Starling, David Vessel, and Robert Vockrodt. The authors would also like to thank the Program Management Team who also provided valuable feedback to this research and Rachel Jordan, who helped with GIS analysis.
TABLE OF CONTENTS
1 INTRODUCTION................................................................................................................. 1
2 LITERATURE REVIEW .................................................................................................... 3
3 BACKGROUND ................................................................................................................... 5
4 SUMMARY OF ESTIMATED MARKET VALUES ....................................................... 9 4.1 COMMERCIAL PROPERTIES ............................................................................................... 9 4.2 INDUSTRIAL PROPERTIES ................................................................................................ 11
5 HEDONIC ANALYSIS OF SALE PRICES..................................................................... 15 5.1 DATA ............................................................................................................................. 15 5.2 METHODOLOGY ............................................................................................................. 17 5.3 RESULTS ........................................................................................................................ 21
5.3.1 Subregion .................................................................................................................. 21 5.3.2 Station area ............................................................................................................... 22
6 CONCLUSIONS ................................................................................................................. 25
REFERENCES ............................................................................................................................ 27
APPENDIX A: ALTERNATIVE HEDONIC MODELS FOR SALES PRICE
LIST OF TABLES Table 4.1. Commercial Properties Estimated Market Value- Overall .......................................... 10 Table 4.2. Commercial Properties Estimated Market Value- Downtown Region ........................ 10 Table 4.3. Commercial Properties Estimated Market Value- Midtown Region ........................... 11 Table 4.4. Commercial Properties Estimated Market Value- Airport/ Mall Region .................... 11 Table 4.5. Industrial Properties Estimated Market Value- Overall .............................................. 12 Table 4.6. Industrial Properties Estimated Market Value- Downtown Region ............................ 12 Table 4.7. Industrial Properties Estimated Market Value- Midtown Region ............................... 13 Table 4.8. Industrial Properties Estimated Market Value- Airport/ Mall Region ........................ 13 Table 5.1. Number of Observations Available ............................................................................. 16 Table 5.2. Summary Statistics of Applicable Variables ............................................................... 20 Table 5.3. Hedonic Price Function Estimates for Subregion ........................................................ 22 Table 5.4. Hedonic Price Function Estimates for Station Area .................................................... 23
LIST OF FIGURES Figure 1.1. 2030 Transitway System in the Twin Cities ................................................................. 2 Figure 3.1. Hiawatha Light Rail Route Map ................................................................................... 6 Figure 3.2. Land Use Description in Control and Treatment Areas ............................................... 7 Figure 5.1. Sales Activity in Control and Treatment Areas .......................................................... 16 Figure 5.2. Sales of Commercial Properties ................................................................................. 17 Figure 5.3. Sales of Industrial Properties ...................................................................................... 18 Figure 5.4. Price Premium and Proximity to LRT ........................................................................ 24

EXECUTIVE SUMMARY The 2030 Transportation Policy Plan developed by the Metropolitan Council identifies several potential transitway corridors for the Twin Cities metropolitan area. Because these transitways are major transportation investments, it is imperative to know whether they bring measurable economic benefits. Urban economic theories state that a relative increase in accessibility tends to boost the values of nearby properties because the demand for highly accessible locations drives up the bid for the locations. As a companion work on residential property led by Dr. Ed Goetz, this study investigates the impact of proximity to transitways on the values of commercial and industrial properties. Through a case study of the Hiawatha Light Rail Line, this study aims to address the following question: How does the proximity to light rail stations impact the values of properties along the corridor? The study examines the first operational section of the Hiawatha Line, a 12-mile section of light rail line connecting downtown Minneapolis, Minnesota, to its southern suburbs. Using the 2000-2008 property sales data, we applied a linear hedonic pricing model to isolate the value-added impact of the proximity to light rail stations, while controlling for other key factors that determine commercial and industrial property values. These factors include those related to property structural characteristics, access to transportation network, agglomeration economy, prestige of location, and access to labor pool. We developed two models: one for one-mile station area and the other for a sub-region. According to the model for the sub-region, we did not find a statistically significant impact of the Hiawatha Line on property values in the sub-region. Therefore, the impact of the light rail line, if any, tends to be along the line. The station area model showed that the Hiawatha Line has increased the demand for commercial and industrial properties along the corridor; properties closer to light rail stations were sold at higher prices and the benefits of the Hiawatha Line extended nearly a mile from stations. Overall, the Hiawatha Line has increased the values of commercial and industrial properties within a one-mile radius of light rail stations. However, this study is unable to tell whether the increases along the line represent generative economic benefits or the increases are at the expense of losses in other areas in the region.
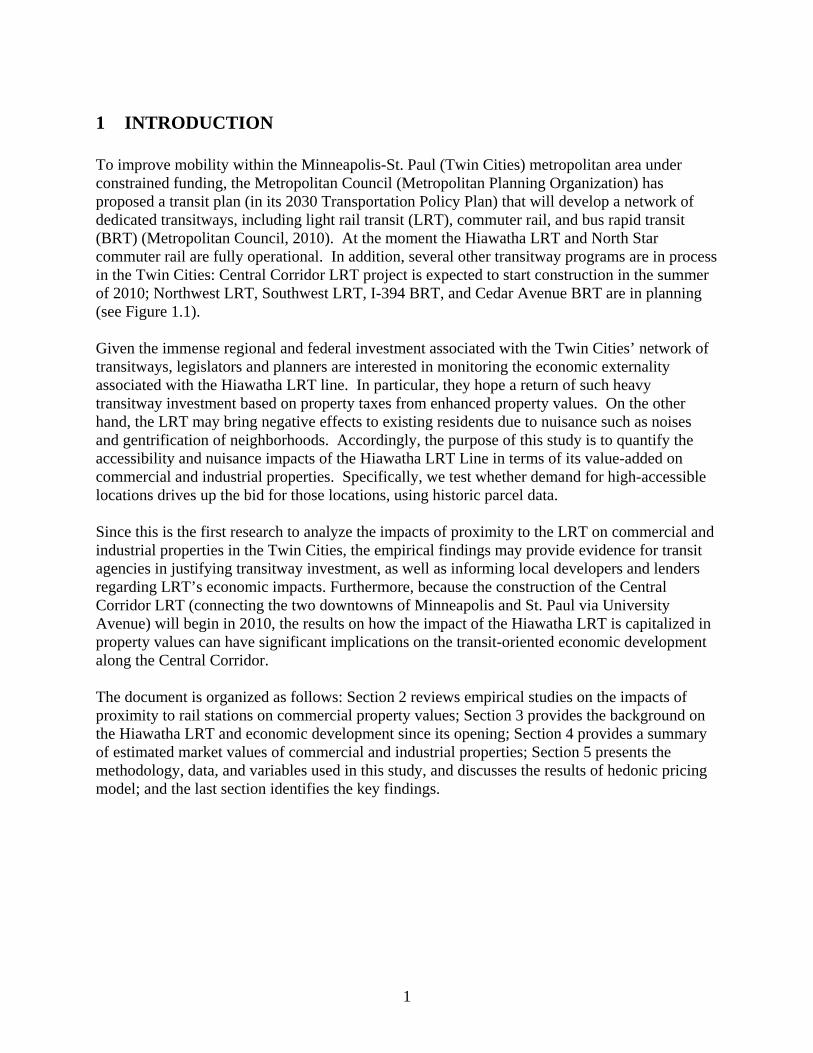
1 INTRODUCTION To improve mobility within the Minneapolis-St. Paul (Twin Cities) metropolitan area under constrained funding, the Metropolitan Council (Metropolitan Planning Organization) has proposed a transit plan (in its 2030 Transportation Policy Plan) that will develop a network of dedicated transitways, including light rail transit (LRT), commuter rail, and bus rapid transit (BRT) (Metropolitan Council, 2010). At the moment the Hiawatha LRT and North Star commuter rail are fully operational. In addition, several other transitway programs are in process in the Twin Cities: Central Corridor LRT project is expected to start construction in the summer of 2010; Northwest LRT, Southwest LRT, I-394 BRT, and Cedar Avenue BRT are in planning (see Figure 1.1). Given the immense regional and federal investment associated with the Twin Cities’ network of transitways, legislators and planners are interested in monitoring the economic externality associated with the Hiawatha LRT line. In particular, they hope a return of such heavy transitway investment based on property taxes from enhanced property values. On the other hand, the LRT may bring negative effects to existing residents due to nuisance such as noises and gentrification of neighborhoods. Accordingly, the purpose of this study is to quantify the accessibility and nuisance impacts of the Hiawatha LRT Line in terms of its value-added on commercial and industrial properties. Specifically, we test whether demand for high-accessible locations drives up the bid for those locations, using historic parcel data. Since this is the first research to analyze the impacts of proximity to the LRT on commercial and industrial properties in the Twin Cities, the empirical findings may provide evidence for transit agencies in justifying transitway investment, as well as informing local developers and lenders regarding LRT’s economic impacts. Furthermore, because the construction of the Central Corridor LRT (connecting the two downtowns of Minneapolis and St. Paul via University Avenue) will begin in 2010, the results on how the impact of the Hiawatha LRT is capitalized in property values can have significant implications on the transit-oriented economic development along the Central Corridor. The document is organized as follows: Section 2 reviews empirical studies on the impacts of proximity to rail stations on commercial property values; Section 3 provides the background on the Hiawatha LRT and economic development since its opening; Section 4 provides a summary of estimated market values of commercial and industrial properties; Section 5 presents the methodology, data, and variables used in this study, and discusses the results of hedonic pricing model; and the last section identifies the key findings.
1
Source: Metropolitan Council (2010)
Figure 1.1. 2030 Transitway System in the Twin Cities
2

2 LITERATURE REVIEW The body of literature regarding the impact of rail on commercial property values is very limited. The most relevant studies in terms of analytical approach are for the California rail transit systems. Cervero and Duncan (2002a) developed hedonic pricing models using Metroscan 1998-1999 sales data (controlling for various types of commercial activities) and found, on average, that within a 0.25 mile radius of LRT stations, commercial properties commanded an average price premium of about $4 per square foot; and that commercial properties with 0.25 mile of the CalTrain stations had a $25 per square foot premium whereas a discount of -$1.88 per square foot was found for those within 0.5 mile of a highway. For properties in Los Angeles County, Cervero and Duncan (2002b) used Metroscan 1999-2001 data and found average premiums of $14,877 and $2,574 per property for the Blue and Green Lines respectively (these were the only LRT lines). Weinberger (2001) analyzed the relationship between commercial office effective rental rates and proximity to LRT stations in Santa Clara County, CA. Using lease transaction data from 1984 to 2000, she tested the effects of several location dummy variables on property values and concluded that the highest premium was found for properties that are within 0.25 mile of the LRT stations, at $0.08 per square foot. Beyond the 0.5 mile boundary (which is believed to be a comfortable walking distance for most people), she did not find statistically significant relationship between the distance from transit stations and the rents for commercial properties. When she analyzed distance gradient (in a form of step functions) with a different model, she found that rents fell between the 0.25-0.75 mile radii, at a rate that ranges between $0.2 and $0.3 per mile. Using the quarterly asking rents per square foot in the CoStar property information system data from 1999-2004, Fuerst (2007) performed separate analyses for property- and location-specific price determinants, as well as for random and fixed effects arising from submarket heterogeneity within Manhattan, New York. According to all log-linear regression results, there were positive price gradient towards major transit exchanges (subway, commuter train, and bus). In particular, the elasticity of price per square foot with respect to distance in feet ranges from 0.059 to 0.116. In general, these studies found positive impacts of proximity to rail stations on commercial property values. However, the impacts are not always significant and consistently positive. Landis et al (1995) conducted a comprehensive study of the BART as well as the San Diego Trolley using TRW-REDI’s online real property files from 1987 to 1993. The data included full transaction prices in Alameda, Contra Cost, and San Diego Counties. According to their multiple regression results for the three separate counties and for isolating and then combing various land uses, proximity to transit stations is not statistically significant, although they found some price premium for properties within a 0.5 mile radius of transit stations using ANOVA. Some studies also found mixed results regarding the impacts of rail transit on property values, depending on the sizes of adjacent areas considered in the studies, the location of properties, and the variable of interest. Landis and Loutzenheiser (1995) used Black’s Office Leasing Guide 1993 data for the San Francisco Bay Area to calibrate a model with four distance dummy variables for properties within 0.5 mile of BART stations. Within a 0.25 mile buffer, they concluded a negative asking rent premium of -$0.18 per square foot; in contrast, a positive
3

premium of $0.23 was found for properties within a 0.5 mile radius. In a study for San Diego County, Cervero and Duncan (2002c) found significant variation in their results in terms of both signs and magnitudes. Specifically, they found that the Mission Valley (within a half mile radius) and Downtown LRT (within a quarter mile radius) stations commanded price premiums of $813,124 and $50,196 respectively. In contrast, properties within a half mile radius of the South and East Line stations were priced with discounts of -$104,267 and -$12,796 respectively. In addition, two studies using the same rail line produced opposite results. Nelson (1999) analyzed the impact of three heavy rail stations (operated by the Metropolitan Atlanta Rapid Transit Authority (MARTA)) on commercial property values from 1980-1994. Using sale prices as the dependent variable, he found a positive price gradient towards the stations. In the other study, Bollinger et al (1998) use rental rate per square foot data from Jamison Research, Inc., for the fourth quarter of 1990, the third quarter of 1994, and the first quarter of 1996. Using dummy variables for properties within one mile of highway and quarter mile of MARTA stations, they found a positive price premium towards the highway but a negative price premium towards the transit stations. These estimates ranged from $0.28 to $0.34 and from -$0.99 to -$0.81, respectively. Further, Ryan (2005) investigated the impact of highway and LRT access on asking rents of commercial and industrial buildings in San Diego metropolitan area. The author used data from the Torrey Urban Research Institute from 1986 to 1995 to conduct separate analyses of three market areas of difference socioeconomic and land use characteristics. Overall, the author found that highway access seemed to be a driving factor of office rents, but access to LRT stations tended to produce negative rent premiums in two market areas. Contrary to the traditional formulation used in a hedonic pricing function, Debrezion et al (2007) analyzed the impact of rail stations on effect sizes of proximity to stations on property from existing studies. Essentially they used results from the literature as their data sample. Regressing estimated percentage in property values on 0.25 mile station dummy variable, they found that the average effect size for the impact of rail station proximity on property values was 25.7%. In summary, there have been a limited number of studies conducted to explore the influences of rail transit on commercial property values and most studies focused on the rail systems in California. Furthermore, the results of these studies are mixed. Accordingly, legislators and the public are left with an open question: does the installation of a LRT line increase commercial property values, given its opportunity cost? A study in the Twin Cities should shed light on this question.
4
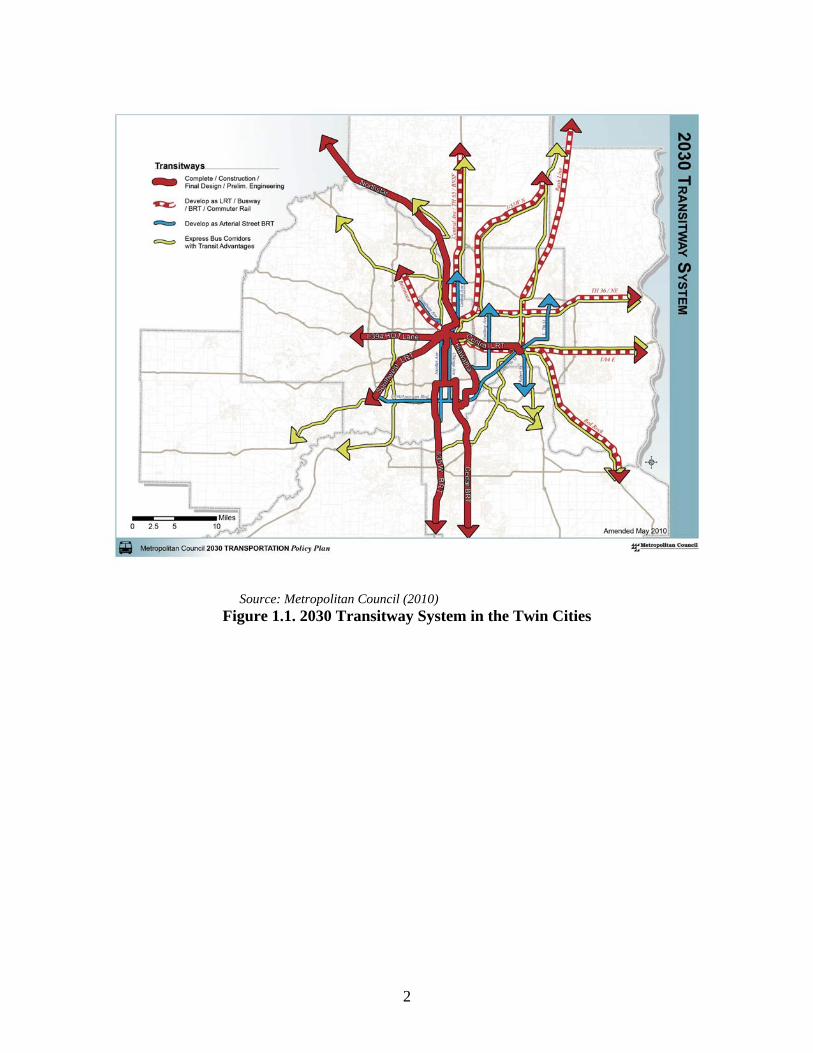
3 BACKGROUND Construction of the Hiawatha LRT line in Minneapolis started in 2001, shortly after final financing was secured from the Federal Transit Administration, and it was completed in 2004. As shown in Figure 3.1, the 12-mile line has 17 stations and runs north to south between downtown Minneapolis and the Mall of America in Bloomington, Minnesota, through the Minneapolis-Saint Paul International Airport (two more stations, Target Field and American boulevard were added in late 2009). There are four stations located in the northernmost downtown Minneapolis area, and six stations located at the southern most part of the line, starting at the MSP airport, the Bloomington corporate center, and ending at the Mall of America. These station areas at either end of the line are primarily dominated by commercial development and/or institutional land uses, while the station areas in the middle of the line are dominated by industrial and residential properties (Figure 3.2). Some evidence suggests the completion of the LRT line has affected nearby economic development. According to the Metropolitan Council, the line has attracted and/or sustained a steady growth of several corporate commercial and retail developments at both ends of the line, as well as other smaller retailers and restaurants in neighborhoods along the line (Metropolitan Council, 2006). In addition, there have been positive premiums generated by the LRT in residential home (Ko et. al, 2009). Adjusting for the recent boom and bust in the residential real estate market by identifying a half mile treatment area , they found a $18,374,284 premium generated for single-family homes as well as a $6,900,598 premium for multifamily homes, after the completion of the LRT line. In order to provide quantitative evidence for the localized impacts of the LRT, we specify a treatment study area as one mile buffers from all station. Also, we identify a subregion (defined by the boundary intersections of one mile west of I-35W (Lyndale Avenue), one mile north of the last downtown Minneapolis station, the Mississippi River, and one mile south of the Mall of America (see Figure 3.2) of Minneapolis and Bloomington) so that we can discount overall price fluctuations in the real estate market in the region.
5
Source: Metro Transit
Figure 3.1. Hiawatha Light Rail Route Map
6

Figure 3.2. Land Use Description in Control and Treatment Areas
7

8
4 SUMMARY OF ESTIMATED MARKET VALUES In the section we report the overall change in estimated market values (EMV) per property square footage of commercial and industrial properties in the subregion, as well as in three distinct station regions. The set of parcel EMV data is available from the Metropolitan Council and the square footage information is from the City of Minneapolis Assessor’s Office. We used this exercise to gain knowledge of the nonresidential real market trends of the types of properties that we are interested in this study. In particular, we compare the EMV of properties before and after the opening of LRT in 2004. Essentially we use the results here to form hypotheses regarding the transaction prices that are applied towards our hedonic pricing model. The results in this section should not be interpreted as predictors of non-residential market activities. The data sets used here do not reflect the economics of commercial and industrial real estate market, or the preferences of property buyers. Moreover, the results do not reflect any value premiums of LRT capitalized in property transactions. The averages presented are based on the number of observations available in both years of each respective period of LRT, and they are deflated to constant year 2000 dollars using deflators from Nation Income and Product Account’s (NIPA) Gross Domestic Product deflators.
4.1 Commercial properties The results for the commercial properties in the data set are displayed in Table 4.1 - Table 4.4. Table 4.1 compares commercial property values in the subregion and those in station areas along the whole Hiawatha corridor. In general, building and land values fell within study area during the pre-LRT period. In 2004, per square foot building values within 0.25 mi radius ofLRT stations declined 6.6 percent from 2001and such a change was more than ten percent lower than the percentage change for the subregion over the same period. The data show that the decline in average land value was more prominent. The overall decrease in values can be dthe nuisance of constructio
ue to n.
During the post-LRT period, both building and land value rose, and the number of observations increased. In 2007, per square foot building values within 0.25 mi radius of LRT stations increased over 38 percent from 2004 and such a change was about 18 percent higher than the percentage change for the subregion over the same period. Table 4.2 displays the EMV summary for the first station region: downtown. This region is defined by the Downtown Zone of the LRT (including the Warehouse District Station, Nicollet Mall Station, Government Plaza Station, and the Metrodome Station) and a parcel is considered to be inside this region if the station from which it is closest to is within this zone. Between 2001 and 2004, the value of per square foot spaces was low within the treatment areas (0.5-mile buffer) while land prices were much higher. This indicates that within the downtown region, land is more valuable than building spaces. This continues to be true after opening of LRT. Similar to the previous case, where EMV of both building and land values fell prior to the
9
opening of LRT, we observe large price increases after 2004. The alarming findings here are that within the treatment areas, percentage change in building value (38 percent) increased almost double the subregion’s (20 percent), suggesting the increased in demand was highly concentrated around the station areas.
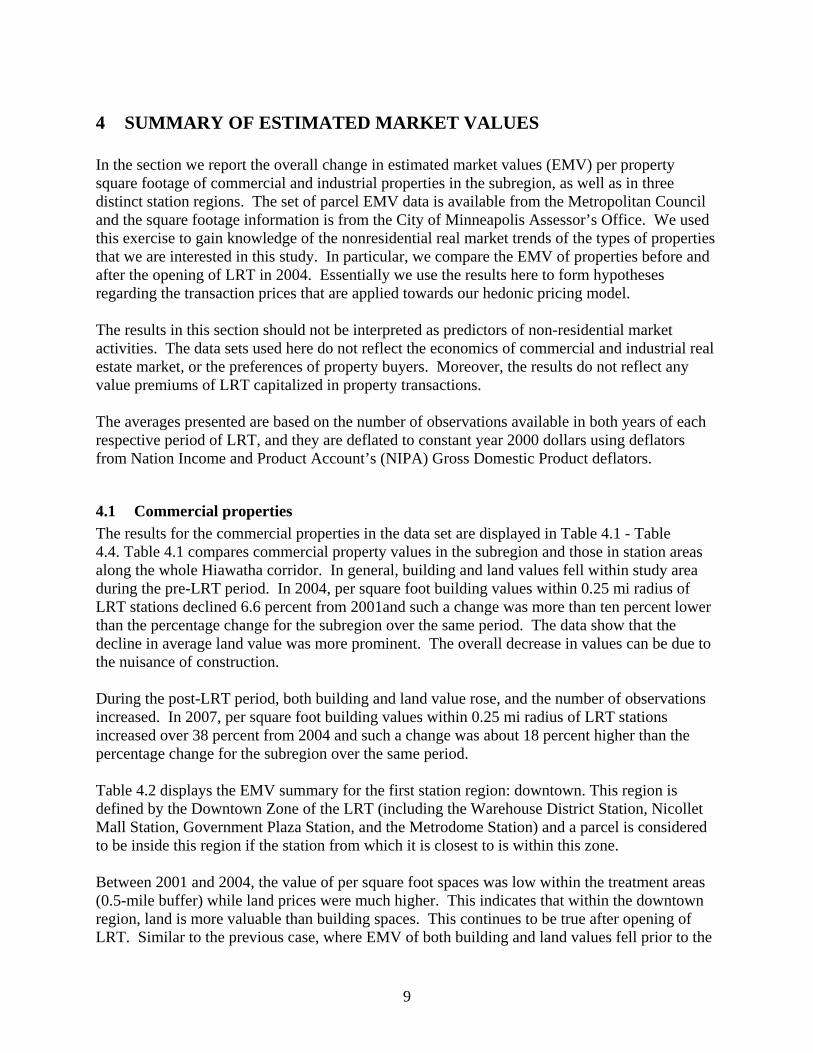
Table 4.1. Commercial Properties Estimated Market Value- Overall
Subregion 0.5 mi 0.25 mi Post LRT Subregion 0.5 mi 0.25 mi2001 $43.80 $31.33 $26.71 2004 $45.19 $30.51 $24.912004 $45.38 $31.19 $24.96 2007 $54.31 $39.80 $34.46
3.62 -0.46 -6.55 20.18 30.44 38.33-4.08 -10.17 10.26 18.15
$1.58 -$0.15 -$1.75 $9.12 $9.29 $9.55
Subregion 0.5 mi 0.25 mi Post LRT Subregion 0.5 mi 0.25 mi2001 $17.24 $45.54 $64.55 2004 $16.42 $37.97 $50.782004 $16.30 $37.98 $52.17 2007 $21.48 $43.34 $55.70
-5.47 -16.61 -19.18 30.82 14.15 9.69-11.14 -13.71 -16.67 -21.13
-$0.94 -$7.56 -$12.38 $5.06 $5.37 $4.92
% Change% Difference
Overall Average EMV of Building per Square FootagePre/ Early LRT
Absolute Change
Absolute Change
Overall Average EMV of Land per Polygon Square FootagePre/ Early LRT
% Change% Difference
Notes: Percentage change is calculated by change in value over time (from 2001 to 2004, or from 2004to 2007); percentage difference measures the difference in percentage change when study area is restricted to 0.5 mile radius, and then to 0.25 mile radius from subregion; absolute change is the nominal difference over time.
Table 4.2. Commercial Properties Estimated Market Value- Downtown Region
Subregion 0.5 mi 0.25 mi Post LRT Subregion 0.5 mi 0.25 mi2001 $39.55 $19.85 $19.82 2004 $40.17 $19.19 $18.102004 $40.84 $20.28 $18.40 2007 $51.56 $30.74 $29.18
3.27 2.17 -7.19 28.36 60.22 61.18-1.11 -10.46 31.86 32.82
$1.30 $0.43 -$1.42 $11.39 $11.55 $11.07
Subregion 0.5 mi 0.25 mi Post LRT Subregion 0.5 mi 0.25 mi2001 $41.35 $78.78 $94.73 2004 $35.91 $62.94 $74.882004 $35.99 $64.28 $75.54 2007 $41.20 $69.02 $80.18
-12.96 -18.40 -20.26 14.73 9.67 7.08-5.44 -7.30 -5.07 -7.66
-$5.36 -$14.50 -$19.20 $5.29 $6.08 $5.30Absolute Change% Difference
% Change% Difference
Downtown Average EMV of Building per Square FootagePre/ Early LRT
Absolute Change
Downtown Average EMV of Land per Polygon Pre/ Early LRT
% Change
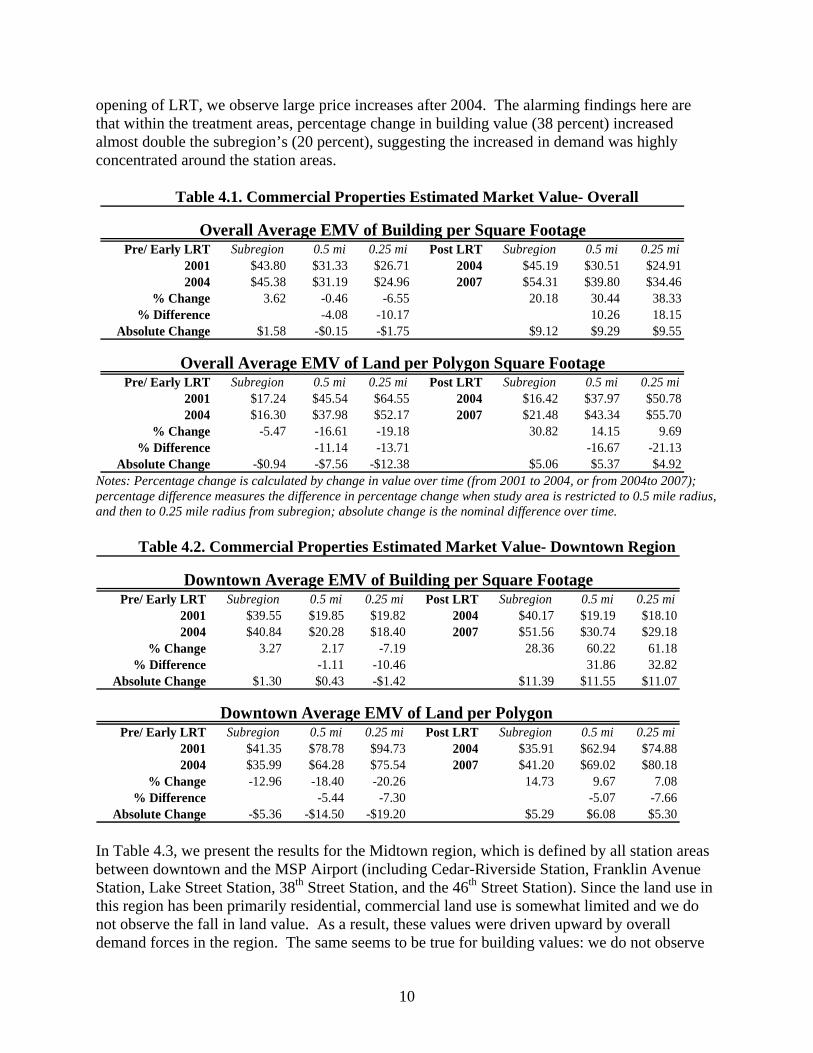
In Table 4.3, we present the results for the Midtown region, which is defined by all station areas between downtown and the MSP Airport (including Cedar-Riverside Station, Franklin Avenue Station, Lake Street Station, 38th Street Station, and the 46th Street Station). Since the land use in this region has been primarily residential, commercial land use is somewhat limited and we do not observe the fall in land value. As a result, these values were driven upward by overall demand forces in the region. The same seems to be true for building values: we do not observe
10

significant differences in values within the treatment areas when they are compared to values in the subregion.
Table 4.3. Commercial Properties Estimated Market Value- Midtown Region
Subregion 0.5 mi 0.25 mi Post LRT Subregion 0.5 mi 0.25 mi2001 $45.54 $45.52 $43.52 2004 $47.34 $45.54 $41.692004 $47.18 $44.66 $40.98 2007 $55.05 $51.83 $47.47
3.61 -1.88 -5.84 16.29 13.80 13.88-5.49 -9.45 -2.49 -2.41
$1.64 -$0.86 -$2.54 $7.71 $6.28 $5.78
Subregion 0.5 mi 0.25 mi Post LRT Subregion 0.5 mi 0.25 mi2001 $5.18 $5.20 $5.72 2004 $5.80 $5.73 $6.132004 $5.85 $5.79 $6.25 2007 $10.38 $10.15 $10.45
12.90 11.46 9.23 79.06 77.28 70.61-1.44 -3.67 -1.78 -8.45
$0.67 $0.60 $0.53 $4.58 $4.42 $4.33
% Change% Difference
Midtown Average EMV of Building per Square FootagePre/ Early LRT
Absolute Change
Absolute Change
Midtown Average EMV of Land per Polygon Pre/ Early LRT
% Change% Difference
Since we do not have structural information for the Airport/Mall region (where it includes all station areas starting from the MSP airport stations to the Mall of America station), we cannot infer much from building value (see Table 4.4). The increases in land values within our treatment areas were dramatically smaller than those in the subregion in both periods, suggesting that in this region, station area effects on land values are small.
Table 4.4. Commercial Properties Estimated Market Value- Airport/ Mall Region
Subregion 0.5 mi 0.25 mi Post LRT Subregion 0.5 mi 0.25 mi2001 $62.86 $0.00 $0.00 2004 $67.09 $0.00 $0.00
67.09 0.00 0.00 2007 76.17 0.00 0.006.72 NA NA 13.54 NA NA
NA NA NA NA$4.23 NA NA $9.08 NA NA
Subregion 0.5 mi 0.25 mi Post LRT Subregion 0.5 mi 0.25 mi2001 $9.03 $12.23 $11.68 2004 $11.04 $12.66 $11.72
11.00 12.97 12.40 2007 16.84 17.42 15.7521.86 6.08 6.23 52.58 37.60 34.37
-15.79 -15.63 -14.98 -18.21$1.97 0.74 0.73 $5.80 4.76 4.03
Airport/ Mall Average EMV of Building per Square Footage
2004
Pre/ Early LRT
Airport/ Mall EMV of Land per Polygon
Absolute Change
Absolute Change
% Change% Difference
Pre/ Early LRT
% Change% Difference
2004
4.2 Industrial properties We report summary results for the industrial properties in Table 4.5 - Table 4.8. Within our study area, land values were flat during the pre-LRT period, and increased during the post-LRT period
11
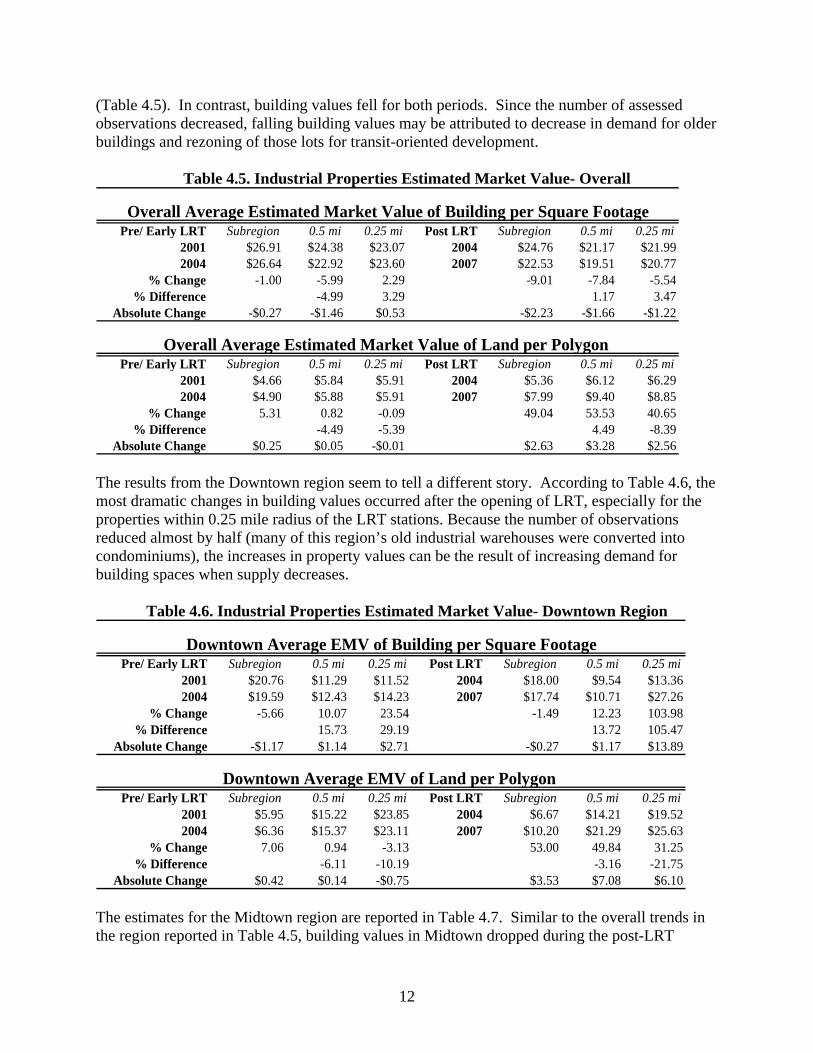
(Table 4.5). In contrast, building values fell for both periods. Since the number of assessed observations decreased, falling building values may be attributed to decrease in demand for older buildings and rezoning of those lots for transit-oriented development.
Table 4.5. Industrial Properties Estimated Market Value- Overall
Subregion 0.5 mi 0.25 mi Post LRT Subregion 0.5 mi 0.25 mi2001 $26.91 $24.38 $23.07 2004 $24.76 $21.17 $21.992004 $26.64 $22.92 $23.60 2007 $22.53 $19.51 $20.77
-1.00 -5.99 2.29 -9.01 -7.84 -5.54-4.99 3.29 1.17 3.47
-$0.27 -$1.46 $0.53 -$2.23 -$1.66 -$1.22
Subregion 0.5 mi 0.25 mi Post LRT Subregion 0.5 mi 0.25 mi2001 $4.66 $5.84 $5.91 2004 $5.36 $6.12 $6.292004 $4.90 $5.88 $5.91 2007 $7.99 $9.40 $8.85
5.31 0.82 -0.09 49.04 53.53 40.65-4.49 -5.39 4.49 -8.39
$0.25 $0.05 -$0.01 $2.63 $3.28 $2.56
% Change% Difference
Overall Average Estimated Market Value of Building per Square FootagePre/ Early LRT
% DifferenceAbsolute Change
Absolute Change
Overall Average Estimated Market Value of Land per Polygon Pre/ Early LRT
% Change
The results from the Downtown region seem to tell a different story. According to Table 4.6, the most dramatic changes in building values occurred after the opening of LRT, especially for the properties within 0.25 mile radius of the LRT stations. Because the number of observations reduced almost by half (many of this region’s old industrial warehouses were converted into condominiums), the increases in property values can be the result of increasing demand for building spaces when supply decreases.
Table 4.6. Industrial Properties Estimated Market Value- Downtown Region
Subregion 0.5 mi 0.25 mi Post LRT Subregion 0.5 mi 0.25 mi2001 $20.76 $11.29 $11.52 2004 $18.00 $9.54 $13.362004 $19.59 $12.43 $14.23 2007 $17.74 $10.71 $27.26
-5.66 10.07 23.54 -1.49 12.23 103.9815.73 29.19 13.72 105.47
-$1.17 $1.14 $2.71 -$0.27 $1.17 $13.89
Subregion 0.5 mi 0.25 mi Post LRT Subregion 0.5 mi 0.25 mi2001 $5.95 $15.22 $23.85 2004 $6.67 $14.21 $19.522004 $6.36 $15.37 $23.11 2007 $10.20 $21.29 $25.63
7.06 0.94 -3.13 53.00 49.84 31.25-6.11 -10.19 -3.16 -21.75
$0.42 $0.14 -$0.75 $3.53 $7.08 $6.10Absolute Change% Difference
% Change% Difference
Downtown Average EMV of Building per Square FootagePre/ Early LRT
Downtown Average EMV of Land per Polygon Pre/ Early LRT
% Change
Absolute Change
The estimates for the Midtown region are reported in Table 4.7. Similar to the overall trends in the region reported in Table 4.5, building values in Midtown dropped during the post-LRT
12
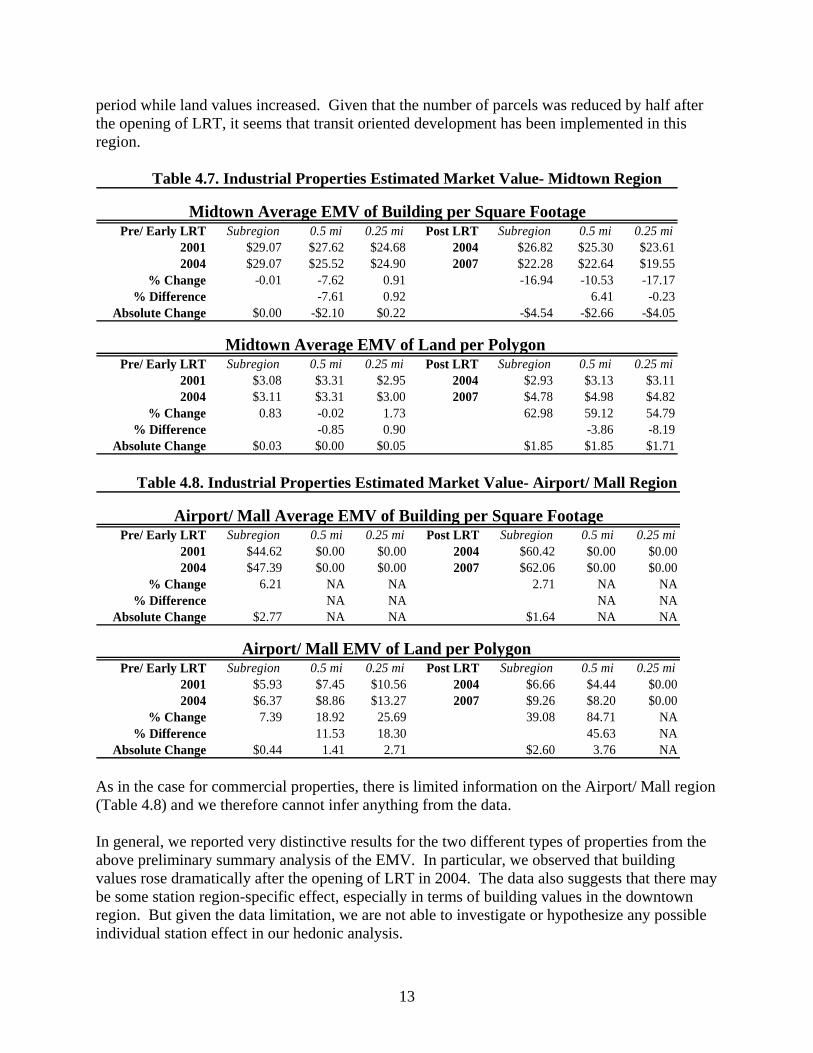
period while land values increased. Given that the number of parcels was reduced by half after the opening of LRT, it seems that transit oriented development has been implemented in this region.
Table 4.7. Industrial Properties Estimated Market Value- Midtown Region
Subregion 0.5 mi 0.25 mi Post LRT Subregion 0.5 mi 0.25 mi2001 $29.07 $27.62 $24.68 2004 $26.82 $25.30 $23.612004 $29.07 $25.52 $24.90 2007 $22.28 $22.64 $19.55
-0.01 -7.62 0.91 -16.94 -10.53 -17.17-7.61 0.92 6.41 -0.23
$0.00 -$2.10 $0.22 -$4.54 -$2.66 -$4.05
Subregion 0.5 mi 0.25 mi Post LRT Subregion 0.5 mi 0.25 mi2001 $3.08 $3.31 $2.95 2004 $2.93 $3.13 $3.112004 $3.11 $3.31 $3.00 2007 $4.78 $4.98 $4.82
0.83 -0.02 1.73 62.98 59.12 54.79-0.85 0.90 -3.86 -8.19
$0.03 $0.00 $0.05 $1.85 $1.85 $1.71
% Change% Difference
Midtown Average EMV of Building per Square FootagePre/ Early LRT
Absolute Change
Absolute Change
Midtown Average EMV of Land per Polygon Pre/ Early LRT
% Change% Difference
Table 4.8. Industrial Properties Estimated Market Value- Airport/ Mall Region
Subregion 0.5 mi 0.25 mi Post LRT Subregion 0.5 mi 0.25 mi2001 $44.62 $0.00 $0.00 2004 $60.42 $0.00 $0.00
$47.39 $0.00 $0.00 2007 $62.06 $0.00 $0.006.21 NA NA 2.71 NA NA
NA NA NA NA$2.77 NA NA $1.64 NA NA
Subregion 0.5 mi 0.25 mi Post LRT Subregion 0.5 mi 0.25 mi2001 $5.93 $7.45 $10.56 2004 $6.66 $4.44 $0.00
$6.37 $8.86 $13.27 2007 $9.26 $8.20 $0.007.39 18.92 25.69 39.08 84.71 NA
11.53 18.30 45.63 NA$0.44 1.41 2.71 $2.60 3.76 NAAbsolute Change
% Change% Difference
Pre/ Early LRT
% Change% Difference
2004
Airport/ Mall Average EMV of Building per Square Footage
2004
Pre/ Early LRT
Airport/ Mall EMV of Land per Polygon
Absolute Change
As in the case for commercial properties, there is limited information on the Airport/ Mall region (Table 4.8) and we therefore cannot infer anything from the data. In general, we reported very distinctive results for the two different types of properties from the above preliminary summary analysis of the EMV. In particular, we observed that building values rose dramatically after the opening of LRT in 2004. The data also suggests that there may be some station region-specific effect, especially in terms of building values in the downtown region. But given the data limitation, we are not able to investigate or hypothesize any possible individual station effect in our hedonic analysis.
13

14

5 HEDONIC ANALYSIS OF SALE PRICES
5.1 Data In this study, we used sales price of commercial (including retail sales, offices, services, hotels, motels, health care facilities, recreational services that are privately owned and operated for profits) and industrial (manufacturing, transportation, construction, communications, utilities, and wholesale trade) properties (defined by the Metropolitan Council) as our dependent variable. As presented earlier, previous studies have used various forms to measure values of commercial and industrial property. Some studies used contract rents (Bollinger et al., 1998; Weinberger, 2001). In Minnesota, rental data are proprietary and hence not obtainable from assessor’s office according to the law in Minnesota. An assessor of City of Minneapolis stated that even if rental data can be released, the number of records is rather limited because property owners are reluctant to report their rental information to city assessors (personal communication with Scott A. Lindquist, June 26, 2008). Further, contract rents may not reflect effective rents due to concessions made in transactions (Cervero and Duncan, 2002a). In our search data, we reached a few private businesses that collect property income information and obtained a database of asking rents. However, the data are not complete and the quality is inferior. More importantly, asking rents do not precisely reflect the real estate market equilibrium price. Given the limitations of rental data, we chose to use sales values of properties. The property data set was obtained from the Metropolitan Council, in which individual parcel’s transaction price is available over our analysis horizon. A cross section of structural data was obtained from the City of Minneapolis, and we used the data set under the assumption that change in structural characteristics of a property is small. The two data sets were joined in ArcMap 9.2 (ESRI) and analyzed for spatial references. Since our research focuses on the impacts of proximity to the LRT before and after the Hiawatha LRT begins service, we only included properties that were sold between 2000 and 2008. All monetary values were deflated to constant year 2000 dollars as before for EMV. Table 5.1 summarizes the number of commercial and industrial observations in the dataset and Figure 5.1 shows that the majority of sales occurred near downtown Minneapolis and Mall of America in Bloomington. We take the most recent sales into consideration (as opposed to repeat sales since we do not have structural data across time). Taking data inconsistencies and structural information availability into account, the number of observations used in this analysis is smaller than what is available in the parcel data.
15
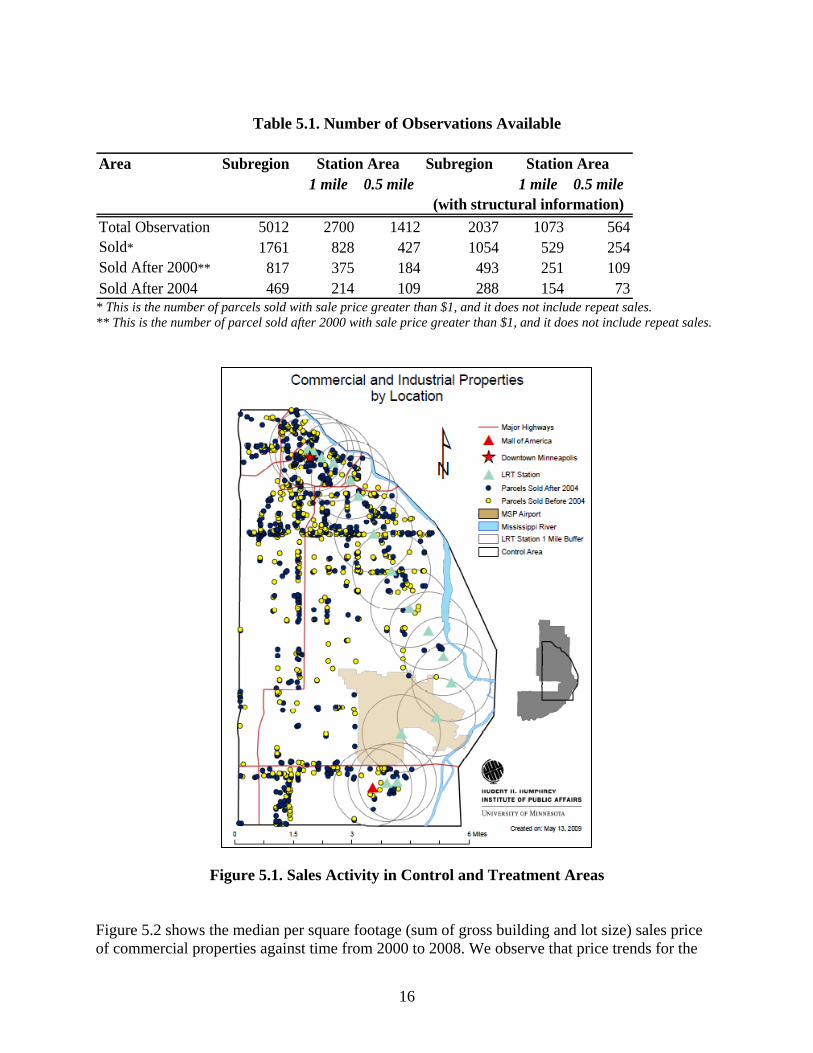
Table 5.1. Number of Observations Available
Area Subregion Subregion1 mile 0.5 mile 1 mile 0.5 mile
Total Observation 5012 2700 1412 2037 1073 564Sold* 1761 828 427 1054 529 254Sold After 2000** 817 375 184 493 251 109Sold After 2004 469 214 109 288 154 73
Station Area Station Area
(with structural information)
* This is the number of parcels sold with sale price greater than $1, and it does not include repeat sales. ** This is the number of parcel sold after 2000 with sale price greater than $1, and it does not include repeat sales.
Figure 5.1. Sales Activity in Control and Treatment Areas
Figure 5.2 shows the median per square footage (sum of gross building and lot size) sales price of commercial properties against time from 2000 to 2008. We observe that price trends for the
16
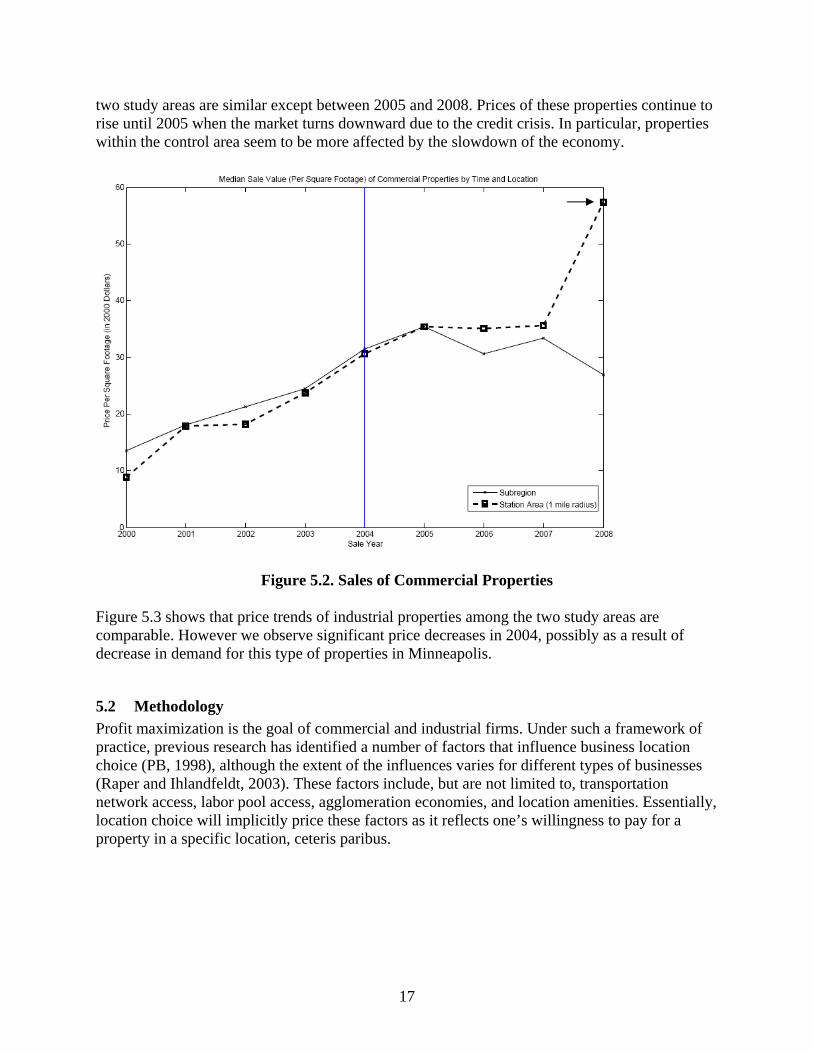
two study areas are similar except between 2005 and 2008. Prices of these properties continue torise until 2005 when the market turns downward due to the credit crisis. In particular, propertieswithin the control area seem to be more affected by the slowdown of the economy.
Figure 5.2. Sales of Commercial Properties Figure 5.3 shows that price trends of industrial properties among the two study areas are comparable. However we observe significant price decreases in 2004, possibly as a result of decrease in demand for this type of properties in Minneapolis.
5.2 Methodology Profit maximization is the goal of commercial and industrial firms. Under such a framework of practice, previous research has identified a number of factors that influence business location choice (PB, 1998), although the extent of the influences varies for different types of businesses (Raper and Ihlandfeldt, 2003). These factors include, but are not limited to, transportation network access, labor pool access, agglomeration economies, and location amenities. Essentially, location choice will implicitly price these factors as it reflects one’s willingness to pay for a property in a specific location, ceteris paribus.
17
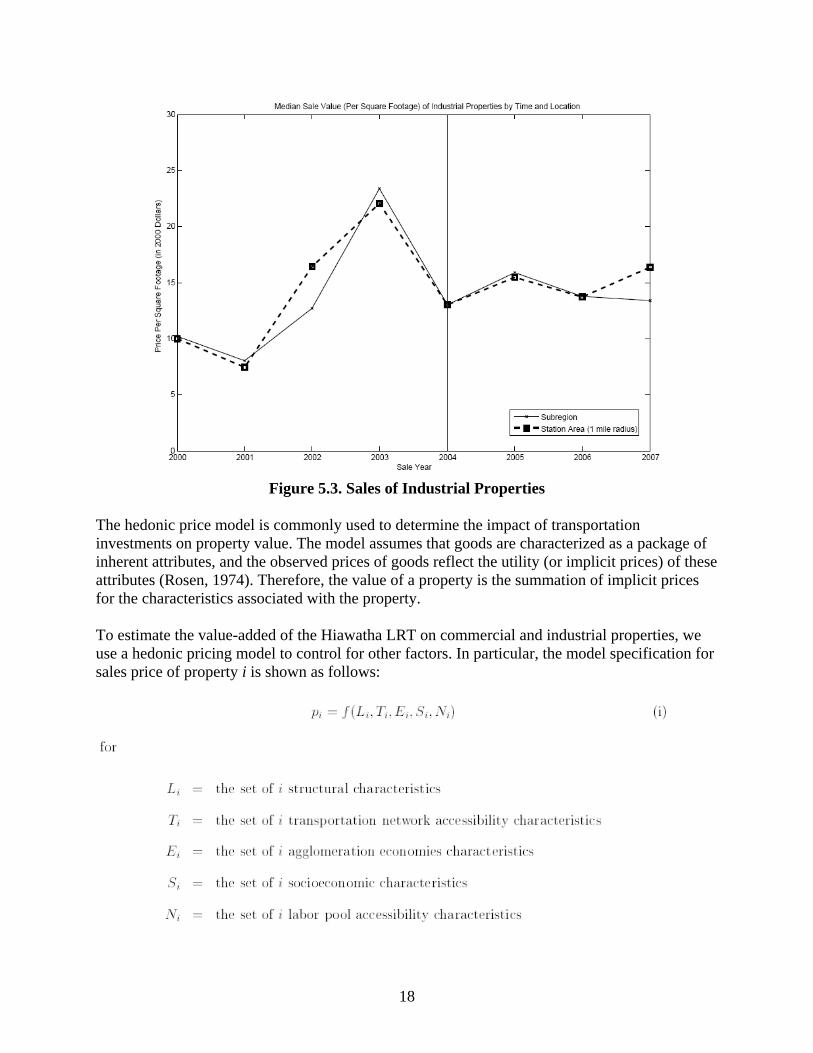
Figure 5.3. Sales of Industrial Properties
The hedonic price model is commonly used to determine the impact of transportation investments on property value. The model assumes that goods are characterized as a package of inherent attributes, and the observed prices of goods reflect the utility (or implicit prices) of these attributes (Rosen, 1974). Therefore, the value of a property is the summation of implicit prices for the characteristics associated with the property. To estimate the value-added of the Hiawatha LRT on commercial and industrial properties, we use a hedonic pricing model to control for other factors. In particular, the model specification for sales price of property i is shown as follows:
18

In this equation, the impact of Hiawatha LRT on the value of a property is captured by including the property’s distance to its nearest LRT station, as a measure for transportation network accessibility in the linear hedonic model. Given the structural and operational differences between commercial and industrial properties, we expect that the construction and opening of the LRT line to affect these two types of properties differently. Thus, we estimate the effects of the LRT on the two types of properties separately (by including a dummy variable indicating property type and its interaction with proximity to LRT stations), as well as for pre- and post-opening of the line (by using a dummy variable). In Table 5.2, we summarize our dataset used for the hedonic analysis. On average, the parcels are 83 percent commercial, with less than two stories, and were built around 1939. These properties are located around 2000 meters away from LRT stations (which are located at major traffic intersections of Hiawatha Avenue - State Highway 55) and highway on-ramps and are much closer to downtown Minneapolis than to the Mall of America. Within a one mile buffer of a typical property, there are about 41 percent of single-family homes, 25 percent of multifamily homes, 13 percent of commercial properties, and 10 percent of industrial properties. Upon examining the data and removing variables with multicollinearity problems using variance inflation factors1, we impose a linear specification of equation (i) using some variables described in Table 5.2. The parcel-specific variables include all transportation network accessibility characteristics and some of the structural characteristics: a dummy variable to separate industrial properties from commercial, a dummy variable to indicate whether a property is within one mile of downtown Minneapolis, total land area squared footage, total building area, and number of stories. The variables representing the sum of retail and office spaces, and industrial space are also parcel-specific. The variables for workforce size and residential workforce size are from 2002-2006 Census LEHD (available at block group level). In addition, we included a quadratic distance term to increase flexibility of the model. Finally, we included interaction terms of post LRT opening dummy variable with some2 of the other variables to demonstrate the impact of LRT.
1 The set of variables removed are year built, distance to downtown Minneapolis, distance to Mall of America, distance to LRT track, the interactions between commercial property and distance to LRT stations, single-family homes area, multifamily homes area, workforce income, and resident workforce income. 2 After running a model with all possible interaction terms involving post LRT dummy variable, we removed those that are not statistically significant.
19
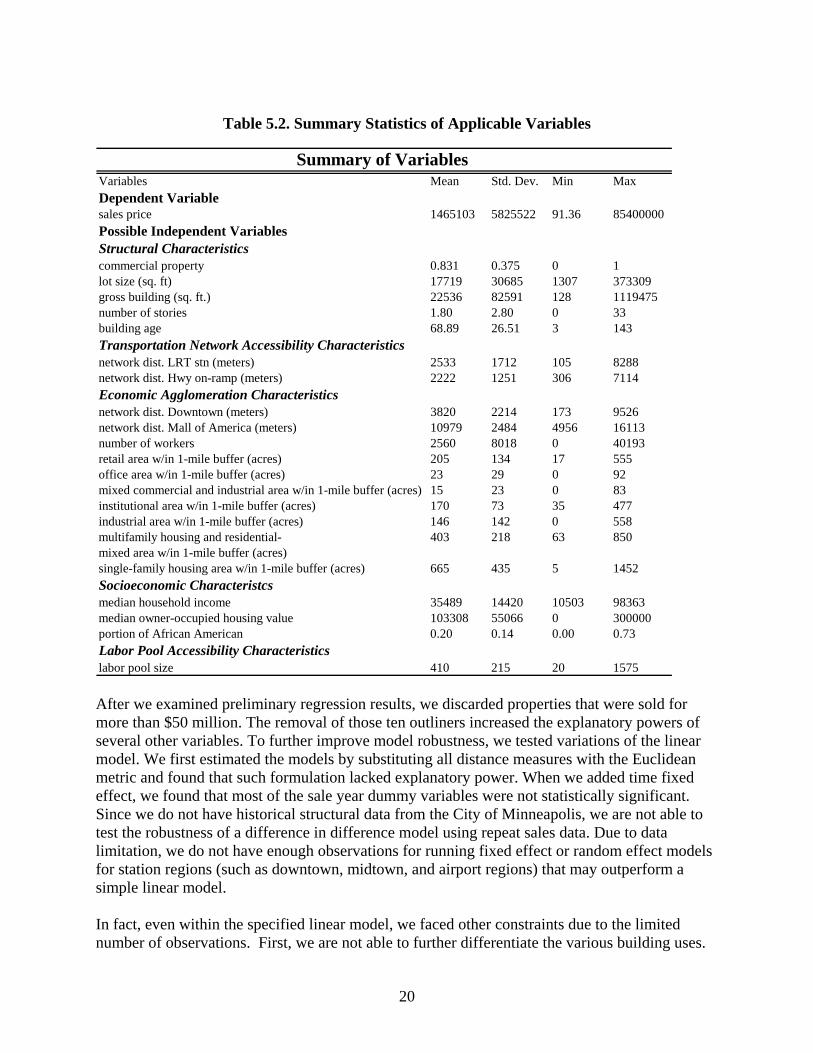
Table 5.2. Summary Statistics of Applicable Variables
Summary of Variables Variables Mean Std. Dev. Min MaxDependent Variablesales price 1465103 5825522 91.36 85400000Possible Independent VariablesStructural Characteristicscommercial property 0.831 0.375 0 1lot size (sq. ft) 17719 30685 1307 373309gross building (sq. ft.) 22536 82591 128 1119475number of stories 1.80 2.80 0 33building age 68.89 26.51 3 143Transportation Network Accessibility Characteristicsnetwork dist. LRT stn (meters) 2533 1712 105 8288network dist. Hwy on-ramp (meters) 2222 1251 306 7114Economic Agglomeration Characteristicsnetwork dist. Downtown (meters) 3820 2214 173 9526network dist. Mall of America (meters) 10979 2484 4956 16113number of workers 2560 8018 0 40193retail area w/in 1-mile buffer (acres) 205 134 17 555office area w/in 1-mile buffer (acres) 23 29 0 92mixed commercial and industrial area w/in 1-mile buffer (acres) 15 23 0 83institutional area w/in 1-mile buffer (acres) 170 73 35 477industrial area w/in 1-mile buffer (acres) 146 142 0 558multifamily housing and residential- 403 218 63 850mixed area w/in 1-mile buffer (acres)single-family housing area w/in 1-mile buffer (acres) 665 435 5 1452Socioeconomic Characteristcsmedian household income 35489 14420 10503 98363median owner-occupied housing value 103308 55066 0 300000portion of African American 0.20 0.14 0.00 0.73Labor Pool Accessibility Characteristicslabor pool size 410 215 20 1575 After we examined preliminary regression results, we discarded properties that were sold for more than $50 million. The removal of those ten outliners increased the explanatory powers of several other variables. To further improve model robustness, we tested variations of the linear model. We first estimated the models by substituting all distance measures with the Euclidean metric and found that such formulation lacked explanatory power. When we added time fixed effect, we found that most of the sale year dummy variables were not statistically significant. Since we do not have historical structural data from the City of Minneapolis, we are not able to test the robustness of a difference in difference model using repeat sales data. Due to data limitation, we do not have enough observations for running fixed effect or random effect models for station regions (such as downtown, midtown, and airport regions) that may outperform a simple linear model. In fact, even within the specified linear model, we faced other constraints due to the limited number of observations. First, we are not able to further differentiate the various building uses.
20

For example, it would be valuable to isolate detailed land use within the commercial and industrial parcels in question, such as retail versus office spaces, as well as warehouses versus utilities.
5.3 Results In this section we present the findings of our hedonic analysis. To establish a baseline reference point, we first report the results for the subregion. We then present the results for the station area, emphasizing on any accessibility effects of the LRT.
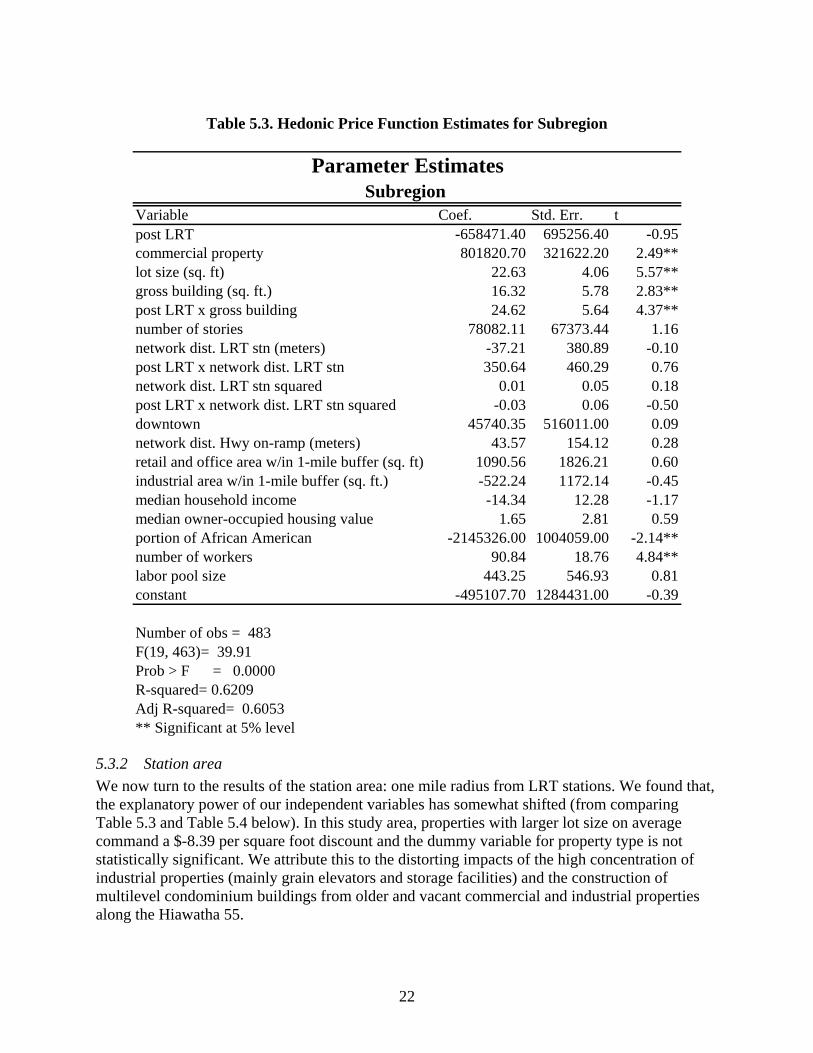
5.3.1 Subregion The regression results for the hedonic equation are reported in Table 5.3. The estimated coefficients for structural characteristics (except for number of stories) are statistically significant with plausible magnitudes and the hypothesized signs. This means that our results are consistent with firms’ preferences since these coefficients measure their marginal willingness to pay for the corresponding structural attributes. There is significant increase in the willingness to pay for gross building size after the opening of the LRT, meaning that there has been competition for space among new and existing businesses within the subregion area. As expected, commercial properties command on average $801,821 more than industrial properties. When we compared properties sold before and after 2004 within the model, we did not find any statistically significant differences. Moreover, this continues to be true for coefficients of distance to LRT stations for either period (see distance to LRT stations and its interaction with post LRT coefficients). These results suggest that the influence of the proximity to LRT stations, if any, seems to be localized because we did not find the impacts of the LRT line on commercial and industrial property values in the subregion area. Overall (regardless of pre or post LRT), none of other explanatory variables in the model are significant except for the proportion of African American and the number of private jobs available. When developing models, we also included the proportion of Asian American and the proportion of other races (such as Hispanic and American Indian) in the original model specification. However, they were removed from the final model because they were insignificant. The negative coefficient for the proportion of African American suggests that a higher share of African American in an area may discourage business owners from operating in the area. On the other hand, we found that property values tend to increase as the number of workers increases, which substantiates the influence of economic agglomeration effect.
21
22
Table 5.3. Hedonic Price Function Estimates for Subregion
Parameter EstimatesSubregion
Variable Coef. Std. Err. tpost LRTcommercial propertylot size (sq. ft)gross building (sq. ft.)post LRT x gross buildingnumber of storiesnetwork dist. LRT stn (meters)post LRT x network dist. LRT stnnetwork dist. LRT stn squaredpost LRT x network dist. LRT stn squareddowntownnetwork dist. Hwy on-ramp (meters)retail and office area w/in 1-mile buffer (sq. industrial area w/in 1-mile buffer (sq. ft.)median household incomemedian owner-occupied housing valueportion of African American number of workers labor pool sizeconstant
ft)
-658471.40 695256.40801820.70 321622.20
22.63 4.0616.32 5.7824.62 5.64
78082.11 67373.44-37.21 380.89350.64 460.29
0.01 0.05-0.03 0.06
45740.35 516011.0043.57 154.12
1090.56 1826.21-522.24 1172.14-14.34 12.28
1.65 2.81-2145326.00 1004059.00
90.84 18.76443.25 546.93
-495107.70 1284431.00
-0.952.49**5.57**2.83**4.37**
1.16-0.100.760.18
-0.500.090.280.60
-0.45-1.170.59
-2.14**4.84**
0.81-0.39
Number of obs = 483F(19, 463)= 39.91Prob > F = 0.0000R-squared= 0.6209Adj R-squared= 0.6053** Significant at 5% level
5.3.2 Station area We now turn to the results of the station area: one mile radius from LRT stations. We found that, the explanatory power of our independent variables has somewhat shifted (from comparing Table 5.3 and Table 5.4 below). In this study area, properties with larger lot size on average command a $-8.39 per square foot discount and the dummy variable for property type is not statistically significant. We attribute this to the distorting impacts of the high concentration of industrial properties (mainly grain elevators and storage facilities) and the construction of multilevel condominium buildings from older and vacant commercial and industrial properties along the Hiawatha 55.
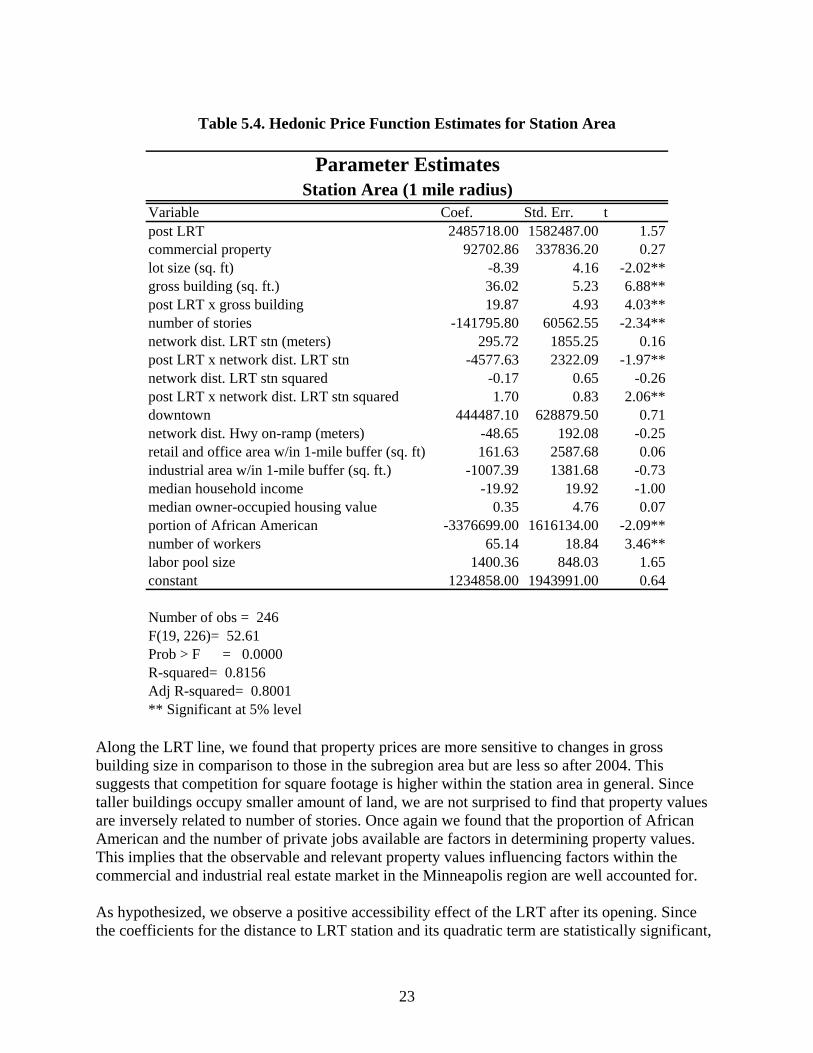
23
Table 5.4. Hedonic Price Function Estimates for Station Area
Parameter EstimatesStation Area (1 mile radius)
Variable Coef. Std. Err. tpost LRTcommercial propertylot size (sq. ft)gross building (sq. ft.)post LRT x gross buildingnumber of storiesnetwork dist. LRT stn (meters)post LRT x network dist. LRT stnnetwork dist. LRT stn squaredpost LRT x network dist. LRT stn squareddowntownnetwork dist. Hwy on-ramp (meters)retail and office area w/in 1-mile buffer (sq. ft)industrial area w/in 1-mile buffer (sq. ft.)median household incomemedian owner-occupied housing valueportion of African American number of workers labor pool sizeconstant
2485718.00 1582487.0092702.86 337836.20
-8.39 4.1636.02 5.2319.87 4.93
-141795.80 60562.55295.72 1855.25
-4577.63 2322.09-0.17 0.651.70 0.83
444487.10 628879.50-48.65 192.08161.63 2587.68
-1007.39 1381.68-19.92 19.92
0.35 4.76-3376699.00 1616134.00
65.14 18.841400.36 848.03
1234858.00 1943991.00
1.570.27
-2.02**6.88**4.03**
-2.34**0.16
-1.97**-0.26
2.06**0.71
-0.250.06
-0.73-1.000.07
-2.09**3.46**
1.650.64
Number of obs = 246F(19, 226)= 52.61Prob > F = 0.0000R-squared= 0.8156Adj R-squared= 0.8001** Significant at 5% level
Along the LRT line, we found that property prices are more sensitive to changes in gross building size in comparison to those in the subregion area but are less so after 2004. This suggests that competition for square footage is higher within the station area in general. Since taller buildings occupy smaller amount of land, we are not surprised to find that property values are inversely related to number of stories. Once again we found that the proportion of African American and the number of private jobs available are factors in determining property values. This implies that the observable and relevant property values influencing factors within the commercial and industrial real estate market in the Minneapolis region are well accounted for. As hypothesized, we observe a positive accessibility effect of the LRT after its opening. Since the coefficients for the distance to LRT station and its quadratic term are statistically significant,
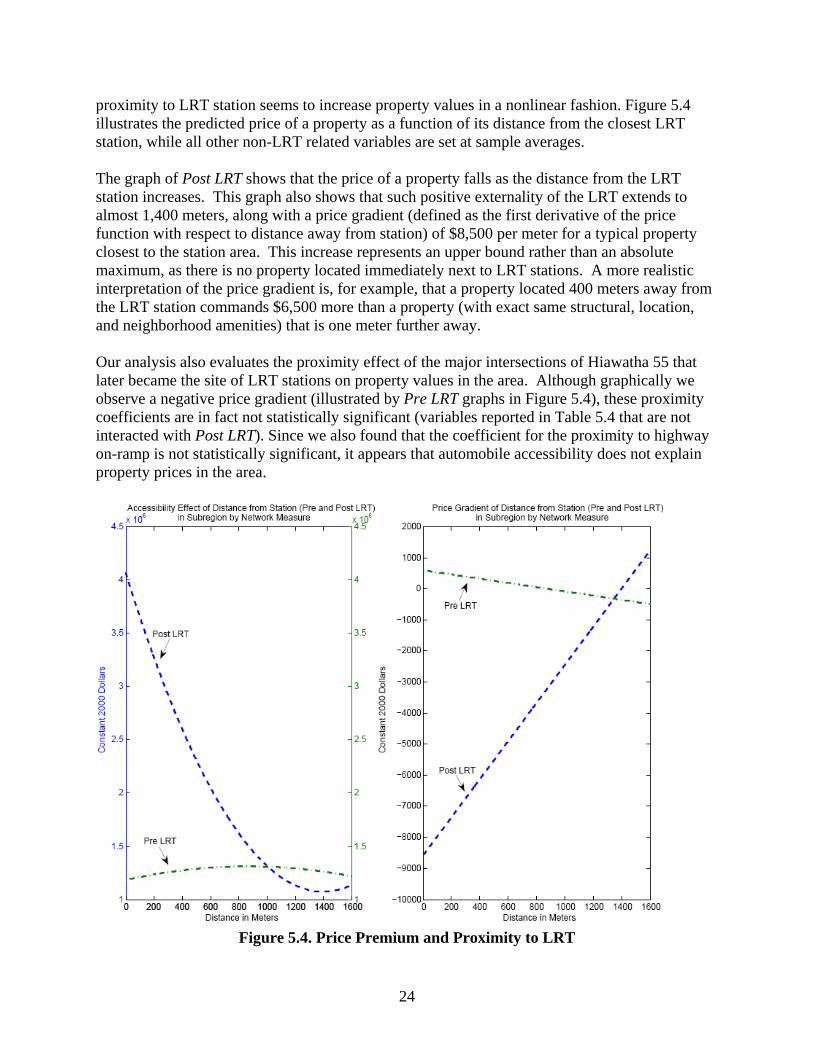
proximity to LRT station seems to increase property values in a nonlinear fashion. Figure 5.4 illustrates the predicted price of a property as a function of its distance from the closest LRT station, while all other non-LRT related variables are set at sample averages. The graph of Post LRT shows that the price of a property falls as the distance from the LRT station increases. This graph also shows that such positive externality of the LRT extends to almost 1,400 meters, along with a price gradient (defined as the first derivative of the price function with respect to distance away from station) of $8,500 per meter for a typical property closest to the station area. This increase represents an upper bound rather than an absolute maximum, as there is no property located immediately next to LRT stations. A more realistic interpretation of the price gradient is, for example, that a property located 400 meters away from the LRT station commands $6,500 more than a property (with exact same structural, location, and neighborhood amenities) that is one meter further away. Our analysis also evaluates the proximity effect of the major intersections of Hiawatha 55 that later became the site of LRT stations on property values in the area. Although graphically we observe a negative price gradient (illustrated by Pre LRT graphs in Figure 5.4), these proximity coefficients are in fact not statistically significant (variables reported in Table 5.4 that are not interacted with Post LRT). Since we also found that the coefficient for the proximity to highway on-ramp is not statistically significant, it appears that automobile accessibility does not explain property prices in the area.
Figure 5.4. Price Premium and Proximity to LRT
24
6 CONCLUSIONS In this study we found evidence that the Hiawatha LRT line has generated positive price premium on commercial and industrial properties in station areas. Through a hedonic pricing function, we recover the implicit prices for proximity to LRT stations for properties within one mile of the LRT stations. Furthermore, we accounted for the observable and relevant factors in driving commercial and industrial property prices within the Minneapolis region. Since we did not find that proximity to highway on-ramps and major traffic intersections of the Hiawatha 55 have provided any impact for nearby properties, the Hiawatha LRT line plays a key role in driving property premium. In particular, the curvature of our pricing function demonstrate that the positive price gradient extends to almost 1,400 meters away from the LRT stations, far beyond the positive impact of the other LRT systems that previous studies found. The results in this study should be interpreted with cautions. This study recovered the hedonic values of the proximity to LRT stations for properties in the local communities along a particular LRT line at a particular time. For the entire Minneapolis and St. Paul region as a whole, this study is unable to predict whether the Hiawatha Line (and future extension) generates net price premium. Transportation investment may shift business activities from one area to the other within a region, especially in economically stagnant and declining areas (Giuliano 2004; Adams and van Drasek 2007). When predicting/evaluating the impacts of transportation investment on economic development, the following factors should be considered (Giuliano 2004). First, if the investment occurs in a fast growing area, it tends to have a substantial impact on economic development. Second, if the land is available for development, the investment tends to generate significant impacts. However, the impacts tend to be limited in well-established area where land is scarce. Third, residents’ responses and land use policies play an important role in determining the degree of the impacts. If residents oppose new development (“Not In My Back Yard”- NIMBYism) and governments lack strong leadership, the impacts of transportation investment tend to be limited. Further, the relative changes in accessibility resulting from the investment influence economic development: the first 10 miles of a transportation network tend to generate larger impacts than the last 10 miles of the network (Giuliano 2004). This study has several limitations. The Hiawatha Line serves three distinct areas: Downtown Region, Midtown Region, and Airport/Mall Region. The impacts of LRT proximity on property values may differ in these areas. As discussed earlier in the report, it is desirable to develop separated models for the areas and compare the results with the pooled model. However, the limited number of observations precludes us from developing robust models. Instead, we included variables associated with agglomeration economy in the model to capture such effects. Furthermore, it is also desirable to include time dummies such as transaction year in the model to capture variation of real estate market over time. However, such variables do not carry enough explanatory power in the analysis due to limited observations and we chose only a dummy variable to indicate whether a property was sold before or after the completion of the LRT. As the Hiawatha Line completed just a few years ago, it is highly recommended to revisit the
25
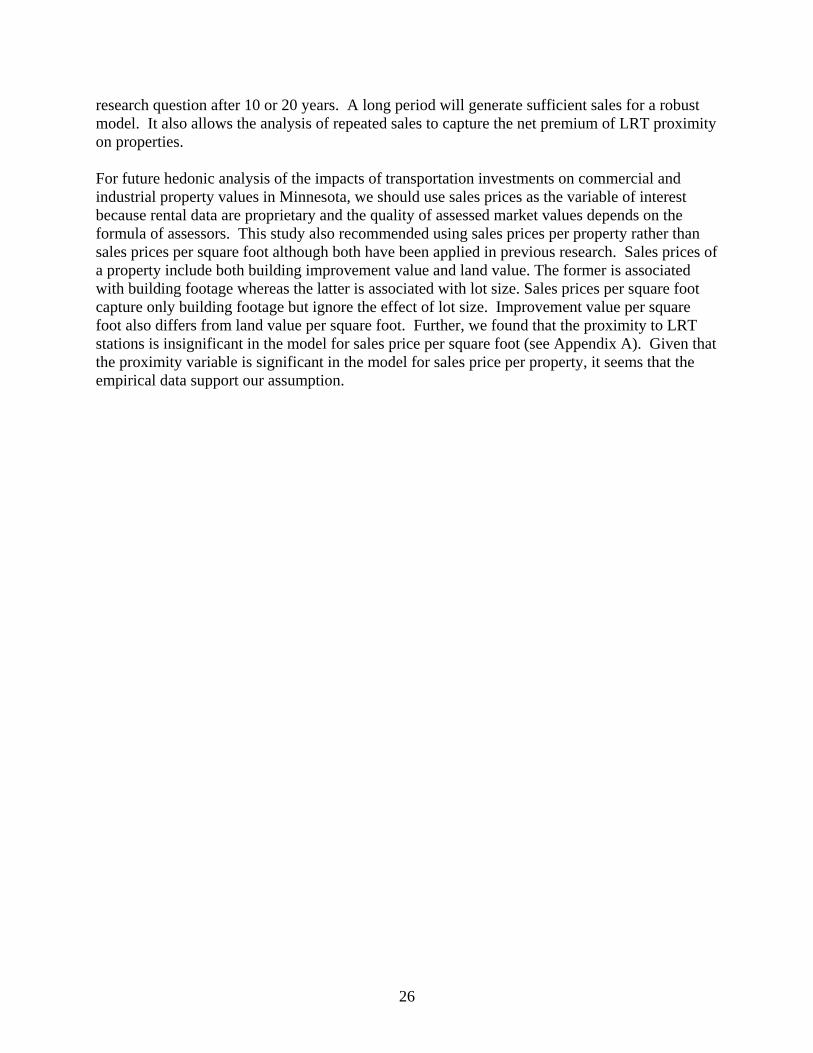
research question after 10 or 20 years. A long period will generate sufficient sales for a robust model. It also allows the analysis of repeated sales to capture the net premium of LRT proximity on properties. For future hedonic analysis of the impacts of transportation investments on commercial and industrial property values in Minnesota, we should use sales prices as the variable of interest because rental data are proprietary and the quality of assessed market values depends on the formula of assessors. This study also recommended using sales prices per property rather than sales prices per square foot although both have been applied in previous research. Sales prices of a property include both building improvement value and land value. The former is associated with building footage whereas the latter is associated with lot size. Sales prices per square foot capture only building footage but ignore the effect of lot size. Improvement value per square foot also differs from land value per square foot. Further, we found that the proximity to LRT stations is insignificant in the model for sales price per square foot (see Appendix A). Given that the proximity variable is significant in the model for sales price per property, it seems that the empirical data support our assumption.
26
REFERENCES
Adams, J., and B.J. van Drasek. Transportation as Catalyst for Community Economic Development. Research Report No. CTS 07-07. Center for Transportation Studies, (2007), University of Minnesota, Minneapolis, MN.
Bollinger, C.R., K.R. Ihlanfeldt, and D.R. Bowes. "Spatial Variation in Office Rents Within the Atlanta Region." Urban Studies, 35, 7, (1998): 1097–1117.
Cervero, R., and M. Duncan. "Transit's Value-Added: Effects of Light and Commuter Rail Services on Commercial Land Values." Transportation Research Record, 1805, (2002a): 1-18.
Cervero, R., and M. Duncan. "Land Value Impacts of Rail Transit Services in Los Angeles County." National Association of Realtors and Urban Land Institute, (2002b): 1-36.
Cervero, R., and M. Duncan. "Land Value Impacts of Rail Transit Services in San Diego County." National Association of Realtors and Urban Land Institute, (2002c): 1-29.
Debrezion, G., E. Pels, and P. Rietveld. "The Impact of Railway Stations on Residential and Commercial Property Value: A Meta-analysis." Journal of Real Estate and Financial Economics, 35, (2007): 161–180
Fuerst, F. "Office Rent Determinants: A Hedonic Panel Analysis." Working Paper. University of Reading, Henley Business School, (2007), Reading, UK.
Giuliano, G. “Land use impacts of transportation investments: highway and transit.” The Geography of Urban Transportation, eds. Hanson, S., and G. Giuliano, New York: The Guilford Press, (2004): 237-273.
Ko, K., E. Goetz, and H. Hagar. "Differential Impact of the Hiawatha Light Rail Line on Property Values in Minneapolis." Under review by Environment and Planning: B, (2009).
Landis, J., R. Cervero, S. Guhathukurta, D. Loutzenheiser, and M. Zhang. "Rail Transit Investments, Real Estate Values, and Land Use Change: A Comparative Analysis of Five California Rail Transit Systems." Monograph 48, Institute of Urban and Regional Studies, University of California, Berkeley, (1995), Berkeley, CA.
27
28
r06.09.
Landis, J., and D. Loutzenheiser. "BART at 20: BART Access and Office Building Performance." Working Paper. Institute of Urban and Regional Development, University of California, Berkeley, (1995), Berkeley, CA.
Metropolitan Council. 2030 Transportation Policy Plan. (2010). Available http://www.metrocouncil.org/planning/transportation/TPP/2008/index.htm. Accessed on May 27, 2010.
Metropolitan Council. Hiawatha Light Rail Transit Development. (2006). Available http://www.metrocouncil.org/directions/transit/transit2006/hiawatha_TODMahtm. Accessed on May 13, 20
Nelson, A.C. "Transit Stations and Commercial Property Values: Case Study with Policy and Land Use Implications." Journal of Public Transportation, 2, 3, (1999): 77-93.
Parsons, Brinckerhoff, Quade & Douglas, Inc. "Land Use Impacts of Transportation: A Guidebook.” Prepared for National Cooperative Highway Research Program, Transportation Research Board, (1998).
Raper, M., and K.R. Ihlandfeldt. "Towards Understanding How Office-Location Decisions Differ." Dynamics of Office Markets: Empirical Findings and Research Issues, ed. J.M. Clapp, Washington, D.C.: The Urban Institute Press, (1993): 149-160.
Rosen, S. "Hedonic Prices and Implicit Markets: Product Differentiation in Pure Competition." Journal of Political Economy, 82, (1974): 34-55.
Ryan, S. “The Value of Access to Highways and Light Rail Transit: Evidence for Industrial and Office Firms.” Urban Studies, 42, 4, (2005): 751-764.
Weinberger, R. "Light Rail Proximity: Benefit or Detriment in the Case of Santa Clara County, California?" Transportation Research Record, 1747, (2001): 104-113.

APPENDIX A: ALTERNATIVE HEDONIC MODELS FOR SALES PRICE

Different from Table 5.3 and Table 5.4, the dependent variable for models presented in Table A.1 and Table A.2 is sales price per building footage.
Table A.1. Hedonic Price Function Estimates for Subregion
Variable Coef. Std. Err. tpost LRT 94.03 56.84 1.65*commercial property 71.33 28.08 2.54**lot size (sq. ft) 0.00 0.00 3.54**number of stories -9.75 3.94 -2.47**network dist. LRT stn (meters) 0.03 0.03 0.94post LRT x network dist. LRT stn 94.03 56.84 1.65*network dist. LRT stn squared 0.00 0.00 -0.29post LRT x network dist. LRT stn squared 0.00 0.00 0.85downtown 54.47 45.00 1.21network dist. Hwy on-ramp (meters) 0.03 0.01 2.4**retail and office area w/in 1-mile buffer (sq. ft) 0.21 0.16 1.29industrial area w/in 1-mile buffer (sq. ft.) -0.02 0.10 -0.22median household income 0.00 0.00 -1.93*median owner-occupied housing value 0.00 0.00 -0.5portion of African American -207.86 87.58 -2.37**number of workers 0.00 0.00 0.49labor pool size 0.05 0.05 0.95constant -71.66 110.62 -0.65
Parameter EstimatesSubregion
Number of obs = 483F(17, 465)= 3.61Prob > F = 0.0000R-squared= 0.1166Adj R-squared= 0.0843** Significant at 5% level* Significant at 10% level
A-1
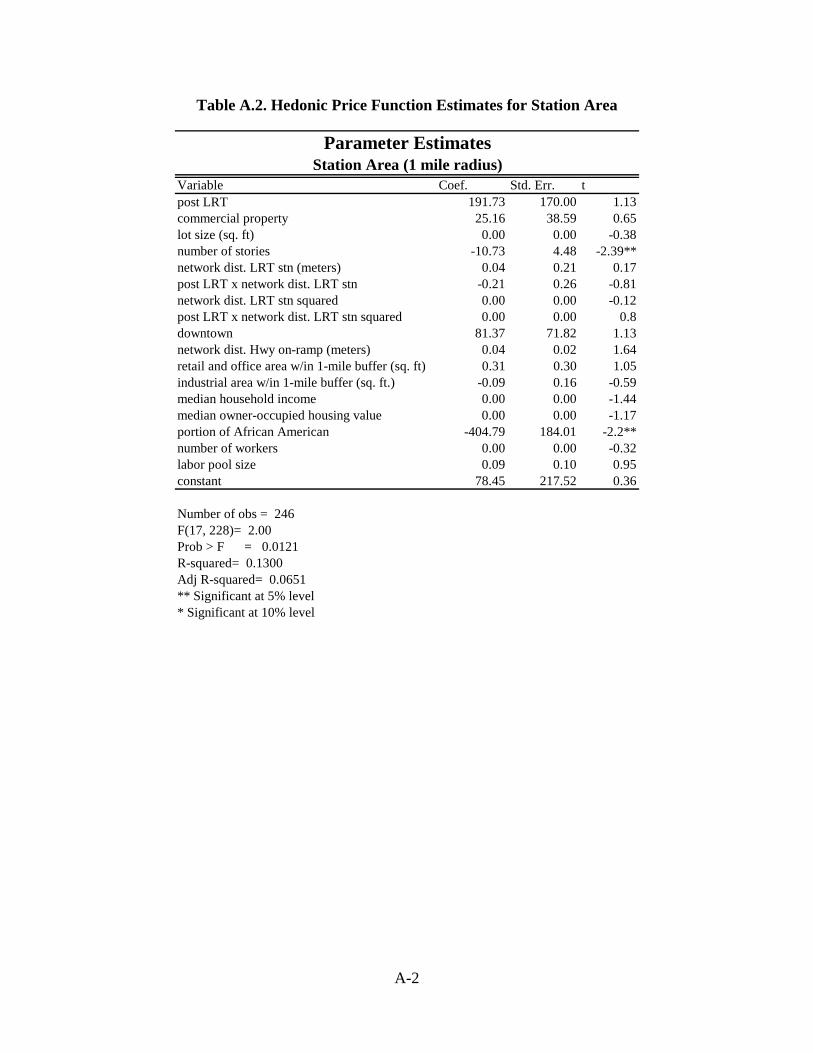
Table A.2. Hedonic Price Function Estimates for Station Area
Parameter EstimatesStation Area (1 mile radius)
Variable Coef. Std. Err. tpost LRTcommercial propertylot size (sq. ft)number of storiesnetwork dist. LRT stn (meters)post LRT x network dist. LRT stnnetwork dist. LRT stn squaredpost LRT x network dist. LRT stn squareddowntownnetwork dist. Hwy on-ramp (meters)retail and office area w/in 1-mile buffer (sq. ft)industrial area w/in 1-mile buffer (sq. ft.)median household incomemedian owner-occupied housing valueportion of African American number of workers labor pool sizeconstant
191.7325.160.00
-10.730.04
-0.210.000.00
81.370.040.31
-0.090.000.00
-404.790.000.09
78.45
170.0038.590.004.480.210.260.000.00
71.820.020.300.160.000.00
184.010.000.10
217.52
1.130.65
-0.38-2.39**
0.17-0.81-0.12
0.81.131.641.05
-0.59-1.44-1.17
-2.2**-0.320.950.36
Number of obs = 246F(17, 228)= 2.00Prob > F = 0.0121R-squared= 0.1300Adj R-squared= 0.0651** Significant at 5% level* Significant at 10% level
A-2