Embed Size (px)
Citation preview

Mid-Markets,Major Pizzaz: Venues Getting it RightAugust 16, 2021

2
Table of Contents
Introduction
Savannah, Georgia
Rapid City, South Dakota
Augusta, Georgia
Henderson, Nevada
01
02
03
04

Introduction1

hundenpartners.com | © 2021 HSP 4
Design and Development Speakers
Rob Hunden Don Dethlefs HB Brantley Troy Westover
CEO, Hunden Strategic Partners, Inc.
Sports, Recreation, and Entertainment Practice Leader, Perkins & Will
HB Brantley, Project Executive Consultant
Facilities Manager, City of Henderson

Savannah & Rapid City2

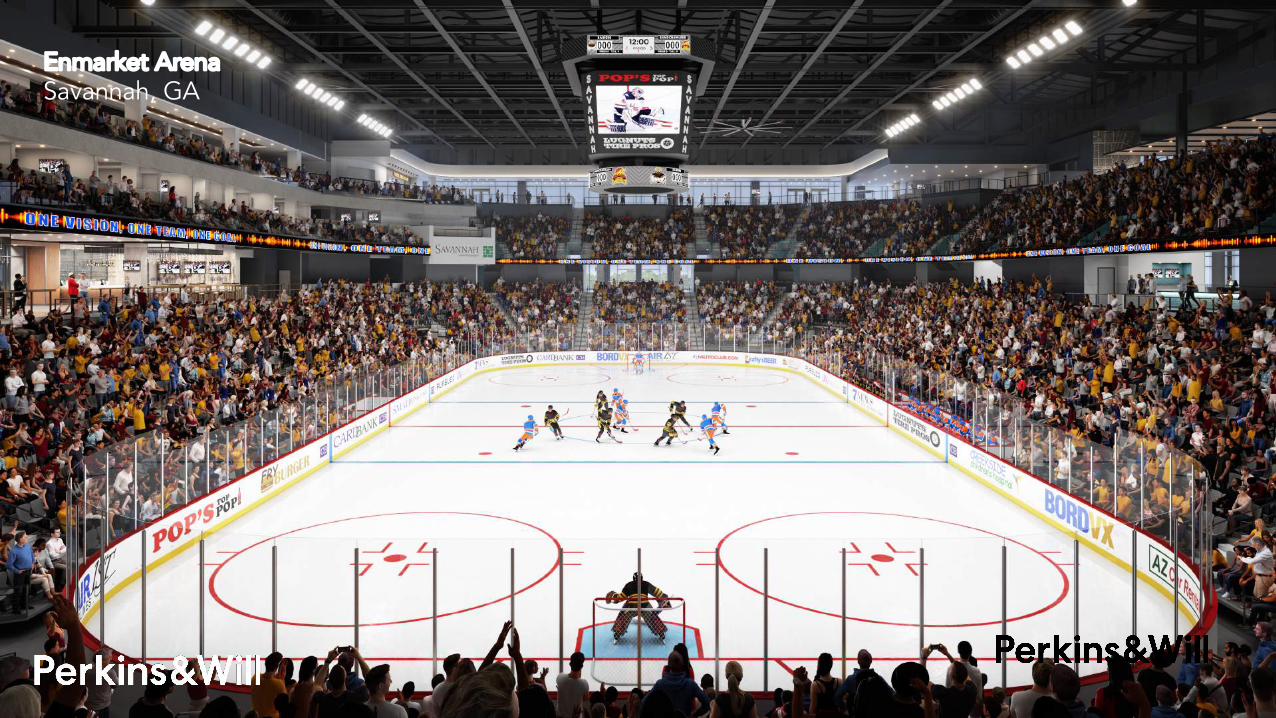
Enmarket ArenaSavannah, Georgia
Size 216,000
Hockey Capacity 7,200
Construction Cost $130 million
Cost per Seat $18,000
Cost per square ft. $600

Savannah ArenaEnmarket ArenaSavannah, GA

Savannah ArenaEnmarket ArenaSavannah, GA
Enmarket ArenaSavannah, GA

Enmarket ArenaSavannah, GA

Enmarket ArenaSavannah, GA

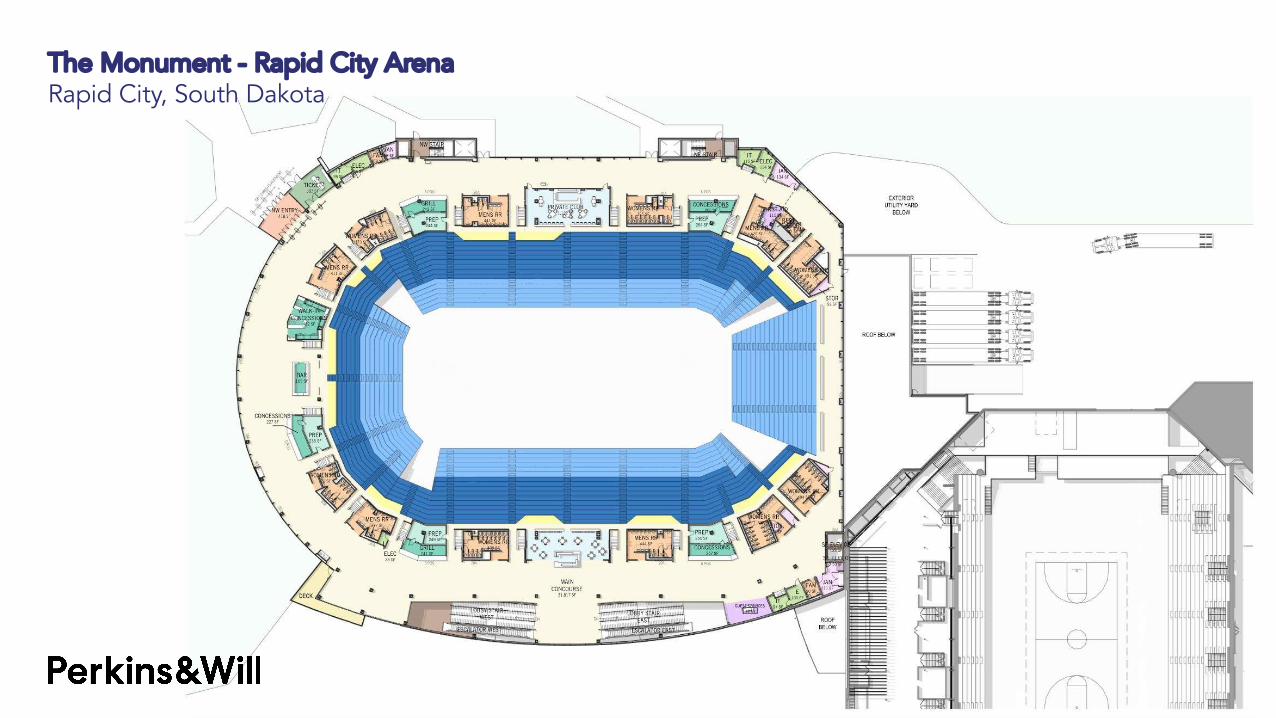
The Monument ArenaRapid City, South Dakota
Size 226,000
Hockey Capacity 9,662
Construction Cost $112 million
Cost per Seat $11,591
Cost per square ft. $476

Rapid City ArenaThe Monument - Rapid City ArenaRapid City, South Dakota

Rapid City ArenaThe Monument - Rapid City ArenaRapid City, South Dakota

Rapid City ArenaThe Monument - Rapid City ArenaRapid City, South Dakota

Rapid City ArenaThe Monument - Rapid City ArenaRapid City, South Dakota

The Monument - Rapid City ArenaRapid City, South Dakota
The Monument - Rapid City ArenaRapid City, South Dakota

James Brown Arena, Augusta, GA3

20ARENA DEVELOPMENT SWOT ANALYSIS
INTERNAL FACTORS EXTERNAL FACTORSPO
SITI
VENE
GATI
VE
§ Existing book of Arena Business
§ Georgia Cyber Center§ Healthcare§ Augusta National Golf Club
STRENGTHS
§ Lack of Attractions§ Corporate Presence§ Access§ Existing JBA Size, Quality
WEAKNESSES
§ James Brown Legacy§ Larger events§ Connection to improving downtown§ Religious market
OPPORTUNITIES
§ Competition from Larger and NewerFacilities
§ Renovated Competitors
THREATS
How External and Internal Factors Affect Project Viability

Regional Drive-Times
21
The city is the economic and culturalcenter of an area an hour in almost anydirection comprising 862,500 people,averaging $52,250 per householdannually. Residing within a two-hourdrive are 3,189,000, and a three-hourdrive captures Atlanta, Charlotte,Greenville, Charleston and Savannah,totaling over 15,000,000.
Augusta is the largest urban complexwithin a one-hour drive-time ofdowntown. Four-lane highways bringlong-distance travelers from Atlanta,Columbia, Macon, Savannah by way ofStatesboro. Direct high-speed accessfrom the Greenville and Uplands regionand Charleston area is hampered by anoutdated two-lane road network, andthus, Interstate 20 is the only true long-distance highway through Augusta.

Population Distribution
22
The Southeastern U.S. is not known forlarge cosmopolitan centers outside ofAtlanta and Charlotte, however, as thisnighttime light-sensitivity mapillustrates, cities and towns cover thelandscape, and the combined rural andmid-sized urban populations are farmore substantial than it generally getscredited by outsiders.
Many of the cities on this map areexperiencing rapid growth, especiallythe larger urban areas, yet their growthis “flying under the radar" of nationalawareness. The television markets ofGeorgia and the Carolinas are show,with Augusta’s market outlined in red.The urban area’s sprawl is evident andappears to be similar in size toSavannah, Macon, and other cities, withroom to grow.

Regional Competitive Arena Map
HSP identified the regional competitivearenas within a 3-hour drive from thenew James Brown Arena. Colonial LifeArena, located roughly 76 miles fromthe new JBA, is the closest competitivearena. The supply of competitive arenasbecomes abundant outside of a 2-hourdrive time from the new James BrownArena. The competitive set consists ofan array of arena types such as majorcity arenas, university arenas and coastalarenas.
23

Regional Competitors by Relevance and
Capacity
HSP evaluated the regional arena competitive set and narrowed it down tothese five regional competitors. HSP believes that these five competitors arethe most relevant to the new James Brown Arena due to the type of showsthey host, capacity, and markets that they are involved in. The averagecapacity for this competitive set is roughly 13,000.
24
Augusta Regional Arena Competitors by Relevance and Capacity
Venue LocationTV Market
PopulationTV
Households
# of Large Employers in
TV Market (over 100)
Miles from Augusta Capacity
End-Stage
Capacity
Capacity per 1,000 People Suites
Premium Seats
Premium Seats per
Large Employer
Colonial Life Arena Columbia, SC 1,120,656 365,850 1,934 76 18,000 13,000 16.1 45 872 0.45Bon Secours Wellness Arena Greenville, SC 2,359,791 787,930 5,006 115 15,000 10,200 6.4 30 1,400 0.28North Charleston Coliseum North Charleston, SC 933,068 309,250 2,048 143 13,000 8,200 13.9 -- -- --Savannah Arena* Savannah, GA 967,051 315,400 2,544 121 9,437 8,300 9.8 13 617 0.24Macon Coliseum Macon, GA 650,576 211,110 1,792 121 9,000 6,800 13.8 -- -- --Average 1,206,228 397,908 2,665 115 12,887 9,300 12.0 29 963 0.32
Implied Augusta Arena Augusta, GA 748,759 241,000 1,934 -- 8,977 -- 12.0 17 627 0.32
*Under ConstructionSource: Pollstar, Various Venues
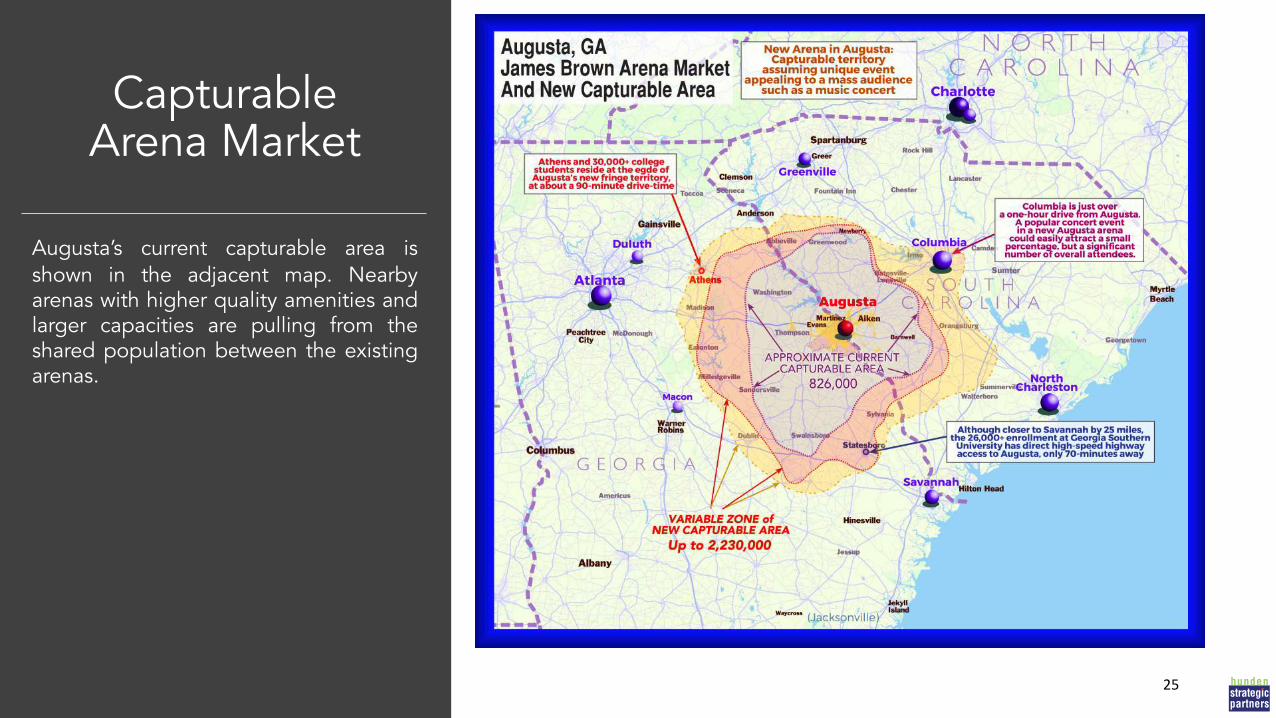
Capturable Arena Market
Augusta’s current capturable area isshown in the adjacent map. Nearbyarenas with higher quality amenities andlarger capacities are pulling from theshared population between the existingarenas.
25

Current Arena Market
The map to the right shows thecapturable area of 75% of the attendeesto the JBA. Most visitors are heavilyclustered within the Augusta area, but asmall portion will drive from thesouthwest where highways are readilyaccessible.
26

Current Arena Market
The adjacent map indicates the origin ofclusters of the top 75 percent ofattendees at James Brown arena (showon the previous slide).
27

Capturable Arena Market
Augusta’s new capturable marketrelative to nearby arenas is shown in theadjacent map. This new capturable areafactors in a new arena development.
28

29Recommendation Scenarios
29
The primary recommendation for thedevelopment of the new James BrownArena includes the development ofrentable meeting space. This meetingspace will provide a connection from theJames Brown Arena to the BellAuditorium.
The secondary recommendation mimicsthe preferred recommendation, withoutmeeting space.
Each recommendation includes aconnection of the JBA to the Bell and anoutdoor entertainment/festival areabetween the JBA and the Bell.
Recommendations
Components Primary SecondaryArena
End-Stage Capacity 10,000+ 10,000+Lower Bowl Capacity 6,500 6,500Premium Seats 1,050 1,050Suites 12 12
Meeting Space (Bell Auditorium Connection)Ballroom (sf) 20,000 --Meeting Rooms 12 --Meeting Rooms (sf) 1,200 --Boardroom (sf) 500 --
OtherConnection to Bell Auditorium Yes YesOutdoor Event Plaza Yes Yes
Source: Hunden Strategic Partners, S.P.A.C.E, Perkins & Will

ArenaEvents & Event Days The arena and meeting space complex is expected to host more than 300 events
per year during stabilization and more than 400 event days per year.

Arena Attendance HSP projects that the arena and meeting space complex will attractapproximately 254,000 attendees in the stabilized year. Most attendees areexpected to come from concerts, family shows and graduations.

ArenaPro Forma
HSP projects that the arena and meeting space complex will generate annualoperating revenue of $3.1 million in Year 1 and increase revenues to more than$4.3 million by Year 10. Certain key revenue items are shown as ‘net’, includingconcessions & catering, parking and advertising & sponsorship.
Operating expenses are projected to total more than $3 million in Year 1 andincrease to more than $3.6 million by the end of the period, resulting in positivenet operating income prior to setting aside capital reserves.
Arena Projection & ProformaYr 1 Yr 2 Yr 3 Yr 4 Yr 5 Yr 6 Yr 7 Yr 8 Yr 9 Yr 10
Arena-Only Proforma (does not include Bell Auditorium)
Revenue (000s) - Arena OnlyRent/Net Ticket Rev 691$ 804$ 894$ 994$ 1,023$ 1,041$ 1,059$ 1,078$ 1,096$ 1,115$ Premium Seating 531$ 536$ 540$ 544$ 555$ 537$ 547$ 558$ 569$ 581$ Net Concessions/Catering 791$ 923$ 1,029$ 1,158$ 1,193$ 1,217$ 1,241$ 1,266$ 1,291$ 1,317$ Net Parking 151$ 154$ 150$ 153$ 156$ 159$ 162$ 165$ 168$ 172$ Naming Rights 275$ 281$ 286$ 292$ 298$ 304$ 310$ 316$ 322$ 329$ Advertising & Sponsorship (net) 260$ 265$ 271$ 276$ 281$ 287$ 293$ 299$ 305$ 311$ Facility Service Fee 386$ 403$ 403$ 414$ 422$ 431$ 439$ 448$ 457$ 466$ Other 54$ 59$ 63$ 68$ 70$ 71$ 72$ 74$ 75$ 76$ Total 3,138$ 3,424$ 3,635$ 3,899$ 3,998$ 4,045$ 4,123$ 4,203$ 4,284$ 4,367$
Expenses (000s) - Arena OnlySalaries, Wages & Benefits 1,615$ 1,647$ 1,680$ 1,714$ 1,748$ 1,783$ 1,819$ 1,855$ 1,892$ 1,930$ General & Admin 255$ 260$ 265$ 270$ 275$ 281$ 287$ 292$ 298$ 304$ Utllities 466$ 475$ 485$ 494$ 504$ 514$ 525$ 535$ 546$ 557$ Repairs & Maintenance 257$ 262$ 268$ 273$ 278$ 284$ 290$ 296$ 301$ 307$ Insurance 180$ 184$ 188$ 191$ 195$ 199$ 203$ 207$ 211$ 216$ Advertising & Other 91$ 93$ 95$ 97$ 99$ 101$ 103$ 105$ 107$ 109$ Management Fee 212$ 216$ 221$ 225$ 229$ 234$ 239$ 244$ 248$ 253$ Total 3,077$ 3,138$ 3,201$ 3,265$ 3,330$ 3,397$ 3,465$ 3,534$ 3,605$ 3,677$
Net Operating Income 62$ 286$ 434$ 634$ 668$ 648$ 659$ 669$ 679$ 690$
Reserves (Authority Funded) 126$ 137$ 145$ 156$ 160$ 162$ 165$ 168$ 171$ 175$
Source: Hunden Strategic Partners

Summary of30-Year Impacts
The Project is expected to generate roughly$1.5 billion in net new spending, $656 millionin net new earnings and 621 new full-timeequivalent jobs at stabilization.
Capturable fiscal impact is expected to totalapproximately $36 million from sales, hoteland beverage taxes.
Construction impacts from the $248 millionproject will be significant, including $150million in local labor spending supporting2,100+ jobs.
In addition, local taxes from construction-related spending are estimated at more than$5 million.
33
30-Yr. Summary of Impacts
Net New Spending (millions)Direct $951Indirect $369Induced $206Total $1,526
Net New Earnings (millions)From Direct $446From Indirect $126From Induced $84Total $656
Net New FTE Jobs ActualFrom Direct 380From Indirect 154From Induced 86Total 621
Capturable Taxes (millions)Sales Tax (4.0%) $22.1SPLOST (1.0%) $5.5Hotel Tax (6.0%) $5.1Beverage Tax (3.0%) $3.3Total $36.0
Source: Hunden Strategic Partners
Scenario with Meeting Space
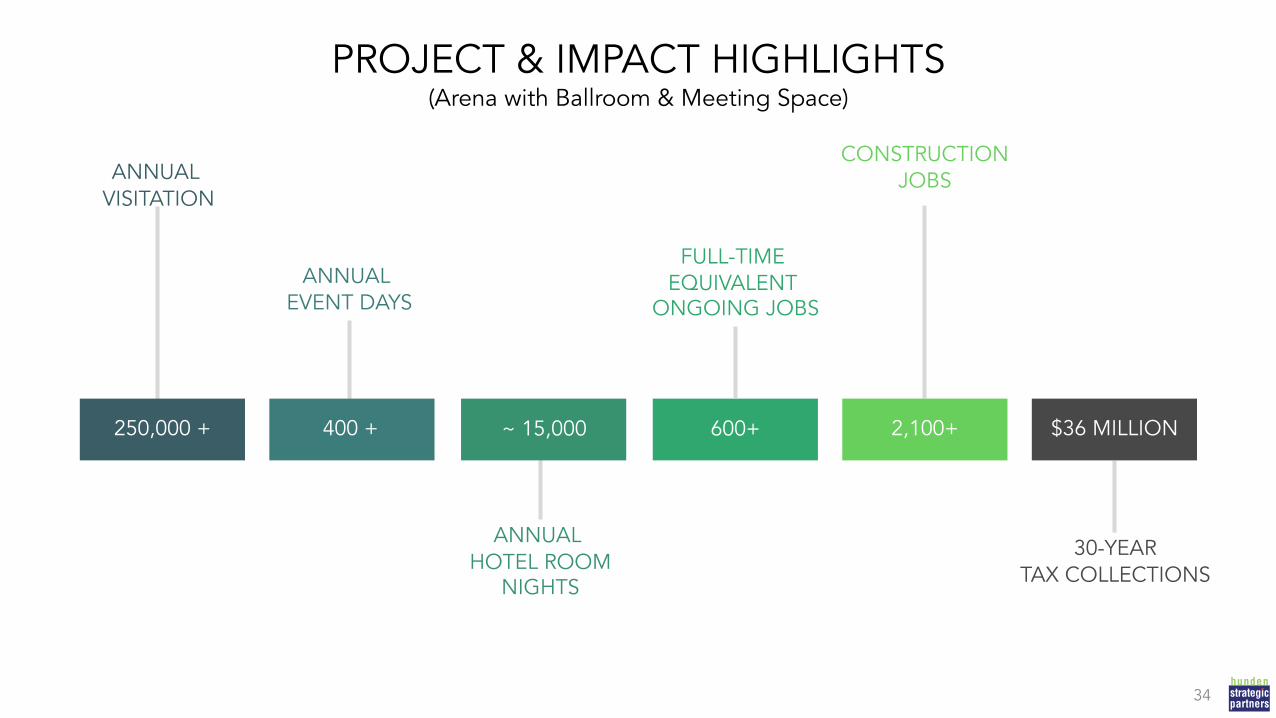
34PROJECT & IMPACT HIGHLIGHTS(Arena with Ballroom & Meeting Space)
250,000 + 400 +
ANNUAL VISITATION
ANNUAL EVENT DAYS
ANNUAL HOTEL ROOM
NIGHTS
30-YEARTAX COLLECTIONS
CONSTRUCTIONJOBS
FULL-TIME EQUIVALENT
ONGOING JOBS
~ 15,000 600+ $36 MILLION2,100+
34

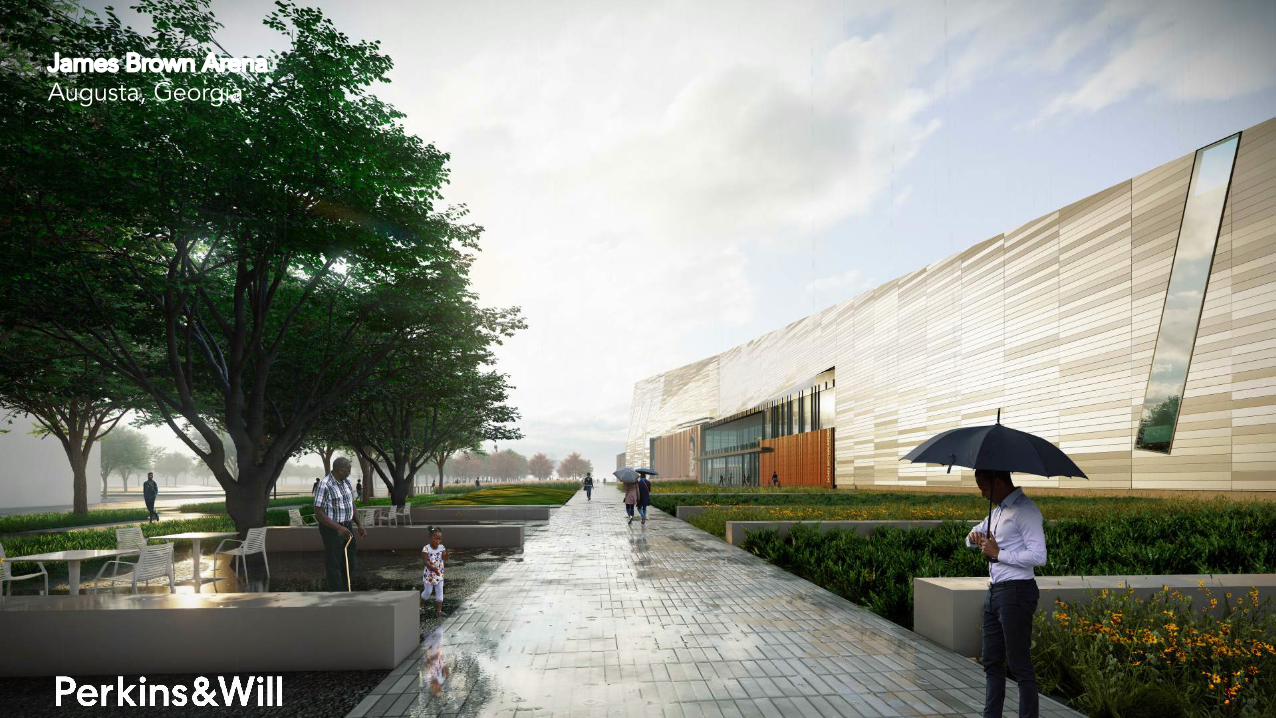
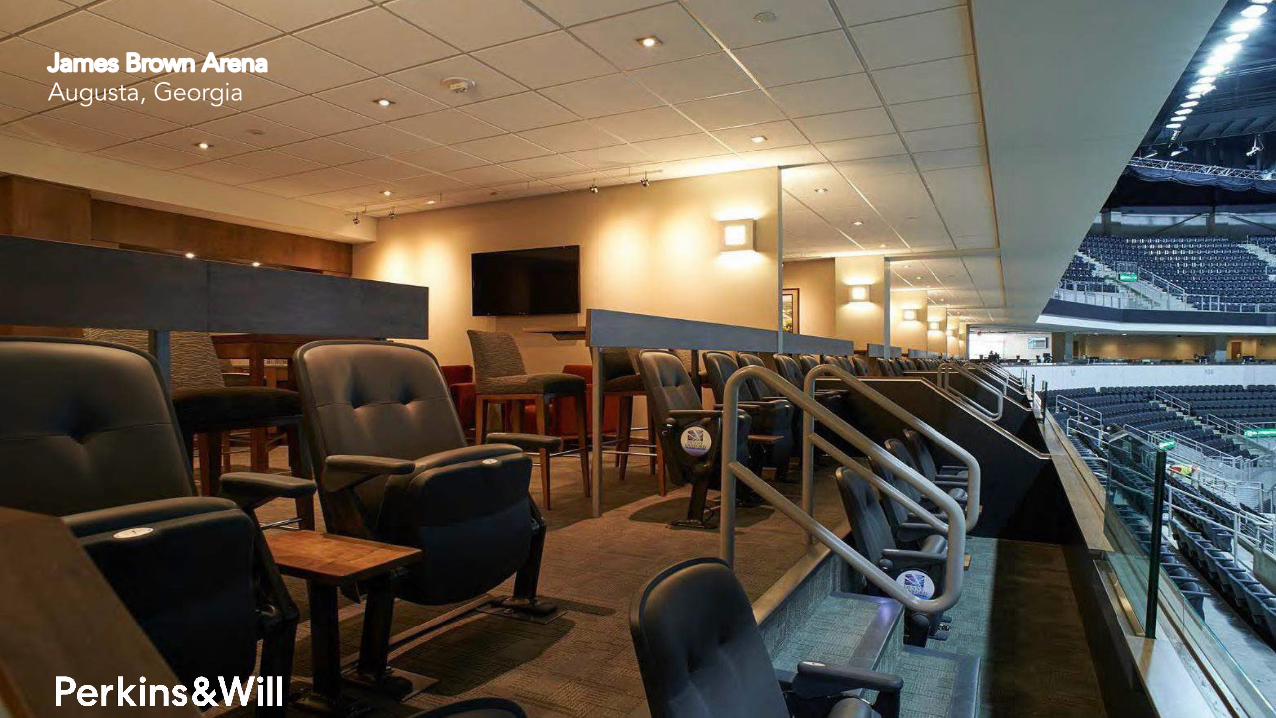
James Brown ArenaAugusta, Georgia
Size 355,000 SF
Concert Capacity (End Stage/Fixed) 10,400/9,680
Prelim Construction Cost $183 million
Cost per fixed Seat $18,900
Cost per square ft. $515


James Brown ArenaAgusta, Georgia,James Brown ArenaAugusta, Georgia

James Brown ArenaAgusta, GeorgiaJames Brown ArenaAugusta, Georgia

Savannah ArenaJames Brown ArenaAgusta, GeorgiaJames Brown ArenaAugusta, Georgia
James Brown ArenaAgusta, GeorgiaJames Brown ArenaAugusta, Georgia

James Brown ArenaAgusta, GeorgiaJames Brown ArenaAugusta, Georgia
James Brown ArenaAugusta, Georgia

James Brown ArenaAugusta, Georgia

EVENT / GROUND FLOOR PLANARENA | SHARED FUNCTIONS | BELL EXPANSION

SUITE LEVEL FLOORPLAN

UPPERLEVEL FLOOR PLAN

James Brown ArenaAugusta, Georgia

Dollar Loan CenterHenderson, NV4

50
Henderson Pavilion – Open Air theater – Severelydamaged in a microburst event in 2018
Henderson Pavilion

51
Matchmaking• Vegas Golden Knights partnered with the
City of Henderson to develop an Ice Arenain Downtown Henderson for youth Hockeyand other ice events
• Knights purchased an AHL team andconverted space in the Downtown facilityfor offices and practice facility.
• Knights looking for a venue to play gameswhile the City was working to reimaginethe Pavilion
• Serendipity! A match made in heaven
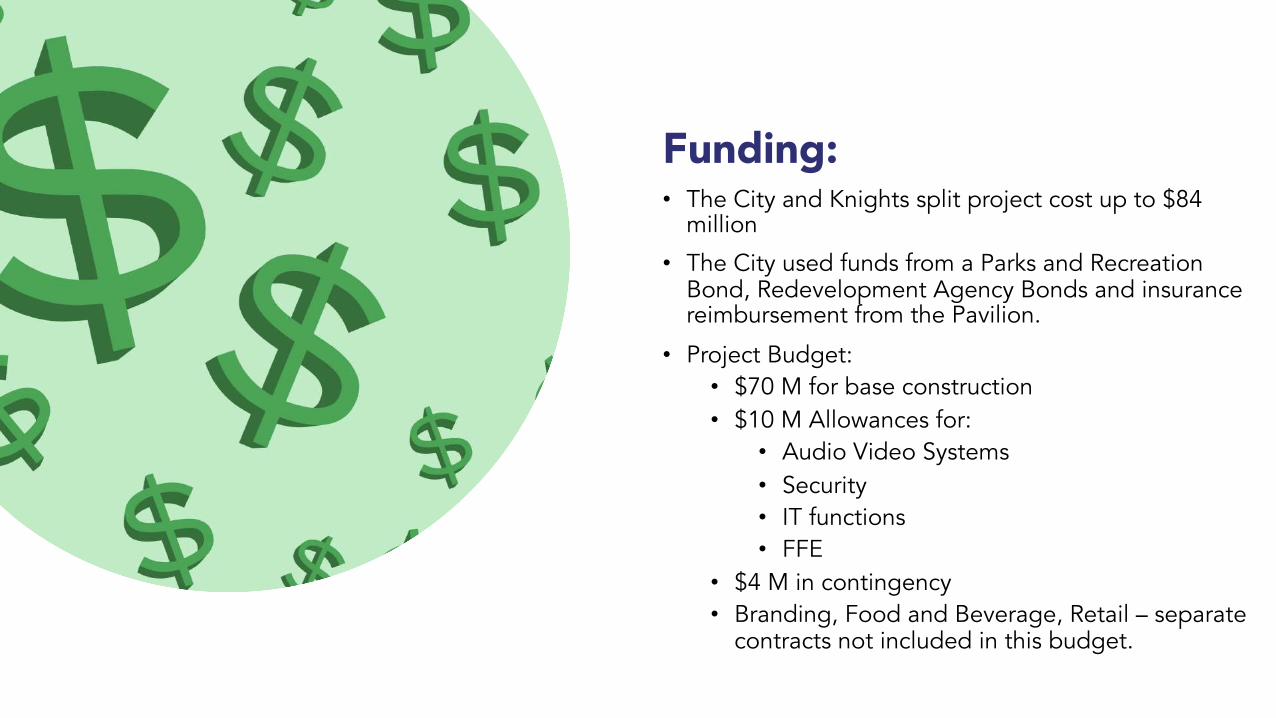
Funding:• The City and Knights split project cost up to $84
million
• The City used funds from a Parks and Recreation Bond, Redevelopment Agency Bonds and insurance reimbursement from the Pavilion.
• Project Budget:• $70 M for base construction• $10 M Allowances for:
• Audio Video Systems• Security• IT functions• FFE
• $4 M in contingency• Branding, Food and Beverage, Retail – separate
contracts not included in this budget.

Project Delivery
• Expediency of project delivery time• Finite funding• Integration into Community setting.
Considerations:
• Design Build – Design Competition• Provided the most streamlined design for
construction schedule• Provided the best means to establish the
budget at the beginning of the project• Allowed for a range of different design
solutions to be considered.
Solution

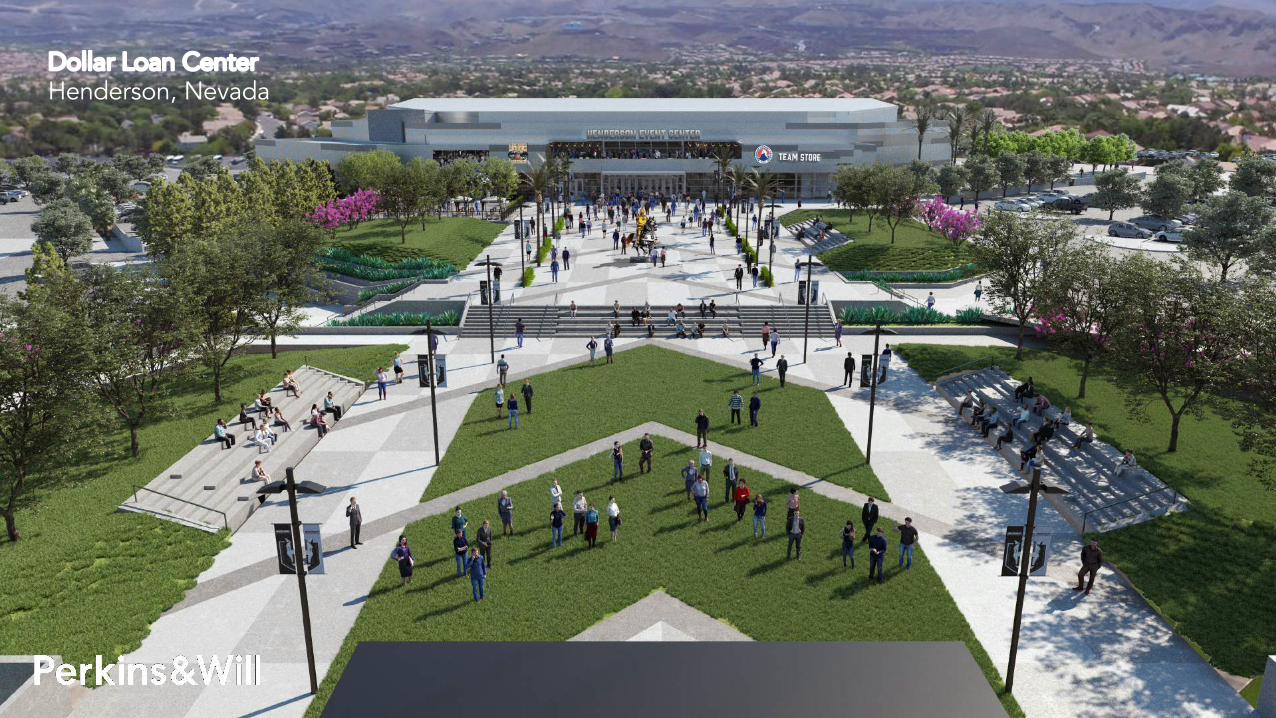
Dollar Loan CenterHenderson, Nevada
Size 199,562 SF
Hockey Capacity 6,000
Construction Cost $84 million
Cost per Seat $14,000
Cost per square ft. $420
Dollar Loan CenterHenderson, Nevada

Dollar Loan CenterHenderson, Nevada

Dollar Loan CenterHenderson, Nevada

Dollar Loan CenterHenderson, Nevada

59
Dollar Loan CenterHenderson, Nevada

Dollar Loan CenterHenderson, Nevada

Dollar Loan CenterHenderson, Nevada
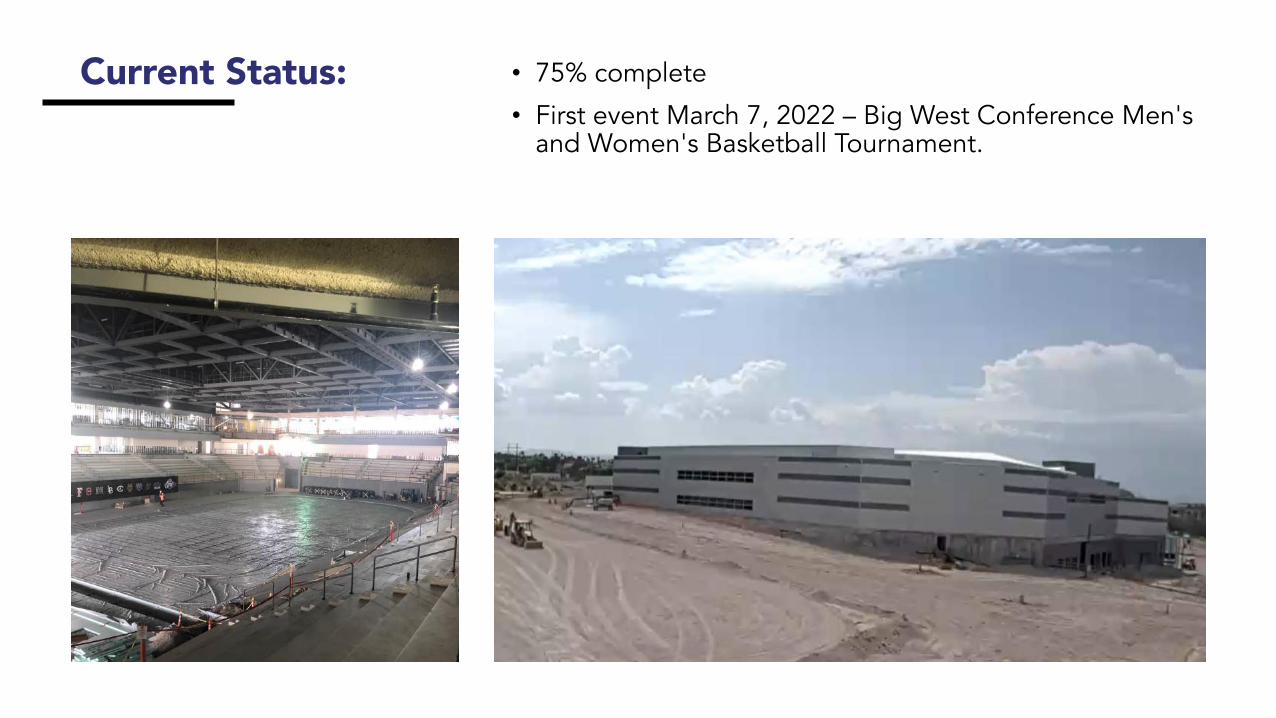
Current Status: • 75% complete
• First event March 7, 2022 – Big West Conference Men's and Women's Basketball Tournament.

63
Q&A?

Thank YouThank You!