Embed Size (px)
Citation preview
To protect the confidential and proprietary information included in this material, it may not be disclosed or provided to any third parties without the approval of Hewitt Associates LLC.
Mid-Year view onPerformance & Reward Trends in India
July 2009
2
[Title MM/DD/YYYY]
The current economic crisis is deeper and broader than many of us initially imagined it would be. Stock market fluctuations, shrinking business and consumer credit, job losses, and government interventions are all uneasy reflections of managing businessin today's environment.
Organisations in order to bridge the gap between shrinking margins and declining business opportunities are compelled to reevaluate their cost structures. Even though the war is global, for Indian businesses, the stakes are high since our success islargely contributed by harnessing global talent together, which by far is the most vulnerable commodity in both good and not so good times. organisations have focused on getting a better return on their people cost and hence are focused on productivity, utilization and innovation.
Hewitt has been working actively with organisations in reworking the business and performance agenda. In our commitment to come back to the market we conducted a mid year dip stick research across 137 organisations to study and analyze their decisionson actual salary increase, variable pay and other survival tactics in combating the current downturn and more focused on revival.
As India Inc. recovers from the initial shock of the downturn, it is interesting to see that organisations are adopting a mix ofdeliberate, optimistic, yet slightly cautious strategies for managing rewards and performance.
The subsequent slides display detailed results on the following: Salary Revision, Salary Freeze, Salary Reduction, Salary Increase – by employee group, by industry & by performance ratings, Variable Pay Plan, Layoffs and Attrition
Introduction
3
[Title MM/DD/YYYY]
Content
1
2
3
4
Survey Highlights
Definition Of Terms
5
6
Variable Pay Plans
Layoffs
Salary Increase
Salary Revision and Salary Freeze
7 Attrition
8 Participant List
4
[Title MM/DD/YYYY]
Survey Highlights
5
[Title MM/DD/YYYY]
Mid-Year survey on Performance & Reward Trends in India
Survey Highlights
Hewitt Associates has recently concluded a Mid-Year survey on Performance & Reward Trends in India. The intent was to capture the potential changes and considerations with regards to 2009 salary increase budgets. This survey was a follow up to Hewitt's India Salary Increase Survey which focused on changes to salary increase budgets post the downturn phase.
The survey measures actual salary increases and compensation practices for five specific employee levels - top executive, senior management, middle management, junior manager/professional/ supervisor and manual workforce.
Information used in this report was collected during the period of May to June 2009.
A total of 137 organisations participated in this survey across 9 primary industries.
The following is a brief summary of the results:
Salary Revision Cycle: Approximately 30% of the organisations have deferred their salary revision cycle. Typically, the salary revisions have been deferred from the month of April to July or October.
Salary Freeze & Salary Reduction: 16% of the organisations have a salary freeze currently. These are mainly organisations in the Financial Services, IT & ITES sectors. Salary reduction is not very prevalent, only 6% of the organisations have reduced salaries.
6
[Title MM/DD/YYYY]
Performance & Reward Trends in India
Survey Highlights
7.2
8.8
8.4
8.0
7.4
2009Projected
10.8
14.3
13.8
13.2
12.4
2008
7.7
9.5
8.7
8.1
7.3
Mid Year 2009
11.311.911.49.79.57.710.212.4Manual Workforce
15.916.015.414.312.610.914.515.1Junior Manager / Supervisor / Professional
15.715.014.513.312.010.713.814.9Middle Management
14.913.913.912.210.910.013.614.7Senior Management
13.913.913.912.210.910.013.614.7Top Executive
20072006200520042003200220012000Employee Groups
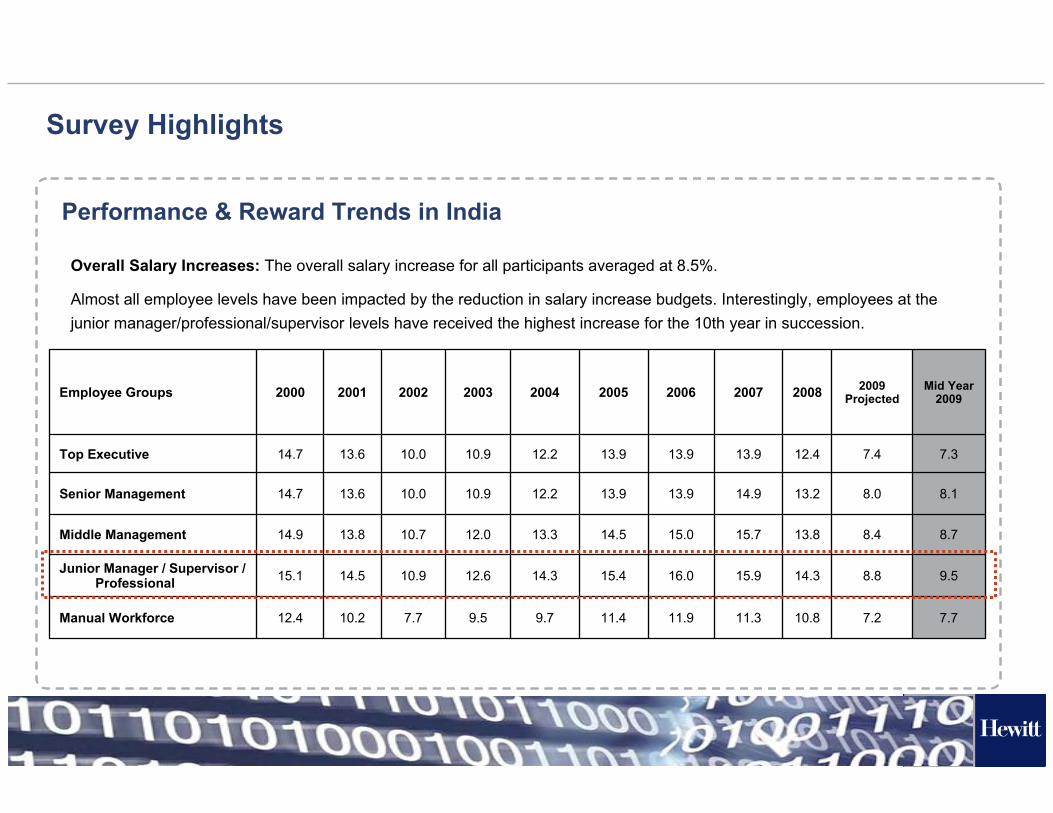
Overall Salary Increases: The overall salary increase for all participants averaged at 8.5%.
Almost all employee levels have been impacted by the reduction in salary increase budgets. Interestingly, employees at the junior manager/professional/supervisor levels have received the highest increase for the 10th year in succession.
7
[Title MM/DD/YYYY]
Performance & Reward Trends in India
Survey Highlights
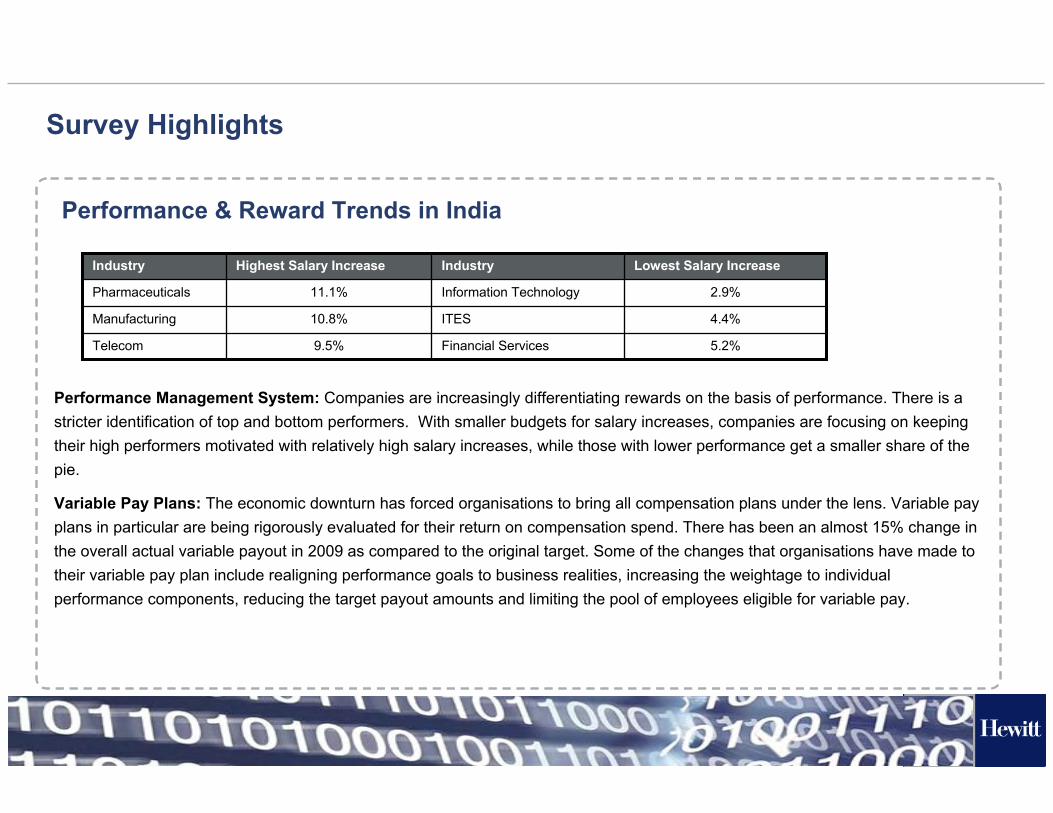
Performance Management System: Companies are increasingly differentiating rewards on the basis of performance. There is a stricter identification of top and bottom performers. With smaller budgets for salary increases, companies are focusing on keeping their high performers motivated with relatively high salary increases, while those with lower performance get a smaller share of the pie.
Variable Pay Plans: The economic downturn has forced organisations to bring all compensation plans under the lens. Variable pay plans in particular are being rigorously evaluated for their return on compensation spend. There has been an almost 15% change in the overall actual variable payout in 2009 as compared to the original target. Some of the changes that organisations have made to their variable pay plan include realigning performance goals to business realities, increasing the weightage to individual performance components, reducing the target payout amounts and limiting the pool of employees eligible for variable pay.
2.9%Information Technology11.1%Pharmaceuticals
9.5%
10.8%
Highest Salary Increase
Telecom
Manufacturing
Industry
Financial Services
ITES
Industry
5.2%
4.4%
Lowest Salary Increase
8
[Title MM/DD/YYYY]
Definition of Terms
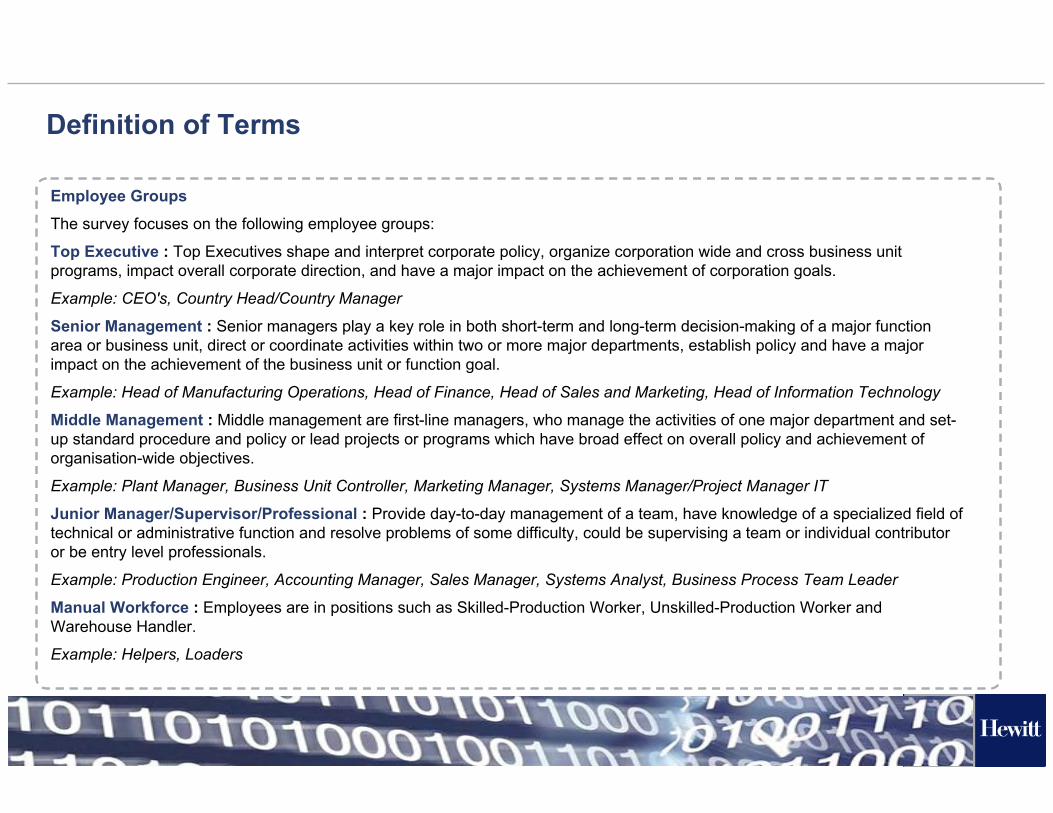
Employee Groups
The survey focuses on the following employee groups:
Top Executive : Top Executives shape and interpret corporate policy, organize corporation wide and cross business unit programs, impact overall corporate direction, and have a major impact on the achievement of corporation goals.
Example: CEO's, Country Head/Country Manager
Senior Management : Senior managers play a key role in both short-term and long-term decision-making of a major function area or business unit, direct or coordinate activities within two or more major departments, establish policy and have a major impact on the achievement of the business unit or function goal.
Example: Head of Manufacturing Operations, Head of Finance, Head of Sales and Marketing, Head of Information Technology
Middle Management : Middle management are first-line managers, who manage the activities of one major department and set-up standard procedure and policy or lead projects or programs which have broad effect on overall policy and achievement of organisation-wide objectives.
Example: Plant Manager, Business Unit Controller, Marketing Manager, Systems Manager/Project Manager IT
Junior Manager/Supervisor/Professional : Provide day-to-day management of a team, have knowledge of a specialized field of technical or administrative function and resolve problems of some difficulty, could be supervising a team or individual contributor or be entry level professionals.
Example: Production Engineer, Accounting Manager, Sales Manager, Systems Analyst, Business Process Team Leader
Manual Workforce : Employees are in positions such as Skilled-Production Worker, Unskilled-Production Worker and Warehouse Handler.
Example: Helpers, Loaders
9
[Title MM/DD/YYYY]
Salary Revision Cycle and Salary Freeze
10
[Title MM/DD/YYYY]
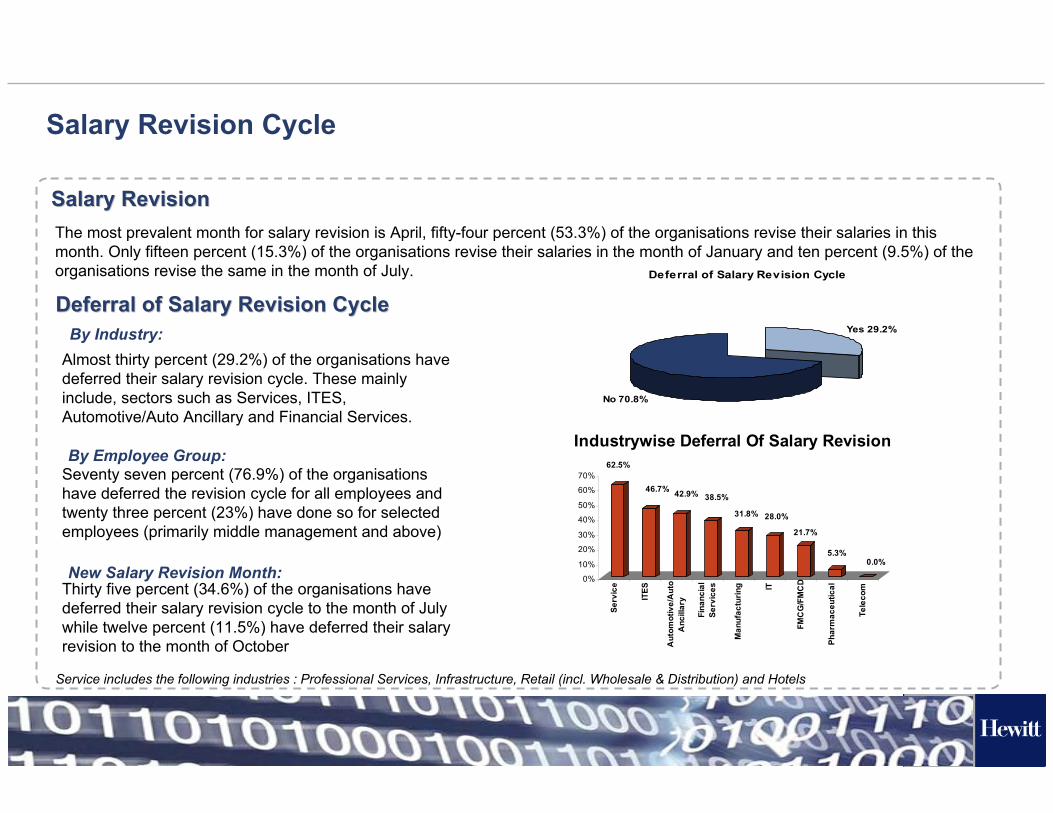
The most prevalent month for salary revision is April, fifty-four percent (53.3%) of the organisations revise their salaries in this month. Only fifteen percent (15.3%) of the organisations revise their salaries in the month of January and ten percent (9.5%) of the organisations revise the same in the month of July.
Salary RevisionSalary Revision
Deferral of Salary Revision CycleDeferral of Salary Revision Cycle
Almost thirty percent (29.2%) of the organisations have deferred their salary revision cycle. These mainly include, sectors such as Services, ITES, Automotive/Auto Ancillary and Financial Services.
Seventy seven percent (76.9%) of the organisations have deferred the revision cycle for all employees and twenty three percent (23%) have done so for selected employees (primarily middle management and above)
Thirty five percent (34.6%) of the organisations have deferred their salary revision cycle to the month of July while twelve percent (11.5%) have deferred their salary revision to the month of October
Salary Revision Cycle
Deferral of Salary Revision Cycle
Yes 29.2%
No 70.8%
Industry wise deferral of Salary Revision
By Industry:
By Employee Group:
New Salary Revision Month:
Service includes the following industries : Professional Services, Infrastructure, Retail (incl. Wholesale & Distribution) and Hotels
62.5%
46.7% 42.9% 38.5%
31.8% 28.0%
21.7%
5.3%0.0%
0%
10%
20%
30%
40%
50%
60%
70%
Serv
ice
ITES
Aut
omot
ive/
Aut
oA
ncill
ary
Fina
ncia
lSe
rvic
es
Man
ufac
turin
g IT
FMC
G/F
MC
D
Phar
mac
eutic
al
Tele
com
Industrywise Deferral Of Salary Revision
11
[Title MM/DD/YYYY]
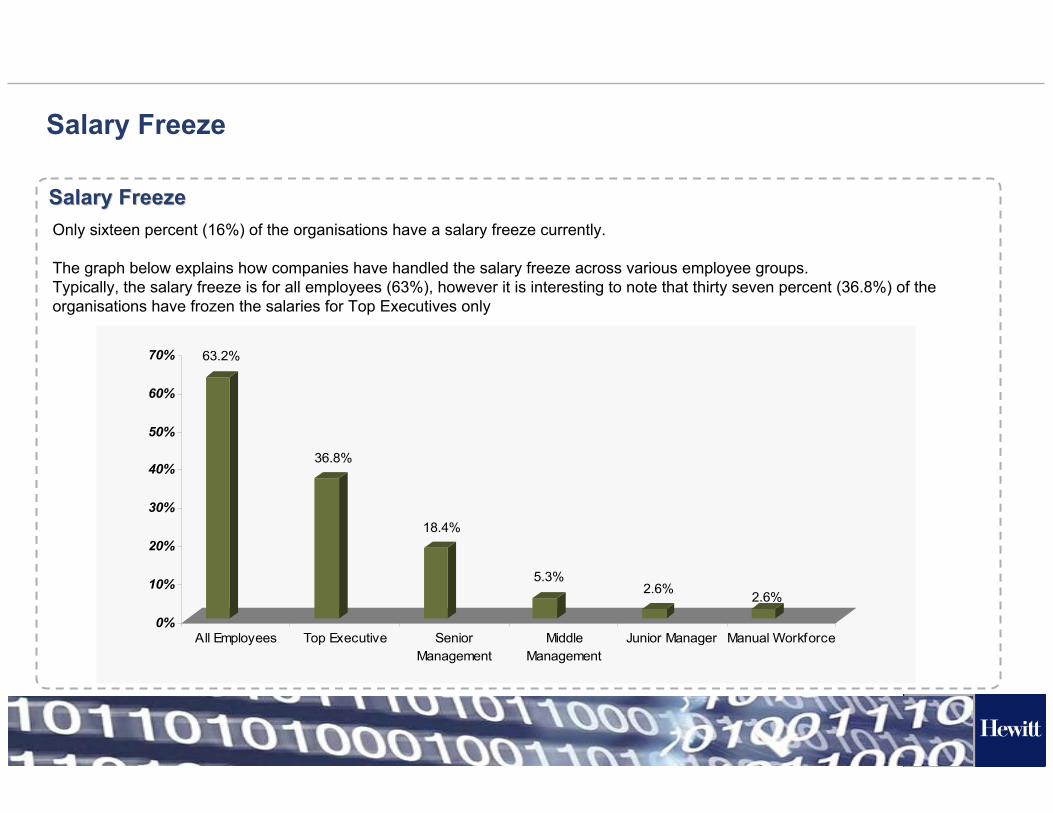
Salary FreezeSalary FreezeOnly sixteen percent (16%) of the organisations have a salary freeze currently.
The graph below explains how companies have handled the salary freeze across various employee groups.Typically, the salary freeze is for all employees (63%), however it is interesting to note that thirty seven percent (36.8%) of the organisations have frozen the salaries for Top Executives only
Salary Freeze
63.2%
36.8%
18.4%
5.3%2.6% 2.6%
0%
10%
20%
30%
40%
50%
60%
70%
All Employees Top Executive SeniorManagement
MiddleManagement
Junior Manager Manual Workforce
12
[Title MM/DD/YYYY]
Salary Freeze by Industry
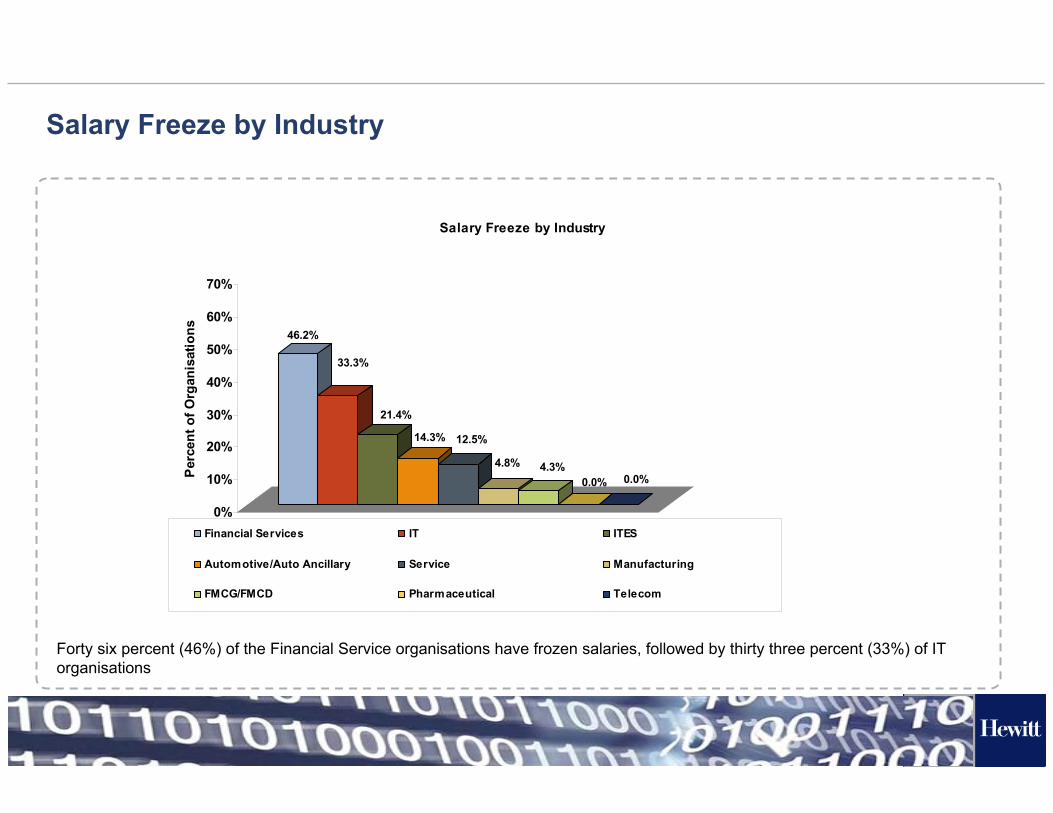
Forty six percent (46%) of the Financial Service organisations have frozen salaries, followed by thirty three percent (33%) of IT organisations
46.2%
33.3%
21.4%
14.3% 12.5%
4.8% 4.3%0.0% 0.0%
0%
10%
20%
30%
40%
50%
60%
70%
Per
cent
of O
rgan
isat
ions
Salary Freeze by Industry
Financial Services IT ITES
Automotive/Auto Ancillary Service Manufacturing
FMCG/FMCD Pharmaceutical Telecom
13
[Title MM/DD/YYYY]
Overall Salary ReductionOverall Salary Reduction
Overall Salary Reduction in 2009
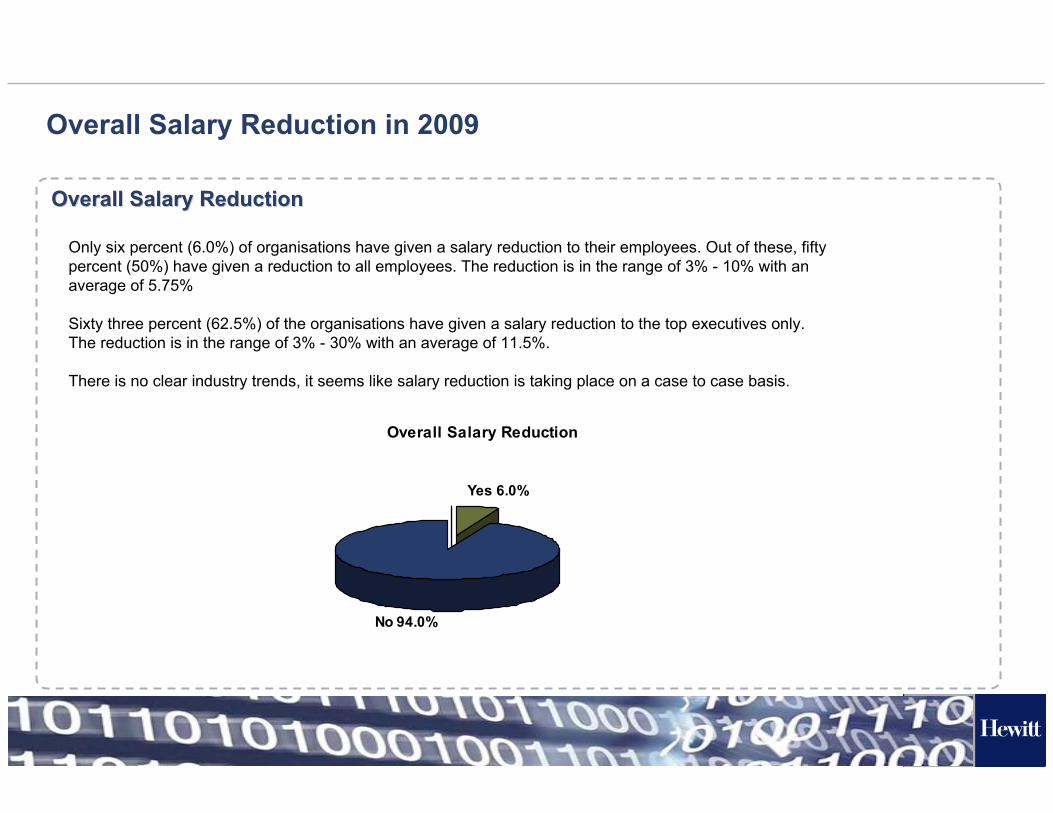
Only six percent (6.0%) of organisations have given a salary reduction to their employees. Out of these, fifty percent (50%) have given a reduction to all employees. The reduction is in the range of 3% - 10% with an average of 5.75%
Sixty three percent (62.5%) of the organisations have given a salary reduction to the top executives only. The reduction is in the range of 3% - 30% with an average of 11.5%.
There is no clear industry trends, it seems like salary reduction is taking place on a case to case basis.
Overall Salary Reduction
No 94.0%
Yes 6.0%
14
[Title MM/DD/YYYY]
Salary Increase
15
[Title MM/DD/YYYY]
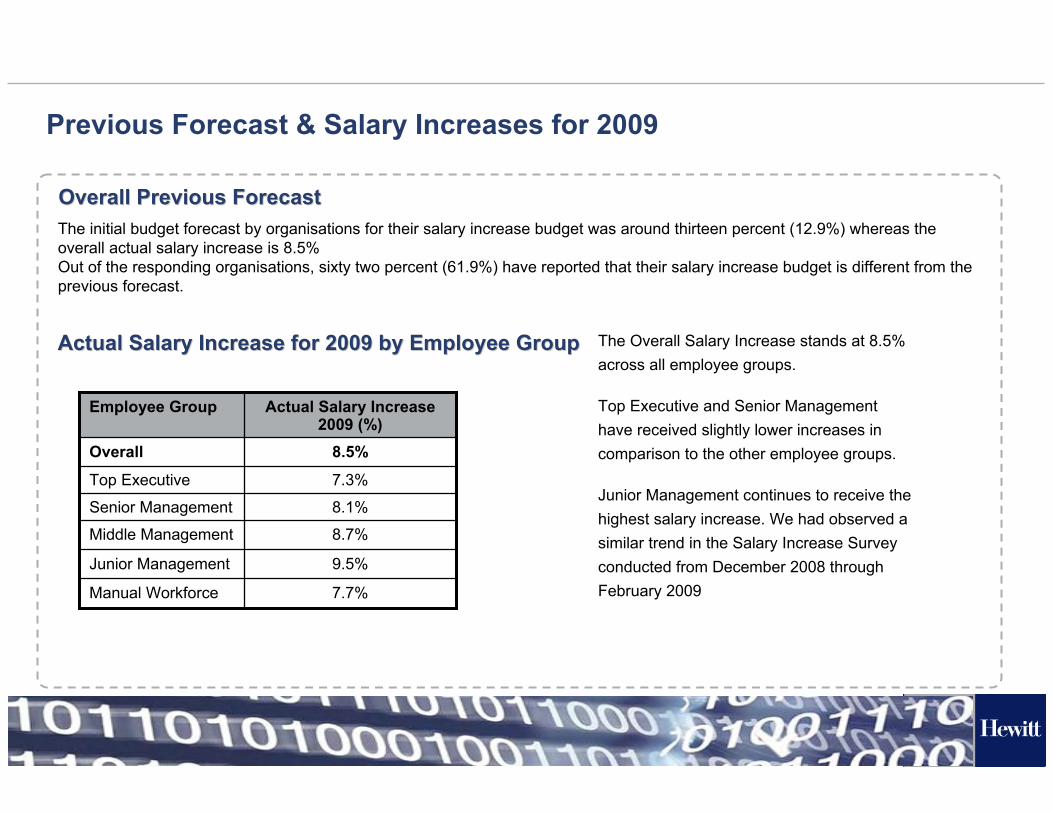
Overall Previous ForecastOverall Previous ForecastThe initial budget forecast by organisations for their salary increase budget was around thirteen percent (12.9%) whereas the overall actual salary increase is 8.5% Out of the responding organisations, sixty two percent (61.9%) have reported that their salary increase budget is different from the previous forecast.
Previous Forecast & Salary Increases for 2009
Actual Salary Increase for 2009 by Employee GroupActual Salary Increase for 2009 by Employee Group
Manual Workforce
Junior Management
Middle Management
Senior Management
Top Executive
Overall
Employee Group
7.7%
9.5%
8.7%
8.1%
7.3%
8.5%
Actual Salary Increase 2009 (%)
The Overall Salary Increase stands at 8.5% across all employee groups.
Top Executive and Senior Management have received slightly lower increases in comparison to the other employee groups.
Junior Management continues to receive the highest salary increase. We had observed a similar trend in the Salary Increase Survey conducted from December 2008 through February 2009
16
[Title MM/DD/YYYY]
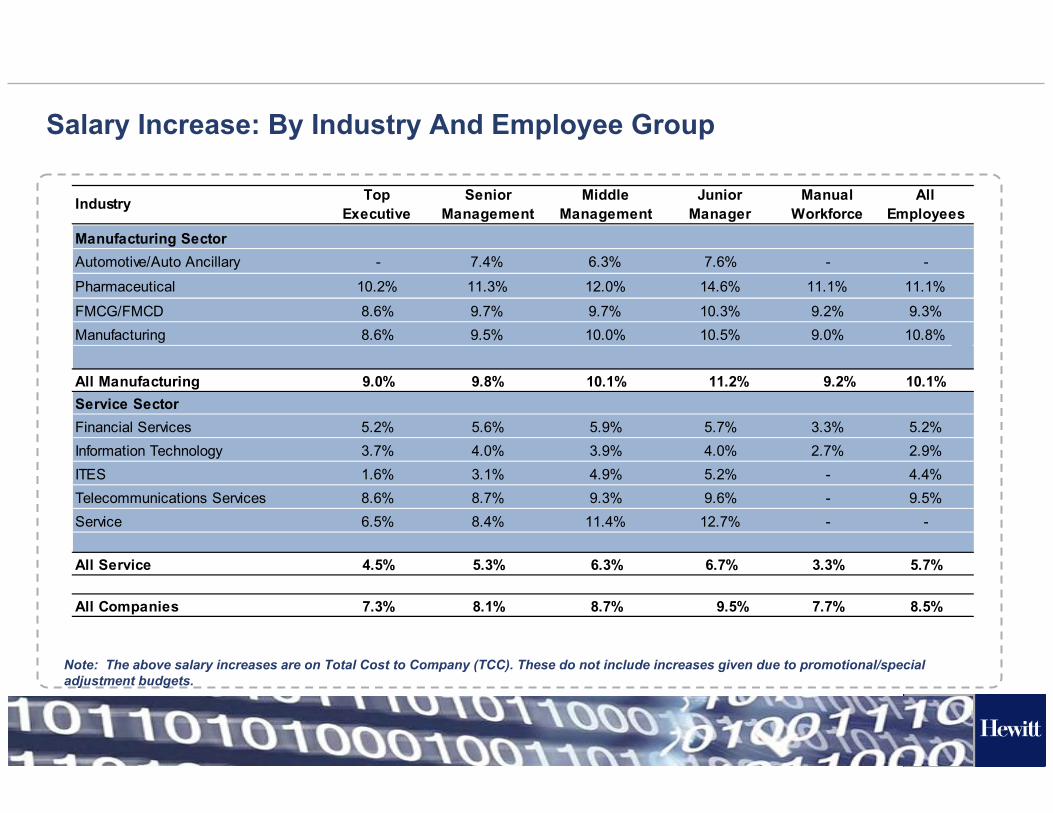
Salary Increase: By Industry And Employee Group
Note: The above salary increases are on Total Cost to Company (TCC). These do not include increases given due to promotional/special adjustment budgets.
- 7.6% -
10.2% 14.6% 11.1%
8.6% 10.3% 9.2%8.6% 10.5% 9.0%
9.0% 11.2% 9.2%Service Sector
5.2% 5.7% 3.3%3.7% 4.0% 2.7%1.6% 5.2% -8.6% 9.6% -6.5% 12.7% -
4.5% 6.7% 3.3%
7.3% 9.5% 7.7%All Companies
Industry
Pharmaceutical
Automotive/Auto AncillaryManufacturing Sector
Service
All Manufacturing
Telecommunications Services
Financial Services
ITESInformation Technology
FMCG/FMCDManufacturing
All Service
Top Executive
Junior Manager
Middle Management
Manual Workforce
Senior Management
All Employees
-
11.1%
9.3%10.8%
10.1%
5.2%2.9%4.4%9.5%
-
5.7%
8.5%
7.4%
11.3%
9.7%9.5%
9.8% 10.1%
10.0%9.7%
12.0%
6.3%
5.9%3.9%4.9%9.3%
11.4%
6.3%
8.7%
3.1%4.0%5.6%
8.1%
5.3%
8.4%8.7%
17
[Title MM/DD/YYYY]
Overall Salary Increases : By Industry
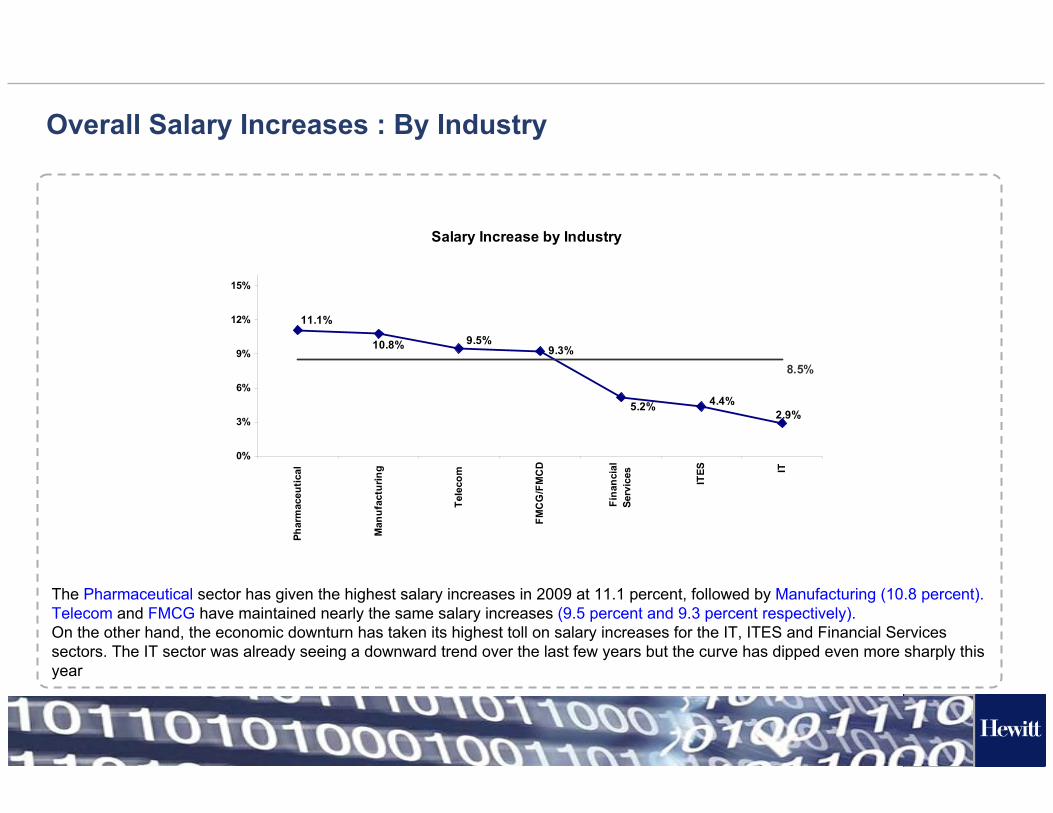
The Pharmaceutical sector has given the highest salary increases in 2009 at 11.1 percent, followed by Manufacturing (10.8 percent).Telecom and FMCG have maintained nearly the same salary increases (9.5 percent and 9.3 percent respectively).On the other hand, the economic downturn has taken its highest toll on salary increases for the IT, ITES and Financial Services sectors. The IT sector was already seeing a downward trend over the last few years but the curve has dipped even more sharply this year
Salary Increase by Industry
9.3%
2.9%5.2%
10.8% 9.5%
11.1%
4.4%
8.5%
0%
3%
6%
9%
12%
15%Ph
arm
aceu
tical
Man
ufac
turin
g
Tele
com
FMC
G/F
MC
D
Fina
ncia
lSe
rvic
es ITES IT
18
[Title MM/DD/YYYY]
Top Executive & Senior ManagementTop Executive & Senior Management
Salary Increases in 2008-2009 & 2009-2010
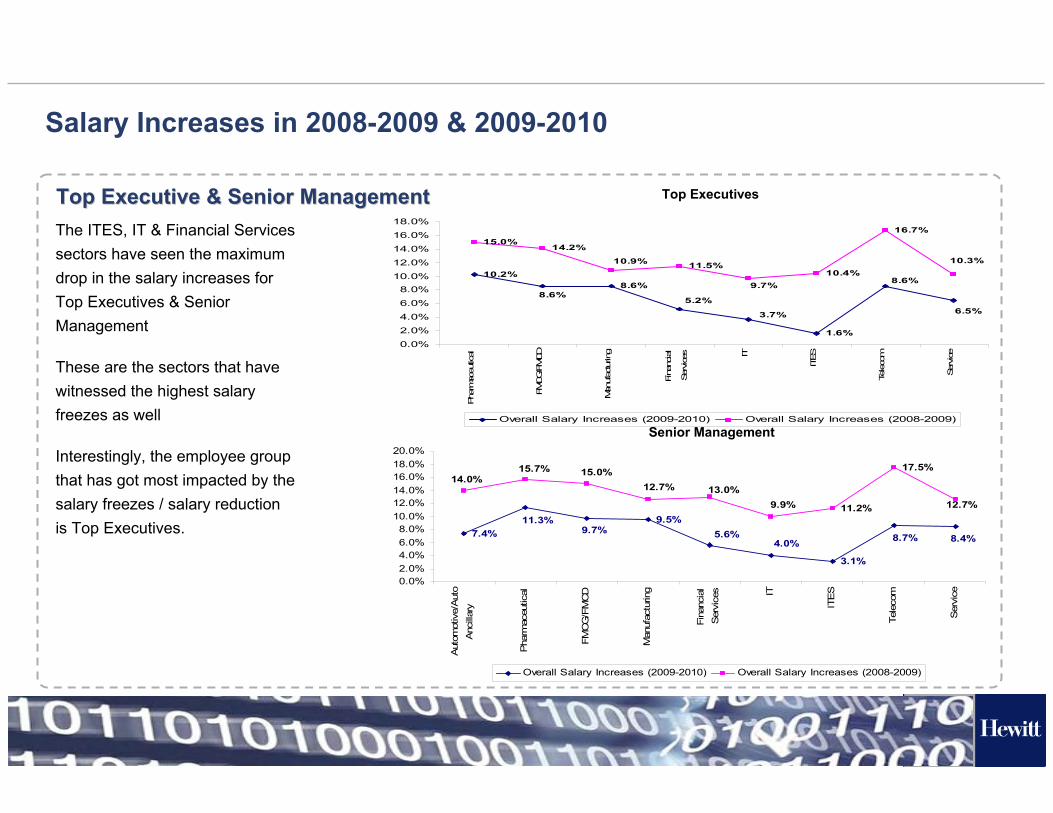
The ITES, IT & Financial Services sectors have seen the maximum drop in the salary increases for Top Executives & Senior Management
These are the sectors that have witnessed the highest salary freezes as well
Interestingly, the employee group that has got most impacted by the salary freezes / salary reduction is Top Executives.
10.2%8.6%
1.6%
15.0%14.2%
11.5%10.4%
16.7%
3.7%
5.2%8.6%
6.5%
8.6%
10.9%
9.7%
10.3%
0.0%
2.0%
4.0%
6.0%
8.0%10.0%
12.0%
14.0%
16.0%
18.0%
Pha
rmac
eutic
al
FMCG/FMCD
Man
ufac
turin
g
Fina
ncial
Ser
vice
s IT
ITES
Teleco
m
Service
Overall Salary Increases (2009-2010) Overall Salary Increases (2008-2009)
Top Executives
7.4%9.5%
3.1%
11.2%
17.5%
11.3%9.7% 5.6%
4.0% 8.7% 8.4%
12.7%9.9%13.0%12.7%
15.0%15.7%14.0%
0.0%2.0%4.0%6.0%8.0%
10.0%12.0%14.0%16.0%18.0%20.0%
Aut
omot
ive/
Aut
oA
ncill
ary
Pha
rmac
eutic
al
FMC
G/F
MC
D
Man
ufac
turin
g
Fina
ncia
lS
ervi
ces IT
ITE
S
Tele
com
Ser
vice
Overall Salary Increases (2009-2010) Overall Salary Increases (2008-2009)
Senior Management
19
[Title MM/DD/YYYY]
Middle & Junior ManagementMiddle & Junior Management
Salary Increases in 2008-2009 & 2009-2010
6.3%
14.8%11.9%
19.3%
11.4%
9.3%12.0%
9.7%
10.0%
5.9%3.9%
4.9%
11.0%
13.9%13.1%15.5%15.9%
9.4%
0.0%
5.0%
10.0%
15.0%
20.0%
25.0%
Aut
omot
ive/
Aut
o
Anc
illar
y
Pha
rmac
eutic
al
FMCG
/FM
CD
Man
ufac
turin
g
Fina
ncial
Ser
vice
s IT
ITES
Tele
com
Ser
vice
Overall Salary Increases (2009-2010) Overall Salary Increases (2008-2009)
10.5%
14.3%12.4%
19.6%
12.7%
9.6%
5.2%4.0%
5.7%10.3%
14.6%
7.6%
19.0%
15.4% 15.5%13.9%
10.6% 10.3%
0.0%
5.0%
10.0%
15.0%
20.0%
25.0%
Aut
omot
ive/
Aut
oA
ncill
ary
Pha
rmac
eutic
al
FMC
G/F
MC
D
Man
ufac
turin
g
Fina
ncia
lS
ervi
ces IT
ITE
S
Tele
com
Ser
vice
Overall Salary Increases (2009-2010) Overall Salary Increases (2008-2009)
Middle Management
Junior Management
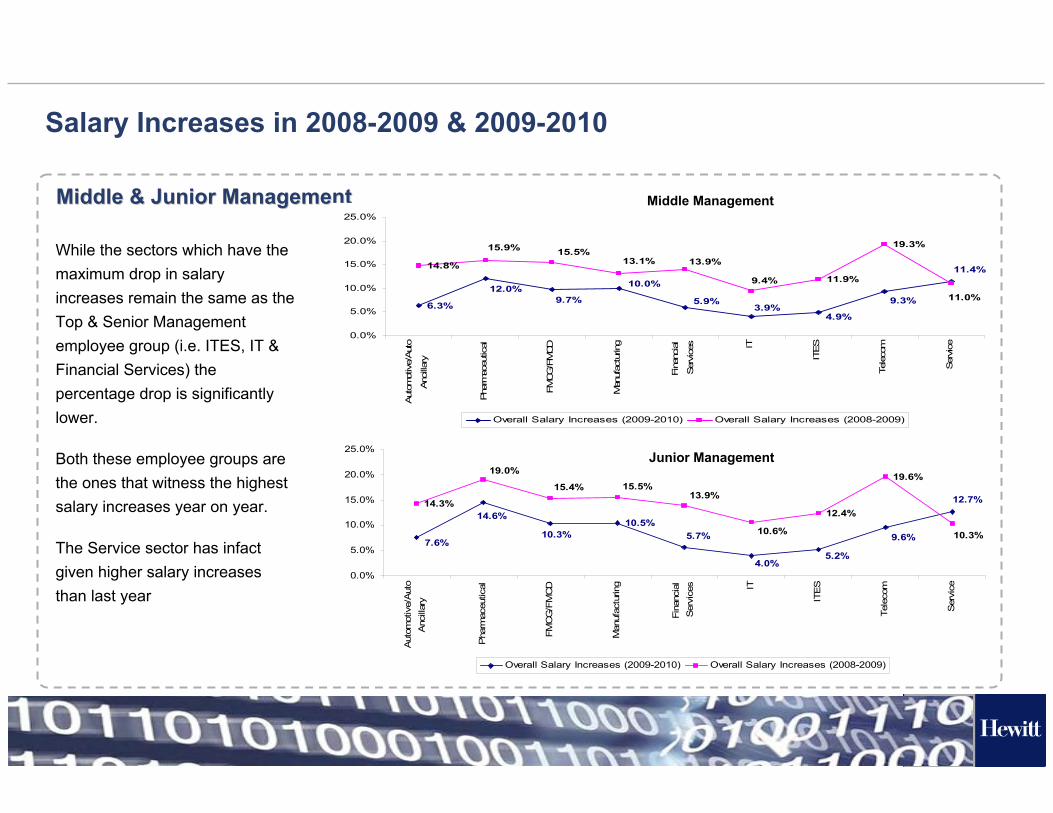
While the sectors which have the maximum drop in salary increases remain the same as the Top & Senior Management employee group (i.e. ITES, IT & Financial Services) the percentage drop is significantly lower.
Both these employee groups are the ones that witness the highest salary increases year on year.
The Service sector has infact given higher salary increases than last year
20
[Title MM/DD/YYYY]
Overall Merit Increase by Performance Rating 2009Overall Merit Increase by Performance Rating 2009--20102010
Merit Increases by Performance Ratings
3.2%
13.8%
52.2%
23.7%
7.1%
Employee %
Did Not Meet Expectations
Partially Met Expectations
Met Expectations
Exceeding Expectations
Far Exceeding Expectations
Performance Ratings
0.4%
4.8%
8.9%
12.6%
17.0%
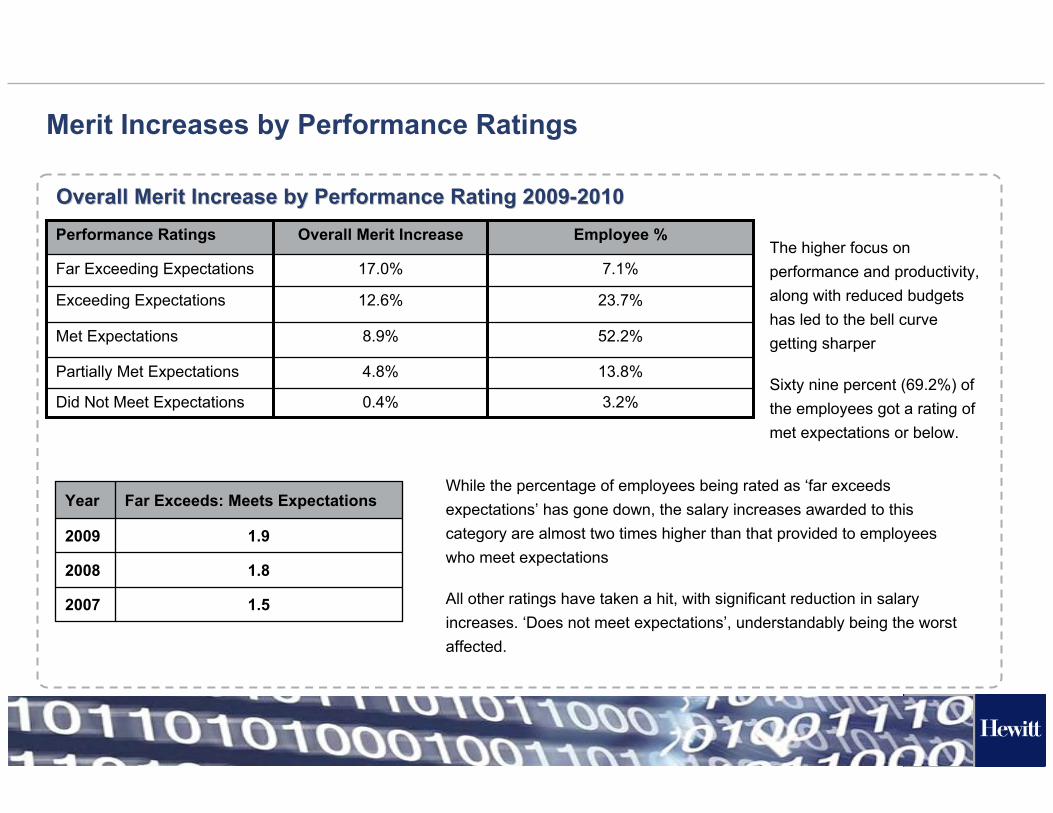
Overall Merit IncreaseThe higher focus on performance and productivity, along with reduced budgets has led to the bell curve getting sharper
Sixty nine percent (69.2%) of the employees got a rating of met expectations or below.
1.52007
1.82008
1.92009
Far Exceeds: Meets ExpectationsYearWhile the percentage of employees being rated as ‘far exceeds expectations’ has gone down, the salary increases awarded to this category are almost two times higher than that provided to employees who meet expectations
All other ratings have taken a hit, with significant reduction in salary increases. ‘Does not meet expectations’, understandably being the worst affected.
21
[Title MM/DD/YYYY]
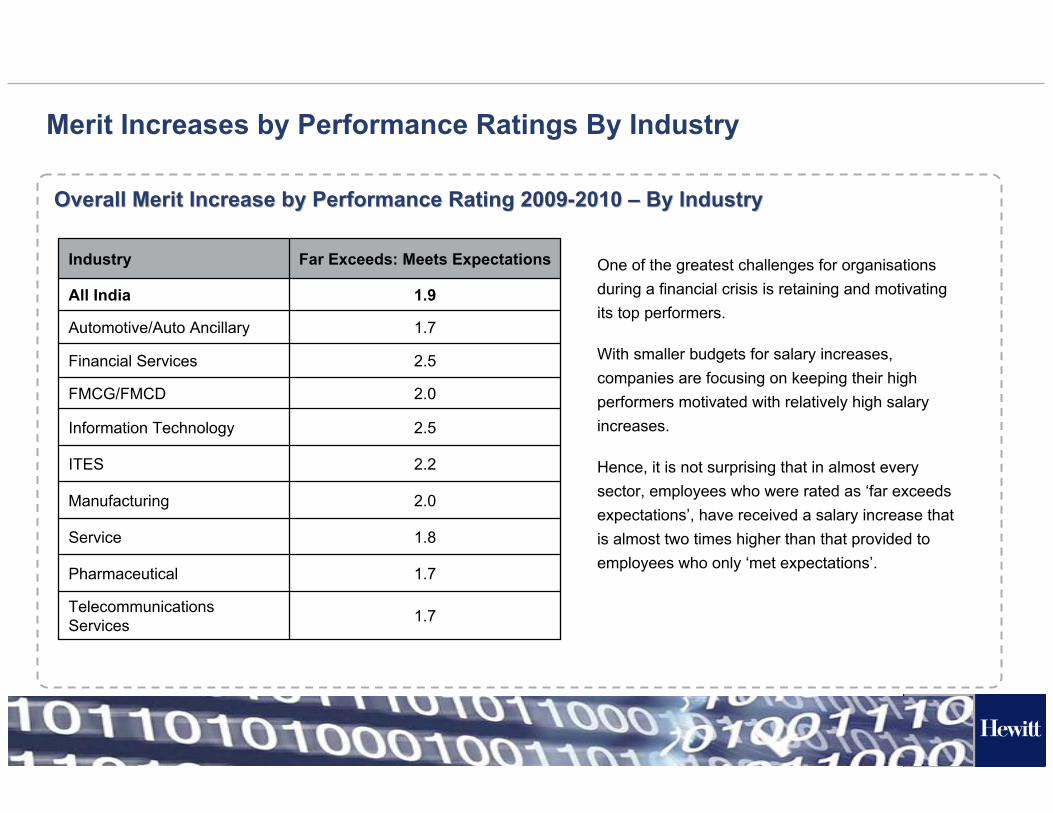
Overall Merit Increase by Performance Rating 2009Overall Merit Increase by Performance Rating 2009--2010 2010 –– By IndustryBy Industry
Merit Increases by Performance Ratings By Industry
1.8Service
1.7Pharmaceutical
2.5Financial Services
2.0FMCG/FMCD
2.5Information Technology
2.2ITES
2.0Manufacturing
1.7Telecommunications Services
1.7Automotive/Auto Ancillary
1.9All India
Far Exceeds: Meets ExpectationsIndustry One of the greatest challenges for organisations during a financial crisis is retaining and motivating its top performers.
With smaller budgets for salary increases, companies are focusing on keeping their high performers motivated with relatively high salary increases.
Hence, it is not surprising that in almost every sector, employees who were rated as ‘far exceeds expectations’, have received a salary increase that is almost two times higher than that provided to employees who only ‘met expectations’.

22
[Title MM/DD/YYYY]
Variable Pay Plans
23
[Title MM/DD/YYYY]
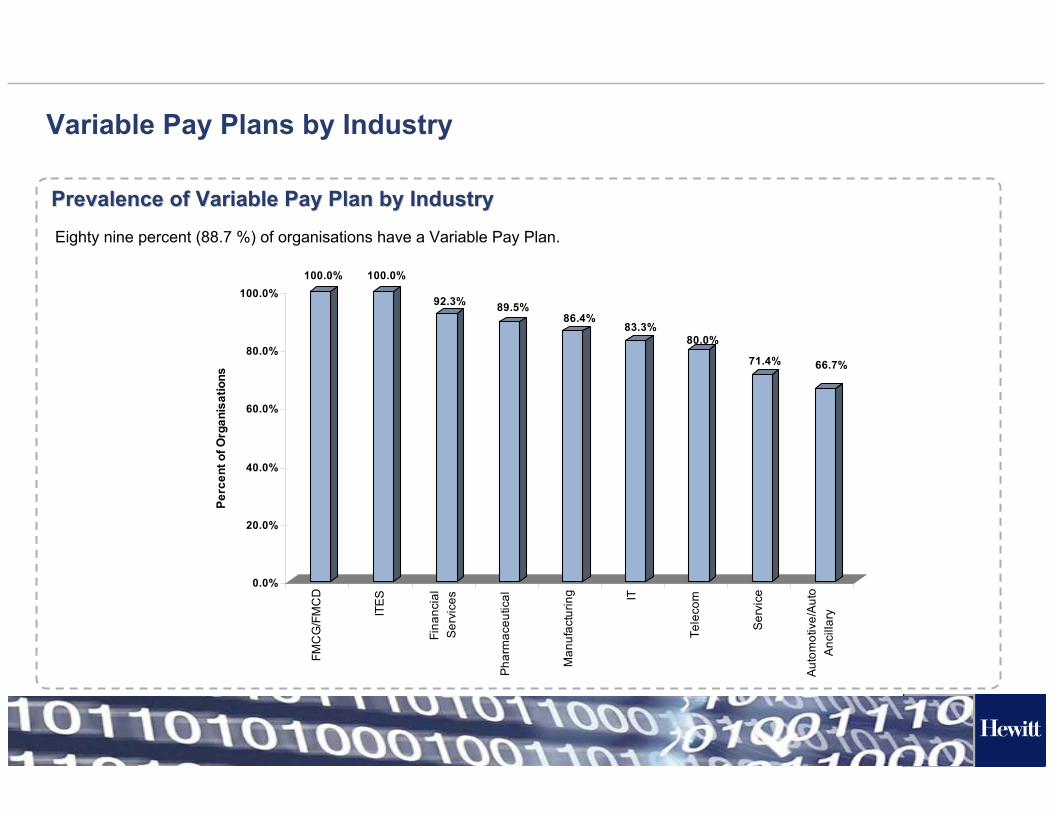
Prevalence of Variable Pay Plan by IndustryPrevalence of Variable Pay Plan by Industry
Variable Pay Plans by Industry
Eighty nine percent (88.7 %) of organisations have a Variable Pay Plan.
100.0% 100.0%
92.3% 89.5%86.4%
83.3%80.0%
71.4% 66.7%
0.0%
20.0%
40.0%
60.0%
80.0%
100.0%
Perc
ent o
f Org
anis
atio
ns
FMC
G/F
MC
D
ITES
Fina
ncia
lSe
rvic
es
Phar
mac
eutic
al
Man
ufac
turin
g IT
Tele
com
Ser
vice
Aut
omot
ive/
Aut
oA
ncill
ary
24
[Title MM/DD/YYYY]
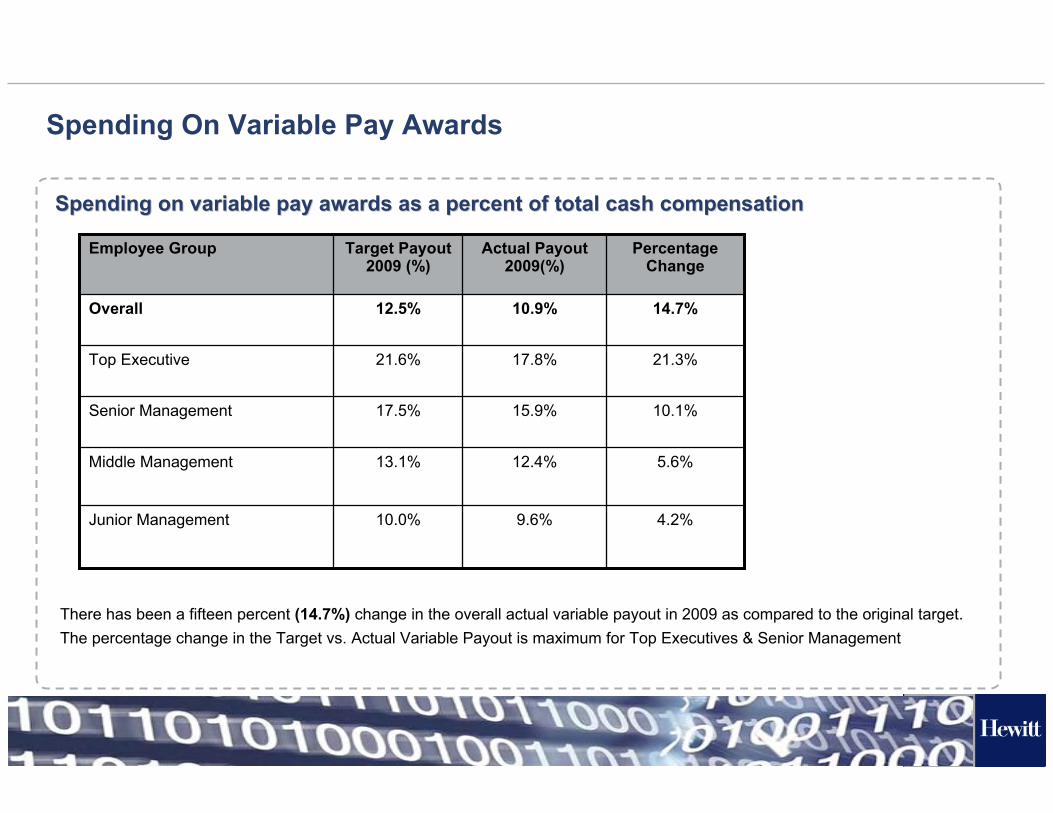
Spending On Variable Pay Awards
Spending on variable pay awards as a percent of total cash compeSpending on variable pay awards as a percent of total cash compensationnsation
9.6%
12.4%
15.9%
17.8%
10.9%
Actual Payout 2009(%)
4.2%
5.6%
10.1%
21.3%
14.7%
Percentage Change
10.0%Junior Management
13.1%Middle Management
17.5%Senior Management
21.6%Top Executive
12.5%Overall
Target Payout 2009 (%)
Employee Group
There has been a fifteen percent (14.7%) change in the overall actual variable payout in 2009 as compared to the original target. The percentage change in the Target vs. Actual Variable Payout is maximum for Top Executives & Senior Management
25
[Title MM/DD/YYYY]
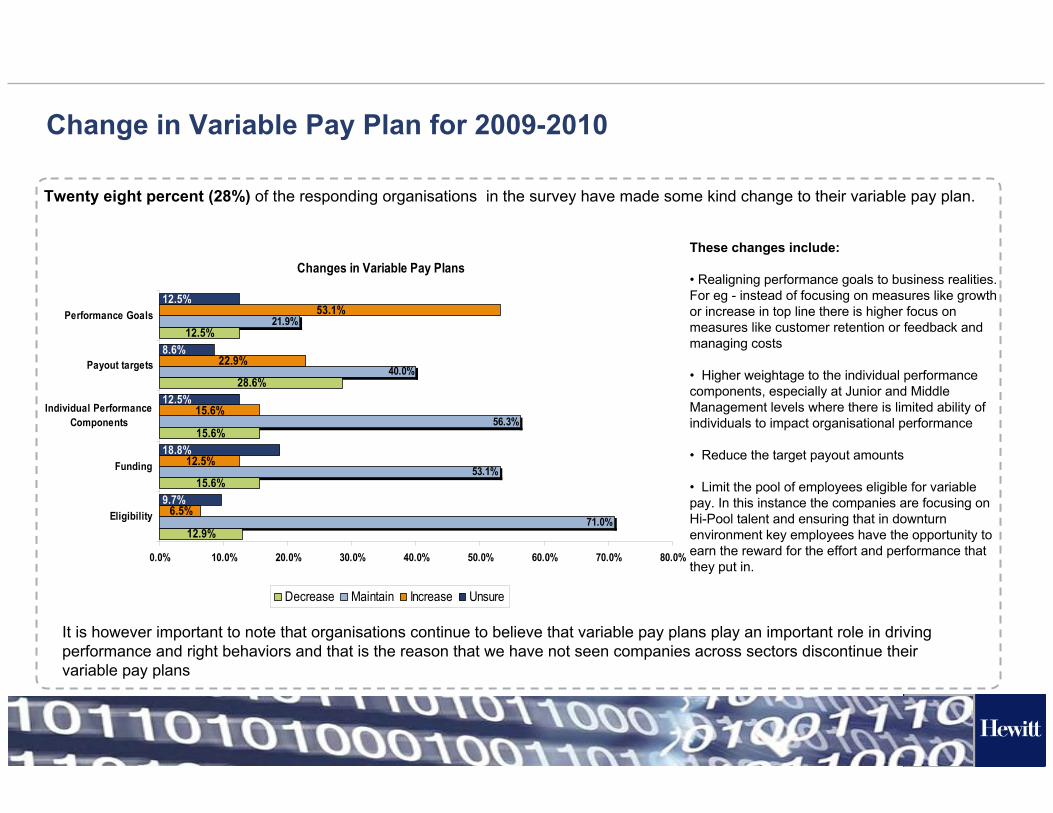
Change in Variable Pay Plan for 2009-2010
Changes in Variable Pay Plans
12.9%
28.6%
12.5%
71.0%
53.1%
21.9%
15.6%
22.9%
18.8%
12.5%
15.6%
15.6%
56.3%
40.0%
53.1%
6.5%
12.5%
9.7%
8.6%
12.5%
0.0% 10.0% 20.0% 30.0% 40.0% 50.0% 60.0% 70.0% 80.0%
Eligibility
Funding
Individual PerformanceComponents
Payout targets
Performance Goals
Decrease Maintain Increase Unsure
These changes include:
• Realigning performance goals to business realities. For eg - instead of focusing on measures like growth or increase in top line there is higher focus on measures like customer retention or feedback and managing costs
• Higher weightage to the individual performance components, especially at Junior and Middle Management levels where there is limited ability of individuals to impact organisational performance
• Reduce the target payout amounts
• Limit the pool of employees eligible for variable pay. In this instance the companies are focusing on Hi-Pool talent and ensuring that in downturn environment key employees have the opportunity to earn the reward for the effort and performance that they put in.
Twenty eight percent (28%) of the responding organisations in the survey have made some kind change to their variable pay plan.
It is however important to note that organisations continue to believe that variable pay plans play an important role in drivingperformance and right behaviors and that is the reason that we have not seen companies across sectors discontinue their variable pay plans

26
[Title MM/DD/YYYY]
Layoffs
27
[Title MM/DD/YYYY]
Layoffs in 2008 Layoffs in 2008 -- 20092009
Layoffs
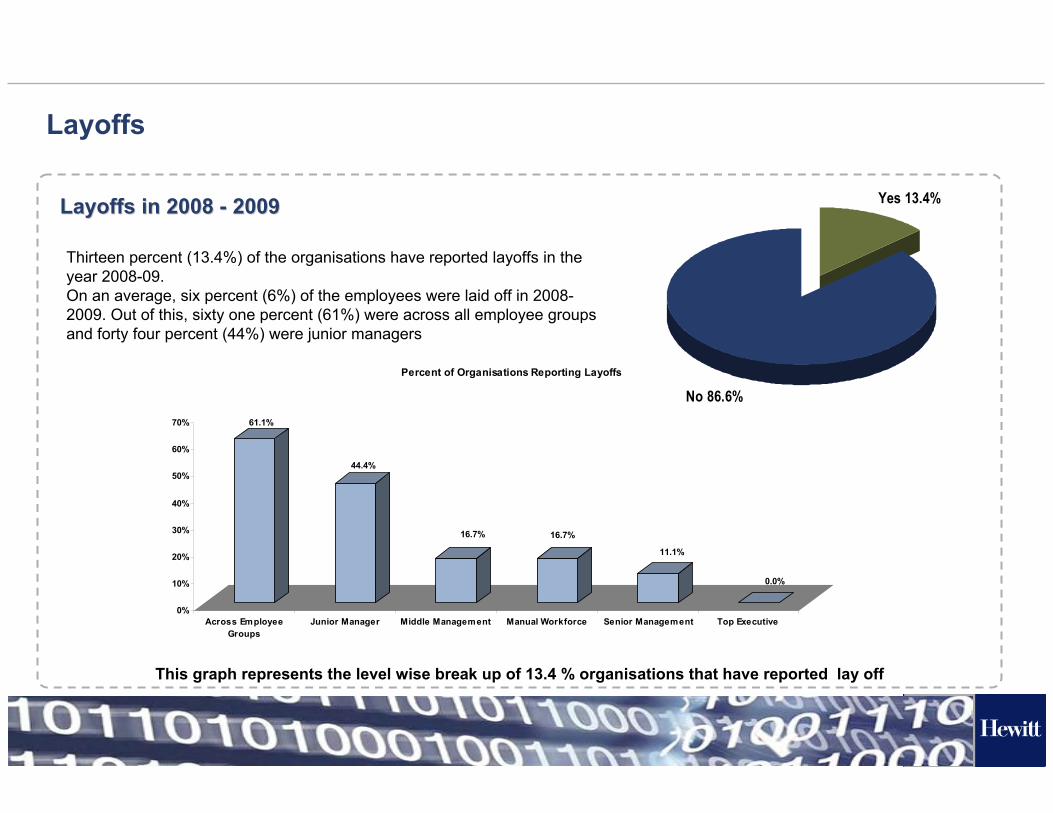
Thirteen percent (13.4%) of the organisations have reported layoffs in the year 2008-09.On an average, six percent (6%) of the employees were laid off in 2008-2009. Out of this, sixty one percent (61%) were across all employee groups and forty four percent (44%) were junior managers
61.1%
44.4%
16.7% 16.7%
11.1%
0.0%
0%
10%
20%
30%
40%
50%
60%
70%
Across EmployeeGroups
Junior Manager Middle Management Manual Workforce Senior Management Top Executive
Percent of Organisations Reporting Layoffs
Yes 13.4%
No 86.6%
This graph represents the level wise break up of 13.4 % organisations that have reported lay off
28
[Title MM/DD/YYYY]
Layoffs in 2009 Layoffs in 2009 -- 20102010
Layoffs
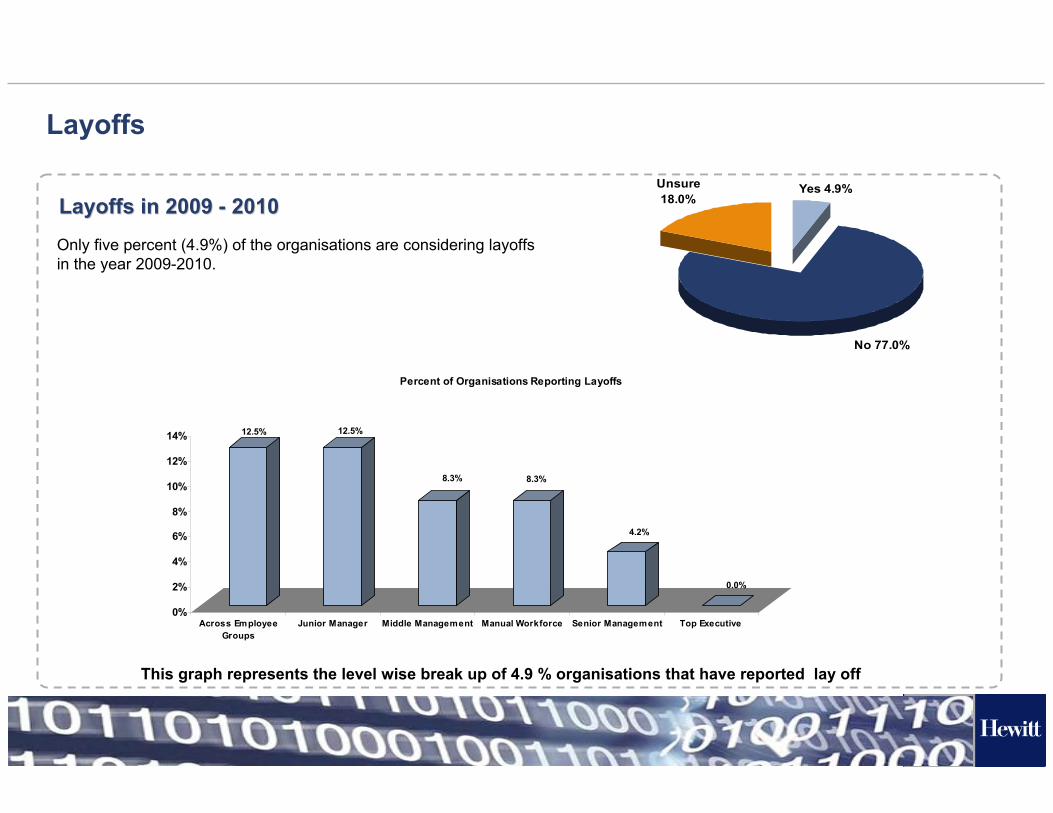
Only five percent (4.9%) of the organisations are considering layoffs in the year 2009-2010.
Yes 4.9%
No 77.0%
Unsure 18.0%
12.5% 12.5%
8.3% 8.3%
4.2%
0.0%
0%
2%
4%
6%
8%
10%
12%
14%
Across EmployeeGroups
Junior Manager Middle Management Manual Workforce Senior Management Top Executive
Percent of Organisations Reporting Layoffs
This graph represents the level wise break up of 4.9 % organisations that have reported lay off

29
[Title MM/DD/YYYY]
Attrition
30
[Title MM/DD/YYYY]
Overall Attrition by IndustryOverall Attrition by Industry
Attrition
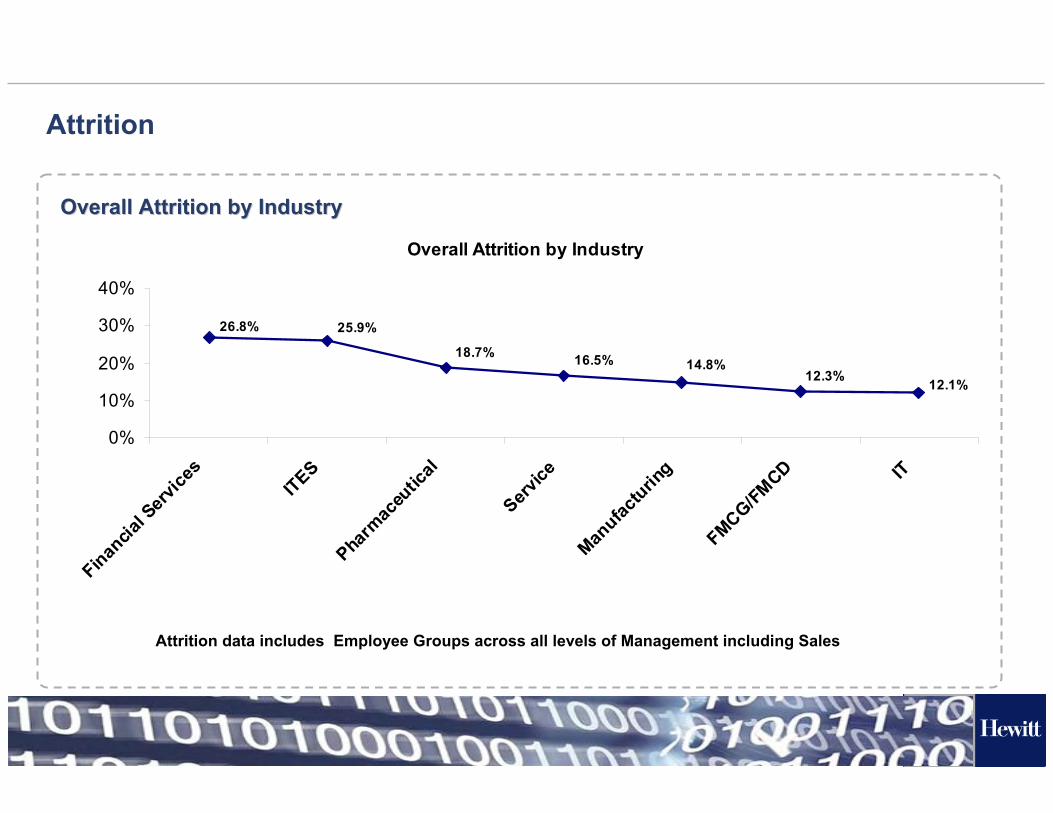
Overall Attrition by Industry
26.8% 25.9%
18.7% 16.5% 14.8%12.3% 12.1%
0%
10%
20%
30%
40%
Financia
l Serv
ices
ITES
Pharm
aceu
tical
Service
Manufac
turing
FMCG/FMCD IT
Attrition data includes Employee Groups across all levels of Management including Sales
31
[Title MM/DD/YYYY]
Overall Attrition by Industry and Employee GroupOverall Attrition by Industry and Employee Group
Attrition
- -- 13.6%
12.5% -- 26.3%
12.2% 15.1%Service Sector
- -- -- -- - -- -
19.1% 13.3%
15.0% 14.5%
13.5%12.7%10.1%
-13.4%16.1%
11.3%
12.0%
11.6%
--
12.0%--
13.3%
16.5%
17.6%
16.1%
13.7%16.3%14.2%11.6%
14.0%
19.1%11.2%
26.8%12.1%25.9%
-
-18.7%12.3%
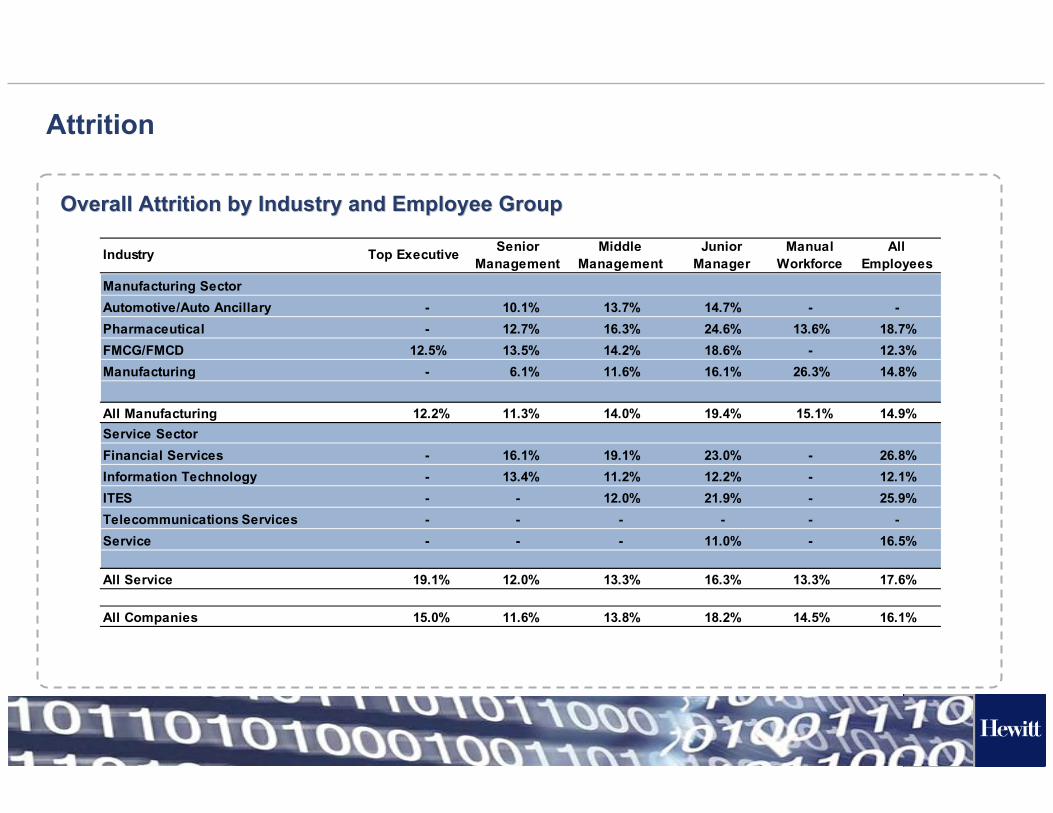
Industry Top Executive Senior Management
Middle Management
Junior Manager
Manual Workforce
All Employees
Manufacturing SectorAutomotive/Auto AncillaryPharmaceuticalFMCG/FMCDManufacturing 14.8%6.1%
All Manufacturing 14.9%19.4%
Financial ServicesInformation TechnologyITESTelecommunications ServicesService
All Service
All Companies 13.8%
14.7%24.6%18.6%16.1%
16.3%
18.2%
23.0%
21.9%
11.0%
12.2%
32
[Title MM/DD/YYYY]
Participant List
33
[Title MM/DD/YYYY]
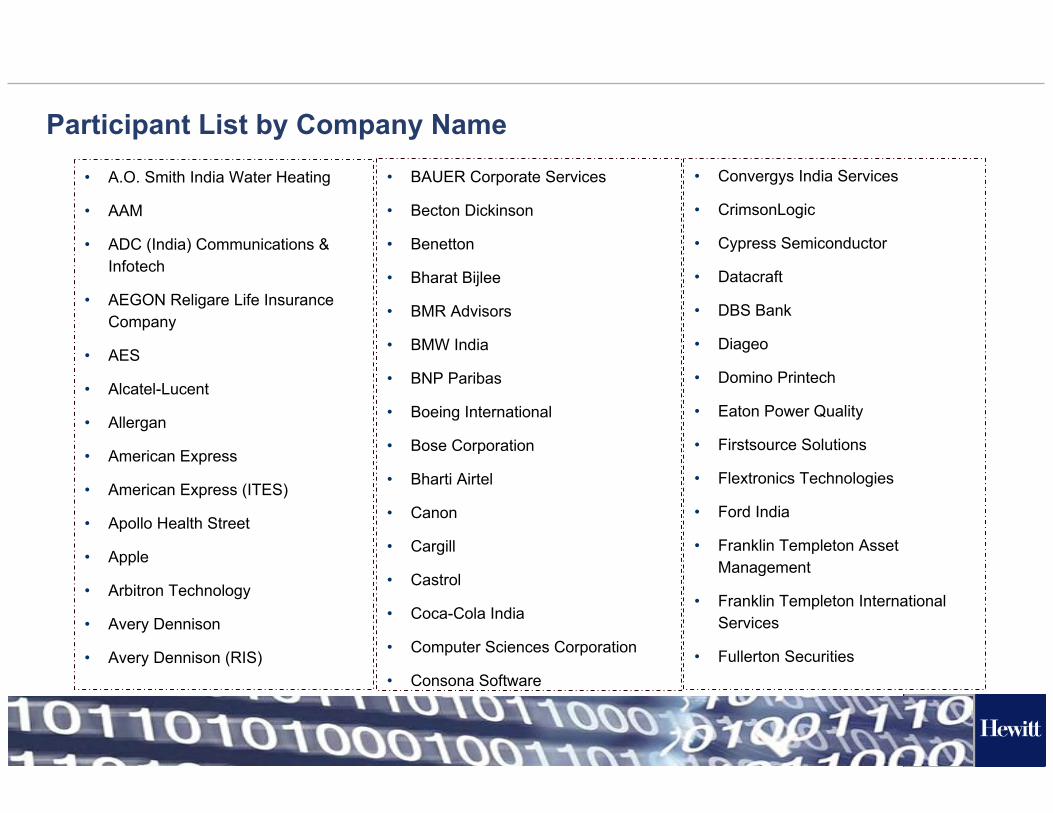
• A.O. Smith India Water Heating
• AAM
• ADC (India) Communications & Infotech
• AEGON Religare Life Insurance Company
• AES
• Alcatel-Lucent
• Allergan
• American Express
• American Express (ITES)
• Apollo Health Street
• Apple
• Arbitron Technology
• Avery Dennison
• Avery Dennison (RIS)
• BAUER Corporate Services
• Becton Dickinson
• Benetton
• Bharat Bijlee
• BMR Advisors
• BMW India
• BNP Paribas
• Boeing International
• Bose Corporation
• Bharti Airtel
• Canon
• Cargill
• Castrol
• Coca-Cola India
• Computer Sciences Corporation
• Consona Software
• Convergys India Services
• CrimsonLogic
• Cypress Semiconductor
• Datacraft
• DBS Bank
• Diageo
• Domino Printech
• Eaton Power Quality
• Firstsource Solutions
• Flextronics Technologies
• Ford India
• Franklin Templeton Asset Management
• Franklin Templeton International Services
• Fullerton Securities
Participant List by Company Name
34
[Title MM/DD/YYYY]
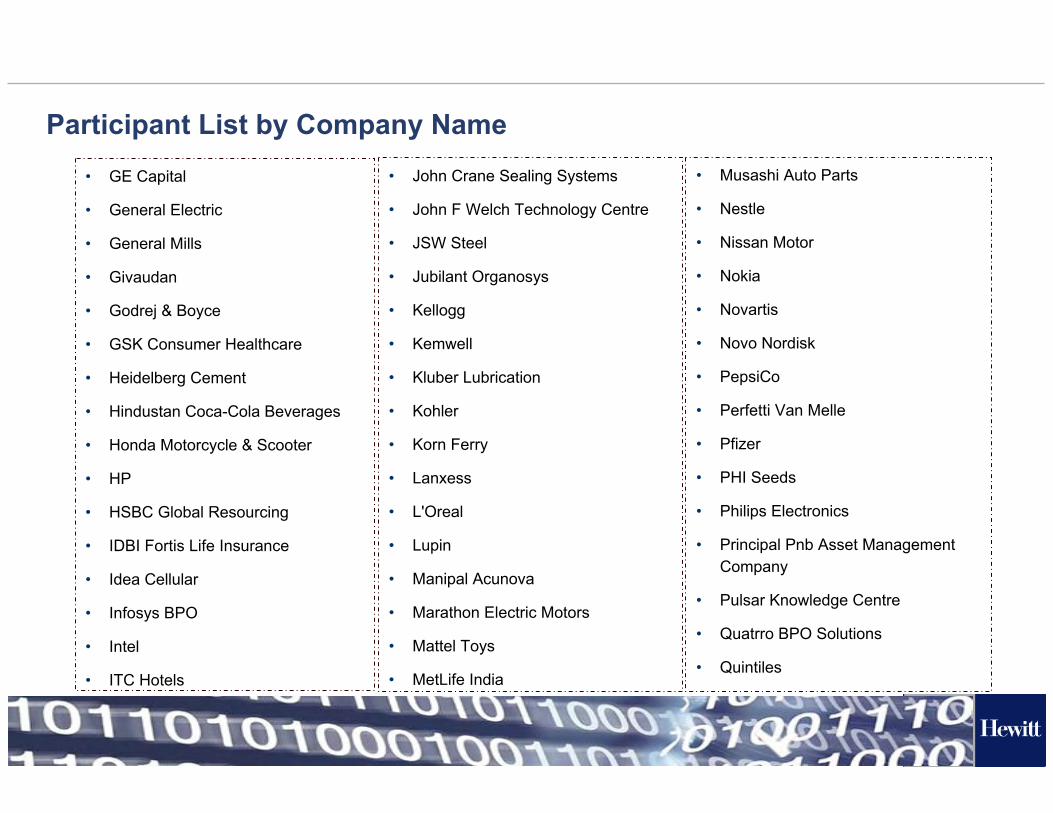
• GE Capital
• General Electric
• General Mills
• Givaudan
• Godrej & Boyce
• GSK Consumer Healthcare
• Heidelberg Cement
• Hindustan Coca-Cola Beverages
• Honda Motorcycle & Scooter
• HP
• HSBC Global Resourcing
• IDBI Fortis Life Insurance
• Idea Cellular
• Infosys BPO
• Intel
• ITC Hotels
• John Crane Sealing Systems
• John F Welch Technology Centre
• JSW Steel
• Jubilant Organosys
• Kellogg
• Kemwell
• Kluber Lubrication
• Kohler
• Korn Ferry
• Lanxess
• L'Oreal
• Lupin
• Manipal Acunova
• Marathon Electric Motors
• Mattel Toys
• MetLife India
• Musashi Auto Parts
• Nestle
• Nissan Motor
• Nokia
• Novartis
• Novo Nordisk
• PepsiCo
• Perfetti Van Melle
• Pfizer
• PHI Seeds
• Philips Electronics
• Principal Pnb Asset Management Company
• Pulsar Knowledge Centre
• Quatrro BPO Solutions
• Quintiles
Participant List by Company Name
35
[Title MM/DD/YYYY]
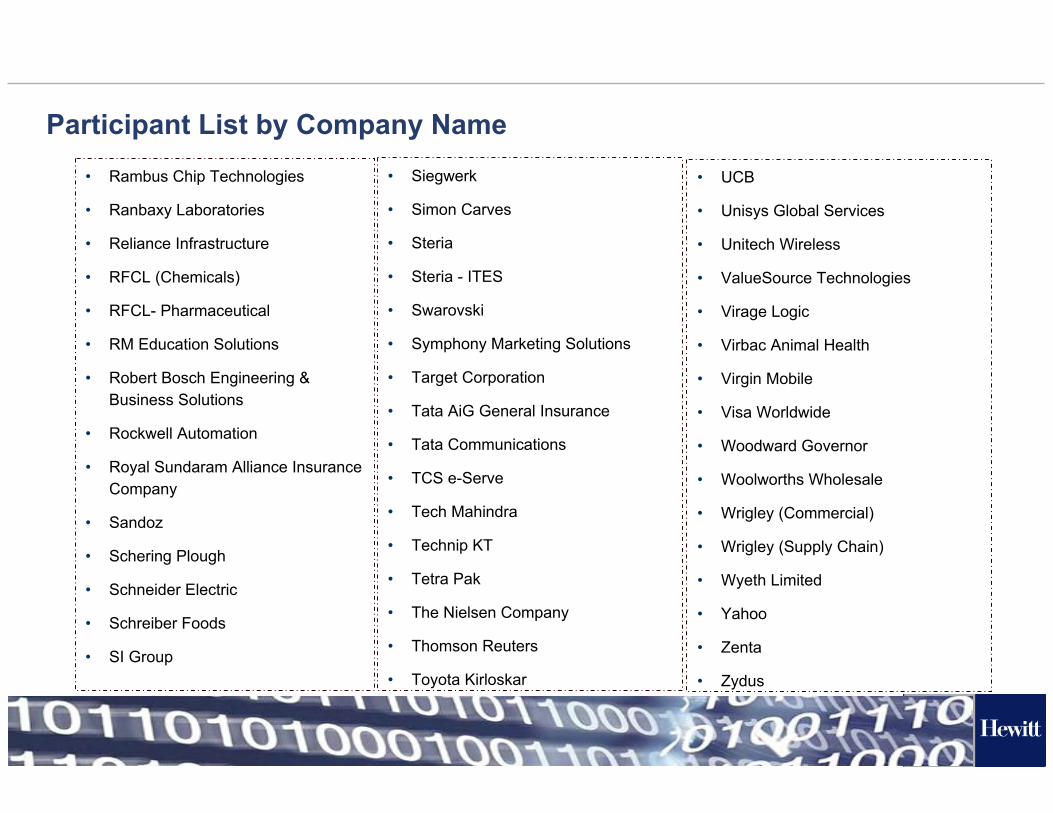
• Rambus Chip Technologies
• Ranbaxy Laboratories
• Reliance Infrastructure
• RFCL (Chemicals)
• RFCL- Pharmaceutical
• RM Education Solutions
• Robert Bosch Engineering & Business Solutions
• Rockwell Automation
• Royal Sundaram Alliance Insurance Company
• Sandoz
• Schering Plough
• Schneider Electric
• Schreiber Foods
• SI Group
• Siegwerk
• Simon Carves
• Steria
• Steria - ITES
• Swarovski
• Symphony Marketing Solutions
• Target Corporation
• Tata AiG General Insurance
• Tata Communications
• TCS e-Serve
• Tech Mahindra
• Technip KT
• Tetra Pak
• The Nielsen Company
• Thomson Reuters
• Toyota Kirloskar
• UCB
• Unisys Global Services
• Unitech Wireless
• ValueSource Technologies
• Virage Logic
• Virbac Animal Health
• Virgin Mobile
• Visa Worldwide
• Woodward Governor
• Woolworths Wholesale
• Wrigley (Commercial)
• Wrigley (Supply Chain)
• Wyeth Limited
• Yahoo
• Zenta
• Zydus
Participant List by Company Name
36
[Title MM/DD/YYYY]
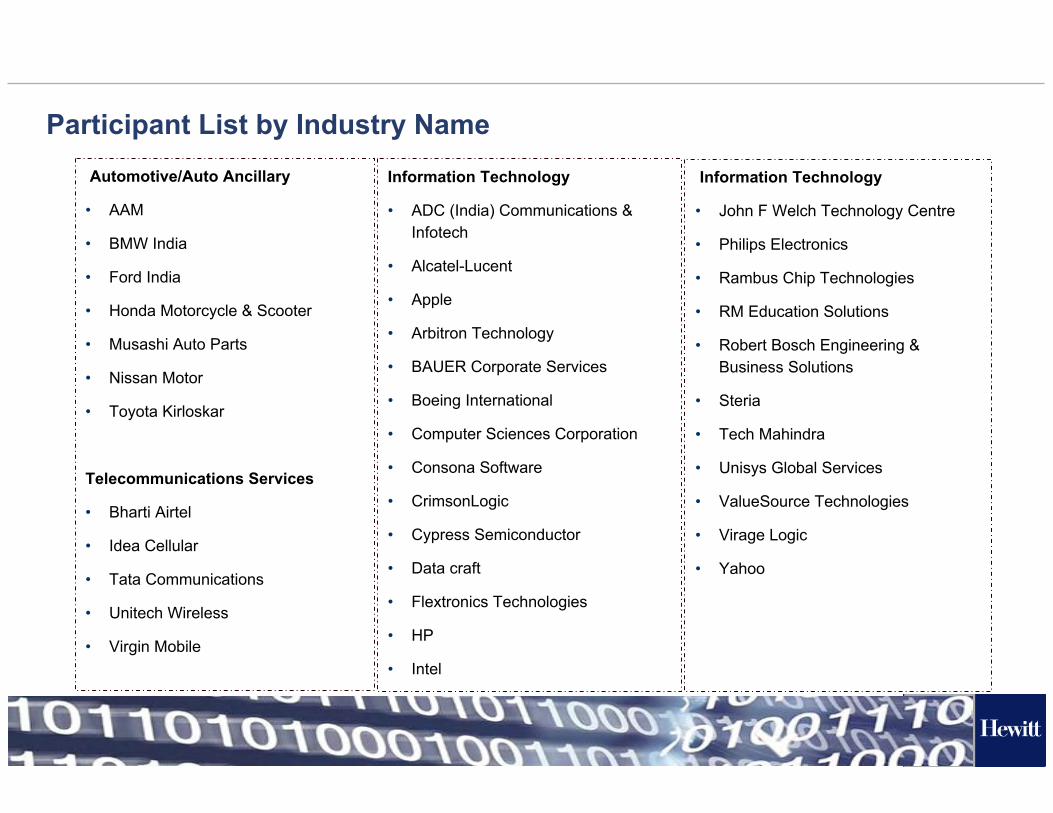
Automotive/Auto Ancillary
• AAM
• BMW India
• Ford India
• Honda Motorcycle & Scooter
• Musashi Auto Parts
• Nissan Motor
• Toyota Kirloskar
Telecommunications Services
• Bharti Airtel
• Idea Cellular
• Tata Communications
• Unitech Wireless
• Virgin Mobile
Information Technology
• ADC (India) Communications & Infotech
• Alcatel-Lucent
• Apple
• Arbitron Technology
• BAUER Corporate Services
• Boeing International
• Computer Sciences Corporation
• Consona Software
• CrimsonLogic
• Cypress Semiconductor
• Data craft
• Flextronics Technologies
• HP
• Intel
Information Technology
• John F Welch Technology Centre
• Philips Electronics
• Rambus Chip Technologies
• RM Education Solutions
• Robert Bosch Engineering & Business Solutions
• Steria
• Tech Mahindra
• Unisys Global Services
• ValueSource Technologies
• Virage Logic
• Yahoo
Participant List by Industry Name
37
[Title MM/DD/YYYY]
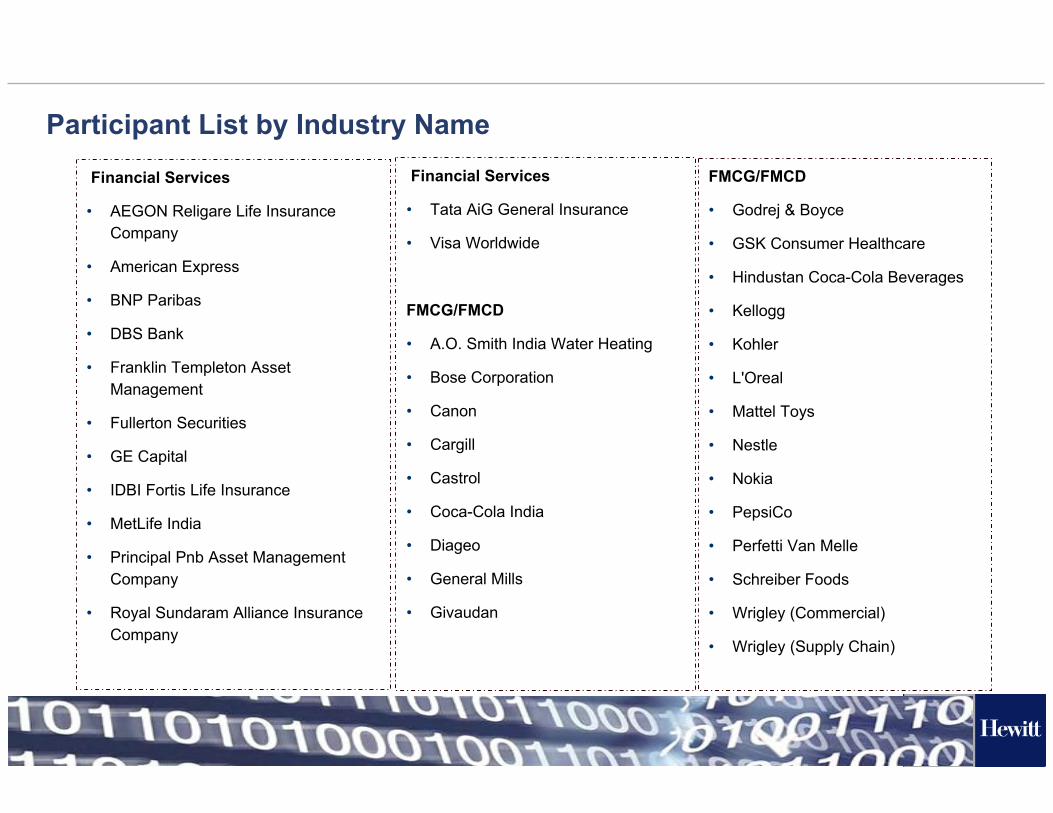
Financial Services
• AEGON Religare Life Insurance Company
• American Express
• BNP Paribas
• DBS Bank
• Franklin Templeton Asset Management
• Fullerton Securities
• GE Capital
• IDBI Fortis Life Insurance
• MetLife India
• Principal Pnb Asset Management Company
• Royal Sundaram Alliance Insurance Company
Financial Services
• Tata AiG General Insurance
• Visa Worldwide
FMCG/FMCD
• A.O. Smith India Water Heating
• Bose Corporation
• Canon
• Cargill
• Castrol
• Coca-Cola India
• Diageo
• General Mills
• Givaudan
FMCG/FMCD
• Godrej & Boyce
• GSK Consumer Healthcare
• Hindustan Coca-Cola Beverages
• Kellogg
• Kohler
• L'Oreal
• Mattel Toys
• Nestle
• Nokia
• PepsiCo
• Perfetti Van Melle
• Schreiber Foods
• Wrigley (Commercial)
• Wrigley (Supply Chain)
Participant List by Industry Name
38
[Title MM/DD/YYYY]
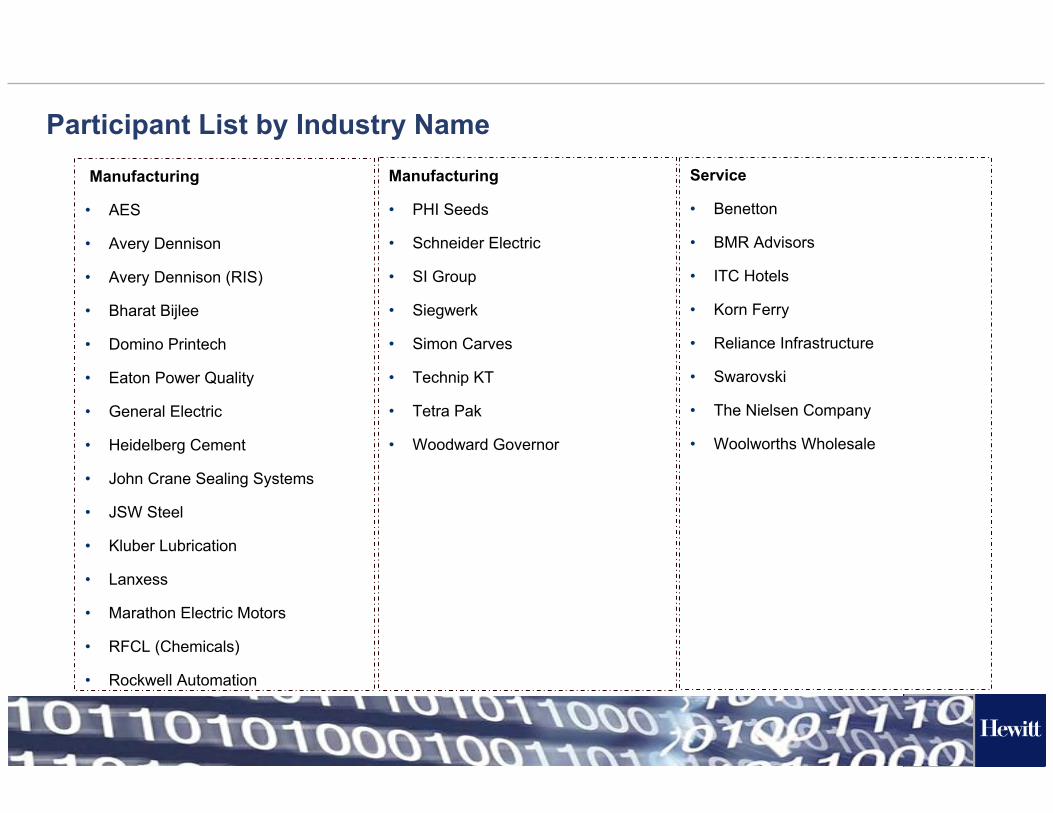
Manufacturing
• AES
• Avery Dennison
• Avery Dennison (RIS)
• Bharat Bijlee
• Domino Printech
• Eaton Power Quality
• General Electric
• Heidelberg Cement
• John Crane Sealing Systems
• JSW Steel
• Kluber Lubrication
• Lanxess
• Marathon Electric Motors
• RFCL (Chemicals)
• Rockwell Automation
Manufacturing
• PHI Seeds
• Schneider Electric
• SI Group
• Siegwerk
• Simon Carves
• Technip KT
• Tetra Pak
• Woodward Governor
Service
• Benetton
• BMR Advisors
• ITC Hotels
• Korn Ferry
• Reliance Infrastructure
• Swarovski
• The Nielsen Company
• Woolworths Wholesale
Participant List by Industry Name
39
[Title MM/DD/YYYY]
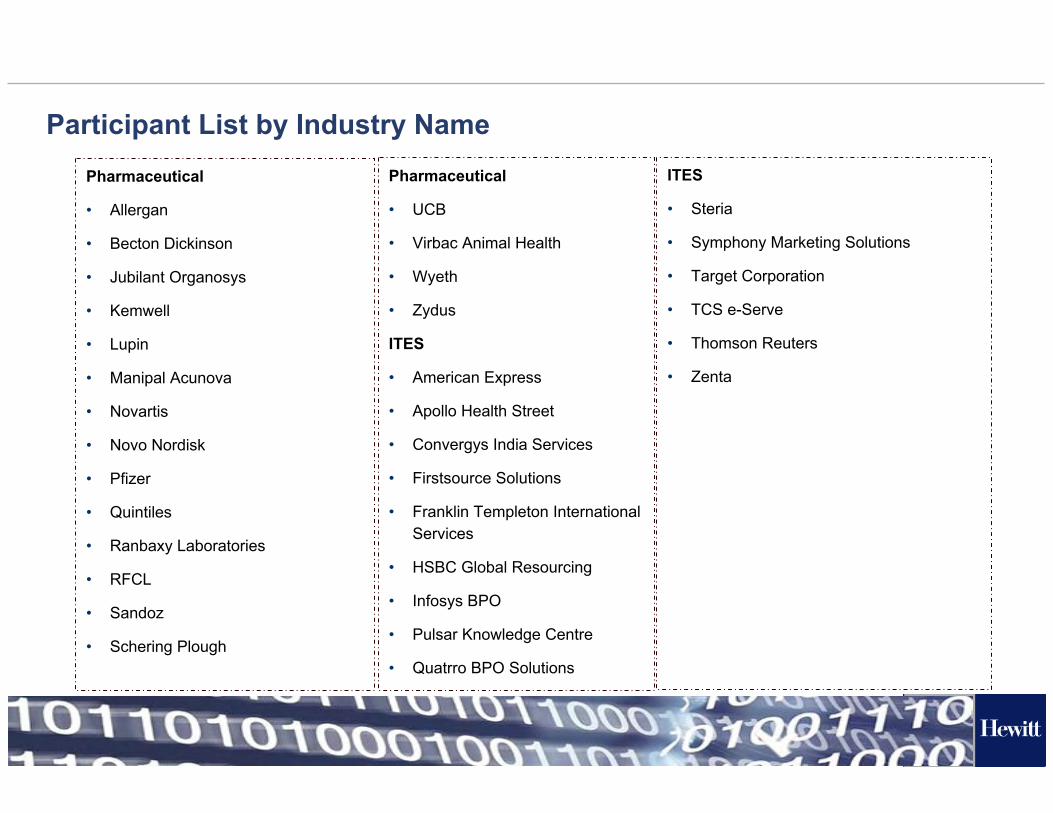
Pharmaceutical
• Allergan
• Becton Dickinson
• Jubilant Organosys
• Kemwell
• Lupin
• Manipal Acunova
• Novartis
• Novo Nordisk
• Pfizer
• Quintiles
• Ranbaxy Laboratories
• RFCL
• Sandoz
• Schering Plough
Pharmaceutical
• UCB
• Virbac Animal Health
• Wyeth
• Zydus
ITES
• American Express
• Apollo Health Street
• Convergys India Services
• Firstsource Solutions
• Franklin Templeton International Services
• HSBC Global Resourcing
• Infosys BPO
• Pulsar Knowledge Centre
• Quatrro BPO Solutions
ITES
• Steria
• Symphony Marketing Solutions
• Target Corporation
• TCS e-Serve
• Thomson Reuters
• Zenta
Participant List by Industry Name
40
[Title MM/DD/YYYY]
Thank you for your Participation.
For any further queries, please feel free to reach out to the Survey Coordinator:
Mehak Awasthy, [email protected],
or send a mail to: [email protected]
Thank You!!