Embed Size (px)
Citation preview

- 1 -
Migration and Mental Health: Evidence from a Natural Experiment#
Steven Stillman, Motu Economic and Public Policy Research David McKenzie, Development Research Group, World Bank*
John Gibson, University of Waikato
Abstract
People migrate to improve their well-being. Yet a large literature suggests that migration can be a stressful process, with potentially negative impacts on mental health. However, to truly understand the effect of migration one must compare the mental health of migrants to what their mental health would be had they stayed in their home country. The existing literature is not able to do this. New Zealand allows a quota of Tongans to immigrate each year with a random ballot used to choose amongst the excess number of applicants. Experimental estimates of the mental health effects of migration are obtained by comparing the mental health of migrants who were successful applicants in the random ballot to the mental health of those who applied to migrate under the quota, but whose names were not drawn. Migration is found to lead to improvements in mental health, particularly for women and those with poor mental health. Keywords: Migration, Mental Health, Natural Experiment JEL codes: J61, I12, F22, O12
# We thank the Government of the Kingdom of Tonga for permission to conduct the survey there, the New Zealand Department of Labour Workforce Group for providing the sampling frame, Halahingano Rohorua and her assistants for excellent work conducting the survey, and most especially the survey respondents. The editor, a referee, Mary Adams and participants at the PAA conference provided helpful comments. Financial support from the World Bank, Stanford University, the Waikato Management School and Marsden Fund grant UOW0503 is gratefully acknowledged. The study was approved by the multi-region ethics committee of the New Zealand Ministry of Health. The views expressed here are those of the authors alone and do not necessarily reflect the opinions of the World Bank, the New Zealand Department of Labour, or the Government of Tonga. * Corresponding author: MSN MC3-300, 1818 H Street N.W., Washington, DC 20433, USA. E-mail: [email protected]. Fax (202) 522-1155.

- 2 -
1. Introduction
People migrate to improve their well-being. Economic migrants moving from a developing to a
developed country will generally experience large gains in material well-being as they take
advantage of higher wages abroad. However, the effects of migration on other dimensions of
well-being are less clear. In particular, the process of moving from one cultural setting to another
can be a very stressful process, with potentially negative impacts on mental health (Bhugra and
Jones, 2001). In fact, the World Health Organization (2001, p.13) goes as far to claim “usually
migration does not bring improved social well-being; rather…it often results in…exposing
migrants to social stress and increased risk of mental disorders”. To the extent that these mental
health changes reduce the net benefits of migration they are of potential interest to economists,
especially because there are strong economic arguments for increasing international migration
(World Bank, 2005).
However, migration also has a number of effects that may improve mental health.
Although recent evidence suggests there is little association between income levels and mental
health in developing countries (Das et al, 2007), it is argued that immigrants may experience a
deep sense of fulfillment in the short-term by using their new-found wealth to contribute to their
extended family, village and church at home (Foliaki, 1998). Migrants may also experience
mental health improvements from a change in cultural setting, which allows them to shed the
burden of social restrictions that caused them to be anxious or depressed in their home countries.
To truly understand the effect of migration on mental health one must compare the
mental health of migrants to what their mental health would have been had they stayed in their
home country. However, the existing literature is not able to do this. The majority of studies
compare the mental health of immigrants to those of natives.1 Such comparisons take no account
of any pre-existing differences between immigrants from developing countries and natives in
these developed countries.2 While a few studies have made comparisons between movers and
stayers from the same country (Ödegaard, 1932 and Maveras and Bebbington, 1988), these
1 For example, Muynck (1997), as cited in Carballo, Divino and Zeric (1998), finds that during the period of resettlement, Moroccan immigrants in Belgium are five times more likely to develop peptic ulcers than Belgian nationals, Bhugra (2004b) reviews a series of studies which find higher rates of schizophrenia among African-Caribbean immigrants in the UK than among white British natives, and Nazroo (1997) finds lower rates of emotional disorders and depression among immigrants from South Asia in the UK than among native-born whites. 2 A further problem is that many of these studies compare clinical populations, and therefore are faced with the further selection issue of whether immigrants and natives are equally likely to use clinical facilities.

- 3 -
studies are also unable to control for the potential selection bias that will occur if unobserved
characteristics which increase the propensity to migrate are also associated with either higher or
lower risks of mental health disorders.
The direction of this bias is unclear since mental illnesses may lead to restlessness and
hence make individuals more likely to migrate, but on the other hand, since long-distance
migration is a complicated event, individuals with worse mental health may not be able to handle
the processes needed to emigrate (Bhugra, 2004b). VanLandingham and Fu (2007) is the only
paper we know of which attempts to deal with this selection, by comparing Vietnamese
immigrants in New Orleans to never-leavers in Vietnam and to returnees in Vietnam who
initially made it to a country of first asylum but were then repatriated because they could not
show a bona fide risk of persecution in Vietnam. While the returnees provide a comparison
group in Vietnam of individuals who also wished to migrate, forced repatriation is unlikely to be
a random event and likely has its own direct impact on mental health, thus this group provides a
less than ideal control group.
This paper overcomes the selection problems affecting these previous studies by
examining Tongans who migrate to New Zealand through the Pacific Access Category (PAC).
The PAC allows an annual quota of Tongans to migrate to New Zealand, additional to those
approved through other migration categories such as skilled migrants and family streams. Many
more applications are received than the quota allows, so a ballot is used to randomly select from
among the registrations. A unique survey conducted by the authors in both Tonga and New
Zealand allows experimental estimates of the mental health effects of migration to be obtained
by comparing the mental health of migrants who were successful applicants in the ballot to the
mental health of those who applied to migrate under the quota, but whose names were not drawn.
We are also able to compare the mental health of applicants to this migration program to that of
non-applicants, examining the role of selection.
Our measure of mental health is the MHI-5 of Veit and Ware (1983), a measure of mental
health for the general population, which is useful for detecting depression, anxiety, and general
affective disorders. Our results show that despite being positively selected in terms of education,
Tongans with worse mental health are more likely to apply to migrate to New Zealand. We find
that there are large and significant positive effects of migration on mental well-being. We also
extend on the current literature, by allowing migration to have non-uniform impacts on mental

- 4 -
health and find that migration has larger impacts on women and on individuals with poor mental
health. Thus, rather than there being a mental health cost offsetting some of the economic gains
from migration in an overall welfare assessment, these results suggest that migration brings
positive benefits beyond economic gains.
Public and policy discussions about migration often express significant concern about
possible negative social and mental health effects of migration on the migrants, with little hard
evidence. Our paper provides the first cleanly identified estimate of the short-term impact of
migration on mental health in any context, showing that, at least for Tongans moving to New
Zealand, migration is also accompanied by mental health gains. The natural question which
arises is then how generalizable these results are to other settings. There are a variety of types of
migration, including permanent migration for work, refugees, political asylees, seasonal workers,
and forced migrants, and it seems unlikely the mental health effects will be the same for all
groups.
Our study concerns the short-term impact of individuals migrating for work with their
immediate family from a developing to a much richer developed country. This is one of the most
common forms of migration worldwide. Moreover, Tongan migrants are similar in several
important respects to the average developing country emigrant moving to work in a rich country.
They work in jobs such as construction, cleaning, and retail services frequented by immigrants
worldwide. The average Tongan in our sample has 11.7 years of education, compared to 11.0
years for the average 18 to 45 year-old new immigrant in the US, and Tongans exhibit a similar
degree of positive selection on schooling as found among Mexican migrants moving to the US.
As such, the results of this study may well generalize to other developing country economic
migrants.
2. The Association between Mental Health and Migration
Since the classic study of Ödegaard (1932), which found higher hospital admission rates for
schizophrenia among Norwegians who had migrated to the United States than those who stayed
in Norway, it has been generally presumed in the literature that migration is harmful for mental
health. For example, according to Pernice et al, (2000, p. 24)
“the adverse effects on mental health of migration have been widely researched and
established”.

- 5 -
Much of the clinical literature concentrates on schizophrenia, where five hypotheses are
suggested for the apparently high incidence rates amongst migrants (Cochrane and Bal, 1987):
1. sending countries have high rates of schizophrenia,
2. schizophrenia predisposes people to migrate,
3. the process of migration produces stress and elevated rates of schizophrenia,
4. certain cultural practices of migrant groups get misdiagnosed as schizophrenia, and
5. some symptoms of schizophrenia are more common amongst the cultures that migrants
are from.
There is debate about the strength of each of these hypotheses. Moreover, they illustrate the
difficulties associated with ascribing a causal role to migration. Most studies in the literature
compare immigrants to natives. However, if people from different countries have different rates
of mental illness (explanation 1), or different probabilities of getting diagnosed (explanations 4
and 5), then these will confound the effect of migration. Studies which compare migrants and
non-migrants from the same country still face the problem of distinguishing selection
(explanation 2) from causation (explanation 3).
Bhugra (2004a, b) notes that the evidence is less clear cut when one considers common
mental disorders such as anxiety and depression, with some studies finding higher incidences in
immigrant groups than among natives, and others the opposite. Similar mixed results are found
among immigrants to New Zealand. Pernice and Brook (1994) find the mental health of a sample
of Pacific Island immigrants in New Zealand to be as low as that of a sample of Southeast Asian
refugees, and significantly lower than that of British immigrants. In contrast, Graves and Graves
(1985) surveyed Samoans, Cook Islanders and native-born New Zealanders of European
background, and found the Pacific Islanders to have significantly fewer psychosomatic
symptoms of health problems than did the European New Zealanders.
Nevertheless, despite this mixed evidence, there are a number of hypotheses and theories
which suggest that migration should have a causal effect on mental health. Carta et al. (2007)
note that emigration involves far-reaching changes in practically everything that surrounds a
person, with changes in climate, language, culture, status, and social relations. They claim that
every person who migrates experiences affective loss. Depression may arise from this loss.
However, Bhugra (2004b) also notes that the genesis of depression can often lie in a sense of
entrapment and defeat. Individuals who feel trapped by limited job and social opportunities in

- 6 -
their home countries may therefore emerge out of depression when new opportunities open
through migration. The net effect is ultimately an empirical matter, requiring careful attention to
self-selection.
3. Context and Survey
3.1 Background
The Kingdom of Tonga is an archipelago of islands in the South Pacific, about two-thirds of the
way from Hawaii to New Zealand.3 The population is just over 100,000, with a GDP per capita
of approximately US$2,200 in PPP terms. One-third of the labor force is in agriculture and
fishing, with the majority of workers in the manufacturing and services sectors, which are
dominated by the public sector and tourism. Employment concerns are particularly prevalent
among youth, and appear to contribute to elevated levels of depression amongst this group
(UNICEF, 2001).4
Emigration levels are high, with 30,000 Tongans living abroad, primarily in New
Zealand, Australia and the United States. Migration to New Zealand began in sizeable numbers
during the 1960s and 1970s, with Tongans arriving on temporary permits to take up work
opportunities. After their permits expired, some returned to Tonga and others stayed on in New
Zealand illegally. An amnesty in 1976 granted many of these individuals permanent residence.
Migration for work continued in the late 1970s and 1980s, and by 1986 the Tongan population in
New Zealand had reached 13,600. However, in 1991, New Zealand introduced a selection
system for immigration, in which potential migrants are awarded points for education, skills, and
business capital. Few Tongans qualified to migrate under this system, and so most Tongan
migration during the 1990s was under family-sponsored categories – as the spouse, parent, or
child of an existing migrant. For example, in 1997/98 only 29 Tongans were admitted as
principal applicants under the points system, compared to 436 under family categories. With
family migration, the Tongan-born population in New Zealand had grown to 19,000 by the 2001
3 This sub-section is based on information from the CIA World Factbook (http://www.cia.gov/cia/publications/factbook/geos/tn.html) and from the Tongan Statistical Abstract 2006 (http://www.spc.int/prism/tongatest/StatisticalAbstract2006/AbsSection/lfm.pdf) 4 According to a UNICEF study, one-third of school age youth in Tonga reported experiencing severe sadness or depression in the previous six months. Almost one half of the sample felt it was unlikely or impossible that they would find a job upon leaving school (UNICEF, 2001).

- 7 -
Census. Migration to Australia and the United States has also become much more restrictive and
reliant on family reunification categories. Australia admitted 284 Tongans during the 2004/05
financial year.5 The United States admitted 324 Tongans in the 2004 calendar year, comprising
only 5 under employment-based preferences and 290 under immediate relative or family-
sponsored categories.6
3.2 The Pacific Access Category
In early 2002, another channel was opened up for immigration to New Zealand through the
creation of the Pacific Access Category (PAC), which allows for a quota of 250 Tongans to
emigrate to New Zealand each year without going through the usual migration categories used
for groups such as skilled migrants and business investors.7 Specifically, any Tongan citizens
aged between 18 and 45, who meet certain English, health and character requirements,8 can
register to migrate to New Zealand.9 Many more applications are received than the quota allows,
so a ballot is used by the New Zealand Department of Labour (DoL) to randomly select from
amongst the registrations. During the 2002-05 period we study, the odds of having one’s name
drawn were approximately one in ten. Individuals whose names are not selected can apply again
the next year.
Once their ballot is selected, applicants must provide a valid job offer in New Zealand
within six months in order to have their application to migrate approved. After a job offer is filed
along with their residence application, it typically takes three to nine months for an applicant to
receive a decision. Once receiving approval, they are then given up to one year to move. The
5 Source: Settler Arrivals 2004-2005, Australian Government Department of Immigration and Multicultural Affairs. 6 Source: 2004 Yearbook of Immigration Statistics, U.S. Department of Homeland Security Office of Immigration Statistics. 7 The Pacific Access Category also provides quotas for 75 citizens from Kiribati, 75 citizens from Tuvalu, and, prior to the December 2006 coup, 250 citizens from Fiji to migrate to New Zealand. There have been some changes in the conditions for migration under the Pacific Access Category since the period we examine in this paper (see Gibson and McKenzie (2007) for details) – here we describe the conditions that applied for the potential migrants studied in this paper. 8 Data supplied by the New Zealand Department of Labour for residence decisions made between November 2002 and October 2004 reveals that out of 98 applications only 1 was rejected for failure to meet the English requirement and only 3 others were rejected for failing other requirements of the policy. See McKenzie, Gibson and Stillman (2008) for more details on this policy. 9 The person who registers is a Principal Applicant. If they are successful, their immediate family (spouse and children under age 24) can also apply to migrate as Secondary Applicants. The quota of 250 applies to the total of Primary and Secondary Applicants and corresponds to about 70 migrant households.

- 8 -
median migrant in our sample moved within one month of receiving their residence approval. At
the time of our survey, the median migrant had spent 8 months in New Zealand (mean of 11
months). Thus, this paper examines the impact of migration on mental health in the short-term.
3.3 Survey Data
The data used in this paper are from the Tongan component of the Pacific Island-New Zealand
Migration Survey (PINZMS), a comprehensive household survey designed to measure multiple
aspects of the migration process and take advantage of the natural experiment provided by the
PAC.10 The survey design and enumeration, which was overseen by the authors in 2005-06,
covered random samples of four groups of households, surveying in both New Zealand and
Tonga.
The first group consists of a random sample of 101 of the 302 Tongan immigrant
households in New Zealand, who had a member who was a successful participant in the 2002-
2005 PAC ballots.11 Administrative data show that none of the ballot winners had returned to
live in Tonga at the time of the survey, nor had any of them after a further two years. The second
group consists of a sample of households of successful participants from the same random ballots
who were still in Tonga at the time of surveying. We sampled 26 of the 65 households in this
group, focusing our sampling on households located in villages from which the migrants in our
first survey group had emigrated. Most of this group consists of individuals whose applications
were still being processed at the time of surveying. In forming our experimental estimate, we
weight the sample so that it reflects the actual ratio of migrants to successful ballots still in
Tonga at the time of the survey.
The third survey group consists of households of unsuccessful participants in these same
ballots. The full list of unsuccessful ballots from these years was provided to us by the New
Zealand Department of Labour, but the details for this group were less informative than those for
the successful ballots, as only a post office box address was supplied and there were no
10 See www.pacificmigration.ac.nz for more details of the survey. 11 A large group of the immigrant households were unavailable for us to survey because they had been reserved for selection into the sample of the Longitudinal Immigrant Survey, conducted by Statistics New Zealand. In McKenzie et al. (2008), we describe in detail the tracking of the sample in New Zealand, showing a contact rate of over 70 percent. The main reasons for non-contact were incomplete name and address details, which should be independent of mental health and therefore not a source of sample selectivity bias. There was only one refusal to take part in the survey in New Zealand and none in Tonga.

- 9 -
telephone numbers. We used two strategies to derive a sample of 119 households with a member
with an unsuccessful ballots from this list, with this sample size again dictated by our available
budget. First, we used information on the villages where migrants had come from to draw a
sample of unsuccessful ballots from the same villages (implicitly using the village of residence
as a stratifying variable). Second, we used the Tongan telephone directory to find contact details
for people on the list. To overcome concerns that this would bias the sample to the main island of
Tongatapu, where people are more likely to have telephones, we deliberately included in the
sample households from the Outer Islands of Vava’u and ‘Eua.
The final survey group consists of households living in the same villages as the PAC
applicants but from which no eligible individuals applied for the quota in any of our sample
years (e.g. 2002-2005). We randomly selected 90 non-applicant households with at least one
member aged 18 to 45. This group will be used to examine selection into migration.
3.4 Measuring Mental Health
The same survey instruments were then administered to all four groups by the same survey team.
The survey collected data on employment, income and demographics for all household members,
along with detailed modules on health, remittances and the migration experience. Mental health
was measured using the Mental Health Inventory 5 (MHI-5) of Veit and Ware (1983).12 This is a
five item scale with a maximum score of 25 and minimum score of 5. Higher scores are desirable
in that they indicate the experience of psychological well-being and the absence of psychological
distress during the past month. The MHI-5 measure was developed for use in the general
population and has been used as part of general surveys of health and quality of life in addition to
specific studies on mental health. The measure compares well to other more detailed measures.
For example, Berwick et al. (1991) compared the screening accuracy of the MHI-5 with that of
the longer 18-item MHI, the 30-item version of the General Health Questionnaire (GHQ-30), and
a 28-item Somatic Symptom Inventory (SSI-28). The MHI-5 was found to be as good as the
MHI-18 and the GHQ-30, and better than the SSI-28, for detecting major depression, general
affective disorders, and anxiety disorders.
12 We use version 2, which is the mental health component of the 36 item short-form health survey (SF-36) which has been used in over 50 countries as part of the International Quality of Life Assessment project (http://www.sf-36.org). Appendix 1 lists the specific questions used in the MHI-5.

- 10 -
Different thresholds of the MHI-5 score correspond to different degrees of mental
distress. While there is no universal choice of a threshold, several studies of general populations
have used a cut-off of less than 17 as an indicator of major depression, and a cut-off of less than
19 as an indicator of poor mental health (Urban Institute, 1999; Yamazaki et al, 2005). In our
non-migrant sample, 6.5% of individuals have scores less than 17, 17.9% have scores below 18,
31.1% have scores below 19, and 48.7% have scores below 20. However, in the migrant sample,
only one person has a score less than 17 and five people have a score less than 18, thus in our
empirical models we consider threshold cut-offs of less than 19 and less than 20.
Mental health was collected for each individual aged 15 and over in the household.
However, since PAC migrants can only move with their spouse and dependent children, our
experimental estimates compare the mental health of the migrant, spouse, and children aged 15
and over to those of the principal applicant, spouse, and children aged 15 and over among PAC
ballot entrants still in Tonga.13 This results in sample sizes of 201 migrants, 56 ballot winners
still in Tonga, and 240 ballot losers in Tonga. All results are clustered at the household level and
weighted to represent the population of PAC ballot entrants.
4. Mental Health Patterns in Tonga
We begin by examining the correlates of mental health status for individuals aged 15 to 48
residing in Tonga, as estimated using the combined sample of unsuccessful ballot applicants,
successful ballot applicants still in Tonga, non-applicants and previous household members of
successful migrants now in NZ that are still in Tonga . These results will then be used later in the
paper as an aid to help understand the possible channels through which migration may be
affecting mental health. Table 1 presents the results of regressing the MHI-5 score on
socioeconomic characteristics of these respondents. These results are used merely to describe the
patterns present in the data, since many of the included independent variables, such as education,
13 In the overwhelming majority of cases, all family members who were eligible to move with the principal applicant did so. In our survey, only five age-eligible and relationship-eligible family members did not move to New Zealand simultaneously with the migration of the lottery winner. Four of these who stayed were children, three of whom were below age two. The one spouse who stayed was the mother of one of these young children. In our follow-up survey in 2008, we established that all of these young children and the spouse had subsequently moved to New Zealand. The only eligible teenager who stayed was 18 years old. This teenager had an age-ineligible sibling (aged 27) who stayed in the family dwelling in Tonga and we presume that the teenager choose to initially stay with their sibling rather than move with the parents to New Zealand. However, by the time of our follow-up survey in 2008, they had moved to New Zealand to join the parents.
- 11 -
labour force status, religion, and physical health may themselves be affected by mental health
status.
Column 1 presents a base regression, relating mental health status to some of the most
common correlates studied in the literature. Women are found to have significantly better mental
health than men. While this is in contrast to the patterns found in many other countries (Das et al.
2007), it is consistent with previous evidence from Tonga, at least amongst school-age youth
(UNICEF, 2001). Mental health declines with age (at least among the eligible age range for the
PAC). Mental health status is found to be worse for individuals born on the main island of
Tongatapu compared to those born on the other islands in Tonga, better for Catholics than those
of other religions and better for individuals that have previously visited New Zealand..
Column 2 then adds controls for household income, employment and physical health. We
see a positive and significant association between household income and mental health, and a
positive, but marginally significant association, between employment and mental health. A one
standard deviation increase in monthly total household income is associated with a 0.30 increase
(or 0.13 standard deviation) increase in mental health. There are no significant associations
between physical health status and mental health.
Columns 3 and 4 of Table 1 then estimate the correlates of mental health separately by
sex. Most of the variables have similar relationships with mental health for males and females.
However, we do find different relationships for a few. In particular, a 1,000 pa’anga increase in
annual household income is associated with a 0.015 increase in mental health for men and a
0.020 increase in mental health for women.14 Employment status also has a strong relationship
with mental health for women. Smoking is associated with worse mental health for men, but with
better mental health for women, while alcohol consumption is associated with worse mental
health for women but not men.
5. Self-Selection into Migration by Mental Health Status
One of the suggested explanations for finding worse mental health among migrants is that
individuals with mental disorders may be more likely to try and migrate. However, we are not
aware of any empirical study that has been able to test this hypothesis by comparing migrants
prior to emigration to non-migrants. The PINZMS data allows us to investigate this by
14 At the time of the survey, 1,000 pa’anga was equivalent to US$500 and NZ$730.

- 12 -
comparing the characteristics of unsuccessful applicants to the PAC, who wish to migrate to
New Zealand, with non-applicants, who do not.
Table 2 presents marginal effects from probit estimation of the likelihood that an
individual applies for the PAC as a function of their characteristics. It compares the sample of
non-applicants aged 18 to 45 to the sample of principal applicants with unsuccessful ballots, who
provide a random sample of people who want to migrate to New Zealand. Column 1 considers
selection into the PAC without conditioning on mental health. Individuals who are employed, not
married, with more education, who have previously visited New Zealand and who were born on
Tongatapu are more likely to apply to migrate. The peak age for applying is 38. Column 2 then
shows that conditional on these other observed characteristics, individuals with lower MHI-5
scores are more likely to apply to the PAC ballot. Since higher MHI-5 scores indicate better
mental health, the point estimate shows negative selection into migration. Columns 2 and 3
consider cutoffs of less than 19 and less than 20 for mental health scores, which are similar to the
cutoffs used in other studies to indicate poor mental health. Again, we find a strong and
significant impact of mental health on migration. Individuals with poor mental health are 19 to
20 percentage points more likely to apply to migrate, even after conditioning on their age,
gender, education, marital status, employment status, and household income per capita.
6. The Effect of Migration on Mental Health
6.1. Estimating Treatment Effects using Experimental Data
The remainder of this paper focuses on estimating the impact of migration to New Zealand on
the mental health of Tongans. To determine the impact of migration on mental health, one must
compare the mental health of the migrant to what their mental health would have been like had
they not migrated. Typically, it is not possible to readily identify this unobserved counterfactual
outcome. However, the PAC ballot, by randomly choosing among individuals eager to migrate to
New Zealand, creates a control group of individuals that should have the same outcomes as what
the migrants would have had if they had not moved. While random selection guarantees that the
characteristics of the successful and unsuccessful ballots will have the same means on average,
some differences can arise in any given sample. Table 3 compares the means of ex-ante
characteristics for ballot winners and ballot losers among all individuals age 15 to 48 in our
sample, and shows that the two groups are similar in most respects. In particular, they have the

- 13 -
same gender, age, proportion principle applicant, education, height, religion, marital status, and
income in the prior year. However, ballot winners have higher employment rates in our sample,
on average, than ballot losers and are more likely to have visited New Zealand prior to 2000.
Thus, we will control for these observed characteristics to improve the precision of our estimates
and control for any differences in mental health arising from baseline differences in observed
variables.
6.2. Linear Treatment Effects
Table 4 presents our experimental estimates of the impact of migration on mental health. The
intent-to-treat effect is shown in column 1, and is the mean impact of the PAC program on
mental health. On average, winning the PAC ballot is estimated to improve mental health by 1.77
points, which is significant at the 1 percent level. To improve the efficiency of our ITT estimate
and control for any differences between the sample characteristics of the successful and
unsuccessful ballots, we next add in variables which control for the observable pre-existing
characteristics of the two groups and estimate β in the following regression:
MentalHealthi = α + β*BallotSuccessi + δ’Xi + ωi (1)
In Column 2, we add a set of controls for pre-existing characteristics of individuals.
These include standard variables, such as age, sex, marital status, and years of education. In
addition, we include height as a pre-existing measure of health, whether or not the individual was
born on the main island of Tongatapu, whether the individual visited New Zealand prior to 2000,
and dummy variables indicating the individual’s religion (Catholic v. Mormon v. Protestant or
Other), and past income to capture the effect of a host of unobserved individual attributes.
Adding these controls decreases the size of the estimated effect slightly, to 1.57. The fact that the
coefficient does not change much when we add these controls is consistent with randomization
ensuring that the treatment and control groups are balanced.
The ITT measures the impact of winning the PAC ballot, rather than the impact of
migration, because not all ballot winners had migrated. Instrumental variables regression
provides an approach for estimating average treatment effects with experimental data. In our
application, the PAC ballot outcome can be used as an excluded instrument because
randomization ensures that success in the ballot is uncorrelated with unobserved individual

- 14 -
attributes which might also affect mental health and success in the ballot is strongly correlated
with migration (the first stage F-statistic is 395).15 This estimate is called the local average
treatment effect (IV-LATE) and can be interpreted as the effect of treatment on individuals
whose treatment status is changed by the instrument. Angrist (2004) demonstrates that in
situations where no individuals who are assigned to the control group receive the treatment (eg.
there is no other way for unsuccessful applicants to migrate to New Zealand, which more or less
characterizes the situation for PAC applicants) then the IV-LATE is the same as the average
treatment effect on the treated (IV-TT).
Column 3 of Table 4 reports the IV-TT estimator when no other controls are included in
the regression model, and estimates a 2.19 point improvement in mental health from migrating,
which is a large (almost an entire standard deviation) and statistically significant effect at the
1 percent level. Column 4 then adds the same control variables as used above when estimating
the ITT; the estimated impact decreases slightly to 1.94 points, which is again not significantly
different from the results that do not include controls.16 In Columns 5 and 6 of Table 4, we
examine whether the treatment effect of migration differs for males and females. The estimated
impact is found to be significantly larger for females than for males at the 5 percent level (2.35
for females compared to 1.60 for males), with the impact statistically significant for both genders
at the 1 percent level.
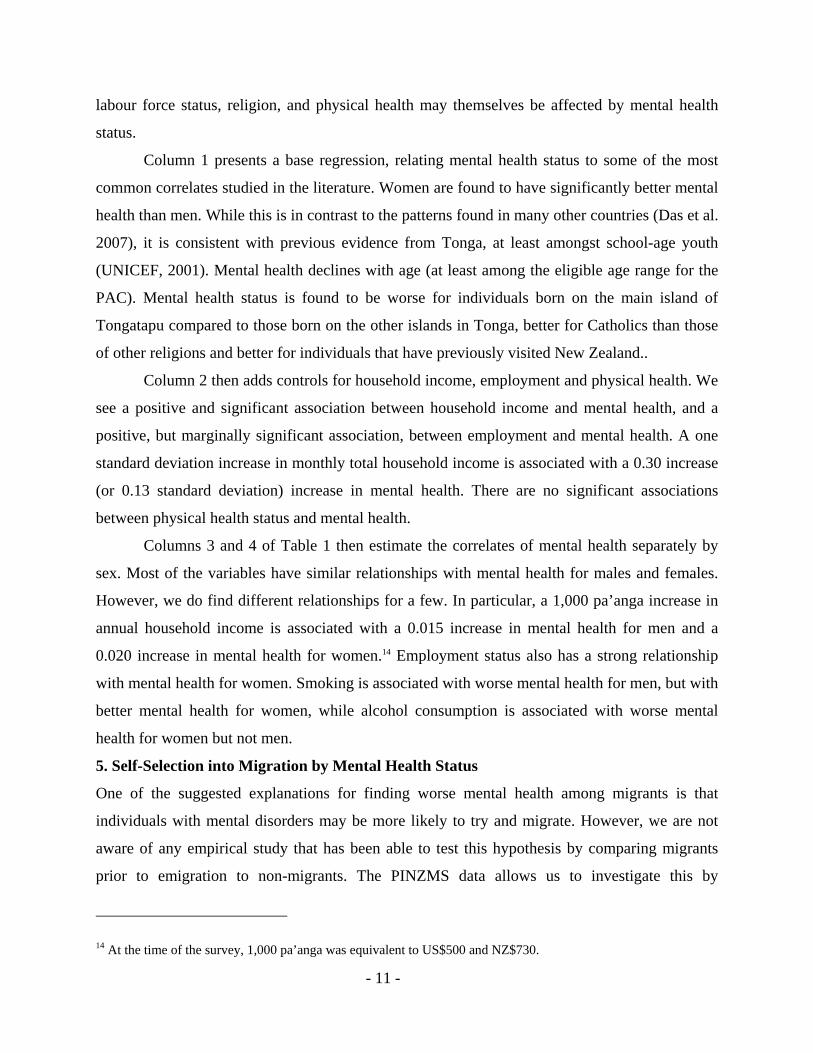
Figure 1 displays kernel density estimates in the top graphs and actual cumulative
densities in the bottom graphs of the mental health scores of men (left column) and women (right
column) among migrants, non-migrant ballot winners, and ballot losers. These figures show that
the impact of migration on mental health appears to be strongly non-linear. While the mental
health of non-migrants is distributed fairly normally (and is similar for non-migrants with both
15 Validity of the instrument also requires that the ballot outcome does not directly affect mental health conditional on migration status. One could conceive of stories such as that winning the ballot and not being able to migrate causes frustration which leads to a decline in mental health, or conversely, winning the ballot impacts mental health by causing adulation or worries about the prospect of migrating. However, the mental health of non-migrants among the successful ballots is not statistically different from that of the unsuccessful ballots giving us reason to believe that the instrument is a valid one. 16 These results do not change very much if we restrict the sample only to the principal applicants, and not their family members. The ITT effect in column 2 falls from 1.57 to 1.32, and is still significant at the 1% level, while the IV-TT in column 4 falls from 1.94 to 1.59, still significant at the 1% level. Given that 54% of principal applicants are male versus only 48% of the full applicant sample, we are not surprised by the slight reduction in the impacts here. Since almost all eligible family members move, these findings suggest that the impact of migration on mental health is the same for principal applicants as other family members.

- 15 -
successful and unsuccessful ballots), the mental health of migrants is skewed towards the upper
part of the mental health distribution.17 This suggests that it will also be useful to estimate models
that allow for non-linear treatment effects.
Figure 1
Mental Health by Gender
Den
sity
Mental Health Index (25 = Best) for Men Aged 15-48
Migrant in NZ Successful Ballot in Tonga Unsuccessful Ballot
15 16 17 18 19 20 21 22 23 24 25
0
.1
.2
.3
.4
.5
.6
Den
sity
Mental Health Index (25 = Best) for Women Aged 15-48
Migrant in NZ Successful Ballot in Tonga Unsuccessful Ballot
15 16 17 18 19 20 21 22 23 24 25
0
.1
.2
.3
.4
.5
.6
CD
F
Mental Health Index (25 = Best) for Men Aged 15-48
Migrant in NZ Successful Ballot in Tonga Unsuccessful Ballot
15 16 17 18 19 20 21 22 23 24 25
0
.2
.4
.6
.8
1
CD
F
Mental Health Index (25 = Best) for Women Aged 15-48
Migrant in NZ Successful Ballot in Tonga Unsuccessful Ballot
15 16 17 18 19 20 21 22 23 24 25
0
.2
.4
.6
.8
1
6.3. Non-Linear Treatment Effects
We take two approaches to estimating non-linear treatment effects. First, we examine the impact
of migration on the probability of having a mental health score below various thresholds. The
rationale for this is that we might expect improvements in mental health to only occur for
individuals who would have poor mental health in the absence of migration. As noted above,
several studies of general populations have used a cut-off of less than 17 as an indicator of major
depression, and a cut-off of less than 19 as an indicator of poor mental health. However, as noted
above, few individuals in the migrant sample have mental health scores below 18, thus we
17 The difference in the densities of the mental health distribution of migrants and ballot losers is highly significant. Davidson-Duclos tests of stochastic dominance reveal that the migrant distribution first-order stochastically dominates that of the ballot loser group.

- 16 -
restrict estimation to the likelihood of having a mental health score less than 19, and less than 20.
We use a bivariate probit model since both migration and the mental health thresholds are
discrete outcomes. Again, whether an individual has migrated to New Zealand is instrumented
by whether a member of their household was successful in the PAC ballot. The dependent
variable in each case measures whether or not the individual is in poor mental health, according
to the specified threshold.
These results are presented in Table 5. The same covariates are included in the regression
as when estimating the average treatment effects. We find strong and significant effects, showing
that migration lowers the likelihood of being in poor mental health. Migrants are 35 percentage
points less likely to have a mental health score less than 19 and 49 percentage points less likely
to have a score less than 20 compared to non-migrants. These are very large effects. The percent
of unsuccessful ballots with a mental health score below 19 is 41 percent, so the 35 percentage
point reduction indicates that only 6 percent of migrants are below this threshold. The effect is
larger for females both when we consider a threshold of less than 19 and when we consider a
threshold of less than 20.
Second, we follow the methodology of Chernozhukov and Hansen (2005) for estimating
quantile treatment effects (QTE) using instrumental variables. We estimate the impact of
migration on mental health at the 25th, 50th, and 75th percentile of the mental health
distribution. The key assumption of this econometric model is that individual unobservables are
rank invariant to the potential treatment status, e.g. individuals who have relatively better (worse)
mental health without migrating will also have better (worse) mental health if they migrate.
Thus, rank invariance implies that a common unobserved factor, for example, general mental
state, determines the ranking of a given person across treatment states.
Table 6 presents the results from this model. For our application, it is necessary to
bootstrap standard errors. Consistent with our results from the bivariate probit models, the causal
impact of migration on mental health appears to be larger at the lower part of the mental health
distribution. For example, migration increases mental health by 2.44 points for individuals at the
25th percentile of the mental health distribution, compared to 1.96 points at the median and 1.86
points at the 75th percentile. The treatment effect is statistically significant at the 1 percent level
for each of the three quantiles estimated.

- 17 -
Taken together, these results indicate that the migration improves mental health, and
improves it more for individuals with low mental health scores, thus reducing the overall
likelihood of migrants having poor mental health. This is consistent with individuals with low
mental health scores being more interested in migrating to New Zealand.
6. Interpreting the Results
Migration is seen to improve mental health, particularly for those with low mental health in the
absence of migration. In this section, we attempt to understand some of the channels through
which this effect operates. As seen in Table 1, mental health status in Tonga is significantly
associated with household income, has a large but insignificant association with employment
status, and is significantly associated with smoking behaviour, all of which may change with
migration. Therefore, in Table 7 we report the ATT effect of migration on these variables, once
again using the ballot outcome as an instrument for migration.
As shown in McKenzie, Gibson and Stillman (2008), migration from Tonga to New
Zealand results in large increases in income. Converting New Zealand dollars earned by migrants
into Tongan pa’anga for ease of comparison with Table 1, Column 1 shows a 10,440 pa’anga per
year increase in household income from migration. Adding several controls in Column 2 reduces
this to a 6,200 pa’anga increase and it is no longer significant, but neither is it significantly
different from the initial result in Column 1. From Table 1, Column 2, we see a 1,000 pa’anga
increase in household income is associated with a 0.0172 increase in mental health. Based on
this, we would predict that changes in income from migration are related to a 0.11-0.18 increase
in mental health from migration, which is only 5-9 percent of the overall effect found in Column
4 of Table 4.
Table 7 shows no overall effect of migration on the probability of being employed, or on
the likelihood of being a smoker. The results for employment persist when we estimate the ATT
separately by gender. However, when we estimate the effect of migration on smoking separately
for males and females, we find that while migration has a negative, but insignificant effect, on
whether women smoke, it has a negative and significant effect of whether men smoke. Based on
this, we would predict that the impact of migration on the likelihood of men smoking is related to
a 0.10 increase in mental health from migration, which is only 5 percent of the overall effect
found in Column 4 of Table 4.

- 18 -
Thus, based on these estimates, it appears unlikely that changes in income, employment
and smoking behavior that are caused by migration explain more than a minority of the
improvement in mental health found in this paper. It does seem plausible that other, possibly
non-monetary factors, may account for these differences. To explore this, we examine questions
administered to the principal applicants to PAC for the sample of unsuccessful ballot
participants. We asked these individuals how important different reasons were for wanting to
migrate to New Zealand. In Table 8, we highlight whether there are differences in the motives
for migrating for those with lower compared to higher mental health, and for females compared
to males. We use a threshold of less than 20 for mental health status to split the sample into
roughly equal groups of individuals with low and high mental health.
Table 8 does show significant differences in the motives for wanting to migrate between
individuals with low and high mental health status in Tonga, and between men and women.
Individuals with poor mental health are significantly more likely to say that the desire for a better
social life are very important reasons for wanting to migrate; 69 percent of those with mental
health score less than 20 say social life is a very important reason, compared to only 46 percent
of those with mental health of 20 or higher. In contrast, those with better mental health are more
likely to want to migrate so that their children can attend school in New Zealand and to have
access to better public services such as health care . Women are more likely than men to say that
accessing better public services such as health care is a very important reason for wanting to
migrate and less likely to say that earning money to start a business in Tonga is a very important
reason.
These results therefore suggest that in addition to the positive effect of increased incomes
on mental health, the gain in mental health from migration may arise from the ability of some
migrants send their children to better schools, to have a better social life in New Zealand, and to
access better public services. That is, it appears likely that there are lifestyle and non-financial
factors which improve mental health on top of economic factors.
7. Conclusions
A large literature suggests that migration can be a stressful process, with potentially negative
impacts on mental health. However, to truly understand the effect of migration on mental health
one must compare the mental health of migrants to what their mental health would have been had

- 19 -
they stayed in their home country. The existing literature is unable to do this and typically settles
for comparing the mental health of migrants to that of natives in the destination country, which
does not take into account any pre-existing differences between these groups. This paper
overcomes the selection problems affecting these previous studies by examining a migration
program which uses a random ballot to choose amongst excess number of applicants.
We find that migrating from Tonga to New Zealand leads to mental health improvements,
in particular for women and for migrants with lower levels of mental health. This finding
suggests that the overall welfare impact of migration is even larger than that brought about by the
large increase in income that migration offers. These results refer to short-run changes in mental
health status, roughly one year after migrating to New Zealand. Future waves of the survey will
enable us to trace the process of mental health changes with time spent in New Zealand. Finally,
a further contribution of the analysis in this paper is in showing that the impacts of large life
changes on mental health can be nonlinear, and so studies of mental health need to look beyond
average treatment effects.
Appendix: MHI-5 Questions
1. During the past month, how much of the time were you a happy person?
(1=All of the time, 2=Most of the Time, 3=Some of the time, 4=A little of the time, 5=None of the time)
2. How much of the time, during the past month, have you felt calm and peaceful?
(1=All of the time, 2=Most of the Time, 3=Some of the time, 4=A little of the time, 5=None of the time)
3.How much of the time, during the past month, have you been a very nervous person?
(1=All of the time, 2=Most of the Time, 3=Some of the time, 4=A little of the time, 5=None of the time)
4. How much of the time, during the past month, have you felt down-hearted and blue?
(1=All of the time, 2=Most of the Time, 3=Some of the time, 4=A little of the time, 5=None of the time)
5.How much of the time, during the past month, did you feel so down in the dumps that nothing could
cheer you up? (1=Always, 2=Very often, 3=Sometimes, 4=Almost Never, 5=Never)
Questions 1 and 2 are reverse-scored, so that answer one receives score 5, answer two score 4, and so on.
Questions 3 through 5 are scored as they appear. This gives a maximum MHI-5 score of 25, and a
minimum of 5, with higher scores representing better mental health.

- 20 -
References
Angrist, J.D. (2004) “Treatment Effect Heterogeneity In Theory and Practice”, Economic Journal 502: C52-C83.
Berwick DM, Murphy JM, Goldman PA, Ware JE Jr, Barsky AJ, Weinstein MC (1991) “Performance of a five-item mental health screening test”, Medical Care 29(2): 169-76.
Bhugra D. (2004a) “Migration, distress and cultural identity,” British Medical Bulletin 69(1): 129-141.
Bhugra, D. (2004b) “Migration and mental health,” Acta Psychiatrica Scandinavica 109(2): 243-258.
Bhugra, D. and P. Jones (2001) “Migration and Mental Illness” Advances in Psychiatric Treatment 7: 216-33.
Carballo, M., J. Divino and D. Zeric (1998) “Migration and health in the European Union”, Tropical Medicine and International Health 3(12): 936-44.
Carta, MG, M. Bernal, MC Hardoy and JM Haro-Abad (2007) “Migration and Mental Health in Europe (the state of the mental health in Europe working group: appendix 1)” Clinical practice and Epidemiology in Mental Health 1: 13
Chernozhukov, Victor and Christian Hansen (2005), “An IV Model of Quantile Treatment Effects,” Econometrica 73(1): 245-261
Cochrane, R., and Bal, S. (1987) “Migration and schizophrenia: an examination of five hypotheses,” Social Psychiatry 22(2): 181-191.
Das, J., Q-T. Do, J. Friedman, D. McKenzie and K. Scott (2007) “Mental Health and Poverty in Developing Countries: Revisiting the Relationship”, Social Science and Medicine 65(3): 467-80
Foliaki, Siale (1997) “Migration and Mental Health: The Tongan Experience”, International Journal of Mental Health 26(3): 36-54.
Gibson, J. and McKenzie, D. (2007) “The Impact of an Ex-Ante Job Offer Requirement on Labor Migration: The New Zealand-Tongan Experience”, pp. 215-233 in C. Ozden and M. Schiff (eds.) International Migration, Economic Development and Policy. World Bank, Washington D.C.
Graves, T. and Graves, N. 1985. Stress and health among Polynesian migrants to New Zealand. Journal of Behavioral Medicine 8(1): 1-19.
Maveras, V. and P. Bebbington (1988) “Greeks, British Greek Cypriots and Londoners: a comparison of morbidity”, Psychological Medicine 18(2): 433-43.
McKenzie, D., Gibson, J. and Stillman, S. (2008) “How important is selection? Experimental vs non-experimental measures of the income gains from migration”, Journal of the European Economic Association, forthcoming.
Muynck, A. (1997) “Migration and Health in Belgium”, in A. Huismann, C. Weilandt and A. Geiger (eds.) Country reports on Migration and Health in Europe, Wissenschaftliches Institut der Ärzte Deutschlands e V, Bonn.
Nazroo J. (1997) Ethnicity and Mental Health: Findings from a National Community Survey. Policy Studies Institute, London.
Odegaard, O. (1932) “Emigration and insanity,” Acta Psychiatrica et Neurologica 4(1): 1-206 Pernice, R. and Brook, J. (1994). Relationship of migrant status (refugee or immigrant) to mental
health. International Journal of Social Psychiatry 40(3): 177-188.

- 21 -
Pernice, R. Trlin, A., Henderson, A., and North, N. (2000). Employment and mental health of three groups of immigrants to New Zealand. New Zealand Journal of Psychology 29(1): 24-29.
Urban Institute (1999) “Snapshots of America’s Families: Appendix”, http://www.urban.org/url.cfm?ID=900875
UNICEF (2001) The State of Health Behaviour and Lifestyle of Pacific Youth. Kingdom of Tonga Report. UNICEF Pacific. Suva, Fiji.
VanLandingham, M. and H. Fu 2007. “Disentangling Mental Health, Immigrant Adaptation, and Selection: A Natural Experiment Approach” Paper presented at the Annual Meeting of the Population Association of America New York, March.
Veit, C.T. & Ware, Jnr, J.E. (1983). “The structure of psychological distress and well-being in general populations”, Journal of Consulting and Clinical Psychology, 51, 730-742
World Bank (2005) Global Economic Prospects 2006: Economic Implications of Remittances and Migration World Bank Group, Washington DC.
World Health Organization (WHO) (2001) The World Health Report--Mental Health: New Understanding, New Hope. World Health Organization.
Yamazaki, S., S. Fukuhara and J. Green (2005) “Usefulness of five-item and three-item Mental Health Inventories to screen for depressive symptoms in the general population of Japan”, Health and Quality of Life Outcomes 3/1/48

- 22 -
TABLE 1: PREDICTORS OF MENTAL HEALTH STATUS IN TONGA
(1) (2) (3) (4)All All Males Females
Real Total Household Income (000's of June 05 pa'anga) 0.0172** 0.015 0.0195**(0.007) (0.010) (0.008)
Currently Employed Dummy 0.339* 0.241 0.489*(0.190) (0.290) (0.284)
Female Dummy 0.508*** 0.505**(0.169) (0.204)
Married Dummy -0.113 -0.017 -0.016 0.099(0.314) (0.303) (0.434) (0.375)
Age -0.174* -0.130 -0.123 -0.136(0.096) (0.100) (0.160) (0.119)
Age Squared 0.002 0.001 0.001 0.001(0.001) (0.002) (0.002) (0.002)
Years of Education -0.0611** -0.0753** -0.0798* -0.0723**(0.031) (0.030) (0.047) (0.033)
Born on Tongatapu Dummy -0.625*** -0.646*** -0.453* -0.878***(0.199) (0.202) (0.273) (0.277)
Visited New Zealand Before 2000 0.581*** 0.536** 0.470 0.509*(0.217) (0.219) (0.312) (0.294)
Height 0.015 0.012 0.017 0.004(0.009) (0.010) (0.013) (0.015)
Catholic Dummy 0.484 0.405 0.463 0.308(0.333) (0.313) (0.357) (0.380)
Mormon Dummy -0.325 -0.314 -0.308 -0.350(0.346) (0.362) (0.365) (0.450)
Very Good Self-reported Health dummy 0.190 0.399 -0.185(0.209) (0.282) (0.305)
Currently Smoke Dummy -0.239 -0.688*** 1.601***(0.210) (0.246) (0.403)
Number of Alcoholic Drinks Per Typical Month 0.000 0.002 -0.0716***(0.003) (0.003) (0.020)
Constant 21.20*** 20.73*** 19.59*** 22.87***(2.076) (2.127) (2.626) (3.062)
Observations 564 559 268 291R-squared 0.19 0.22 0.22 0.27
* significant at 10%; ** significant at 5%; *** significant at 1%
Robust standard errors that account for clustering at the household level in parentheses. A controlvariable for the survey year are also included in the regression. Columns 1 and 2 are for combinedsample of males and females.

- 23 -
TABLE 2: SELF-SELECTION INTO MIGATION (Unsuccessful Ballots vs Non-Applicants)Probit model of Likelihood of Applying for the Pacific Access CategoryMarginal Effects and Their Standard Errors Are Presented
(1) (2) (3) (4)Mental Health Score -0.0384***
(0.015)Mental Health Score < 19 0.200***
(0.065)Mental Health Score < 20 0.185***
(0.060)Currently Employed Dummy 0.121* 0.124** 0.110* 0.112*
(0.062) (0.062) (0.063) (0.061)Real Total Household Income 0.00382* 0.00450** 0.00421* 0.00448** (000's of June 05 pa'anga) (0.002) (0.002) (0.002) (0.002)Female Dummy -0.075 -0.065 -0.064 -0.066
(0.067) (0.069) (0.069) (0.069)Married Dummy -0.276*** -0.297*** -0.304*** -0.286***
(0.084) (0.086) (0.086) (0.086)Age 0.127*** 0.134*** 0.135*** 0.126***
(0.040) (0.039) (0.040) (0.039)Age Squared -0.00167*** -0.00180*** -0.00180*** -0.00166***
(0.001) (0.001) (0.001) (0.001)Years of Education 0.0456*** 0.0460*** 0.0479*** 0.0442***
(0.015) (0.015) (0.016) (0.015)Born on Tongatapu Dummy 0.124** 0.112* 0.117** 0.122**
(0.060) (0.059) (0.058) (0.059)Visited New Zealand Before 2000 0.145** 0.174** 0.174** 0.173**
(0.073) (0.075) (0.074) (0.075)Height -0.002 -0.002 -0.002 -0.002
(0.003) (0.003) (0.003) (0.003)Catholic Dummy 0.013 0.025 0.030 0.031
(0.093) (0.096) (0.096) (0.096)Mormon Dummy 0.085 0.077 0.103 0.087
(0.105) (0.101) (0.103) (0.103)Very Good Self-reported Health dummy -0.017 -0.006 0.006 -0.011
(0.058) (0.057) (0.058) (0.057)Currently Smoke Dummy 0.061 0.049 0.058 0.057
(0.073) (0.072) (0.073) (0.073)Number of Alcoholic Drinks Per Typical Month 0.000 0.000 0.000 0.000
(0.001) (0.001) (0.001) (0.001)
Observations 350 350 350 350
* significant at 10%; ** significant at 5%; *** significant at 1%
Robust standard errors that account for clustering at the household level in parentheses. A control variablefor the survey year is also included in the regression. This compares unsuccessful principal applicants to allnon-applicants age 18-45. 33.4% of the combined sample is unsuccessful principal applicants.

- 24 -
TABLE 3: TEST FOR RANDOMIZATIONComparison of Ex-ante characteristics of principal applicants, spouse, children >= 15 in successful and unsuccessful ballots
T-testof equality
Successful Unsuccessful of meansBallots Ballots p-value
Proportion female 0.52 0.52 1.00Proportion who are married 0.63 0.64 0.81Age 31.2 30.8 0.59Proportion Principle Applicant (PA) 0.49 0.50 0.91Years of schooling 11.2 10.6 0.18Height 169.8 168.3 0.19Proportion born on Tongatapu 0.77 0.74 0.57Proportion Catholic 0.14 0.15 0.83Proportion Mormon 0.17 0.17 0.92Proportion Protestant 0.62 0.65 0.73Employment in prior year/before moving 0.55 0.40 0.00Income in prior year/before moving 85.9 82.9 0.79Proportion who had been to NZ before 2000 0.39 0.26 0.01
Percent in New Zealand 0.81Months in New Zealand 11.16
Total Sample Size 257 240Test statistics account for clustering at the household level
Sample MeansAPPLICANTS

- 25 -
TABLE 4: LINEAR EXPERIMENTAL ESTIMATES OF INTENT TO TREAT AND TREATMENT EFFECTSDependent Variable: Mental Health Score on 5-25 Scale (25 = best)
(1) (2) (3) (4) (5) (6)OLS OLS IV IV IV-males IV-females
Ballot Success Dummy 1.772*** 1.566***(0.249) (0.236)
Migration Dummy 2.185*** 1.944*** 1.596*** 2.354***(0.289) (0.262) (0.321) (0.322)
Female Dummy 0.188 0.189(0.195) (0.191)
Married Dummy -0.403 -0.405 -0.036 -0.562(0.374) (0.367) (0.581) (0.434)
Age 0.014 0.014 -0.142 0.177(0.127) (0.125) (0.173) (0.146)
Age-Squared/100 (0.000) (0.000) 0.002 (0.003)(0.002) (0.002) (0.003) (0.002)
Years of Education -0.0651* -0.0678* -0.062 -0.0990**(0.038) (0.037) (0.056) (0.046)
Born on Tongatapu Dummy -0.249 -0.246 -0.116 -0.343(0.258) (0.253) (0.382) (0.376)
Height 0.005 0.005 0.007 0.010(0.011) (0.010) (0.014) (0.015)
Catholic Dummy 1.105** 1.112** 0.658 1.663***(0.457) (0.447) (0.523) (0.485)
Mormon Dummy 0.249 0.258 0.202 0.470(0.357) (0.348) (0.427) (0.457)
Past Employment Dummy 0.154 0.136 -0.235 0.593(0.382) (0.375) (0.494) (0.529)
Past Income -0.001 -0.001 0.000 -0.002(0.001) (0.001) (0.001) (0.002)
Visited NZ Before 2000 0.802*** 0.774*** 0.828* 0.689*(0.269) (0.264) (0.424) (0.385)
Constant 19.30*** 19.64*** 19.30*** 19.60*** 21.26*** 17.09***(0.19) (2.71) (0.19) (2.67) (3.30) (3.59)
First stage Instrument F-stat 395.0 372.6 301.1 352.6Mean for Unsuccessful Ballots 19.3 19.3 19.2 19.4Observations 497 497 497 497 238 259R-squared 0.05 0.25 0.06 0.26 0.24 0.32
* significant at 10%; ** significant at 5%; *** significant at 1%
Robust standard errors that account for clustering at the household level in parentheses. Control variablesfor whether past income is missing, vis ited New Zealand before 2000 is missing, and the survey year arealso included in the regression. Ballot Success is used as an instrument for Migration. Columns 1 to 4 are forcombined sample of males and females.

- 26 -
TABLE 5: IV ESTIMATES OF EXPERIMENTAL IMPACT FOR DIFFERENT THRESHOLDSDependent Variable: ML Bivariate Probit Models - Marginal Effects and Their Standard Errors Are Presented
(1) (2) (3) (4) (5 (6)<19 <20 <19 <19 <20 <20All All Males Females Males Females
Migration Dummy -0.349*** -0.492*** -0.320*** -0.381*** -0.435*** -0.541***(0.040) (0.052) (0.060) (0.050) (0.083) (0.061)
Female Dummy 0.017 0.023(0.062) (0.060)
Married Dummy 0.145 0.078 -0.118 0.321*** -0.003 0.134(0.089) (0.108) (0.156) (0.108) (0.167) (0.145)
Age -0.010 0.006 0.071 -0.113** 0.069 -0.061(0.032) (0.036) (0.045) (0.046) (0.047) (0.050)
Age-Squared/100 0.000 0.000 -0.001 0.00169** -0.001 0.001(0.000) (0.001) (0.001) (0.001) (0.001) (0.001)
Years of Education 0.012 0.021 0.001 0.0368** -0.005 0.0488***(0.013) (0.013) (0.018) (0.017) (0.019) (0.018)
Born on Tongatapu Dummy -0.020 0.078 -0.056 -0.039 0.049 0.057(0.066) (0.077) (0.112) (0.104) (0.124) (0.106)
Height -0.001 0.002 -0.003 -0.002 -0.001 0.004(0.003) (0.003) (0.004) (0.005) (0.004) (0.005)
Catholic Dummy -0.133 -0.201* 0.109 -0.357*** -0.023 -0.375***(0.082) (0.121) (0.114) (0.080) (0.145) (0.134)
Mormon Dummy -0.045 -0.079 0.034 -0.211** 0.021 -0.258*(0.080) (0.105) (0.114) (0.100) (0.138) (0.135)
Past Employment Dummy -0.080 0.015 0.003 -0.255* 0.034 -0.092(0.109) (0.110) (0.142) (0.138) (0.155) (0.171)
Past Income 0.000 0.000 0.000 0.001 0.000 0.000(0.000) (0.000) (0.000) (0.001) (0.001) (0.001)
Visited NZ Before 2000 -0.133** -0.120 -0.154 -0.078 -0.084 -0.121(0.066) (0.075) (0.104) (0.105) (0.119) (0.112)
Percent of Unsuccessful BallotsBelow Threshold 0.406 0.582 0.395 0.416 0.588 0.576Observations 482 482 229 253 229 253
* significant at 10%; ** significant at 5%; *** significant at 1%
Robust standard errors that account for clustering at the household level in parentheses. Control variables forwhether past income is missing and the survey year are also included in the regression. 15 individuals missingwhether they visited NZ before 2000 are dropped from each regression. Ballot Success is used as aninstrument for Migration. Columns 1 to 2 are for combined sample of males and females.

- 27 -
TABLE 6: IV QUANTILE REGRESSION EXPERIMENTAL ESTIMATES (CH METHOD)Dependent Variable: Mental Health Score on 5-25 Scale (25 = best)
(1) (2) (3)25th Pctile 50th Pctile 75th Pctile
Migration Dummy 2.440*** 1.960*** 1.860***(0.444) (0.389) (0.380)
Female Dummy 0.006 0.047 0.197(0.339) (0.335) (0.370)
Married Dummy -0.826 -0.887 -0.196(0.558) (0.610) (0.529)
Age 0.064 0.009 0.017(0.201) (0.154) (0.177)
Age-Squared/100 -0.001 0.000 0.000(0.003) (0.002) (0.003)
Years of Education -0.161 -0.094* -0.081(0.080) (0.056) (0.051)
Born on Tongatapu Dummy -0.082 -0.055 -0.463(0.386) (0.413) (0.431)
Height -0.004 0.004 0.003(0.019) (0.019) (0.013)
Catholic Dummy 0.782* 1.034 0.919**(0.633) (0.695) (0.537)
Mormon Dummy 0.064 -0.034 0.062(0.472) (0.530) (0.407)
Past Employment Dummy 0.270 0.100 -0.202(0.558) (0.592) (0.542)
Past Income 0.001 0.000 0.000(0.002) (0.002) (0.002)
Visited NZ Before 2000 0.733* 1.022** 0.294*(0.440) (0.397) (0.355)
Observations 497 497 497
* significant at 10%; ** significant at 5%; *** significant at 1%
Robust standard errors that account for clustering at the household level in parentheses.Significance levels are derived using the percentile method. Control variables for whetherpast income is missing, whether previously visited New Zealand is missing and the surveyyear are also included in the regression. Ballot Success is used as an instrument forMigration. 72 reps for 25th, 10 reps for 50th and 27 reps for 75th out of 1000 are droppedbecause of non-convergence.

- 28 -
TABLE 7: TREATMENT EFFECT OF MIGRATION ON CORRELATES OF MENTAL HEALTH
(1) (2) (3) (4) (5) (6) (7) (8)Real Hhold Real Hhold
Income/1000 Income/1000 Employed Employed Employed Smokes Smokes SmokesAll All All Males Females All Males Females
Migration Dummy 10.44** 6.202 -0.031 0.071 -0.105 -0.067 -0.143* -0.019(4.748) (4.280) (0.050) (0.059) (0.074) (0.043) (0.081) (0.033)
Female Dummy 3.489* -0.031 -0.338***(1.799) (0.036) (0.044)
Married Dummy -0.123 -0.065 0.098 -0.180** 0.028 0.001 0.007(4.391) (0.056) (0.087) (0.073) (0.071) (0.143) (0.062)
Age -4.912*** 0.0308* 0.029 0.032 0.0477*** 0.113*** -0.007(1.347) (0.018) (0.027) (0.023) (0.018) (0.037) (0.009)
Age-Squared/100 0.0740*** 0.000 0.000 0.000 -0.000604** -0.00146** 0.000(0.020) (0.000) (0.000) (0.000) (0.000) (0.001) (0.000)
Years of Education 0.714 0.0116* 0.010 0.010 -0.00814* -0.0155* -0.002(0.498) (0.006) (0.006) (0.008) (0.005) (0.008) (0.003)
Born on Tongatapu Dummy 2.662 0.050 0.071 0.043 0.060 0.087 0.013(2.435) (0.032) (0.045) (0.049) (0.039) (0.076) (0.035)
Height 0.324** 0.002 0.000 0.00522** -0.003 -0.006 -0.001(0.133) (0.001) (0.002) (0.002) (0.002) (0.004) (0.001)
Catholic Dummy 12.99* -0.038 -0.097 0.010 0.056 0.010 0.136*(7.400) (0.053) (0.079) (0.081) (0.072) (0.108) (0.077)
Mormon Dummy 1.543 -0.0670* -0.117*** -0.043 -0.142*** -0.354*** -0.0447*(4.689) (0.037) (0.043) (0.059) (0.053) (0.095) (0.027)
Past Employment Dummy -5.437 0.692*** 0.738*** 0.635*** 0.087 0.116 0.021(3.677) (0.055) (0.071) (0.077) (0.066) (0.118) (0.041)
Past Income 0.0535*** 0.000 0.000 0.000 0.000 -0.001 0.000(0.014) (0.000) (0.000) (0.000) (0.000) (0.000) (0.000)
Visited NZ Before 2000 3.501 -0.038 0.019 -0.107* -0.028 -0.090 0.038(2.485) (0.046) (0.063) (0.061) (0.053) (0.103) (0.039)
Constant 27.42*** 35.080 -0.698** -0.379 -1.261*** -0.019 -0.471 0.279(2.309) (26.690) (0.337) (0.496) (0.454) (0.461) (0.822) (0.265)
Mean for Unsuccessful Ballots 27.4 27.4 0.48 0.52 0.44 0.20 0.37 0.04Observations 497 497 475 230 245 494 238 256
* significant at 10%; ** significant at 5%; *** significant at 1%
Robust standard errors that account for clustering at the household level in parentheses. Control variables for whether past income is missing, vis ited NewZealand before 2000 is missing, and the survey year are also included in the regression. Ballot Success is used as an instrument for Migration. Columns 1 to 3and 6 are for combined sample of males and females.

- 29 -
TABLE 8: REASONS FOR APPLYING TO MIGRATEProportion of Unsuccessful Principle Applicants Saying Reason is Very Important
<19 20 to 25 p-value Male Female p-valueTo be with family members already in NZ 0.750 0.710 0.638 0.683 0.778 0.253To earn money for school fees in Tonga 0.042 0.043 0.962 0.048 0.037 0.780So children can attend school in NZ 0.386 0.688 0.002 0.633 0.479 0.110To earn money to start a business in Tonga 0.000 0.043 0.146 0.048 0.000 0.106To earn money to build a better house in Tonga 0.021 0.058 0.333 0.032 0.056 0.530Better public services such as health care in NZ 0.688 0.913 0.002 0.714 0.944 0.001To earn higher wages in NZ 0.479 0.551 0.450 0.556 0.481 0.428To earn money to pay for social responsibilities in my home vil lage 0.104 0.043 0.204 0.079 0.056 0.615Better social life 0.688 0.464 0.016 0.508 0.611 0.267Less cultural restrictions on what I can do and cannot do 0.042 0.043 0.962 0.063 0.019 0.234
Sample Size 48 69 63 54Note: p-value is for a t-test of equality of proportions between the two groups.
By Mental Health Score By Sex