Embed Size (px)
Citation preview
[ Strategic Commissioning Statistical Bulletin September 2019
Strategic Commissioning - Analytics, Kent County Council www.kent.gov.uk/research
Migration indicators in Kent - 2018
Related information
This bulletin presents the migration indicators for Kent between Mid-year 2017 to Mid-year 2018 as published by the Office for National Statistics (ONS) in June and August 2019. Net migration is the difference between the number of people who move into an area minus the number of people who move out of that area. A positive Net migration figure means that more people are moving in than are moving out.
• Between Mid-2017/18 Net migration to Kent was 12,100 which accounts for 86.3% of the total population growth.
• Net migration to Kent in 2018 accounts for 0.8% of the total population of +1.5million.
• 53.4% of all migrants are aged between 25 and 44. Internal migrants are people who have moved from a different area within the UK for example from Surrey to Kent.
• Net Internal migration to Kent was +6,600 people which accounts for the majority (61%) of Kent’s Net migration during Mid-2017/18
• Kent attracts people from all over the UK but mainly from London (46.6%) and elsewhere in the South East (25.9%).
• The majority (30.3%) of people leaving Kent during Mid-2016/17 went elsewhere in the South East.
• 73.1% of all internal migrants are aged between 25 and 44.
International migrants are people who have moved to Kent from outside the UK.
• Net International migration to Kent during Mid-2016/17 was +4,500 people which accounts for 39% of Kent’s Net migration.
• This figure is the lowest number since Mid-2013/14.
• 55.8% of all international migrants are aged under 24.
The Population and Census web page contains more information which you may find useful. Population data presents the latest population estimates and an analysis of annual change Population forecasts presents the latest thinking about future population levels 2011 Census provides information of the characteristics of the population NOTE: within this bulletin ’Kent’ refers to the Kent County Council (KCC) area which excludes Medway
Contact details
Strategic Commissioning - Analytics Kent County Council Invicta House Maidstone Kent ME14 1XQ Email: [email protected]
Tel: 03000 417444
Strategic Business Development & Intelligence, Kent County Council www.kent.gov.uk/research
Page 1
Introduction
Migration is the key component of population change for Kent and therefore
plays an important role in the county’s population and economic profile. It is
vital that the County Council has a good understanding of the level of
migration to Kent and the characteristics of the migrants settling in the area to
ensure the planning and provision of appropriate services. Key policy themes
for migration include employment and skills, health, education and community
cohesion.
Unfortunately, there is no single data set that provides the complete
picture of migration flows and the characteristics of all migrants. This
has made the task of estimating the number of migrants very difficult. In 2008
the Office for National Statistics (ONS) embarked upon a programme of work
designed to improve the quality of existing sources of migration statistics.
Despite improvements being made there is still no single data set that
provides the complete picture of immigration, emigration and the resulting net
migrant total.
The most recent migration data comes from the Components of Population
Change, which are used to calculate the annual Mid-Year Population
Estimates (MYEs) and were published 26 June 2019, and The Local
Migration Indicators which were published 22 August 2019.
The Components of Population Change provide data from Mid-2002 to
Mid-2018 include:
• Total Internal migrants
• Total Long-term international migrants
• Internal and International migrants by age and sex
• Origin and destination of internal migrants
The Local Area Migration Indicators include:
• Short-term international migrant estimates
• Flag 4 GP registrations - data from the NHS Patient Register Data Service (PRDS) on the number of people registering with a doctor whose previous address was outside of the UK
Where possible, data for the South East region and England is presented to
allow for comparison of Kent with the national picture. Data for the Kent local
authority districts is also presented to help identify local areas which have
higher or lower levels of migration.
All data is annual from Mid-year to Mid-year with Mid-2017 to mid-2018 being
the latest available.
Strategic Business Development & Intelligence, Kent County Council www.kent.gov.uk/research
Page 2
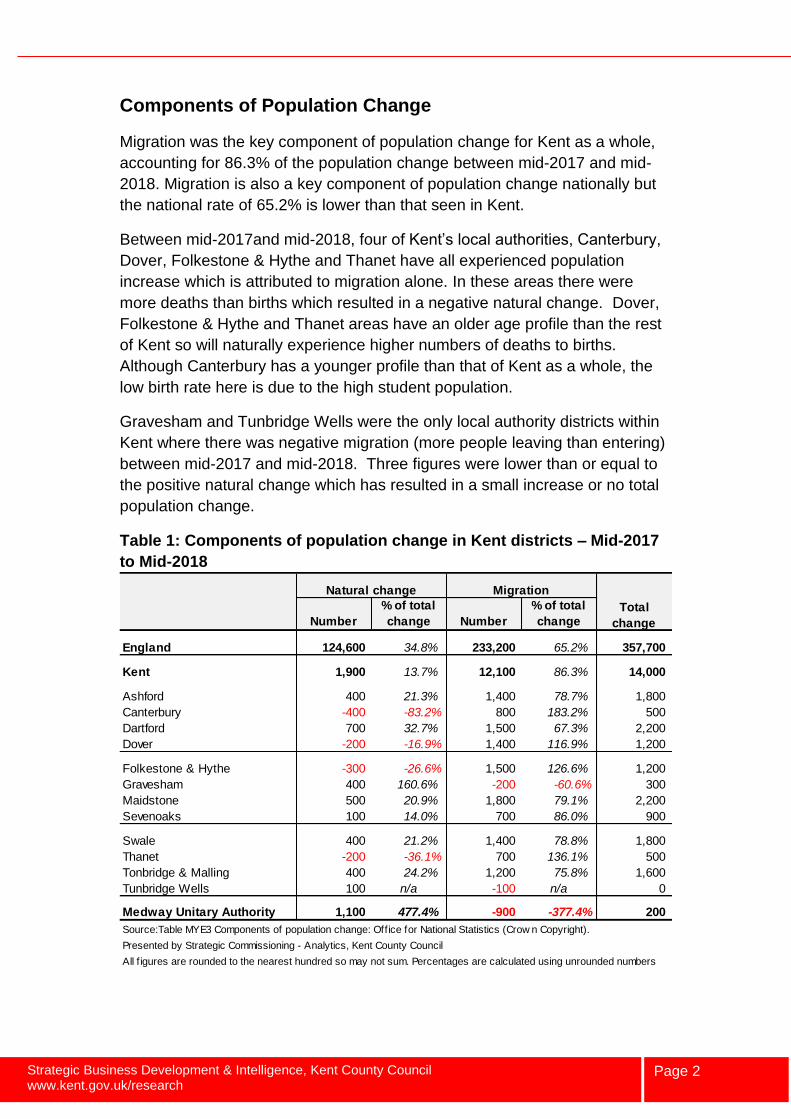
Components of Population Change
Migration was the key component of population change for Kent as a whole,
accounting for 86.3% of the population change between mid-2017 and mid-
2018. Migration is also a key component of population change nationally but
the national rate of 65.2% is lower than that seen in Kent.
Between mid-2017and mid-2018, four of Kent’s local authorities, Canterbury,
Dover, Folkestone & Hythe and Thanet have all experienced population
increase which is attributed to migration alone. In these areas there were
more deaths than births which resulted in a negative natural change. Dover,
Folkestone & Hythe and Thanet areas have an older age profile than the rest
of Kent so will naturally experience higher numbers of deaths to births.
Although Canterbury has a younger profile than that of Kent as a whole, the
low birth rate here is due to the high student population.
Gravesham and Tunbridge Wells were the only local authority districts within
Kent where there was negative migration (more people leaving than entering)
between mid-2017 and mid-2018. Three figures were lower than or equal to
the positive natural change which has resulted in a small increase or no total
population change.
Table 1: Components of population change in Kent districts – Mid-2017
to Mid-2018
Natural change Migration
Number
% of total
change Number
% of total
change
England 124,600 34.8% 233,200 65.2% 357,700
Kent 1,900 13.7% 12,100 86.3% 14,000
Ashford 400 21.3% 1,400 78.7% 1,800
Canterbury -400 -83.2% 800 183.2% 500
Dartford 700 32.7% 1,500 67.3% 2,200
Dover -200 -16.9% 1,400 116.9% 1,200
Folkestone & Hythe -300 -26.6% 1,500 126.6% 1,200
Gravesham 400 160.6% -200 -60.6% 300
Maidstone 500 20.9% 1,800 79.1% 2,200
Sevenoaks 100 14.0% 700 86.0% 900
Swale 400 21.2% 1,400 78.8% 1,800
Thanet -200 -36.1% 700 136.1% 500
Tonbridge & Malling 400 24.2% 1,200 75.8% 1,600
Tunbridge Wells 100 n/a -100 n/a 0
Medway Unitary Authority 1,100 477.4% -900 -377.4% 200
Source:Table MYE3 Components of population change: Office for National Statistics (Crow n Copyright).
Presented by Strategic Commissioning - Analytics, Kent County Council
All f igures are rounded to the nearest hundred so may not sum. Percentages are calculated using unrounded numbers
Total
change
Strategic Business Development & Intelligence, Kent County Council www.kent.gov.uk/research
Page 3
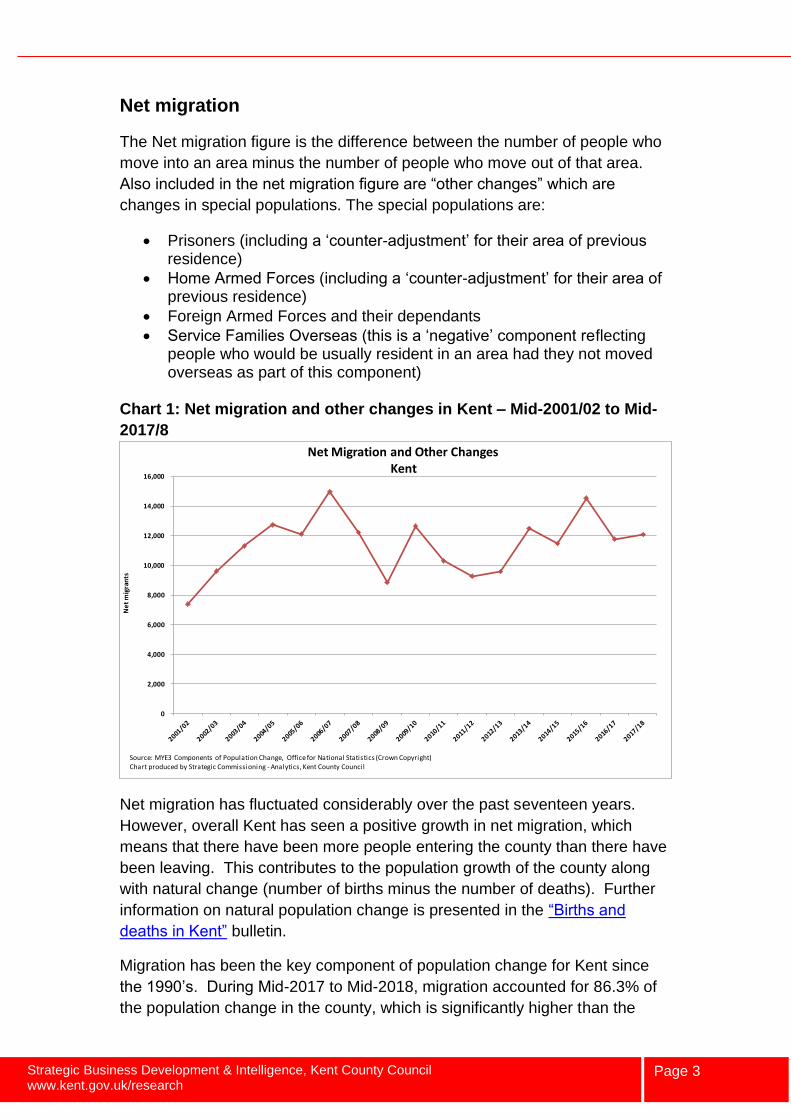
Net migration
The Net migration figure is the difference between the number of people who
move into an area minus the number of people who move out of that area.
Also included in the net migration figure are “other changes” which are
changes in special populations. The special populations are:
• Prisoners (including a ‘counter-adjustment’ for their area of previous residence)
• Home Armed Forces (including a ‘counter-adjustment’ for their area of previous residence)
• Foreign Armed Forces and their dependants
• Service Families Overseas (this is a ‘negative’ component reflecting people who would be usually resident in an area had they not moved overseas as part of this component)
Chart 1: Net migration and other changes in Kent – Mid-2001/02 to Mid-
2017/8
Net migration has fluctuated considerably over the past seventeen years.
However, overall Kent has seen a positive growth in net migration, which
means that there have been more people entering the county than there have
been leaving. This contributes to the population growth of the county along
with natural change (number of births minus the number of deaths). Further
information on natural population change is presented in the “Births and
deaths in Kent” bulletin.
Migration has been the key component of population change for Kent since
the 1990’s. During Mid-2017 to Mid-2018, migration accounted for 86.3% of
the population change in the county, which is significantly higher than the
0
2,000
4,000
6,000
8,000
10,000
12,000
14,000
16,000
Ne
t m
igra
nts
Net Migration and Other ChangesKent
Source: MYE3 Components of Population Change, Office for National Statistics (Crown Copyright)Chart produced by Strategic Commissioning - Analytics, Kent County Council
Strategic Business Development & Intelligence, Kent County Council www.kent.gov.uk/research
Page 4
national average (65.2%). Further information is presented in the “What’s
causing Kent’s population growth?” bulletin.
Net migration to the county reached a peak in mid-2006 to mid-2007 when
Kent saw 15,000 net migrants in a single year. In the latest year there were
12,100 net migrants to Kent which is an increase of 300 from last year.
Seven out of 12 Kent districts have seen net migration increase during Mid-
2017 and mid-2018. Canterbury, Dartford, Dover and Tunbridge Wells are
the only local authorities to have experienced a decline in net migration in the
past year.
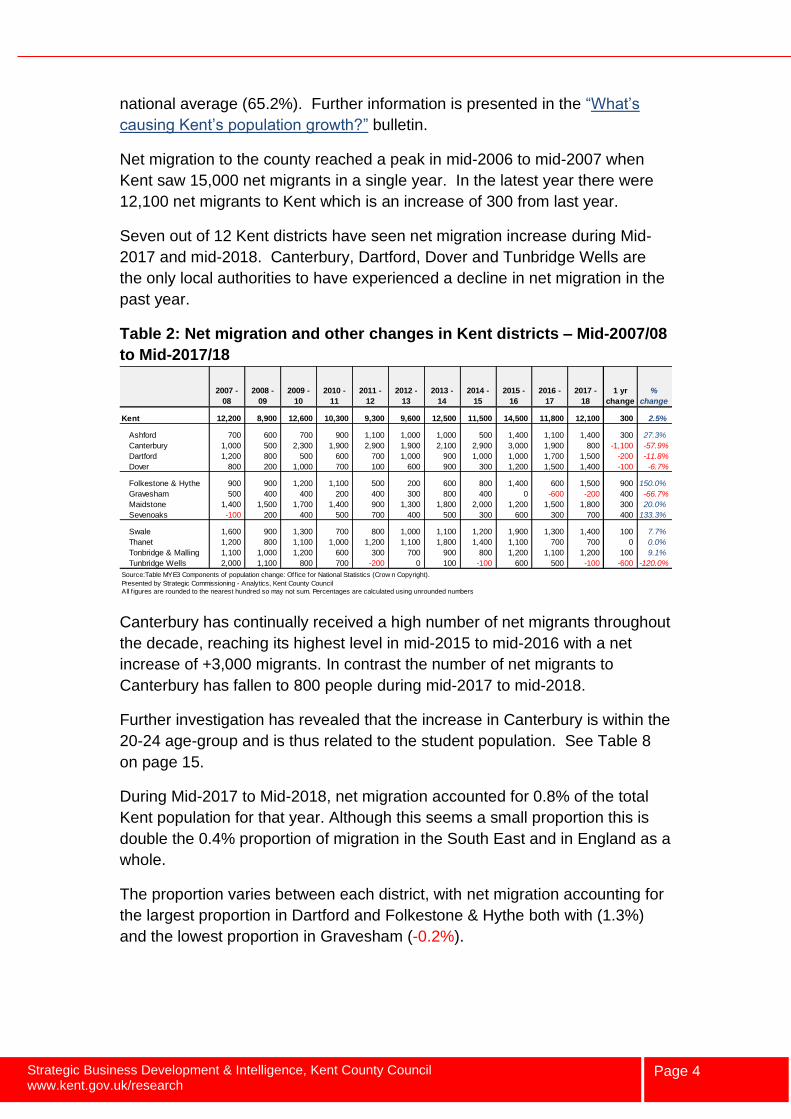
Table 2: Net migration and other changes in Kent districts – Mid-2007/08
to Mid-2017/18
Canterbury has continually received a high number of net migrants throughout
the decade, reaching its highest level in mid-2015 to mid-2016 with a net
increase of +3,000 migrants. In contrast the number of net migrants to
Canterbury has fallen to 800 people during mid-2017 to mid-2018.
Further investigation has revealed that the increase in Canterbury is within the
20-24 age-group and is thus related to the student population. See Table 8
on page 15.
During Mid-2017 to Mid-2018, net migration accounted for 0.8% of the total
Kent population for that year. Although this seems a small proportion this is
double the 0.4% proportion of migration in the South East and in England as a
whole.
The proportion varies between each district, with net migration accounting for
the largest proportion in Dartford and Folkestone & Hythe both with (1.3%)
and the lowest proportion in Gravesham (-0.2%).
2007 -
08
2008 -
09
2009 -
10
2010 -
11
2011 -
12
2012 -
13
2013 -
14
2014 -
15
2015 -
16
2016 -
17
2017 -
18
1 yr
change
%
change
Kent 12,200 8,900 12,600 10,300 9,300 9,600 12,500 11,500 14,500 11,800 12,100 300 2.5%
Ashford 700 600 700 900 1,100 1,000 1,000 500 1,400 1,100 1,400 300 27.3%
Canterbury 1,000 500 2,300 1,900 2,900 1,900 2,100 2,900 3,000 1,900 800 -1,100 -57.9%
Dartford 1,200 800 500 600 700 1,000 900 1,000 1,000 1,700 1,500 -200 -11.8%
Dover 800 200 1,000 700 100 600 900 300 1,200 1,500 1,400 -100 -6.7%
Folkestone & Hythe 900 900 1,200 1,100 500 200 600 800 1,400 600 1,500 900 150.0%
Gravesham 500 400 400 200 400 300 800 400 0 -600 -200 400 -66.7%
Maidstone 1,400 1,500 1,700 1,400 900 1,300 1,800 2,000 1,200 1,500 1,800 300 20.0%
Sevenoaks -100 200 400 500 700 400 500 300 600 300 700 400 133.3%
Swale 1,600 900 1,300 700 800 1,000 1,100 1,200 1,900 1,300 1,400 100 7.7%
Thanet 1,200 800 1,100 1,000 1,200 1,100 1,800 1,400 1,100 700 700 0 0.0%
Tonbridge & Malling 1,100 1,000 1,200 600 300 700 900 800 1,200 1,100 1,200 100 9.1%
Tunbridge Wells 2,000 1,100 800 700 -200 0 100 -100 600 500 -100 -600 -120.0%
Source:Table MYE3 Components of population change: Office for National Statistics (Crow n Copyright).
Presented by Strategic Commissioning - Analytics, Kent County Council
All f igures are rounded to the nearest hundred so may not sum. Percentages are calculated using unrounded numbers
Strategic Business Development & Intelligence, Kent County Council www.kent.gov.uk/research
Page 5
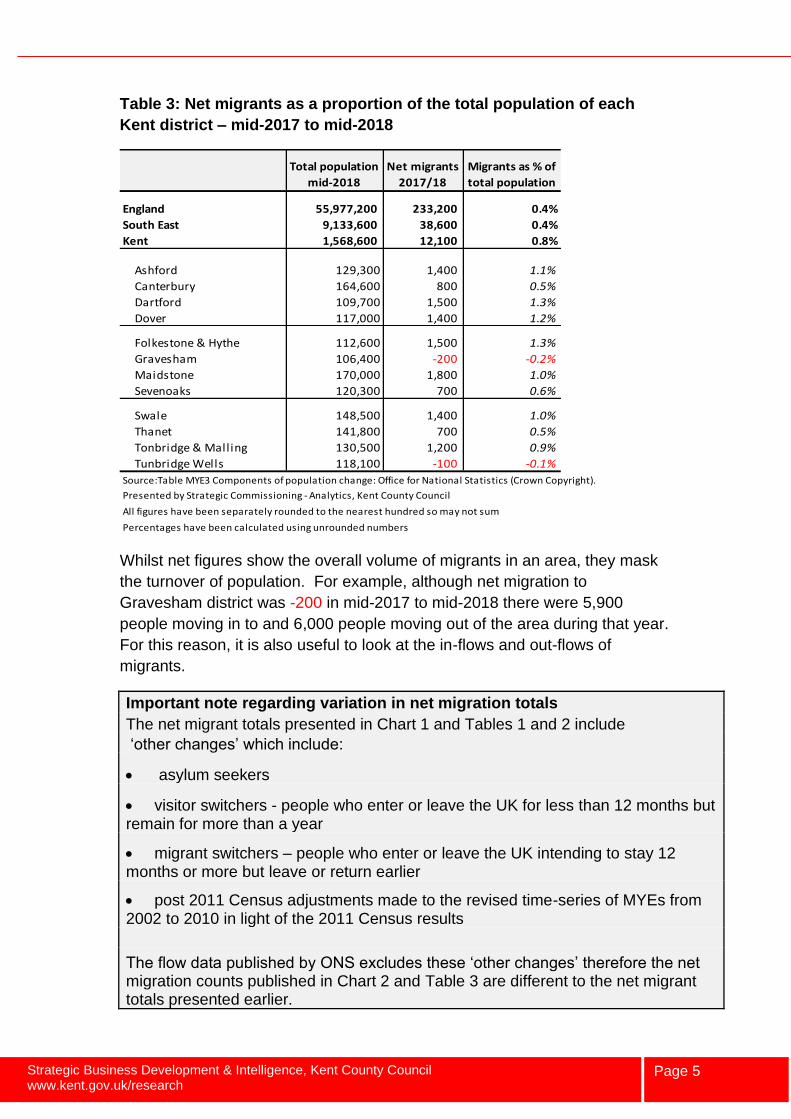
Table 3: Net migrants as a proportion of the total population of each
Kent district – mid-2017 to mid-2018
Whilst net figures show the overall volume of migrants in an area, they mask
the turnover of population. For example, although net migration to
Gravesham district was -200 in mid-2017 to mid-2018 there were 5,900
people moving in to and 6,000 people moving out of the area during that year.
For this reason, it is also useful to look at the in-flows and out-flows of
migrants.
Important note regarding variation in net migration totals
The net migrant totals presented in Chart 1 and Tables 1 and 2 include
‘other changes’ which include:
• asylum seekers
• visitor switchers - people who enter or leave the UK for less than 12 months but remain for more than a year
• migrant switchers – people who enter or leave the UK intending to stay 12 months or more but leave or return earlier
• post 2011 Census adjustments made to the revised time-series of MYEs from 2002 to 2010 in light of the 2011 Census results
The flow data published by ONS excludes these ‘other changes’ therefore the net migration counts published in Chart 2 and Table 3 are different to the net migrant totals presented earlier.
Total population
mid-2018
Net migrants
2017/18
Migrants as % of
total population
England 55,977,200 233,200 0.4%
South East 9,133,600 38,600 0.4%
Kent 1,568,600 12,100 0.8%
Ashford 129,300 1,400 1.1%
Canterbury 164,600 800 0.5%
Dartford 109,700 1,500 1.3%
Dover 117,000 1,400 1.2%
Folkestone & Hythe 112,600 1,500 1.3%
Gravesham 106,400 -200 -0.2%
Maidstone 170,000 1,800 1.0%
Sevenoaks 120,300 700 0.6%
Swale 148,500 1,400 1.0%
Thanet 141,800 700 0.5%
Tonbridge & Malling 130,500 1,200 0.9%
Tunbridge Wells 118,100 -100 -0.1%
Source:Table MYE3 Components of population change: Office for National Statistics (Crown Copyright).
Presented by Strategic Commissioning - Analytics, Kent County Council
All figures have been separately rounded to the nearest hundred so may not sum
Percentages have been calculated using unrounded numbers
Strategic Business Development & Intelligence, Kent County Council www.kent.gov.uk/research
Page 6
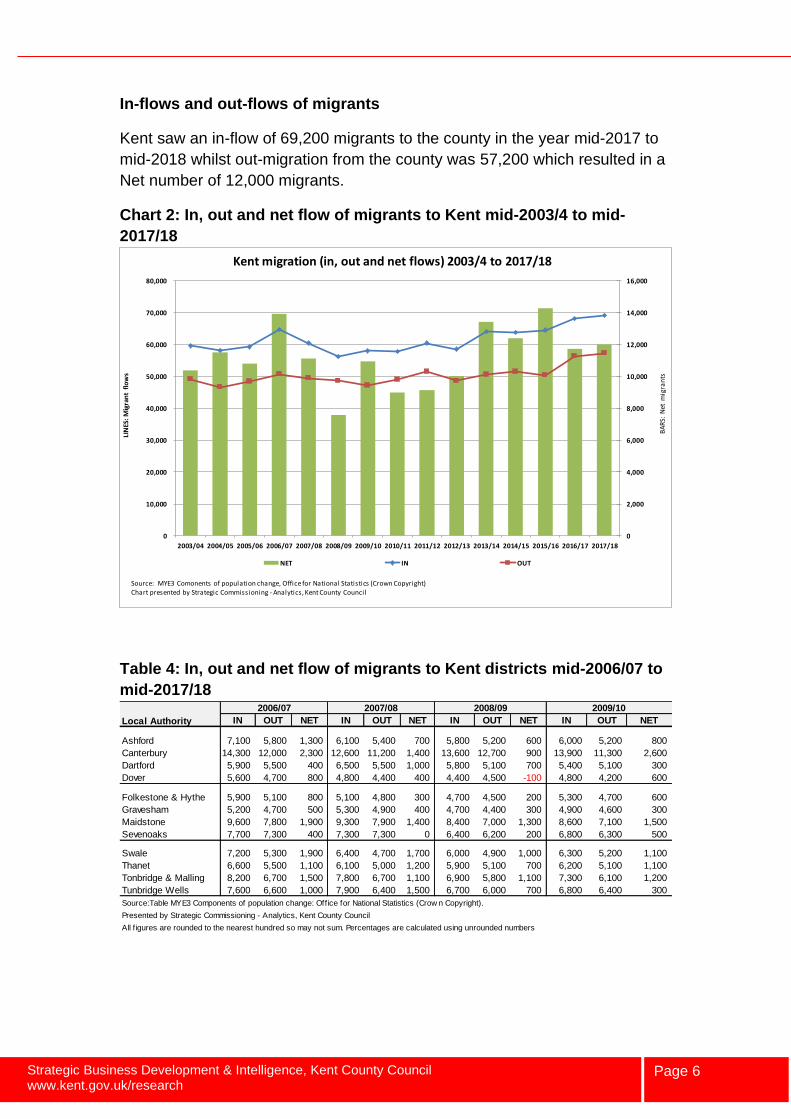
In-flows and out-flows of migrants
Kent saw an in-flow of 69,200 migrants to the county in the year mid-2017 to
mid-2018 whilst out-migration from the county was 57,200 which resulted in a
Net number of 12,000 migrants.
Chart 2: In, out and net flow of migrants to Kent mid-2003/4 to mid-
2017/18
Table 4: In, out and net flow of migrants to Kent districts mid-2006/07 to
mid-2017/18
0
2,000
4,000
6,000
8,000
10,000
12,000
14,000
16,000
0
10,000
20,000
30,000
40,000
50,000
60,000
70,000
80,000
2003/04 2004/05 2005/06 2006/07 2007/08 2008/09 2009/10 2010/11 2011/12 2012/13 2013/14 2014/15 2015/16 2016/17 2017/18
BA
RS:
Net
mig
ran
ts
LIN
ES:
Mig
ran
t fl
ow
s
Kent migration (in, out and net flows) 2003/4 to 2017/18
NET IN OUT
Source: MYE3 Comonents of population change, Office for National Statistics (Crown Copyright)Chart presented by Strategic Commissioning - Analytics, Kent County Council
2006/07 2007/08
IN OUT NET IN OUT NET IN OUT NET IN OUT NET
Ashford 7,100 5,800 1,300 6,100 5,400 700 5,800 5,200 600 6,000 5,200 800
Canterbury 14,300 12,000 2,300 12,600 11,200 1,400 13,600 12,700 900 13,900 11,300 2,600
Dartford 5,900 5,500 400 6,500 5,500 1,000 5,800 5,100 700 5,400 5,100 300
Dover 5,600 4,700 800 4,800 4,400 400 4,400 4,500 -100 4,800 4,200 600
Folkestone & Hythe 5,900 5,100 800 5,100 4,800 300 4,700 4,500 200 5,300 4,700 600
Gravesham 5,200 4,700 500 5,300 4,900 400 4,700 4,400 300 4,900 4,600 300
Maidstone 9,600 7,800 1,900 9,300 7,900 1,400 8,400 7,000 1,300 8,600 7,100 1,500
Sevenoaks 7,700 7,300 400 7,300 7,300 0 6,400 6,200 200 6,800 6,300 500
Swale 7,200 5,300 1,900 6,400 4,700 1,700 6,000 4,900 1,000 6,300 5,200 1,100
Thanet 6,600 5,500 1,100 6,100 5,000 1,200 5,900 5,100 700 6,200 5,100 1,100
Tonbridge & Malling 8,200 6,700 1,500 7,800 6,700 1,100 6,900 5,800 1,100 7,300 6,100 1,200
Tunbridge Wells 7,600 6,600 1,000 7,900 6,400 1,500 6,700 6,000 700 6,800 6,400 300
Source:Table MYE3 Components of population change: Office for National Statistics (Crow n Copyright).
Presented by Strategic Commissioning - Analytics, Kent County Council
All f igures are rounded to the nearest hundred so may not sum. Percentages are calculated using unrounded numbers
2009/102008/09
Local Authority
Strategic Business Development & Intelligence, Kent County Council www.kent.gov.uk/research
Page 7
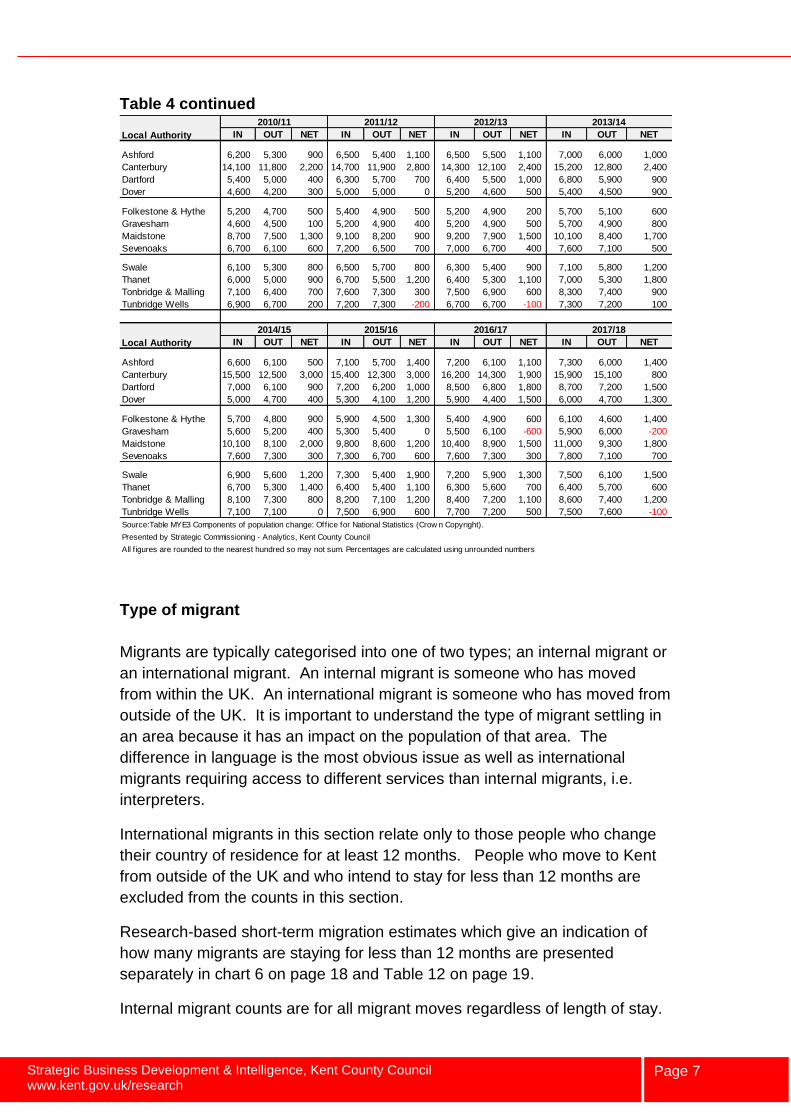
Table 4 continued
Type of migrant
Migrants are typically categorised into one of two types; an internal migrant or
an international migrant. An internal migrant is someone who has moved
from within the UK. An international migrant is someone who has moved from
outside of the UK. It is important to understand the type of migrant settling in
an area because it has an impact on the population of that area. The
difference in language is the most obvious issue as well as international
migrants requiring access to different services than internal migrants, i.e.
interpreters.
International migrants in this section relate only to those people who change
their country of residence for at least 12 months. People who move to Kent
from outside of the UK and who intend to stay for less than 12 months are
excluded from the counts in this section.
Research-based short-term migration estimates which give an indication of
how many migrants are staying for less than 12 months are presented
separately in chart 6 on page 18 and Table 12 on page 19.
Internal migrant counts are for all migrant moves regardless of length of stay.
2010/11 2011/12
IN OUT NET IN OUT NET IN OUT NET IN OUT NET
Ashford 6,200 5,300 900 6,500 5,400 1,100 6,500 5,500 1,100 7,000 6,000 1,000
Canterbury 14,100 11,800 2,200 14,700 11,900 2,800 14,300 12,100 2,400 15,200 12,800 2,400
Dartford 5,400 5,000 400 6,300 5,700 700 6,400 5,500 1,000 6,800 5,900 900
Dover 4,600 4,200 300 5,000 5,000 0 5,200 4,600 500 5,400 4,500 900
Folkestone & Hythe 5,200 4,700 500 5,400 4,900 500 5,200 4,900 200 5,700 5,100 600
Gravesham 4,600 4,500 100 5,200 4,900 400 5,200 4,900 500 5,700 4,900 800
Maidstone 8,700 7,500 1,300 9,100 8,200 900 9,200 7,900 1,500 10,100 8,400 1,700
Sevenoaks 6,700 6,100 600 7,200 6,500 700 7,000 6,700 400 7,600 7,100 500
Swale 6,100 5,300 800 6,500 5,700 800 6,300 5,400 900 7,100 5,800 1,200
Thanet 6,000 5,000 900 6,700 5,500 1,200 6,400 5,300 1,100 7,000 5,300 1,800
Tonbridge & Malling 7,100 6,400 700 7,600 7,300 300 7,500 6,900 600 8,300 7,400 900
Tunbridge Wells 6,900 6,700 200 7,200 7,300 -200 6,700 6,700 -100 7,300 7,200 100
2014/15 2015/16
IN OUT NET IN OUT NET IN OUT NET IN OUT NET
Ashford 6,600 6,100 500 7,100 5,700 1,400 7,200 6,100 1,100 7,300 6,000 1,400
Canterbury 15,500 12,500 3,000 15,400 12,300 3,000 16,200 14,300 1,900 15,900 15,100 800
Dartford 7,000 6,100 900 7,200 6,200 1,000 8,500 6,800 1,800 8,700 7,200 1,500
Dover 5,000 4,700 400 5,300 4,100 1,200 5,900 4,400 1,500 6,000 4,700 1,300
Folkestone & Hythe 5,700 4,800 900 5,900 4,500 1,300 5,400 4,900 600 6,100 4,600 1,400
Gravesham 5,600 5,200 400 5,300 5,400 0 5,500 6,100 -600 5,900 6,000 -200
Maidstone 10,100 8,100 2,000 9,800 8,600 1,200 10,400 8,900 1,500 11,000 9,300 1,800
Sevenoaks 7,600 7,300 300 7,300 6,700 600 7,600 7,300 300 7,800 7,100 700
Swale 6,900 5,600 1,200 7,300 5,400 1,900 7,200 5,900 1,300 7,500 6,100 1,500
Thanet 6,700 5,300 1,400 6,400 5,400 1,100 6,300 5,600 700 6,400 5,700 600
Tonbridge & Malling 8,100 7,300 800 8,200 7,100 1,200 8,400 7,200 1,100 8,600 7,400 1,200
Tunbridge Wells 7,100 7,100 0 7,500 6,900 600 7,700 7,200 500 7,500 7,600 -100
Source:Table MYE3 Components of population change: Office for National Statistics (Crow n Copyright).
Presented by Strategic Commissioning - Analytics, Kent County Council
All f igures are rounded to the nearest hundred so may not sum. Percentages are calculated using unrounded numbers
Local Authority
2013/14
Local Authority
2012/13
2016/17 2017/18
Strategic Business Development & Intelligence, Kent County Council www.kent.gov.uk/research
Page 8
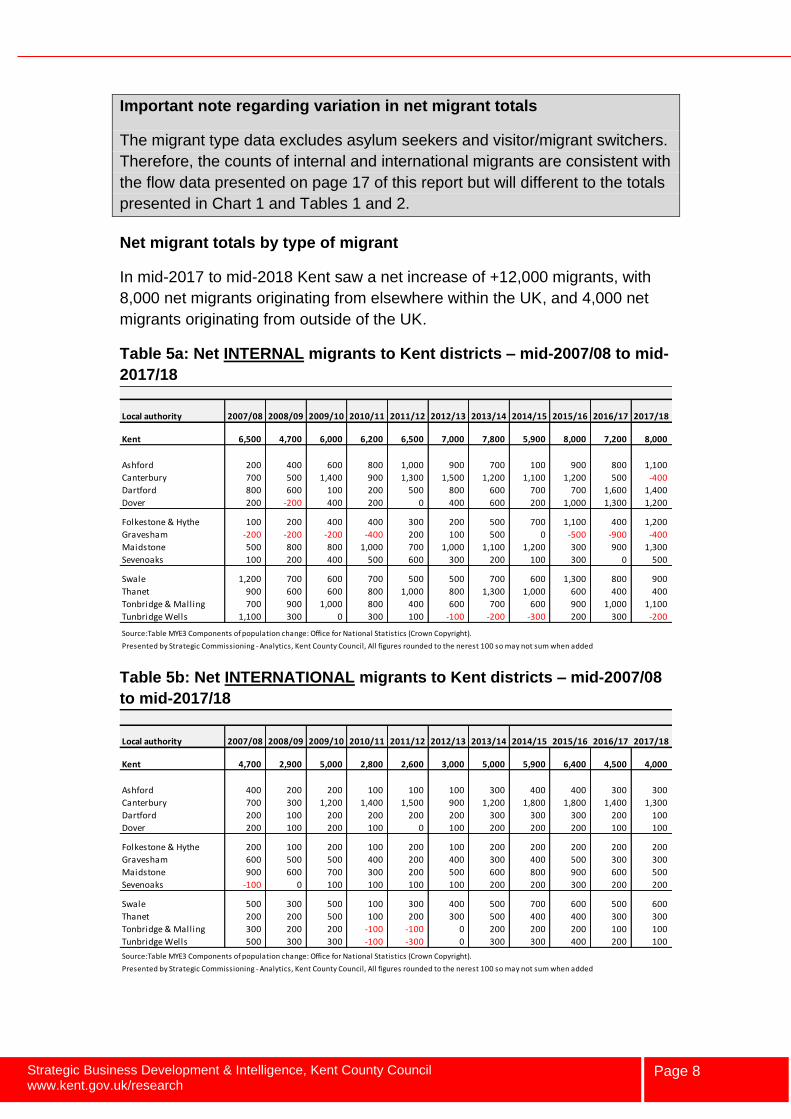
Important note regarding variation in net migrant totals
The migrant type data excludes asylum seekers and visitor/migrant switchers.
Therefore, the counts of internal and international migrants are consistent with
the flow data presented on page 17 of this report but will different to the totals
presented in Chart 1 and Tables 1 and 2.
Net migrant totals by type of migrant
In mid-2017 to mid-2018 Kent saw a net increase of +12,000 migrants, with
8,000 net migrants originating from elsewhere within the UK, and 4,000 net
migrants originating from outside of the UK.
Table 5a: Net INTERNAL migrants to Kent districts – mid-2007/08 to mid-
2017/18
Table 5b: Net INTERNATIONAL migrants to Kent districts – mid-2007/08
to mid-2017/18
Number of people
Local authority 2007/08 2008/09 2009/10 2010/11 2011/12 2012/13 2013/14 2014/15 2015/16 2016/17 2017/18
Kent 6,500 4,700 6,000 6,200 6,500 7,000 7,800 5,900 8,000 7,200 8,000
Ashford 200 400 600 800 1,000 900 700 100 900 800 1,100
Canterbury 700 500 1,400 900 1,300 1,500 1,200 1,100 1,200 500 -400
Dartford 800 600 100 200 500 800 600 700 700 1,600 1,400
Dover 200 -200 400 200 0 400 600 200 1,000 1,300 1,200
Folkestone & Hythe 100 200 400 400 300 200 500 700 1,100 400 1,200
Gravesham -200 -200 -200 -400 200 100 500 0 -500 -900 -400
Maidstone 500 800 800 1,000 700 1,000 1,100 1,200 300 900 1,300
Sevenoaks 100 200 400 500 600 300 200 100 300 0 500
Swale 1,200 700 600 700 500 500 700 600 1,300 800 900
Thanet 900 600 600 800 1,000 800 1,300 1,000 600 400 400
Tonbridge & Malling 700 900 1,000 800 400 600 700 600 900 1,000 1,100
Tunbridge Wells 1,100 300 0 300 100 -100 -200 -300 200 300 -200
Source:Table MYE3 Components of population change: Office for National Statistics (Crown Copyright).
Presented by Strategic Commissioning - Analytics, Kent County Council, All figures rounded to the nerest 100 so may not sum when added
Local authority 2007/08 2008/09 2009/10 2010/11 2011/12 2012/13 2013/14 2014/15 2015/16 2016/17 2017/18
Kent 4,700 2,900 5,000 2,800 2,600 3,000 5,000 5,900 6,400 4,500 4,000
Ashford 400 200 200 100 100 100 300 400 400 300 300
Canterbury 700 300 1,200 1,400 1,500 900 1,200 1,800 1,800 1,400 1,300
Dartford 200 100 200 200 200 200 300 300 300 200 100
Dover 200 100 200 100 0 100 200 200 200 100 100
Folkestone & Hythe 200 100 200 100 200 100 200 200 200 200 200
Gravesham 600 500 500 400 200 400 300 400 500 300 300
Maidstone 900 600 700 300 200 500 600 800 900 600 500
Sevenoaks -100 0 100 100 100 100 200 200 300 200 200
Swale 500 300 500 100 300 400 500 700 600 500 600
Thanet 200 200 500 100 200 300 500 400 400 300 300
Tonbridge & Malling 300 200 200 -100 -100 0 200 200 200 100 100
Tunbridge Wells 500 300 300 -100 -300 0 300 300 400 200 100
Source:Table MYE3 Components of population change: Office for National Statistics (Crown Copyright).
Presented by Strategic Commissioning - Analytics, Kent County Council, All figures rounded to the nerest 100 so may not sum when added
Strategic Business Development & Intelligence, Kent County Council www.kent.gov.uk/research
Page 9
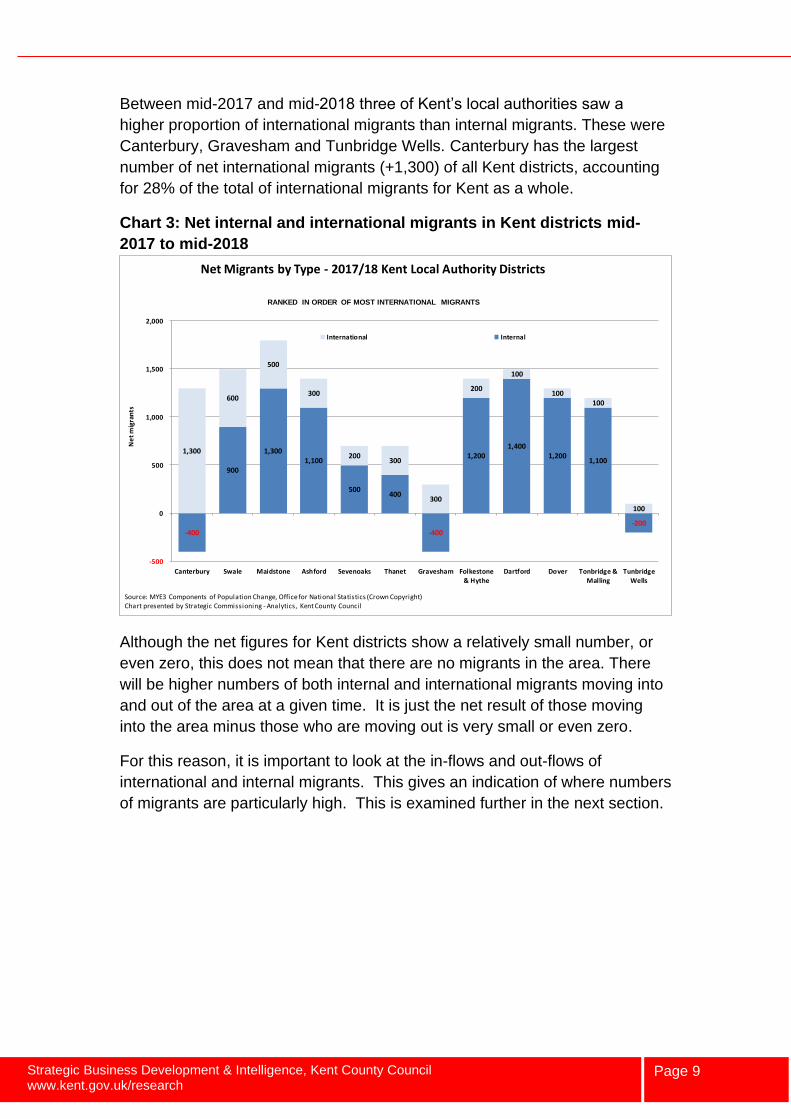
Between mid-2017 and mid-2018 three of Kent’s local authorities saw a
higher proportion of international migrants than internal migrants. These were
Canterbury, Gravesham and Tunbridge Wells. Canterbury has the largest
number of net international migrants (+1,300) of all Kent districts, accounting
for 28% of the total of international migrants for Kent as a whole.
Chart 3: Net internal and international migrants in Kent districts mid-
2017 to mid-2018
Although the net figures for Kent districts show a relatively small number, or
even zero, this does not mean that there are no migrants in the area. There
will be higher numbers of both internal and international migrants moving into
and out of the area at a given time. It is just the net result of those moving
into the area minus those who are moving out is very small or even zero.
For this reason, it is important to look at the in-flows and out-flows of
international and internal migrants. This gives an indication of where numbers
of migrants are particularly high. This is examined further in the next section.
-400
900
1,300 1,100
500 400
-400
1,200 1,400
1,200 1,100
-200
1,300
600
500
300
200 300
300
200
100
100 100
100
-500
0
500
1,000
1,500
2,000
Canterbury Swale Maidstone Ashford Sevenoaks Thanet Gravesham Folkestone
& Hythe
Dartford Dover Tonbridge &
Malling
Tunbridge
Wells
Ne
t m
igra
nts
Net Migrants by Type - 2017/18 Kent Local Authority Districts
International Internal
Source: MYE3 Components of Population Change, Office for National Statistics (Crown Copyright)Chart presented by Strategic Commissioning - Analytics, Kent County Council
RANKED IN ORDER OF MOST INTERNATIONAL MIGRANTS
Strategic Business Development & Intelligence, Kent County Council www.kent.gov.uk/research
Page 10
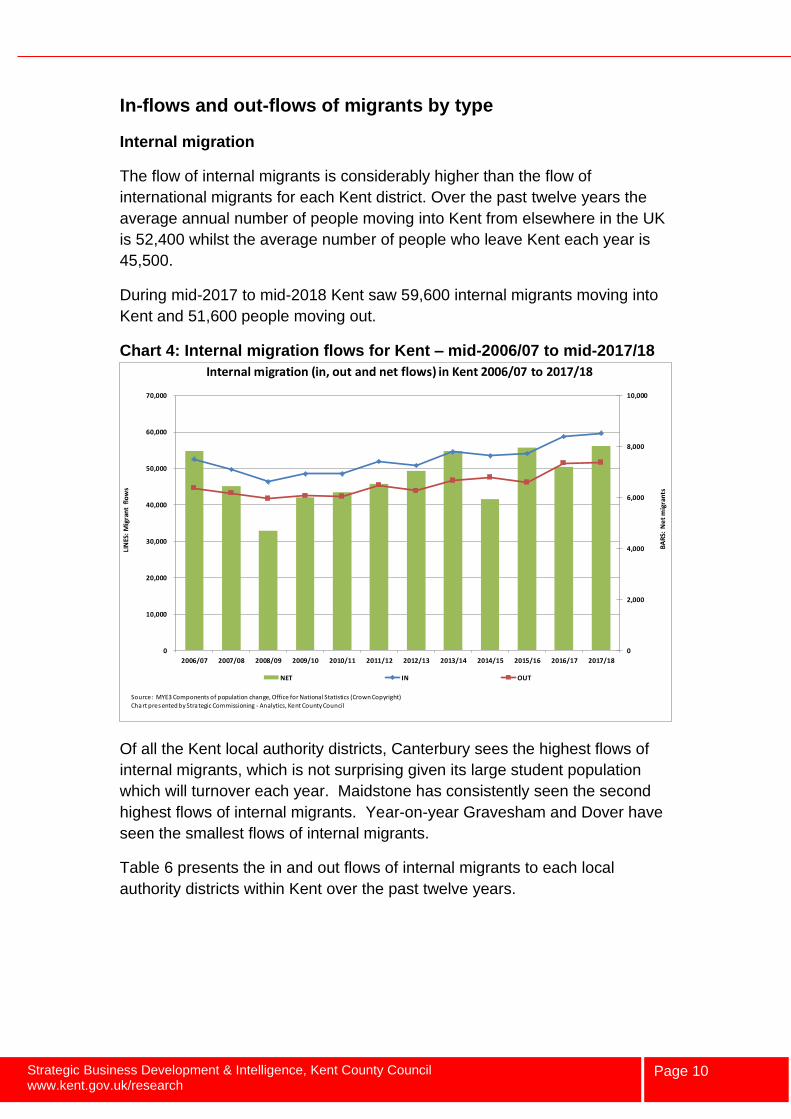
In-flows and out-flows of migrants by type
Internal migration
The flow of internal migrants is considerably higher than the flow of
international migrants for each Kent district. Over the past twelve years the
average annual number of people moving into Kent from elsewhere in the UK
is 52,400 whilst the average number of people who leave Kent each year is
45,500.
During mid-2017 to mid-2018 Kent saw 59,600 internal migrants moving into
Kent and 51,600 people moving out.
Chart 4: Internal migration flows for Kent – mid-2006/07 to mid-2017/18
Of all the Kent local authority districts, Canterbury sees the highest flows of
internal migrants, which is not surprising given its large student population
which will turnover each year. Maidstone has consistently seen the second
highest flows of internal migrants. Year-on-year Gravesham and Dover have
seen the smallest flows of internal migrants.
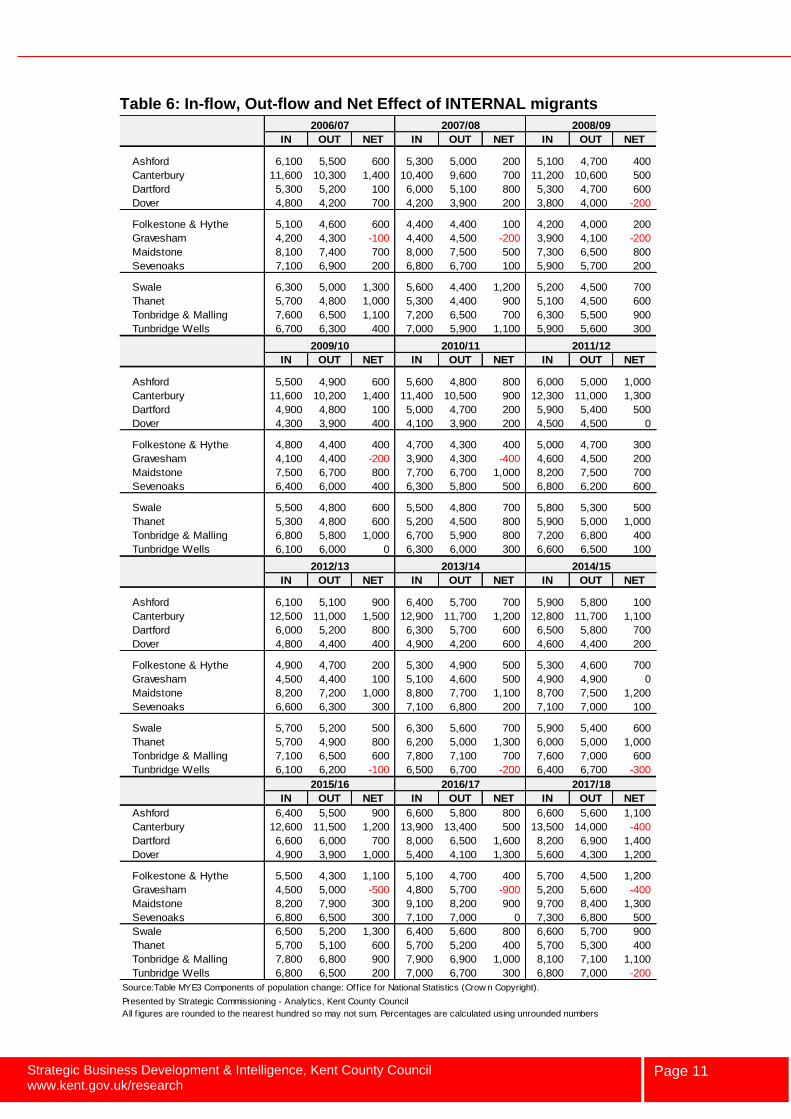
Table 6 presents the in and out flows of internal migrants to each local
authority districts within Kent over the past twelve years.
0
2,000
4,000
6,000
8,000
10,000
0
10,000
20,000
30,000
40,000
50,000
60,000
70,000
2006/07 2007/08 2008/09 2009/10 2010/11 2011/12 2012/13 2013/14 2014/15 2015/16 2016/17 2017/18B
AR
S: N
et
mig
ran
ts
LIN
ES:
Mig
ran
t fl
ow
s
Internal migration (in, out and net flows) in Kent 2006/07 to 2017/18
NET IN OUT
Source: MYE3 Components of population change, Office for National Statistics (Crown Copyright)Chart presented by Strategic Commissioning - Analytics, Kent County Council
Strategic Business Development & Intelligence, Kent County Council www.kent.gov.uk/research
Page 11
Table 6: In-flow, Out-flow and Net Effect of INTERNAL migrants
2006/07 2007/08 2008/09
IN OUT NET IN OUT NET IN OUT NET
Ashford 6,100 5,500 600 5,300 5,000 200 5,100 4,700 400
Canterbury 11,600 10,300 1,400 10,400 9,600 700 11,200 10,600 500
Dartford 5,300 5,200 100 6,000 5,100 800 5,300 4,700 600
Dover 4,800 4,200 700 4,200 3,900 200 3,800 4,000 -200
Folkestone & Hythe 5,100 4,600 600 4,400 4,400 100 4,200 4,000 200
Gravesham 4,200 4,300 -100 4,400 4,500 -200 3,900 4,100 -200
Maidstone 8,100 7,400 700 8,000 7,500 500 7,300 6,500 800
Sevenoaks 7,100 6,900 200 6,800 6,700 100 5,900 5,700 200
Swale 6,300 5,000 1,300 5,600 4,400 1,200 5,200 4,500 700
Thanet 5,700 4,800 1,000 5,300 4,400 900 5,100 4,500 600
Tonbridge & Malling 7,600 6,500 1,100 7,200 6,500 700 6,300 5,500 900
Tunbridge Wells 6,700 6,300 400 7,000 5,900 1,100 5,900 5,600 300
2009/10 2010/11 2011/12
IN OUT NET IN OUT NET IN OUT NET
Ashford 5,500 4,900 600 5,600 4,800 800 6,000 5,000 1,000
Canterbury 11,600 10,200 1,400 11,400 10,500 900 12,300 11,000 1,300
Dartford 4,900 4,800 100 5,000 4,700 200 5,900 5,400 500
Dover 4,300 3,900 400 4,100 3,900 200 4,500 4,500 0
Folkestone & Hythe 4,800 4,400 400 4,700 4,300 400 5,000 4,700 300
Gravesham 4,100 4,400 -200 3,900 4,300 -400 4,600 4,500 200
Maidstone 7,500 6,700 800 7,700 6,700 1,000 8,200 7,500 700
Sevenoaks 6,400 6,000 400 6,300 5,800 500 6,800 6,200 600
Swale 5,500 4,800 600 5,500 4,800 700 5,800 5,300 500
Thanet 5,300 4,800 600 5,200 4,500 800 5,900 5,000 1,000
Tonbridge & Malling 6,800 5,800 1,000 6,700 5,900 800 7,200 6,800 400
Tunbridge Wells 6,100 6,000 0 6,300 6,000 300 6,600 6,500 100
2012/13 2013/14 2014/15
IN OUT NET IN OUT NET IN OUT NET
Ashford 6,100 5,100 900 6,400 5,700 700 5,900 5,800 100
Canterbury 12,500 11,000 1,500 12,900 11,700 1,200 12,800 11,700 1,100
Dartford 6,000 5,200 800 6,300 5,700 600 6,500 5,800 700
Dover 4,800 4,400 400 4,900 4,200 600 4,600 4,400 200
Folkestone & Hythe 4,900 4,700 200 5,300 4,900 500 5,300 4,600 700
Gravesham 4,500 4,400 100 5,100 4,600 500 4,900 4,900 0
Maidstone 8,200 7,200 1,000 8,800 7,700 1,100 8,700 7,500 1,200
Sevenoaks 6,600 6,300 300 7,100 6,800 200 7,100 7,000 100
Swale 5,700 5,200 500 6,300 5,600 700 5,900 5,400 600
Thanet 5,700 4,900 800 6,200 5,000 1,300 6,000 5,000 1,000
Tonbridge & Malling 7,100 6,500 600 7,800 7,100 700 7,600 7,000 600
Tunbridge Wells 6,100 6,200 -100 6,500 6,700 -200 6,400 6,700 -300
2015/16 2016/17 2017/18
IN OUT NET IN OUT NET IN OUT NET
Ashford 6,400 5,500 900 6,600 5,800 800 6,600 5,600 1,100
Canterbury 12,600 11,500 1,200 13,900 13,400 500 13,500 14,000 -400
Dartford 6,600 6,000 700 8,000 6,500 1,600 8,200 6,900 1,400
Dover 4,900 3,900 1,000 5,400 4,100 1,300 5,600 4,300 1,200
Folkestone & Hythe 5,500 4,300 1,100 5,100 4,700 400 5,700 4,500 1,200
Gravesham 4,500 5,000 -500 4,800 5,700 -900 5,200 5,600 -400
Maidstone 8,200 7,900 300 9,100 8,200 900 9,700 8,400 1,300
Sevenoaks 6,800 6,500 300 7,100 7,000 0 7,300 6,800 500
Swale 6,500 5,200 1,300 6,400 5,600 800 6,600 5,700 900
Thanet 5,700 5,100 600 5,700 5,200 400 5,700 5,300 400
Tonbridge & Malling 7,800 6,800 900 7,900 6,900 1,000 8,100 7,100 1,100
Tunbridge Wells 6,800 6,500 200 7,000 6,700 300 6,800 7,000 -200
Source:Table MYE3 Components of population change: Office for National Statistics (Crow n Copyright).
Presented by Strategic Commissioning - Analytics, Kent County Council
All f igures are rounded to the nearest hundred so may not sum. Percentages are calculated using unrounded numbers
Strategic Business Development & Intelligence, Kent County Council www.kent.gov.uk/research
Page 12
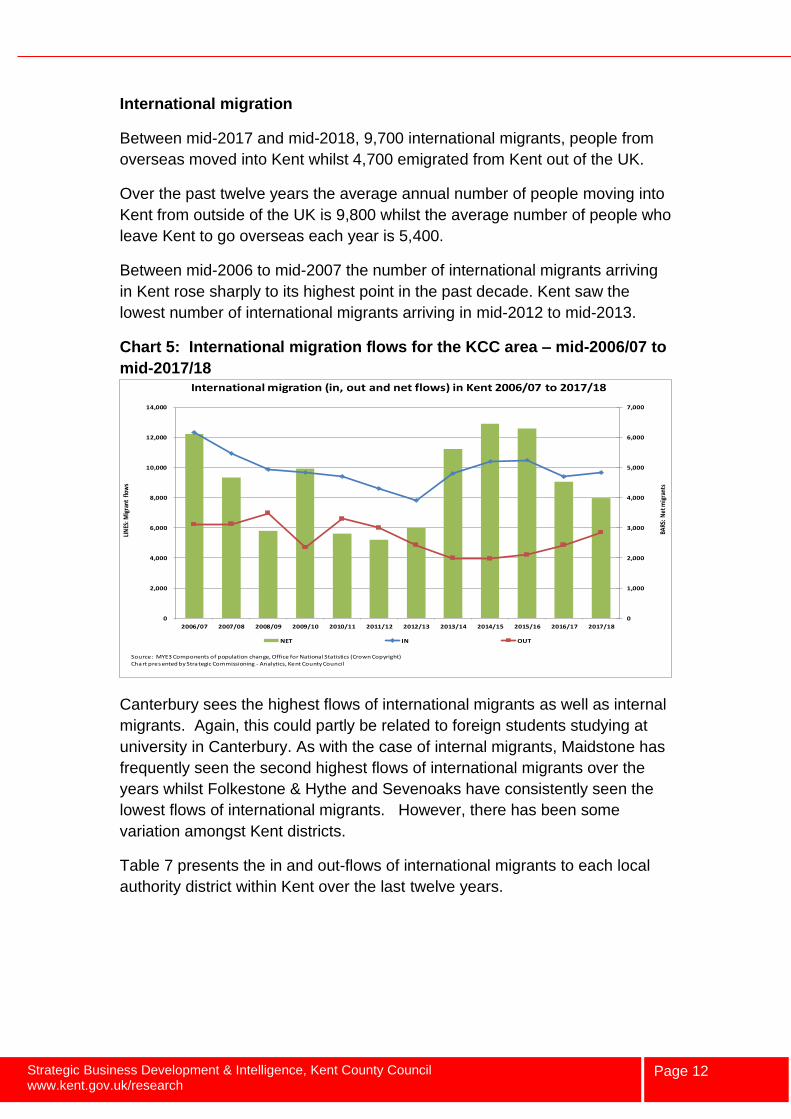
International migration
Between mid-2017 and mid-2018, 9,700 international migrants, people from
overseas moved into Kent whilst 4,700 emigrated from Kent out of the UK.
Over the past twelve years the average annual number of people moving into
Kent from outside of the UK is 9,800 whilst the average number of people who
leave Kent to go overseas each year is 5,400.
Between mid-2006 to mid-2007 the number of international migrants arriving
in Kent rose sharply to its highest point in the past decade. Kent saw the
lowest number of international migrants arriving in mid-2012 to mid-2013.
Chart 5: International migration flows for the KCC area – mid-2006/07 to
mid-2017/18
Canterbury sees the highest flows of international migrants as well as internal
migrants. Again, this could partly be related to foreign students studying at
university in Canterbury. As with the case of internal migrants, Maidstone has
frequently seen the second highest flows of international migrants over the
years whilst Folkestone & Hythe and Sevenoaks have consistently seen the
lowest flows of international migrants. However, there has been some
variation amongst Kent districts.
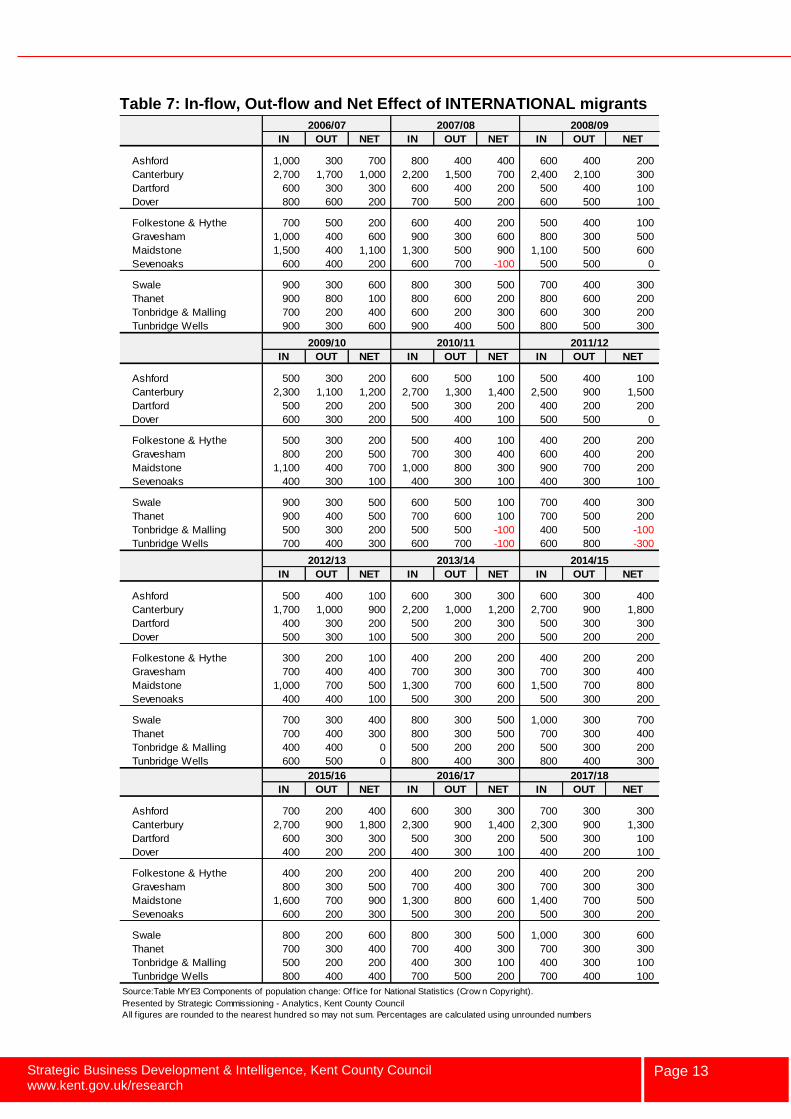
Table 7 presents the in and out-flows of international migrants to each local
authority district within Kent over the last twelve years.
0
1,000
2,000
3,000
4,000
5,000
6,000
7,000
0
2,000
4,000
6,000
8,000
10,000
12,000
14,000
2006/07 2007/08 2008/09 2009/10 2010/11 2011/12 2012/13 2013/14 2014/15 2015/16 2016/17 2017/18
BARS
: N
et m
igra
nts
LIN
ES: M
igra
nt f
low
s
International migration (in, out and net flows) in Kent 2006/07 to 2017/18
NET IN OUT
Source: MYE3 Components of population change, Office for National Statistics (Crown Copyright)Chart presented by Strategic Commissioning - Analytics, Kent County Council
Strategic Business Development & Intelligence, Kent County Council www.kent.gov.uk/research
Page 13
Table 7: In-flow, Out-flow and Net Effect of INTERNATIONAL migrants
2006/07 2007/08 2008/09
IN OUT NET IN OUT NET IN OUT NET
Ashford 1,000 300 700 800 400 400 600 400 200
Canterbury 2,700 1,700 1,000 2,200 1,500 700 2,400 2,100 300
Dartford 600 300 300 600 400 200 500 400 100
Dover 800 600 200 700 500 200 600 500 100
Folkestone & Hythe 700 500 200 600 400 200 500 400 100
Gravesham 1,000 400 600 900 300 600 800 300 500
Maidstone 1,500 400 1,100 1,300 500 900 1,100 500 600
Sevenoaks 600 400 200 600 700 -100 500 500 0
Swale 900 300 600 800 300 500 700 400 300
Thanet 900 800 100 800 600 200 800 600 200
Tonbridge & Malling 700 200 400 600 200 300 600 300 200
Tunbridge Wells 900 300 600 900 400 500 800 500 300
2009/10 2010/11 2011/12
IN OUT NET IN OUT NET IN OUT NET
Ashford 500 300 200 600 500 100 500 400 100
Canterbury 2,300 1,100 1,200 2,700 1,300 1,400 2,500 900 1,500
Dartford 500 200 200 500 300 200 400 200 200
Dover 600 300 200 500 400 100 500 500 0
Folkestone & Hythe 500 300 200 500 400 100 400 200 200
Gravesham 800 200 500 700 300 400 600 400 200
Maidstone 1,100 400 700 1,000 800 300 900 700 200
Sevenoaks 400 300 100 400 300 100 400 300 100
Swale 900 300 500 600 500 100 700 400 300
Thanet 900 400 500 700 600 100 700 500 200
Tonbridge & Malling 500 300 200 500 500 -100 400 500 -100
Tunbridge Wells 700 400 300 600 700 -100 600 800 -300
2012/13 2013/14 2014/15
IN OUT NET IN OUT NET IN OUT NET
Ashford 500 400 100 600 300 300 600 300 400
Canterbury 1,700 1,000 900 2,200 1,000 1,200 2,700 900 1,800
Dartford 400 300 200 500 200 300 500 300 300
Dover 500 300 100 500 300 200 500 200 200
Folkestone & Hythe 300 200 100 400 200 200 400 200 200
Gravesham 700 400 400 700 300 300 700 300 400
Maidstone 1,000 700 500 1,300 700 600 1,500 700 800
Sevenoaks 400 400 100 500 300 200 500 300 200
Swale 700 300 400 800 300 500 1,000 300 700
Thanet 700 400 300 800 300 500 700 300 400
Tonbridge & Malling 400 400 0 500 200 200 500 300 200
Tunbridge Wells 600 500 0 800 400 300 800 400 300
2015/16 2016/17 2017/18
IN OUT NET IN OUT NET IN OUT NET
Ashford 700 200 400 600 300 300 700 300 300
Canterbury 2,700 900 1,800 2,300 900 1,400 2,300 900 1,300
Dartford 600 300 300 500 300 200 500 300 100
Dover 400 200 200 400 300 100 400 200 100
Folkestone & Hythe 400 200 200 400 200 200 400 200 200
Gravesham 800 300 500 700 400 300 700 300 300
Maidstone 1,600 700 900 1,300 800 600 1,400 700 500
Sevenoaks 600 200 300 500 300 200 500 300 200
Swale 800 200 600 800 300 500 1,000 300 600
Thanet 700 300 400 700 400 300 700 300 300
Tonbridge & Malling 500 200 200 400 300 100 400 300 100
Tunbridge Wells 800 400 400 700 500 200 700 400 100
Source:Table MYE3 Components of population change: Office for National Statistics (Crow n Copyright).
Presented by Strategic Commissioning - Analytics, Kent County Council
All f igures are rounded to the nearest hundred so may not sum. Percentages are calculated using unrounded numbers
Strategic Business Development & Intelligence, Kent County Council www.kent.gov.uk/research
Page 14
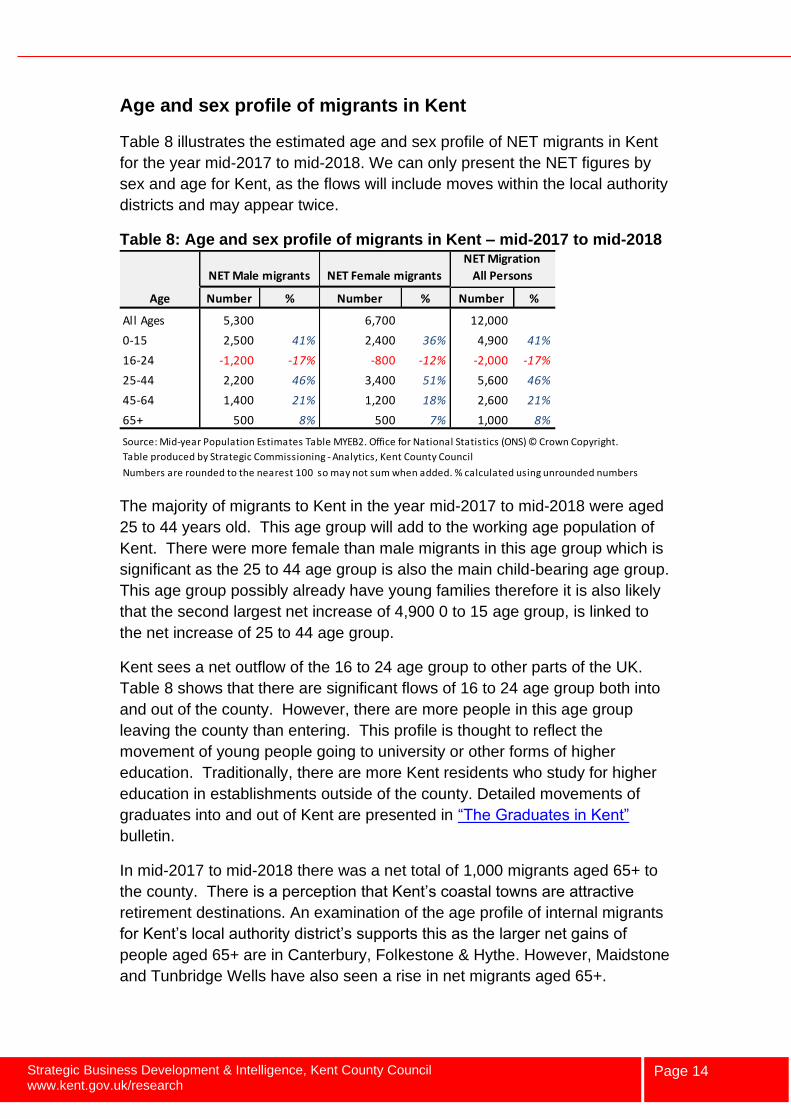
Age and sex profile of migrants in Kent
Table 8 illustrates the estimated age and sex profile of NET migrants in Kent
for the year mid-2017 to mid-2018. We can only present the NET figures by
sex and age for Kent, as the flows will include moves within the local authority
districts and may appear twice.
Table 8: Age and sex profile of migrants in Kent – mid-2017 to mid-2018
The majority of migrants to Kent in the year mid-2017 to mid-2018 were aged
25 to 44 years old. This age group will add to the working age population of
Kent. There were more female than male migrants in this age group which is
significant as the 25 to 44 age group is also the main child-bearing age group.
This age group possibly already have young families therefore it is also likely
that the second largest net increase of 4,900 0 to 15 age group, is linked to
the net increase of 25 to 44 age group.
Kent sees a net outflow of the 16 to 24 age group to other parts of the UK.
Table 8 shows that there are significant flows of 16 to 24 age group both into
and out of the county. However, there are more people in this age group
leaving the county than entering. This profile is thought to reflect the
movement of young people going to university or other forms of higher
education. Traditionally, there are more Kent residents who study for higher
education in establishments outside of the county. Detailed movements of
graduates into and out of Kent are presented in “The Graduates in Kent”
bulletin.
In mid-2017 to mid-2018 there was a net total of 1,000 migrants aged 65+ to
the county. There is a perception that Kent’s coastal towns are attractive
retirement destinations. An examination of the age profile of internal migrants
for Kent’s local authority district’s supports this as the larger net gains of
people aged 65+ are in Canterbury, Folkestone & Hythe. However, Maidstone
and Tunbridge Wells have also seen a rise in net migrants aged 65+.
NET Male migrants NET Female migrants
NET Migration
All Persons
Age Number % Number % Number %
All Ages 5,300 6,700 12,000
0-15 2,500 41% 2,400 36% 4,900 41%
16-24 -1,200 -17% -800 -12% -2,000 -17%
25-44 2,200 46% 3,400 51% 5,600 46%
45-64 1,400 21% 1,200 18% 2,600 21%
65+ 500 8% 500 7% 1,000 8%
Source: Mid-year Population Estimates Table MYEB2. Office for National Statistics (ONS) © Crown Copyright.
Table produced by Strategic Commissioning - Analytics, Kent County Council
Numbers are rounded to the nearest 100 so may not sum when added. % calculated using unrounded numbers
Strategic Business Development & Intelligence, Kent County Council www.kent.gov.uk/research
Page 15
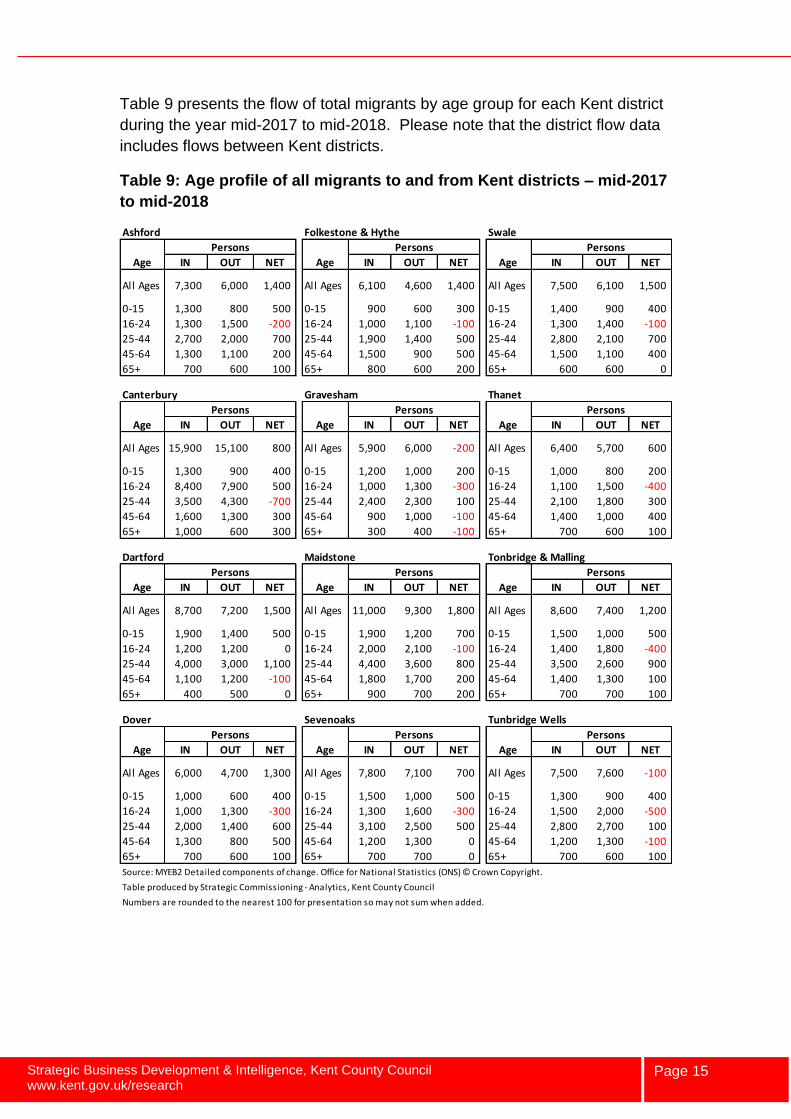
Table 9 presents the flow of total migrants by age group for each Kent district
during the year mid-2017 to mid-2018. Please note that the district flow data
includes flows between Kent districts.
Table 9: Age profile of all migrants to and from Kent districts – mid-2017
to mid-2018
Ashford Folkestone & Hythe Swale
Persons Persons Persons
Age IN OUT NET Age IN OUT NET Age IN OUT NET
All Ages 7,300 6,000 1,400 All Ages 6,100 4,600 1,400 All Ages 7,500 6,100 1,500
0-15 1,300 800 500 0-15 900 600 300 0-15 1,400 900 400
16-24 1,300 1,500 -200 16-24 1,000 1,100 -100 16-24 1,300 1,400 -100
25-44 2,700 2,000 700 25-44 1,900 1,400 500 25-44 2,800 2,100 700
45-64 1,300 1,100 200 45-64 1,500 900 500 45-64 1,500 1,100 400
65+ 700 600 100 65+ 800 600 200 65+ 600 600 0
Canterbury Gravesham Thanet
Persons Persons Persons
Age IN OUT NET Age IN OUT NET Age IN OUT NET
All Ages 15,900 15,100 800 All Ages 5,900 6,000 -200 All Ages 6,400 5,700 600
0-15 1,300 900 400 0-15 1,200 1,000 200 0-15 1,000 800 200
16-24 8,400 7,900 500 16-24 1,000 1,300 -300 16-24 1,100 1,500 -400
25-44 3,500 4,300 -700 25-44 2,400 2,300 100 25-44 2,100 1,800 300
45-64 1,600 1,300 300 45-64 900 1,000 -100 45-64 1,400 1,000 400
65+ 1,000 600 300 65+ 300 400 -100 65+ 700 600 100
Dartford Maidstone Tonbridge & Malling
Persons Persons Persons
Age IN OUT NET Age IN OUT NET Age IN OUT NET
All Ages 8,700 7,200 1,500 All Ages 11,000 9,300 1,800 All Ages 8,600 7,400 1,200
0-15 1,900 1,400 500 0-15 1,900 1,200 700 0-15 1,500 1,000 500
16-24 1,200 1,200 0 16-24 2,000 2,100 -100 16-24 1,400 1,800 -400
25-44 4,000 3,000 1,100 25-44 4,400 3,600 800 25-44 3,500 2,600 900
45-64 1,100 1,200 -100 45-64 1,800 1,700 200 45-64 1,400 1,300 100
65+ 400 500 0 65+ 900 700 200 65+ 700 700 100
Dover Sevenoaks Tunbridge Wells
Persons Persons Persons
Age IN OUT NET Age IN OUT NET Age IN OUT NET
All Ages 6,000 4,700 1,300 All Ages 7,800 7,100 700 All Ages 7,500 7,600 -100
0-15 1,000 600 400 0-15 1,500 1,000 500 0-15 1,300 900 400
16-24 1,000 1,300 -300 16-24 1,300 1,600 -300 16-24 1,500 2,000 -500
25-44 2,000 1,400 600 25-44 3,100 2,500 500 25-44 2,800 2,700 100
45-64 1,300 800 500 45-64 1,200 1,300 0 45-64 1,200 1,300 -100
65+ 700 600 100 65+ 700 700 0 65+ 700 600 100
Source: MYEB2 Detailed components of change. Office for National Statistics (ONS) © Crown Copyright.
Table produced by Strategic Commissioning - Analytics, Kent County Council
Numbers are rounded to the nearest 100 for presentation so may not sum when added.
Strategic Business Development & Intelligence, Kent County Council www.kent.gov.uk/research
Page 16
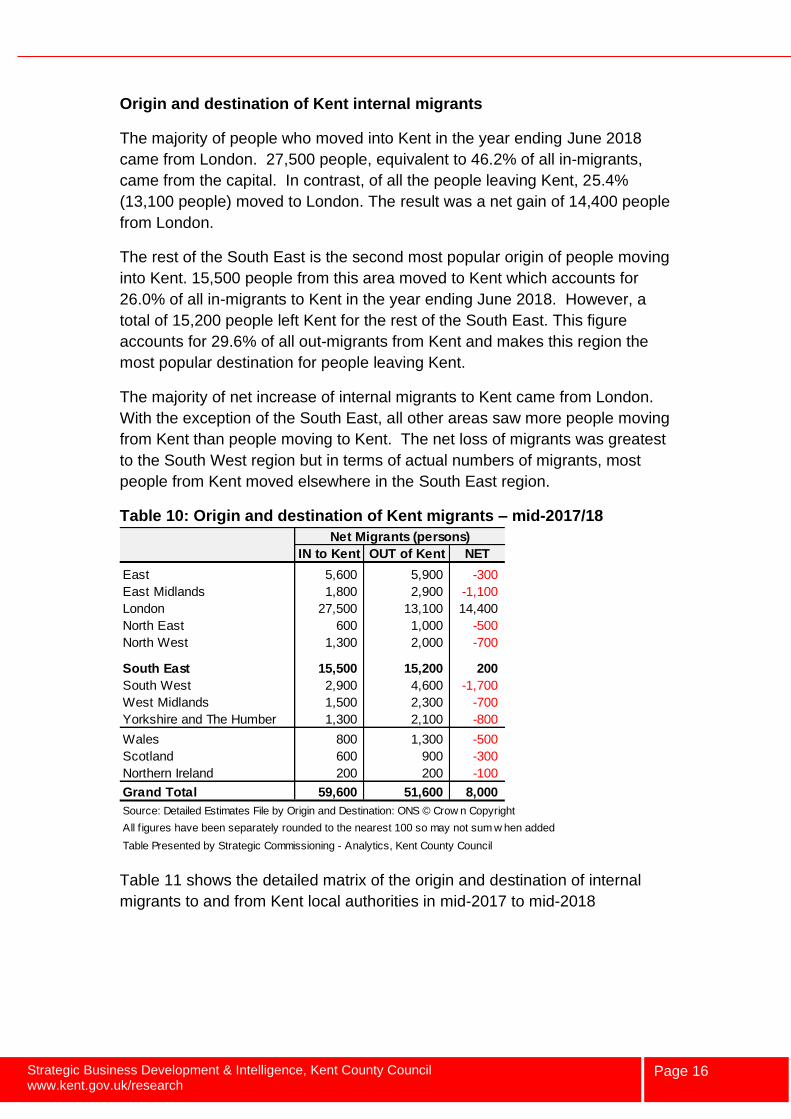
Origin and destination of Kent internal migrants
The majority of people who moved into Kent in the year ending June 2018
came from London. 27,500 people, equivalent to 46.2% of all in-migrants,
came from the capital. In contrast, of all the people leaving Kent, 25.4%
(13,100 people) moved to London. The result was a net gain of 14,400 people
from London.
The rest of the South East is the second most popular origin of people moving
into Kent. 15,500 people from this area moved to Kent which accounts for
26.0% of all in-migrants to Kent in the year ending June 2018. However, a
total of 15,200 people left Kent for the rest of the South East. This figure
accounts for 29.6% of all out-migrants from Kent and makes this region the
most popular destination for people leaving Kent.
The majority of net increase of internal migrants to Kent came from London.
With the exception of the South East, all other areas saw more people moving
from Kent than people moving to Kent. The net loss of migrants was greatest
to the South West region but in terms of actual numbers of migrants, most
people from Kent moved elsewhere in the South East region.
Table 10: Origin and destination of Kent migrants – mid-2017/18
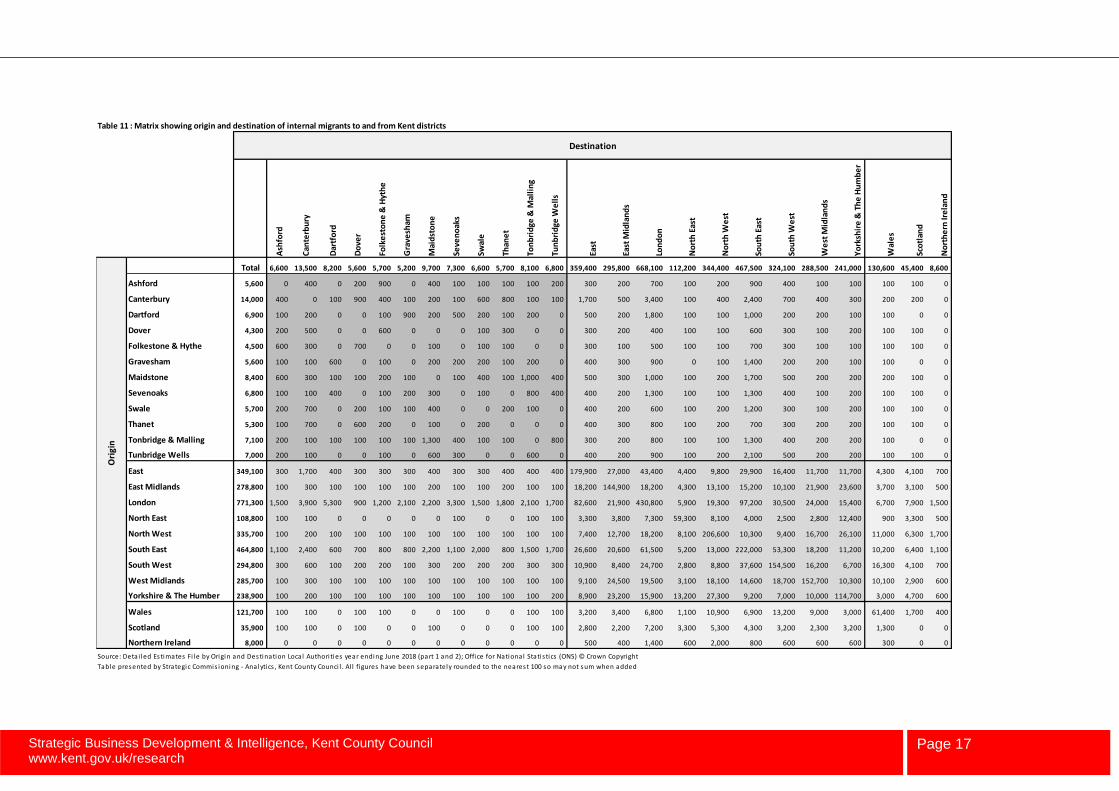
Table 11 shows the detailed matrix of the origin and destination of internal
migrants to and from Kent local authorities in mid-2017 to mid-2018
Net Migrants (persons)
IN to Kent OUT of Kent NET
East 5,600 5,900 -300
East Midlands 1,800 2,900 -1,100
London 27,500 13,100 14,400
North East 600 1,000 -500
North West 1,300 2,000 -700
South East 15,500 15,200 200
South West 2,900 4,600 -1,700
West Midlands 1,500 2,300 -700
Yorkshire and The Humber 1,300 2,100 -800
Wales 800 1,300 -500
Scotland 600 900 -300
Northern Ireland 200 200 -100
Grand Total 59,600 51,600 8,000
Source: Detailed Estimates File by Origin and Destination: ONS © Crow n Copyright
All f igures have been separately rounded to the nearest 100 so may not sum w hen added
Table Presented by Strategic Commissioning - Analytics, Kent County Council
Strategic Business Development & Intelligence, Kent County Council www.kent.gov.uk/research
Page 17
Table 11 : Matrix showing origin and destination of internal migrants to and from Kent districts
Destination
Ash
ford
Can
terb
ury
Dar
tfo
rd
Do
ver
Folk
est
on
e &
Hyt
he
Gra
vesh
am
Mai
dst
on
e
Seve
no
aks
Swal
e
Than
et
Ton
bri
dge
& M
alli
ng
Tun
bri
dge
We
lls
East
East
Mid
lan
ds
Lon
do
n
No
rth
Eas
t
No
rth
We
st
Sou
th E
ast
Sou
th W
est
We
st M
idla
nd
s
Yo
rksh
ire
& T
he
Hu
mb
er
Wal
es
Sco
tlan
d
No
rth
ern
Ire
lan
d
Total 6,600 13,500 8,200 5,600 5,700 5,200 9,700 7,300 6,600 5,700 8,100 6,800 359,400 295,800 668,100 112,200 344,400 467,500 324,100 288,500 241,000 130,600 45,400 8,600
Ashford 5,600 0 400 0 200 900 0 400 100 100 100 100 200 300 200 700 100 200 900 400 100 100 100 100 0
Canterbury 14,000 400 0 100 900 400 100 200 100 600 800 100 100 1,700 500 3,400 100 400 2,400 700 400 300 200 200 0
Dartford 6,900 100 200 0 0 100 900 200 500 200 100 200 0 500 200 1,800 100 100 1,000 200 200 100 100 0 0
Dover 4,300 200 500 0 0 600 0 0 0 100 300 0 0 300 200 400 100 100 600 300 100 200 100 100 0
Folkestone & Hythe 4,500 600 300 0 700 0 0 100 0 100 100 0 0 300 100 500 100 100 700 300 100 100 100 100 0
Gravesham 5,600 100 100 600 0 100 0 200 200 200 100 200 0 400 300 900 0 100 1,400 200 200 100 100 0 0
Maidstone 8,400 600 300 100 100 200 100 0 100 400 100 1,000 400 500 300 1,000 100 200 1,700 500 200 200 200 100 0
Sevenoaks 6,800 100 100 400 0 100 200 300 0 100 0 800 400 400 200 1,300 100 100 1,300 400 100 200 100 100 0
Swale 5,700 200 700 0 200 100 100 400 0 0 200 100 0 400 200 600 100 200 1,200 300 100 200 100 100 0
Thanet 5,300 100 700 0 600 200 0 100 0 200 0 0 0 400 300 800 100 200 700 300 200 200 100 100 0
Tonbridge & Malling 7,100 200 100 100 100 100 100 1,300 400 100 100 0 800 300 200 800 100 100 1,300 400 200 200 100 0 0
Tunbridge Wells 7,000 200 100 0 0 100 0 600 300 0 0 600 0 400 200 900 100 200 2,100 500 200 200 100 100 0
East 349,100 300 1,700 400 300 300 300 400 300 300 400 400 400 179,900 27,000 43,400 4,400 9,800 29,900 16,400 11,700 11,700 4,300 4,100 700
East Midlands 278,800 100 300 100 100 100 100 200 100 100 200 100 100 18,200 144,900 18,200 4,300 13,100 15,200 10,100 21,900 23,600 3,700 3,100 500
London 771,300 1,500 3,900 5,300 900 1,200 2,100 2,200 3,300 1,500 1,800 2,100 1,700 82,600 21,900 430,800 5,900 19,300 97,200 30,500 24,000 15,400 6,700 7,900 1,500
North East 108,800 100 100 0 0 0 0 0 100 0 0 100 100 3,300 3,800 7,300 59,300 8,100 4,000 2,500 2,800 12,400 900 3,300 500
North West 335,700 100 200 100 100 100 100 100 100 100 100 100 100 7,400 12,700 18,200 8,100 206,600 10,300 9,400 16,700 26,100 11,000 6,300 1,700
South East 464,800 1,100 2,400 600 700 800 800 2,200 1,100 2,000 800 1,500 1,700 26,600 20,600 61,500 5,200 13,000 222,000 53,300 18,200 11,200 10,200 6,400 1,100
South West 294,800 300 600 100 200 200 100 300 200 200 200 300 300 10,900 8,400 24,700 2,800 8,800 37,600 154,500 16,200 6,700 16,300 4,100 700
West Midlands 285,700 100 300 100 100 100 100 100 100 100 100 100 100 9,100 24,500 19,500 3,100 18,100 14,600 18,700 152,700 10,300 10,100 2,900 600
Yorkshire & The Humber 238,900 100 200 100 100 100 100 100 100 100 100 100 200 8,900 23,200 15,900 13,200 27,300 9,200 7,000 10,000 114,700 3,000 4,700 600
Wales 121,700 100 100 0 100 100 0 0 100 0 0 100 100 3,200 3,400 6,800 1,100 10,900 6,900 13,200 9,000 3,000 61,400 1,700 400
Scotland 35,900 100 100 0 100 0 0 100 0 0 0 100 100 2,800 2,200 7,200 3,300 5,300 4,300 3,200 2,300 3,200 1,300 0 0
Northern Ireland 8,000 0 0 0 0 0 0 0 0 0 0 0 0 500 400 1,400 600 2,000 800 600 600 600 300 0 0
Source: Deta i led Estimates Fi le by Origin and Destination Local Authori ties year ending June 2018 (part 1 and 2); Office for National Statis tics (ONS) © Crown Copyright
Table presented by Strategic Commis ioning - Analytics , Kent County Counci l . Al l figures have been separately rounded to the nearest 100 so may not sum when added
Ori
gin
Strategic Business Development & Intelligence, Kent County Council www.kent.gov.uk/research
Page 18
Local Migration Indicators
Short-term international migration estimates (experimental statistics)
Information on short-term international migration comes from the International
Passenger Survey and are estimates of short-term non-British migrants
satisfying the United Nations definition of a short-term migrant. These are
annual figures from Mid-year to Mid-year and are only available from mid-
2007 to mid-2008 up to mid-2016 to mid-2017 with the final year being
provisional figures.
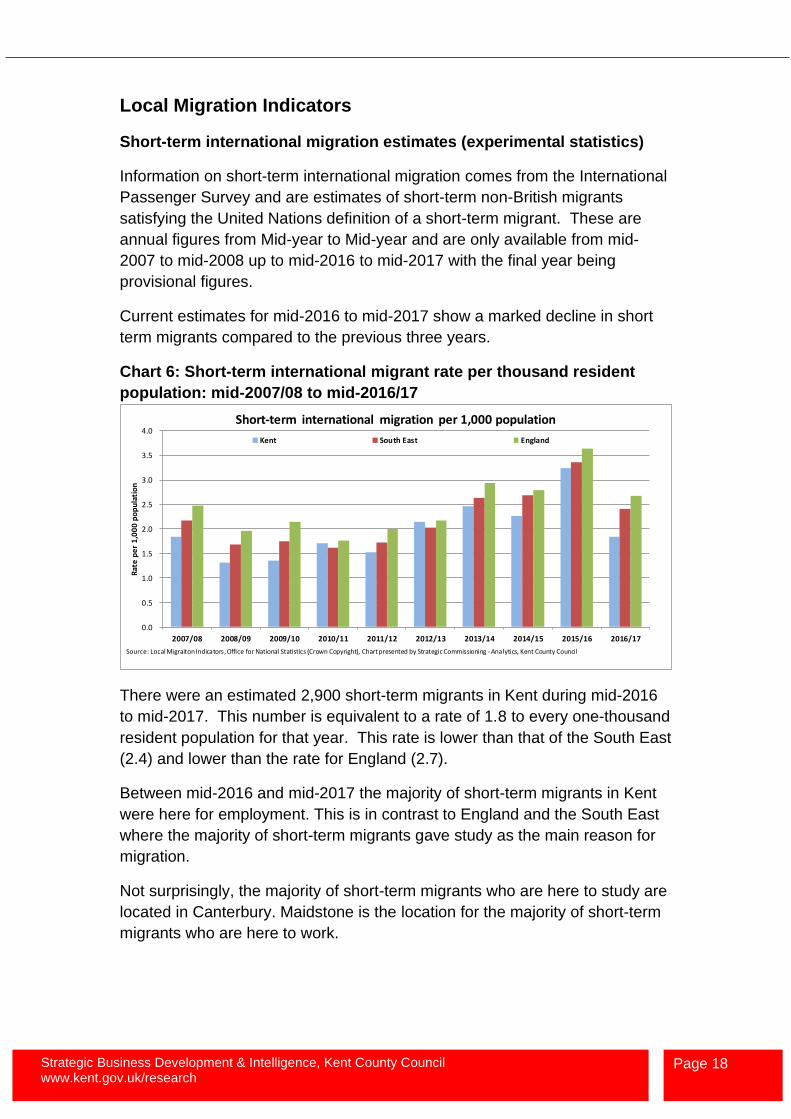
Current estimates for mid-2016 to mid-2017 show a marked decline in short
term migrants compared to the previous three years.
Chart 6: Short-term international migrant rate per thousand resident
population: mid-2007/08 to mid-2016/17
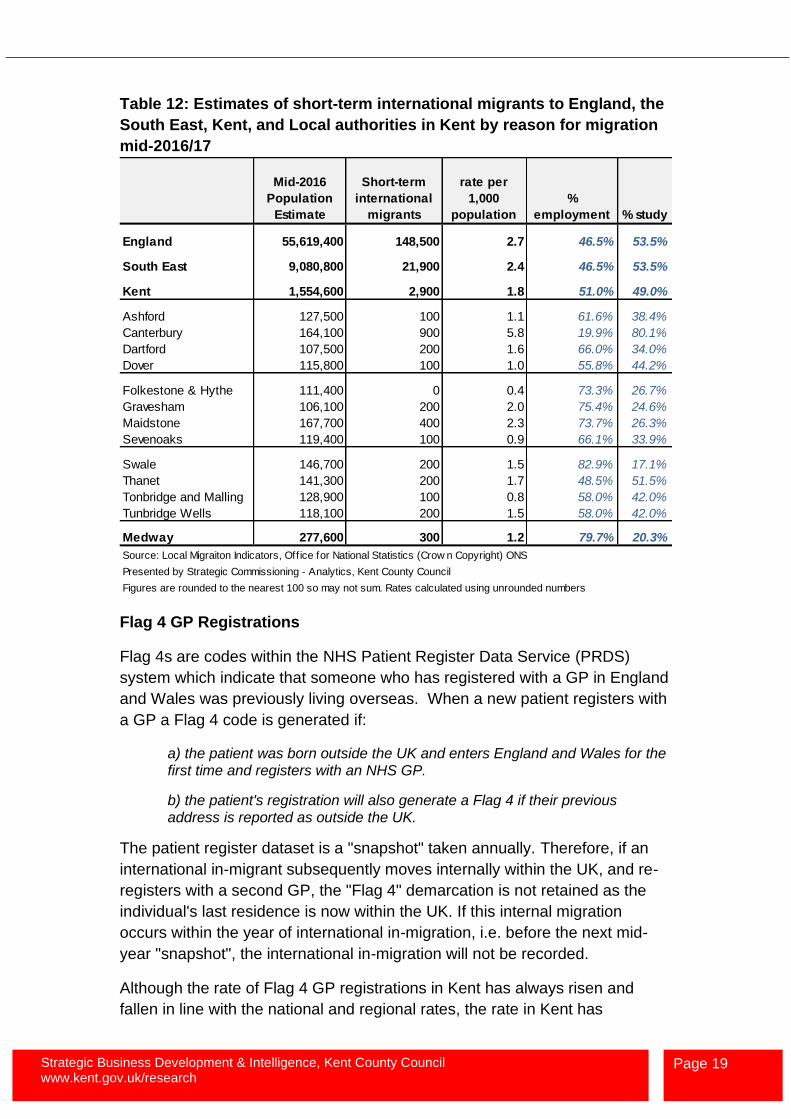
There were an estimated 2,900 short-term migrants in Kent during mid-2016
to mid-2017. This number is equivalent to a rate of 1.8 to every one-thousand
resident population for that year. This rate is lower than that of the South East
(2.4) and lower than the rate for England (2.7).
Between mid-2016 and mid-2017 the majority of short-term migrants in Kent
were here for employment. This is in contrast to England and the South East
where the majority of short-term migrants gave study as the main reason for
migration.
Not surprisingly, the majority of short-term migrants who are here to study are
located in Canterbury. Maidstone is the location for the majority of short-term
migrants who are here to work.
0.0
0.5
1.0
1.5
2.0
2.5
3.0
3.5
4.0
2007/08 2008/09 2009/10 2010/11 2011/12 2012/13 2013/14 2014/15 2015/16 2016/17
Rat
e p
er
1,0
00
po
pu
lati
on
Short-term international migration per 1,000 population
Kent South East England
Source: Local Migraiton Indicators, Office for National Statistics (Crown Copyright), Chart presented by Strategic Commissioning - Analytics, Kent County Council
Strategic Business Development & Intelligence, Kent County Council www.kent.gov.uk/research
Page 19
Table 12: Estimates of short-term international migrants to England, the
South East, Kent, and Local authorities in Kent by reason for migration
mid-2016/17
Flag 4 GP Registrations
Flag 4s are codes within the NHS Patient Register Data Service (PRDS)
system which indicate that someone who has registered with a GP in England
and Wales was previously living overseas. When a new patient registers with
a GP a Flag 4 code is generated if:
a) the patient was born outside the UK and enters England and Wales for the first time and registers with an NHS GP.
b) the patient's registration will also generate a Flag 4 if their previous address is reported as outside the UK.
The patient register dataset is a "snapshot" taken annually. Therefore, if an
international in-migrant subsequently moves internally within the UK, and re-
registers with a second GP, the "Flag 4" demarcation is not retained as the
individual's last residence is now within the UK. If this internal migration
occurs within the year of international in-migration, i.e. before the next mid-
year "snapshot", the international in-migration will not be recorded.
Although the rate of Flag 4 GP registrations in Kent has always risen and
fallen in line with the national and regional rates, the rate in Kent has
Mid-2016
Population
Estimate
Short-term
international
migrants
rate per
1,000
population
%
employment % study
England 55,619,400 148,500 2.7 46.5% 53.5%
South East 9,080,800 21,900 2.4 46.5% 53.5%
Kent 1,554,600 2,900 1.8 51.0% 49.0%
Ashford 127,500 100 1.1 61.6% 38.4%
Canterbury 164,100 900 5.8 19.9% 80.1%
Dartford 107,500 200 1.6 66.0% 34.0%
Dover 115,800 100 1.0 55.8% 44.2%
Folkestone & Hythe 111,400 0 0.4 73.3% 26.7%
Gravesham 106,100 200 2.0 75.4% 24.6%
Maidstone 167,700 400 2.3 73.7% 26.3%
Sevenoaks 119,400 100 0.9 66.1% 33.9%
Swale 146,700 200 1.5 82.9% 17.1%
Thanet 141,300 200 1.7 48.5% 51.5%
Tonbridge and Malling 128,900 100 0.8 58.0% 42.0%
Tunbridge Wells 118,100 200 1.5 58.0% 42.0%
Medway 277,600 300 1.2 79.7% 20.3%
Source: Local Migraiton Indicators, Office for National Statistics (Crow n Copyright) ONS
Presented by Strategic Commissioning - Analytics, Kent County Council
Figures are rounded to the nearest 100 so may not sum. Rates calculated using unrounded numbers
Strategic Business Development & Intelligence, Kent County Council www.kent.gov.uk/research
Page 20
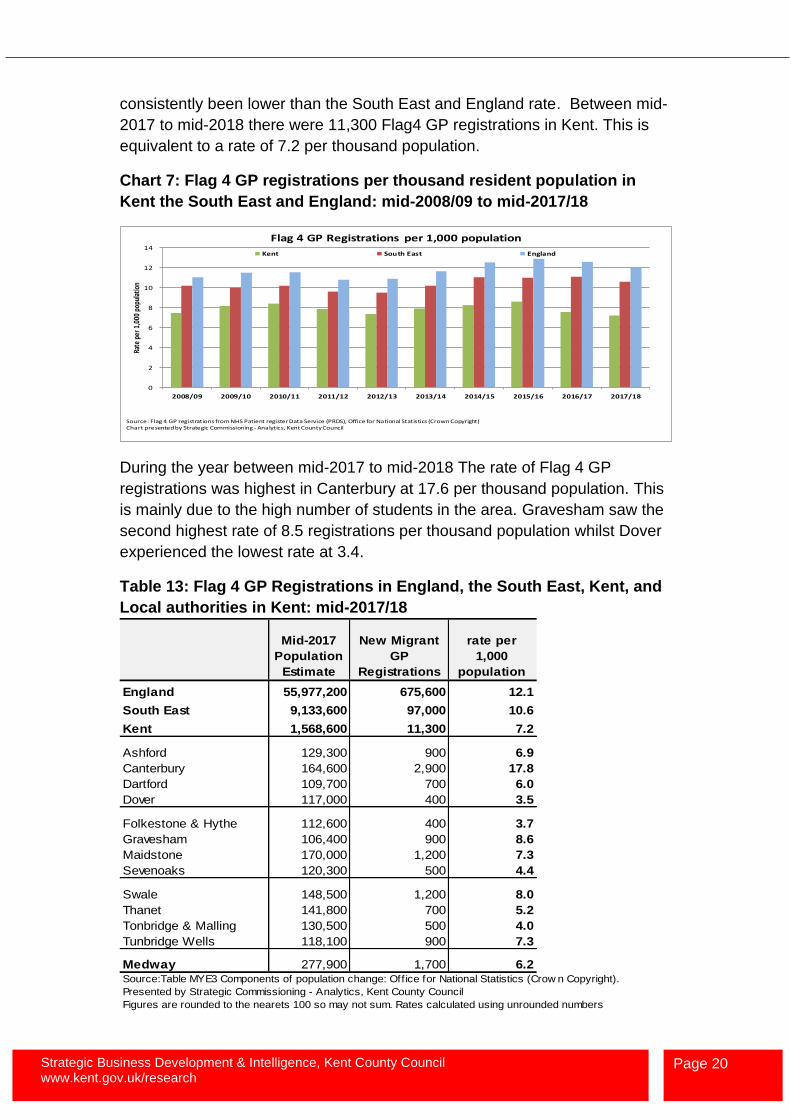
consistently been lower than the South East and England rate. Between mid-
2017 to mid-2018 there were 11,300 Flag4 GP registrations in Kent. This is
equivalent to a rate of 7.2 per thousand population.
Chart 7: Flag 4 GP registrations per thousand resident population in
Kent the South East and England: mid-2008/09 to mid-2017/18
During the year between mid-2017 to mid-2018 The rate of Flag 4 GP
registrations was highest in Canterbury at 17.6 per thousand population. This
is mainly due to the high number of students in the area. Gravesham saw the
second highest rate of 8.5 registrations per thousand population whilst Dover
experienced the lowest rate at 3.4.
Table 13: Flag 4 GP Registrations in England, the South East, Kent, and
Local authorities in Kent: mid-2017/18
0
2
4
6
8
10
12
14
2008/09 2009/10 2010/11 2011/12 2012/13 2013/14 2014/15 2015/16 2016/17 2017/18
Rate
per
1,0
00 p
opul
atio
n
Flag 4 GP Registrations per 1,000 population
Kent South East England
Source: Flag 4 GP registrations from NHS Patient register Data Service (PRDS), Office for National Statistics (Crown Copyright)Chart presented by Strategic Commissioning - Analytics, Kent County Council
Mid-2017
Population
Estimate
New Migrant
GP
Registrations
rate per
1,000
population
England 55,977,200 675,600 12.1
South East 9,133,600 97,000 10.6
Kent 1,568,600 11,300 7.2
Ashford 129,300 900 6.9
Canterbury 164,600 2,900 17.8
Dartford 109,700 700 6.0
Dover 117,000 400 3.5
Folkestone & Hythe 112,600 400 3.7
Gravesham 106,400 900 8.6
Maidstone 170,000 1,200 7.3
Sevenoaks 120,300 500 4.4
Swale 148,500 1,200 8.0
Thanet 141,800 700 5.2
Tonbridge & Malling 130,500 500 4.0
Tunbridge Wells 118,100 900 7.3
Medway 277,900 1,700 6.2Source:Table MYE3 Components of population change: Office for National Statistics (Crow n Copyright).
Presented by Strategic Commissioning - Analytics, Kent County Council
Figures are rounded to the nearets 100 so may not sum. Rates calculated using unrounded numbers