Embed Size (px)
Citation preview

Mild Streptozotocin Diabetes in the Göttingen Minipig. A Novel Model of
Moderate Insulin Deficiency and Diabetes
M. O. Larsen1,2, M. Wilken3, C.F. Gotfredsen4, R.D. Carr1, O. Svendsen2 and B. Rolin1.
1Department of Pharmacological Research I, Novo Nordisk A/S, Bagsvaerd, Denmark
2Department of Pharmacology and Pathobiology, the Royal Veterinary and Agricultural
University, Copenhagen, Denmark
3Department of Assay and Cell technology, Novo Nordisk A/S, Bagsvaerd, Denmark
4Department of Histology, Novo Nordisk A/S, Bagsvaerd, Denmark
Short title: M.O. Larsen et al.: Mild Streptozotocin Induced Diabetes in the Minipig
Address correspondence to: Marianne O. Larsen Department of Pharmacological Research I Pharmacology Research and Development Novo Allé, 6A1.117 DK-2880 Bagsvaerd Denmark Phone: +45 4442 7675 Fax: +45 44427488 E-mail: [email protected]
Copyright 2002 by the American Physiological Society.
AJP-Endo Articles in PresS. Published on February 19, 2002 as DOI 10.1152/ajpendo.00564.2001
2
2
Abstract
Non-rodent models of diabetes are needed for practical and physiological reasons. Induction
of mild insulin deficient diabetes was investigated in male Göttingen minipigs using
streptozotocin (STZ) alone (75,100 and 125mg/kg) or 125mg/kg in combination with pre-
treatment with nicotinamide (NIA)(0,20,67,100,150 and 230mg/kg). Use of NIA resulted in a
less steep slope of the regression line between FPG and changing doses compared to
STZ(–7.0±1.4 vs. 29.7±7.0mM·(mg·kg-1)-1, p<0.0001). Intermediate NIA doses induced
moderate changes of glucose tolerance(AUCglucose increased from 940±175 to
1598±462mM·min, p<0.001(100mg/kg) and from 890±109 to 1669±691mM·min,
p=0.003(67mg/kg)) with reduced insulin secretion(1248±602 after 16 and 1566±190 after 60
days vs. 3251±804pM·min in normal animals (p<0.001)) and β-cell mass(5.5±1.4 after 27 and
7.9±4.1 after 60 days vs. 17.7±4.7mg/kg in normal animals (p=0.009)). The combination of
NIA and STZ provided a model characterized by fasting and especially postprandial
hyperglycemia, and reduced, but maintained, insulin secretion and β-cell mass. This model
holds promise as an important tool for studying the pathophysiology of diabetes and
development of new pharmacological agents for treatment of the disease.
Keywords: In vivo pharmacology, large animal model, glucose tolerance, β-cell reduction,
glucose stimulated insulin secretion.

3
3
Abbreviations: STZ: streptozotocin, FPG: fasting plasma glucose, NIA: nicotinamide, FPI:
fasting plasma insulin, 2-hPG: 2 hour plasma glucose during OGTT, FPGa: fasting plasma
glucagon, NGT: normal glucose tolerance.
Introduction
The study of the pathophysiology and treatment of diabetes requires well-characterized
animal models that resemble aspects of the disease humans. Various forms of diabetes occur
spontaneously or can be induced in several species of animals. Most of the available models
are based on rodents, however non-rodent models of diabetes are urgently needed as a
valuable supplement to rodents for both practical and physiological reasons.
The pig is useful as a model for human physiology and pathophysiology since many organ
systems resemble those of the human. Of special interest for the study of diabetes is the
similarities to humans found in the clinical chemistry (7, 10, 12, 14, 24, 26, 55), nutrition and
gastrointestinal tract (4, 8, 11, 20, 35, 40, 51), pancreas development and morphology (21,
36, 37, 44, 49, 54) as well as metabolism (3, 35).
These characteristics make swine an interesting species for studies of metabolic abnormalities
in diabetes. The Göttingen minipig is especially suitable for long-term studies because of its
small size and ease of handling, even at full maturity (6).
Pancreatectomy has been investigated as a method of inducing diabetes in pigs (33, 34, 50,
55). However high rates of mortality have been observed post operatively (50, 55), meaning
that this technique should be used with great caution and alternatives should be considered
because of welfare considerations. Chemical induction of diabetes offers the advantage of
preservation of both exocrine and endocrine cell populations other than β-cells, thus
4
4
resembling the situation in human diabetes (55). Several stable models have been established
for overt type 1 diabetes in the pig by the use of pharmacological induction of β cell damage
with streptozotocin (STZ), either as single or repeated injections (2, 15, 16, 27, 28, 29, 46,
55). Substantially increased fasting plasma glucose (FPG) leve ls and decreased insulin
secretion in response to glucose stimuli have been obtained, as well as increases in plasma
triglycerides and total cholesterol (27, 29). Late complications typical of diabetes such as
capillary basement membrane thickening and cataracts have also been shown in diabetic
minipigs (28, 41).
In other studies, alloxan has been used for induction of diabetes in pigs (11, 25, 41). This
compound, which has similar β-cell toxic properties as STZ, in a dose of 200 mg/kg in
Yucatan minipigs induced severe diabetes with high mortality due to hypoglycemia following
acute hyperinsulinaemia as a consequence of massive β-cell damage (41). Doses of 80 mg/kg
have been reported to induce mild diabetes with moderate hyperglycemia and partial loss of
β-cell mass, with impaired insulin secretion rates, but normal fasting insulin levels in
Göttingen minipigs (25). Due to greater selectivity towards β-cells, wider range between
doses causing mild and severe changes in glucose tolerance compared to alloxan (22, 23), and
the more extensive background literature on the effect of STZ in pigs, this compound was
chosen for reduction of β-cell mass in the present study.
Despite of the widespread use of STZ, its use results in a wide variability in the extent of
diabetes depending on species, strain, age and laboratory, thus limiting the predictability of its
effects. Furthermore the efficacy of STZ varies even in an apparently uniform group of
animals receiving the same dose of the compound (13, 47).
In the present study, it was, therefore, investigated whether the use of nicotinamide (NIA)
would have protective effects against the diabetogenic action of STZ in the Göttingen minipig
5
5
as previously reported in rats (31). The protective effect of NIA against the effect of STZ has
been shown in vivo to be both dose and pre-treatment time dependent, but even the most
effective protective dose of NIA did not completely prevent the diabetogenic effects of STZ
(23, 30). Thus, a combination of these two compounds might be useful in the establishment of
a non-rodent model of mild insulin deficient diabetes and in the present study, the dose-
response relations on glucose metabolism using two different approaches of pharmacological
induction of abnormalities in the glucose tolerance are investigated in adult male Göttingen
minipigs. The first approach was administration of a dose range of STZ (75, 100 and 125
mg/kg) alone, the second being administration of different doses of NIA (0-230 mg/kg) as a
pre-treatment, in combination with STZ as a fixed high dose (125 mg/mg). The aim of the
study was to obtain a reliable method of induction of impaired glucose tolerance and/or mild
insulin deficient diabetes in the adult Göttingen minipig, characterized by reduced β-cell mass
and disturbed residual insulin secretion leading to a decreased ability to dispose of glucose
and a following, modest, hyperglycemia during oral glucose tolerance test (OGTT).
Materials and methods
Animals
Adult male Göttingen minipigs 11-14 months of age were obtained from the barrier unit at
Ellegaard Göttingen minipigs ApS, Dalmose, Denmark. Animals were housed in single pens
under controlled conditions (temperature was kept between 18 and 22 °C, relative air
humidity was 30-70 % with 4 air changes per hour) with a 12h light: 12 h dark cycle and fed
twice daily: 140 g of SDS minipig diet (SDS, Essex, England) and 240 g of a commercial
swine fodder (“Svinefoder 22”, Slangerup, Denmark) and allowed free access to water. The
6
6
pigs were studied at least two weeks post surgery and were trained carefully in all
experimental procedures before start of experiments.
For the dosing studies with STZ alone, 14 animals were used weighing 18 ± 3 kg (range 14-
23). For the dosing studies using NIA and STZ in combination, 38 animals were used
weighing 22.5 ± 3.25 kg (range 16.9 to 28.9). These animals served as their own control and
were studied both before and after induction of diabetes.
Principles of laboratory animal care were followed and the type of study was approved by the
Animal Experiments Inspectorate, Ministry of Justice, Denmark.
Surgical implantation of central venous catheters
Two central venous catheters (Certo 455, B. Braun Melsungen AG, Melsungen, Germany)
were inserted surgically under general anesthesia induced with a combination of zolazepam
0.83 mg/kg, tiletamine 0.83 mg/kg (Zoletil® 50 vet., Boeringer Ingelheim, Copenhagen,
Denmark), xylazine 0.90 mg/kg (Rompun® vet (20 mg/ml), Bayer, Lyngby, Denmark),
ketamine 0.83 mg/kg (Ketaminol® vet (100 mg/ml), Rosco, Taastrup, Denmark) and
methadone 0.20 mg/kg (Metadon “DAK” (10 mg/ml), Nycomed, Roskilde, Denmark) I.M
and maintained with isoflurane (1-3 %) (Forene®, Abbot, Gentofte, Denmark) in 100 %
oxygen. Post surgical analgesia was maintained by injection of buprenorfine 0,03 mg/kg
(Anorfin® (0.3 mg/ml) GEA, Frederiksberg, Denmark) and carprofen 4 mg/kg (Rimadyl®
vet. (50 mg/ml), Pfizer, Ballerup, Denmark) IM before the end of anesthesia and for 3 days
post surgery by injection of carporfen 4 mg/kg once daily IM. Post-surgical infection was
prevented by injection of dihydrostreptomycin sulfate (25mg/kg) and benzylpenicillinprocain
(20,000 IE/kg) (Streptocillin® vet. (250 mg DHS + 200.000 IE benzylpenicillinprocain/ml),
Boehringer Ingelheim, Copenhagen, Denmark) immediately post surgery and once daily for
7
7
the following 2 days. All animals were allowed 2-3 weeks of recovery after the surgical
procedure and had normal behavior and eating patterns at the start of the study period.
Protocol 1: Mixed Meal Oral glucose tolerance test
The Mixed Meal Oral Glucose Tolerance Test (OGTT) was performed in all animals in the
NIA and STZ combination study one week before and one week after exposure to NIA and
STZ. The test was performed in non-restrained, freely moving animals in their usual pens to
reduce the amount of stress experienced by the animals during testing.
After an 18-hour overnight fast, animals were offered a mixed meal oral glucose tolerance test
of 25 g SDS minipigfodder and 2g/kg glucose (500 g/l, SAD, Copenhagen, Denmark). The
meal was eaten, rapidly and without stress, from a bowl under supervision.
Blood samples were obtained from the jugular vein catheters at t = -15, -5, 0, 15, 30, 45, 60,
90, 120, 150, and 180 minutes relative to the fodder and glucose load.
Protocol 2: Intravenous glucose and arginine challenge
This test was performed two weeks (16±2 days) (n=6) or two months (60±0 days) (n=2) after
dosing of NIA+STZ in the NIA 67 mg/kg group and a control group of normal, age matched,
animals (n=14) to evaluate insulin secretory capacity. The test was performed in non-
restrained, freely moving animals to reduce the amount of stress experienced by the animals
during testing.
After an 18-hour overnight fast, animals were dosed with an intravenous bolus of glucose
(500 g/l, SAD, Copenhagen, Denmark) (0.3 mg/kg) at t=0 and blood samples were obtained at
t= -15, -10, -5, 1, 3, 5, 7, 10, 45, 50, 55, 61, 63, 65, 67, 70, 80, 85, 91, 93, 95, 97, 100 minutes
relative to the glucose load. At t= 60 minutes another bolus of glucose (500 g/l, SAD,
8
8
Copenhagen, Denmark) (0.6g/kg) was dosed intravenously and from t=61 to t=100 glucose
was infused intravenously at 2g/kg/hour (200 g/l, SAD, Copenhagen, Denmark). At t=90
arginine (L-Arginine, Merck art. 1542) (67 mg/kg) dissolved in sterile saline (0.9%, SAD,
Copenhagen, Denmark) was given intravenously. The insulin response to glucose and
arginine was calculated as the Area Under the Curve (AUC) (baseline subtracted) during 10
minutes immediately after dosing.
Protocol 3: Examination of STZ dosed animals
The examination of animals dosed with STZ alone was limited to measurement of fasting
plasma values of glucose, insulin and glucagon.
Handling and analysis of blood samples
Blood samples (2 ml of whole blood) were immediately transferred to vials containing EDTA
(1.6 mg/ml final concentration) and aprotinin 500 KIU/ ml full blood (Trasylol®, 10.000
KIU/ml, Bayer, Lyngby, Denmark) and were kept on ice until centrifugation. Samples were
centrifuged (4°C, 10 min, 3500 rpm) and plasma separated and stored at -20°C until analysis.
Plasma glucose was analyzed using the immobilized glucose oxidase method, 10 µl of plasma
in 0.5 ml buffer (EBIO plus autoanalyzer and solution, Eppendorf, Hamburg, Germany).
Plasma insulin was analyzed in a two-site immunometric assay with monoclonal antibodies as
catching and detecting antibodies (Catching antibody HUI-018 raised against the A-chain of
human insulin. Detecting antibody OXI-005 raised against the B-chain of bovine insulin) (1)
and using purified porcine insulin for calibration of the assay. The minimal detectable
concentration was 3.2 pM, the upper limit was 1200 pM (no sample dilution) and the inter-
and intra-assay variations at three concentration levels were 15.3% and 3.2% (at 342 pM),
9
9
9.9% and 7.6% (at 235 pM) and 14.6% and 4.4% (at 87 pM). Recovery at high, medium and
low concentration levels was 97.1%, 97.9% and 101% respectively. A commercial kit from
Linco was used to measure glucagon concentrations (Glucagon RIA kit, Cat.# GL-32K).
Performance data for the glucagon assay as given by the supplier were: CV of 10.3% (39
pg/ml, ED80), 7.7% (104 pg/ml, ED50) and 7.8% (271 pg/ml, ED20).
Induction of diabetes
Diabetes was induced by intravenous administration, through the indwelling catheters, over 2
minutes of STZ (Sigma S-0130), either at variable doses alone (75 (n=4), 100 (n=3) or 125
(n=7) mg/kg) or at a fixed dose of 125 mg/kg in combination with NIA to accomplish a
partial protection of the β-cells. NIA (Sigma N-3376) was administered intravenously 15
minutes prior to STZ. The doses of NIA used were: 0 (n=4), 20 (n=2), 67 (n= 11), 100 (n=
11), 150 (n=6) and 230 (n=4) mg/kg. Administration of NIA and STZ was performed after an
18 h overnight fast in conscious animals. NIA was weighed out in individual portions,
protected from light and dissolved immediately before injection in sterile saline (0.9 % SAD,
Copenhagen, Denmark) to a concentration of 300 mg/ml. STZ was weighed out in individual
portions and dissolved in sodium-citrate buffer (no.929546, Bie & Berntsen, Roedovre,
Denmark, pH= 4.7) to a concentration of 62.5 mg/ml immediately before injection.
Vomiting was seen in all animals during the first hours after administration of STZ, and this
seemed to be unaffected by NIA pretreatment. Most animals were eating and behaving
normally 24 to 48 hours after dosing. Animals were offered SDS fodder 2 hours after
administration of NIA and STZ and were observed frequently during the first 2 days after
administration of NIA and STZ. Blood glucose was monitored regularly to avoid episodes of
hypoglycemia due to sudden hyperinsulinemia caused by necrosis of β-cells.
10
10
After 2 days, insulin therapy (Insulatard, 100 ie/ml, Novo Nordisk A/S, Bagsvaerd,
Denmark) was initiated if necessary based on individual clinical examination, with the aim of
keeping fasting plasma glucose below 10 mM.
Histological examination of pancreas
Fixation and physical fractionation
Histological examination was performed one month (27±8 days) (n=7) or two months (60±0
days) (n=4) after dosing of NIA (67mg/kg) and STZ and compared with data from normal
animals (n=5). Furthermore, an animal that received STZ alone was included for comparison.
At the end of the study period, after euthanasia with pentobarbitone (20 ml per animal) (200
mg/ml, Pharmacy of the Royal Veterinary and Agricultural University, Copenhagen,
Denmark), the pancreas was immediately isolated in toto and fixed in paraformaldehyde (Bie
& Berntsen, Copenhagen, Denmark) for 24 hours. The following day, the pancreas was
embedded in 3% agar solution (Meco-Benzon Cat. 303289, Copenhagen, Denmark) at 45°C.
After cooling the pancreas was cut into 3mm slaps (17), and every fifth tissue slab, starting at
slab 1, 2, 3, 4, or 5 determined from a table of random numbers, was retained for sectioning
into about 80 cubes of roughly equal size. Those cubes were arranged according to size as
practiced in the smooth fractionator method with the biggest cubes in the middle and the
smallest cubes in the ends (5, 32). Every 8ht cube, starting at cube 1,2,3,4….8 determined
from a table of random numbers, was retained and placed in cassettes for dehydration and
paraffin infiltration in a tissue processor (Leica TP 1050, Copenhagen, Denmark). The 10-12
pancreas cubes were embedded in paraffin and sections 3 µm thick cut on a Leica RM 2165
microtome (Leica, Copenhagen, Denmark).
11
11
Immunohistochemistry
Sections were deparaffinised in xylen, brought to 99% ethanol, treated with 0.5%H2O2 for 20
min to block endogenous peroxidase activity, and rinsed with Tris-buffered saline (TBS).
Sections were then immersed in 0.01M citrate buffer pH 6, preheated to 90°C and submitted
to antigen retrieval by microwave oven treatment for 3x5min heating at 80% (Polar Patent,
Umeå, Sweden). The slides were subsequently cooled, still in the citrate buffer, by immersion
of the jar in running tap water, rinsed in TBS + 0.01%Triton X-100 (Sigma, St. Louis, MO,
USA) (TBS-T buffer), and the tissue sections ‘ringed’ with a DAKO-pen (DAKO,
Copenhagen, Denmark).
Insulin staining
The following stainingsteps were carried out in an Autostainer (DAKO, Copenhagen ,
Denmark). All dilutions were carried out with TBS-T. Sections were blocked with 5% normal
rabbit serum (X0902, DAKO, Copenhagen, Denmark), then incubated 60 min with primary
antibody guinea pig-anti insulin (651041, ICN, Costa Mesa, CA, U.S.A.) diluted 1:3500 in
7% normal rabbit serum+ 3% normal swine serum (X901, DAKO, Copenhagen, Denmark) in
TBS-T. Sections were rinsed in TBS-T and incubated 30 min in secondary antibody
peroxidase labeled rabbit anti-guinea pig IgG (P141, DAKO, Copenhagen, Denmark) diluted
1:300 in 7% rabbit + 3% swine serum in TBS-T. The sections were rinsed with TBS-T and
then developed with 0,075% diaminobenzidine (DAB, DAKO, Copenhagen, Denmark) and
0.008% H2O2 in TBS-T for 3 min. Following a rinse in TBS-T, the slides were washed 5 min
in running tap water, counterstained with Mayer’s hematoxyline for ½ min, washed again in
running tap water for 10 min, dehydrated and mounted in Pertex (Histolab, Stockholm,
Sweden).
12
12
Non-β cell staining
These staining steps were also carried out in an Autostainer (DAKO, Copenhagen, Denmark).
All dilutions were carried out with TBS + 0.01% Triton X-100 (TBS-T). Sections were
incubated 10 min with avidin blocking solution (DAKO, Copenhagen, Denmark), washed
with TBS-T, incubated 10 min with biotin blocking solution (DAKO, Copenhagen, Denmark)
to block endogenous biotin binding sites, and rinsed in TBS-T. Sections were then incubated
with 5% normal donkey serum (D-9663, Sigma, St. Louis, MO, USA). The sections were then
incubated 60 min with a mixture of antibodies to glucagons (GLU), somatostatin (SOM) and
pancreatic polypeptide (PP); monoclonal mouse-anti GLU (clone Glu-001, Novo Nordisk,
Copenhagen, Denmark) 1:2500 + rabbit anti-SOM (A566, DAKO, Copenhagen, Denmark)
1:1600 + rabbit anti-PP (A619, DAKO, Copenhagen, Denmark) 1:2000 diluted in TBS-T with
4% normal goat serum (X0907, DAKO, Copenhagen, Denmark) +4% donkey serum + 3%
normal swine serum. Sections were rinsed in TBS-T, and incubated 30 min with a mixture of
biotinylated secondary antibodies; biotinylated donkey anti-mouse IgG (715-065-1501,
Jackson, West Grove, PA, USA) 1:3000 + biotinylated goat ant-rabbit IgG (111-065-1441,
Jackson, West Grove, PA, USA) 1:3000 diluted in same serum containing buffer as the
primary antibodies, 4% goat + 4% donkey + 3% swine serum in TBS-T. Sections were rinsed
in TBS-T, incubated 15 min with peroxidase- labeled streptavidin (P397, DAKO,
Copenhagen, Denmark) 1:300, and rinsed in TBS-T. Peroxidase activity was developed for 5
min with 0.05% DAB + 0.006% H2O2 + 1.3% NiSO4 in TBS-T + imidazole. Following a
rinse in TBS-T, the slides were washed 5 min in running tap water, counterstained with
Mayer’s hematoxyline for ½ min, washed again in running tap water for 10 min, dehydrated
and mounted in Pertex (Histolab, Stockholm, Sweden).
13
13
Stereological estimation of β- and non-β-cell mass
β and non-β endocrine cell mass was evaluated stereologically in 2-3 sections 250 µm apart
in an Olympus BX-50 microscope (Olympus, Denmark, Copenhagen) with video camera and
monitor at a total on-screen magnification of 960x. The sections were analysed by point
counting of frames after systematic uniform random sampling using a PC-controlled
motorized stage and the CAST-GRID software (Olympus, Denmark, Copenhagen).
Initially, the tissue sections were circumscribed using a 1.25x objective and within this area
the counting of endocrine and exocrine structures took place. The volume fractions of beta or
non-beta cells were estimated by point counting stereological techniques (18) at a total on-
screen magnification of 960x obtained with a 20x objective, a grid of 4x64 points, and step
lengths of max 900x600 µm controlled by the CAST-GRID software. The sections were
examined with the origin of the sections blinded to the observer. Mean values of estimated
volume fractions were calculated with correction for the differences in total areas counted.
Statistics
Calculations of fasting values and AUC (baseline=0 for glucose and insulin during OGTT
(protocol 1), baseline subtracted for glucagon during OGTT (protocol 1) and for insulin
during glucose and arginine stimulation test (protocol 2)) and statistical evaluation of results
was performed using paired two tailed Students t-test, Kruskal-Wallis test and linear
regression using Excel (2000) and GraphPad Prism version 3.00 for Windows (GraphPad
Software, San Diego, CA, USA). Comparison of slopes of regression lines was performed
using the method described by Zar (56). p-values of 0.05 or less were considered significant.
14
14
Results
Normal plasma profiles during OGTT (protocol 1)
Based on the OGTT performed in all 38 animals before administration of NIA and STZ,
curves showing the normal plasma concentrations of glucose, insulin and glucagon were
obtained. Normal FPG and insulin (FPI) are summarized in table 1. AUCglucose was 980 ± 200
mM·min and the 2-hour plasma glucose (2-hPG) was 4.7 ± 1.2 mM. Similarly, normal
AUCinsulin was 42087 ± 21637 pM·min. Normal fasting plasma glucagon (FPGa) was 86 ± 22
ng/l, and AUCglucagon was -1451 ± 2886 ng/l·min.
Fasting plasma values after administration of STZ (protocol 3)
Changes in FPG, FPI and FPGa were evaluated by comparison to the normal values obtained
in the 38 animals (table 1). FPG was significantly increased in the 100 and 125 mg/kg STZ
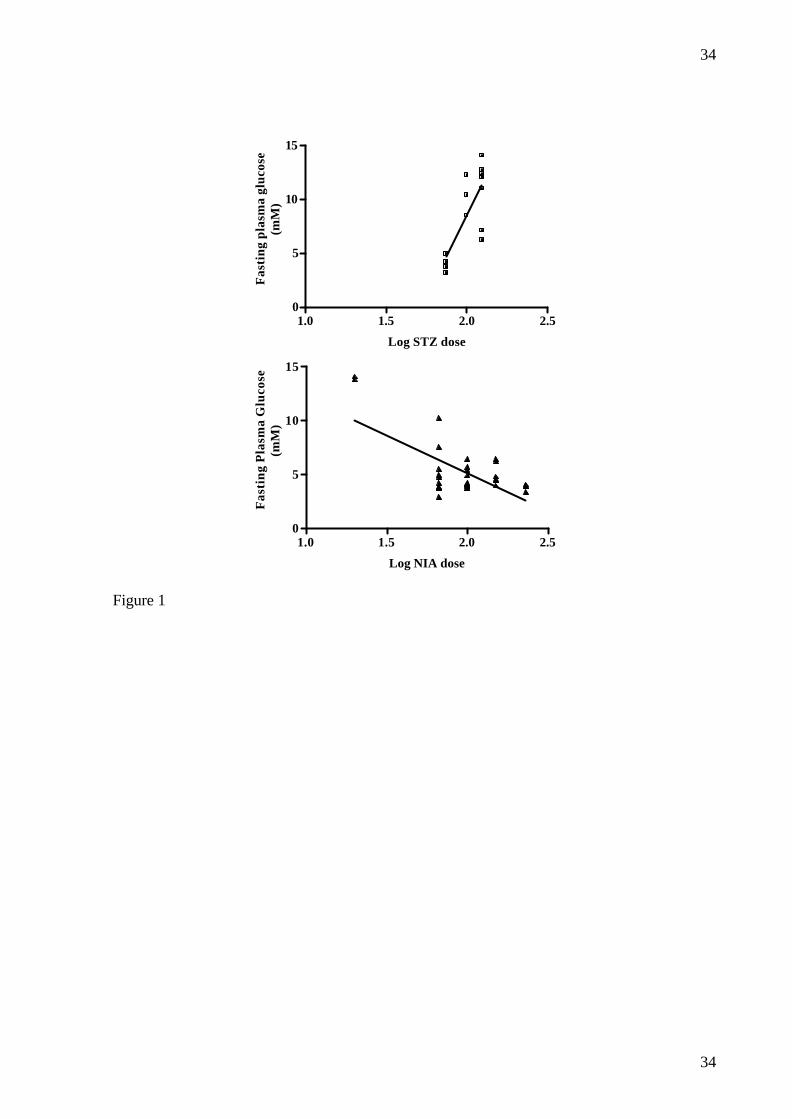
groups but not in the 75 mg/kg STZ group and there was a significant correlation between log
STZ dose and FPG (r2=0.5924, p= 0.001) (fig.1). FPI was significantly decreased in the 100
and 125 mg/kg STZ groups but not in the 75 mg/kg STZ group, there being a significant
correlation between log dose STZ and FPI (r2=0.6157, p=0.002). No significant change was
detected in FPGa (data not shown).
Plasma profiles during OGTT (protocol 1) after administration of NIA and STZ
A significant increase in FPG was found in the NIA 100, 67, 20 and 0 groups but not in the
NIA 230 and 150 mg/kg groups (table 2), the correlation being significant between log dose
of NIA and FPG (r2 = 0.4339, p<0.001) (fig.1). A significant decrease in FPI was found in the
NIA 67 mg/kg group, but this most probably is due to high values of FPI before NIA+ STZ in
15
15
this group, since changes in all other groups were non-significant. There was no significant
correlation between log dose of NIA and FPI (r2 = 0.0052, p=0.687).
No significant changes in FPGa were detected in any of the dosing groups.
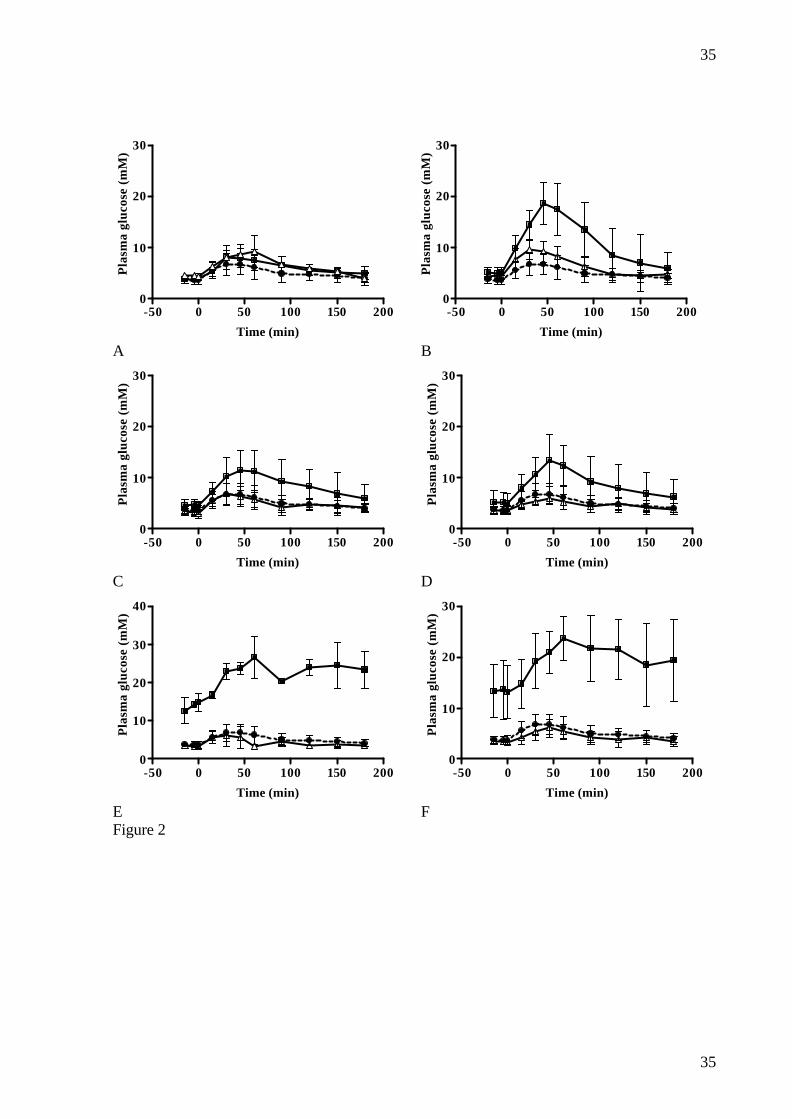
A significant increase in AUCglucose was found in all dosing groups except the NIA 230 mg/kg
group (table 3). Changes in glucose levels are illustrated in fig.2 and there was a significant
correlation between the log NIA dose and AUCglucose (r2= 0.2970, p<0.001) (data not shown).
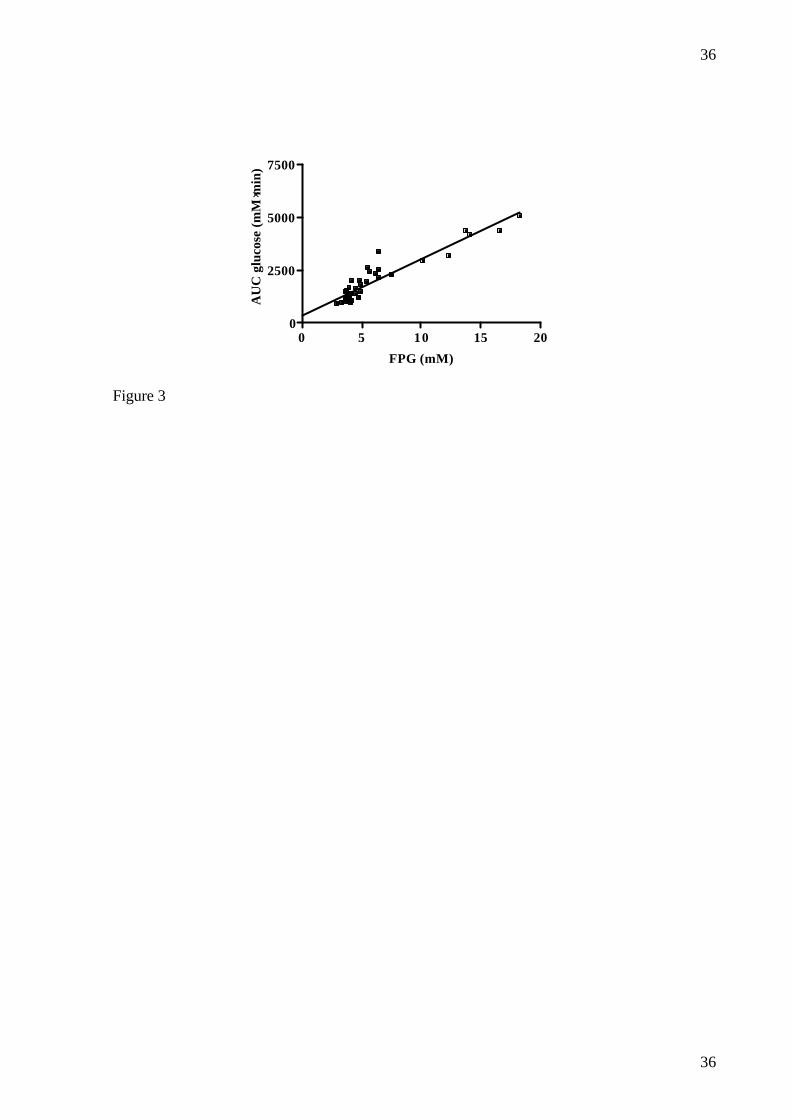
Furthermore, there was a significant correlation between AUCglucose and FPG (r2=0.880,
p<0.0001) (fig.3). A significant decrease in AUCinsulin was found in the NIA 150, 67 and 0
mg/kg groups. In the other groups, a non-significant trend for lowering of AUCinsulin was seen.
When AUCinsulin after NIA20 mg/kg and STZ were compared to the AUCinsulin (pM·min) from
the 38 normal OGTT profiles, there was a significant decrease (from 42087 ± 21637 to 7970
± 2702, p=0.03). There was no significant correlation between log NIA dose and AUC insulin
(r2= 0.00875, p= 0.599). No significant changes in AUCglucagon were found in any of the
groups.
Significant increases in 2h-PG were found in the NIA 100, 20 and 0 mg/kg groups and non-
significant increases were seen in the NIA 150 and 67 mg/kg groups. A non-significant
decrease was seen in the NIA 230 mg/kg group and there was a significant correlation
between log NIA dose and 2-hPG (r2= 0.2989, p<0.001) (data not shown).
Duration of reduction of β -cell function and mass
Over the period in which the intravenous glucose and arginine challenge (protocol 2) was
performed, FPG (mM) was consistently elevated in the NIA+STZ dosed animals (4.0±1.0
after two weeks and 4.9±1.2 after two months vs. 3.2±0.4 in normal animals (p=0.029)
whereas FPI (pM) did not differ between the groups (20±11 after two weeks and 27±6 after
16
16
two months vs. 38±30 in normal animals (NS)). No change in individual FPG was seen from
one week after dosing of NIA+STZ to the time of intravenous glucose and arginine challenge
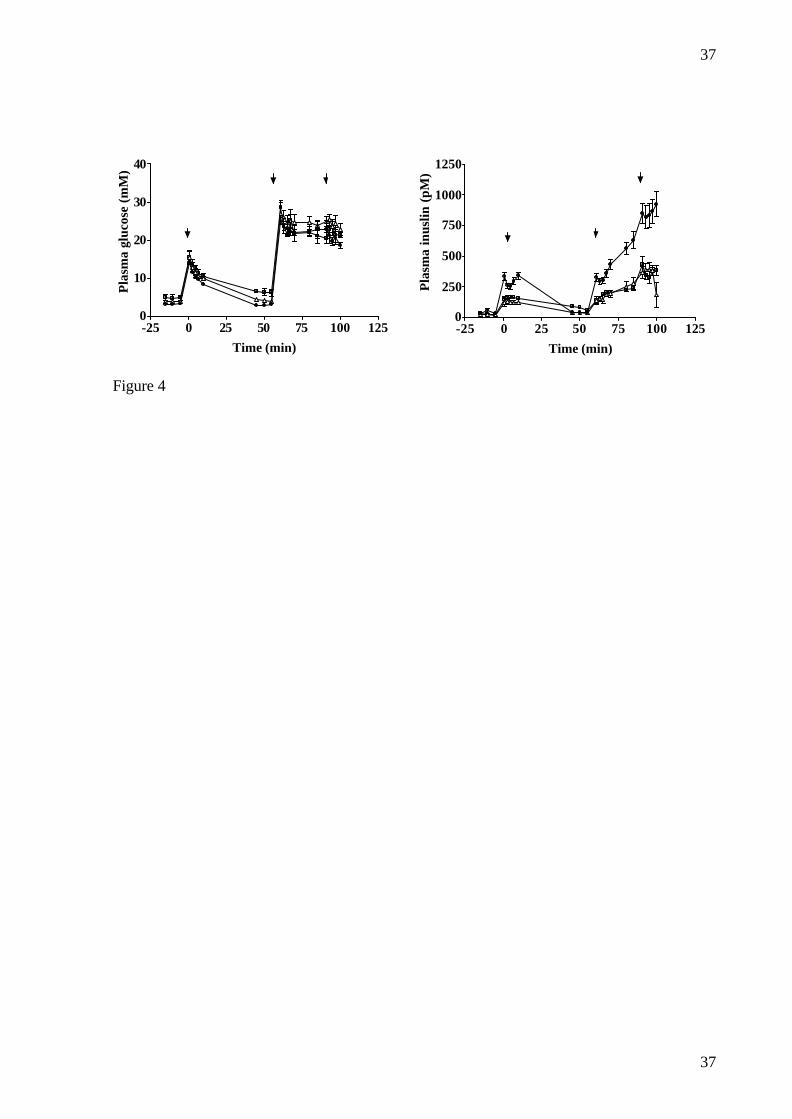
(4.6±1.5 vs. 4.4±1.0 mM, (NS). Reduction in insulin response (pM·min) was seen both after
intravenous glucose, 0.3 g/kg (1248±602 after two weeks and 1566±190 after two months vs.
3251±804 in normal animals (p<0.001)), 0.6 g/kg (1464±693 after two weeks and 1173±256
after two months vs. 3593±1253 in normal animals (p<0.001)) and arginine (1424±440 after
two weeks and 1779±1027 after two months vs. 3283±1854 in normal animals (p=0.015))
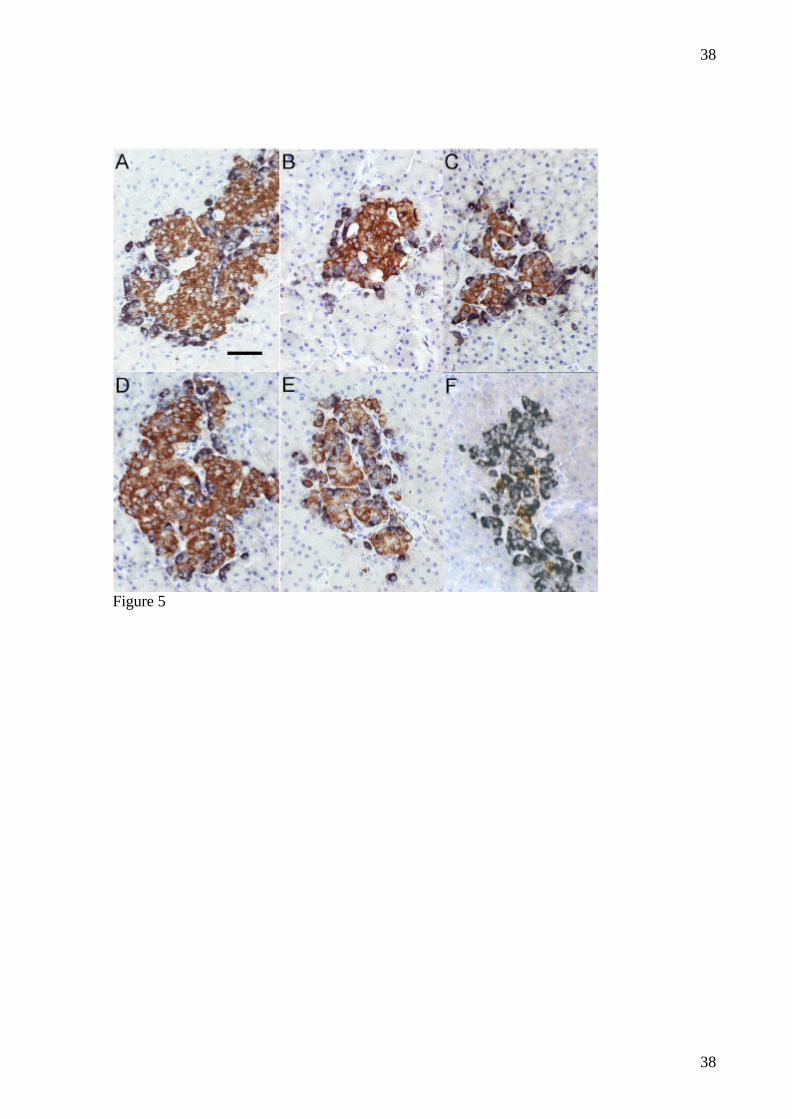
(fig. 4). Furthermore, β-cell mass (mg/kg) (5.5±1.4 after one month and 7.9±4.1 after two
months vs. 17.7±4.7 in normal animals (p=0.009)) was reduced after NIA+STZ (fig 5).
During the histological examination of pancreata from animals dosed with NIA+STZ, no
signs of development of tumors from surviving ß-cells were found.
Discussion
Attempts to genetically select a strain of diabetic pigs have been made (38, 39, 40) but have,
so far, not been confirmed to be successful (19). The use of pancreatectomized animals as a
model of diabetes (15, 33, 34, 50) has the disadvantage of also removing the exocrine
function of the pancreas and the non-beta-cell endocrine cells of the islets of Langerhans and,
although, performance of partial pancreatectomy might be useful for induction of mild
diabetes, this method clearly is more invasive compared to the administration of STZ.
Pigs are more resistant to the diabetogenic effects of STZ than rats (2, 13, 15, 16, 23, 27, 28,
29, 31, 46, 55) and non human primates (42), and a wide individual variability in the response
to STZ was seen in the present study as has also been shown in non human primates (42). In
the present study, only male animals were included to reduce variability in glucose tolerance
due to estrous cycling and probably the diversity of genetic background is the best
17
17
explanation for the wide variability seen, as diet and nutritional status were standardized in
the present experiment.
Previous observations showing that 35-40 mg/kg STZ did not influence glucose metabolism
in pigs (15, 29) are consistent with data from the present study. In the present study all
animals in the STZ 100 mg/kg group and 5 out of 7 animals in the STZ 125 mg/kg group
were classified as severely diabetic, whereas the remaining 2 animals from the STZ 125
mg/kg group had impaired fasting glucose (IFG). Thus, these data demonstrate that adult male
Göttingen minipigs can be made severely diabetic using a dose of STZ of 100-125 mg/kg or
above. This is in accordance with previous observations in minipigs and domestic pigs, with
100-150 mg/kg STZ inducing overt diabetes (9, 15, 16, 55). The response to 100 or 125
mg/kg STZ showed some individual variation, indicating individual grades of sensitivity to
STZ alone, in accordance with previous observations (13, 47). The effects of STZ alone,
expressed as increased FPG and decreased FPI and FPC, are significantly correlated to log
dose of STZ, and show a clear dose response relationship and despite the individual variation,
this dosing regimen seems to be a reliable method for pharmacological induction of overt
diabetes. However, based on the present results, the dosing window in which induction of
mild, insulin deficient diabetes can be accomplished seems very narrow due to the steepness
of the dose-response curve to STZ alone.
The present results show that NIA is indeed capable of partially protecting β-cells from the
damaging effects of STZ in the Göttingen minipig as has also been shown previously in rats
(23, 30, 31).
The use of NIA seems feasible for induction of mild type 1/insulin deficient diabetes, since
the changes in FPG in response to changing doses of NIA are significantly smaller compared
to changing doses of STZ. This can be seen when comparing the regression lines for log dose
18
18
NIA or STZ and FPG (fig.2), with the regression line based on changing STZ dose having a
much steeper slope (30 ± 7) compared to that for the changing NIA dose (-7 ± 2) (p<0.001).
NIA in a dose of 67 mg/kg in combination with STZ seems to be useful regimen for induction
of mild insulin deficient diabetes.
However, the protective effect of NIA is not complete, as even the highest dose of NIA could
not fully prevent the effect on the β-cells, as has also been shown in rats (23, 30).
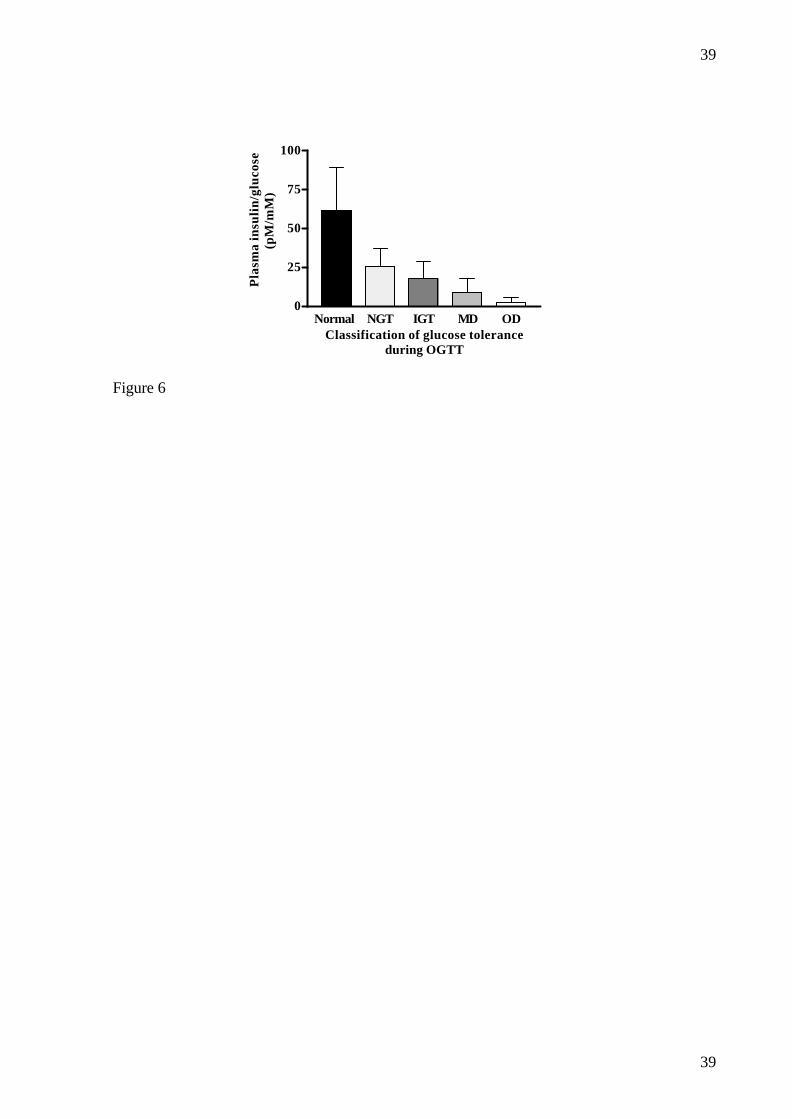
The ratio of insulin to glucose at 30 minutes during the OGTT was decreased even in the
animals that had normal glucose tolerance (NGT) post NIA+STZ compared to pre NIA+STZ
values (25.8±11.5 vs. 61.2±28.0, p<0.001). Furthermore there was a gradual decrease in the
ratio post NIA+STZ from the NGT animals through the glucose intolerant animals
(17.7±11.1) and mildly diabetic animals (9.2 ± 8.8) to the overtly diabetic animals (2.6 ± 3.2)
(p<0.001) (fig.6), which is similar to what has been observed in humans (53). The fact that
this ratio is also decreased in the animals with normal glucose tolerance after dosing with
NIA+STZ compared to pre NIA+STZ values indicates some deterioration of insulin secretory
response to glucose even in these animals.
The protection by NIA seems to be negligible when doses of 20 mg/kg or below are used. In
the dosing range 150-67 mg/kg of NIA, mild diabetes could be induced even though some
variability existed within the dosing groups, with the diabetic animals having moderately
increased fasting plasma glucose and higher residual insulin secretory capacity compared to
diabetic animals from the NIA 20 and 0 mg/kg groups.
Administration of NIA and STZ in combination has been known to induce insulin producing
tumors in the pancreas of rats (45). In the present study, no tumors were found during
histological examination of pancreatic tissues from animals for up to two months after dosing
of NIA + STZ. Diabetes induced by STZ has previously been shown to be stable in some
19
19
experiments (9, 55), while other studies have shown a gradual improvement of glucose
tolerance (27). In the present study, the elevated FPG after NIA+STZ was stable in the seven
tested animals for a period of two weeks to two months after dosing. Furthermore, there was a
very significant reduction in insulin secretory response to both glucose and arginine after the
same period of time. Finally, the in vivo measures of reduced insulin secretory capacity was
confirmed histologically by reduced β-cell mass in the model. The stability of the
IGT/diabetes in this model beyond two months after dosing has yet to be investigated in
detail.
In conclusion, these studies have shown that varying degrees of glucose intolerance and
diabetes can be induced in male Göttingen minipigs with STZ and that NIA has protective
effects in β-cells in these animals as has also been shown in rats. There seems to be a rational
reason for including NIA together with STZ for induction of diabetes in the minipig, since
NIA produces a less steep dose response-curve with respect to effects of changing doses on
FPG compared to STZ. Even though the protection of NIA 67 mg/kg was too high to induce
frank diabetes in some of the animals, this dose still results in a significant change in glucose
tolerance, making this a suitable model for studies of new pharmacological agents for the
treatment of diabetes. The model has proven to be stable for up to two months, both
functionally and histologically. The characteristics of the model include a reduced β-cell mass
and disturbed residual insulin secretory capacity leading to a decreased ability to dispose of
glucose, seen as both fasting, and especially postprandial hyperglycemia. The pathogenesis of
latent autoimmune diabetes in adults (LADA) is closely related to a primary reduction in β-
cell function whereas obesity and the metabolic syndrome are not thought to be of primary
importance (43, 48, 52). Since the primary defects in the present model is reduction of β-cell
mass and function whereas obesity, insulin resistance and other characteristics of the
20
20
metabolic syndrome are not involved as a primary defect, this model of insulin deficient
diabetes is of special interest for the study of LADA. Induction of insulin resistance and
obesity, possibly by high fat feeding, would further improve the usefulness of this model as a
tool in diabetes research, thereby including major characteristics of type 2 diabetes, and
studies are ongoing to investigate this possibility. Furthermore, the good condition of the
animals after induction of diabetes with NIA+STZ makes this a valuable alternative to
pancreatectomy for induction of diabetes with respect to animal welfare measures. Thus, a
model of IGT/mild insulin deficient diabetes has been developed that can be very useful in
short and long-term studies of pathophysiology and treatment of human diabetes/IGT due to
reduced insulin secretion capacity.
21
21
Acknowledgements
We thank Helle Nygaard, Line Mürer, Margit Nelboe Jeppesen, Lene Sejersen Winther, Lotte
Gotlieb Sørensen, Anne Grethe Juul, Nanna Kasmira Nowa Hansen, Annemette Petersen,
Jannie Neuman, Susanne Primdal, Steen Kryger, Karsten Larsen, Ejnar Eriksen and Hans
Rasmussen for excellent technical assistance.
22
22
References
1. Andersen L, Dinesen B, Jørgensen PN, Poulsen F and Røder ME. Enzyme Immunoassay for Intact
Human Insulin in Serum or Plasma. Clinical Chemistry 39: 578-582, 1993.
2. Barb CR, Cox NM, Carlton CA, Chang WJ and Randle RF. Growth hormone secretion, serum, and
cerebral spinal fluid insulin and insulin-like growth factor-I concentrations in pigs with streptozotocin-
induced diabetes mellitus. Proc Soc Exp Biol Med 201: 223-228, 1992.
3. Barth CA, Pfeuffer M and Scholtissek J . Animal models for the study of lipid metabolism, with
particular reference to the Göttingen minipig. Journal of Animals Physiology and Animal Nutrition S20:
39-49, 1990.
4. Bentouimou N, Vaugelade P, Bernard F, Cherbut C and Darcy-Vrillon B . Compared metabolic
effects of seaweed fibres in pigs and humans. EAAP Publication 57-60, 1997.
5. Bock T, Svenstrup K, Pakkenberg B and Buschard K. Unbiased estimation of total beta-cell number
and mean beta-cell volume in rodent pancreas. APMIS 107: 791-799, 1999.
6. Bollen P and Ellegaard L. The Gottingen minipig in pharmacology and toxicology. Pharmacol Toxicol
80: 3-4, 1997.
7. Brechbühler T, Kaeslin M and Wyler F. Reference Values for Various Blood Constituents in Young
Minipigs. Journal of Clinical Chemistry and Clinical Biochemistry 22: 301-304, 1984.
8. Brown, DR and Terris, JM. Swine in physiological and pathophysiological research. Tumbleson, ME
and Schook, LB. New York, Plenum Press. (1), 5-6. 1996.
23
23
9. Canavan JP, Flecknell PA, New JP, Alberti KG and Home PD. The effect of portal and peripheral
insulin delivery on carbohydrate and lipid metabolism in a miniature pig model of human IDDM.
Diabetologia 40: 1125-1134, 1997.
10. Chapman MJ and Goldstein S . Comparison of the serum low density lipoprotein and of its apoprotein in
the pig, rhesus monkey and baboon with that in man. Atherosclerosis 25: 267-291, 1976.
11. Dixon JL, Stoops JD, Parker JL, Laughlin MH, Weisman GA and Sturek M. Dyslip idemia and
vascular dysfunction in diabetic pigs fed an atherogenic diet. Arterioscler Thromb Vasc Biol 19: 2981-
2992, 1999.
12. Ellegaard L, Jørgensen KD, Klastrup S, Hansen AK and Svendsen O . Haematologic and Clinical
Chemical Values in 3 and 6 Months old Göttingen Minipigs. Scand J Lab Anim Sci 22: 239-248, 1995.
13. Engle MJ, Perelman RH, McMahon KE, Langan SM and Farrell PM. Relationship between the
severity of experimental diabetes and altered lung phospholipid metabolism (41869). Proc Soc Exp Biol
Med 176: 261-267, 1984.
14. Fujimori, K., Takahashi, A., Numata, H., and Takanaka, A. Drug metabolizing enzyme system of the
Göttingen miniature pig. In Swine in biomedical research. Tumbleson, M. E. New York, Plenum Press.
(1), 533-548. 1986.
15. Gabel H, Bitter-Suermann H, Henriksson C, Save -Soderbergh J, Lundholm K and Brynger H.
Streptozotocin diabetes in juvenile pigs. Evaluation of an experimental model. Horm Metab Res 17: 275-
280, 1985.
16. Grussner R, Nakhleh R, Grussner A, Tomadze G, Diem P and Sutherland D. Streptozotocin-induced
diabetes mellitus in pigs. Horm Metab Res 25: 199-203, 1993.
24
24
17. Gundersen HJ, Bagger P, Bendtsen TF, Evans SM, Korbo L, Marcussen N, Moller A, Nielsen K,
Nyengaard JR and Pakkenberg B . The new stereological tools: disector, fractionator, nucleator and
point sampled intercepts and their use in pathological research and diagnosis. APMIS 96: 857-881, 1988.
18. Gundersen HJ, Bendtsen TF, Korbo L, Marcussen N, Moller A, Nielsen K, Nyengaard JR,
Pakkenberg B, Sorensen FB and Vesterby A . Some new, simple and efficient stereological methods
and their use in pathological research and diagnosis. APMIS 96: 379-394, 1988.
19. Hand MS, Surwit RS, Rodin J, Van OP and Feinglos MN. Failure of genetically selected miniature
swine to model NIDDM. Diabetes 36: 284-287, 1987.
20. Huge A, Weber E and Ehrlein HJ . Effects of enteral feedback inhibition on motility, luminal flow, and
absorption of nutrients in proximal gut of minipigs. Dig Dis Sci 40: 1024-1034, 1995.
21. Jay TR, Heald KA, Carless NJ, Topham DE and Downing R. The distribution of porcine pancreatic
beta-cells at ages 5, 12 and 24 weeks. Xenotransplantation 6: 131-140, 1999.
22. Junod A, Lambert AE, Orci L, Pictet R, Gonet AE and Renold AE. Studies of the diabetogenic action
of streptozotocin. Proc Soc Exp Biol Med 126: 201-205, 1967.
23. Junod A, Lambert AE, Stauffacher W and Renold AE. Diabetogenic action of streptozotocin:
relationship of dose to metabolic response. J Clin Invest 48: 2129-2139, 1969.
24. Jørgensen KD, Ellegaard L, Klastrup S and Svendsen O . Haematological and clinical chemical values
in pregnant and juvenile Göttingen minipigs. Scand J Lab Anim Sci 25: 181-190, 1998.
25
25
25. Kjems LL, Kirby BM, Welsh EM, Veldhuis JD, Straume M, McIntyre SS, Yang DC, Lefebvre P
and Butler PC . Decrease in beta-cell mass leads to impaired pulsatile insulin secretion, reduced
postprandial hepatic insulin clearance, and relative hyperglucagonemia in the minipig. Diabetes 50: 2001-
2012, 2001.
26. Larsen MO, Rolin B , Wilken M, Carr RD, Svendsen O and Bollen P. Parameters of glucose and lipid
metabolism in the male Gottingen minipig: Influence of age, body weight, and breeding family.
Comparative Med 51: 436-442, 2001.
27. Marshall M. Induction of chronic diabetes by streptozotocin in the miniature pig. Res Exp Med (Berl )
175: 187-196, 1979.
28. Marshall M, Oberhofer H and Staubesand J . Early micro- and macro -angiopathy in the streptozotocin
diabetic minipig. Res Exp Med (Berl ) 177: 145-158, 1980.
29. Marshall M, Sprandel U and Zollner N. Streptozotocin diabetes in a miniature pig (author's transl)
Streptozotocindiabetes beim miniaturschwein. Res Exp Med (Berl) 165: 61-65, 1975.
30. Masiello P and Bergamini E. Nicotinamide and streptozotocin diabetes in the rat. Factors influencing the
effectiveness of the protection. Experientia 33: 1246-1247, 1977.
31. Masiello P, Broca C, Gross R, Roye M, Manteghetti M, Hillaire-Buys D, Novelli M and Ribes G.
Experimental NIDDM: development of a new model in adult rats administered streptozotocin and
nicotinamide. Diabetes 47: 224-229, 1998.
32. Mayhew TM and Gundersen HJ . If you assume, you can make an ass out of u and me': a decade of the
disector for stereological counting of particles in 3D space. J Anat 188 ( Pt 1): 1-15, 1996.
26
26
33. Mellert J, Hering BJ, Liu X, Brandhorst D, Brandhorst H, Brendel M, Ernst E, Gramberg D,
Bretzel RG and Hopt UT . Succesful islet auto- and allotransplantation in diabetic pigs. Transplantation
66: 200-204, 1998.
34. Mellert J, Hopt UT, Hering BJ, Bretzel RG and Federlin K. Influence of islet mass and purity on
reversibility of diabetes in pancreatectomized pigs. Transplant Proc 23: 1687-1689, 1991.
35. Miller ER and Ullrey DE. The pig as a model for human nutrition. Annu Rev Nutr 7: 361-382, 1987.
36. Murakami T, Hitomi S, Ohtsuka A, Taguchi T and Fujita T. Pancreatic insulo-acinar portal systems
in humans, rats, and some other mammals: scanning electron microscopy of vascular casts. Microsc Res
Tech 37: 478-488, 1997.
37. Orci L, Stefan Y, Malaisse-Lagae F and Perrelet A . Instability of pancreatic endocrine cell populations
throughout life letter. Lancet 1: 615-616, 1979.
38. Panepinto LM, Phillips RW, Westmoreland NW and Cleek JL. Influence of genetics and diet on the
development of diabetes in Yucatan miniature swine. J Nutr 112: 2307-2313, 1982.
39. Phillips RW, Panepinto LM, Spangler R and Westmoreland N . Yucatan miniature swine as a model
for the study of human diabetes mellitus. Diabetes 31: 30-36, 1982.
40. Phillips RW, Panepinto LM and Will DH. Genetic selection for diabetogenic traits in Yucatan
miniature swine. Diabetes 28: 1102-1107, 1979.
41. Phillips RW, Panepinto LM, Will DH and Case GL. The effects of alloxan diabetes on Yucatan
miniature swine and their progeny. Metabolism 29: 40-45, 1980.

27
27
42. Pitkin RM and Reynolds WA. Diabetogenic effects of streptozotocin in rhesus monkeys. Diabetes 19:
85-90, 1970.
43. Pozzilli P and Di Mario U. Autoimmune diabetes not requiring insulin at diagnosis (latent autoimmune
diabetes of the adult) - Definition, characterization and potential prevention. Diabetes Care 24: 1460-
1467, 2001.
44. Rahier J, Wallon J and Henquin JC. Cell populations in the endocrine pancreas of human neonates and
infants. Diabetologia 20: 540-546, 1981.
45. Rakieten N, Gordon BS, Beaty A, Cooney DA, Davis RD and Schein PS . Pancreatic Islet Cell Tumors
Produced by the Combined Action of Streptozotocin and Nicotinamide. Proc Soc Exp Biol Med 137: 280-
283, 1971.
46. Ramsay TG and White ME. Insulin regulation of leptin expression in streptozotocin diabetic pigs. J
Anim Sci 78: 1497-1503, 2000.
47. Rodrigues, B., Poucheret, P., and Battel, Mary L. and McNeill John H. Streptozotocin-Induced
Diabetes: Induction, Mechanism(s) and Dose Dependency. In Experimental models of diabetes. John
H.McNeill. Boca Raton, Florida, CRC press LLC. 3-19. 1999.
48. Schernthaner G, Hink S, Kopp HP, Muzyka B, Streit G and Kroiss A. Progress in the characterization
of slowly progressive autoimmune diabetes in adult patients (LADA or type 1,5 diabetes). Exp Clin
Endocrinol Diabetes 109: S94-S108, 2001.
49. Stefan Y, Grasso S, Perrelet A and Orci L. A quantitative immunofluorescent study of the endocrine
cell populations in the developing human pancreas. Diabetes 32: 293-301, 1983.
28
28
50. Stump KC, Swindle MM, Saudek CD and Strandberg JD. Pancreatectomized swine as a model of
diabetes mellitus. Laboratory Animal Science 38: 439-443, 1988.
51. Swindle MM and Smith AC. Comparative anatomy and physiology of the pig. Scand J Lab Anim Sci 25:
11-21, 1998.
52. Tripathy D, Carlsson AL, Lehto M, Isomaa B, Tuomi T and Groop L. Insulin secretion and insulin
sensitivity in diabetic subgroups: studies in the prediabetic and diabetic state. Diabetologia 43: 1476-
1483, 2000.
53. Tripathy D, Carlsson M, Almgren P, Isomaa B, Taskinen MR, Tuomi T and Groop LC. Insulin
secretion and insulin sensitivity in relation to glucose tolerance - Lessons from the Botnia Study. Diabetes
49: 975-980, 2000.
54. Wieczorek G, Pospischil A and Perentes E. A comparative immunohistochemical study of pancreatic
islets in laboratory animals (rats, dogs, minipigs, nonhuman primates). Exp Toxicol Pathol 50: 151-172,
1998.
55. Wilson JD, Dhall DP, Simeonovic CJ and Lafferty KJ . Induction and management of diabetes mellitus
in the pig. Aust J Exp Biol Med Sci 64: 489-500, 1986.
56. Zar, j. Biostatistical analyss. Prentice-Hall. 2, Chapter 18. 1984.
29
29
Figure legends
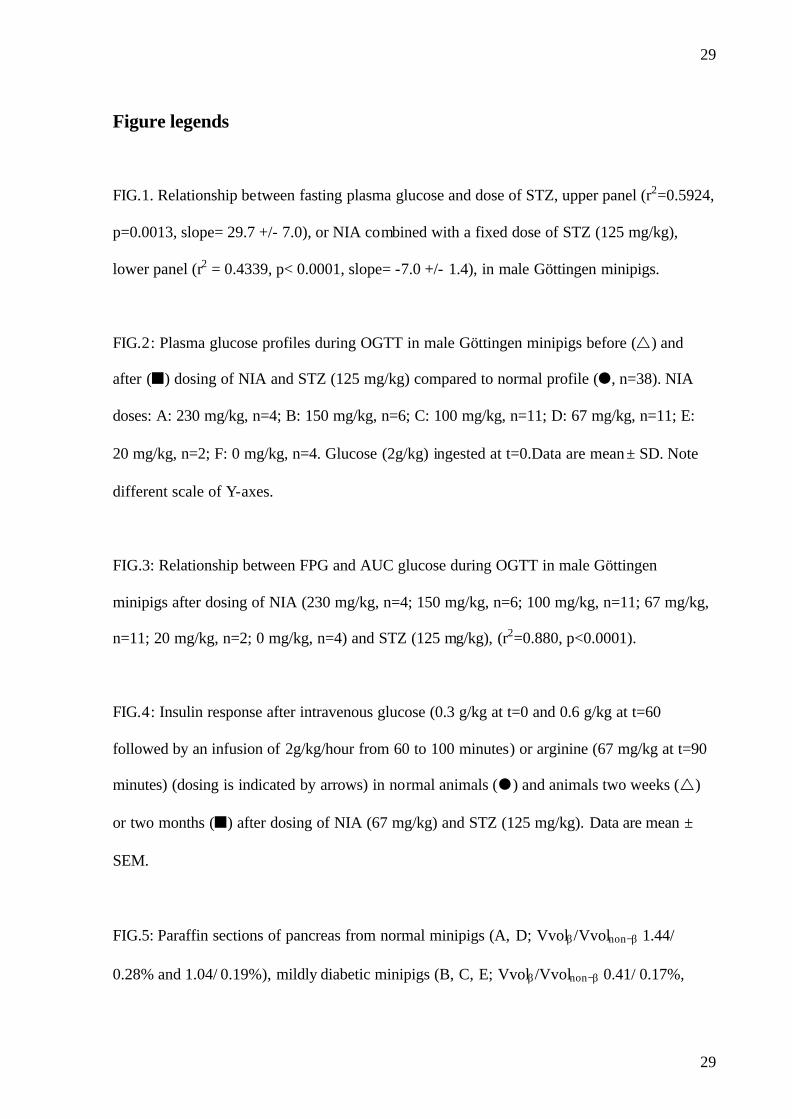
FIG.1. Relationship between fasting plasma glucose and dose of STZ, upper panel (r2=0.5924,
p=0.0013, slope= 29.7 +/- 7.0), or NIA combined with a fixed dose of STZ (125 mg/kg),
lower panel (r2 = 0.4339, p< 0.0001, slope= -7.0 +/- 1.4), in male Göttingen minipigs.
FIG.2: Plasma glucose profiles during OGTT in male Göttingen minipigs before (r) and
after (¢) dosing of NIA and STZ (125 mg/kg) compared to normal profile (�, n=38). NIA
doses: A: 230 mg/kg, n=4; B: 150 mg/kg, n=6; C: 100 mg/kg, n=11; D: 67 mg/kg, n=11; E:
20 mg/kg, n=2; F: 0 mg/kg, n=4. Glucose (2g/kg) ingested at t=0.Data are mean ± SD. Note
different scale of Y-axes.
FIG.3: Relationship between FPG and AUC glucose during OGTT in male Göttingen
minipigs after dosing of NIA (230 mg/kg, n=4; 150 mg/kg, n=6; 100 mg/kg, n=11; 67 mg/kg,
n=11; 20 mg/kg, n=2; 0 mg/kg, n=4) and STZ (125 mg/kg), (r2=0.880, p<0.0001).
FIG.4: Insulin response after intravenous glucose (0.3 g/kg at t=0 and 0.6 g/kg at t=60
followed by an infusion of 2g/kg/hour from 60 to 100 minutes) or arginine (67 mg/kg at t=90
minutes) (dosing is indicated by arrows) in normal animals (�) and animals two weeks (r)
or two months (¢) after dosing of NIA (67 mg/kg) and STZ (125 mg/kg). Data are mean ±
SEM.
FIG.5: Paraffin sections of pancreas from normal minipigs (A, D; Vvolβ/Vvolnon−β 1.44/
0.28% and 1.04/ 0.19%), mildly diabetic minipigs (B, C, E; Vvolβ/Vvolnon−β 0.41/ 0.17%,
30
30
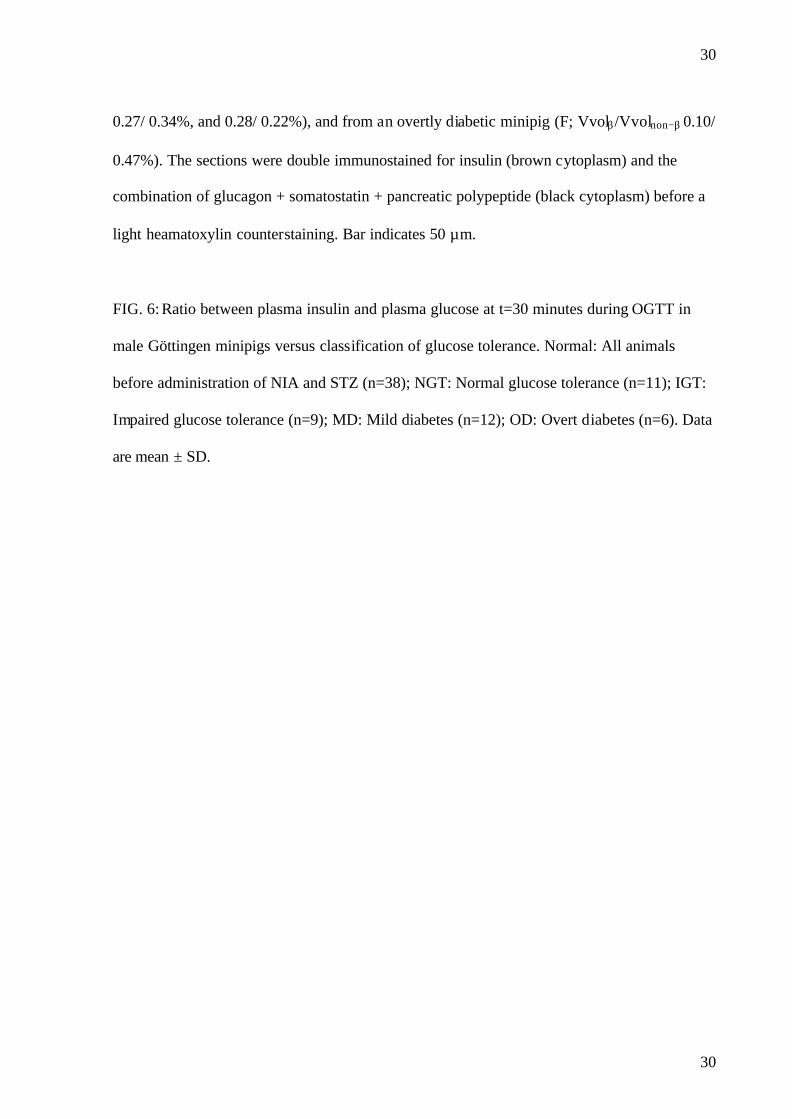
0.27/ 0.34%, and 0.28/ 0.22%), and from an overtly diabetic minipig (F; Vvolβ/Vvolnon−β 0.10/
0.47%). The sections were double immunostained for insulin (brown cytoplasm) and the
combination of glucagon + somatostatin + pancreatic polypeptide (black cytoplasm) before a
light heamatoxylin counterstaining. Bar indicates 50 µm.
FIG. 6: Ratio between plasma insulin and plasma glucose at t=30 minutes during OGTT in
male Göttingen minipigs versus classification of glucose tolerance. Normal: All animals
before administration of NIA and STZ (n=38); NGT: Normal glucose tolerance (n=11); IGT:
Impaired glucose tolerance (n=9); MD: Mild diabetes (n=12); OD: Overt diabetes (n=6). Data
are mean ± SD.
31
31
Tables
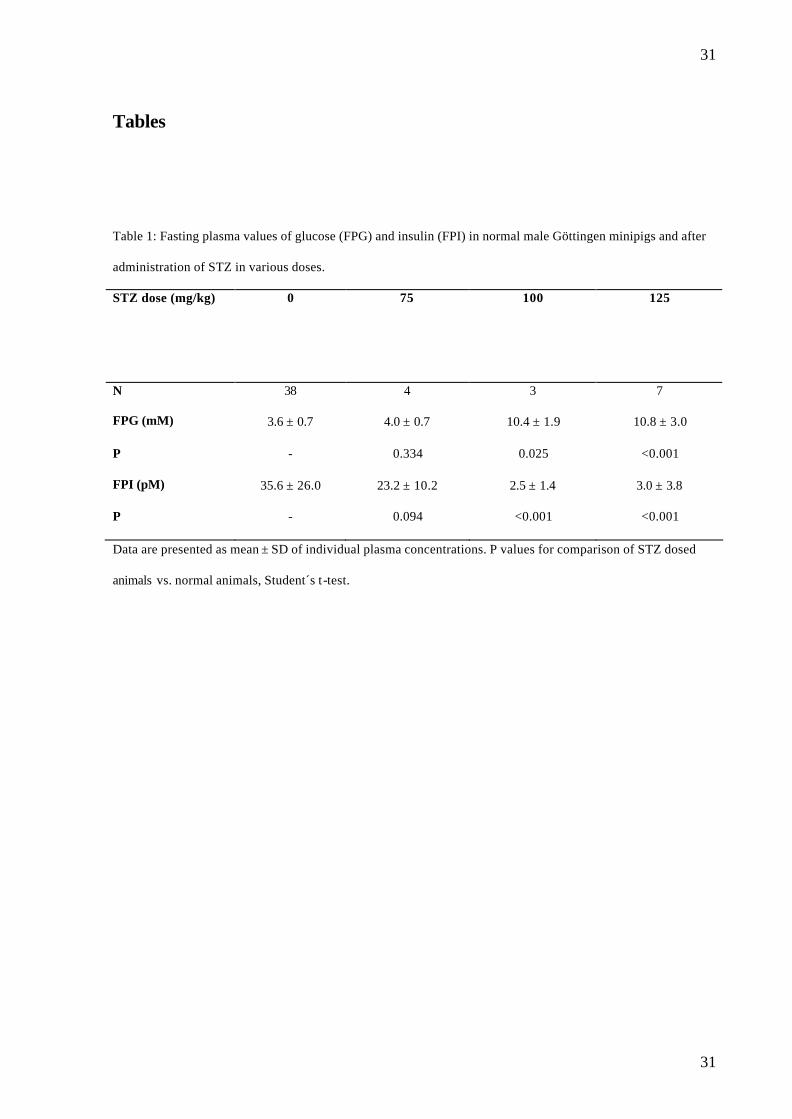
Table 1: Fasting plasma values of glucose (FPG) and insulin (FPI) in normal male Göttingen minipigs and after
administration of STZ in various doses.
STZ dose (mg/kg) 0 75
100 125
N 38 4 3 7
FPG (mM) 3.6 ± 0.7 4.0 ± 0.7 10.4 ± 1.9 10.8 ± 3.0
P - 0.334 0.025 <0.001
FPI (pM) 35.6 ± 26.0 23.2 ± 10.2 2.5 ± 1.4 3.0 ± 3.8
P - 0.094 <0.001 <0.001
Data are presented as mean ± SD of individual plasma concentrations. P values for comparison of STZ dosed
animals vs. normal animals, Student´s t-test.
32
32
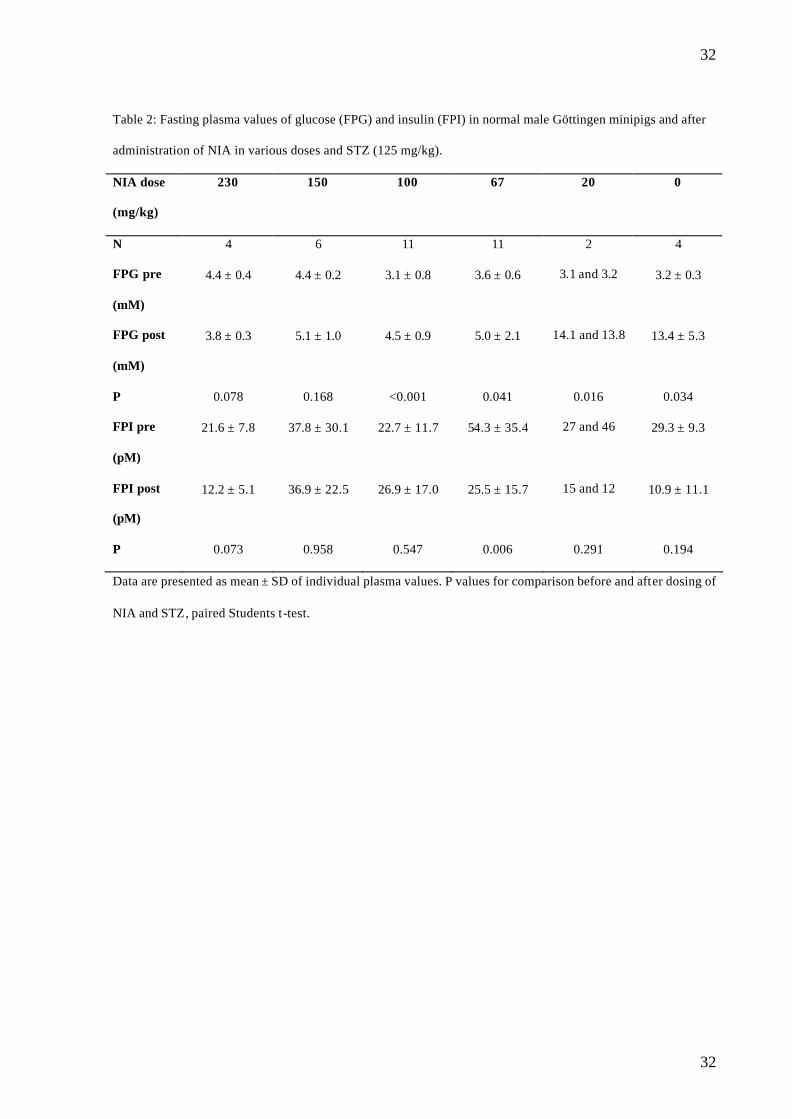
Table 2: Fasting plasma values of glucose (FPG) and insulin (FPI) in normal male Göttingen minipigs and after
administration of NIA in various doses and STZ (125 mg/kg).
NIA dose
(mg/kg)
230 150 100 67 20 0
N 4 6 11 11 2 4
FPG pre
(mM)
4.4 ± 0.4 4.4 ± 0.2 3.1 ± 0.8 3.6 ± 0.6 3.1 and 3.2 3.2 ± 0.3
FPG post
(mM)
3.8 ± 0.3 5.1 ± 1.0 4.5 ± 0.9 5.0 ± 2.1 14.1 and 13.8 13.4 ± 5.3
P 0.078 0.168 <0.001 0.041 0.016 0.034
FPI pre
(pM)
21.6 ± 7.8 37.8 ± 30.1 22.7 ± 11.7 54.3 ± 35.4 27 and 46 29.3 ± 9.3
FPI post
(pM)
12.2 ± 5.1 36.9 ± 22.5 26.9 ± 17.0 25.5 ± 15.7 15 and 12 10.9 ± 11.1
P 0.073 0.958 0.547 0.006 0.291 0.194
Data are presented as mean ± SD of individual plasma values. P values for comparison before and after dosing of
NIA and STZ, paired Students t -test.
33
33
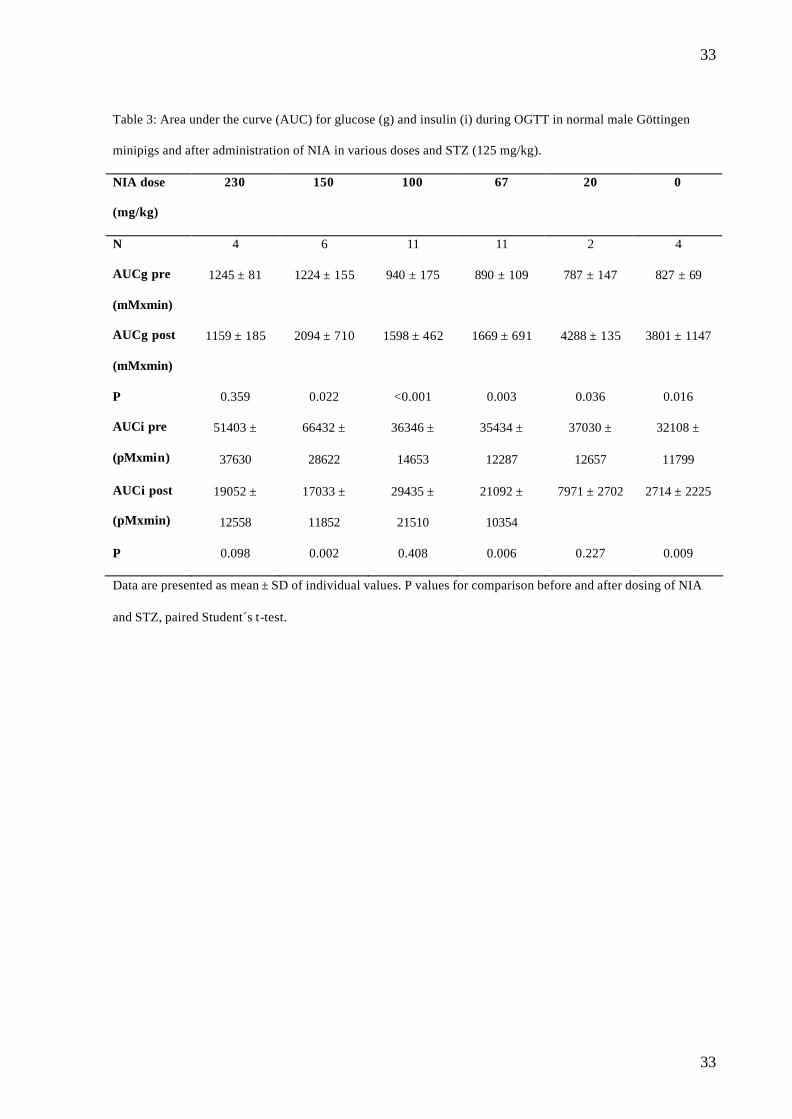
Table 3: Area under the curve (AUC) for glucose (g) and insulin (i) during OGTT in normal male Göttingen
minipigs and after administration of NIA in various doses and STZ (125 mg/kg).
NIA dose
(mg/kg)
230 150 100 67 20 0
N 4 6 11 11 2 4
AUCg pre
(mMxmin)
1245 ± 81 1224 ± 155 940 ± 175 890 ± 109 787 ± 147 827 ± 69
AUCg post
(mMxmin)
1159 ± 185 2094 ± 710 1598 ± 462 1669 ± 691 4288 ± 135 3801 ± 1147
P 0.359 0.022 <0.001 0.003 0.036 0.016
AUCi pre
(pMxmin)
51403 ±
37630
66432 ±
28622
36346 ±
14653
35434 ±
12287
37030 ±
12657
32108 ±
11799
AUCi post
(pMxmin)
19052 ±
12558
17033 ±
11852
29435 ±
21510
21092 ±
10354
7971 ± 2702 2714 ± 2225
P 0.098 0.002 0.408 0.006 0.227 0.009
Data are presented as mean ± SD of individual values. P values for comparison before and after dosing of NIA
and STZ, paired Student´s t-test.
34
34
1.0 1.5 2.0 2.50
5
10
15
Log STZ dose
Fas
ting
pla
sma
gluc
ose
(mM
)
Figure 1
1.0 1.5 2.0 2.50
5
10
15
Log NIA dose
Fas
ting
Pla
sma
Glu
cose
(mM
)
35
35
A B
C D
E F Figure 2
-50 0 50 100 150 2000
10
20
30
Time (min)
Pla
sma
gluc
ose
(mM
)
-50 0 50 100 150 2000
10
20
30
Time (min)
Pla
sma
gluc
ose
(mM
)
-50 0 50 100 150 2000
10
20
30
Time (min)
Pla
sma
gluc
ose
(mM
)
-50 0 50 100 150 2000
10
20
30
Time (min)
Pla
sma
gluc
ose
(mM
)
-50 0 50 100 150 2000
10
20
30
40
Time (min)
Pla
sma
gluc
ose
(mM
)
-50 0 50 100 150 2000
10
20
30
Time (min)
Pla
sma
gluc
ose
(mM
)
36
36
Figure 3
0 5 10 15 200
2500
5000
7500
FPG (mM)
AU
C g
luco
se (m
M⋅m
in)
37
37
-25 0 25 50 75 100 1250
10
20
30
40
Time (min)
Pla
sma
gluc
ose
(mM
)
-25 0 25 50 75 100 1250
250
500
750
1000
1250
Time (min)
Pla
sma
inus
lin (
pM)
Figure 4
38
38
Figure 5
39
39
Figure 6
Normal NGT IGT MD OD0
25
50
75
100
Classification of glucose toleranceduring OGTT
Pla
sma
insu
lin/
gluc
ose
(pM
/mM
)