Embed Size (px)
Citation preview

1
1
US EPA approved Microbiological Methods for Testing Drinking, Ground, Recreational
and Waste Waters
Gil Dichter
World Wide Technical Support Manager, Water
www.idexx.com/water
2
OBJECTIVESIntroduction to water microbiology
Define total coliforms, fecal, E.coli & enterococci
Overview of Regulations
USEPA approved methods
Understanding MPN theory and relationship to MF
Q&A
3
Bacteria Hierarchy
FamilyGenus (type of bacteria)Species
EnterobacteriaceaeEscherichia, Klebsiella, CitrobacterE.coli, E. hermanii,K. pneumoniae, C. freundii

2
4
Coliform Genera
Escherichia- human and animal feces
Enterobacter- environment, feces
Klebsiella- environment, feces
Citrobacter- environment
Serratia- environment
5
Thermotolerant Coliforms [aka Fecal Coliforms]It is a subset of total coliformsDefined as coliform bacteria that can grow at
44.5°CConsists of the following coliforms:
– E. coli– K. pnuemoniae–Enterobacter spp.
6
Coliform Bacteria Group
Total coliforms (35Klebsiella
E.coli
Fecal Coliforms -
thermotolerant (44.5°C)
CitrobacterEnterobacter
Total Coliforms (35°C)

3
7
Definitions of Coliforms & E.coliStandard Methods for the Examination of Water and Wastewater, 21st Edition– 9221 MTF: Gram negative bacteria that ferment lactose resulting in
gas and/or acid formation (turbidity) within 48 h at 35C.
– 9222 MF: Gram negative bacteria that develop red colonies with a metallic sheen within 24 h at 35C on m-Endo medium. Some members of the coliform group produce red colonies without a metallic sheen.
– 9223 Enzymatic: The total coliform group is defined as all bacteria possessing the enzyme β-D galactosidase cleaving the chromogenic substrate resulting in the release of the chromogen.
8
Definition of coliforms and E.coliEnzymatic con’t
E.Coli is defined as giving a total coliform response and possessing the enzyme β-D glucuronidase, cleaving the flurogenic substrate resulting in the release of the fluorgen.
Fecal Coliform (thermotolerant bacteria)– Bacteria that grow at 44.5°C
Produce gas & turbidity in EC medium
Produce blue colonies in m-FC media
Produce yellow color wells with Colilert-18
9
Why Test for E.coliAnimal # Tested E.coli Klebsiella
sppEnterobacter/ Citrobacter
Human 26 96.8% 1.5% 1.7%
Cow 15 99.9 - 0.1
Horse 3 100 - -
Sheep 20 97 - 3
Pig 15 83.5 6.8 9.7
Average 94.5%
Source:E.coli:Fecal Coliform A.P. Dufour. Special Technical Publication 65, ASRM. Pp48-58, 1977

4
10
Commonly Used Indicator Bacteria for Water Testing
Most commonly used:– Total coliform– Fecal coliform– E. coli– Enterococci
Total coliform used for >100 years
Fecal coliform used for >80 years
E. coli >20 years
11
Requirements for an Indicator Organism
Present when pathogens are present
Absent in uncontaminated waters
Present in higher numbers than pathogens in contaminated water
Better survival in water than pathogens
Easy and Safe to analyze
Rapid results
Inexpensive
Accurate
12
Overview of RegulationsTotal Coliform Rule-
LT2
Ground Water
Recreational Water
Waste Water

5
13
Total Coliform RulePromulgated 6/29/89
To control pathogensMonitor for total coliform bacteria in the distribution system (CFR 141)– Number of samples dependent on population
servedi.e.; 8501-12900 population requires 10 samples/month minimum.
Used as an indicator of treatment reliability & distribution integrityIf >5% TC/month, violates MLC for TC; if 2 consecutive TC with one E.coli, = acute violation and requires immediate notification
14
Where is Sampling
Done?
•May have dedicated sampling stations.
• In public buildings such as fire and police stations.
• Some are sampled daily M-F while others once a week, or two or three times a week.
• Depending on size as little as one site exists for sampling.
• Usually no dedicated sampling stations
• Maybe a kitchen or laundry sink.
Large Systems Small Systems
( Philadelphia )
15
LT2 ESWTR
Proposed- 7/03Promulgated- 1/5/06Large water systems must test for Crypto, E.coli & turbiditySmall water systems test for E.coliSmall systems may be required to test for Crypto.Proposes methods for Crypto & E.coli

6
16
Key Features of the LT2 Rule
Applies to all public water systems using surface water sources
(including GWUDI)
Supplements existing regulations to address Cryptosporidium in
systems with higher risk
– Filtered systems with high source water occurrence
– All unfiltered systems
17
Analytical Methods for Biological Pollutants in the
Ambient Water
RuleProcedure for enumerating E.coli, enterococci and Crypto & Giardia in ambient waterBased on 1986 guidelines for E.coli & enterococciMethods include- m-TEC, Colilert and Colilert-18 for E.coli, m-EI & Enterolert for enterococci.Final rule effective - 8/20/03
18
Guidelines for Analysis of Pollutants; Analytical Methods for Biological
Waste Water
Federal Register Notice- August 16th, 2005
Promulgated on March 26th, 2007
Testing for E.coli and for Enterococci – Approved methods include m-TEC, m-ColiBlue, Colilert, Colilert-18 for
E.coli, Enterolert & m-EI methods for enterococci
– E.coli for fresh surface waters and enterococci for marine waters
June 2010
US EPA recommends Colilert-18 for testing fecal coliforms in WW AT 45.5°C

7
19
Multiple Tube Fermentation (MTF)
Most Probable Number (MPN)
20
Most Probable Number Assay
21
Multiple Tube Fermentation Method (Total Coliforms-LTB & BGLB)

8
22
Fecal Coliform/E. coli Multiple Tube Method -EC medium + MUG
23
Membrane FiltrationMethods
24
Membrane Filter Apparatus

9
25
Membrane Filtration- applicable to all methods
May required media prep
Extensive QC
Minimum of 20 steps
20-80 colonies (20-60 for m-FC)
Risk of confluent growth
Risk of clogged filters
Risk of overlapping colonies
Risk of air bubbles under membrane
Difficult to read
26
m-Endo: Method
Standard Methods 9222B&C
Incubate for 24 hours at 35-37°C
Read at 24 hours for presumptive results
– Dark red or pink with metallic/green sheen
HPC Interference at 120 colonies or more– Transfer colonies to BGB to confirm coliforms (up to 48
hours)
Positives produce gas and turbidity
Transfer positives to EC (+Mug) for 24 hours at 44.5°C
– Positives produce, turbidity/gas, and/or fluorescence
Results with confirmation- could take up to 3 days
27
m-Endo Plate

10
28
Hach m-ColiBlue
Reagent storage is at 2-8°C
Incubate for 24 hours at 35±0.5°C
Read at 24 hours– Red or blue colony = TC
– Blue colony = E.coli
– Difficult to interpret colonies (very small)
If count >200 for TC/EC, exclude from calculation
29
Modified m-TEC for E. coli
Contains 5-bromo-6-chloro-3-indolyl-β-D-glucuronide
Selective inhibitory chemicals that can effect the growth of sub-lethal injured bacteria.
2 hours of incubation at 35°C followed by 22 hours at 44.5°C
Positive reaction is red to magenta color colonies
Extensive QC requirements
30
m-FCEnriched lactose medium
Contains aniline blue
Larger colonies than m-Endo; range is 20-60 colonies
Incubate in water bath at 44.5 ±0.2°C for 24 hours in plastic bag
Blue colonies are positive
Atypical- grey to green colonies
Confirm as per section 9020 Standard Methods

11
31
Defined Substrate Technology- Colilert &
Colilert-18
32
ONPG Positive ReactionColilert & Colilert-18
33
MUG Positive ReactionColilert & Colilert-18

12
34
MUG Positive ReactionColilert & Colilert-18
35
Quanti-Tray Demonstration
Add Colilert to sample and shake to dissolve
Pour mixture into a Quanti-Tray
36
Quanti-Tray Demonstrationcont.
Seal and incubate at 35°C for 18 or 24 hours for total coliforms and 44.5°C for
fecal coliforms for 18 hours
Count positive wells and refer to MPN table

13
37
E.coli- Blue Fluorescence- Quanti-Trayunder a 365nm UV Light at 35°C for 18 or 24 hours for
E.coli
38
StudiesAWWARF Study : Significance of Methods and Sample
Volumes for EC &TC Measurements- Fricker et al – Methods and volume of samples evaluated for drinking water testing cited in Sept. 2010 RTCR meeting.
Glactosidase methods will detect more coliforms (higher concentration and a broader range) than lactose based methods
Study found Colilert-18 and Colilert had a confirmation rate of 97.7 and 95.1%. False negative rate of 1.8 and 2.8%
Confirmation rates for m-Endo was 84.6% & false negative rate of 13.2%
Verification of E.coli for Colilert-18 & Colilert are 100 & 99.1%, m-FC is 79.7%
39
Studies con’t
Choice of a specific method is often a personal preference within a lab. Factors such as sensitivity, specificity, accuracy, simplicity & time to results are most important factors in choosing an appropriate method

14
40
Studies con’t
Comparison of m-Endo, MacConkey & Teepol Agar Methods for MF Counting Total Coliform bacteria in Water: Grabow & Preez AEM, Sept’79 Vol 38 #3 p 351-355
– 341 coliform like colonies picked from m-Endo membranes for identification
186 /55% true coliforms
138/40% Aeromonas hydrophilia
17/5% other species
A comparison of ten USEPA approved total coliform/E. coli tests: Jeremy Olstadt, WQTC 2005
– 2 different strains of Aeromonas spike into different waters at 3 different sites- Colilert & Colilert 18 negative at 105/mL
41
Studies con’t
Evaluation of Two Colilert Formulations and Quanti-Tray for the Assessment of the Bacteriological Quality of Water: Fricker et al. Water Research 1997 Vol 31 pp 2495-2499
– Identified 296 wells for total coliforms for Colilert & Quanti-Tray
All 296 wells confirmed as coliforms compared to 257 colonies/363 (71%) for the UK MF method.
Evaluation of the Autoanalysis Colilert for Determination & Enumeration of Coliforms: Covert et al AEM Oct 1989 Vol 55 #10
– No false positives from Pseudomonas, 1 + Aeromonas* at 7.5X10⁴/ml
– Flavobacterium + at 107-108/mL
– *All above label claim
42
Enterococci MF and Defined Substrate
Technology®
15
43
m-EI Method for Enterococci
24 hour MF Test
All colonies regardless of color with a blue halo
20-60/plate
Colonies <0.5mm difficult to read
Media is expensive (Indoxyl-β-D-glucoside)
Magnification required to read plates
44
Method 1600- m-EI
45
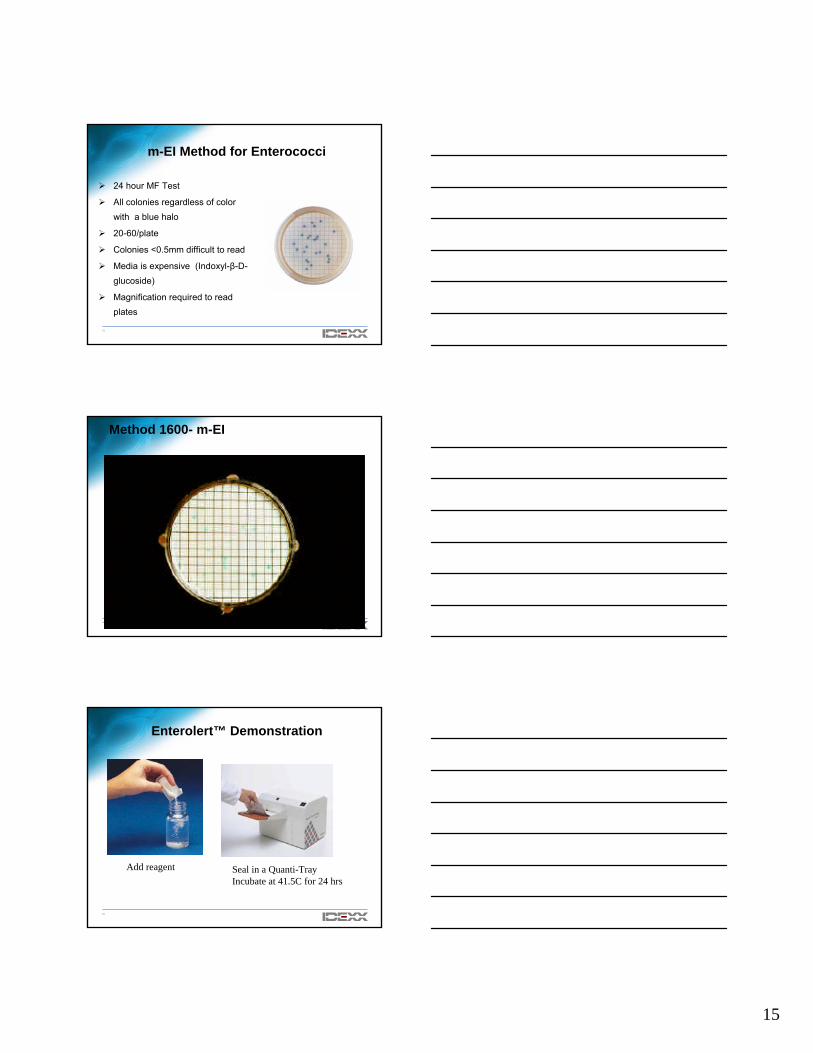
Enterolert™ Demonstration
Add reagent Seal in a Quanti-TrayIncubate at 41.5C for 24 hrs

16
46
Enterolert™ Demonstration
Count fluorescent wells and refer to MPN table
47
Estimation of Bacterial Densities by MPNDates back to 1915 when the concept was introduced by
M.H. McCrady (J of Infectious Disease Vol 17, 1915*)
Prior to this novel concept; no means of direct counting– Only had presence-absence of fermentation tubes
The method is a means for estimating without any direct count, the density of organisms in a liquid.
Multiple samples of the liquid are taken and incubated in suitable media
– Record presence or absence of growth in each sample tube
– Ingenious application of probability theory
– Estimate the number of organisms from the number of negative tubes
*The Numerical Interpretation of Fermentation Tube Results
48
MPN Theory MPN Theory –– a short math lessona short math lessonBasic assumptions:
– The organisms are distributed randomly throughout– the liquid
Sample is well shaken (important and often neglected)– A sample will exhibit growth (in the culture media) whenever one
or more of the target organisms is presentMedia should be selective and sensitive
– Requires that at least 1 tube shows no growth (sterile)If n samples, each of volume v mL are taken from a liquid, and s of these are sterile,
then an estimate of the organism density d per mL in the original sample is:
d = -2.303/v log(s/n) [Poisson distribution]
d can be shown statistically to have the highest probability of estimating the actual organism density – the “Most Probable Number” - MPN

17
49
Single dilution Single dilution –– Maximum counting rangeMaximum counting range
d = -2.303/v log(s/n)n = 50, v = 2 mL, s = 1
d = -2.303/2 log (1/50)= 1.956 MPN/mL
= 195.6 MPN/100 mL
Number of Tubes Maximum MPN/100mL
Number of Tubes Maximum MPN/100mL
5 8 35 12510 23 40 14815 40 45 17120 60 50 19625 80 75 32430 102 100 461
50
Uncertainty of MPNSkewed distribution & Uncertainty of Results– For microbiological tests, because of the complications of the skewed distribution, the estimate of uncertainty from a well-designed precision experiment will be regarded as a reasonable estimate of the uncertainty of results
When MPN tables are used to obtain results, the 95% CL in the table will be regarded as a reasonable estimate of the uncertainty of the results
Labs are encourage to identify and question unusual combinations of positive tubes in the tables.
–15 tube MPN combination of + tubes»1-2-3»3-5-4
51
Standard Methods MPN Table 15 Tube

18
52
Overcoming the tube numbers problemOvercoming the tube numbers problemTo increase counting range need more tubes
For 100mL sample could use 50 tubes x 2mL
Would give counting range of ~200MPN/100mL– Big headache for lab – lots of tubes – lots of pipettes -lots of
washing! Not really practical.
– Microtitre plate (96 wells) – MPN range 438/100mL
53
QuantiQuanti--TrayTray®
Use multiple well concept but automate the sealing
51 well Quanti-TrayTotal sample volume 100mL
d = -2.303/v log(s/n)
n = 51, v = 1.96 mL, s = 1
d = -2.303/1.96 log (1/51)= 2.006 MPN/mL
= 200.6 MPN/100 mL
54
Multiple DilutionsMultiple DilutionsNot practical to extend the counting range by increasing the number of
wells beyond a certain point.
Sample serially diluted and each dilution is inoculated into a similar
number of tubes. Commonly used configurations:
– 3 tubes x 3 decimal dilutions – food industry
– 5 tubes x 3 decimal dilutions – food, water wastewater (Max MPN = 1600/100mL)
With multiple dilutions the statistical calculation of the MPN value becomes more complex. Thomas provided an approximation that could be used for any combination of tubes
MPN/100mL = # of positive tubes x 100√ (# of mL in negative tubes) x (# of mL in all tubes)

19
55
QuantiQuanti--Tray 2000Tray 2000®®
Innovative approach to provide a multiple dilution system without adding dilution water
Small wells are 1/10th the volume of the large wells– Effectively a 49 x 48 tube serial dilution
Using the Thomas formula:(MPN is an approximate, deviates from the MPN table and is not significant)Number of +ve tubes = 96Volume of –ve tubes = 0.186mLVolume in all tubes = 100mL
MPNmax = 96 x100√ (0.186) x (100)
= 2232/100mL vs 2419
56
Confidence LimitsConfidence LimitsDistribution of MPN estimates is approximately log normal (distribution).
Confidence limits can be calculated (95% limits = +/- 1.96σ)
Precision is low when the number of tubes is small.
For 10 x 10mL tubes with 9 positive: MPN = 28/100mL
the 95% confidence limits are: 11.5 – 68.1 MPN/100mL
Confidence limits for 51 well Quanti-trayWhen increased to 51 x 1.96mL with 22 positive: MPN = 28.8/100mL
The 95% confidence limits are: 19.0 – 44.3 MPN/100mL
Interesting fact: If had 100 x 1mL with 25 positive: MPN = 29/100mL
The 95% confidence limits are: 19.6 – 43.0 MPN/100mL
Not much improvement – 50 tubes is about optimum
57

20
58
95% Confidence Limit Comparison
79 22-22078.0 55.6-103.878.2 56.4-111.2
49 15-15050.4 35.0-69.150.4 35.4-72.5
20 12.2-30.820 6.8-4020.6 12.7-31.820.7 13-33.3
17 9.9-27.217 6.0-4017.9 10.7-28.217.8 10.8-29.4
5 1.6-7.24.5 0.79-155.2 1.8-10.85.3 2.3-12.3
Value CLValue CLValue CLValue CL
MF
CFU/100mL
MTF
MPN/100mL
Quanti-Tray
2000
MPN/100mL
Quanti-Tray
MPN/100mL
59
IDEXX Support
1-800-321-0207- #1 Customer Support- #2 Technical Service-#3 Select extension
-www.idexx.com/water
60
Thank You
Questions