Embed Size (px)
Citation preview
Main Research Report
Minda Industries Limited
Independent Equity Research
March - 2016
Equentis Wealth Advisory Services (P) Ltd
Registered Office:
712, Raheja Chambers, Nariman Point,
Mumbai – 400021 India
Tel: +91 22 61013800
Email: [email protected]
2
BACKGROUND & BUSINESS
Group -Minda Industries Limited (MIL) -- M.Cap Rs.14bn ($210mn @ Rs.66.6/$); FY15 consolidated revenues
Rs.22bn) is the flagship entity of Nirmal Kumar (NK) Minda Group (group turnover more than $500mn); the group
recently rebranded itself as “UNO MINDA”. With humble beginnings way back in 1958 by Late Shri S.L. Minda,
the company over the last five decades has evolved into a leading Tier-1 supplier of Proprietary Automotive Solutions
to original equipment manufacturers OEMs across a range of automotive components.
Segments (Current) -UNO Minda is widely present in almost all the domains of vehicles production such as –
electrical & electronics, body & structure, chassis & motor systems, engine & exhaust, interior controls and safety,
clean‐tech, distribution & institutional businesses. As a Tier‐1 supplier, the Company designs, develops and
manufactures a wide range of automotive components such as - switches – 2W/HBA & 4W/HVAC, sensor and body
electronics, relay, actuators, accelerator pedal assembly, automotive lighting, automotive horns, alternate fuel
systems, non-automotive LED lighting, solar renewable energy, automatic gear shifters, blow molding and fuel caps.
Business Overview – As % Consolidated turnover – HY-1-FY16
Products % Sales Channels % Sales Geography % Sales Segments % Sales
Switches 45% OEM 80% Domestic 83% 4W 33%
Lighting 20% Replacement 20% Overseas 17% 2W 67%
Horns 18%
Others 17%
Segments (New) -During FY15, it entered into a JV with Panasonic Corporation (Japan) to revive its battery
business. MIL owns 40% stake in the JV. This business will have an installed capacity of 4mn batteries p.a. and will
commence commercial production from FY17 onwards. Another JV formed by Minda was with Kosei of Japan to
manufacture alloy wheels for Passenger Vehicles.MIL has 70% stake in this venture. It has set up an alloy wheels
facility with capacity of 60,000 units pm at Bawal, Haryana which will commence commercial production in FY17.
Business strengths -MIL has 25 manufacturing facilities across 14 locations in India. Presently, MIL is the second
largest manufacturer of 2W/3W horns globally (after FIAMM) and the third largest manufacturer of automotive
switches in India (after Lumax Industries and Fiem Industries). It has more than 100 registered patents, 129 design
registrations till date and three R&D centres across the country. MIL employs more than 6,200 people and through
its network of more than 500 business partners and 10,000 dealers, it serves more than 50 OEMs in India and abroad.
Recent acquisitions -Its most recent acquisition was that of Clarton Horn (CH), a Spanish company (in March,
2013) for a consideration value of €6.8mn ($8.9mn, Rs.580mn). CH is a leading manufacturer of automotive
electronic horns, supplying to all major OEMs in Europe. The firm has manufacturing plants in La Carolina (Spain),
Morocco and Mexico and sales office in Germany. In FY14 – the first full year of integration with Minda, this
business reported sales of roughly Rs.2bn, EBITDA margins of around 4.5% and PBT loss of Rs.110 mn. The
management successfully turned around this entity in the second year itself with FY15 sales of ~Rs.4bn, EBITDA
margins of ~5% and PBT of Rs.19mn.
Business Integration Exercise -As part of broader reorganization at the consolidated level, MIL is increasing its stake
in various group companies which have synergies with the portfolio of the company. The objective is to consolidate all
businesses of the Uno Minda Group. Already the company has increased stake in the lighting business of its erstwhile
Indonesian and Vietnam group companies. Further it has increased stake in the casting business which has also shown a
remarkable turnaround. Plans are underway to integrate the businesses of various partnership concerns into the books of
MIL. It has appointed KPMG to work on a scheme to simplify corporate structure in a tax efficient manner.We view this
initiative as highly constructive and are of the opinion that it would give a huge fillip to the turnover and profits of
MIL.
3
Group Companies - MIL has formed associations with several global automotive technology players through joint
ventures and partnerships. These are summarized below:
Sr. No. Partner Entity
Partner Country Segment Type
MIL's Stake Entity
1 Kyoraku CO Japan Blow Moulding Subsidiary 71.66% MindaKyoraku Company Ltd
2 JBM Group India Die Casting Subsidiary 98.00% M J Casting Ltd
3 Tokairika Co Japan Switches Associate 27.08% MindaRika Private Ltd
4 Panasonic Corp Japan Batteries JV 40.00% Panasonic Minda Storage Batteries India Pvt. Ltd
5 Emer S.p.A. Italy Fuel Systems JV 49.10% MindaEmer Technologies Ltd
6 Kosei Aluminum Co Japan Alloy Wheels JV 70.00% Minda Kosei Alloy Wheels Pvt. Ltd
7 Fujitsu Ten Japan Auto Infotainment Systems JV 51.00% Minda F-Ten Pvt. Ltd
Management effectiveness -From its humble beginnings as primarily a maker of automotive switches, the
management has been very proactive in diversifying its product portfolio which now includes - lighting products,
horns, batteries, fuel caps, auto gas, alloy wheels, etc. Further, it has also successfully ramped up its operations by
forging successful partnerships with global leaders which have helped the business add new clients and become a
dominant Tier-I vendor for its product portfolio. Alongside it has built a strong brand recall in the after-market
segments.
Financial Performance – A Glimpse -Consolidated Net Revenues have grown at a robust pace of ~25% CAGR
over past three years while EBITDA has grown at more than 25% CAGR during the period. This is an impressive
run rate and is expected to improve going ahead given that several of its recently formed JVs and associations would
turn around and start generating profits over the next 1 – 2 years. Debt-Equity ratio is comfortably below 1xs while
RoCE and RoE have been steadily going up over past three years. While RoCE has improved from 8% in FY12 to
10% in FY15, RoE has gone up from 12% to 20% during the period. Given that there are no plans to set up new
facilities in the near future and most capacity expansions are in place, the free cash flow generation (which turned
positive) in FY15 (FCFF Rs.878mn) would improve going ahead.
Ownership Profile -The promoters have maintained their stake in the company at a steady level (65% - 70%) over
the past decade. At the same time no part of the promoter holding is pledged. Motilal Oswal’s India PE Fund owns
close to 8.5% stake in MIL since 2010. The management has been quite transparent regarding periodic disclosures
addressing analyst and investor queries through regular quarterly post-result conference calls and analyst meets.
4
INVESTMENT THESIS
Minda is at the cusp of a strong ‘new growth cycle’, led by a powerful play of twin factors of a highly attractive opportunity
at its end-user Indian automotive industry, as well as by its dominant Tier-I auto vendor status, resulting in high entry
barriers and market leadership across its diversified product portfolio.
Over the years, the management has shown tremendous foresight in scaling up the operations, led by successful
diversification of product portfolio and strong client additions. Importantly, this successful ramp-up has been supported
by partnerships with global leaders, which in turn has ensured high quality products and robust acceptance of the same
amongst OEMs. Alongside, the company has built strong brand equity in the more profitable after-market, which also
helps to some extent smoothen business cycle volatilities.
In our opinion, the next leg of growth would be driven by the following –
a) Steady growth in existing product portfolio mainly of switches, lighting and acoustics led by its dominant market
leadership across OEMs and after-markets. For the same, Minda has already invested in building new capacities that
offer visibility to support strong double digit revenue CaGR over the next 3-5 years.
b) The group has initiated a ‘Business Integration Exercise’, with the objective to bring the operations of various
group companies mostly owned by the promoters into the books of Minda Industries. As a part of this process we
expect the following businesses to be fully merged with Minda Industries over the next 6-9 months –
1) Operations of the lighting business of Indonesia and Vietnam - during the current financial year, Minda paid
roughly Rs. 260mn to increase stake from 19% to 51% and plans are to increase stake to 100% (at similar
valuations) by end of this fiscal or by first quarter of FY17. This business is estimated to post revenues to the
tune of Rs. 650mn in FY16.
2) MJ Casting which was earlier a 50:50 JV with JBM Auto is now 98% owned by Minda Industries. FY16 will
be the first year of full integration of the financials of this business which is estimated to report a turnover of
~Rs. 2bn. The company paid Rs. 140mn to increase its share from 50% to 98%.
3) Partnership firms – Yogendra Engineering and Auto Components, Haridwar both in which Minda has 49%
interest are expected to be fully merged within a time frame of 6-9 months. These businesses are estimated to
have a topline of around Rs. 3bn and are debt-free.
Note – We’d like to highlight that an important line of business of 4W switches housed in the associate company – Mindarika
which presently is a ~27% associate is not considered in our estimates as part of the integration exercise. Mindarika has
a turnover of ~ Rs. 5bn with a large balance sheet base of ~ Rs. 2bn. It has debt: equity ratio of ~1:1 and integration of this
company would have meaningful implications on the cash flows of Minda. Whilst, there is a business case for bringing it in
the books of Minda given its synergies with the existing mainstay business of switches for 2W/3W/off the road vehicles, we
will keep a close watch on the developments on this front and revise our estimates as and when there is greater clarity on the
transaction details and the means of funding.
c) Investments in new business lines – alloy wheels (70% subsidiary with Japanese leader Kosei Aluminium) and
batteries (40% JV with global major Panasonic), both of which have an extremely favourable industry opportunity,
are in process to commence commercial production shortly and are estimated to contribute in a meaningful way to
the financials of the company going forward.
Key assumptions for Base Case Forecasts over FY15-20
Revenue:As per our estimates, consolidated turnover of Minda is projected to report strong double-digit CaGR
in the range of 20-25% over FY15-20, off which revenues coming through business integration exercise and
through new product additions are likely to account for ~9% of turnover in FY16 and thereafter jump to ~22% from
FY17 itself. Existing operations across standalone and subsidiaries are projected to grow at 16% CaGR over FY15-
20, with revenues from integration of group companies and new product additions registering ~60% CaGR over
FY16-20.
Accordingly, turnover from ~Rs. 22bn in FY15 is estimated to grow to ~Rs. 27bn in FY16 a growth of 25% YoY. Off this,
existing operations are estimated to grow at ~15% YoY with the balance growth coming on account of integration of a few
group companies.
Taking forward, we estimate FY17 to be the first full year reflecting the revenues on account of integration and revenue
from new product additions like alloy wheels and batteries. We estimate FY17 revenues of ~Rs. 38bn, growth of 37% YoY.
Off this, the current existing business is estimated to grow at 17% YoY with the remainder coming from integration exercise
5
and revenues kicking in from new product additions. Thereafter, we project consolidated sales to grow at ~18% YoY each in
FY18/19&20.
Basis these assumptions, consolidated turnover is expected to grow nearly 3xs over FY15-20. As stated above, these
estimates may be revised upwards if the associate company Mindarika and/or other family owned companies (on which there
is no information presently) are also brought in the fold of Minda.
EBITDA: We estimate consolidated EBITDA to grow at a CaGR of ~35% over FY15-20, higher than the
topline CaGR aided by EBITDA margin expansion of ~450bps over FY15-20. We’d like to draw attention to the
fact that much of the EBITDA margin expansion of nearly 315bps is expected in FY16 itself, with Minda posting
consolidated EBITDA margins of close to 10% in FY16 as against ~7% in FY15. This is in-line with the strong boost
in EBITDA margins reported by Minda in first half this fiscal with management guidance of closing this fiscal with
nearly double-digit EBITDA margins. Thereafter through FY17-20 we forecast around 115bps EBITDA margin
expansion.
EBITDA contribution from integration of group companies and new product additions is expected to account for ~22%
of consolidated EBITDA in-line with its contribution to the turnover as covered above.
Capex& Asset-sweating: In the past 5 years, Minda has invested cumulative Rs. 8bn which is sufficient to support
our growth estimates over the next 3 years. FY16 we estimate capex at ~ Rs. 2.5bn mainly towards the alloy wheels
facility. Thereafter, the management has guided for nominal capex of around Rs. 500mn in FY17. Over our
forecasted period FY16-20 we estimate cumulative capex of Rs. 6.5bn. We estimate steady improvement in asset
sweating from current levels of roughly 2xs to 3xs+ over FY20.
Investments: We estimate Minda to have a cash outflow of ~ Rs. 1.5bn over FY16 & 17 towards increasing its stake
in group companies as part of the on-going business integration exercise. As covered before, this does not factor in
the potential integration of the associate company Mindarika, which we reckon would require substantial outgo.
Cap-structure: Based on the above assumptions, we estimate Minda to become debt-free by FY19. Over the near-
term we expect leverage to remain well below 1xs and with a steadily declining bias.
PAT: With a topline CaGR of 22%, EBITDA CaGR of ~35%, we estimate PAT CaGR of ~39% over FY15-20.
We have assumed tax rates at ~25% each year in our forecasted period.
Dividend Payout: We have maintained dividend payout ratio as % net profits to be constant at current levels of
~17% over our forecasted period.
Working Capital Intensity: Minda has an efficient working capital management with Net working capital as % net
sales at around 5%. We project it at similar levels going forward.
Return Metrics: RoCE is expected to double to 20%+ in FY16 itself over FY15 levels and steadily increase to
25%+ in FY17 and further to 30%+ in FY18 and inch towards 40% levels in FY19 & 20.
Valuations& Recommendation
Basis the above explained growth opportunity and Minda’s strong competitive positioning, alongside benefits of scaling up
through business integration exercise and new product additions; over FY15-20, we forecast Consolidated Turnover to grow
~3xs, EBITDA to grow ~4.5xs and PAT to grow ~5.5xs. After building in cumulative capex and investments worth ~Rs.
8.5bn, we estimate Minda to become debt-free by FY19, with cumulative free cash flows to the firm worth Rs. 12bn.
RoCE is expected to double to 20%+ in FY16 itself over FY15 levels and steadily increase to 25%+ in FY17 and further
to 30%+ in FY18 and inch towards 40% levels in FY19 & 20.Such rampant pace of improvement in financials puts Minda
in a sweet spot, wherein it should see the twin benefits of sharp upward revision in earnings as well as multiple re-rating.
We forecast base case EPS at Rs. 75/- in FY16 (77% YoY), Rs. 107/- in FY17 (42% YoY), Rs. 145/- in FY18 (35% YoY),
Rs. 180/- in FY19 (25% YoY) and Rs. 215/- in FY20 (20%) YoY. This implies EPS CaGR of 38% over FY15-20.
Over the next 12-15 months, we expect the stock has the potential of more than doubling over the current levels.This is
based on valuing average FY16 & 17 estimated EPS of ~ Rs. 90/- at 20xs PE multiple.
Given our high conviction in the business model and the favourable medium-term outlook, we are of the opinion, that apart
from the strong near-term stock price appreciation, Minda also has the potential of creating significant wealth and fits well
into our 5x5 strategy.
6
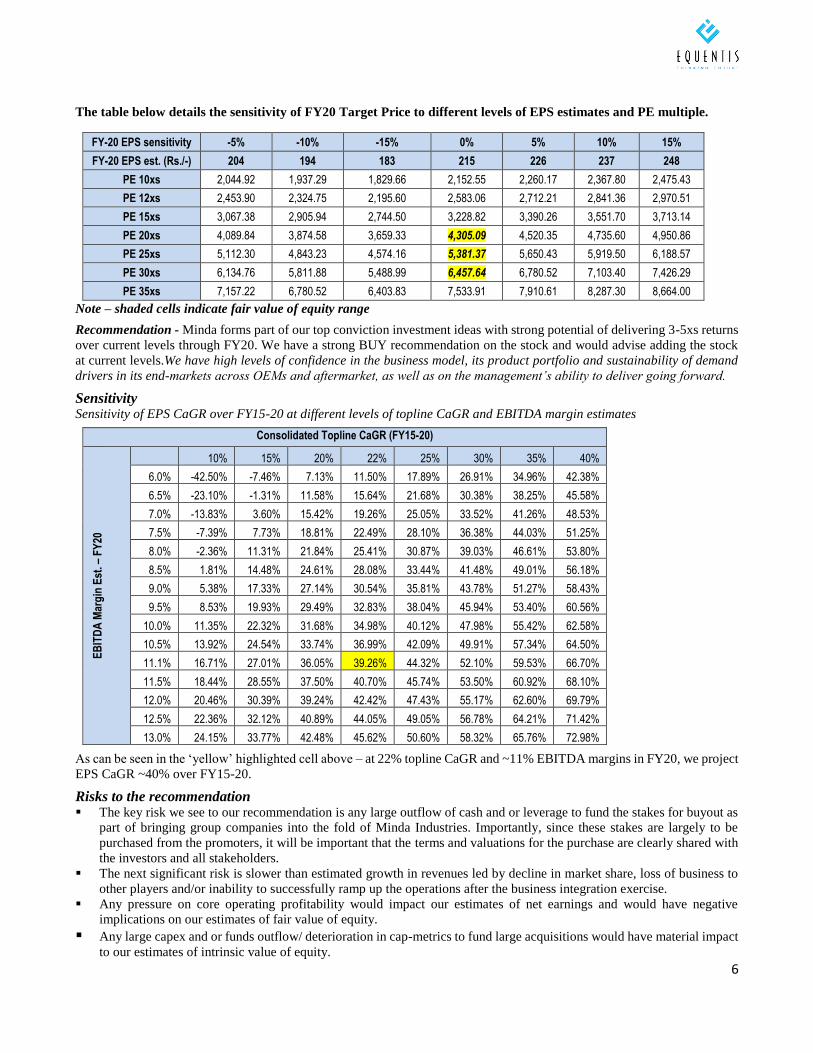
The table below details the sensitivity of FY20 Target Price to different levels of EPS estimates and PE multiple.
FY-20 EPS sensitivity -5% -10% -15% 0% 5% 10% 15%
FY-20 EPS est. (Rs./-) 204 194 183 215 226 237 248
PE 10xs 2,044.92 1,937.29 1,829.66 2,152.55 2,260.17 2,367.80 2,475.43
PE 12xs 2,453.90 2,324.75 2,195.60 2,583.06 2,712.21 2,841.36 2,970.51
PE 15xs 3,067.38 2,905.94 2,744.50 3,228.82 3,390.26 3,551.70 3,713.14
PE 20xs 4,089.84 3,874.58 3,659.33 4,305.09 4,520.35 4,735.60 4,950.86
PE 25xs 5,112.30 4,843.23 4,574.16 5,381.37 5,650.43 5,919.50 6,188.57
PE 30xs 6,134.76 5,811.88 5,488.99 6,457.64 6,780.52 7,103.40 7,426.29
PE 35xs 7,157.22 6,780.52 6,403.83 7,533.91 7,910.61 8,287.30 8,664.00
Note – shaded cells indicate fair value of equity range
Recommendation - Minda forms part of our top conviction investment ideas with strong potential of delivering 3-5xs returns
over current levels through FY20. We have a strong BUY recommendation on the stock and would advise adding the stock
at current levels.We have high levels of confidence in the business model, its product portfolio and sustainability of demand
drivers in its end-markets across OEMs and aftermarket, as well as on the management’s ability to deliver going forward.
Sensitivity Sensitivity of EPS CaGR over FY15-20 at different levels of topline CaGR and EBITDA margin estimates
Consolidated Topline CaGR (FY15-20)
EB
ITD
A M
arg
in E
st. –
FY
20
10% 15% 20% 22% 25% 30% 35% 40%
6.0% -42.50% -7.46% 7.13% 11.50% 17.89% 26.91% 34.96% 42.38%
6.5% -23.10% -1.31% 11.58% 15.64% 21.68% 30.38% 38.25% 45.58%
7.0% -13.83% 3.60% 15.42% 19.26% 25.05% 33.52% 41.26% 48.53%
7.5% -7.39% 7.73% 18.81% 22.49% 28.10% 36.38% 44.03% 51.25%
8.0% -2.36% 11.31% 21.84% 25.41% 30.87% 39.03% 46.61% 53.80%
8.5% 1.81% 14.48% 24.61% 28.08% 33.44% 41.48% 49.01% 56.18%
9.0% 5.38% 17.33% 27.14% 30.54% 35.81% 43.78% 51.27% 58.43%
9.5% 8.53% 19.93% 29.49% 32.83% 38.04% 45.94% 53.40% 60.56%
10.0% 11.35% 22.32% 31.68% 34.98% 40.12% 47.98% 55.42% 62.58%
10.5% 13.92% 24.54% 33.74% 36.99% 42.09% 49.91% 57.34% 64.50%
11.1% 16.71% 27.01% 36.05% 39.26% 44.32% 52.10% 59.53% 66.70%
11.5% 18.44% 28.55% 37.50% 40.70% 45.74% 53.50% 60.92% 68.10%
12.0% 20.46% 30.39% 39.24% 42.42% 47.43% 55.17% 62.60% 69.79%
12.5% 22.36% 32.12% 40.89% 44.05% 49.05% 56.78% 64.21% 71.42%
13.0% 24.15% 33.77% 42.48% 45.62% 50.60% 58.32% 65.76% 72.98%
As can be seen in the ‘yellow’ highlighted cell above – at 22% topline CaGR and ~11% EBITDA margins in FY20, we project
EPS CaGR ~40% over FY15-20.
Risks to the recommendation The key risk we see to our recommendation is any large outflow of cash and or leverage to fund the stakes for buyout as
part of bringing group companies into the fold of Minda Industries. Importantly, since these stakes are largely to be
purchased from the promoters, it will be important that the terms and valuations for the purchase are clearly shared with
the investors and all stakeholders.
The next significant risk is slower than estimated growth in revenues led by decline in market share, loss of business to
other players and/or inability to successfully ramp up the operations after the business integration exercise.
Any pressure on core operating profitability would impact our estimates of net earnings and would have negative
implications on our estimates of fair value of equity.
Any large capex and or funds outflow/ deterioration in cap-metrics to fund large acquisitions would have material impact
to our estimates of intrinsic value of equity.
7
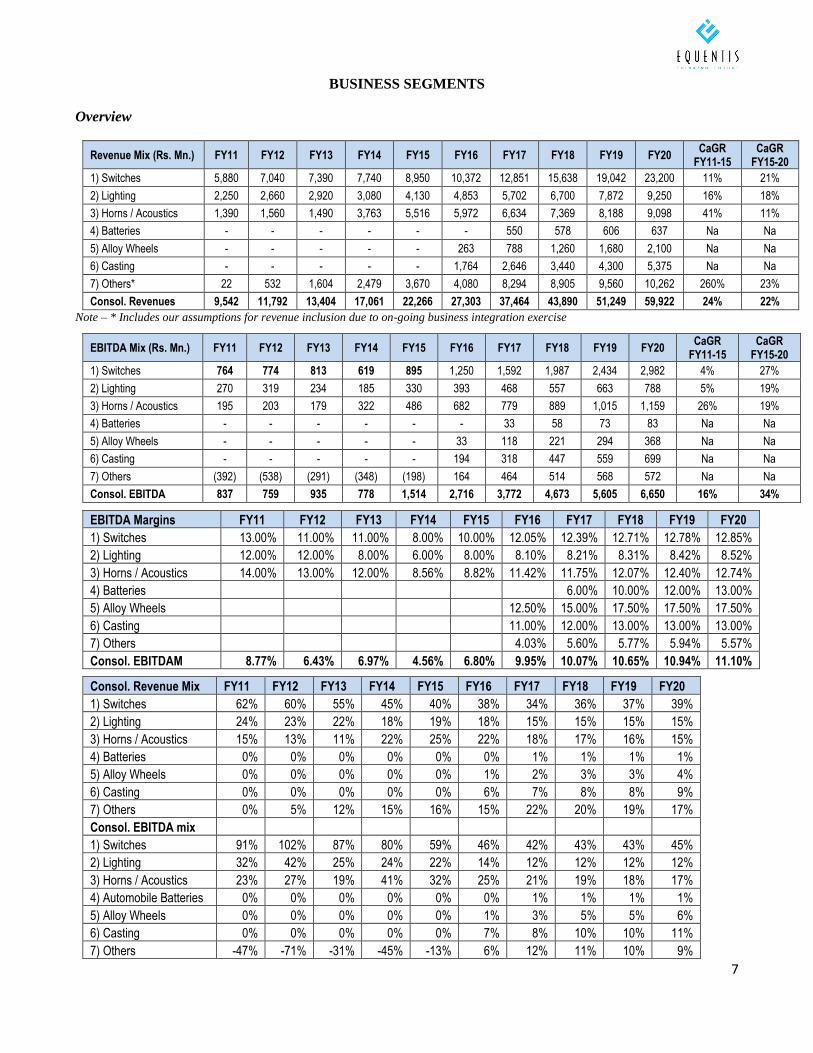
BUSINESS SEGMENTS
Overview
Revenue Mix (Rs. Mn.) FY11 FY12 FY13 FY14 FY15 FY16 FY17 FY18 FY19 FY20 CaGR
FY11-15 CaGR
FY15-20
1) Switches 5,880 7,040 7,390 7,740 8,950 10,372 12,851 15,638 19,042 23,200 11% 21%
2) Lighting 2,250 2,660 2,920 3,080 4,130 4,853 5,702 6,700 7,872 9,250 16% 18%
3) Horns / Acoustics 1,390 1,560 1,490 3,763 5,516 5,972 6,634 7,369 8,188 9,098 41% 11%
4) Batteries - - - - - - 550 578 606 637 Na Na
5) Alloy Wheels - - - - - 263 788 1,260 1,680 2,100 Na Na
6) Casting - - - - - 1,764 2,646 3,440 4,300 5,375 Na Na
7) Others* 22 532 1,604 2,479 3,670 4,080 8,294 8,905 9,560 10,262 260% 23%
Consol. Revenues 9,542 11,792 13,404 17,061 22,266 27,303 37,464 43,890 51,249 59,922 24% 22%
Note – * Includes our assumptions for revenue inclusion due to on-going business integration exercise
EBITDA Mix (Rs. Mn.) FY11 FY12 FY13 FY14 FY15 FY16 FY17 FY18 FY19 FY20 CaGR
FY11-15 CaGR
FY15-20
1) Switches 764 774 813 619 895 1,250 1,592 1,987 2,434 2,982 4% 27%
2) Lighting 270 319 234 185 330 393 468 557 663 788 5% 19%
3) Horns / Acoustics 195 203 179 322 486 682 779 889 1,015 1,159 26% 19%
4) Batteries - - - - - - 33 58 73 83 Na Na
5) Alloy Wheels - - - - - 33 118 221 294 368 Na Na
6) Casting - - - - - 194 318 447 559 699 Na Na
7) Others (392) (538) (291) (348) (198) 164 464 514 568 572 Na Na
Consol. EBITDA 837 759 935 778 1,514 2,716 3,772 4,673 5,605 6,650 16% 34%
EBITDA Margins FY11 FY12 FY13 FY14 FY15 FY16 FY17 FY18 FY19 FY20
1) Switches 13.00% 11.00% 11.00% 8.00% 10.00% 12.05% 12.39% 12.71% 12.78% 12.85%
2) Lighting 12.00% 12.00% 8.00% 6.00% 8.00% 8.10% 8.21% 8.31% 8.42% 8.52%
3) Horns / Acoustics 14.00% 13.00% 12.00% 8.56% 8.82% 11.42% 11.75% 12.07% 12.40% 12.74%
4) Batteries 6.00% 10.00% 12.00% 13.00%
5) Alloy Wheels 12.50% 15.00% 17.50% 17.50% 17.50%
6) Casting 11.00% 12.00% 13.00% 13.00% 13.00%
7) Others 4.03% 5.60% 5.77% 5.94% 5.57%
Consol. EBITDAM 8.77% 6.43% 6.97% 4.56% 6.80% 9.95% 10.07% 10.65% 10.94% 11.10%
Consol. Revenue Mix FY11 FY12 FY13 FY14 FY15 FY16 FY17 FY18 FY19 FY20
1) Switches 62% 60% 55% 45% 40% 38% 34% 36% 37% 39%
2) Lighting 24% 23% 22% 18% 19% 18% 15% 15% 15% 15%
3) Horns / Acoustics 15% 13% 11% 22% 25% 22% 18% 17% 16% 15%
4) Batteries 0% 0% 0% 0% 0% 0% 1% 1% 1% 1%
5) Alloy Wheels 0% 0% 0% 0% 0% 1% 2% 3% 3% 4%
6) Casting 0% 0% 0% 0% 0% 6% 7% 8% 8% 9%
7) Others 0% 5% 12% 15% 16% 15% 22% 20% 19% 17%
Consol. EBITDA mix
1) Switches 91% 102% 87% 80% 59% 46% 42% 43% 43% 45%
2) Lighting 32% 42% 25% 24% 22% 14% 12% 12% 12% 12%
3) Horns / Acoustics 23% 27% 19% 41% 32% 25% 21% 19% 18% 17%
4) Automobile Batteries 0% 0% 0% 0% 0% 0% 1% 1% 1% 1%
5) Alloy Wheels 0% 0% 0% 0% 0% 1% 3% 5% 5% 6%
6) Casting 0% 0% 0% 0% 0% 7% 8% 10% 10% 11%
7) Others -47% -71% -31% -45% -13% 6% 12% 11% 10% 9%
8
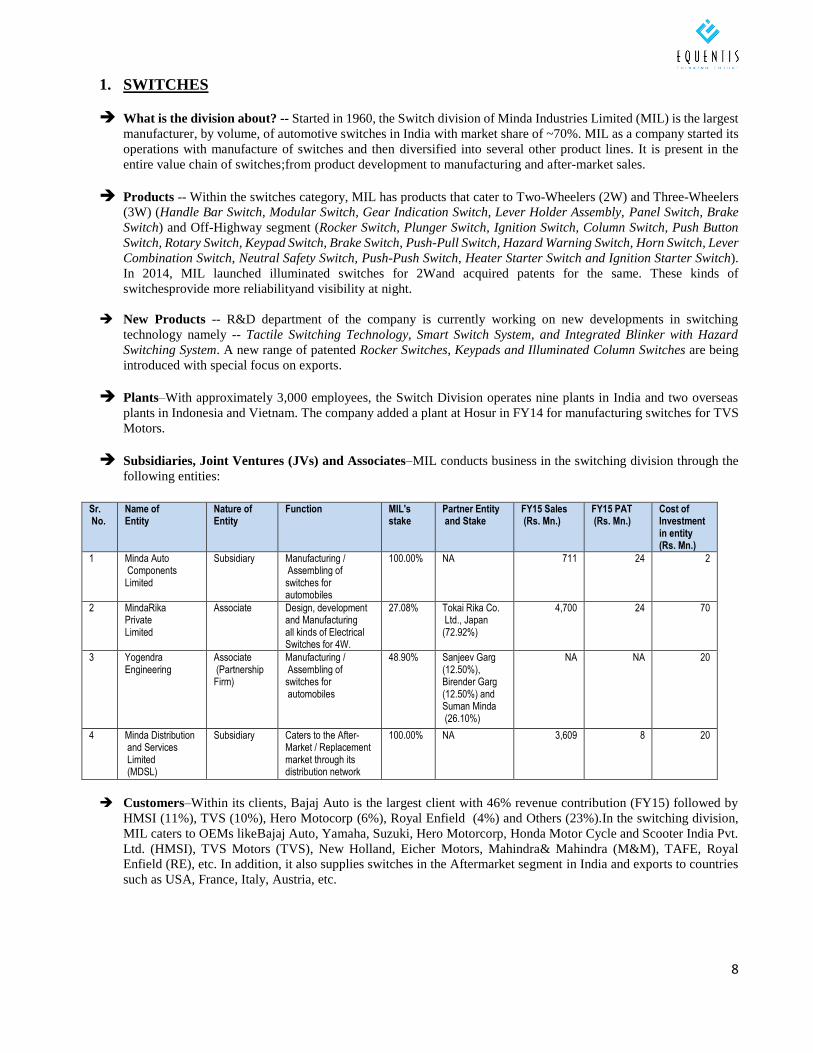
1. SWITCHES
What is the division about? -- Started in 1960, the Switch division of Minda Industries Limited (MIL) is the largest
manufacturer, by volume, of automotive switches in India with market share of ~70%. MIL as a company started its
operations with manufacture of switches and then diversified into several other product lines. It is present in the
entire value chain of switches;from product development to manufacturing and after-market sales.
Products -- Within the switches category, MIL has products that cater to Two-Wheelers (2W) and Three-Wheelers
(3W) (Handle Bar Switch, Modular Switch, Gear Indication Switch, Lever Holder Assembly, Panel Switch, Brake
Switch) and Off-Highway segment (Rocker Switch, Plunger Switch, Ignition Switch, Column Switch, Push Button
Switch, Rotary Switch, Keypad Switch, Brake Switch, Push-Pull Switch, Hazard Warning Switch, Horn Switch, Lever
Combination Switch, Neutral Safety Switch, Push-Push Switch, Heater Starter Switch and Ignition Starter Switch).
In 2014, MIL launched illuminated switches for 2Wand acquired patents for the same. These kinds of
switchesprovide more reliabilityand visibility at night.
New Products -- R&D department of the company is currently working on new developments in switching
technology namely -- Tactile Switching Technology, Smart Switch System, and Integrated Blinker with Hazard
Switching System. A new range of patented Rocker Switches, Keypads and Illuminated Column Switches are being
introduced with special focus on exports.
Plants–With approximately 3,000 employees, the Switch Division operates nine plants in India and two overseas
plants in Indonesia and Vietnam. The company added a plant at Hosur in FY14 for manufacturing switches for TVS
Motors.
Subsidiaries, Joint Ventures (JVs) and Associates–MIL conducts business in the switching division through the
following entities:
Sr. No.
Name of Entity
Nature of Entity
Function MIL's stake
Partner Entity and Stake
FY15 Sales (Rs. Mn.)
FY15 PAT (Rs. Mn.)
Cost of Investment in entity (Rs. Mn.)
1 Minda Auto Components Limited
Subsidiary Manufacturing / Assembling of switches for automobiles
100.00% NA 711 24 2
2 MindaRika Private Limited
Associate Design, development and Manufacturing all kinds of Electrical Switches for 4W.
27.08% Tokai Rika Co. Ltd., Japan (72.92%)
4,700 24 70
3 Yogendra Engineering
Associate (Partnership Firm)
Manufacturing / Assembling of switches for automobiles
48.90% Sanjeev Garg (12.50%), Birender Garg (12.50%) and Suman Minda (26.10%)
NA NA 20
4 Minda Distribution and Services Limited (MDSL)
Subsidiary Caters to the After-Market / Replacement market through its distribution network
100.00% NA 3,609 8 20
Customers–Within its clients, Bajaj Auto is the largest client with 46% revenue contribution (FY15) followed by
HMSI (11%), TVS (10%), Hero Motocorp (6%), Royal Enfield (4%) and Others (23%).In the switching division,
MIL caters to OEMs likeBajaj Auto, Yamaha, Suzuki, Hero Motorcorp, Honda Motor Cycle and Scooter India Pvt.
Ltd. (HMSI), TVS Motors (TVS), New Holland, Eicher Motors, Mahindra& Mahindra (M&M), TAFE, Royal
Enfield (RE), etc. In addition, it also supplies switches in the Aftermarket segment in India and exports to countries
such as USA, France, Italy, Austria, etc.
9
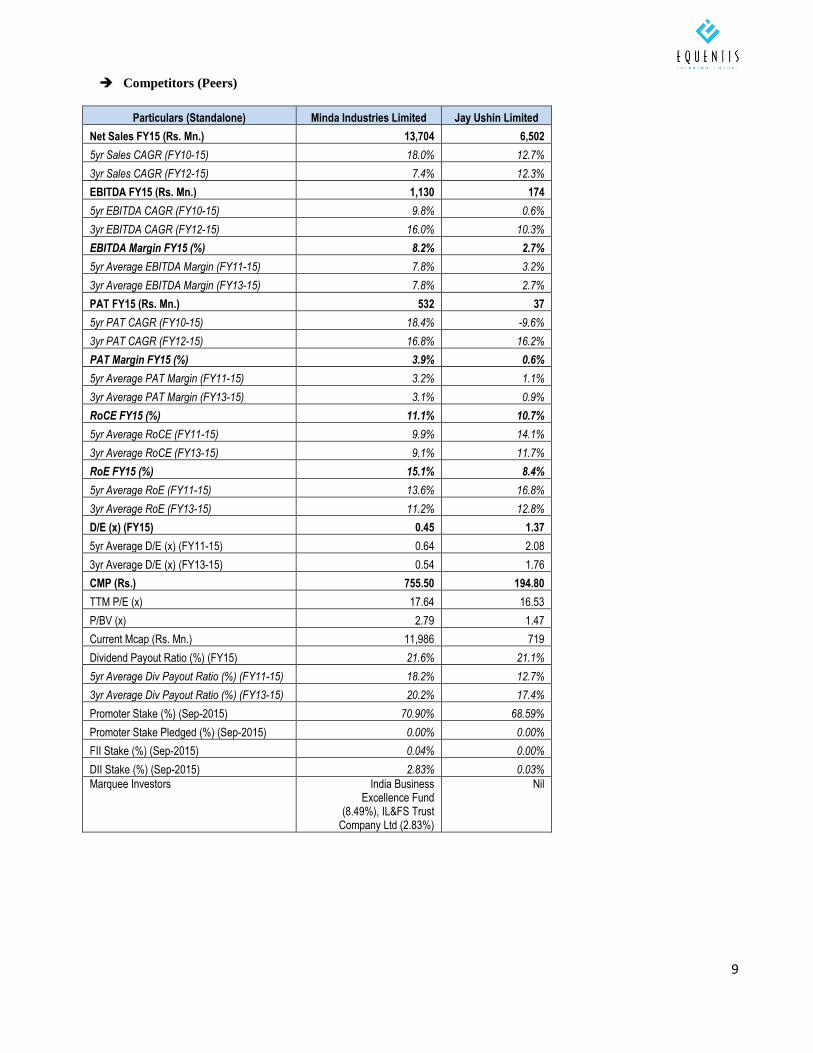
Competitors (Peers)
Particulars (Standalone) Minda Industries Limited Jay Ushin Limited
Net Sales FY15 (Rs. Mn.) 13,704 6,502
5yr Sales CAGR (FY10-15) 18.0% 12.7%
3yr Sales CAGR (FY12-15) 7.4% 12.3%
EBITDA FY15 (Rs. Mn.) 1,130 174
5yr EBITDA CAGR (FY10-15) 9.8% 0.6%
3yr EBITDA CAGR (FY12-15) 16.0% 10.3%
EBITDA Margin FY15 (%) 8.2% 2.7%
5yr Average EBITDA Margin (FY11-15) 7.8% 3.2%
3yr Average EBITDA Margin (FY13-15) 7.8% 2.7%
PAT FY15 (Rs. Mn.) 532 37
5yr PAT CAGR (FY10-15) 18.4% -9.6%
3yr PAT CAGR (FY12-15) 16.8% 16.2%
PAT Margin FY15 (%) 3.9% 0.6%
5yr Average PAT Margin (FY11-15) 3.2% 1.1%
3yr Average PAT Margin (FY13-15) 3.1% 0.9%
RoCE FY15 (%) 11.1% 10.7%
5yr Average RoCE (FY11-15) 9.9% 14.1%
3yr Average RoCE (FY13-15) 9.1% 11.7%
RoE FY15 (%) 15.1% 8.4%
5yr Average RoE (FY11-15) 13.6% 16.8%
3yr Average RoE (FY13-15) 11.2% 12.8%
D/E (x) (FY15) 0.45 1.37
5yr Average D/E (x) (FY11-15) 0.64 2.08
3yr Average D/E (x) (FY13-15) 0.54 1.76
CMP (Rs.) 755.50 194.80
TTM P/E (x) 17.64 16.53
P/BV (x) 2.79 1.47
Current Mcap (Rs. Mn.) 11,986 719
Dividend Payout Ratio (%) (FY15) 21.6% 21.1%
5yr Average Div Payout Ratio (%) (FY11-15) 18.2% 12.7%
3yr Average Div Payout Ratio (%) (FY13-15) 20.2% 17.4%
Promoter Stake (%) (Sep-2015) 70.90% 68.59%
Promoter Stake Pledged (%) (Sep-2015) 0.00% 0.00%
FII Stake (%) (Sep-2015) 0.04% 0.00%
DII Stake (%) (Sep-2015) 2.83% 0.03%
Marquee Investors India Business Excellence Fund
(8.49%), IL&FS Trust Company Ltd (2.83%)
Nil
10
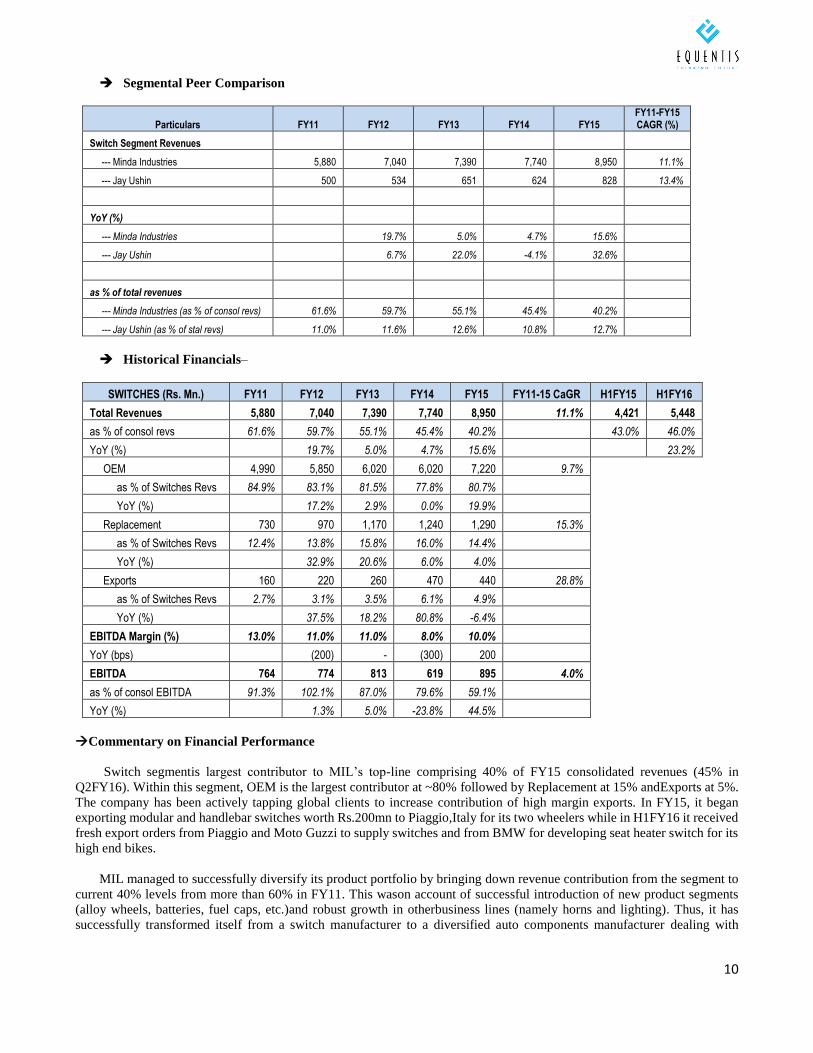
Segmental Peer Comparison
Particulars FY11 FY12 FY13 FY14 FY15 FY11-FY15 CAGR (%)
Switch Segment Revenues
--- Minda Industries 5,880 7,040 7,390 7,740 8,950 11.1%
--- Jay Ushin 500 534 651 624 828 13.4%
YoY (%)
--- Minda Industries 19.7% 5.0% 4.7% 15.6%
--- Jay Ushin 6.7% 22.0% -4.1% 32.6%
as % of total revenues
--- Minda Industries (as % of consol revs) 61.6% 59.7% 55.1% 45.4% 40.2%
--- Jay Ushin (as % of stal revs) 11.0% 11.6% 12.6% 10.8% 12.7%
Historical Financials–
SWITCHES (Rs. Mn.) FY11 FY12 FY13 FY14 FY15 FY11-15 CaGR H1FY15 H1FY16
Total Revenues 5,880 7,040 7,390 7,740 8,950 11.1% 4,421 5,448
as % of consol revs 61.6% 59.7% 55.1% 45.4% 40.2% 43.0% 46.0%
YoY (%) 19.7% 5.0% 4.7% 15.6% 23.2%
OEM 4,990 5,850 6,020 6,020 7,220 9.7%
as % of Switches Revs 84.9% 83.1% 81.5% 77.8% 80.7%
YoY (%) 17.2% 2.9% 0.0% 19.9%
Replacement 730 970 1,170 1,240 1,290 15.3%
as % of Switches Revs 12.4% 13.8% 15.8% 16.0% 14.4%
YoY (%) 32.9% 20.6% 6.0% 4.0%
Exports 160 220 260 470 440 28.8%
as % of Switches Revs 2.7% 3.1% 3.5% 6.1% 4.9%
YoY (%) 37.5% 18.2% 80.8% -6.4%
EBITDA Margin (%) 13.0% 11.0% 11.0% 8.0% 10.0%
YoY (bps) (200) - (300) 200
EBITDA 764 774 813 619 895 4.0%
as % of consol EBITDA 91.3% 102.1% 87.0% 79.6% 59.1%
YoY (%) 1.3% 5.0% -23.8% 44.5%
Commentary on Financial Performance
Switch segmentis largest contributor to MIL’s top-line comprising 40% of FY15 consolidated revenues (45% in
Q2FY16). Within this segment, OEM is the largest contributor at ~80% followed by Replacement at 15% andExports at 5%.
The company has been actively tapping global clients to increase contribution of high margin exports. In FY15, it began
exporting modular and handlebar switches worth Rs.200mn to Piaggio,Italy for its two wheelers while in H1FY16 it received
fresh export orders from Piaggio and Moto Guzzi to supply switches and from BMW for developing seat heater switch for its
high end bikes.
MIL managed to successfully diversify its product portfolio by bringing down revenue contribution from the segment to
current 40% levels from more than 60% in FY11. This wason account of successful introduction of new product segments
(alloy wheels, batteries, fuel caps, etc.)and robust growth in otherbusiness lines (namely horns and lighting). Thus, it has
successfully transformed itself from a switch manufacturer to a diversified auto components manufacturer dealing with
11
multiple products. Over the years, revenues from this division have grown at 11% CAGR (FY11 – FY15) through introduction
of new types of switches and addition of new clients in India and abroad.
The switch segment is also the largest contributor to EBITDA at ~60% of consolidated EBITDA (FY15). EBITDA for
the segmenthas grown at 4% CAGR over FY11 – FY15 while EBITDAmargins have remained in the range of 10%- 11%.
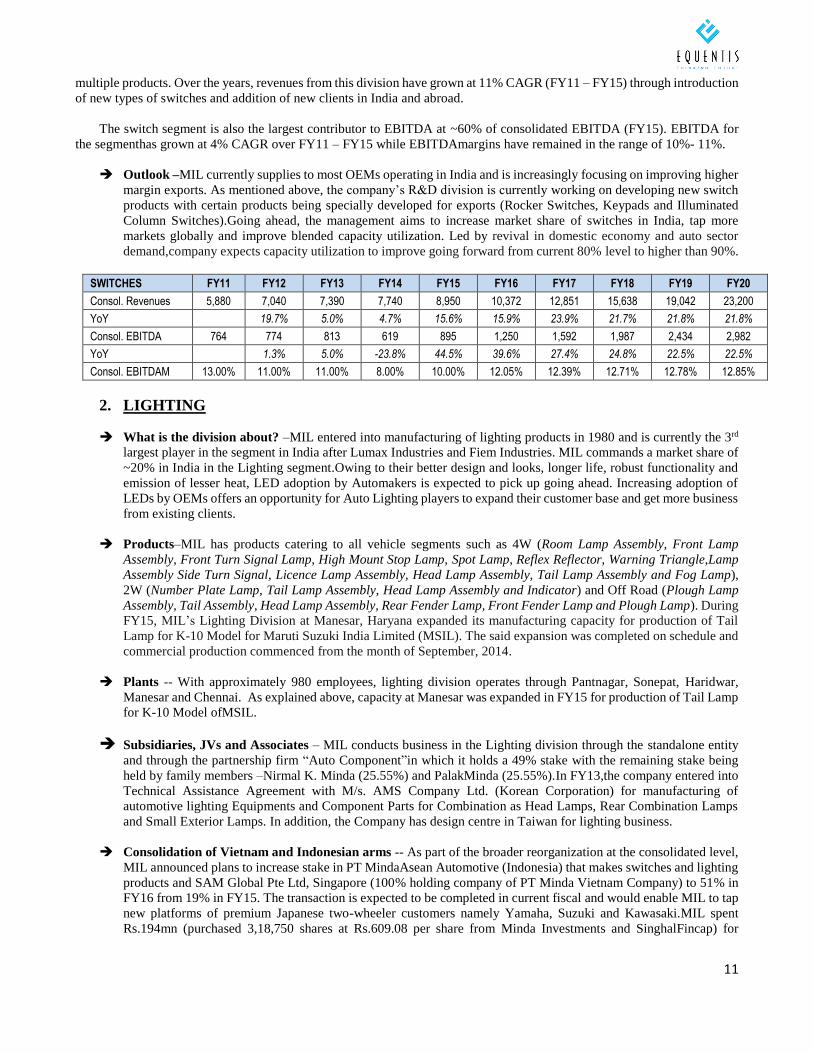
Outlook –MIL currently supplies to most OEMs operating in India and is increasingly focusing on improving higher
margin exports. As mentioned above, the company’s R&D division is currently working on developing new switch
products with certain products being specially developed for exports (Rocker Switches, Keypads and Illuminated
Column Switches).Going ahead, the management aims to increase market share of switches in India, tap more
markets globally and improve blended capacity utilization. Led by revival in domestic economy and auto sector
demand,company expects capacity utilization to improve going forward from current 80% level to higher than 90%.
SWITCHES FY11 FY12 FY13 FY14 FY15 FY16 FY17 FY18 FY19 FY20
Consol. Revenues 5,880 7,040 7,390 7,740 8,950 10,372 12,851 15,638 19,042 23,200
YoY 19.7% 5.0% 4.7% 15.6% 15.9% 23.9% 21.7% 21.8% 21.8%
Consol. EBITDA 764 774 813 619 895 1,250 1,592 1,987 2,434 2,982
YoY 1.3% 5.0% -23.8% 44.5% 39.6% 27.4% 24.8% 22.5% 22.5%
Consol. EBITDAM 13.00% 11.00% 11.00% 8.00% 10.00% 12.05% 12.39% 12.71% 12.78% 12.85%
2. LIGHTING
What is the division about? –MIL entered into manufacturing of lighting products in 1980 and is currently the 3rd
largest player in the segment in India after Lumax Industries and Fiem Industries. MIL commands a market share of
~20% in India in the Lighting segment.Owing to their better design and looks, longer life, robust functionality and
emission of lesser heat, LED adoption by Automakers is expected to pick up going ahead. Increasing adoption of
LEDs by OEMs offers an opportunity for Auto Lighting players to expand their customer base and get more business
from existing clients.
Products–MIL has products catering to all vehicle segments such as 4W (Room Lamp Assembly, Front Lamp
Assembly, Front Turn Signal Lamp, High Mount Stop Lamp, Spot Lamp, Reflex Reflector, Warning Triangle,Lamp
Assembly Side Turn Signal, Licence Lamp Assembly, Head Lamp Assembly, Tail Lamp Assembly and Fog Lamp),
2W (Number Plate Lamp, Tail Lamp Assembly, Head Lamp Assembly and Indicator) and Off Road (Plough Lamp
Assembly, Tail Assembly, Head Lamp Assembly, Rear Fender Lamp, Front Fender Lamp and Plough Lamp). During
FY15, MIL’s Lighting Division at Manesar, Haryana expanded its manufacturing capacity for production of Tail
Lamp for K-10 Model for Maruti Suzuki India Limited (MSIL). The said expansion was completed on schedule and
commercial production commenced from the month of September, 2014.
Plants -- With approximately 980 employees, lighting division operates through Pantnagar, Sonepat, Haridwar,
Manesar and Chennai. As explained above, capacity at Manesar was expanded in FY15 for production of Tail Lamp
for K-10 Model ofMSIL.
Subsidiaries, JVs and Associates – MIL conducts business in the Lighting division through the standalone entity
and through the partnership firm “Auto Component”in which it holds a 49% stake with the remaining stake being
held by family members –Nirmal K. Minda (25.55%) and PalakMinda (25.55%).In FY13,the company entered into
Technical Assistance Agreement with M/s. AMS Company Ltd. (Korean Corporation) for manufacturing of
automotive lighting Equipments and Component Parts for Combination as Head Lamps, Rear Combination Lamps
and Small Exterior Lamps. In addition, the Company has design centre in Taiwan for lighting business.
Consolidation of Vietnam and Indonesian arms -- As part of the broader reorganization at the consolidated level,
MIL announced plans to increase stake in PT MindaAsean Automotive (Indonesia) that makes switches and lighting
products and SAM Global Pte Ltd, Singapore (100% holding company of PT Minda Vietnam Company) to 51% in
FY16 from 19% in FY15. The transaction is expected to be completed in current fiscal and would enable MIL to tap
new platforms of premium Japanese two-wheeler customers namely Yamaha, Suzuki and Kawasaki.MIL spent
Rs.194mn (purchased 3,18,750 shares at Rs.609.08 per share from Minda Investments and SinghalFincap) for
12
acquisition of stake in Sam Global Pte Ltd and Rs.61mn (purchased 13,845 shares at Rs.4432.40 per share from
Minda Investments) for acquisition of stake in PT MindaAsean Automotive, Indonesia.
Customers -- Within its clients, MSIL is the largest client with 37% revenue contribution, followed by VW (9%),
M&M (12%), HMSI (6%), Royal Enfield (5%) and others (31%). In the lighting division, MIL caters to OEMs such
asYamaha, Suzuki, Swaraj Mazda, New Holland, Eicher, Mahindra, Tafe, Royal Enfield, Maruti, General Motors,
Fiat, Volkswagen, Toyota, Tata, Ford etc. International customer base includes Daihatsu, Mbk, Suzuki, Piaggio,
Kawasaki, Torica, Volkwagen etc.MIL supplies switches in the Aftermarket segment in India and exports to
countries such as Italy, Indonesia, France, Japan, etc.
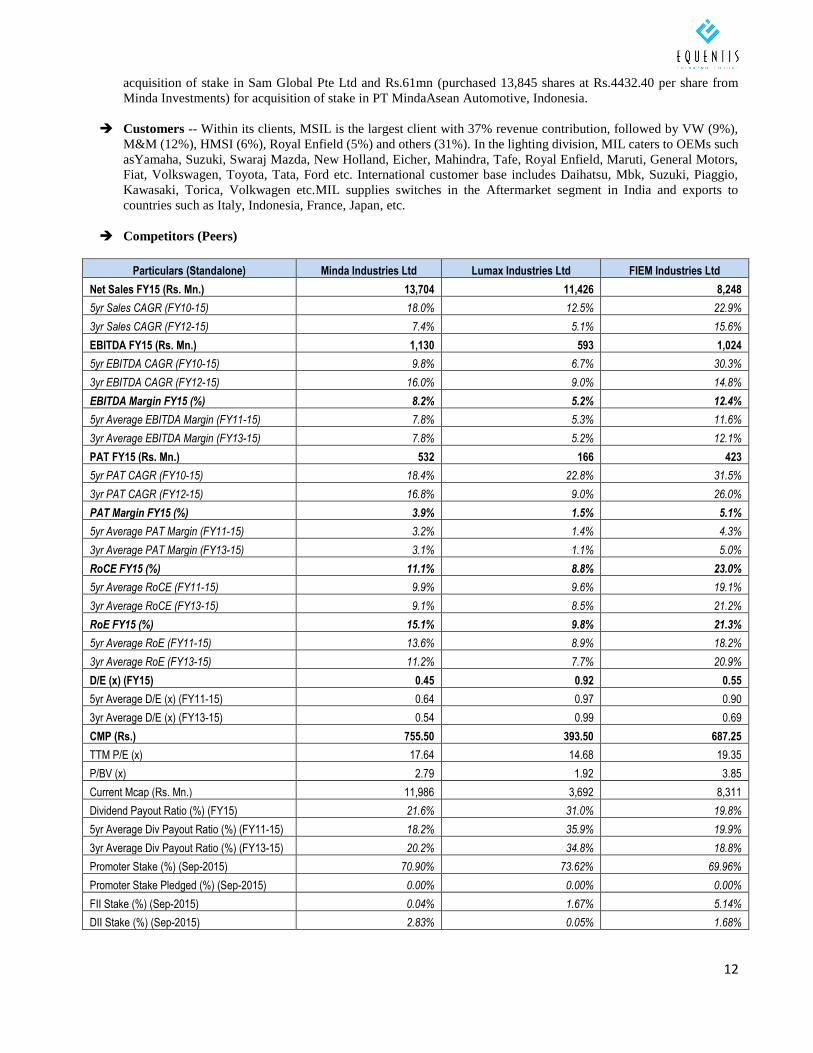
Competitors (Peers)
Particulars (Standalone) Minda Industries Ltd Lumax Industries Ltd FIEM Industries Ltd
Net Sales FY15 (Rs. Mn.) 13,704 11,426 8,248
5yr Sales CAGR (FY10-15) 18.0% 12.5% 22.9%
3yr Sales CAGR (FY12-15) 7.4% 5.1% 15.6%
EBITDA FY15 (Rs. Mn.) 1,130 593 1,024
5yr EBITDA CAGR (FY10-15) 9.8% 6.7% 30.3%
3yr EBITDA CAGR (FY12-15) 16.0% 9.0% 14.8%
EBITDA Margin FY15 (%) 8.2% 5.2% 12.4%
5yr Average EBITDA Margin (FY11-15) 7.8% 5.3% 11.6%
3yr Average EBITDA Margin (FY13-15) 7.8% 5.2% 12.1%
PAT FY15 (Rs. Mn.) 532 166 423
5yr PAT CAGR (FY10-15) 18.4% 22.8% 31.5%
3yr PAT CAGR (FY12-15) 16.8% 9.0% 26.0%
PAT Margin FY15 (%) 3.9% 1.5% 5.1%
5yr Average PAT Margin (FY11-15) 3.2% 1.4% 4.3%
3yr Average PAT Margin (FY13-15) 3.1% 1.1% 5.0%
RoCE FY15 (%) 11.1% 8.8% 23.0%
5yr Average RoCE (FY11-15) 9.9% 9.6% 19.1%
3yr Average RoCE (FY13-15) 9.1% 8.5% 21.2%
RoE FY15 (%) 15.1% 9.8% 21.3%
5yr Average RoE (FY11-15) 13.6% 8.9% 18.2%
3yr Average RoE (FY13-15) 11.2% 7.7% 20.9%
D/E (x) (FY15) 0.45 0.92 0.55
5yr Average D/E (x) (FY11-15) 0.64 0.97 0.90
3yr Average D/E (x) (FY13-15) 0.54 0.99 0.69
CMP (Rs.) 755.50 393.50 687.25
TTM P/E (x) 17.64 14.68 19.35
P/BV (x) 2.79 1.92 3.85
Current Mcap (Rs. Mn.) 11,986 3,692 8,311
Dividend Payout Ratio (%) (FY15) 21.6% 31.0% 19.8%
5yr Average Div Payout Ratio (%) (FY11-15) 18.2% 35.9% 19.9%
3yr Average Div Payout Ratio (%) (FY13-15) 20.2% 34.8% 18.8%
Promoter Stake (%) (Sep-2015) 70.90% 73.62% 69.96%
Promoter Stake Pledged (%) (Sep-2015) 0.00% 0.00% 0.00%
FII Stake (%) (Sep-2015) 0.04% 1.67% 5.14%
DII Stake (%) (Sep-2015) 2.83% 0.05% 1.68%
13
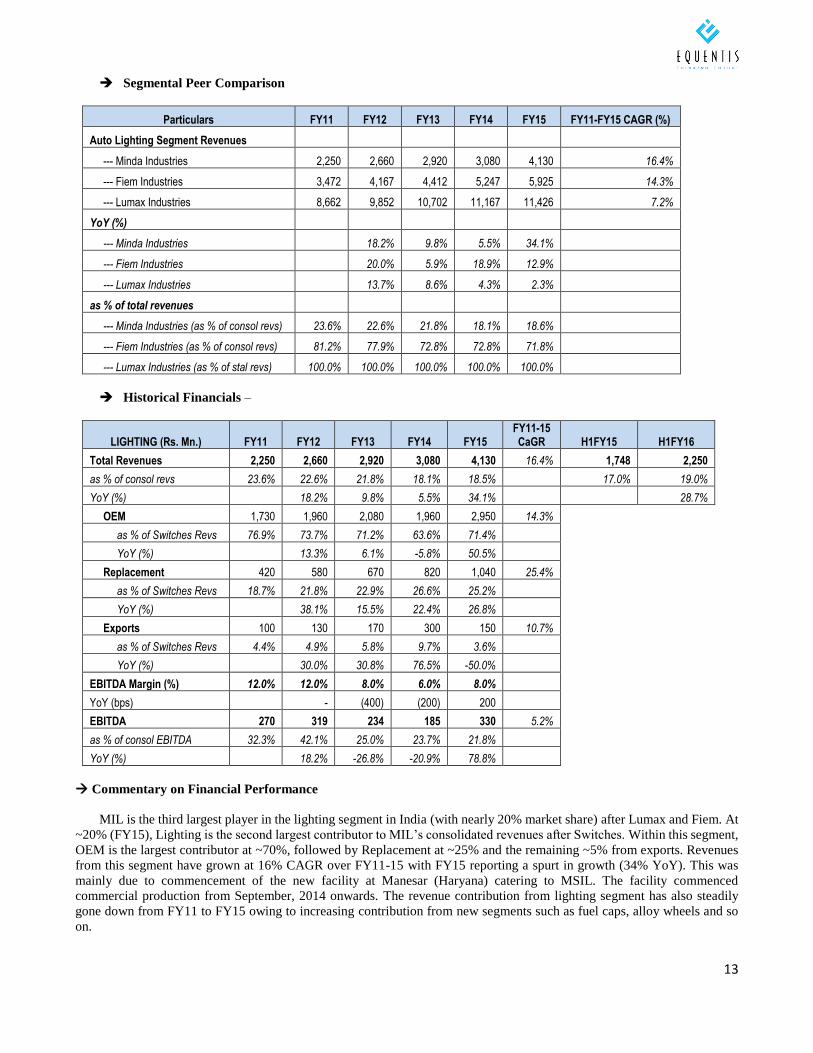
Segmental Peer Comparison
Particulars FY11 FY12 FY13 FY14 FY15 FY11-FY15 CAGR (%)
Auto Lighting Segment Revenues
--- Minda Industries 2,250 2,660 2,920 3,080 4,130 16.4%
--- Fiem Industries 3,472 4,167 4,412 5,247 5,925 14.3%
--- Lumax Industries 8,662 9,852 10,702 11,167 11,426 7.2%
YoY (%)
--- Minda Industries 18.2% 9.8% 5.5% 34.1%
--- Fiem Industries 20.0% 5.9% 18.9% 12.9%
--- Lumax Industries 13.7% 8.6% 4.3% 2.3%
as % of total revenues
--- Minda Industries (as % of consol revs) 23.6% 22.6% 21.8% 18.1% 18.6%
--- Fiem Industries (as % of consol revs) 81.2% 77.9% 72.8% 72.8% 71.8%
--- Lumax Industries (as % of stal revs) 100.0% 100.0% 100.0% 100.0% 100.0%
Historical Financials –
LIGHTING (Rs. Mn.) FY11 FY12 FY13 FY14 FY15 FY11-15 CaGR H1FY15 H1FY16
Total Revenues 2,250 2,660 2,920 3,080 4,130 16.4% 1,748 2,250
as % of consol revs 23.6% 22.6% 21.8% 18.1% 18.5% 17.0% 19.0%
YoY (%) 18.2% 9.8% 5.5% 34.1% 28.7%
OEM 1,730 1,960 2,080 1,960 2,950 14.3%
as % of Switches Revs 76.9% 73.7% 71.2% 63.6% 71.4%
YoY (%) 13.3% 6.1% -5.8% 50.5%
Replacement 420 580 670 820 1,040 25.4%
as % of Switches Revs 18.7% 21.8% 22.9% 26.6% 25.2%
YoY (%) 38.1% 15.5% 22.4% 26.8%
Exports 100 130 170 300 150 10.7%
as % of Switches Revs 4.4% 4.9% 5.8% 9.7% 3.6%
YoY (%) 30.0% 30.8% 76.5% -50.0%
EBITDA Margin (%) 12.0% 12.0% 8.0% 6.0% 8.0%
YoY (bps) - (400) (200) 200
EBITDA 270 319 234 185 330 5.2%
as % of consol EBITDA 32.3% 42.1% 25.0% 23.7% 21.8%
YoY (%) 18.2% -26.8% -20.9% 78.8%
Commentary on Financial Performance
MIL is the third largest player in the lighting segment in India (with nearly 20% market share) after Lumax and Fiem. At
~20% (FY15), Lighting is the second largest contributor to MIL’s consolidated revenues after Switches. Within this segment,
OEM is the largest contributor at ~70%, followed by Replacement at ~25% and the remaining ~5% from exports. Revenues
from this segment have grown at 16% CAGR over FY11-15 with FY15 reporting a spurt in growth (34% YoY). This was
mainly due to commencement of the new facility at Manesar (Haryana) catering to MSIL. The facility commenced
commercial production from September, 2014 onwards. The revenue contribution from lighting segment has also steadily
gone down from FY11 to FY15 owing to increasing contribution from new segments such as fuel caps, alloy wheels and so
on.
14
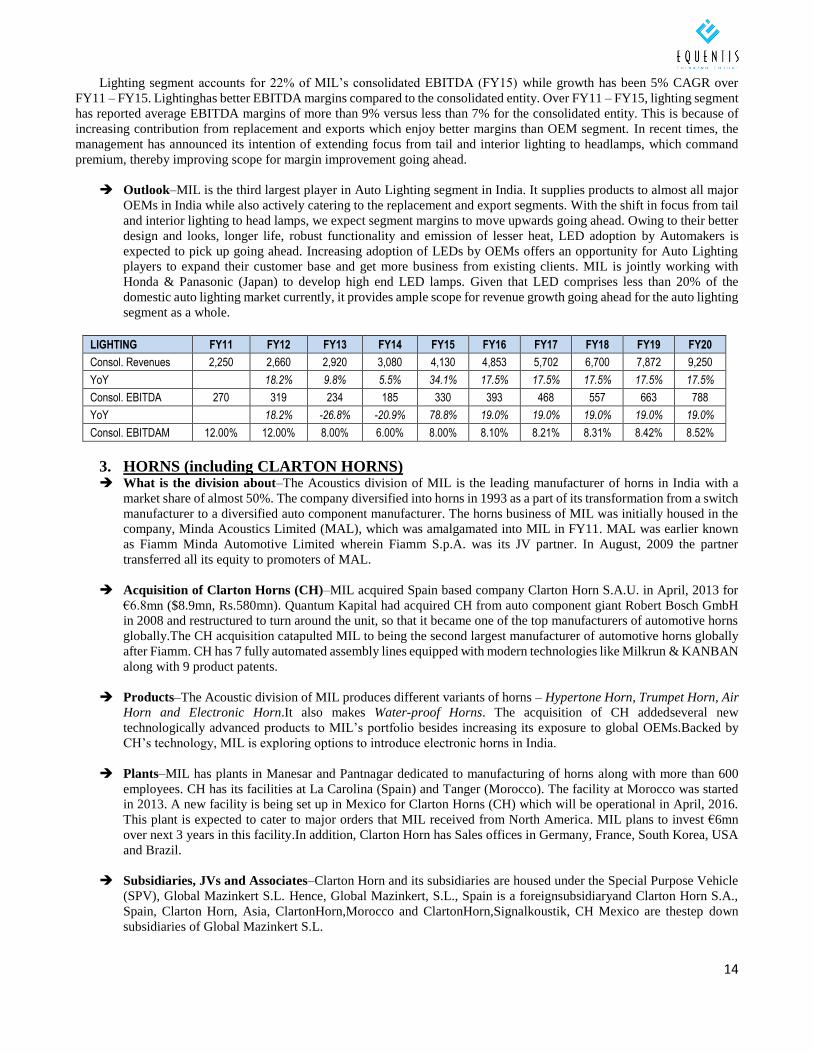
Lighting segment accounts for 22% of MIL’s consolidated EBITDA (FY15) while growth has been 5% CAGR over
FY11 – FY15. Lightinghas better EBITDA margins compared to the consolidated entity. Over FY11 – FY15, lighting segment
has reported average EBITDA margins of more than 9% versus less than 7% for the consolidated entity. This is because of
increasing contribution from replacement and exports which enjoy better margins than OEM segment. In recent times, the
management has announced its intention of extending focus from tail and interior lighting to headlamps, which command
premium, thereby improving scope for margin improvement going ahead.
Outlook–MIL is the third largest player in Auto Lighting segment in India. It supplies products to almost all major
OEMs in India while also actively catering to the replacement and export segments. With the shift in focus from tail
and interior lighting to head lamps, we expect segment margins to move upwards going ahead. Owing to their better
design and looks, longer life, robust functionality and emission of lesser heat, LED adoption by Automakers is
expected to pick up going ahead. Increasing adoption of LEDs by OEMs offers an opportunity for Auto Lighting
players to expand their customer base and get more business from existing clients. MIL is jointly working with
Honda & Panasonic (Japan) to develop high end LED lamps. Given that LED comprises less than 20% of the
domestic auto lighting market currently, it provides ample scope for revenue growth going ahead for the auto lighting
segment as a whole.
LIGHTING FY11 FY12 FY13 FY14 FY15 FY16 FY17 FY18 FY19 FY20
Consol. Revenues 2,250 2,660 2,920 3,080 4,130 4,853 5,702 6,700 7,872 9,250
YoY 18.2% 9.8% 5.5% 34.1% 17.5% 17.5% 17.5% 17.5% 17.5%
Consol. EBITDA 270 319 234 185 330 393 468 557 663 788
YoY 18.2% -26.8% -20.9% 78.8% 19.0% 19.0% 19.0% 19.0% 19.0%
Consol. EBITDAM 12.00% 12.00% 8.00% 6.00% 8.00% 8.10% 8.21% 8.31% 8.42% 8.52%
3. HORNS (including CLARTON HORNS) What is the division about–The Acoustics division of MIL is the leading manufacturer of horns in India with a
market share of almost 50%. The company diversified into horns in 1993 as a part of its transformation from a switch
manufacturer to a diversified auto component manufacturer. The horns business of MIL was initially housed in the
company, Minda Acoustics Limited (MAL), which was amalgamated into MIL in FY11. MAL was earlier known
as Fiamm Minda Automotive Limited wherein Fiamm S.p.A. was its JV partner. In August, 2009 the partner
transferred all its equity to promoters of MAL.
Acquisition of Clarton Horns (CH)–MIL acquired Spain based company Clarton Horn S.A.U. in April, 2013 for
€6.8mn ($8.9mn, Rs.580mn). Quantum Kapital had acquired CH from auto component giant Robert Bosch GmbH
in 2008 and restructured to turn around the unit, so that it became one of the top manufacturers of automotive horns
globally.The CH acquisition catapulted MIL to being the second largest manufacturer of automotive horns globally
after Fiamm. CH has 7 fully automated assembly lines equipped with modern technologies like Milkrun & KANBAN
along with 9 product patents.
Products–The Acoustic division of MIL produces different variants of horns – Hypertone Horn, Trumpet Horn, Air
Horn and Electronic Horn.It also makes Water-proof Horns. The acquisition of CH addedseveral new
technologically advanced products to MIL’s portfolio besides increasing its exposure to global OEMs.Backed by
CH’s technology, MIL is exploring options to introduce electronic horns in India.
Plants–MIL has plants in Manesar and Pantnagar dedicated to manufacturing of horns along with more than 600
employees. CH has its facilities at La Carolina (Spain) and Tanger (Morocco). The facility at Morocco was started
in 2013. A new facility is being set up in Mexico for Clarton Horns (CH) which will be operational in April, 2016.
This plant is expected to cater to major orders that MIL received from North America. MIL plans to invest €6mn
over next 3 years in this facility.In addition, Clarton Horn has Sales offices in Germany, France, South Korea, USA
and Brazil.
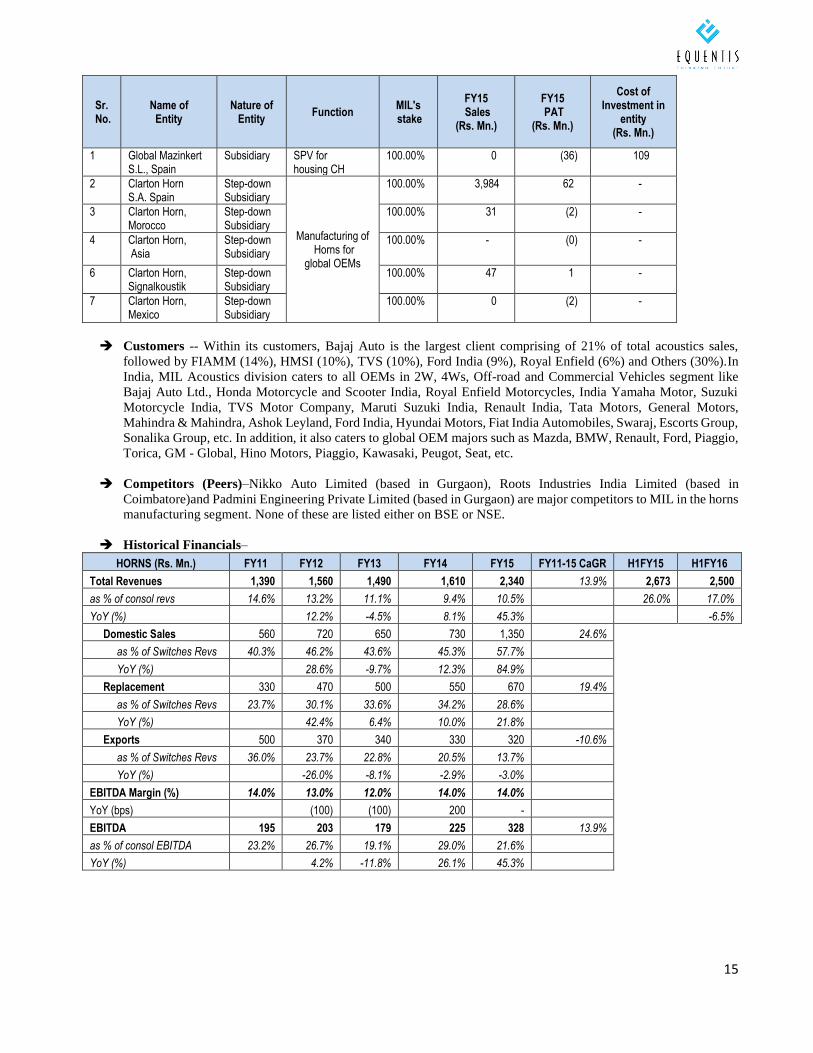
Subsidiaries, JVs and Associates–Clarton Horn and its subsidiaries are housed under the Special Purpose Vehicle
(SPV), Global Mazinkert S.L. Hence, Global Mazinkert, S.L., Spain is a foreignsubsidiaryand Clarton Horn S.A.,
Spain, Clarton Horn, Asia, ClartonHorn,Morocco and ClartonHorn,Signalkoustik, CH Mexico are thestep down
subsidiaries of Global Mazinkert S.L.
15
Sr. No.
Name of Entity
Nature of Entity
Function MIL's stake
FY15 Sales
(Rs. Mn.)
FY15 PAT
(Rs. Mn.)
Cost of Investment in
entity (Rs. Mn.)
1 Global Mazinkert S.L., Spain
Subsidiary SPV for housing CH
100.00% 0 (36) 109
2 Clarton Horn S.A. Spain
Step-down Subsidiary
Manufacturing of Horns for
global OEMs
100.00% 3,984 62 -
3 Clarton Horn, Morocco
Step-down Subsidiary
100.00% 31 (2) -
4 Clarton Horn, Asia
Step-down Subsidiary
100.00% - (0) -
6 Clarton Horn, Signalkoustik
Step-down Subsidiary
100.00% 47 1 -
7 Clarton Horn, Mexico
Step-down Subsidiary
100.00% 0 (2) -
Customers -- Within its customers, Bajaj Auto is the largest client comprising of 21% of total acoustics sales,
followed by FIAMM (14%), HMSI (10%), TVS (10%), Ford India (9%), Royal Enfield (6%) and Others (30%).In
India, MIL Acoustics division caters to all OEMs in 2W, 4Ws, Off-road and Commercial Vehicles segment like
Bajaj Auto Ltd., Honda Motorcycle and Scooter India, Royal Enfield Motorcycles, India Yamaha Motor, Suzuki
Motorcycle India, TVS Motor Company, Maruti Suzuki India, Renault India, Tata Motors, General Motors,
Mahindra & Mahindra, Ashok Leyland, Ford India, Hyundai Motors, Fiat India Automobiles, Swaraj, Escorts Group,
Sonalika Group, etc. In addition, it also caters to global OEM majors such as Mazda, BMW, Renault, Ford, Piaggio,
Torica, GM - Global, Hino Motors, Piaggio, Kawasaki, Peugot, Seat, etc.
Competitors (Peers)–Nikko Auto Limited (based in Gurgaon), Roots Industries India Limited (based in
Coimbatore)and Padmini Engineering Private Limited (based in Gurgaon) are major competitors to MIL in the horns
manufacturing segment. None of these are listed either on BSE or NSE.
Historical Financials–
HORNS (Rs. Mn.) FY11 FY12 FY13 FY14 FY15 FY11-15 CaGR H1FY15 H1FY16
Total Revenues 1,390 1,560 1,490 1,610 2,340 13.9% 2,673 2,500
as % of consol revs 14.6% 13.2% 11.1% 9.4% 10.5% 26.0% 17.0%
YoY (%) 12.2% -4.5% 8.1% 45.3% -6.5%
Domestic Sales 560 720 650 730 1,350 24.6%
as % of Switches Revs 40.3% 46.2% 43.6% 45.3% 57.7%
YoY (%) 28.6% -9.7% 12.3% 84.9%
Replacement 330 470 500 550 670 19.4%
as % of Switches Revs 23.7% 30.1% 33.6% 34.2% 28.6%
YoY (%) 42.4% 6.4% 10.0% 21.8%
Exports 500 370 340 330 320 -10.6%
as % of Switches Revs 36.0% 23.7% 22.8% 20.5% 13.7%
YoY (%) -26.0% -8.1% -2.9% -3.0%
EBITDA Margin (%) 14.0% 13.0% 12.0% 14.0% 14.0%
YoY (bps) (100) (100) 200 -
EBITDA 195 203 179 225 328 13.9%
as % of consol EBITDA 23.2% 26.7% 19.1% 29.0% 21.6%
YoY (%) 4.2% -11.8% 26.1% 45.3%
16
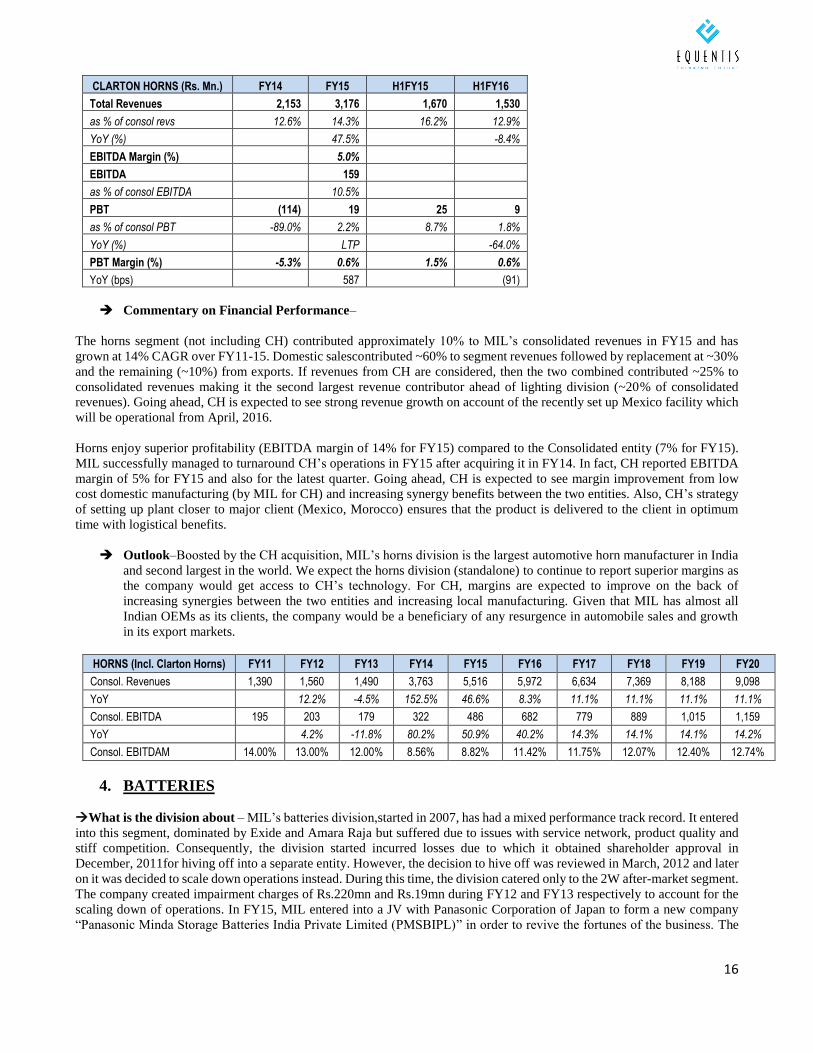
CLARTON HORNS (Rs. Mn.) FY14 FY15 H1FY15 H1FY16
Total Revenues 2,153 3,176 1,670 1,530
as % of consol revs 12.6% 14.3% 16.2% 12.9%
YoY (%) 47.5% -8.4%
EBITDA Margin (%) 5.0%
EBITDA 159
as % of consol EBITDA 10.5%
PBT (114) 19 25 9
as % of consol PBT -89.0% 2.2% 8.7% 1.8%
YoY (%) LTP -64.0%
PBT Margin (%) -5.3% 0.6% 1.5% 0.6%
YoY (bps) 587 (91)
Commentary on Financial Performance–
The horns segment (not including CH) contributed approximately 10% to MIL’s consolidated revenues in FY15 and has
grown at 14% CAGR over FY11-15. Domestic salescontributed ~60% to segment revenues followed by replacement at ~30%
and the remaining (~10%) from exports. If revenues from CH are considered, then the two combined contributed ~25% to
consolidated revenues making it the second largest revenue contributor ahead of lighting division (~20% of consolidated
revenues). Going ahead, CH is expected to see strong revenue growth on account of the recently set up Mexico facility which
will be operational from April, 2016.
Horns enjoy superior profitability (EBITDA margin of 14% for FY15) compared to the Consolidated entity (7% for FY15).
MIL successfully managed to turnaround CH’s operations in FY15 after acquiring it in FY14. In fact, CH reported EBITDA
margin of 5% for FY15 and also for the latest quarter. Going ahead, CH is expected to see margin improvement from low
cost domestic manufacturing (by MIL for CH) and increasing synergy benefits between the two entities. Also, CH’s strategy
of setting up plant closer to major client (Mexico, Morocco) ensures that the product is delivered to the client in optimum
time with logistical benefits.
Outlook–Boosted by the CH acquisition, MIL’s horns division is the largest automotive horn manufacturer in India
and second largest in the world. We expect the horns division (standalone) to continue to report superior margins as
the company would get access to CH’s technology. For CH, margins are expected to improve on the back of
increasing synergies between the two entities and increasing local manufacturing. Given that MIL has almost all
Indian OEMs as its clients, the company would be a beneficiary of any resurgence in automobile sales and growth
in its export markets.
HORNS (Incl. Clarton Horns) FY11 FY12 FY13 FY14 FY15 FY16 FY17 FY18 FY19 FY20
Consol. Revenues 1,390 1,560 1,490 3,763 5,516 5,972 6,634 7,369 8,188 9,098
YoY 12.2% -4.5% 152.5% 46.6% 8.3% 11.1% 11.1% 11.1% 11.1%
Consol. EBITDA 195 203 179 322 486 682 779 889 1,015 1,159
YoY 4.2% -11.8% 80.2% 50.9% 40.2% 14.3% 14.1% 14.1% 14.2%
Consol. EBITDAM 14.00% 13.00% 12.00% 8.56% 8.82% 11.42% 11.75% 12.07% 12.40% 12.74%
4. BATTERIES
What is the division about – MIL’s batteries division,started in 2007, has had a mixed performance track record. It entered
into this segment, dominated by Exide and Amara Raja but suffered due to issues with service network, product quality and
stiff competition. Consequently, the division started incurred losses due to which it obtained shareholder approval in
December, 2011for hiving off into a separate entity. However, the decision to hive off was reviewed in March, 2012 and later
on it was decided to scale down operations instead. During this time, the division catered only to the 2W after-market segment.
The company created impairment charges of Rs.220mn and Rs.19mn during FY12 and FY13 respectively to account for the
scaling down of operations. In FY15, MIL entered into a JV with Panasonic Corporation of Japan to form a new company
“Panasonic Minda Storage Batteries India Private Limited (PMSBIPL)” in order to revive the fortunes of the business. The
17
JV, which began production in Q1FY16, currently manufactures batteries only for 2Ws and plans to catering to the 4W
segment going ahead.
Products–The batteries division manufactures all types of batteries for two wheelers ranging from Valve Regulated Lead
Acid (VRLA) Battery to Flooded Batteries. The warrantees on batteries range from 15 to 36 months, depending upon the
model and the type. The company has over 650 distributors and the distribution is done through its arm Minda Distribution
and Services Limited (MDSL). The batteries are available under the brands ‘ULTIMO’ and ‘POWERPLUS’ and are available
in three sizes – 2.5Ah, 5.0Ah and 9.0Ah.
New Products–Through the JV, MIL plans to increase coverage from 2W segment to 4Ws and industrial segment as well.
It also plans to increase capacity to 4mn units by 2018 from current 3mn units.
Plants–MIL has a battery manufacturing plant at Pantnagar which will be used by the JV (PMSBIPL) going ahead.
Management targets to increase capacity to 4mn units by 2018 from 3mn units currently. Current capacity utilization stands
at 30% which provides ample scope for future scale up.
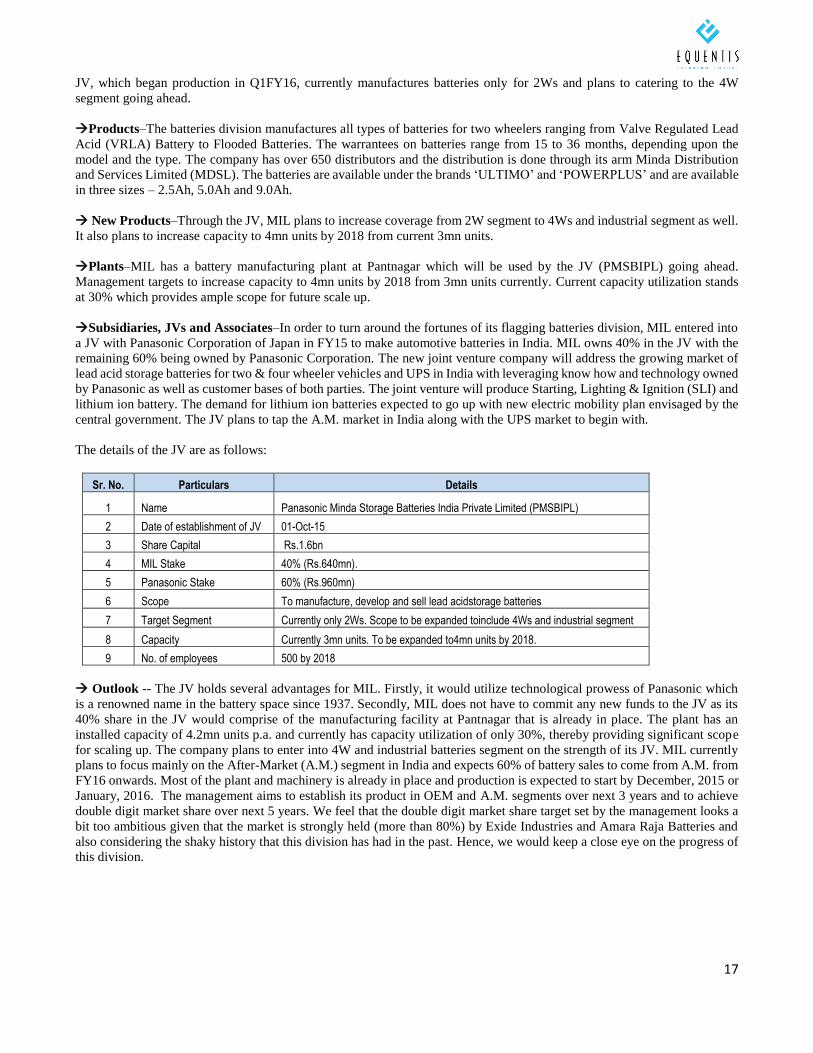
Subsidiaries, JVs and Associates–In order to turn around the fortunes of its flagging batteries division, MIL entered into
a JV with Panasonic Corporation of Japan in FY15 to make automotive batteries in India. MIL owns 40% in the JV with the
remaining 60% being owned by Panasonic Corporation. The new joint venture company will address the growing market of
lead acid storage batteries for two & four wheeler vehicles and UPS in India with leveraging know how and technology owned
by Panasonic as well as customer bases of both parties. The joint venture will produce Starting, Lighting & Ignition (SLI) and
lithium ion battery. The demand for lithium ion batteries expected to go up with new electric mobility plan envisaged by the
central government. The JV plans to tap the A.M. market in India along with the UPS market to begin with.
The details of the JV are as follows:
Sr. No. Particulars Details
1 Name Panasonic Minda Storage Batteries India Private Limited (PMSBIPL)
2 Date of establishment of JV 01-Oct-15
3 Share Capital Rs.1.6bn
4 MIL Stake 40% (Rs.640mn).
5 Panasonic Stake 60% (Rs.960mn)
6 Scope To manufacture, develop and sell lead acidstorage batteries
7 Target Segment Currently only 2Ws. Scope to be expanded toinclude 4Ws and industrial segment
8 Capacity Currently 3mn units. To be expanded to4mn units by 2018.
9 No. of employees 500 by 2018
Outlook -- The JV holds several advantages for MIL. Firstly, it would utilize technological prowess of Panasonic which
is a renowned name in the battery space since 1937. Secondly, MIL does not have to commit any new funds to the JV as its
40% share in the JV would comprise of the manufacturing facility at Pantnagar that is already in place. The plant has an
installed capacity of 4.2mn units p.a. and currently has capacity utilization of only 30%, thereby providing significant scope
for scaling up. The company plans to enter into 4W and industrial batteries segment on the strength of its JV. MIL currently
plans to focus mainly on the After-Market (A.M.) segment in India and expects 60% of battery sales to come from A.M. from
FY16 onwards. Most of the plant and machinery is already in place and production is expected to start by December, 2015 or
January, 2016. The management aims to establish its product in OEM and A.M. segments over next 3 years and to achieve
double digit market share over next 5 years. We feel that the double digit market share target set by the management looks a
bit too ambitious given that the market is strongly held (more than 80%) by Exide Industries and Amara Raja Batteries and
also considering the shaky history that this division has had in the past. Hence, we would keep a close eye on the progress of
this division.
18
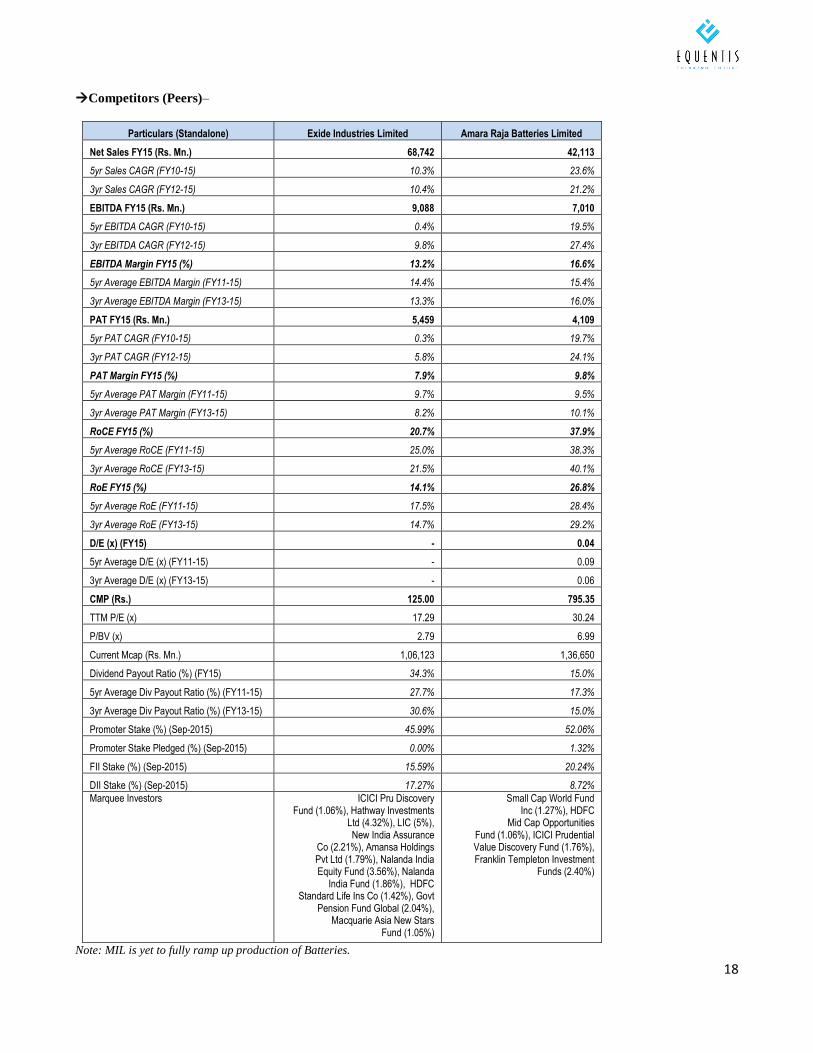
Competitors (Peers)–
Particulars (Standalone) Exide Industries Limited Amara Raja Batteries Limited
Net Sales FY15 (Rs. Mn.) 68,742 42,113
5yr Sales CAGR (FY10-15) 10.3% 23.6%
3yr Sales CAGR (FY12-15) 10.4% 21.2%
EBITDA FY15 (Rs. Mn.) 9,088 7,010
5yr EBITDA CAGR (FY10-15) 0.4% 19.5%
3yr EBITDA CAGR (FY12-15) 9.8% 27.4%
EBITDA Margin FY15 (%) 13.2% 16.6%
5yr Average EBITDA Margin (FY11-15) 14.4% 15.4%
3yr Average EBITDA Margin (FY13-15) 13.3% 16.0%
PAT FY15 (Rs. Mn.) 5,459 4,109
5yr PAT CAGR (FY10-15) 0.3% 19.7%
3yr PAT CAGR (FY12-15) 5.8% 24.1%
PAT Margin FY15 (%) 7.9% 9.8%
5yr Average PAT Margin (FY11-15) 9.7% 9.5%
3yr Average PAT Margin (FY13-15) 8.2% 10.1%
RoCE FY15 (%) 20.7% 37.9%
5yr Average RoCE (FY11-15) 25.0% 38.3%
3yr Average RoCE (FY13-15) 21.5% 40.1%
RoE FY15 (%) 14.1% 26.8%
5yr Average RoE (FY11-15) 17.5% 28.4%
3yr Average RoE (FY13-15) 14.7% 29.2%
D/E (x) (FY15) - 0.04
5yr Average D/E (x) (FY11-15) - 0.09
3yr Average D/E (x) (FY13-15) - 0.06
CMP (Rs.) 125.00 795.35
TTM P/E (x) 17.29 30.24
P/BV (x) 2.79 6.99
Current Mcap (Rs. Mn.) 1,06,123 1,36,650
Dividend Payout Ratio (%) (FY15) 34.3% 15.0%
5yr Average Div Payout Ratio (%) (FY11-15) 27.7% 17.3%
3yr Average Div Payout Ratio (%) (FY13-15) 30.6% 15.0%
Promoter Stake (%) (Sep-2015) 45.99% 52.06%
Promoter Stake Pledged (%) (Sep-2015) 0.00% 1.32%
FII Stake (%) (Sep-2015) 15.59% 20.24%
DII Stake (%) (Sep-2015) 17.27% 8.72%
Marquee Investors ICICI Pru Discovery Fund (1.06%), Hathway Investments
Ltd (4.32%), LIC (5%), New India Assurance
Co (2.21%), Amansa Holdings Pvt Ltd (1.79%), Nalanda India Equity Fund (3.56%), Nalanda
India Fund (1.86%), HDFC Standard Life Ins Co (1.42%), Govt
Pension Fund Global (2.04%), Macquarie Asia New Stars
Fund (1.05%)
Small Cap World Fund Inc (1.27%), HDFC
Mid Cap Opportunities Fund (1.06%), ICICI Prudential Value Discovery Fund (1.76%), Franklin Templeton Investment
Funds (2.40%)
Note: MIL is yet to fully ramp up production of Batteries.
19
5. OTHER BUSINESSES –
A) FUEL CAPS
What is the division about? -- MIL started manufacturing fuel caps in 2014 and has a technology tie-up with Toyoda
Goseiand Toyota Tsusho for manufacturing fuel caps along with other safety parts.
Plants–The companyhas a unit at Manesar(Gurgaon)for the manufacture of Fuel Caps for four wheelers.
Subsidiaries, JVs and Associates–The FY14 Annual Report states that MIL manufactures fuel caps through Toyota
GoseiMinda India Private Limited. This company is a JV between MIL, Toyoda Gosei and Toyota Tsusho from Japan.
However, there is no mention of the company in the FY15 Annual Report and also no financial data available for the same.
Customers–MIL presently has only one customer – Maruti Suzuki India Limited (MSIL) and supplies to two models of
MSIL.
Competitors (Peers)–There are no listed competitors; however, companies such as Moonlight Auto Pvt. Ltd. (located in
Ludhiana), UG Group of Industries (Delhi), Hunjan Auto Industries (Delhi), etc. are also engaged in manufacturing and sales
of fuel tank caps.
Outlook–Fuel tank caps are relatively new category for MIL started in 2014 with a view to diversify its product portfolio.
Also, the product enjoys higher margins compared to most other products under MIL’s fold. Traditionally, OEMs used to rely
on imported products for fuel tank caps; mainly from China and Thailand.However, some OEMs areconsidering local sourcing
of the same. MSIL has already started sourcing fuel caps from MIL for two of its models since Q1FY15. Incremental revenue
growth for this division would come from OEMs that start local sourcing of fuel tank caps and also from newer models of
existing clients (MSIL).
B) AUTO GAS
The Auto gas business of MIL was previously housed under MindaAutogas Limited (MAL). However, MAL was
amalgamated with the company during in FY12 and is now a part of the standalone entity. The Auto Gas Division
manufactures LPG/CNGkits and components for OEMs as well as forA.M.s. TheOEMs client profile includes MSIL, TAFE,
TML and M&M. Italso supplies kits & componentsto Honda Power for IndustrialGenset.Whilethe price differential between
petrol / diesel and LPG/CNG led to rapid adoption of LPG/CNG kits by car owners, the current scenario of lower crude oil
prices has led to a slowdown inthe same. However, over the longer term, with increasing Government emphasis on using
clean fuels and stricter emission norms, CNG/LPG (especially CNG) would be back in reckoning. Hence, we feel that the
business has a steady growth potential in the long term.
C) ALLOY WHEELS
What is the division about?–In 2015, MIL entered into JV with Kosei Aluminum Company Limited of Japan for
manufacturing of Alloy Wheels for Passenger vehicles (PVs). The JV, called Minda Kosei Alloy Wheels Private Limited,
will have stakes of MIL and Kosei in the ratio of 70:30 respectively and will set up a plant at Bawal (Haryana) for
manufacturing.
Products–The JV is expected to manufacture and sell Aluminum Alloy Wheels for PVs and also Aluminum Die Casting
parts to Indian and global OEMs. The Wheels will be in sizes ranging from 13’’ to 17’’ and cater to 4W OEMs in India and
abroad as well as A.M.s in India.
Plants–The proposed plant of the JV will be located at Bawal (Haryana). Commercial production is expected to start from
February, 2016with monthly capacity of 60,000 units.
Customers – In the first phase, the JV will supply to OEMs and will cater to A.M.s in the later phase. The company has
already received its first order from MSIL and the first shipment was delivered to the company in October, 2015. Going ahead,
the company plans to leverage its existing OEM relationships and distribution network in order to rope in more clients in the
business.
20
Potential - The JV will create a very strong local production base to offer market-leading, technology intensive Alloy
wheels and Aluminum Die Casting Parts to India and global OEMs. The most important aspect of the JV is the availability of
top-notch Japanese technology in aluminum casting, which KOSEI will infuse in this joint venture.
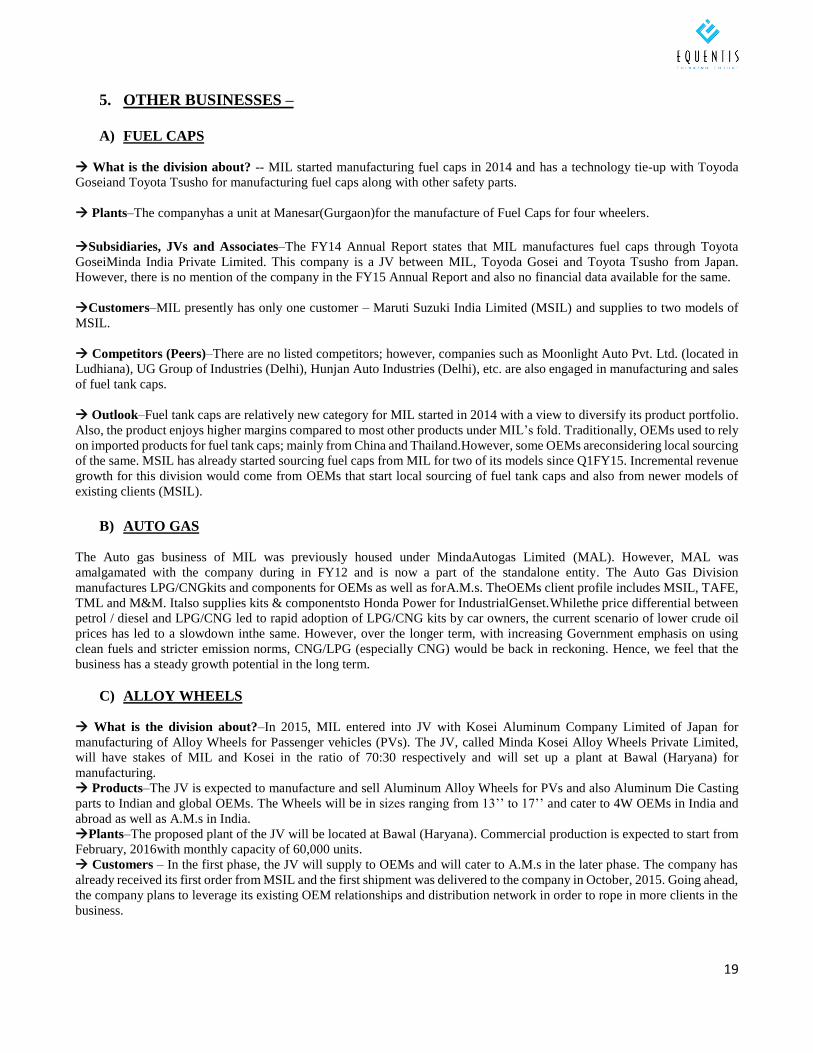
Subsidiaries, JVs and Associates – As stated above, MIL has JV with Kosei Aluminum Company of Japan for
manufacturing Aluminum Alloy Wheels in India. Details of the JV are as follows:
Sr. No. Particulars Details
1 Name Minda Kosei Aluminium Wheels Private Limited
2 Date of establishment of JV 30-Mar-15
3 Date of commencement of production Feb-16
4 Scope To develop, manufacture and sell Aluminium Alloy wheels in India
5 Target Segment PVs -- OEMs and A.M.
6 Capacity 60,000 units per month
7 Total Investment Rs.2bn (in 1st phase of production)
8 MIL Stake 70% (Rs.1.4bn)
9 Kosei Stake 30% (Rs.600mn)
10 MIL stake D:E split Debt -- 60% (Rs.840mn). Equity -- 40% (Rs.560mn)
Outlook – The Aluminum Alloy wheels (AAW) market in India is currently dominated by Steel Strips Wheels Limited
and Wheels India Limited that control nearly 80% of the market. The fortunes of this business are dependent on growth in
OEM demand as there is hardly any replacement market for alloy wheels. Aluminum wheels are lower in weight; however
they are 4 times more expensive than steel wheels. Hence, they are mainly used in higher end cars. Currently there is over-
capacity of AAW globally hence majority demand would be driven domestically. MIL management expects the AAW
business to have asset turns of ~1x on full ramp up along with EBITDA margins of 15-20% against consolidated EBITDA
margins of ~7% (in FY15).
21
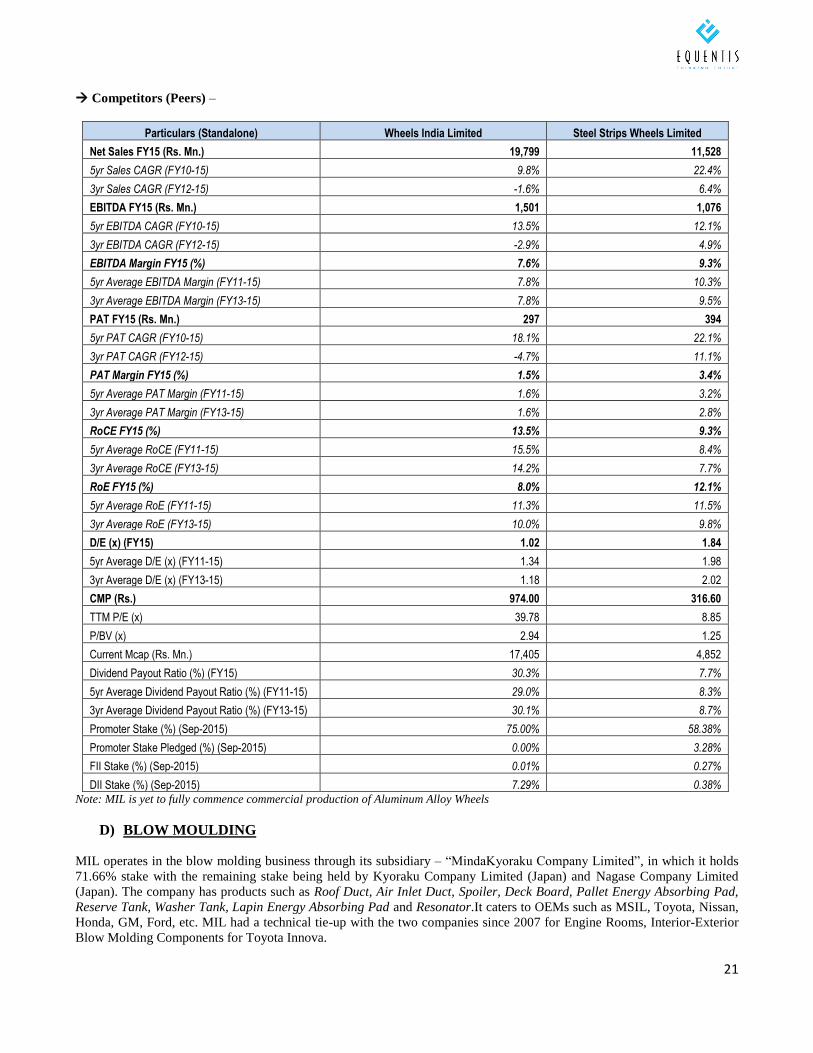
Competitors (Peers) –
Particulars (Standalone) Wheels India Limited Steel Strips Wheels Limited
Net Sales FY15 (Rs. Mn.) 19,799 11,528
5yr Sales CAGR (FY10-15) 9.8% 22.4%
3yr Sales CAGR (FY12-15) -1.6% 6.4%
EBITDA FY15 (Rs. Mn.) 1,501 1,076
5yr EBITDA CAGR (FY10-15) 13.5% 12.1%
3yr EBITDA CAGR (FY12-15) -2.9% 4.9%
EBITDA Margin FY15 (%) 7.6% 9.3%
5yr Average EBITDA Margin (FY11-15) 7.8% 10.3%
3yr Average EBITDA Margin (FY13-15) 7.8% 9.5%
PAT FY15 (Rs. Mn.) 297 394
5yr PAT CAGR (FY10-15) 18.1% 22.1%
3yr PAT CAGR (FY12-15) -4.7% 11.1%
PAT Margin FY15 (%) 1.5% 3.4%
5yr Average PAT Margin (FY11-15) 1.6% 3.2%
3yr Average PAT Margin (FY13-15) 1.6% 2.8%
RoCE FY15 (%) 13.5% 9.3%
5yr Average RoCE (FY11-15) 15.5% 8.4%
3yr Average RoCE (FY13-15) 14.2% 7.7%
RoE FY15 (%) 8.0% 12.1%
5yr Average RoE (FY11-15) 11.3% 11.5%
3yr Average RoE (FY13-15) 10.0% 9.8%
D/E (x) (FY15) 1.02 1.84
5yr Average D/E (x) (FY11-15) 1.34 1.98
3yr Average D/E (x) (FY13-15) 1.18 2.02
CMP (Rs.) 974.00 316.60
TTM P/E (x) 39.78 8.85
P/BV (x) 2.94 1.25
Current Mcap (Rs. Mn.) 17,405 4,852
Dividend Payout Ratio (%) (FY15) 30.3% 7.7%
5yr Average Dividend Payout Ratio (%) (FY11-15) 29.0% 8.3%
3yr Average Dividend Payout Ratio (%) (FY13-15) 30.1% 8.7%
Promoter Stake (%) (Sep-2015) 75.00% 58.38%
Promoter Stake Pledged (%) (Sep-2015) 0.00% 3.28%
FII Stake (%) (Sep-2015) 0.01% 0.27%
DII Stake (%) (Sep-2015) 7.29% 0.38%
Note: MIL is yet to fully commence commercial production of Aluminum Alloy Wheels
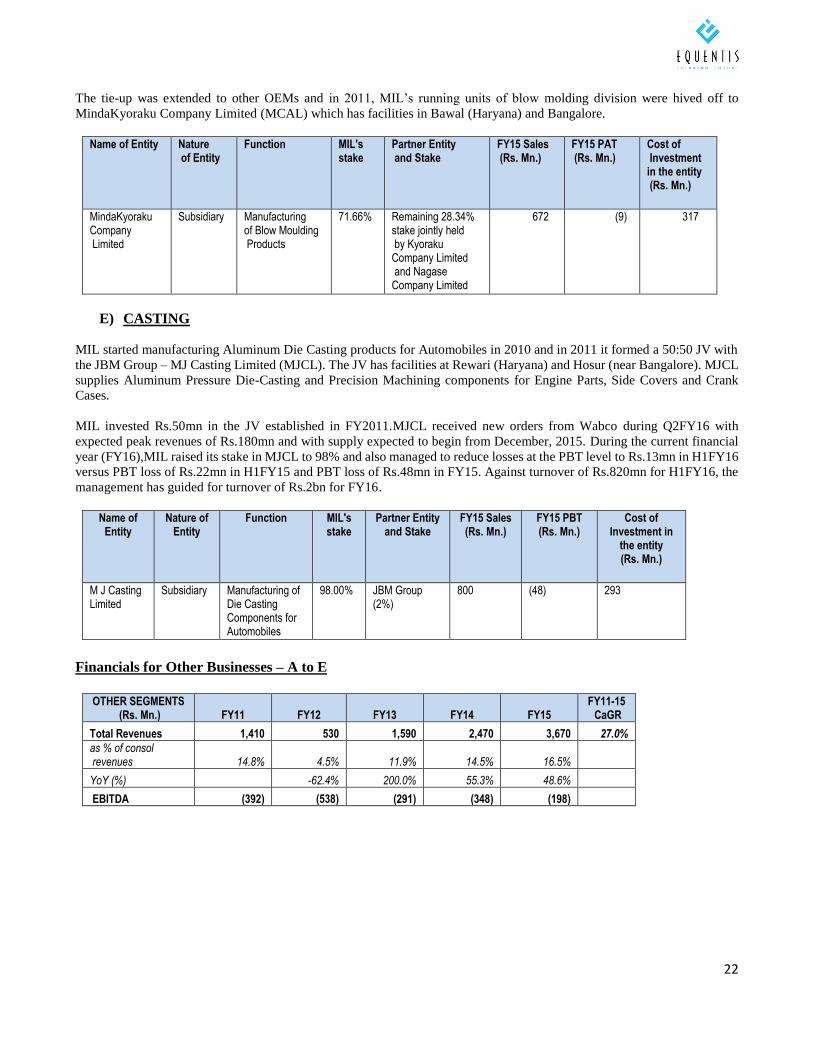
D) BLOW MOULDING
MIL operates in the blow molding business through its subsidiary – “MindaKyoraku Company Limited”, in which it holds
71.66% stake with the remaining stake being held by Kyoraku Company Limited (Japan) and Nagase Company Limited
(Japan). The company has products such as Roof Duct, Air Inlet Duct, Spoiler, Deck Board, Pallet Energy Absorbing Pad,
Reserve Tank, Washer Tank, Lapin Energy Absorbing Pad and Resonator.It caters to OEMs such as MSIL, Toyota, Nissan,
Honda, GM, Ford, etc. MIL had a technical tie-up with the two companies since 2007 for Engine Rooms, Interior-Exterior
Blow Molding Components for Toyota Innova.
22
The tie-up was extended to other OEMs and in 2011, MIL’s running units of blow molding division were hived off to
MindaKyoraku Company Limited (MCAL) which has facilities in Bawal (Haryana) and Bangalore.
Name of Entity Nature of Entity
Function MIL's stake
Partner Entity and Stake
FY15 Sales (Rs. Mn.)
FY15 PAT (Rs. Mn.)
Cost of Investment in the entity (Rs. Mn.)
MindaKyoraku Company Limited
Subsidiary Manufacturing of Blow Moulding Products
71.66% Remaining 28.34% stake jointly held by Kyoraku Company Limited and Nagase Company Limited
672 (9) 317
E) CASTING
MIL started manufacturing Aluminum Die Casting products for Automobiles in 2010 and in 2011 it formed a 50:50 JV with
the JBM Group – MJ Casting Limited (MJCL). The JV has facilities at Rewari (Haryana) and Hosur (near Bangalore). MJCL
supplies Aluminum Pressure Die-Casting and Precision Machining components for Engine Parts, Side Covers and Crank
Cases.
MIL invested Rs.50mn in the JV established in FY2011.MJCL received new orders from Wabco during Q2FY16 with
expected peak revenues of Rs.180mn and with supply expected to begin from December, 2015. During the current financial
year (FY16),MIL raised its stake in MJCL to 98% and also managed to reduce losses at the PBT level to Rs.13mn in H1FY16
versus PBT loss of Rs.22mn in H1FY15 and PBT loss of Rs.48mn in FY15. Against turnover of Rs.820mn for H1FY16, the
management has guided for turnover of Rs.2bn for FY16.
Name of Entity
Nature of Entity
Function MIL's stake
Partner Entity and Stake
FY15 Sales (Rs. Mn.)
FY15 PBT (Rs. Mn.)
Cost of Investment in
the entity (Rs. Mn.)
M J Casting Limited
Subsidiary Manufacturing of Die Casting Components for Automobiles
98.00% JBM Group (2%)
800 (48) 293
Financials for Other Businesses – A to E
OTHER SEGMENTS
(Rs. Mn.) FY11 FY12 FY13 FY14 FY15 FY11-15 CaGR
Total Revenues 1,410 530 1,590 2,470 3,670 27.0%
as % of consol revenues 14.8% 4.5% 11.9% 14.5% 16.5%
YoY (%) -62.4% 200.0% 55.3% 48.6%
EBITDA (392) (538) (291) (348) (198)
23
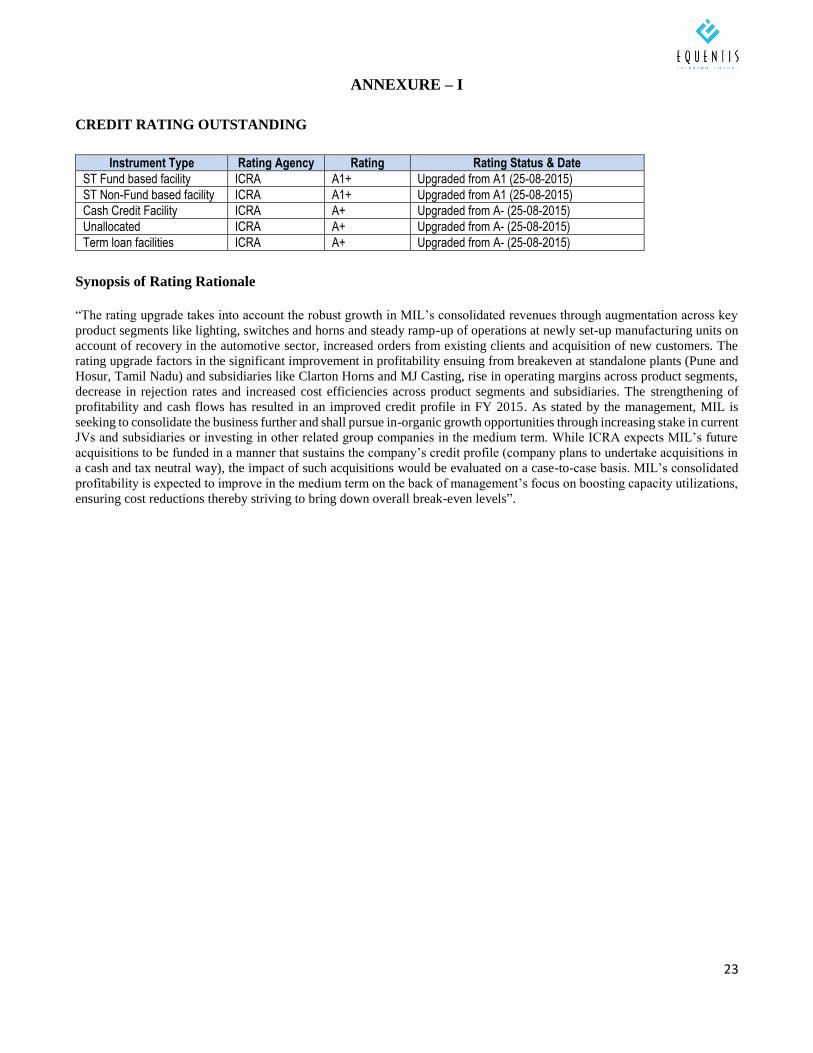
ANNEXURE – I
CREDIT RATING OUTSTANDING
Instrument Type Rating Agency Rating Rating Status & Date
ST Fund based facility ICRA A1+ Upgraded from A1 (25-08-2015)
ST Non-Fund based facility ICRA A1+ Upgraded from A1 (25-08-2015)
Cash Credit Facility ICRA A+ Upgraded from A- (25-08-2015)
Unallocated ICRA A+ Upgraded from A- (25-08-2015)
Term loan facilities ICRA A+ Upgraded from A- (25-08-2015)
Synopsis of Rating Rationale
“The rating upgrade takes into account the robust growth in MIL’s consolidated revenues through augmentation across key
product segments like lighting, switches and horns and steady ramp-up of operations at newly set-up manufacturing units on
account of recovery in the automotive sector, increased orders from existing clients and acquisition of new customers. The
rating upgrade factors in the significant improvement in profitability ensuing from breakeven at standalone plants (Pune and
Hosur, Tamil Nadu) and subsidiaries like Clarton Horns and MJ Casting, rise in operating margins across product segments,
decrease in rejection rates and increased cost efficiencies across product segments and subsidiaries. The strengthening of
profitability and cash flows has resulted in an improved credit profile in FY 2015. As stated by the management, MIL is
seeking to consolidate the business further and shall pursue in-organic growth opportunities through increasing stake in current
JVs and subsidiaries or investing in other related group companies in the medium term. While ICRA expects MIL’s future
acquisitions to be funded in a manner that sustains the company’s credit profile (company plans to undertake acquisitions in
a cash and tax neutral way), the impact of such acquisitions would be evaluated on a case-to-case basis. MIL’s consolidated
profitability is expected to improve in the medium term on the back of management’s focus on boosting capacity utilizations,
ensuring cost reductions thereby striving to bring down overall break-even levels”.
24
ANNEXURE – II
Management Background and Pedigree
MIL, part of the UNO Minda Group,was founded by Late Shri S. L. Minda in 1958. The company started as a manufacturer
of switches and later on diversified into several other auto component segments. The company is currently headed by Mr.
Nirmal K. Minda who is the Chairman and Managing Director while Mr. Sudhir Jain is the Group CFO.
The management of MIL has exhibited a great deal of agility in taking business decisions –whether related to increasing
number of clients (company currently caters to almost all OEMs in India in 2W, 3W, 4W andOff-road segments and most
major global OEMs), setting up new plants closer to clients whenever necessary (most plants in India are located in Auto hubs
while the company recently set up Clarton Horn’s plants in Mexico and Morocco to cater to orders from clients in North
America and Africa respectively), successfully acquiring and turning around loss-making companies (e.g., CH which MIL
turned around in the second year itself and which catapulted MIL to the position of second largest horn manufacturer globally)
while at the same time maintaining financial discipline (Net Sales, EBITDA and PAT have grown at 30%, 16% and 25%
CAGR respectively over past five years, D/E ratio has steadily moved downwards, below 1x while ROCE has steadily
improved over past 3 years, from 8% to 10%) and rewarding shareholders (Dividend Payout Ratio has averaged ~20% over
past 5 years while share price has grown at ~25% CAGR during that period)
Management profile
Chairman & MD - Mr. Nirmal K. Minda is an industrialist with rich business experience ofmore than 3 decades in
Auto Components Sector. Under his dynamicleadership, the Group has grown manifold (UNO MINDA has revenue
ofUS$ 642 mn) and has received numerous awards and recognitions. Heis the Chairman & Managing Director of the
company. Under his dynamicleadership, the company has established footprints across the globe.He has been
instrumental in forging new alliances and joint venturepartnership with globally renowned names. “Haryana Ratna
Award” hasbeen bestowed upon him for his professional and social achievements. Heis also the Chairman of ACMA
Northern region.
Director - Mr. Anand Kumar Minda is the Non-Executive Director of our Company.He has over 35 years of hands
on experience in financial control, reviews,manufacturing, and project management. He has been appointed
asmember of the Board since 2011. He plays a pivotal role in new projectsand strategy formulation. He is also the
member of Audit Committee,Stakeholders Relationship Committee and CSR Committee of the Company.
Director - Mr. Sekhri is an Engineering Graduate in Mechanical stream from Delhi College of Engineering and a
Master of Business Administration (MBA). He has more than 40 years of experience in the field of automotive
industry. He has held various senior positions, including Managing Director of Bosch Chassis Systems India Ltd.
(from 1995 to March 2010). He has been a member of the Executive Committee of professional bodies like
Automotive Components Manufacturers Association, Maharatta Chamber of Commerce Industries and Agriculture
and CII Pune Zone Council. After his retirement in 2010, he has been serving on the boards of Auto Component
Companies and management institutes.
Shareholding Pattern
As on 30th September, 2015 promoters (mainly Minda family members) own 70.90% in the company with none of their
holding pledged. The promoter holding has been stable since 31st March, 2014 when in fact the promoters raised their stake
from 65.98% to the current level. Over the past decade, promoter holding in MIL has remained in the 65-70% range. As per
BSE disclosures on 30th September, 2015 DII holding in MIL was 2.83% while FII holding was miniscule (0.04%). Marquee
stakeholders in the company are India Business Excellence Fund I (8.49%) and IL&FS Trust Company Limited (2.83%).
The India Business Excellence Fund is a Private Equity (PE) fund sponsored by Motilal Oswal Financial Services. It invested
Rs.400mn in MIL in January, 2010 by subscribing to 1,37,625 3% Cumulative Compulsorily Convertible Preference Shares
(CCCPS) having a face value of Rs.2,187 each. Each Preference Share, on exercise of right of conversion, entitled the holder
to apply for and be allotted ten equity shares of the Company of Rs. 10 each, fully paid up, at a price of Rs. 218.70 per equity
share. This was at a discount of ~20% to MIL’s BSE closing price of Rs.274.95 on 13thJanuary, 2010.At the same time, IL&FS
Trust Company subscribed to 45,875 CCCPS of the company. As per BSE shareholding disclosures dated 30th September,
25
2015, both these investors still hold almost their entire shareholding in the company (97% of the number of shares initially
invested into) which demonstrates their faith in the long term growth potential of the company.
Key Market Data
Close of 20th January, 2016 Bloomberg Code MNDA IN Last Price, M. Cap, 52w H/L Rs. 755.50/- (BSE) – Rs. 12bn/ USD 69mn Rs. 996.00/475.00 Shares outstanding, Face Value 15.87 mn , Rs. 10/- Promoter holding (as on 30th September, 2015) Promoter holding at 70.90% (Nil share pledge). Holding unchanged w.r.t. 30th September, 2014
and 30th June, 2015 Institutional holding (as on 30th September, 2015) FII –0.04% (versus 0.02% as on 30th September, 2014 and 0.03% as on 30th June, 2015).
DII – 2.83% (versus 2.89% as on 30th September, 2014 and 2.84% as on 30th June, 2015) Marquee Investors (as on 30th September, 2015) India Business Excellence Fund I (8.49%) and IL&FS Trust Company Limited (2.83%)
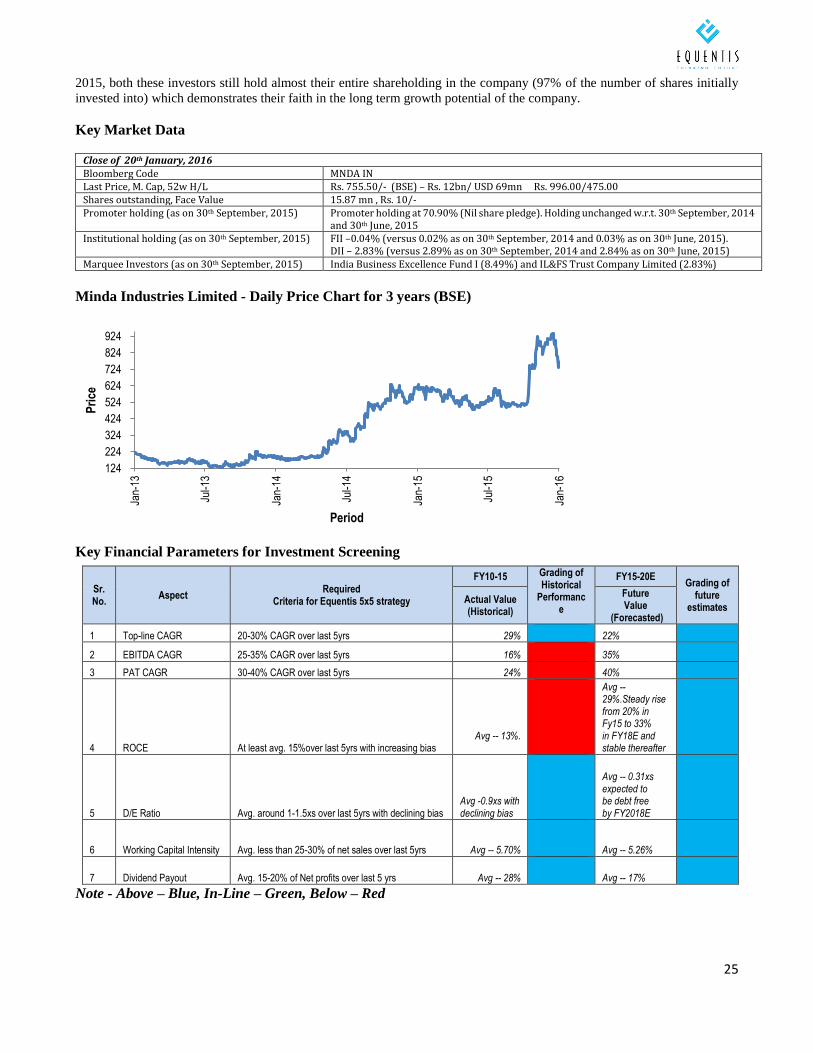
Minda Industries Limited - Daily Price Chart for 3 years (BSE)
Key Financial Parameters for Investment Screening
Sr. No.
Aspect Required
Criteria for Equentis 5x5 strategy
FY10-15 Grading of Historical
Performance
FY15-20E Grading of
future estimates
Actual Value (Historical)
Future Value
(Forecasted)
1 Top-line CAGR 20-30% CAGR over last 5yrs 29%
22%
2 EBITDA CAGR 25-35% CAGR over last 5yrs 16%
35%
3 PAT CAGR 30-40% CAGR over last 5yrs 24% 40%
4 ROCE At least avg. 15%over last 5yrs with increasing bias Avg -- 13%.
Avg -- 29%.Steady rise from 20% in Fy15 to 33% in FY18E and stable thereafter
5 D/E Ratio Avg. around 1-1.5xs over last 5yrs with declining bias Avg -0.9xs with declining bias
Avg -- 0.31xs expected to be debt free by FY2018E
6 Working Capital Intensity Avg. less than 25-30% of net sales over last 5yrs Avg -- 5.70%
Avg -- 5.26%
7 Dividend Payout Avg. 15-20% of Net profits over last 5 yrs Avg -- 28%
Avg -- 17%
Note - Above – Blue, In-Line – Green, Below – Red
124
224
324
424
524
624
724
824
924
Jan-
13
Jul-1
3
Jan-
14
Jul-1
4
Jan-
15
Jul-1
5
Jan-
16
Pri
ce
Period
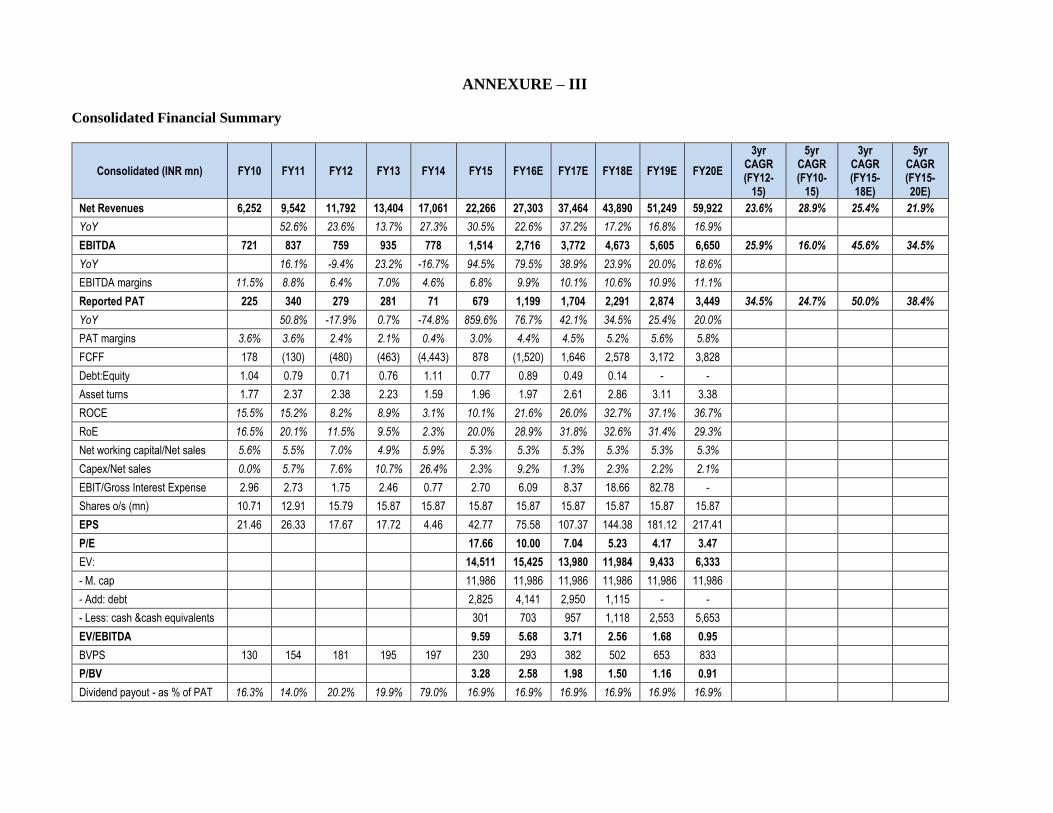
ANNEXURE – III
Consolidated Financial Summary
Consolidated (INR mn) FY10 FY11 FY12 FY13 FY14 FY15 FY16E FY17E FY18E FY19E FY20E
3yr CAGR (FY12-
15)
5yr CAGR (FY10-
15)
3yr CAGR (FY15-18E)
5yr CAGR (FY15-20E)
Net Revenues 6,252 9,542 11,792 13,404 17,061 22,266 27,303 37,464 43,890 51,249 59,922 23.6% 28.9% 25.4% 21.9%
YoY 52.6% 23.6% 13.7% 27.3% 30.5% 22.6% 37.2% 17.2% 16.8% 16.9%
EBITDA 721 837 759 935 778 1,514 2,716 3,772 4,673 5,605 6,650 25.9% 16.0% 45.6% 34.5%
YoY 16.1% -9.4% 23.2% -16.7% 94.5% 79.5% 38.9% 23.9% 20.0% 18.6%
EBITDA margins 11.5% 8.8% 6.4% 7.0% 4.6% 6.8% 9.9% 10.1% 10.6% 10.9% 11.1%
Reported PAT 225 340 279 281 71 679 1,199 1,704 2,291 2,874 3,449 34.5% 24.7% 50.0% 38.4%
YoY 50.8% -17.9% 0.7% -74.8% 859.6% 76.7% 42.1% 34.5% 25.4% 20.0%
PAT margins 3.6% 3.6% 2.4% 2.1% 0.4% 3.0% 4.4% 4.5% 5.2% 5.6% 5.8%
FCFF 178 (130) (480) (463) (4,443) 878 (1,520) 1,646 2,578 3,172 3,828
Debt:Equity 1.04 0.79 0.71 0.76 1.11 0.77 0.89 0.49 0.14 - -
Asset turns 1.77 2.37 2.38 2.23 1.59 1.96 1.97 2.61 2.86 3.11 3.38
ROCE 15.5% 15.2% 8.2% 8.9% 3.1% 10.1% 21.6% 26.0% 32.7% 37.1% 36.7%
RoE 16.5% 20.1% 11.5% 9.5% 2.3% 20.0% 28.9% 31.8% 32.6% 31.4% 29.3%
Net working capital/Net sales 5.6% 5.5% 7.0% 4.9% 5.9% 5.3% 5.3% 5.3% 5.3% 5.3% 5.3%
Capex/Net sales 0.0% 5.7% 7.6% 10.7% 26.4% 2.3% 9.2% 1.3% 2.3% 2.2% 2.1%
EBIT/Gross Interest Expense 2.96 2.73 1.75 2.46 0.77 2.70 6.09 8.37 18.66 82.78 -
Shares o/s (mn) 10.71 12.91 15.79 15.87 15.87 15.87 15.87 15.87 15.87 15.87 15.87
EPS 21.46 26.33 17.67 17.72 4.46 42.77 75.58 107.37 144.38 181.12 217.41
P/E 17.66 10.00 7.04 5.23 4.17 3.47
EV: 14,511 15,425 13,980 11,984 9,433 6,333
- M. cap 11,986 11,986 11,986 11,986 11,986 11,986
- Add: debt 2,825 4,141 2,950 1,115 - -
- Less: cash &cash equivalents 301 703 957 1,118 2,553 5,653
EV/EBITDA 9.59 5.68 3.71 2.56 1.68 0.95
BVPS 130 154 181 195 197 230 293 382 502 653 833
P/BV 3.28 2.58 1.98 1.50 1.16 0.91
Dividend payout - as % of PAT 16.3% 14.0% 20.2% 19.9% 79.0% 16.9% 16.9% 16.9% 16.9% 16.9% 16.9%
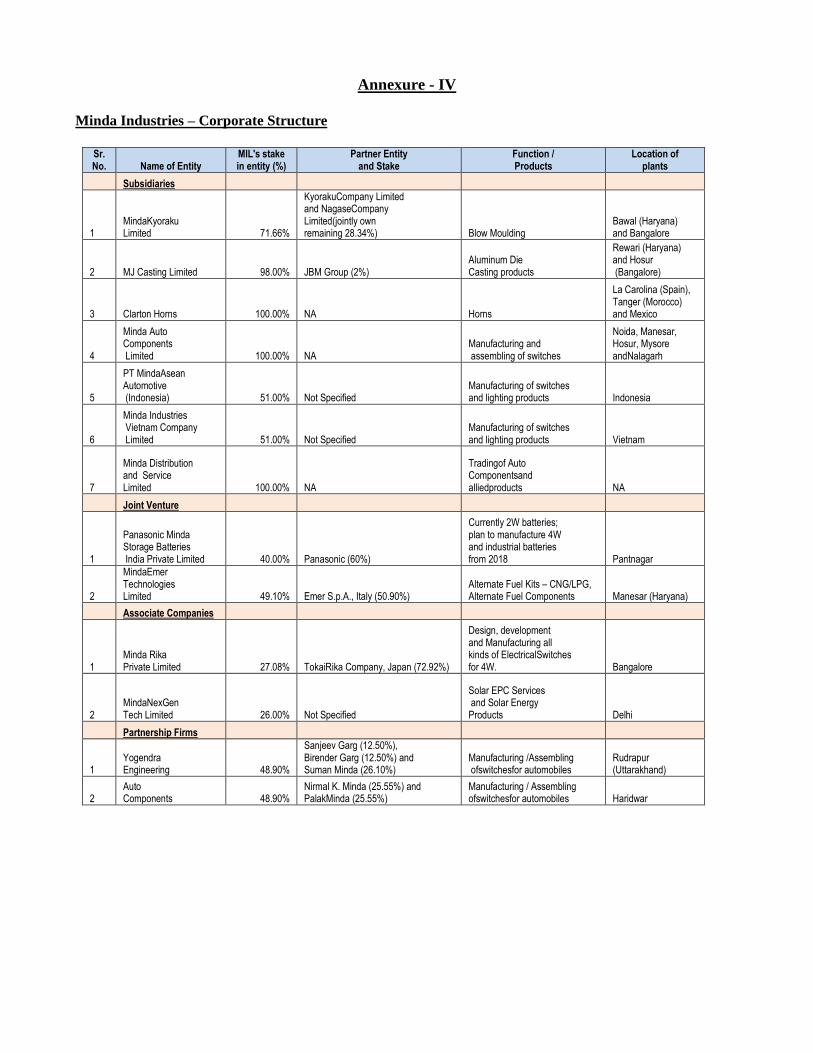
Annexure - IV
Minda Industries – Corporate Structure
Sr. No. Name of Entity
MIL's stake in entity (%)
Partner Entity and Stake
Function / Products
Location of plants
Subsidiaries
1 MindaKyoraku Limited 71.66%
KyorakuCompany Limited and NagaseCompany Limited(jointly own remaining 28.34%) Blow Moulding
Bawal (Haryana) and Bangalore
2 MJ Casting Limited 98.00% JBM Group (2%) Aluminum Die Casting products
Rewari (Haryana) and Hosur (Bangalore)
3 Clarton Horns 100.00% NA Horns
La Carolina (Spain), Tanger (Morocco) and Mexico
4
Minda Auto Components Limited 100.00% NA
Manufacturing and assembling of switches
Noida, Manesar, Hosur, Mysore andNalagarh
5
PT MindaAsean Automotive (Indonesia) 51.00% Not Specified
Manufacturing of switches and lighting products Indonesia
6
Minda Industries Vietnam Company Limited 51.00% Not Specified
Manufacturing of switches and lighting products Vietnam
7
Minda Distribution and Service Limited 100.00% NA
Tradingof Auto Componentsand alliedproducts NA
Joint Venture
1
Panasonic Minda Storage Batteries India Private Limited 40.00% Panasonic (60%)
Currently 2W batteries; plan to manufacture 4W and industrial batteries from 2018 Pantnagar
2
MindaEmer Technologies Limited 49.10% Emer S.p.A., Italy (50.90%)
Alternate Fuel Kits – CNG/LPG, Alternate Fuel Components Manesar (Haryana)
Associate Companies
1 Minda Rika Private Limited 27.08% TokaiRika Company, Japan (72.92%)
Design, development and Manufacturing all kinds of ElectricalSwitches for 4W. Bangalore
2 MindaNexGen Tech Limited 26.00% Not Specified
Solar EPC Services and Solar Energy Products Delhi
Partnership Firms
1 Yogendra Engineering 48.90%
Sanjeev Garg (12.50%), Birender Garg (12.50%) and Suman Minda (26.10%)
Manufacturing /Assembling ofswitchesfor automobiles
Rudrapur (Uttarakhand)
2 Auto Components 48.90%
Nirmal K. Minda (25.55%) and PalakMinda (25.55%)
Manufacturing / Assembling ofswitchesfor automobiles Haridwar
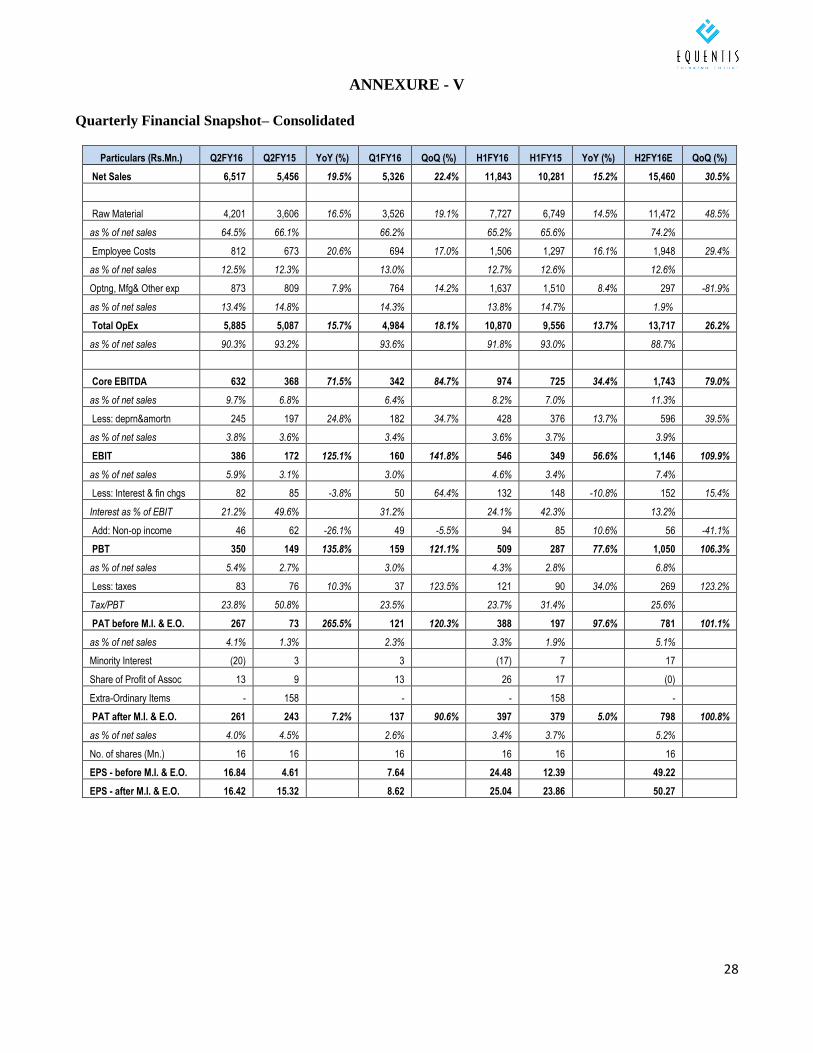
28
ANNEXURE - V
Quarterly Financial Snapshot– Consolidated
Particulars (Rs.Mn.) Q2FY16 Q2FY15 YoY (%) Q1FY16 QoQ (%) H1FY16 H1FY15 YoY (%) H2FY16E QoQ (%)
Net Sales 6,517 5,456 19.5% 5,326 22.4% 11,843 10,281 15.2% 15,460 30.5%
Raw Material 4,201 3,606 16.5% 3,526 19.1% 7,727 6,749 14.5% 11,472 48.5%
as % of net sales 64.5% 66.1% 66.2% 65.2% 65.6% 74.2%
Employee Costs 812 673 20.6% 694 17.0% 1,506 1,297 16.1% 1,948 29.4%
as % of net sales 12.5% 12.3% 13.0% 12.7% 12.6% 12.6%
Optng, Mfg& Other exp 873 809 7.9% 764 14.2% 1,637 1,510 8.4% 297 -81.9%
as % of net sales 13.4% 14.8% 14.3% 13.8% 14.7% 1.9%
Total OpEx 5,885 5,087 15.7% 4,984 18.1% 10,870 9,556 13.7% 13,717 26.2%
as % of net sales 90.3% 93.2% 93.6% 91.8% 93.0% 88.7%
Core EBITDA 632 368 71.5% 342 84.7% 974 725 34.4% 1,743 79.0%
as % of net sales 9.7% 6.8% 6.4% 8.2% 7.0% 11.3%
Less: deprn&amortn 245 197 24.8% 182 34.7% 428 376 13.7% 596 39.5%
as % of net sales 3.8% 3.6% 3.4% 3.6% 3.7% 3.9%
EBIT 386 172 125.1% 160 141.8% 546 349 56.6% 1,146 109.9%
as % of net sales 5.9% 3.1% 3.0% 4.6% 3.4% 7.4%
Less: Interest & fin chgs 82 85 -3.8% 50 64.4% 132 148 -10.8% 152 15.4%
Interest as % of EBIT 21.2% 49.6% 31.2% 24.1% 42.3% 13.2%
Add: Non-op income 46 62 -26.1% 49 -5.5% 94 85 10.6% 56 -41.1%
PBT 350 149 135.8% 159 121.1% 509 287 77.6% 1,050 106.3%
as % of net sales 5.4% 2.7% 3.0% 4.3% 2.8% 6.8%
Less: taxes 83 76 10.3% 37 123.5% 121 90 34.0% 269 123.2%
Tax/PBT 23.8% 50.8% 23.5% 23.7% 31.4% 25.6%
PAT before M.I. & E.O. 267 73 265.5% 121 120.3% 388 197 97.6% 781 101.1%
as % of net sales 4.1% 1.3% 2.3% 3.3% 1.9% 5.1%
Minority Interest (20) 3 3 (17) 7 17
Share of Profit of Assoc 13 9 13 26 17 (0)
Extra-Ordinary Items - 158 - - 158 -
PAT after M.I. & E.O. 261 243 7.2% 137 90.6% 397 379 5.0% 798 100.8%
as % of net sales 4.0% 4.5% 2.6% 3.4% 3.7% 5.2%
No. of shares (Mn.) 16 16 16 16 16 16
EPS - before M.I. & E.O. 16.84 4.61 7.64 24.48 12.39 49.22
EPS - after M.I. & E.O. 16.42 15.32 8.62 25.04 23.86 50.27
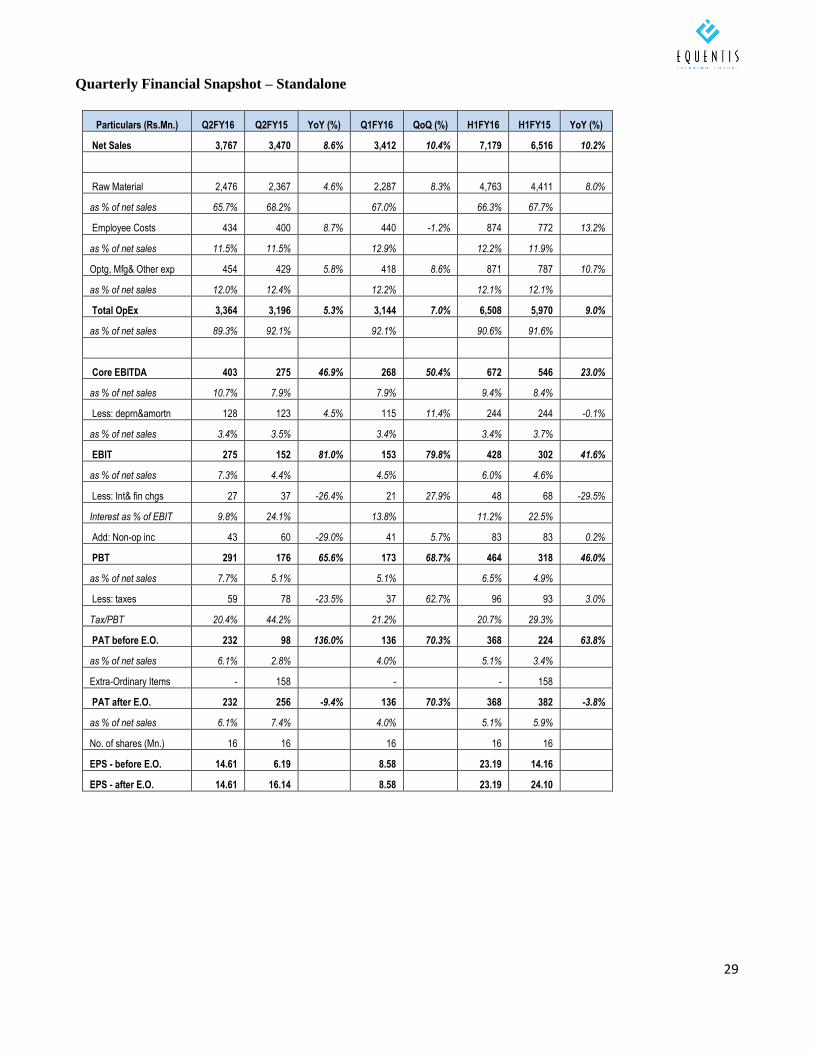
29
Quarterly Financial Snapshot – Standalone
Particulars (Rs.Mn.) Q2FY16 Q2FY15 YoY (%) Q1FY16 QoQ (%) H1FY16 H1FY15 YoY (%)
Net Sales 3,767 3,470 8.6% 3,412 10.4% 7,179 6,516 10.2%
Raw Material 2,476 2,367 4.6% 2,287 8.3% 4,763 4,411 8.0%
as % of net sales 65.7% 68.2% 67.0% 66.3% 67.7%
Employee Costs 434 400 8.7% 440 -1.2% 874 772 13.2%
as % of net sales 11.5% 11.5% 12.9% 12.2% 11.9%
Optg, Mfg& Other exp 454 429 5.8% 418 8.6% 871 787 10.7%
as % of net sales 12.0% 12.4% 12.2% 12.1% 12.1%
Total OpEx 3,364 3,196 5.3% 3,144 7.0% 6,508 5,970 9.0%
as % of net sales 89.3% 92.1% 92.1% 90.6% 91.6%
Core EBITDA 403 275 46.9% 268 50.4% 672 546 23.0%
as % of net sales 10.7% 7.9% 7.9% 9.4% 8.4%
Less: deprn&amortn 128 123 4.5% 115 11.4% 244 244 -0.1%
as % of net sales 3.4% 3.5% 3.4% 3.4% 3.7%
EBIT 275 152 81.0% 153 79.8% 428 302 41.6%
as % of net sales 7.3% 4.4% 4.5% 6.0% 4.6%
Less: Int& fin chgs 27 37 -26.4% 21 27.9% 48 68 -29.5%
Interest as % of EBIT 9.8% 24.1% 13.8% 11.2% 22.5%
Add: Non-op inc 43 60 -29.0% 41 5.7% 83 83 0.2%
PBT 291 176 65.6% 173 68.7% 464 318 46.0%
as % of net sales 7.7% 5.1% 5.1% 6.5% 4.9%
Less: taxes 59 78 -23.5% 37 62.7% 96 93 3.0%
Tax/PBT 20.4% 44.2% 21.2% 20.7% 29.3%
PAT before E.O. 232 98 136.0% 136 70.3% 368 224 63.8%
as % of net sales 6.1% 2.8% 4.0% 5.1% 3.4%
Extra-Ordinary Items - 158 - - 158
PAT after E.O. 232 256 -9.4% 136 70.3% 368 382 -3.8%
as % of net sales 6.1% 7.4% 4.0% 5.1% 5.9%
No. of shares (Mn.) 16 16 16 16 16
EPS - before E.O. 14.61 6.19 8.58 23.19 14.16
EPS - after E.O. 14.61 16.14 8.58 23.19 24.10
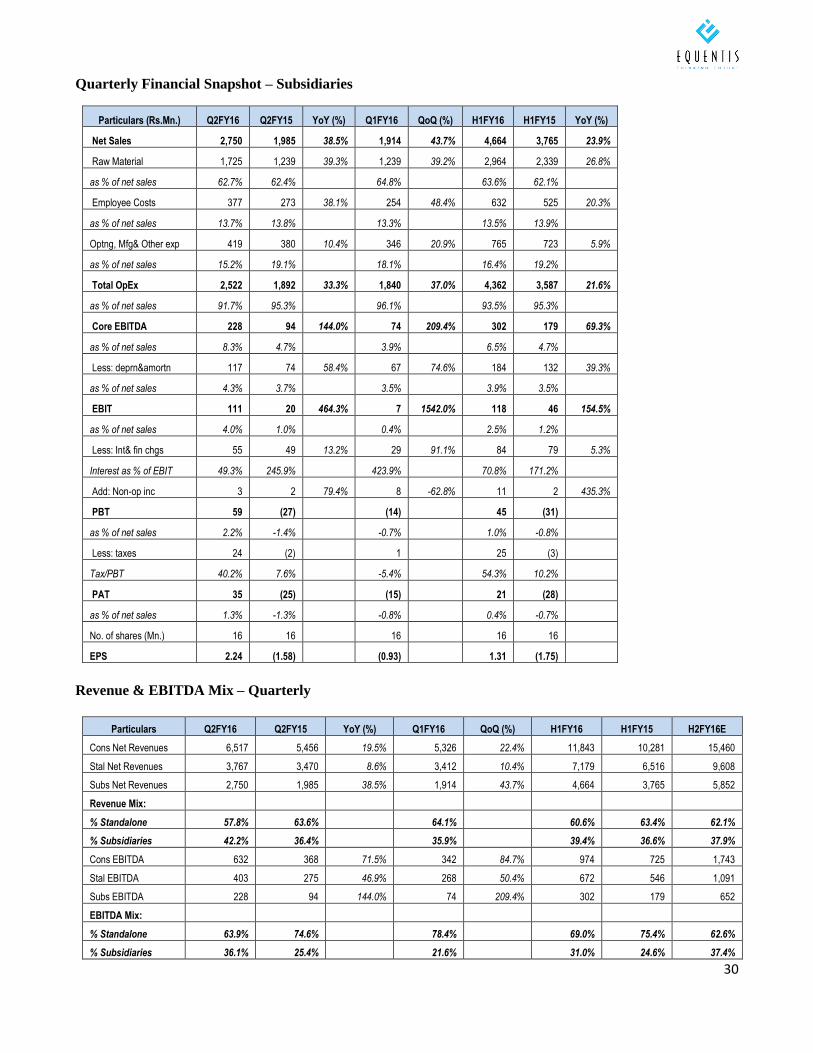
30
Quarterly Financial Snapshot – Subsidiaries
Particulars (Rs.Mn.) Q2FY16 Q2FY15 YoY (%) Q1FY16 QoQ (%) H1FY16 H1FY15 YoY (%)
Net Sales 2,750 1,985 38.5% 1,914 43.7% 4,664 3,765 23.9%
Raw Material 1,725 1,239 39.3% 1,239 39.2% 2,964 2,339 26.8%
as % of net sales 62.7% 62.4% 64.8% 63.6% 62.1%
Employee Costs 377 273 38.1% 254 48.4% 632 525 20.3%
as % of net sales 13.7% 13.8% 13.3% 13.5% 13.9%
Optng, Mfg& Other exp 419 380 10.4% 346 20.9% 765 723 5.9%
as % of net sales 15.2% 19.1% 18.1% 16.4% 19.2%
Total OpEx 2,522 1,892 33.3% 1,840 37.0% 4,362 3,587 21.6%
as % of net sales 91.7% 95.3% 96.1% 93.5% 95.3%
Core EBITDA 228 94 144.0% 74 209.4% 302 179 69.3%
as % of net sales 8.3% 4.7% 3.9% 6.5% 4.7%
Less: deprn&amortn 117 74 58.4% 67 74.6% 184 132 39.3%
as % of net sales 4.3% 3.7% 3.5% 3.9% 3.5%
EBIT 111 20 464.3% 7 1542.0% 118 46 154.5%
as % of net sales 4.0% 1.0% 0.4% 2.5% 1.2%
Less: Int& fin chgs 55 49 13.2% 29 91.1% 84 79 5.3%
Interest as % of EBIT 49.3% 245.9% 423.9% 70.8% 171.2%
Add: Non-op inc 3 2 79.4% 8 -62.8% 11 2 435.3%
PBT 59 (27) (14) 45 (31)
as % of net sales 2.2% -1.4% -0.7% 1.0% -0.8%
Less: taxes 24 (2) 1 25 (3)
Tax/PBT 40.2% 7.6% -5.4% 54.3% 10.2%
PAT 35 (25) (15) 21 (28)
as % of net sales 1.3% -1.3% -0.8% 0.4% -0.7%
No. of shares (Mn.) 16 16 16 16 16
EPS 2.24 (1.58) (0.93) 1.31 (1.75)
Revenue & EBITDA Mix – Quarterly
Particulars Q2FY16 Q2FY15 YoY (%) Q1FY16 QoQ (%) H1FY16 H1FY15 H2FY16E
Cons Net Revenues 6,517 5,456 19.5% 5,326 22.4% 11,843 10,281 15,460
Stal Net Revenues 3,767 3,470 8.6% 3,412 10.4% 7,179 6,516 9,608
Subs Net Revenues 2,750 1,985 38.5% 1,914 43.7% 4,664 3,765 5,852
Revenue Mix:
% Standalone 57.8% 63.6% 64.1% 60.6% 63.4% 62.1%
% Subsidiaries 42.2% 36.4% 35.9% 39.4% 36.6% 37.9%
Cons EBITDA 632 368 71.5% 342 84.7% 974 725 1,743
Stal EBITDA 403 275 46.9% 268 50.4% 672 546 1,091
Subs EBITDA 228 94 144.0% 74 209.4% 302 179 652
EBITDA Mix:
% Standalone 63.9% 74.6% 78.4% 69.0% 75.4% 62.6%
% Subsidiaries 36.1% 25.4% 21.6% 31.0% 24.6% 37.4%
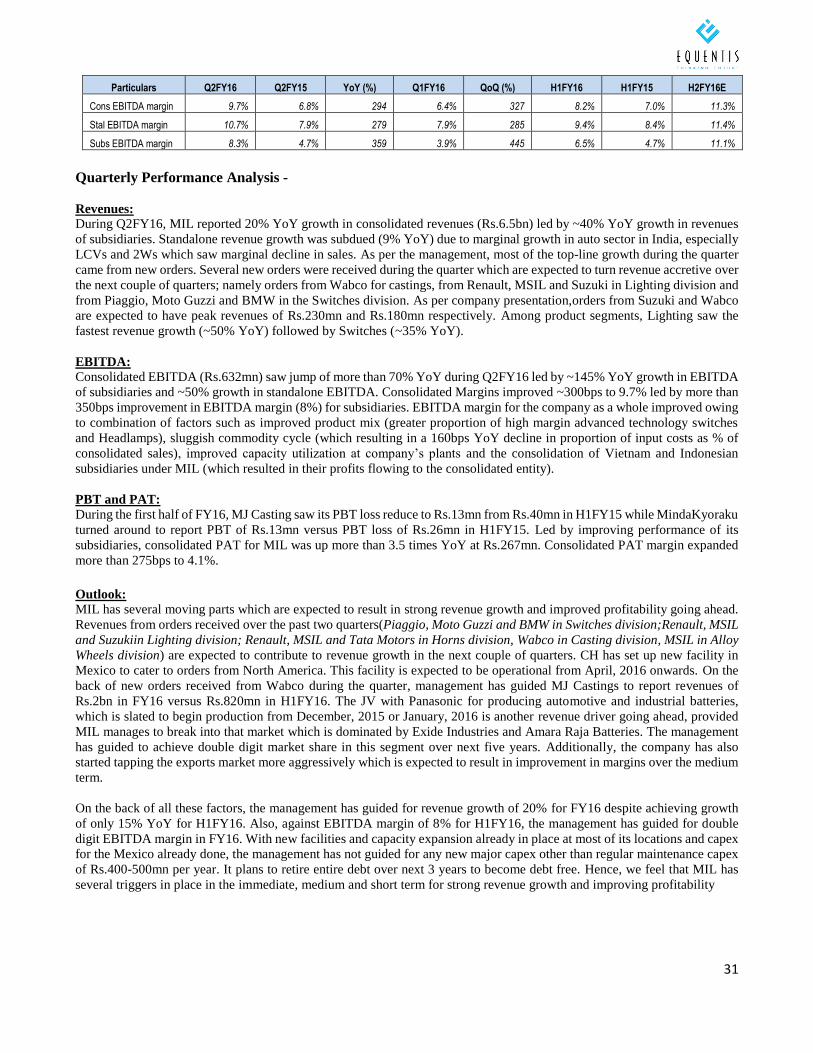
31
Particulars Q2FY16 Q2FY15 YoY (%) Q1FY16 QoQ (%) H1FY16 H1FY15 H2FY16E
Cons EBITDA margin 9.7% 6.8% 294 6.4% 327 8.2% 7.0% 11.3%
Stal EBITDA margin 10.7% 7.9% 279 7.9% 285 9.4% 8.4% 11.4%
Subs EBITDA margin 8.3% 4.7% 359 3.9% 445 6.5% 4.7% 11.1%
Quarterly Performance Analysis -
Revenues:
During Q2FY16, MIL reported 20% YoY growth in consolidated revenues (Rs.6.5bn) led by ~40% YoY growth in revenues
of subsidiaries. Standalone revenue growth was subdued (9% YoY) due to marginal growth in auto sector in India, especially
LCVs and 2Ws which saw marginal decline in sales. As per the management, most of the top-line growth during the quarter
came from new orders. Several new orders were received during the quarter which are expected to turn revenue accretive over
the next couple of quarters; namely orders from Wabco for castings, from Renault, MSIL and Suzuki in Lighting division and
from Piaggio, Moto Guzzi and BMW in the Switches division. As per company presentation,orders from Suzuki and Wabco
are expected to have peak revenues of Rs.230mn and Rs.180mn respectively. Among product segments, Lighting saw the
fastest revenue growth (~50% YoY) followed by Switches (~35% YoY).
EBITDA:
Consolidated EBITDA (Rs.632mn) saw jump of more than 70% YoY during Q2FY16 led by ~145% YoY growth in EBITDA
of subsidiaries and ~50% growth in standalone EBITDA. Consolidated Margins improved ~300bps to 9.7% led by more than
350bps improvement in EBITDA margin (8%) for subsidiaries. EBITDA margin for the company as a whole improved owing
to combination of factors such as improved product mix (greater proportion of high margin advanced technology switches
and Headlamps), sluggish commodity cycle (which resulting in a 160bps YoY decline in proportion of input costs as % of
consolidated sales), improved capacity utilization at company’s plants and the consolidation of Vietnam and Indonesian
subsidiaries under MIL (which resulted in their profits flowing to the consolidated entity).
PBT and PAT:
During the first half of FY16, MJ Casting saw its PBT loss reduce to Rs.13mn from Rs.40mn in H1FY15 while MindaKyoraku
turned around to report PBT of Rs.13mn versus PBT loss of Rs.26mn in H1FY15. Led by improving performance of its
subsidiaries, consolidated PAT for MIL was up more than 3.5 times YoY at Rs.267mn. Consolidated PAT margin expanded
more than 275bps to 4.1%.
Outlook:
MIL has several moving parts which are expected to result in strong revenue growth and improved profitability going ahead.
Revenues from orders received over the past two quarters(Piaggio, Moto Guzzi and BMW in Switches division;Renault, MSIL
and Suzukiin Lighting division; Renault, MSIL and Tata Motors in Horns division, Wabco in Casting division, MSIL in Alloy
Wheels division) are expected to contribute to revenue growth in the next couple of quarters. CH has set up new facility in
Mexico to cater to orders from North America. This facility is expected to be operational from April, 2016 onwards. On the
back of new orders received from Wabco during the quarter, management has guided MJ Castings to report revenues of
Rs.2bn in FY16 versus Rs.820mn in H1FY16. The JV with Panasonic for producing automotive and industrial batteries,
which is slated to begin production from December, 2015 or January, 2016 is another revenue driver going ahead, provided
MIL manages to break into that market which is dominated by Exide Industries and Amara Raja Batteries. The management
has guided to achieve double digit market share in this segment over next five years. Additionally, the company has also
started tapping the exports market more aggressively which is expected to result in improvement in margins over the medium
term.
On the back of all these factors, the management has guided for revenue growth of 20% for FY16 despite achieving growth
of only 15% YoY for H1FY16. Also, against EBITDA margin of 8% for H1FY16, the management has guided for double
digit EBITDA margin in FY16. With new facilities and capacity expansion already in place at most of its locations and capex
for the Mexico already done, the management has not guided for any new major capex other than regular maintenance capex
of Rs.400-500mn per year. It plans to retire entire debt over next 3 years to become debt free. Hence, we feel that MIL has
several triggers in place in the immediate, medium and short term for strong revenue growth and improving profitability
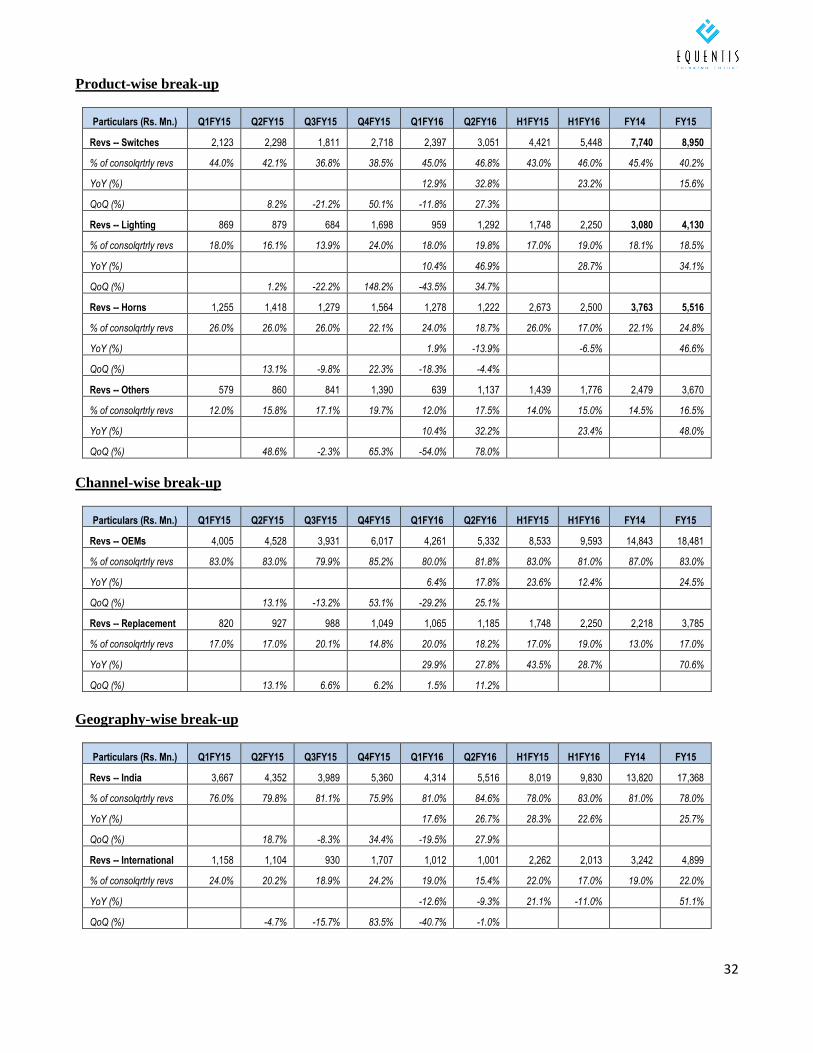
32
Product-wise break-up
Particulars (Rs. Mn.) Q1FY15 Q2FY15 Q3FY15 Q4FY15 Q1FY16 Q2FY16 H1FY15 H1FY16 FY14 FY15
Revs -- Switches 2,123 2,298 1,811 2,718 2,397 3,051 4,421 5,448 7,740 8,950
% of consolqrtrly revs 44.0% 42.1% 36.8% 38.5% 45.0% 46.8% 43.0% 46.0% 45.4% 40.2%
YoY (%) 12.9% 32.8% 23.2% 15.6%
QoQ (%) 8.2% -21.2% 50.1% -11.8% 27.3%
Revs -- Lighting 869 879 684 1,698 959 1,292 1,748 2,250 3,080 4,130
% of consolqrtrly revs 18.0% 16.1% 13.9% 24.0% 18.0% 19.8% 17.0% 19.0% 18.1% 18.5%
YoY (%) 10.4% 46.9% 28.7% 34.1%
QoQ (%) 1.2% -22.2% 148.2% -43.5% 34.7%
Revs -- Horns 1,255 1,418 1,279 1,564 1,278 1,222 2,673 2,500 3,763 5,516
% of consolqrtrly revs 26.0% 26.0% 26.0% 22.1% 24.0% 18.7% 26.0% 17.0% 22.1% 24.8%
YoY (%) 1.9% -13.9% -6.5% 46.6%
QoQ (%) 13.1% -9.8% 22.3% -18.3% -4.4%
Revs -- Others 579 860 841 1,390 639 1,137 1,439 1,776 2,479 3,670
% of consolqrtrly revs 12.0% 15.8% 17.1% 19.7% 12.0% 17.5% 14.0% 15.0% 14.5% 16.5%
YoY (%) 10.4% 32.2% 23.4% 48.0%
QoQ (%) 48.6% -2.3% 65.3% -54.0% 78.0%
Channel-wise break-up
Particulars (Rs. Mn.) Q1FY15 Q2FY15 Q3FY15 Q4FY15 Q1FY16 Q2FY16 H1FY15 H1FY16 FY14 FY15
Revs -- OEMs 4,005 4,528 3,931 6,017 4,261 5,332 8,533 9,593 14,843 18,481
% of consolqrtrly revs 83.0% 83.0% 79.9% 85.2% 80.0% 81.8% 83.0% 81.0% 87.0% 83.0%
YoY (%) 6.4% 17.8% 23.6% 12.4% 24.5%
QoQ (%) 13.1% -13.2% 53.1% -29.2% 25.1%
Revs -- Replacement 820 927 988 1,049 1,065 1,185 1,748 2,250 2,218 3,785
% of consolqrtrly revs 17.0% 17.0% 20.1% 14.8% 20.0% 18.2% 17.0% 19.0% 13.0% 17.0%
YoY (%) 29.9% 27.8% 43.5% 28.7% 70.6%
QoQ (%) 13.1% 6.6% 6.2% 1.5% 11.2%
Geography-wise break-up
Particulars (Rs. Mn.) Q1FY15 Q2FY15 Q3FY15 Q4FY15 Q1FY16 Q2FY16 H1FY15 H1FY16 FY14 FY15
Revs -- India 3,667 4,352 3,989 5,360 4,314 5,516 8,019 9,830 13,820 17,368
% of consolqrtrly revs 76.0% 79.8% 81.1% 75.9% 81.0% 84.6% 78.0% 83.0% 81.0% 78.0%
YoY (%) 17.6% 26.7% 28.3% 22.6% 25.7%
QoQ (%) 18.7% -8.3% 34.4% -19.5% 27.9%
Revs -- International 1,158 1,104 930 1,707 1,012 1,001 2,262 2,013 3,242 4,899
% of consolqrtrly revs 24.0% 20.2% 18.9% 24.2% 19.0% 15.4% 22.0% 17.0% 19.0% 22.0%
YoY (%) -12.6% -9.3% 21.1% -11.0% 51.1%
QoQ (%) -4.7% -15.7% 83.5% -40.7% -1.0%
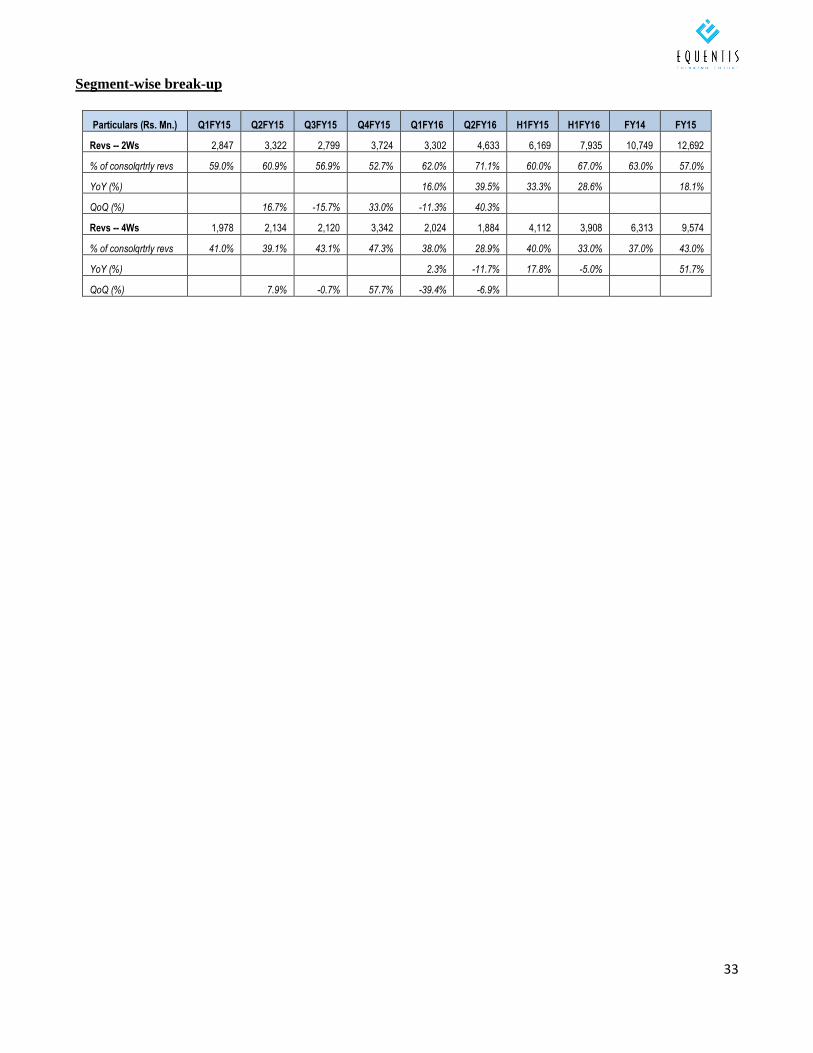
33
Segment-wise break-up
Particulars (Rs. Mn.) Q1FY15 Q2FY15 Q3FY15 Q4FY15 Q1FY16 Q2FY16 H1FY15 H1FY16 FY14 FY15
Revs -- 2Ws 2,847 3,322 2,799 3,724 3,302 4,633 6,169 7,935 10,749 12,692
% of consolqrtrly revs 59.0% 60.9% 56.9% 52.7% 62.0% 71.1% 60.0% 67.0% 63.0% 57.0%
YoY (%) 16.0% 39.5% 33.3% 28.6% 18.1%
QoQ (%) 16.7% -15.7% 33.0% -11.3% 40.3%
Revs -- 4Ws 1,978 2,134 2,120 3,342 2,024 1,884 4,112 3,908 6,313 9,574
% of consolqrtrly revs 41.0% 39.1% 43.1% 47.3% 38.0% 28.9% 40.0% 33.0% 37.0% 43.0%
YoY (%) 2.3% -11.7% 17.8% -5.0% 51.7%
QoQ (%) 7.9% -0.7% 57.7% -39.4% -6.9%
34
DISCLAIMER
Equentis Wealth Advisory Services Private Limited (EWASPL) is registered under the SEBI (Investment Advisers) Regulations, 2013.
“Research & Ranking” is the brand under which the Research Division of EWASPL render’s its Research Services. General Disclaimers: This Research Report (hereinafter called ‘Report’) is prepared and distributed by EWASPL for information purposes only. The recommendations, if any, made herein are expression of views and/or opinions and should not be deemed or construed to be neither advice for the purpose of purchase or sale of any security, derivatives or any other security through EWASPL nor any solicitation or offering of any investment /trading opportunity on behalf of the issuer(s) of the respective security(ies) referred to herein. These information / opinions / views are not meant to serve as a professional investment guide for the readers. No action is solicited based upon the information provided herein. Recipients of this Report should rely on information/data arising out of their own investigations. Readers are advised to seek independent professional advice and arrive at an informed trading/investment decision before executing any trades or making any investments. This Report has been prepared on the basis of publicly available information, internally developed data and other sources believed by EWASPL to be reliable. EWASPL or its directors, employees, affiliates or representatives do not assume any responsibility for, or warrant the accuracy, completeness, adequacy and reliability of such information / opinions / views. While due care has been taken to ensure that the disclosures and opinions given are fair and reasonable, none of the directors, employees, affiliates or representatives of EWASPL shall be liable for any direct, indirect, special, incidental, consequential, punitive or exemplary damages, including lost profits arising in any way whatsoever from the information / opinions / views contained in this Report.
Risks: Trading and investment in securities are subject to market risks. There are no assurances or guarantees that the objectives
of any of trading / investment in securities will be achieved. The trades/ investments referred to herein may not be suitable to all
categories of traders/investors. The names of securities mentioned herein do not in any manner indicate their prospects or returns.
The value of securities referred to herein may be adversely affected by the performance or otherwise of the respective issuer
companies, changes in the market conditions, micro and macro factors and forces affecting capital markets like interest rate risk,
credit risk, liquidity risk and reinvestment risk. Derivative products may also be affected by various risks including but not limited
to counter party risk, market risk, valuation risk, liquidity risk and other risks. Besides the price of the underlying asset, volatility,
tenor and interest rates may affect the pricing of derivatives.
Disclaimers in respect of jurisdiction: The possession, circulation and/or distribution of this Report may be restricted or
regulated in certain jurisdictions by appropriate laws. No action has been or will be taken by EWASPL in any jurisdiction (other than
India), where any action for such purpose(s) is required. Accordingly, this Report shall not be possessed, circulated and/or
distributed in any such country or jurisdiction unless such action is in compliance with all applicable laws and regulations of such
country or jurisdiction. EWASPL requires such recipient to inform himself about and to observe any restrictions at his own expense,
without any liability to EWASPL. Any dispute arising out of this Report shall be subject to the exclusive jurisdiction of the Courts in
Mumbai (India).
Disclosure of Interest: The Research Analyst(s) who have prepared this Report hereby certify that the views /opinions expressed
in this Report are their personal independent views/opinions in respect of the securities and their respective issuers. None of
EWASPL, Research Analyst(s), or their relatives had any known direct /indirect material conflict of interest including any long/short
position(s) in any specific security on which views/opinions have been made in this Report, during its preparation. EWASPL, the
Research Analyst(s), or their relativesdo not have financial interest in the issuer company(ies) of the said securities nor have
ownership of 1% or more individually or jointly till the date of this Report. EWASPL, the Research Analyst(s), or their relatives have
not received any compensation or other benefits from the said issuer company(ies) in last 12 months in any respect whatsoever.
Copyright: The copyright in this Report belongs exclusively to EWASPL. This Report shall only be read by those persons to whom
it has been delivered. No reprinting, reproduction, copying, distribution of this Report in any manner whatsoever, in whole or in
part, is permitted without the prior express written consent of EWASPL.
EWASPL’s activities were never suspended by SEBI or any other authority. Further, there does not exist any material adverse
order/judgments/strictures assessed by any regulatory, government or public authority or agency or any law enforcing agency in
last three years. Further, there does not exist any material enquiry of whatsoever nature instituted or pending against EWASPL as
on the date of this Report.
Important These disclaimers, risks and other disclosures must be read in conjunction with the information / opinions / views of
which they form part of.
CIN: U74999MH2015PTC262812; SEBI Registration No.:INA000003874

![Minda Industries Ltd Product Mix ... Diversified OEM Mix* [FY15] Bajaj 33% HMSI 10% MSIL 9% TVS 8% RE 4% Mahindra 4% ... FY11 –Horns division was not a part of Minda](https://img.pdfslide.net/doc/110x75/5ae273337f8b9ae74a8c7a69/minda-industries-ltd-product-mix-diversified-oem-mix-fy15-bajaj-33-hmsi.jpg)


![Minda Industries Ltd. •[MINDA]€¦ · of the Shareholders and Unsecured Creditors of Minda Industries Limited held on 19 November, 2019, signed by Mr. Raj iv Shankar Dvivedi, Chairman](https://img.pdfslide.net/doc/110x75/5e99efc05d23463bf8297f0b/minda-industries-ltd-aminda-of-the-shareholders-and-unsecured-creditors-of.jpg)