Embed Size (px)
Citation preview
1
MINIMUM RAIL HEIGHT AND DESIGN IMPACT LOAD FOR MASH
TL-4 LONGITUDINAL BARRIERS by N.M. Sheikh, R. P. Bligh, and J. M. Holt
Word Count: 4,880 + (0 table + 8 figures @ 250/ea) = 6,880
Authors:
1. Nauman M. Sheikh, P.E.
Assistant Research Engineer
Texas Transportation Institute, Texas A&M University System, College Station, TX 77845
Phone: 979-845-8955
Fax: 979-845-6107
E-mail: [email protected]
2. Roger P. Bligh, Ph.D., P.E.
Research Engineer
Texas Transportation Institute, Texas A&M University System, College Station, TX 77845
Phone: 979-845-4377
Fax: 979-845-6107
E-mail: [email protected]
3. John M. Holt, P.E.
Bridge Standards Engineer
Texas DOT Bridge Division
125 E. 11th
Street, Austin, TX 78701-2483
Tel. (512) 416-2212
Email: [email protected]
TRB 2012 Annual Meeting Paper revised from original submittal.
2
ABSTRACT
In 2009, Manual for Assessing Safety Hardware (MASH) was adopted as an updated
replacement of National Cooperative Highway Research Program (NCHRP) Report 350. Under
MASH, the impact severity of test level 4 (test 4-12) was increased by 56%. Test vehicle mass
was increased from 17,640 lb to 22,050 lb. Impact speed was increased from 50 mph to 56 mph.
While this is a significant increase in the amount of lateral energy imparted on the barrier, the
54-kip design impact load currently suggested by American Association of State Highway
Transportation Officials (AASHTO) Load and Resistance Factor Design (LRFD) Bridge
Specifications has not been updated to meet MASH test level 4 (TL-4) requirements.
Similarly, the AASHTO LRFD specifications require all TL-4 railings to have a
minimum height of 32 inches. However, due to the increase in test vehicle mass and impact
velocity under MASH, the minimum height for TL-4 railings is expected to be greater than 32
inches. This has also been verified by a recent unsuccessful MASH test 4-21 with a 32-inch tall
New Jersey profile rigid concrete barrier.
Research presented in this paper uses finite element analysis and subsequent crash testing
to determine the minimum rail height for MASH TL-4 impact conditions. The researchers also
determine the appropriate lateral impact design load for use with AASHTO LRFD Bridge
Specifications for the design of TL-4 bridge rails.
TRB 2012 Annual Meeting Paper revised from original submittal.
3
INTRODUCTION
Until recently, longitudinal barriers and bridge rails were required to meet crash and safety
performance criteria specified in National Cooperative Highway Research Program (NCHRP)
Report 350 (1). This report was published in 1993 and defined various full scale vehicle crash
test levels for evaluating highway safety appurtenances. Longitudinal barriers are typically
evaluated using test level 4 (TL-4) impact conditions, which were defined in NCHRP Report 350
as an impact of a 17,640-lb single unit truck (SUT) with the barrier at a nominal speed of 50 mph
and an angle of 15 degrees. The center of mass of the ballast was required to be at a nominal
height of 67 inches. This was designated as test 4-12 and was needed to evaluate rail strength
and vehicle stability under impact from a single unit truck.
To sustain lateral load from a TL-4 impact, longitudinal barriers are typically designed
following the American Association of State Highway and Transportation Officials (AASHTO)
LRFD Bridge Design Specifications (2). In section 13 of these specifications, bridge rails for test
level 4 are required to be designed using impact load of 54 kips following the yield line analysis
procedure described therein.
In 2009, Manual for Assessing Safety Hardware (MASH) was adopted as an updated
successor to NCHRP Report 350 (3). The TL-4 impact conditions for test 4-12 were significantly
modified in MASH. Mass of the impact vehicle was increased from 17,640 lb to 22,050 lb.
Impact speed was increased from 50 mph to 56 mph. Impact angle was maintained at 15 degrees,
and the nominal CG height of the vehicle ballast was reduced 4 inches to 63 inches.
Due to the increase in vehicle’s mass and impact velocity under MASH TL-4 conditions,
the nominal impact severity of test 4-12 increased by approximately 56% compared to NCHRP
Report 350. Impact severity (IS), is typically referred to as the kinetic energy imparted on the
barrier by the lateral component of the vehicle’s velocity. While this is a significant increase in
the amount of lateral energy imparted on the barrier, the 54-kip AASHTO design impact load has
currently not been updated.
The AASHTO LRFD Bridge Design Specifications also require that all TL-4 railings
have a minimum height of 32 inches. Numerous rails have been successfully tested with 32 inch
rail height under NCHRP Report 350 test level 4 conditions. However, due to the increase in test
vehicle mass and impact velocity under MASH, the minimum height for TL-4 railings is
expected to be greater than 32 inches.
Polivka et al. conducted a test with MASH test 4-21 conditions, except that the CG height
of the ballast was 4 inches higher than what was later on specified in the final version of MASH
(4). The SUT impacted a 32-inch tall New Jersey (NJ) profile rigid barrier and rolled over the top
of the barrier. Since the CG height in this test was significantly greater than required by MASH,
Bullard et al. at Texas Transportation Institute (TTI) later on performed the same test with the
ballast CG height of 63 inches, as required for MASH test 4-21 (5). In this test also, the vehicle
rolled over the top of the barrier after impact and was not successfully contained or redirected.
The maximum roll angle was 101 degrees before the vehicle exited the end of the barrier.
Subsequent sliding on the ground enabled the vehicle to right itself as it came to rest. However,
if the test installation length had been longer, the SUT would not have uprighted after the initial
rollover. This test is a clear indication that the currently specified 32-inch minimum rail height
for TL-4 railings needs to be increased.
TRB 2012 Annual Meeting Paper revised from original submittal.
4
OBJECTIVES
The objective of this research was to determine the minimum rail height for TL-4 bridge rails
using the MASH evaluation criteria; and to determine the appropriate lateral design impact load
for use with AAHSTO LRFD yield line strength analysis of TL-4 bridge rails and longitudinal
barriers.
RESEARCH APPROACH
To accomplish these objectives, the researchers used finite element (FE) analysis to simulate
impacts of single unit truck with a rigid barrier under MASH test level 4 impact conditions. Rail
height was parametrically varied to arrive at the suggested minimum rail height. Results of the
FE analysis were used to evaluate the effect of rail height variation on vehicle kinematics and
stability. A crash test was subsequently performed to verify results of the FE analysis. While
performing the FE simulations, the researchers determined the lateral impact load resulting from
each of the height variation. This information was used to suggest a revised design impact load
for MASH TL-4 bridge rails.
FINITE ELEMENT ANALYSIS
Finite element analysis was performed using LS-DYNA, which is a commercial FE software
commonly used for crashworthiness analysis (6). The rigid concrete barriers were modeled with
rigid material representation in all of the analyses. This was done because no significant failure
or deflection of the barrier was expected due to the vehicle impact. The single unit truck model
used in the analyses was primarily developed by National Crash Analysis Center and later on
revised by Battelle (7). However this model was significantly modified by the researchers to
match some of the key vehicle characteristics of the test vehicle used in a validation test as
described below.
Vehicle Model Validation
MASH specifies a maximum wheel base of 240 inches for the SUT used for TL-4 testing. Higher
wheel base tends to stabilize the vehicle by spreading its weight farther from the center of gravity
(CG). Since this research was being performed to determine the minimum rail height for TL-4
bridge rails, it was important to perform FE analyses with a wheel base that represented the
lower spectrum of what is available in the current vehicle market. This would have allowed
instigating greatest vehicular instability when impacting a bridge rail.
Researchers found that single unit trucks with wheel base closer to 190 inches were
among the shortest available in the market. The finite element model of the SUT has a wheel
base of 208 inches, which meets the MASH specifications of maximum wheel base, but may not
be most critical in terms of vehicular instability during impact.
The recent MASH crash test with the 32-inch NJ profile barrier (described earlier) was
performed with a shorter wheel base of 188 inches, which was closer to what the researchers
intended to use to instigate greatest vehicular instability. The researchers had access to the
damaged vehicle from this test, and thus using the information available from pre-test vehicle
measurements and the damaged test vehicle, the researchers made several changes to the FE
model of the SUT. A comprehensive detail of the changes made to the SUT model is outside the
scope of this paper, however major changes included reducing the wheel base, rear overhang,
gap between the cab and the cargo box, and the cargo box height. Additional changes were
made to improve chassis deformation and the connection between the cargo box and the chassis.
TRB 2012 Annual Meeting Paper revised from original submittal.
5
0.125 s
0.122 s
0.365 s
0.366 s
0.605 s
0.613 s
0.935 s
0.930 s
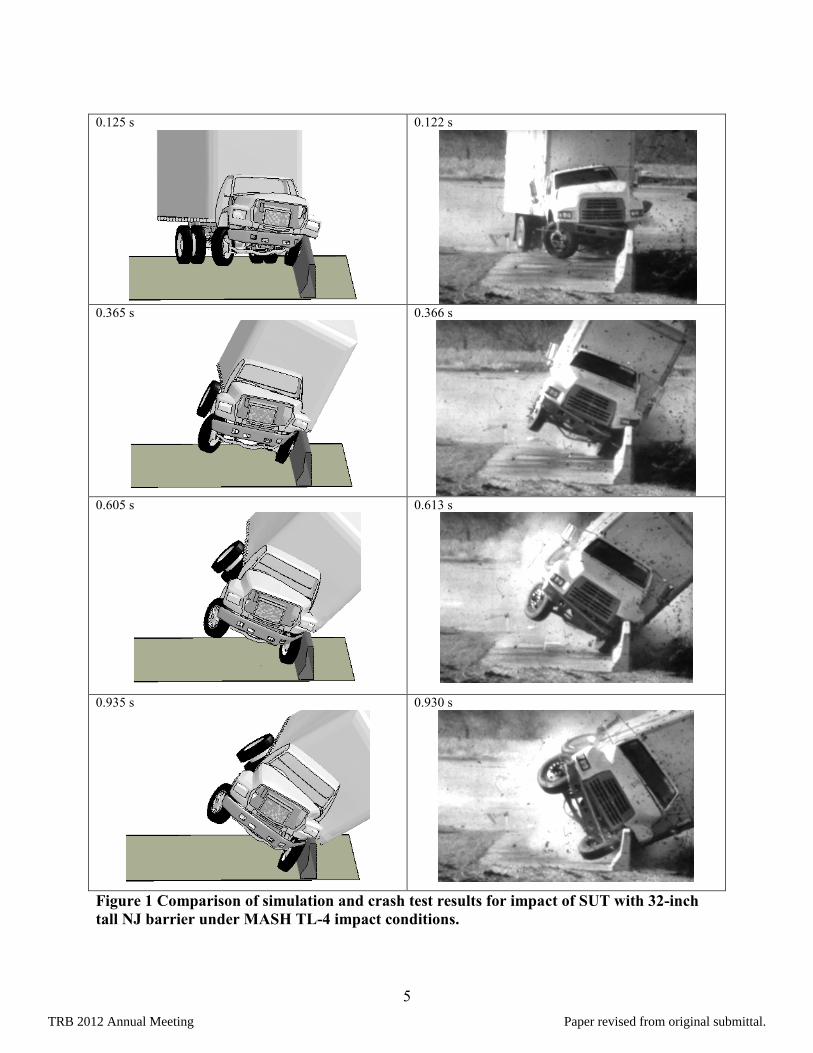
Figure 1 Comparison of simulation and crash test results for impact of SUT with 32-inch
tall NJ barrier under MASH TL-4 impact conditions.
TRB 2012 Annual Meeting Paper revised from original submittal.
6
The ballast shape and size, and its attachment to the vehicle were also modified to match the
state of practice at the TTI testing lab, which performed the test with the 32-inch NJ barrier.
After making these changes, the researchers performed an impact simulation of the modified
SUT with the 32-inch NJ profile barrier using MASH TL-4 impact conditions. A comparison of
the simulation and crash test results is presented in Figure 1.
The simulation model sufficiently matched the vehicle’s pitch and roll characteristics
observed in the crash test. While both simulation and test vehicles rolled over the top of the
barrier, the vehicle rolled over faster after 0.6 seconds in the test compared to the simulation
results. Thus there were some differences in the test and simulation results closer to the end of
the impact event. A marginal kinematic stability of the vehicle in simulation would have implied
greater instability in a crash test. Keeping this limitation in mind, the researchers proceeded with
further analysis using the SUT vehicle model.
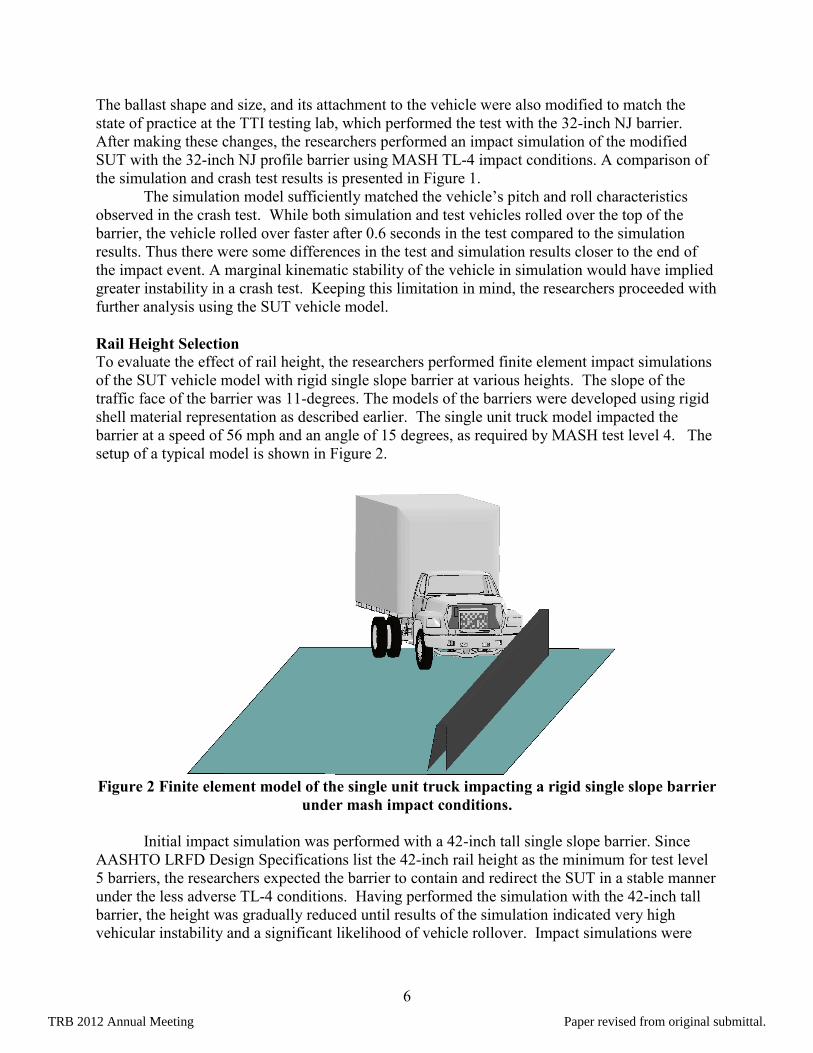
Rail Height Selection
To evaluate the effect of rail height, the researchers performed finite element impact simulations
of the SUT vehicle model with rigid single slope barrier at various heights. The slope of the
traffic face of the barrier was 11-degrees. The models of the barriers were developed using rigid
shell material representation as described earlier. The single unit truck model impacted the
barrier at a speed of 56 mph and an angle of 15 degrees, as required by MASH test level 4. The
setup of a typical model is shown in Figure 2.
Figure 2 Finite element model of the single unit truck impacting a rigid single slope barrier
under mash impact conditions.
Initial impact simulation was performed with a 42-inch tall single slope barrier. Since
AASHTO LRFD Design Specifications list the 42-inch rail height as the minimum for test level
5 barriers, the researchers expected the barrier to contain and redirect the SUT in a stable manner
under the less adverse TL-4 conditions. Having performed the simulation with the 42-inch tall
barrier, the height was gradually reduced until results of the simulation indicated very high
vehicular instability and a significant likelihood of vehicle rollover. Impact simulations were
TRB 2012 Annual Meeting Paper revised from original submittal.
7
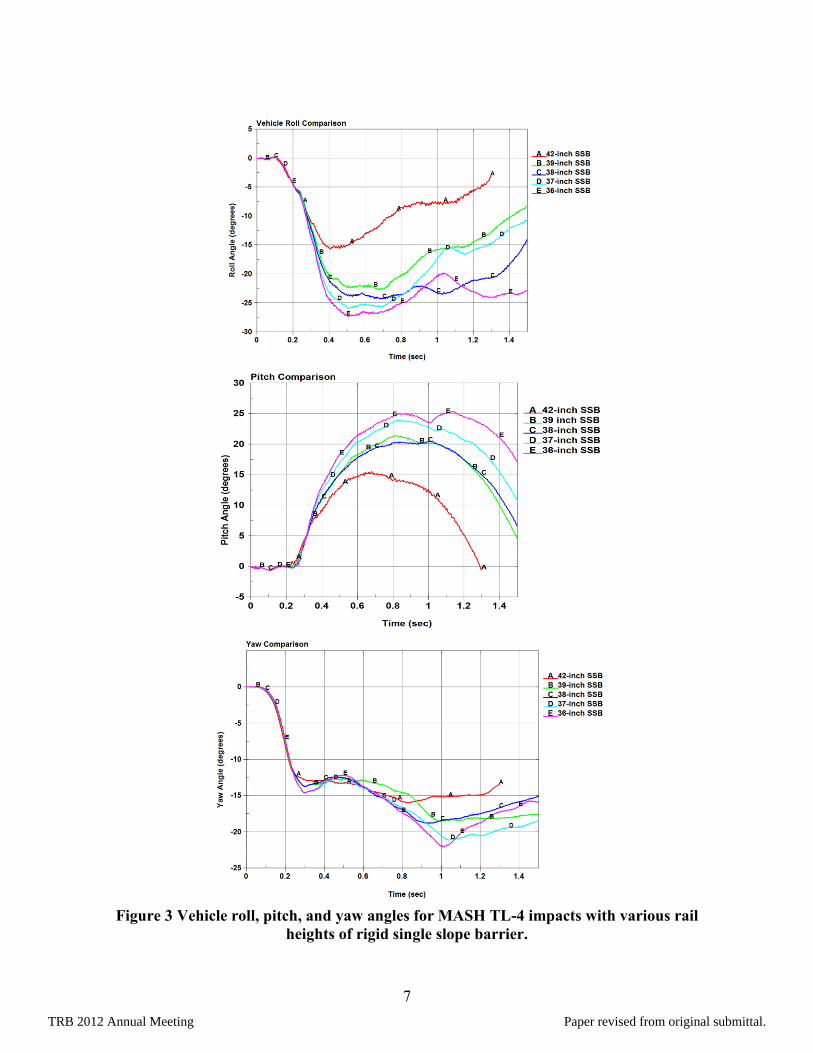
Figure 3 Vehicle roll, pitch, and yaw angles for MASH TL-4 impacts with various rail
heights of rigid single slope barrier.
TRB 2012 Annual Meeting Paper revised from original submittal.
8
performed with barrier heights of 42, 39, 38, 37, and 36 inches. Vehicle roll, pitch, and yaw
angles were determined as a function of time near the CG of the ballast for each of the
simulations. A comparison of these angles is shown in Figure 3.
As expected, the 42-inch rail height resulted in greatest vehicular stability. Reducing the
height to 39 inches increased the roll and pitch of the SUT, however the vehicle was contained
and redirected in a fairly stable manner.
Reducing the rail height further increased the instability of the vehicle. At 36 inches, the
maximum roll and pitch at the CG of the ballast were approximately 27 and 25 degrees,
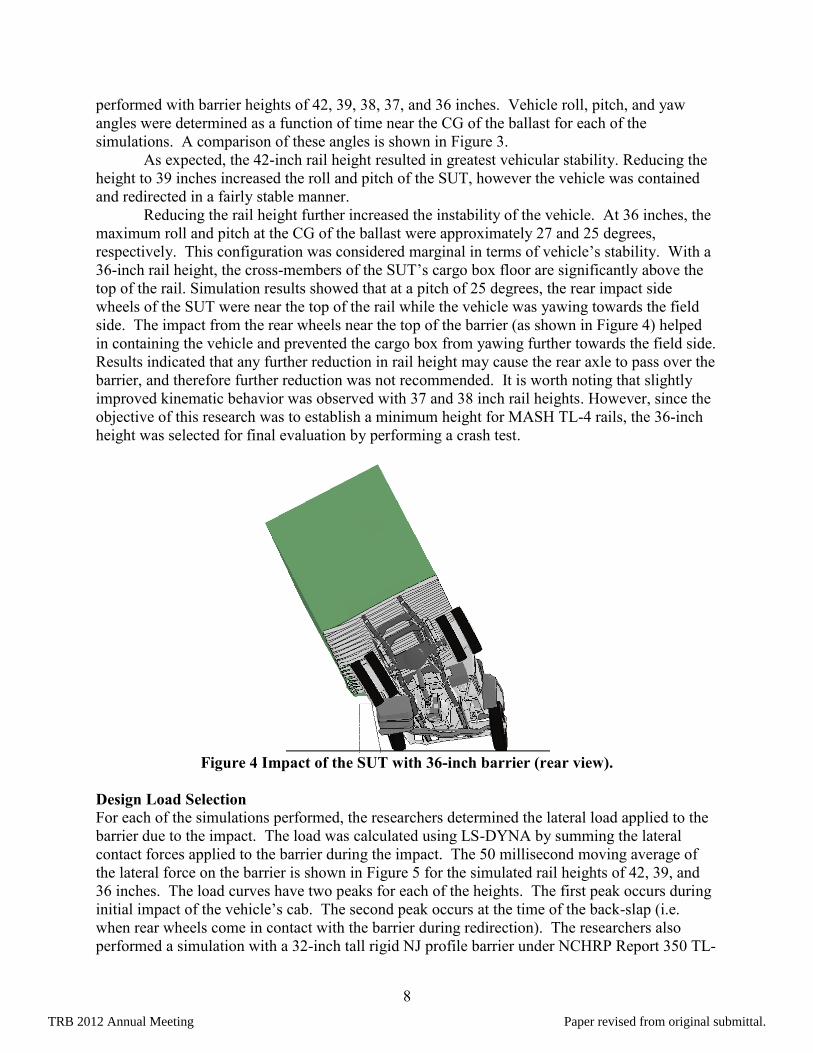
respectively. This configuration was considered marginal in terms of vehicle’s stability. With a
36-inch rail height, the cross-members of the SUT’s cargo box floor are significantly above the
top of the rail. Simulation results showed that at a pitch of 25 degrees, the rear impact side
wheels of the SUT were near the top of the rail while the vehicle was yawing towards the field
side. The impact from the rear wheels near the top of the barrier (as shown in Figure 4) helped
in containing the vehicle and prevented the cargo box from yawing further towards the field side.
Results indicated that any further reduction in rail height may cause the rear axle to pass over the
barrier, and therefore further reduction was not recommended. It is worth noting that slightly
improved kinematic behavior was observed with 37 and 38 inch rail heights. However, since the
objective of this research was to establish a minimum height for MASH TL-4 rails, the 36-inch
height was selected for final evaluation by performing a crash test.
Figure 4 Impact of the SUT with 36-inch barrier (rear view).
Design Load Selection
For each of the simulations performed, the researchers determined the lateral load applied to the
barrier due to the impact. The load was calculated using LS-DYNA by summing the lateral
contact forces applied to the barrier during the impact. The 50 millisecond moving average of
the lateral force on the barrier is shown in Figure 5 for the simulated rail heights of 42, 39, and
36 inches. The load curves have two peaks for each of the heights. The first peak occurs during
initial impact of the vehicle’s cab. The second peak occurs at the time of the back-slap (i.e.
when rear wheels come in contact with the barrier during redirection). The researchers also
performed a simulation with a 32-inch tall rigid NJ profile barrier under NCHRP Report 350 TL-
TRB 2012 Annual Meeting Paper revised from original submittal.
9
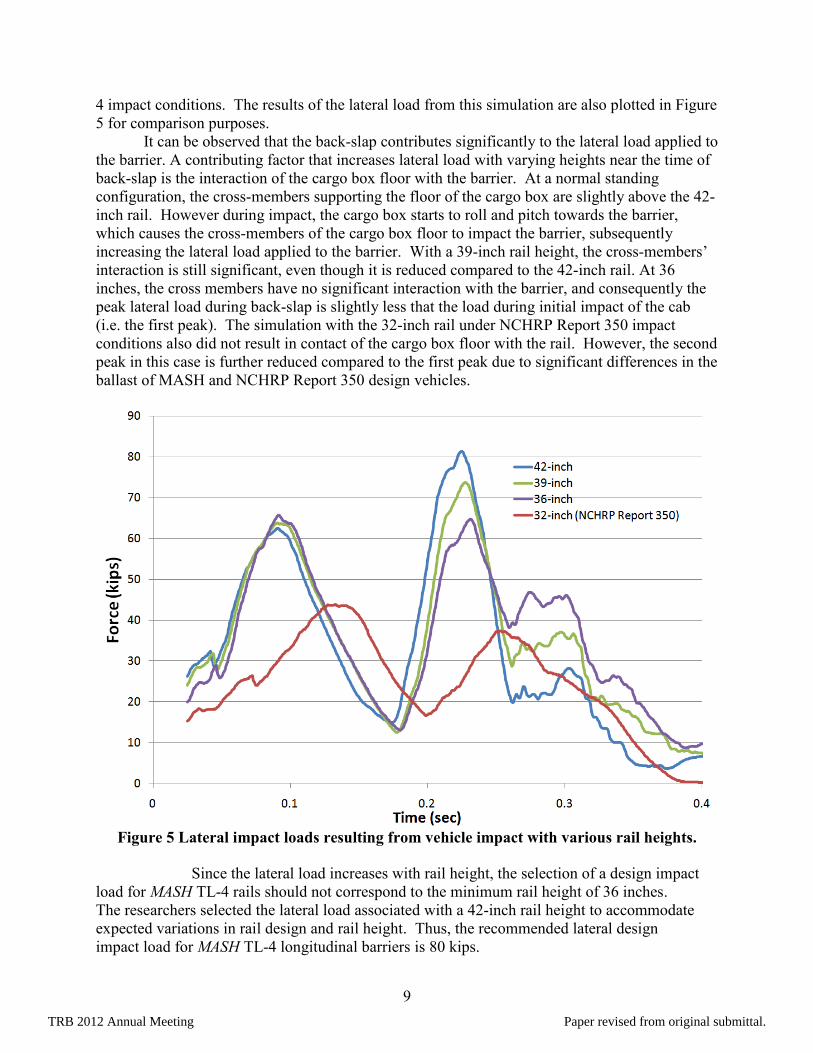
4 impact conditions. The results of the lateral load from this simulation are also plotted in Figure
5 for comparison purposes.
It can be observed that the back-slap contributes significantly to the lateral load applied to
the barrier. A contributing factor that increases lateral load with varying heights near the time of
back-slap is the interaction of the cargo box floor with the barrier. At a normal standing
configuration, the cross-members supporting the floor of the cargo box are slightly above the 42-
inch rail. However during impact, the cargo box starts to roll and pitch towards the barrier,
which causes the cross-members of the cargo box floor to impact the barrier, subsequently
increasing the lateral load applied to the barrier. With a 39-inch rail height, the cross-members’
interaction is still significant, even though it is reduced compared to the 42-inch rail. At 36
inches, the cross members have no significant interaction with the barrier, and consequently the
peak lateral load during back-slap is slightly less that the load during initial impact of the cab
(i.e. the first peak). The simulation with the 32-inch rail under NCHRP Report 350 impact
conditions also did not result in contact of the cargo box floor with the rail. However, the second
peak in this case is further reduced compared to the first peak due to significant differences in the
ballast of MASH and NCHRP Report 350 design vehicles.
Figure 5 Lateral impact loads resulting from vehicle impact with various rail heights.
Since the lateral load increases with rail height, the selection of a design impact
load for MASH TL-4 rails should not correspond to the minimum rail height of 36 inches.
The researchers selected the lateral load associated with a 42-inch rail height to accommodate
expected variations in rail design and rail height. Thus, the recommended lateral design
impact load for MASH TL-4 longitudinal barriers is 80 kips.
TRB 2012 Annual Meeting Paper revised from original submittal.
10
TESTING
Having selected the minimum rail height and impact design load, the researchers looked at
existing bridge rails meeting these requirements. Texas Department of Transportation (TxDOT)
uses a 36-inch tall single slope rigid concrete bridge rail. The researchers performed the
AASHTO LRFD yield line strength analysis of the TxDOT rail and determined that it has a
maximum impact load capacity of 80 kips, which meets the desired 74-kip capacity needed for
MASH TL-4 impacts. A MASH test 4-12 was performed with this rail using a single unit truck
with a shorter wheel base of 187.5 inches to instigate maximum instability. Details of the test
article and crash test results are presented next.
Test Article
The test article was comprised of a 36-inch tall single slope rigid concrete barrier. For a complete
evaluation of the vehicle’s stability during impact, the researchers added extra length to the
bridge rail. The total length of the barrier was 150 ft. Of this, initial 78 ft were cast in place over
an 8-inch thick concrete bridge deck for strength evaluation for the rail. The remaining 72 ft
were cast over a 12-inch thick and 30-inch wide moment slab. This portion of the rail was built
to allow complete evaluation of vehicle’s stability as it redirects after impact.
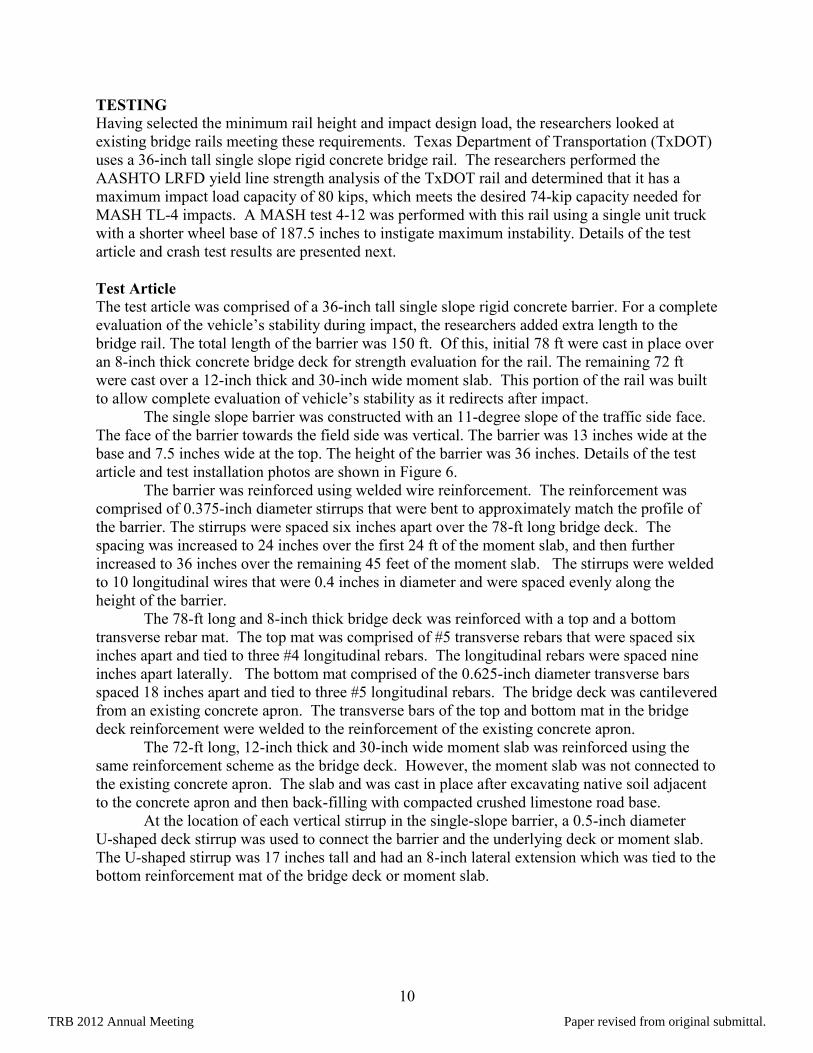
The single slope barrier was constructed with an 11-degree slope of the traffic side face.
The face of the barrier towards the field side was vertical. The barrier was 13 inches wide at the
base and 7.5 inches wide at the top. The height of the barrier was 36 inches. Details of the test
article and test installation photos are shown in Figure 6.
The barrier was reinforced using welded wire reinforcement. The reinforcement was
comprised of 0.375-inch diameter stirrups that were bent to approximately match the profile of
the barrier. The stirrups were spaced six inches apart over the 78-ft long bridge deck. The
spacing was increased to 24 inches over the first 24 ft of the moment slab, and then further
increased to 36 inches over the remaining 45 feet of the moment slab. The stirrups were welded
to 10 longitudinal wires that were 0.4 inches in diameter and were spaced evenly along the
height of the barrier.
The 78-ft long and 8-inch thick bridge deck was reinforced with a top and a bottom
transverse rebar mat. The top mat was comprised of #5 transverse rebars that were spaced six
inches apart and tied to three #4 longitudinal rebars. The longitudinal rebars were spaced nine
inches apart laterally. The bottom mat comprised of the 0.625-inch diameter transverse bars
spaced 18 inches apart and tied to three #5 longitudinal rebars. The bridge deck was cantilevered
from an existing concrete apron. The transverse bars of the top and bottom mat in the bridge
deck reinforcement were welded to the reinforcement of the existing concrete apron.
The 72-ft long, 12-inch thick and 30-inch wide moment slab was reinforced using the
same reinforcement scheme as the bridge deck. However, the moment slab was not connected to
the existing concrete apron. The slab and was cast in place after excavating native soil adjacent
to the concrete apron and then back-filling with compacted crushed limestone road base.
At the location of each vertical stirrup in the single-slope barrier, a 0.5-inch diameter
U-shaped deck stirrup was used to connect the barrier and the underlying deck or moment slab.
The U-shaped stirrup was 17 inches tall and had an 8-inch lateral extension which was tied to the
bottom reinforcement mat of the bridge deck or moment slab.
TRB 2012 Annual Meeting Paper revised from original submittal.
11
Figure 6 Details of the test article and test installation photos.
TRB 2012 Annual Meeting Paper revised from original submittal.
12
Test Description
A 1991 International 4700 single-unit box-van truck with test inertia weight of 22,150 lb and
gross static weight of 22,150 lb was used in the test. The vehicle impacted the barrier at a speed
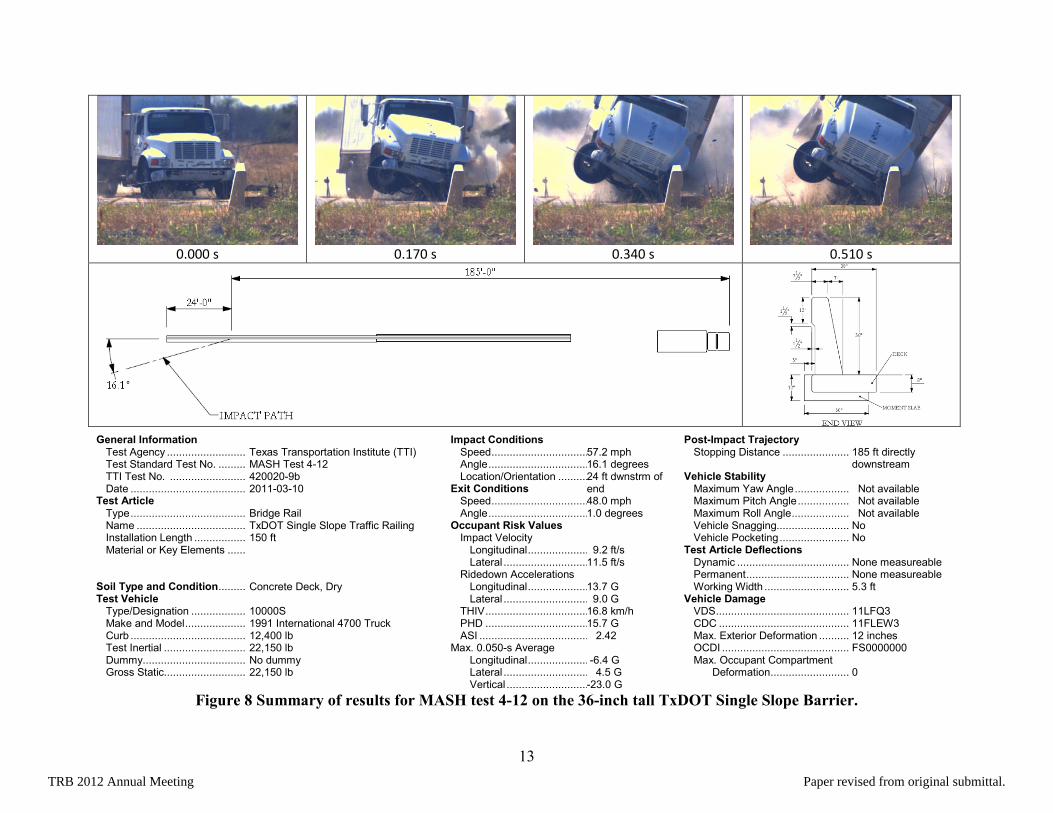
of 57.2 mph, 24 ft downstream of the upstream end at an impact angle of 16.1 degrees.
At 0.015 s after contact, the driver’s side front tire and wheel lost contact with the ground
surface. The vehicle began to redirect at 0.029 s, and the tire and wheel on the front passenger
side lost contact with the ground surface at 0.091 s. At 0.230 s, the rear passenger side tire and
wheel lost contact with the ground surface. The rear of the box contacted the barrier at 0.244 s.
At 0.264 s, the vehicle began traveling parallel with the barrier at a speed of 49.1 mph. The
vehicle lost contact with the barrier and was traveling at an exit speed and angle of 48.0 mph and
1.0 degrees, respectively. The vehicle continued to ride along the traffic face of the barrier and
rode off the end. At 3.3 s after impact, the brakes on the vehicle were applied and the vehicle
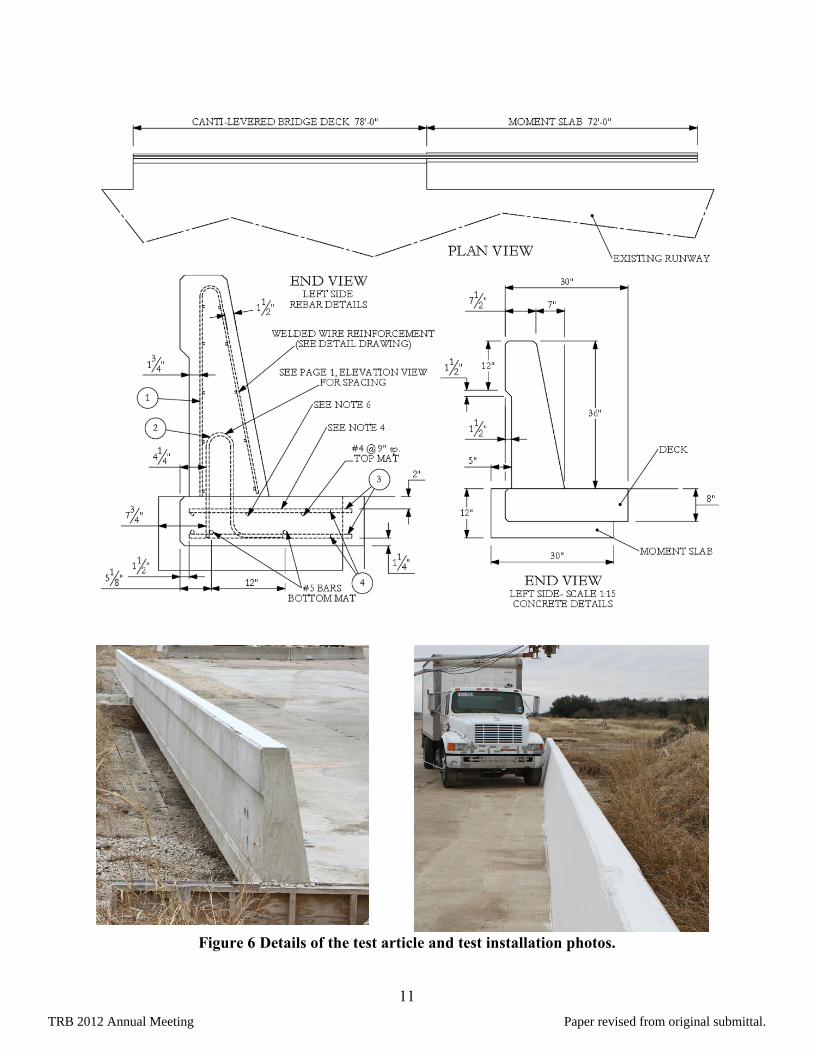
subsequently came to rest 185 feet downstream of the impact (see Figure 7 and 8).
Figure 7 Vehicle and barrier after test.
Test Results
There was no significant damage to the barrier as shown in Figure 7. Tire marks and gouges
were evident on the traffic face of the barrier, but the damage was cosmetic in nature and the
barrier did not need repairs. The barrier did not have any measurable static or dynamic deflection
due to the impact.
TRB 2012 Annual Meeting Paper revised from original submittal.
13
0.000 s
0.170 s
0.340 s
0.510 s
General Information Test Agency .............................. Test Standard Test No. ............. TTI Test No. ............................. Date .......................................... Test Article Type .......................................... Name ........................................ Installation Length ..................... Material or Key Elements .......... Soil Type and Condition ............. Test Vehicle Type/Designation ...................... Make and Model ........................
Curb .......................................... Test Inertial ............................... Dummy...................................... Gross Static...............................
Texas Transportation Institute (TTI) MASH Test 4-12 420020-9b 2011-03-10 Bridge Rail TxDOT Single Slope Traffic Railing 150 ft Concrete Deck, Dry 10000S 1991 International 4700 Truck 12,400 lb 22,150 lb No dummy 22,150 lb
Impact Conditions Speed ........................................ Angle ......................................... Location/Orientation .................. Exit Conditions Speed ........................................ Angle ......................................... Occupant Risk Values Impact Velocity Longitudinal ............................ Lateral ....................................
Ridedown Accelerations Longitudinal ............................ Lateral .................................... THIV .......................................... PHD .......................................... ASI ............................................ Max. 0.050-s Average Longitudinal ............................ Lateral .................................... Vertical ...................................
57.2 mph 16.1 degrees 24 ft dwnstrm of end 48.0 mph 1.0 degrees 9.2 ft/s 11.5 ft/s 13.7 G 9.0 G 16.8 km/h 15.7 G 2.42 -6.4 G 4.5 G -23.0 G
Post-Impact Trajectory Stopping Distance ........................... Vehicle Stability
Maximum Yaw Angle ....................... Maximum Pitch Angle ...................... Maximum Roll Angle ........................ Vehicle Snagging............................. Vehicle Pocketing ............................ Test Article Deflections Dynamic .......................................... Permanent ....................................... Working Width ................................. Vehicle Damage VDS ................................................. CDC ................................................ Max. Exterior Deformation ............... OCDI ............................................... Max. Occupant Compartment Deformation ...............................
185 ft directly downstream Not available Not available Not available No No None measureable None measureable 5.3 ft 11LFQ3 11FLEW3 12 inches FS0000000 0
Figure 8 Summary of results for MASH test 4-12 on the 36-inch tall TxDOT Single Slope Barrier.
TRB 2012 Annual Meeting Paper revised from original submittal.
14
The vehicle sustained significant damage to the front left side; however no notable
occupant compartment deformation occurred. The vehicle remained upright during and after the
impact. Data from an accelerometer located at the vehicle center of gravity were digitized for
evaluation of occupant risk. All risk factors such as occupant impact velocity (OIV), ride-down
acceleration (RA), etc were within acceptable limits of MASH. These data and other pertinent
information from the test are summarized in Figure 8.
Based on the results of the crash test, the 36-inch tall TxDOT single slope barrier was
considered to have performed acceptable for MASH test 4-21.
SUMMARY AND CONCLUSIONS
Due to an increase in the impact speed and vehicle mass of MASH test 4-21, the impact severity
of test level 4 has increased by 56% compared to NCHRP Report 350. AASHTO LRFD Bridge
Specifications require test level 4 barriers to have a minimum height of 32 inches and be
designed using a 54-kip design impact load. These requirements however are based on NCHRP
Report 350 test level 4 impact conditions. Due to the more severe MASH TL-4 criteria, there is a
need to update the AASHTO guidance on minimum rail height and design impact load.
Research presented in this paper used parametric finite element analysis to evaluate the
kinematic stability and the likelihood of successful containment and redirection of a 22,050-lb
single unit truck. Impact simulations were performed with the vehicle impacting rigid single
slope barriers of various heights under MASH test 4-21 impact conditions. The height of the
barrier was reduced starting at a 42-inch rail height. As the rail height decreased, the vehicle
instability increased. Results of the simulation with a 36-inch rail height showed significant
instability of the vehicle and the performance of the barrier was considered marginal. Simulation
results showed that due to a high pitch of the vehicle, the rear impact side wheels of the SUT
were near the top of the rail while the vehicle was yawing towards the field side. The impact
from the rear wheels near the top of the barrier helped in containing the vehicle and prevented
the cargo box from yawing further towards the field side. Any further reduction in rail height
was likely to cause the rear axle to pass over the barrier. Thus a minimum rail height of 36 inches
was selected for full scale crash testing.
A crash test was performed with a 36-inch tall rigid concrete single slope barrier
commonly used by TxDOT. This rail has an impact design strength of 80 kips. The vehicle was
successfully contained and redirected under MASH test 4-21 impact conditions. There was no
significant rail damage observed due to the impact. The phenomenon of rear wheels pitching up
closer to the top of the rail as the vehicle yawed during redirection was also observed in the crash
test, and therefore 36 inches is considered as the minimum rail height for MASH TL-4 impacts
conditions.
To determine the appropriate design impact load for MASH test level 4, the researchers
used LS-DYNA simulations to calculate lateral impact loads resulting from simulated impacts of
the vehicle with rigid single slope barrier of various rail heights. Simulation results indicated that
the lateral loads for MASH TL-4 were significantly greater than NCHRP Report 350. Due to the
higher rail height now needed under MASH, the lateral loads were also increased by the
interaction of the floor of the cargo box with the top of the rail. While the 36-inch tall rail, which
is being recommended as the minimum rail height for MASH TL-4, exhibited reduced lateral
impact load, the researchers have based their recommendation of the lateral design impact load
using the 42-inch rail height. This has been done to accommodate a broader range of MASH TL-
4 rail designs and heights. The recommended design load is thus 80 kips for MASH TL-4 rails.
TRB 2012 Annual Meeting Paper revised from original submittal.
15
The safety shape profiles (F-shape and NJ profile) are known to instigate greater climb
and instability in the small passenger car and pickup truck vehicles due to the tires riding the toe
of these barriers. However due to a significantly greater mass and wheel radius of the 22,050-lb
MASH TL-4 vehicle, the effect of the toe on the initial stability and climb of the vehicle is
insignificant. Previous testing with the 32-inch NJ barrier under MASH TL-4 conditions did not
reveal any climb or instability that could be attributed to the safety profile of the barrier. While
the simulation analyses and the crash test performed in this research used the single slope barrier
profile, the minimum rail height and design impact load recommendations are applicable to all
other barrier profiles.
REFERENCES
1. H. E. Ross, D. L. Sicking, R. A. Zimmer, and J. D. Michie, Recommended Procedures
for the Safety Performance Evaluation of Highway Features, National Cooperative
Highway Research Program Report 350, Transportation Research Board, National
Research Council, Washington, D.C., 1993.
2. American Society of State Highway and Transportation Officials. AASHTO LRFD Bridge
Design Specifications. Third Edition. Washington, D.C., 2004.
3. American Association of State Highway and Transportation Officials, Manual for
Assessing Safety Hardware, AASHTO Subcommittee on Bridges and Structures,
Washington, D.C., 2009.
4. K. A. Polivka, R. K. Faller, D. L. Sicking, J. R. Rohde, B. W. Bielenberg, J. D. Reid, and
B. A. Coon, Performance Evaluation of the Permanent New Jersey Safety Shape Barrier
- Update to NCHRP 350 Test No. 4-12 (2214NJ-2), Final Report to the National
Cooperative Highway Research Program (NCHRP), Transportation Research Board,
Transportation Research Report No. TRP-03-178-06, Midwest Roadside Safety Facility,
University of Nebraska-Lincoln, Lincoln, Nebraska, 2006.
5. D. L. Bullard, R. P. Bligh, and W. L. Menges, Appendix A: MASH-08 TL-4 Testing and
Evaluation of the New Jersey Safety Shape Bridge Rail. NCHRP Project 22-14, College
Station, Texas, 2008.
6. J. O. Hallquist. LS-DYNA® Theory Manual, Livermore Software Technology
Corporation, Livermore, California, 2006.
7. Methodology for Validation and Documentation of Vehicle Finite Element Crash Models
for Roadside Hardware Applications, National Transportation Research Center, Inc.,
http://single-unit-truck.model.ntrci.org/description/
DISCLAIMER The contents of this paper reflect the views of the authors who are solely responsible for the facts
and accuracy of the data, and the opinions, findings and conclusions presented herein. The
contents do not necessarily reflect the official views or policies of the Texas Transportation
Institute (TTI), the Texas Department of Transportation (TxDOT), or the Federal Highway
Administration (FHWA). This report does not constitute a standard, specification, or regulation.
TRB 2012 Annual Meeting Paper revised from original submittal.
16
ACKNOWLEDGMENT This paper presents details of research conducted under a cooperative program between the
Texas Transportation Institute (TTI), the Texas Department of Transportation (TxDOT), and the
U.S. Department of Transportation, Federal Highway Administration (FHWA).
TRB 2012 Annual Meeting Paper revised from original submittal.


![WELCOME! [] · • Supplementary full-height steel picket guards are proposed, bringing the protected guard height to approximately 5m over the rail corridor • Handrail is proposed](https://img.pdfslide.net/doc/110x75/5f77759314e543592b1bd9b2/welcome-a-supplementary-full-height-steel-picket-guards-are-proposed-bringing.jpg)