Embed Size (px)
Citation preview

DI
SC
US
SI
ON
P
AP
ER
S
ER
IE
S
Forschungsinstitut zur Zukunft der ArbeitInstitute for the Study of Labor
Minimum Wage: Does It Improve Welfare in Thailand?
IZA DP No. 7911
January 2014
Ximena Del CarpioJulián MessinaAnna Sanz-de-Galdeano

Minimum Wage:
Does It Improve Welfare in Thailand?
Ximena Del Carpio World Bank
Julián Messina
World Bank and IZA
Anna Sanz-de-Galdeano CRES-UPF, MOVE, World Bank and IZA
Discussion Paper No. 7911 January 2014
IZA
P.O. Box 7240 53072 Bonn
Germany
Phone: +49-228-3894-0 Fax: +49-228-3894-180
E-mail: [email protected]
Any opinions expressed here are those of the author(s) and not those of IZA. Research published in this series may include views on policy, but the institute itself takes no institutional policy positions. The IZA research network is committed to the IZA Guiding Principles of Research Integrity. The Institute for the Study of Labor (IZA) in Bonn is a local and virtual international research center and a place of communication between science, politics and business. IZA is an independent nonprofit organization supported by Deutsche Post Foundation. The center is associated with the University of Bonn and offers a stimulating research environment through its international network, workshops and conferences, data service, project support, research visits and doctoral program. IZA engages in (i) original and internationally competitive research in all fields of labor economics, (ii) development of policy concepts, and (iii) dissemination of research results and concepts to the interested public. IZA Discussion Papers often represent preliminary work and are circulated to encourage discussion. Citation of such a paper should account for its provisional character. A revised version may be available directly from the author.

IZA Discussion Paper No. 7911 January 2014
ABSTRACT
Minimum Wage: Does It Improve Welfare in Thailand?1 We study the causal impact of the minimum wage on employment and welfare in Thailand using a difference-in-difference approach that relies on exogenous policy variation in minimum wages across provinces. We find that minimum-wage increases have small disemployment effects on female, elderly, and less-educated workers and large positive effects on the wages of prime-age male workers. As such, increases in the minimum wage are associated with increases in household consumption per capita in general, but the consumption increase is greatest among those households around the median of the distribution. In fact, rises in the minimum wage increased inequality in consumption per capita within the bottom half of the distribution. JEL Classification: J31, D31 Keywords: minimum wage, household consumption, poverty, employment,
uncovered sector Corresponding author: Anna Sanz-de-Galdeano Departament d’Economia i d’Història Econòmica Office B3-194, Building B, Campus Bellaterra Universitat Autònoma de Barcelona Bellaterra 08193, Barcelona Spain E-mail: [email protected]
1 We would like to thank Kirida Bhaopichitr, John Giles, Lars Sondergaard, and seminar participants at the World Bank in Thailand for helpful comments. The authors would like to thank the National Economic and Social Development Board of Thailand and World Bank colleagues for providing critical data inputs. This research was sponsored by the World Bank under contract 7800772 and the Development Research Funds. The opinions expressed in this article do not necessarily reflect the views of the World Bank. The authors declare that they have no relevant or material financial interests that relate to the research described in this paper. Financial support from the Government of Catalonia (contract 2009SGR189 and the XREPP) and the Government of Spain (through the ECO2011-28822 Grant) is gratefully acknowledged.

2
1. Introduction
The minimum wage constitutes a key labor market policy instrument in both developed and developing
countries. In developing countries, where tax bases are limited and hence resources for other labor market
policies (e.g., active labor market policies) are scarce, minimum wages are used even more often with an
objective of lifting the fortunes of low-skilled workers and poor individuals. But do minimum-wage increases
actually help them escape poverty?
A large literature examining the impact of the minimum wage on labor market outcomes has been
extensively surveyed by Card and Krueger (1997), Flinn (2010), and Neumark and Wascher (2010). Although
there is broad consensus on the positive impact of the minimum wage on average wages, its effects on
employment are still heatedly debated. Some authors argue that the standard textbook analysis of the
minimum wage, which predicts disemployment effects, is at odds with the evidence, which shows few signs
of increased joblessness after minimum-wage increases in developed countries (Card and Krueger 1997;
Dickens, Machin. and Manning 1999). Instead, they interpret the empirical evidence as supportive of
monopsonistic behavior in the labor market, whereby minimum-wage raises help to compress the wage
distribution at the bottom without reducing employment. Other authors, including Neumark and Wascher
(2010), argue that the literature tilts in favor of those studies that find a negative employment effect.
The study of possible disemployment effects of the minimum wage in developing countries is
complicated by those countries’ large informal sectors and frequent noncompliance with labor policy.2
Considerable evidence gathered in Latin America yields nonuniform conclusions (as surveyed by
Cunningham 2007). Large negative effects of the minimum wage increases on formal employment are found
in Honduras (Gindling and Terrell 2009), while effects on employment are small in Costa Rica (Gindling and
Terrell 2007) and Colombia (Maloney and Núñez 2003) and not statistically significant in Mexico (Bell 1997)
and Brazil (Lemos 2009). Much less is known about other developing regions such as Southeast Asia, with
the notable exception there of Indonesia, for which various studies have found small negative employment
effects after minimum-wage spikes (Rama 2001; Alatas and Cameron 2008; Del Carpio, Nguyen, and Wang
2011). However, despite decreases in formal employment, average employment rates did not change in either
Indonesia (Comolla and Mello 2011) or Vietnam (Nguyen 2010). More recently, Magruder (2013) has argued
that previous empirical studies evaluating the role of the minimum wage in Indonesia may have been
contaminated by methodological (namely, endogeneity) biases, thus making the results less valid. He uses a
difference-in-special-differences estimator, which arguably reduces the likelihood of endogeneity biases, and
2 The paper uses informal and uncovered sectors interchangeably, to denote sectors in which workers are either not
legally subject to the minimum wage law, or being legally subject the law is not enforced.

3
finds that minimum-wage increases boosted employment and wages in the economic sectors covered by the
policy.
The academic focus on how minimum-wage increases affect employment contrasts with policy
makers’ emphasis on how minimum-wage legislation would affect income distribution.3 In fact, the literature
studying the impact of the minimum wage on poverty or on income or consumption inequality is much
scarcer than the literature studying its impact on employment,4 and most of it focuses on developed
economies (Terrell and Almeida, 2008). Interestingly, most studies find that disemployment effects tend to
concentrate among the low-skilled, thereby casting doubt on the effectiveness of using minimum-wage policy
as a lever to reduce poverty. Moreover, minimum-wage workers are often not the most disadvantaged in
developing countries; on the contrary, formal minimum-wage workers are protected by labor policy, while
workers in the informal sector likely earn below the minimum wage. Thus, the minimum wage may not be an
effective tool to reduce inequality or poverty in this context.
This paper conducts a fairly comprehensive examination of the impact of changes to the minimum-
wage level in Thailand from 2001 through 2011.5 It focuses on the heterogeneity of the estimated effect of
minimum-wage changes on a wide range of labor-related and social outcomes, including wages, employment,
hours of work, poverty and household consumption. The analysis distinguishes between different skill groups
(unskilled, medium-skilled, and high-skilled) and demographic characteristics such as age and gender. The
detailed analysis offers insights into the impact of the minimum wage on welfare, and enables an examination
of the mechanisms through which it operates.
Thailand constitutes an excellent case study to analyze the impact of the minimum wage on labor
market outcomes because of the way the country implements and administers its policy and because of the
nature of its dual labor market (formal and informal). During the period of analysis, the minimum wage in
Thailand was set by province, introducing a great variability of minimum wages across the country and over
time. These various provincial minimum wages were set following a complex, two-tiered system that involved
near-continnual negotiations between tripartite committees at the provincial and national levels.
As the next section shows, such a complex negotiation process introduced a great deal of
arbitrariness in the minimum wages set. Decision making responded more to imbalances in bargaining power
3 The popular press is full of these examples. U.S. President Barack Obama, in his 2013 State of the Union address, said,
“Tonight, let’s declare that in the wealthiest nation on Earth, no one who works full-time should have to live in
poverty, and raise the federal minimum wage to $9.00 an hour” (New York Times 2013)
4 A simple online search in Google Scholar for articles with the words “minimum wage” and “employment” in the title
yielded 273 hits. Replacing “employment” with “poverty” or “inequality” yielded 39 and 43 hits, respectively.
5 In 2012, Thailand raised its minimum wage substantially (by 35–70 percent, depending on the starting point of each
province); however, this study focuses on yearly “moderate” changes.

4
between employers and employees and to the central government’s desire to maintain provincial status quos
than to a careful process of planning and targeting. As a result, variation of the minimum wage over time and
within provinces was, to a large extent, exogenous to changes in the local labor market. Hence, we use a
difference-in-difference strategy to identify the causal impact of minimum-wage changes on labor market and
household outcomes—a strategy that is not likely to suffer from the common endogeneity biases found in
many previous studies. This paper also contributes to the literature by shedding light on the impact of
minimum-wage increases on labor and social outcomes in a middle-income country where large segments of
the workforce are employed in the informal (uncovered) economy, where labor law is not binding. Indeed, as
in most developing countries, the vast majority of Thai households have at least one member employed in the
informal economy.6
The remainder of the paper is organized as follows. The next section discusses the institutional
features of the Thai minimum-wage system and describes the recent evolution of minimum wages in
Thailand. Section 3 introduces the main datasets used for the analyses and describes the characteristics of
minimum-wage workers. Section 4 discusses the methodology used to estimate the impact of the minimum
wage on labor market outcomes and presents the main results, organized around three interrelated questions:
How has the minimum wage affected wages on average and across distinct labor market demographic
groups? How has the minimum wage affected formal and informal employment (especially among potentially
vulnerable groups such as youth, elder workers, female workers, and low-skilled workers)? Has the minimum
wage been an effective tool for tackling poverty and reducing consumption inequality? Section 5 concludes
with a summary of the paper’s findings and a discussion of their implications.
2. Thai Minimum Wages: Institutional Background and Recent Evolution
The minimum wage has been a key component in the development of Thai labor policy over the past four
decades.7 In 1972, the first minimum-wage legislation passed in Thailand,8 and the Ministry of Interior
appointed a tripartite National Wage Committee (NWC) of government, employer, and employee
representatives to recommend labor policy to the government and fix the minimum wage, which was defined
6 In 2011, about 63 percent of country’s working-age population (15–60 years old) worked in the informal economy,
(NSO 2011).
7 This section draws from three main sources: (a) Peetz (1996), a comprehensive analysis of Thailand’s minimum–wage-
setting system (up to the promulgation of the Labor Protection Act of 1998). This study was sponsored by the
International Labour Organization after the Thai government requested its technical assistance; (b) Paitoonpong,
Akkarakul, and Sukaruji (2005), a study that updates knowledge on the minimum-wage-setting system following the
passage of the Labor Protection Act; and (c) our own conversations with Ministry of Labor officials and members of
the National Wage Committee.
8 The legislation, Revolutionary Party Decree No. 103, was promulgated on March 16, 1972.

5
as “a wage rate which an employee deserves and is sufficient for an employee’s living.” The first minimum
wage was set at 12 baht per day in April 1973 in Bangkok and three surrounding provinces (Samut Prakan,
Nonthaburi, and Pathum Thani). The criteria reportedly used in wage negotiations were the cost of living; the
rate of inflation as reflected by the consumer price index (CPI); and, since 1990, economic growth.9 After
1973, minimum wages continued to be set by geographic zone, and, by 1998, three different minimum wages
covered all 76 Thai provinces.10
The 1997–98 Asian financial crisis led to a reform of Thailand’s labor policy, and the Labor
Protection Act of 1998 (LPA 2541) transformed the previous minimum-wage-setting system into a two-tiered
system intended to differentiate minimum-wage levels by province and industry. The main objective of
having province-specific levels was to take into account provincial differences in the cost of living and other
socioeconomic conditions. The new system fully adopted the provincial differentiation, but the industry-level
differentiation was not implemented, largely because it was too complex to administer.
One of the LPA 2541’s primary mandates was the creation of a new minimum-wage-setting
machinery, which included three key institutions: the NWC, the Provincial Subcommittees on Minimum
Wages (PSMWs), and the Subcommittee on Technical Affairs and Review (STAR). Despite the introduction
of the new system in 1998, no adjustments to minimum-wage levels were made until 2001. In 2008, a new
reform (the Labor Protection Act of 2008 [LPA 2551]) further detailed the criteria established for wage
adjustments, but in practice made no major changes to the wage-setting process. Finally, in 2011, the newly
elected government announced a unified nationwide policy that, by January 2013, had set minimum wages at
300 baht per day (about 9.5 US$ at the time) in all provinces. This drastic increase, however, does not affect
our results because it became effective after 2011.
During the period under study, the rounds of negotiations to review the minimum-wage level were
typically triggered by trade union demands, NWC or PSMW recommendations, or government order. It is the
duty of the PSMWs (tripartite subcommittees composed of government, employer, and employee
representatives) to recommend minimum-wage adjustments at the provincial level to the NWC, which then
sends these recommendations to STAR for technical review. After STAR submits its review, the NWC issues
a final recommendation at the central level, which the Ministry of Labor (the final deciding authority) then
announces in the Royal Gazette. Although the Ministry of Labor may ask the NWC to revise its
9 In particular, the formula proposed was the following: rate of economic growth divided by two plus the inflation rate
(Peetz 1996). Note, however, that these criteria were used as a reference, and the final outcome was determined by
negotiations between the government, employer, and employee representatives on the NWC.
10 In 1998, before the passage of the Labor Protection Act, minimum wages were 162 baht per day in Bangkok, Nakhon
Pathom, Nonthaburi, Pathum Thani, Samut Sakhon, Samut Prakan, and Phuket; 140 baht per day in Chon Buri,
Chiang Mai, Nakhon Ratchasima, Phangnga, Ranong, and Saraburi; and 130 baht per day in the remaining provinces.

6
recommendations, it rarely interferes with the review process beyond its influence on the different
committees through its official representatives.
The frequency of minimum-wage adjustments is generally not fixed by law in East Asian countries,
but they usually revise them annually. Thailand was no exception to this pattern during the 2000s: minimum-
wage adjustments were generally decided by the NWC after the review process in November and became
effective on January 1 of the following year. However, there were two adjustments in some years (2005 and
2008) and none in 2009. As a result of these adjustments, Thailand had 28 different minimum wages by the
end of 2010—ranging from 151 baht per day (about US$4.80 of 2010) in Phrae, Phayao, Mae Hong Son, and
Phichit (in the North region) to 206 baht per day (about US$6.50) in Bangkok and Samut Prakan (in the
Central region). As for coverage, Thai minimum wages apply to all full-time private employees regardless of
nationality, although they do not apply to government employees, employees in households, employees in the
agricultural sector, and part-time or student employees.
In 1998, the LPA 2541 (article 87) also stipulated three main groups of indicators on which to base
minimum-wage adjustments: cost of living, employers’ capacity to pay, and economic conditions.11 On paper,
the reliance on these criteria would introduce some degree of endogeneity in the determination of the
minimum wage, a problem that is fairly common in most of the related literature. In practice, however,
minimum-wage negotiations often differed widely from the text of the legislation for various reasons. First,
the precise weight assigned to each criterion by the members of the committees was not preestablished.
During our conversations, stakeholders suggested that cost-of-living considerations and regional gross
domestic product (GDP) per capita were given priority, possibly because of data availability, but negotiations
took place rather informally, and the criteria used may well have varied across provinces and over time.
Second, the low rate of unionization and the large share of informal employment severely limit Thai
workers’ capacity to coordinate efforts, which results in a review process dominated by the employer
representatives and the government. The virtual absence of unions at the provincial level complicates the
selection and appointment of employee representatives for the PSMWs, which often lacks transparency. The
appointed employee representatives are sometimes not even known among the workers (Paitoonpong,
Akkarakul, and Sukaruji 2005). During interviews with union and employer representatives at the NWC, it
was often told to us that in some PSMWs, employer and employee representatives work in the same firm, the
former having personally handpicked the latter. Even if employee representatives are present, they are often
not prepared enough to contribute to the technical discussion. Hence, it is not surprising that the growth in
11 The differences between the set of criteria established in the LPA 2541 (1998) and the LPA 2551 (2008) were minimal.
The latter further detailed the three broad criteria established by the former, and it added the following ones: inflation
rate, subsistence standard, production costs, goods and service price, labor productivity, and GDP.
7
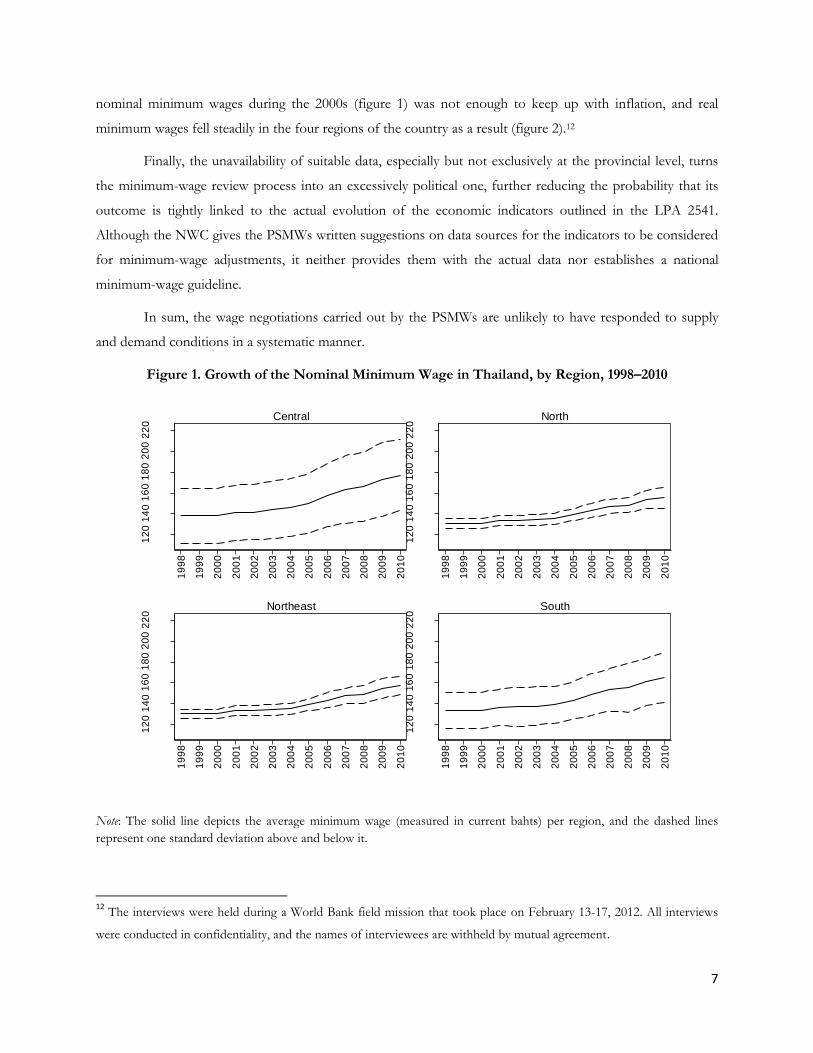
nominal minimum wages during the 2000s (figure 1) was not enough to keep up with inflation, and real
minimum wages fell steadily in the four regions of the country as a result (figure 2).12
Finally, the unavailability of suitable data, especially but not exclusively at the provincial level, turns
the minimum-wage review process into an excessively political one, further reducing the probability that its
outcome is tightly linked to the actual evolution of the economic indicators outlined in the LPA 2541.
Although the NWC gives the PSMWs written suggestions on data sources for the indicators to be considered
for minimum-wage adjustments, it neither provides them with the actual data nor establishes a national
minimum-wage guideline.
In sum, the wage negotiations carried out by the PSMWs are unlikely to have responded to supply
and demand conditions in a systematic manner.
Figure 1. Growth of the Nominal Minimum Wage in Thailand, by Region, 1998–2010
Note: The solid line depicts the average minimum wage (measured in current bahts) per region, and the dashed lines
represent one standard deviation above and below it.
12
The interviews were held during a World Bank field mission that took place on February 13-17, 2012. All interviews
were conducted in confidentiality, and the names of interviewees are withheld by mutual agreement.
12
01
40
16
01
80
20
02
20
19
98
19
99
20
00
20
01
20
02
20
03
20
04
20
05
20
06
20
07
20
08
20
09
20
10
Central1
20
14
01
60
18
02
00
22
0
19
98
19
99
20
00
20
01
20
02
20
03
20
04
20
05
20
06
20
07
20
08
20
09
20
10
North
12
01
40
16
01
80
20
02
20
19
98
19
99
20
00
20
01
20
02
20
03
20
04
20
05
20
06
20
07
20
08
20
09
20
10
Northeast
12
01
40
16
01
80
20
02
20
19
98
19
99
20
00
20
01
20
02
20
03
20
04
20
05
20
06
20
07
20
08
20
09
20
10
South

8
Figure 2. Growth of the Real Minimum Wage in Thailand, by Region, 1998–2010
Note: The solid line depicts the average real minimum wage (measured in constant Baht) per region, and the dashed lines
represent one standard deviation above and below it. Minimum wages are deflated using the provincial CPI.
More importantly, another source of exogenous variation affects minimum-wage outcomes from the
negotiations. NWC members told us that they often considered another criterion (not stipulated by the LPA
2541) before reaching a final recommendation: the extent of cross-provincial disparities. In particular, the
NWC generally tried to avoid exacerbating cross-provincial differences in the minimum wage (which indeed
remained fairly stable along our period of analysis, as the standard deviations across provinces in figure 1
indicate) or, at the minimum, attempted to maintain the status quo in terms of provincial rankings (within
regions). To this purpose, the NWC used to compensate provinces that had lagged behind within the region
in terms of their previous (nominal) minimum-wage adjustment, while it set relatively smaller minimum-wage
increases in provinces that had previously fared better than the regional average.
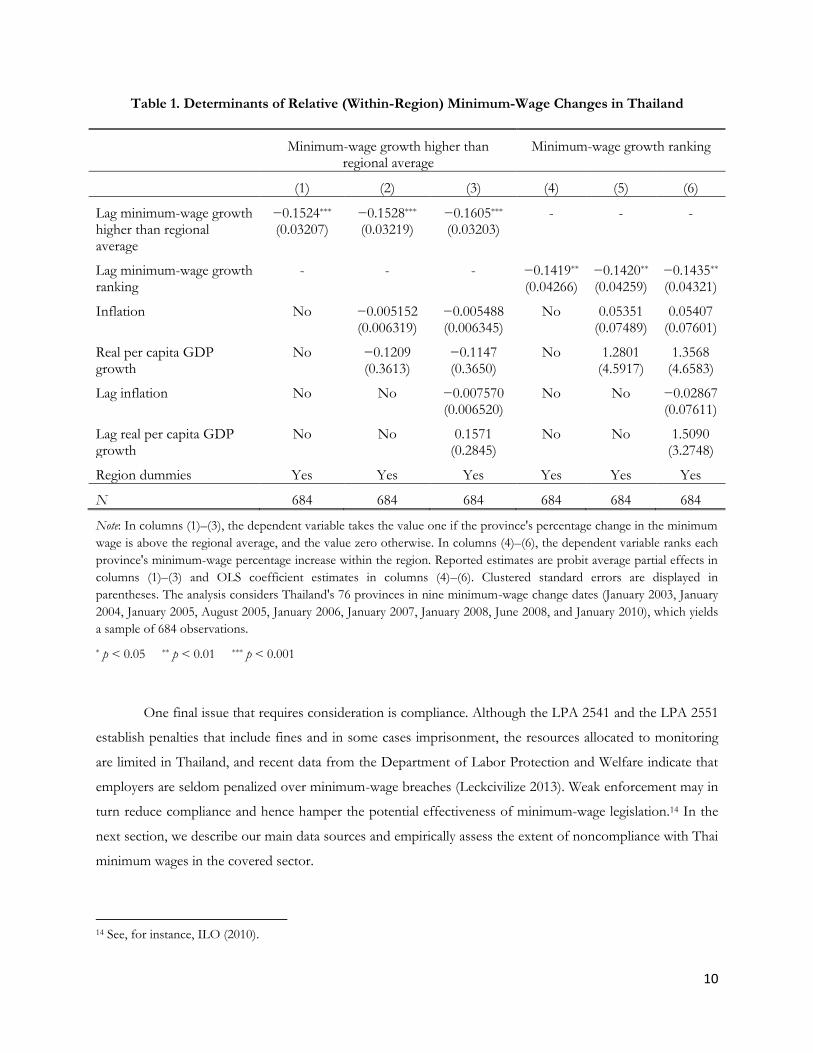
We present evidence supportive of these trend reversals within regions in table 1, which displays
estimates of the determinants of two alternative measures of relative within-region minimum-wage
adjustments: The first one (columns 1–3) is an indicator variable that takes the value one if the province’s
percentage increase in the minimum wage is above the regional average; otherwise, it takes the value zero.
14
01
60
18
02
00
22
02
40
19
98
19
99
20
00
20
01
20
02
20
03
20
04
20
05
20
06
20
07
20
08
20
09
20
10
Central
14
01
60
18
02
00
22
02
40
19
98
19
99
20
00
20
01
20
02
20
03
20
04
20
05
20
06
20
07
20
08
20
09
20
10
North1
40
16
01
80
20
02
20
24
0
19
98
19
99
20
00
20
01
20
02
20
03
20
04
20
05
20
06
20
07
20
08
20
09
20
10
Northeast
14
01
60
18
02
00
22
02
40
19
98
19
99
20
00
20
01
20
02
20
03
20
04
20
05
20
06
20
07
20
08
20
09
20
10
South

9
The second measure (columns 4–6) is the provincial ranking (within-region) in terms of the minimum-wage
percentage increases received. We regress these two indicators on their lagged values, seeking evidence of
trend reversals. In the first specification (columns 1 and 4), we include region dummies on top of the lag of
the dependent variable. Next (columns 2 and 5), we control for provincial inflation and the growth rate of
real per capita provincial GDP (that is, the main indicators on which data are systematically collected that
should be considered in fixing minimum wages according to article 87 of the LPA 2541). Finally (columns 3
and 6), we include the lag of the latter two variables as additional controls.
Our results from column 1 show that the likelihood of getting a minimum-wage increase above the
regional average is significantly smaller in provinces where the previous minimum-wage raise was above the
regional average. Along these lines, we also find that the provincial ranking (within the region) in terms of
minimum-wage percentage increases (column 4) was significantly higher the lower the province had ranked at
the previous minimum-wage change date. It is also worth highlighting that the impact of inflation and GDP
growth on the growth of the minimum wage is far from significant at standard levels of testing, and the
results are virtually unchanged when adding these variables (and their lags) as further controls (columns 2, 3,
5, and 6).
Additionally, we estimated an analogous model to investigate the determinants of the percentage
increase in minimum wages at the province level and reached similar conclusions: current increases in
minimum wages were significantly smaller the higher the previous increases had been, and they were not
significantly affected by inflation or GDP growth, the inclusion of which did not significantly change the
other relevant coefficient estimates.13
This process of ex-post compensation of the provincial minimum wages that was put in place to
guarantee a regional balance introduced exogenous variation in the changes over time of the minimum wage
within provinces. Importantly, these changes appear to be driven by institutional factors rather than by supply
and demand in the local labor markets. To be sure, wages, employment, and minimum wages are jointly
determined at the aggregate level, and the entrenched minimum-wage differences across provinces through
2011 reflected different levels of development. Hence, the identification in the analyses below will rely on
time variation of the minimum-wage within provinces, abstracting from permanent differences across
provinces and common macroeconomic shocks by introducing year, month, and province dummy variables
into the regression. We argue that, in light of the evidence on trend reversals presented here, and given the
great deal of arbitrariness in the complex, two-tiered, tripartite system of minimum-wage negotiations, the
remaining variation within-province in minimum wages is exogenous to local labor market conditions, and
therefore exogenous to employment, poverty, and wage setting at the provincial level.
13 These results are available upon request from the authors.
10
Table 1. Determinants of Relative (Within-Region) Minimum-Wage Changes in Thailand
Minimum-wage growth higher than regional average
Minimum-wage growth ranking
(1) (2) (3) (4) (5) (6)
Lag minimum-wage growth higher than regional average
−0.1524*** (0.03207)
−0.1528*** (0.03219)
−0.1605*** (0.03203)
- - -
Lag minimum-wage growth ranking
- - - −0.1419** (0.04266)
−0.1420** (0.04259)
−0.1435** (0.04321)
Inflation No
−0.005152 (0.006319)
−0.005488 (0.006345)
No
0.05351 (0.07489)
0.05407 (0.07601)
Real per capita GDP growth
No
−0.1209 (0.3613)
−0.1147 (0.3650)
No
1.2801 (4.5917)
1.3568 (4.6583)
Lag inflation No
No
−0.007570 (0.006520)
No
No
−0.02867 (0.07611)
Lag real per capita GDP growth
No
No
0.1571 (0.2845)
No
No
1.5090 (3.2748)
Region dummies Yes Yes Yes Yes Yes Yes
N 684 684 684 684 684 684
Note: In columns (1)–(3), the dependent variable takes the value one if the province's percentage change in the minimum
wage is above the regional average, and the value zero otherwise. In columns (4)–(6), the dependent variable ranks each
province's minimum-wage percentage increase within the region. Reported estimates are probit average partial effects in
columns (1)–(3) and OLS coefficient estimates in columns (4)–(6). Clustered standard errors are displayed in
parentheses. The analysis considers Thailand's 76 provinces in nine minimum-wage change dates (January 2003, January
2004, January 2005, August 2005, January 2006, January 2007, January 2008, June 2008, and January 2010), which yields
a sample of 684 observations.
* p < 0.05 ** p < 0.01 *** p < 0.001
One final issue that requires consideration is compliance. Although the LPA 2541 and the LPA 2551
establish penalties that include fines and in some cases imprisonment, the resources allocated to monitoring
are limited in Thailand, and recent data from the Department of Labor Protection and Welfare indicate that
employers are seldom penalized over minimum-wage breaches (Leckcivilize 2013). Weak enforcement may in
turn reduce compliance and hence hamper the potential effectiveness of minimum-wage legislation.14 In the
next section, we describe our main data sources and empirically assess the extent of noncompliance with Thai
minimum wages in the covered sector.
14 See, for instance, ILO (2010).

11
3. Data and Descriptive Evidence
3.1. Data sources
This paper relies on two main data sources: the Labor Force Survey (LFS), on which we base our individual-
level analyses of labor market outcomes, and the Household Socio-Economic Survey (SES), which we use to
study the impact of the minimum wage on household consumption and poverty.
The National Statistical Office of Thailand (NSO) undertakes the LFS to collect data on the
economic activities of the population, including detailed information on employment and unemployment as
well as on characteristics of the labor force and economically inactive individuals. The LFS relies on a two-
stage stratified sampling design (Thailand’s 76 provinces constituted the strata),15 and it covers the civilian
noninstitutional population living in private households and special households (which include group
households or quarters within a factory compound). LFS data, which are collected monthly and released
quarterly, also include information on relevant socioeconomic characteristics such as age, gender, marital
status, and education.
To study the impact of the minimum wage on the Thai labor market, we focus on the period 1998–
2010 and adapt our sample selection criteria to the specific outcome under study: the wages and hours16
worked by 15- to 60-year-old full-time employees covered by minimum wages.17 Two samples—those of all
working-age (15–60) individuals and of working-age private sector workers—serve as the bases for our
analyses of the probability of employment and the probability of working in the covered or uncovered sector,
respectively. Regarding wage measurement, since Thai minimum wages are set per day, the wage variable we
use is also a daily rate,18 which we deflate when necessary by provincial CPI.
Our analyses of poverty and household consumption rely on the SES, a stratified two-stage sampling
survey that the NSO typically carries out every two years. The goal of the SES is to collect socioeconomic
information on Thai households, such as consumption, characteristics of household members and housing,
ownership of selected durable goods, and so forth. We use data from all years available within our period of
analysis: that is, 2000, 2002, 2004, 2006, 2007, 2008, 2009, and 2010.
15 Primary and secondary sample units are blocks (for municipal areas) or villages (for non-municipal areas) and
households, respectively.
16 Wages and hours worked are considered only for the worker’s main job.
17 The retirement age is 60 in Thailand.
18 For employees paid by the month, monthly wages were converted to a daily rate by dividing by 30.

12
3.2. Who pays and who receives the minimum wage? How binding are Thai minimum
wages?
Data on labor inspections conducted by the Department of Labor Protection and Welfare reveal that, on
average, 12–13 percent of establishments were inspected every year during 2006–10, but more than 94
percent of the establishments violating any labor law received only a warning, and less than 0.3 percent were
actually penalized or prosecuted (Leckcivilize 2013). Therefore, noncompliance with Thai minimum wages
may be relevant even for formal employees, and the following questions are warranted: Are Thai covered
employees actually paid at or above the minimum wage? Who are and who aren’t?
To answer these questions, we depart from the sample of workers covered by minimum-wage
legislation to characterize those who are paid above and below the minimum wage. Because few workers earn
exactly the minimum wage, we define minimum-wage workers (labeled as “At the minimum” in table 2) as
those for whom the difference between the actual daily wage received and the daily minimum wage in the
province where they work does not exceed (in absolute terms) 5 percent. The other two categories, “Below”
and “Above”, identify workers whose wage is more than 5 percent lower and higher than the minimum wage,
respectively.
Table 2 presents summary statistics for these three groups and uncovers a significant degree of
noncompliance: around 20 percent of Thai employees are paid less than the minimum wage, according to our
characterization—a remarkable feature considering that these summary statistics are based on the sample of
workers who, in principle, are covered by minimum wages as stipulated by the legislation. This result is
broadly consistent with other compliance indicators based on alternative data sources.19
Regarding worker characteristics, younger workers (aged 15–24) are more likely than prime-aged
workers (aged 25–49) to be below or at the minimum wage. Because female wages are lower, compliance also
varies by gender: 25.9 percent of females earn less than the minimum, against only 17.8 percent of males. As
for firm size, large firms are more likely to pay at or above minimum wages, while small firms are more prone
to noncompliance. For example, 41.8 percent of individuals working in firms with 1 to 5 employees earn
below the minimum wage, against only 5.3 percent of their counterparts working in firms with more than 200
employees. The incidence of and noncompliance with minimum wages also decreases as education increases
and is more prevalent among blue-collar workers.20
19 See, for instance, Paitoonpong, Akkarakul, and Sukaruji (2005); DLPW (2002); and Peetz (1996).
20 Chandoevwit (2010) reports similar patterns of noncompliance across workers and firms based on LFS data.

13
Table 2. Summary Statistics on Private Sector Wages Relative to Minimum Wage in Thailand
Below the minimum At the minimum Above the minimum
By worker characteristic
Female 25.88 23.85 50.28
Male 17.79 15.73 66.48
Less than elementary education 35.15 18.83 46.02 Elementary education 27.62 24.48 47.91 Lower secondary education 21.15 26.25 52.59 Upper secondary education 12.85 20.41 66.74 Tertiary education 2.80 4.36 92.84 Age 15–24 29.72 27.11 43.18
Age 25–44 17.54 17.84 64.62
Age 45–60 24.72 13.93 61.35
By occupation
Legislators, senior officials 1.00 0.94 98.06 Technicians and associates 4.13 6.94 88.93 Clerks 7.23 11.33 81.44 Service workers, shop, and related 31.45 15.50 53.05 Skilled agriculture and fisheries 56.41 17.97 25.62 Craft and related trades 13.40 17.13 69.47 Plant and machine operators 11.25 32.10 56.65 Elementary occupation 41.89 24.02 34.10 By industry
Agriculture, hunting, forestry, fisheries 59.65 15.81 24.54 Manufacturing, electricity, gas, and water 11.49 30.09 58.43 Construction 12.94 13.04 74.02 Wholesale and retail trade 20.62 13.93 65.45 Hotels and restaurants 37.67 15.22 47.11 Transport, storage, and related 14.93 8.44 76.62 Financial inter. and real estate 8.57 10.53 80.90 Education 11.13 7.41 81.46 Health, social, and household services 39.03 13.58 47.39 By firm size
1–4 employees 41.84 14.66 43.49 5–9 employees 32.01 14.56 53.43 10–19 employees 25.02 16.53 58.45 20–199 employees 14.09 18.62 67.29 200+ employees 5.31 28.00 66.69 Total 21.30 19.26 59.44
Note: Sample drawn from 1998–2010 LFS data on working-age (15–60 years old) full-time private employees paid by the
day or by the month. Workers “at the minimum” wage are defined as those actual daily wage received is within 5 percent
above or below the minimum wage in their province. For workers “below the minimum” and “above the minimum,”
wages are more than 5 percent lower or higher than the minimum wage, respectively.

14
An alternative way of assessing noncompliance and how binding minimum wages are is to look for
spikes in the wage distribution at or around the minimum wage. Because Thai minimum wages during the
period analyzed differed across provinces and over time, we define a new variable that measures the
difference between the wage of each employee and the minimum wage in the province where he or she
works, and we then pool all Thai covered employees by year. Figure 3 displays kernel density estimates of the
distribution of the difference between actual daily wages and the minimum wage for each year of our sample
period. Two main features are worth noting: First, there is a visible spike at or very close to zero, which is the
mode of the wage distribution in all years. Hence, minimum wages are clearly binding. Second, as table 2
revealed, there is also a significant fraction of workers who are paid below the minimum wage in the covered
sector.
In sum, our evidence indicates that, although compliance is far from perfect, Thai minimum wages
are clearly binding. Importantly, the extent of noncompliance appears to vary substantially by socioeconomic
characteristics. Hence, the impact of minimum-wage legislation is likely to vary across groups of employees, a
feature we take into account in our subsequent analyses.
Figure 3. Kernel Density Functions of the Difference between Actual Wages and Minimum Wage in
Thailand, 2001–10
Note: Kernel densities display the log of real daily wages of full-time (35+ hours per week) private salaried workers. The
sample includes employees who are paid by the day as well as employees who are paid by the month.
0
.00
5.0
1.0
15
-100 0 100 200 300
kernel = epanechnikov, bandwidth = 4.6628
2001
0
.00
5.0
1.0
15
-100 0 100 200 300
kernel = epanechnikov, bandwidth = 4.4507
2002
0
.00
5.0
1.0
15
-100 0 100 200 300
kernel = epanechnikov, bandwidth = 4.6709
2003
0
.00
5.0
1.0
15
-100 0 100 200 300
kernel = epanechnikov, bandwidth = 4.7630
2004
0
.00
5.0
1.0
15
-100 0 100 200 300
kernel = epanechnikov, bandwidth = 4.4115
2005
0
.00
5.0
1.0
15
-100 0 100 200 300
kernel = epanechnikov, bandwidth = 4.1320
2006
0
.00
5.0
1.0
15
-100 0 100 200 300
kernel = epanechnikov, bandwidth = 4.3745
2007
0
.00
5.0
1.0
15
-100 0 100 200 300
kernel = epanechnikov, bandwidth = 5.1771
2008
0
.00
5.0
1.0
15
-100 0 100 200 300
kernel = epanechnikov, bandwidth = 5.3431
2009
0
.00
5.0
1.0
15
-100 0 100 200 300
kernel = epanechnikov, bandwidth = 5.7837
2010

15
4. Estimation and Results
4.1. Empirical model and identification
We estimate the impact of the minimum wage on various outcomes by relying on a difference-in-differences
identification strategy. In particular, we estimate equations of the following form:
where yit denotes the outcome of interest (we start by looking at individual real daily wages and then we move
to employment, informality, and poverty) and lnMWpt the log of the minimum wage; i stands for individuals
(in the labor market outcomes analyses) and for households (in the poverty analyses); t stands for time (we
identify the month of interview); and p stands for province. The model includes, depending on the outcome,
a vector of worker or household-specific characteristics (Xit) that control for observable compositional
changes in the labor market. Explanatory variables in vector Xit change with the specification, but in general
include individual specific human capital (a gender dummy, a quadratic term in age, and dummies for the
highest level of education obtained), a dummy for married, and a dummy for living in urban areas. When we
analyze employed individuals, we further include industry and occupation categories and dummy variables for
firm size.
All specifications include a full set of time ( ) and provincial dummies ( ). After including these
two sets of covariates, identification is obtained from deviations of the minimum wage within provinces over
time from the average yearly minimum-wage change, which can be reasonably viewed as exogenous. As an
additional check, we include in some specifications the provincial real GDP per capita, which is one of the
main aspects that wage setters should have taken into account during wage negotiations according to the
legislation. Reassuringly, results with and without this variable are virtually identical. Thus, in line with our
previous discussion, we are reasonably confident that our results do not suffer from endogeneity bias.
4.2 The impact of the minimum wage on average wages
We start by assessing the effect of the minimum wage on average wages, presented in table 3. Our basic
specification in column 1 includes province and monthly dummies, as well as education, occupation, industry,
and establishment-size dummies. In column 2 we extend this specification to control for provincial per capita
GDP. The estimated elasticity of wages to the minimum wage is virtually identical in the two specifications,
the point estimate being 0.36 and highly significant at the 0.1 percent level. Hence, the regression analysis
confirms what previous summary statistics and visual inspection suggested: in spite of substantial
noncompliance, the minimum wage in Thailand is binding, and it has a bearing on actual wages.

16
Table 3. Effect of Thai Minimum Wage on Average Wages (OLS Estimates)
(1) (2)
Log real daily minimum wage
0.3555*** (0.08580)
0.3623*** (0.08188)
Province dummies
Yes Yes
Monthly dummies
Yes Yes
Individual controls
Yes Yes
Education Yes Yes
Occupation Yes Yes
Industry Yes Yes
Establishment size
Yes Yes
Log real yearly province per capita GDP
No Yes
N 1069134 1069134
Note: The dependent variable (individual daily real wages) is measured in logs. Individual controls include a male dummy,
age, age squared/100, married, and municipal area indicators. Sampling weights are used, and standard errors, displayed
in round brackets, are clustered. Analyses are based on working-age (15–60 years old), full-time (35+ hours per week),
private sector employees.
* p < 0.05 ** p < 0.01 *** p < 0.001
Table 4 moves to the analysis of the heterogeneous impact of the minimum wage on wages of
different labor market groups. To simplify the exposition, we report only our preferred specification, which
adds the log of real per capita GDP per province and year to the standard set of covariates. We start the
analysis by examining differences across gender (in panel 1 of table 4), and our results indicate that the impact
of the minimum wage is larger for females than for males. In spite of the higher level of minimum-wage
noncompliance across females that we described in the previous section, the estimated elasticity of female
wages almost doubles that of males (0.49 against 0.26).
In panel 2 of table 4, we show the differential impact of the minimum wage across age categories.
Not surprisingly, the wages of young workers (15–24 years old) are more affected than the wages of prime-
aged employees (25–49 years old), with estimated elasticities of 0.52 and 0.33, respectively. These results
suggest that the minimum wage has a stronger impact on the wages of low-earning workers. Perhaps more

17
surprising is the finding that the minimum wage has no impact on the wages of elderly workers (50–60 years
old), for whom the estimated elasticity is negative although not statistically significant.
Table 4: Effect of Thai Minimum Wage on Average Wages, by Socioeconomic Group (OLS Estimates)
Elasticities and standard errors Sample size
(1) By gender
Men 0.2640*** (0.06412)
580470
Women 0.4894*** (0.1060)
488664
(2) By age group
15–23 years 0.5162*** (0.1144)
170691
24–49 years 0.3318*** (0.08255)
803033
50–60 years -0.1740 (0.1023)
95410
(3) By education
Less than elementary 0.2835*** (0.06179)
277569
Elementary 0.4043*** (0.08313)
247075
Lower secondary 0.3678** (0.1254)
190983
Upper secondary 0.3818*** (0.1060)
171032
Tertiary 0.3455*** (0.08737)
182475
Note: Both the dependent variable (individual daily real wages) and the real daily minimum wage are measured in logs.
Control variables in all panels include province and year-month dummies, age, age2/100, married, and municipal area
dummies, occupation, establishment size, and industry indicators as well as the log of real per capita GDP per province
and year. Estimations by gender (panel 1) also include education indicators, while estimations by age group (panel 2)
include a male dummy as well as education indicators, and estimations by education (panel 3) also include a male
dummy. Sampling weights are used and standard errors, displayed in round brackets, are clustered. Analyses based on
working-age (15–60 years old), full-time (35+ hours per week) private employees.
* p < 0.05 ** p < 0.01 *** p < 0.001
Panel 3 of table 4 shows differences across five educational groups: less than elementary, elementary, lower
secondary, upper secondary, and tertiary. Differences in the impact of the minimum wage on daily wages

18
across educational groups are in general small, with workers at the extremes of the skill distribution
experiencing somewhat smaller gains than workers in the middle. The largest estimated elasticity observed is
that of workers with elementary education (0.40), against an estimated elasticity of 0.28 for the group of
workers who did not complete elementary education.
4.3 Minimum wages, informality, and the intensive and extensive employment margins
Our previous analyses confirmed that the minimum wage in Thailand is binding and showed that it shapes
the wage distribution with differential impacts across different categories of workers. We estimate now the
impact of the minimum wage on employment levels and the type of employment. Most of the literature has
focused on the unemployment impact of the minimum wage. In the case of Thailand, however,
unemployment is extremely low—an average of 1.2 percent during the period we are analyzing—suggesting
that the effect of the minimum wage, if any, should be marginal. However, the minimum wage might
discourage job searching altogether, affecting the rate of joblessness rather than unemployment. Moreover,
such a low unemployment rate might hide some misclassification between unemployed and nonactive
individuals. For this reason, we analyze the impact of the minimum wage on the rate of employment at the
provincial level.
Table 5 shows the impact of the minimum wage on the probability of working. The analysis is carried
out using a logit model, where the dependent variable takes the value one if the individual is working and zero
otherwise. Average partial effects are reported. Our sample consists of working-age (15–60 years old)
individuals, and, as before, the estimated models control for province and year-month dummies, a quadratic
term in age, gender and marital status dummies, and municipal area dummies as well as the log of real per
capita GDP per province and year.
The overall estimated effect (panel 1 of table 5) of the log of the minimum wage on the probability
of working is negative (-0.055) and statistically significant at the 5 percent level. Since the minimum wage is in
logs, this average partial effect implies that the probability of working declines by 0.5 percentage points if the
minimum wage increases by 10 percent. Considering that the average employment rate in Thailand is 77.3
percent during the estimation period, this translates into a 0.64 percent reduction of the probability of being
employed. Our subsequent disaggregated analyses reveal that this figure masks important differences by
gender, because it is the impact of the minimum wage on female employment that drives the average result
(panel 2 of table 5). Indeed, the average partial effect for females is -0.10 and highly significant, while for
males it is 0.003 and insignificant at standard levels.
Across age categories (panel 3 of table 5), the estimated effect is of similar magnitude for young and
older workers, indicating about a 1 percentage point reduction in the probability of employment for each 10
percent increase in the minimum wage. However, the estimated impact is statistically significant only among

19
workers aged 50 to 60. In contrast, the effect on the employment probability for prime-aged (25–49 years old)
workers is smaller in magnitude (-0.008) and not significantly different from zero.
Table 5. Effect of Thai Minimum Wage on Probability of Working (Logit Estimates)
APEs and standard errors Sample size
(1) All -0.05554* (0.02769)
5406775
(2) By gender
Men 0.002783 (0.02893)
2527094
Women -0.1085** (0.03454)
2879681
(3) By age group
15–23 years -0.1129 (0.08236)
983426
24–49 years -0.008016 (0.02265)
3357350
50–60 years -0.1079** (0.03621)
1065999
(4) By education
Less than elementary -0.1011** (0.03330)
1808107
Elementary -0.1469*** (0.03812)
1027020
Lower secondary -0.02878 (0.05351)
971442
Upper secondary 0.01147 (0.08135)
757715
Tertiary 0.05119 (0.02986)
842491
Note: The dependent variable takes the value 1 if the individual is working and 0 otherwise, and the real daily minimum
wage is measured in logs. Unemployed individuals are classified as nonworking. Analyses are based on working-age (15–
60 years old) individuals. Average partial effects (APEs) are displayed, sampling weights are used, and standard errors,
displayed in round brackets, are clustered. Control variables in all panels include province and year-month dummies, age,
age2/100, married, and municipal area dummies as well as the log of real per capita GDP per province and year.
Estimations by gender (panel 2) also include education indicators, while estimations for all working-age individuals and
by age group (panels 1 and 3) include a male dummy as well as education indicators, and estimations by education (panel
4) also include a male dummy.
* p < 0.05 ** p < 0.01 *** p < 0.001

20
When splitting the sample into educational groups (panel 4 of table 5), the minimum wage appears to
concentrate its negative impact on the less-educated employees: the probability of being employed declines by
approximately 1 percentage point for each 10 percent increase in the real minimum wage for workers with
less than elementary education, and this effect amounts to approximately 1.5 percentage points in the case of
workers who finished elementary school. The impact for more-educated workers is always smaller in
magnitude and not statistically significant.
Not surprisingly, the disemployment impact of the minimum wage disproportionally affects low-productivity
employees and those workers who tend to be less attached to the labor market: female, elderly, and low-
educated workers. The employment of prime-aged (25–49 years old) male workers appears instead not to be
affected by minimum-wage changes. However, a second channel of selection may be at play: In the presence
of binding minimum wages, some workers may be forced to move to the uncovered sector, which in
Thailand and most other Southeast Asian economies is large. In particular, about 61 percent of private
workers in Thailand are in the uncovered sector; that is, they are either self-employed or working in a family
business for no pay. Are changes across provinces in the Thai real minimum wage associated with changes in
the probability of working in the uncovered sector? Our next set of regressions investigates this question.
We estimate now the impact of the minimum wage on the probability of working in the covered or
uncovered sector. To this end, we focus on private sector workers and define a dummy variable that takes the
value one if the worker is an employee, and the value of zero if he or she is self-employed or an unpaid family
worker. As before, our benchmark specification controls for province and year-month dummies, a quadratic
term in age, married and municipal area dummies, and occupation and industry indicators as well as the log of
real per capita GDP per province and year. After estimating the average partial effect on the full sample
(panel 1 of table 6), we again consider worker heterogeneity by splitting the sample by gender, age, and
education (panels 2–4 of table 6). In contrast with our initial expectations, our results show no signs that
minimum wage increases are pushing workers into the uncovered sector in Thailand. The estimated average
partial effects for all groups are always small in magnitude and never achieve statistical significance at standard
levels of testing.
Another feature of Thai minimum wages that must be considered is that they are paid by the day. In
an attempt to limit the impact of daily minimum-wage increases on labor costs, employers may react by
adjusting working hours. The LFS asks all employed individuals the number of hours worked during the
reference week, allowing us to examine the impact of the minimum wage on the intensive margin (table 7). As
we did with wages, we depart from the sample of covered workers and focus on working-age (15–60 years
old), full-time (35+ hours per week), private employees in their main jobs. Control variables in all panels
include province and year-month dummies, a quadratic in age, married and municipal area dummies,

21
establishment size, and occupation and industry indicators as well as the log of real per capita GDP per
province and year.
Table 6. Effect of Thai Minimum Wage on the Probability of Working in the Covered Sector
(Logit Estimates)
APEs and standard errors Sample size
(1) All -0.008095 (0.04377)
3620959
(2) By gender
Men -0.001555 (0.04582)
1846136
Women -0.02565 (0.04581)
1774823
(3) By age group
15–23 years 0.01952 (0.05636)
376462
24–49 years 0.007779 (0.04386)
2531539
50–60 years -0.03457 (0.03622)
712958
(4) By education
Less than elementary -0.01285 (0.05204)
1429761
Elementary -0.05349 (0.05717)
798673
Lower secondary -0.03771 (0.07756)
537740
Upper secondary -0.05844 (0.06153)
451126
Tertiary 0.008622 (0.04425)
403659
Note: The dependent variable takes the value 1 if the individual is working in the covered sector (that is, if he or she is a
salaried employee in the private sector) and 0 is he or she is self-employed or an unpaid family worker. The real daily
minimum wage is measured in logs. Analyses are based on 15- to 60-year-old individuals working in the private sector
(public employees and unemployed individuals are therefore excluded from the sample). Average partial effects (APEs)
are displayed, sampling weights are used, and standard errors, displayed in round brackets, are clustered. Control
variables in all panels include province and year-month dummies, age, age2/100, married and municipal area dummies,
and occupation and industry indicators as well as the log of real per capita GDP per province and year. Estimations by
gender (panel 2) also include education indicators, while estimations for all working-age individuals and by age group
(panels 1 and 3) include a male dummy as well as education indicators, and estimations by education (panel 4) also
include a male dummy.
* p < 0.05 ** p < 0.01 *** p < 0.001

22
The impact of the real minimum wage on weekly working hours is positive and statistically significant
at the 5 percent level, although fairly small in magnitude (panel 1 of table 7). Overall, a 10 percent rise in the
minimum wage increases work hours by about 0.5 additional hours per week. Interestingly, this effect is
entirely due to working-hour increases for men, particularly prime-aged men (panels 2 and 3 of table 7).
When we split the sample into educational categories, the effect is largest in magnitude and statistically
significant for workers with upper secondary education, although it is positive (but not statistically significant)
for all educational groups.
Table 7. Effect of Thai Minimum Wage on Hours Worked per Week
Coefficient estimates and standard errors Sample size (1) All 4.9863*
(2.0830) 1211185
(2) By gender Men 6.3375***
(1.3672) 651361
Women 3.2758 (3.2332)
559824
(3) By age group 15–23 years 4.3352
(2.9534) 187850
24–49 years 5.3258* (2.1867)
907855
50–60 years 2.8721 (1.7268)
115480
(4) By education
Less than elementary 1.9850 (2.4561)
335329
Elementary 3.4470 (2.4920)
290015
Lower secondary 5.8191 (3.0059)
210000
Upper secondary 8.3567** (2.6060)
182544
Tertiary 3.5248 (1.7915)
193297
Note: The dependent variable measures the number of hours worked per week by full-time (35+ hours) private
employees in their main jobs, and the real daily minimum wage is measured in logs. Analyses are based on workingage
(15-60 years old) individuals. Sampling weights are used, and standard errors, displayed in round brackets, are clustered.
Control variables in all panels include province and year-month dummies, age, age2/100, married and municipal area
dummies, establishment size, and occupation and industry indicators as well as the log of real per capita GDP per
province and year. Estimations by gender (panel 2) also include education indicators, while estimations for all working-
age individuals and by age group (panels 1 and 3) include a male dummy as well as education indicators, and estimations
by education (panel 4) also include a male dummy.
* p < 0.05 ** p < 0.01 *** p < 0.001
23
4.4 Minimum wages, poverty, and household consumption inequality
So far we have learned that Thai minimum-wages have a positive impact on the average wages of covered
employees, and the effect appears to be fairly homogeneous across skill categories. If anything, the effect is
smaller among the less-educated workers. Even workers with tertiary education benefit from changes in the
minimum wage, which appears to signify that minimum wages represent a social norm that sets the stage for
wage negotiations, even among workers who earn wages well above the minimum.
When we moved to the different margins of adjustments used by employers in response to changes
in the minimum wage, we learned that, in spite of higher levels of noncompliance, the largest disemployment
effects are concentrated among female, older, and less-educated workers. As expected, we found no effects
on employment among workers with tertiary education. The above findings raise the question how minimum-
wage increases affect those who are less well-off. Ultimately, it is an empirical question whether the positive
impact of the minimum wage on average wages is sufficient to compensate for its disemployment effects on
the most vulnerable segments of the labor force.
In this subsection, we address this question from two different angles: the minimum wage’s impact
on the probability of being poor and its impact on household per capita consumption. To these purposes we
rely on a new data set, the Thai Household Socio-Economic Surveys (SES), which was collected in the
following years: 2000, 2002, 2004, 2006, 2007, 2008, 2009, and 2010. The incidence of poverty is obtained
using a consumption approach, and follows official definitions. As such, poor households are those that are
not able to fulfill minimum calorie requirements for their members. Adjustments are made to take into
account the gender and age composition of the household and differences in food prices across regions (see
Jitsuchon, Kakwani, and Plangpraphan, 2006). The average poverty line in 2002 was 1,190 Baht per person
per month (27 US$ of 2002), leaving some 15% of the Thai population in poverty at the time. It is worth
stressing that the official poverty line has been constructed using a base year of 2002 (that is, after the 1997
economic crisis, which led to relevant changes in consumption patterns).
Table 8 presents logit estimates of the probability of the household being poor as a function of the
minimum wage in the province where the household resides. In column 1 we control only for province and
month-year fixed effects. Column 2 adds the household head’s characteristics (a male dummy, age and its
squared term, a married dummy, education, and labor market status indicators); household-level information
(a municipal area dummy, household size, and indicators for the presence of household members younger
than 15 and older than 59 years old); and the log of real per capita GDP per province and year. In both
specifications, the estimated average partial effects are negative and fairly large: a 10 percent increase in the
minimum wage is associated with a 0.7 percentage point reduction in the probability of a household being

24
poor (column 2 of table 8). However, average partial effects are estimated with considerable uncertainty, and
we cannot reject the null that they are equal to zero.
Table 8. Effect of Thai Minimum Wage on Probability of Household Poverty
(Logit APEs)
(1) (2)
Log real daily minimum wage -0.1161
(0.1203)
-0.07219
(0.1199)
Province dummies Yes Yes
Monthly dummies Yes Yes
Household head’s characteristics No Yes
Household characteristics No Yes
Log real yearly province per capita GDP No Yes
N 312985 312872
Note: The dependent variable takes the value 1 for poor households and 0 otherwise, and the real daily minimum wage is
measured in logs. Average partial effects (APEs) are displayed, sampling weights are used, and standard errors, displayed
in round brackets, are clustered. Specification 1 includes only province and year-month dummies. Specification 2 adds
the household head’s characteristics (male dummy, age, age2/10, married dummy, education, and labor market status
indicators); household information (municipal area dummy, household size, and indicators for the presence of
household members younger than 15 and older than 59 years old); and the log of real per capita GDP per province and
year.
* p < 0.05 ** p < 0.01 *** p < 0.001
To gain a better understanding of the impact of the minimum wage on the welfare of the poor, we
now focus on the responses to minimum-wage changes of household consumption per capita. In developed
countries, income per capita at the household level is commonly used as a measure of welfare. In developing
countries, consumption per capita is commonly believed to be a better measure to approximate the

25
permanent income of the household. Income in household surveys tends to be severely understated, a
problem that is much less common in the case of consumption.21
Table 9. Effect of Thai Minimum Wage on Real Per Capita Consumption of Poor Households
(OLS Estimates)
(1) (2)
Log real daily minimum wage 0.5882*
(0.2347)
0.4333
(0.2233)
Province dummies Yes Yes
Monthly dummies Yes Yes
Household head’s characteristics No Yes
Household characteristics No Yes
Log real yearly province per capita GDP No Yes
N 24008 24008
Note: Analyses are based on the sample of poor households. The dependent variable measures the real per capita
consumption of poor households in logs. The real daily minimum wage is measured in logs, too. Sampling weights are
used, and standard errors, displayed in round brackets, are clustered. Specification 1 includes only province and year-
month dummies. Specification 2 adds the household head’s characteristics (male dummy, age, age2/10, married dummy,
education, and labor market status indicators); household information (municipal area dummy, household size, and
indicators for the presence of household members younger than 15 and older than 59 years old); and the log of real per
capita GDP per province and year.
* p < 0.05 ** p < 0.01 *** p < 0.001
In table 9, we restrict the analysis to poor households and estimate the response of their per capita
consumption to changes in the minimum wage. The dependent variable measures (in logs) the real per capita
consumption of poor households, and the regressors are the same as in the previous poverty analyses. The
specification in column 1 of table 8, which controls only for province and month-year fixed effects, indicates
21 We do not use equivalence scales to adjust household consumption per capita levels. We prefer instead to control for
the number of children and elder dependents in the household to account for potential economies of scale.

26
that the impact of the minimum wage on per capita household consumption is positive and statistically
significant at the 5 percent level. Moreover, the estimated elasticity is fairly large: a 10 percent increase in the
minimum wage is associated with an increase in consumption per capita of almost 6 percent for poor
households. However, adding household controls to the regression (column 2 of table 9) reduces the
estimated elasticity to 0.4, which becomes significant only at the 10 percent level.
Finally, we focus on the distributional effects of the minimum wage. In particular, we look into the
effect of the minimum wage along the per capita household consumption distribution. While LFS wage data
are available only for employees, per capita household consumption is available for all households in the SES,
which allows us to provide a broader picture of the welfare effects of minimum-wage legislation. The use of
consumption per capita data has some advantages over alternative summary measures of well-being such as
income. Consumption data are expected to be smoother and less prone to underreporting than income data.
Moreover, consumption captures household welfare better than income, as utility depends on consumption.
Even if household consumption may not be a perfect proxy for welfare (especially among high-earning
households with some saving capacity), the analysis has the potential of capturing some of the general
equilibrium effects of the minimum wage.
The analysis is conducted using standard quantile regressions. The dependent variable is the log of
per capita real household consumption, and explanatory variables are the (log of) the real daily minimum
wage; household heads’ characteristics (male and married dummy, age and its quadratic term, education, and
labor market status indicators); a municipal area; indicators of household composition (household size and
indicators for the presence of household members younger than 15 and older than 59 years old); and the log
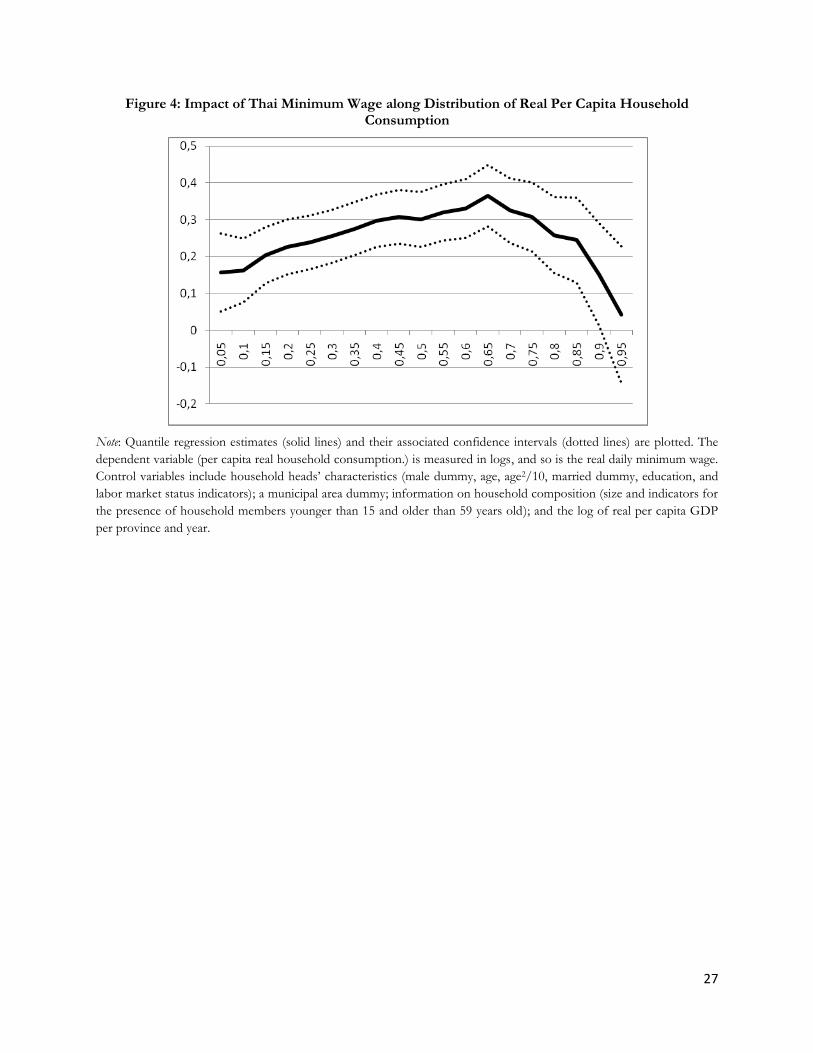
of real per capita GDP per province and year. Figure 4 reports the results. Interestingly, the minimum wage
has a positive impact on per capita household consumption that is statistically significant at all percentiles
below the 90th. However, this effect is not uniform along the distribution, presenting an inverted U-shape. In
particular, the estimated elasticity reaches its maximum (0.35) at the 65th percentile, almost doubling the
elasticities estimated at the lower percentiles of the distribution and more than doubling those estimated
beyond the 90th percentile.
27
Figure 4: Impact of Thai Minimum Wage along Distribution of Real Per Capita Household Consumption
Note: Quantile regression estimates (solid lines) and their associated confidence intervals (dotted lines) are plotted. The
dependent variable (per capita real household consumption.) is measured in logs, and so is the real daily minimum wage.
Control variables include household heads’ characteristics (male dummy, age, age2/10, married dummy, education, and
labor market status indicators); a municipal area dummy; information on household composition (size and indicators for
the presence of household members younger than 15 and older than 59 years old); and the log of real per capita GDP
per province and year.

28
5. Concluding Remarks
The minimum wage in developing countries is often seen as a fundamental tool for lifting the labor market
fortunes of the less favored. However, such a tool may not be effective for several reasons: To begin with, it
is well known that the minimum wage may have adverse effects on employment, precisely among those
workers who are less productive, such as the young, the elderly, and the less-educated in general. Moreover,
these effects may be exacerbated in developing countries, where large fractions of the labor force are
employed through informal arrangements and hence not covered by minimum-wage laws. Even among
formally registered firms, among which one would expect greater enforcement, minimum-wage laws are
associated with considerably high levels of noncompliance. Hence, it is in principle unclear whether the
minimum wage constitutes the right tool for reducing inequality and, ultimately, for alleviating poverty.
This paper examined the impact of the minimum wage on key labor market variables including
employment and wages, but it also extended the analysis to study the impact on household poverty and
consumption per capita during the past decade in Thailand. We find that minimum wage increases also
increase actual wages generally, and they do so more for female and young workers than for prime-aged male
employees. The estimated elasticities are in the range of 0.25–0.5, depending on the subgroup analyzed, and
the average elasticity for the general population of full-time formal sector employees is 0.36. Importantly, we
do not find evidence of minimum wage increases pushing workers into the uncovered sector (comprising
self-employed and unpaid family workers). However, some negative effects of the minimum wage are also
detected: it reduces the probability of being employed, especially among women and elderly workers,
although the estimated impacts are small.
At the aggregate level, the positive impact of the minimum wage on actual wages more than
compensates for the negative effects on employment. Back-of-the-envelope calculations suggest that, even
evaluating employment losses as zero wages, a 10 percent rise in the real minimum wage would have resulted
in an increase of 2.6 percent in the wage bill. However, these gains are not uniformly distributed across the
population: medium- and high-skilled workers benefit the most from a minimum-wage increase.
This conclusion is confirmed by our analysis of the impact of the minimum-wage increases on
consumption per capita at the household level. Although such an impact is always positive—suggesting that
consumption increased more in those provinces where minimum wages grew faster—the largest gains from
minimum-wage rises are observed around the 6th decile of the consumption per capita distribution. In fact,
the minimum wage increased inequality at the bottom half of the distribution, and our estimates are
inconclusive about the scope of minimum wages for poverty reduction in Thailand.

29
References
Alatas, Vivi and Lisa Cameron. 2008. “The Impact of Minimum wages on Employment in a Low Income
Country: A Quasi-Natural Experiment in Indonesia”, Industrial and Labor Relations Review, Vol. 61, No.
2, pp. 201-223
Bell, Linda 1997. “The Impact of Minimum Wages in Mexico and Colombia.” Journal of Labor Economics 15 (3):
S102–S134.
Card, David, and Alan B Krueger. 1997. “Myth and measurement: The new economics of the minimum
wage”. Princeton, NJ: Princeton University Press.
Chandoevwit, Worawan 2010. “The Impact of the Global Financial Crisis and Policy Responses in Thailand.”
TDRI Quarterly Review 25 (1): 12–24.
Margherita Comola & Luiz De Mello, 2011. "How Does Decentralized Minimum Wage Setting Affect
Employment And Informality? The Case Of Indonesia," Review of Income and Wealth, International
Association for Research in Income and Wealth, vol. 57, pages S79-S99, 05.
Cunningham, Wendy V. 2007. “Minimum Wages and Social Policy: Lessons from Developing Countries”.
Directions in Development Series. Washington, DC: World Bank.
Del Carpio, Ximena, Ha Nguyen, and Liang Choon Wang. 2011. “Does the Minimum Wage Affect
Employment? Evidence from the Manufacturing Sector in Indonesia”. World Bank Policy Research
Working Paper 6147
DLPW (Department of Labour Protection and Welfare). 2002. Report of a Study on Wages, Earning, and Hours of
Work [in Thai]. Bangkok: Report of the Ministry of Labour.
Dickens, Richard, Stephen Machin, and Alan Manning. 1999. “The Effects of Minimum Wages on
Employment: Theory and Evidence from Britain.” Journal of Labor Economics 17 (1): 1–22.
Flinn, Christopher 2010. “The Minimum Wage and Labor Market Outcomes”. Cambridge, MA: MIT Press.
Gindling, T. H., and Katherine Terrell. 2007. “The Effects of Multiple Minimum Wages throughout the
Labor Market: The Case of Costa Rica.” Labour Economics 14 (3): 485–511.
———. 2009. “Minimum Wages, Wages and Employment in Various Sectors in Honduras.” Labour Economics
16 (3): 291–303.
ILO (International Labour Office). 2010. Global Wage Report 2010/11: Wage Policies in Times of Crisis. Geneva:
ILO.
Jitsuchon, S., N. Kakwani, and J. Plangpraphan. 2006. “Thailand’s New Official Poverty Line.” Paper
submitted to the National Economic and Social Development Board of Thailand and the United
National Development Programs. Bangkok.
Leckcivilize, Attakrit. 2013. “Minimum Wage and Wage Inequality in Thailand: A Failed
Instrument?”Unpublished manuscript, London School of Economics

30
Lemos, Sara. 2009. “Minimum Wage Effects in a Developing Country.” Labour Economics 16 (2): 224–37.
Magruder, Jeremy. 2013. “Can Minimum Wages Cause the Big Push? Evidence from Indonesia.” Journal of
Development Economics 100 (1): 48–62.
Maloney, William, and Jairo Núñez. 2003. “Measuring the Impact of Minimum Wages: Evidence from Latin
America.” In Law and Employment: Lessons from Latin America and the Caribbean, edited by J. Heckman
and C. Pagés, 109–30. Chicago: University of Chicago Press.
Neumark, David and William Wascher . 2008 Minimum Wages. Cambridge: MIT Press
New York Times. 2013. “Obama’s 2013 State of the Union Address.” Speech transcript. February 12.
Nguyen Viet, Cuong. 2010. “The Impact of a Minimum Wage Increase on Employment, Wages and
Expenditures of Low-Wage Workers in Vietnam.” MPRA Paper No. 36751
NSO (National Statistical Office of Thailand). 2011. “Informal Employed Persons Survey 2011.” Annual
report of survey data, NSO, Bangkok.
Paitoonpong, S., N. Akkarakul, and C. Sukaruji. 2005. “The Minimum Wage-Fixing System in Thailand.”
TDRI Quarterly Review 20 (2): 3–11.
Peetz, David. 1996. Review of Minimum Wage Fixation in Thailand. Bangkok: ILO East Asia Multidisciplinary
Advisory Team.
Rama, Martin. 2001. “The Consequences of Doubling the Minimum Wage: The Case of Indonesia.” Industrial
and Labor Relations Review 54 (4): 864–81.
Terrell, Katherine, Almeida, Rita K.. 2008. “Minimum Wages in Developing Countries : Helping or Hurting
Workers?”. https://openknowledge.worldbank.org/handle/10986/11742 License: CC BY 3.0
Unported.” World Bank, Washington, DC.