Embed Size (px)
Citation preview

Mining servicesRiding the crest of the mining boom
March 2013Publication No. 13-02

Contents
1 OverviewOver the past decade the Australian mining service sector has ridden the wave of the Millennium Mining Boom. However, as commodity prices flat line, the risk environment for the sector is changing.
2 Competitive landscapeThe sector has high concentration, and this is likely to increase as smaller players with sub scale operations struggle to compete and are either bought out by larger players or leave the industry.
3 The Millennium Mining BoomWhilst the Millennium Mining Boom is far from over, it is undergoing a transition which will have fundamental implications for Australian miners and the mining services sector.
4 Good costs and bad costsThe ‘volume over cost’ approach adopted by Australian miners over the past decade is no longer sustainable. As the mining industry shifts its focus to productivity and costs, the mining services sector must do the same.
5 Understanding and improving performanceIn the new era of cost focus and cost cutting, mining service players must respond by increasing productivity through an analysis of their key value drivers and baseline costs, and follow through with performance and benefit analysis.
6 Assessing the risk profile of industry participantsAs the mining industry transitions from a commodity price led boom, to investment driven volume growth, the risk environment for the mining services sector will change.

1 OverviewOver the past decade the Australian mining services sector has ridden the wave of the Millennium Mining Boom. However, as commodity prices flatline and fall and the Australian mining industry repositions itself to replace the real price increases of the past with productivity gains, the risk environment for the mining services sector will change.

The Australian mining services sector has enjoyed average annual growth of 11.5% over the past five years, as it rides the wave of the Millennium Mining Boom.
Whilst growth is expected to moderate over the next five years as falling commodity prices prompt the Australian mining industry to reduce capital investment and manage costs, it is still projected to grow at 6.1% per annum (significantly above GDP growth projections of around 3% per annum).
The major commodities of the Australian mining industry are coal, iron ore and gold. Together these three account for almost 80% of the overall mining industry. Since the early 2000s the mining industry has enjoyed the benefits of rising commodity prices and has funded a massive capital expenditure program to increase production volumes. Unable to manage the increased activity in-house, the mining sector has increasingly outsourced to the mining services sector. As the mining services sector in turn became resource constrained, it was able to take advantage of price indifferent miners and lift margins.
However, with the exception of Gold, commodity prices have been falling since 2012. In response, the mining industry has increasingly focused on in-sourcing and cost savings. As a result competition within the mining services sector will intensify and margins will fall.
44
$12.8 billionRevenue (FY12-13)
$1.5 billionProfit (FY12-13)
11.5 %Annual growth (FY08-13)
6.1%Annual growth (FY13-18)
Major markets
Coal40%
Source: IBISWorld
Iron Ore20%
Nickel6%
Gold19%
Oil and Gas5%
Other10%
$12.8b

The mining services sector is projected to enjoy continued revenue growth (albeit at a reduced annual rate).
55
However, whilst top line growth continues, there is likely to be significant disruptive forces at play within the industry. Rising worldwide mining production volumes, for a range of commodities, will likely result in flat or falling commodity prices over the next five years and will prompt Australian miners to focus more on productivity gains and cost savings. This will change the mining services competitive landscape and those players who do not adapt to the new risk environment will under perform or fail.
Source: IBISWorld
Revenue($b)
12
10
8
6
4
2
0
14
16
18
20
ForecastActual
Mining services revenue growth
Revenue(% change)11.5%
historic average annual increase
FY03 FY04 FY05 FY06 FY07 FY08 FY09 FY11 FY12 FY13 FY14 FY15 FY16 FY17FY10
25%
20%
15%
10%
5%
0%
(5%)
(10%)
(15%)
6.1% project average annual increase

6
The geographic spread of mining services operators reflects that of the overall mining industry and hence is heavily weighted towards Western Australia and Queensland.
Geographical imbalances 6
Mining activity heat map
Percentage of national mining services revenue
Percentage of national population
Western Australia
Northern Territory
South Australia
New South Wales
Victoria
ColdCoolNeutralWarmHot
45%10%
Queensland
13%
Source: ABS, IBISWorld
5%1%
7%26% Tasmania
1%3%
5%7%
33%
24%20%

2 Competitive landscapeThe Australian mining services sector has high concentration, and generally high barriers to entry due to the scale necessary to maintain utilisation of capital equipment. The level of concentration is likely to increase as smaller players with sub scale operations struggle to compete and will either be bought out by larger players or leave the industry.

Concentration in contract mining and heavy equipment supply tends to be relatively high, although the tendency for miners to break up work allows some smaller players to compete. Other sub sectors tend to have lower barriers to entry and lower concentration levels.
This level of concentration reflects, in part, the scale required to maintain utilisation of capital equipment.
Levels of concentration have increased in recent years due to M&A activity undertaken by the larger firms. Industry rationalisation is expected to continue as smaller players with sub scale operations struggle to compete effectively.
However, beyond capital intensive and high barrier to entry mining services such as contract
mining and heavy equipment supply, there is a wide range of other services provided to miners. The competitive characteristics of these sectors are quite different. With generally low capital intensity and low barriers to entry, competition tends to be more price based and industry concentration is much lower.
Mining services firms compete not only with each other, but also with the in house capabilities of mining companies themselves.
888
• Contract mining and mining services
• Earth moving mobile equipment
• Bulk material handling equipment
• Drilling, blasting and rockbreaking equipment
• Hard rock mining equipment
• Labour search, recruitment and HR solutions
• Security intelligence and personnel services
• Safety and health systems and services
• Education and training• Transportation and logistics
service• Equipment maintenance
and management• Metal fabrication• Manufacturing supplies and
services
• Consulting geologists and engineers
• Mine site design, planning and construction
• Analytical laboratory supplies and services
• Engineering services, process and mechanical design
• Mineral analytical and processing services
• Information management systems
• Communication systems
High Low
Low
Barriers to entry
Cap
ital i
nten
sity

3 The Millennium Mining BoomThe recent commodity price falls, and resultant deferral of some major mining projects, have prompted some commentators to call the end of the mining boom. Whilst such comments are premature, the mining boom is transitioning and this will have fundamental implications for Australian miners and the mining services sector.

10
The increase in Australia’s terms of trade during the Millennium Mining Boom has been both the largest and longest since the gold rush of the 1850s. Despite a decline over the past year, Australia’s current terms of trade remain at historically high levels.
The primary driver for the increase in the terms of trade has been the significant increase in commodity prices.
The key driver of the rapid and substantial rise in resource prices has been a demand surge for these commodities in emerging economies. China’s economic growth (its economy has doubled in size every decade along with an urbanisation rate that increased from 20% of the population in the early 1980s to over 50% in 2012) has resulted in large increases in demand for resources and energy over the past decade.
As a consequence of China’s demand for resource commodities there has been a ten-fold increase in the real value of mineral exports to China from Australia rising from $5 billion 2002–03 to around $50 billion in 2010–11.
Between 2003 and 2011 an improvement in the terms of trade contributed to about half of the overall annual increase in Australia’s real gross national income.
Terms of trade
Source: Australian Bureau of Statistics
60
40
20
1959 1969 1979 1989 1999 2009
80
100
120
Index 2010=100Australia’s terms of trade
5 year centred moving average
Contributions to income growth
Source: Bureau of Resources and Energy Economics | Australian Treasury
GNI perperson
(1%)
0%
1%
2%
3%
1990s 2000s
Labour utilisationLabour productivity Foreign income flowsTerms of trade
11
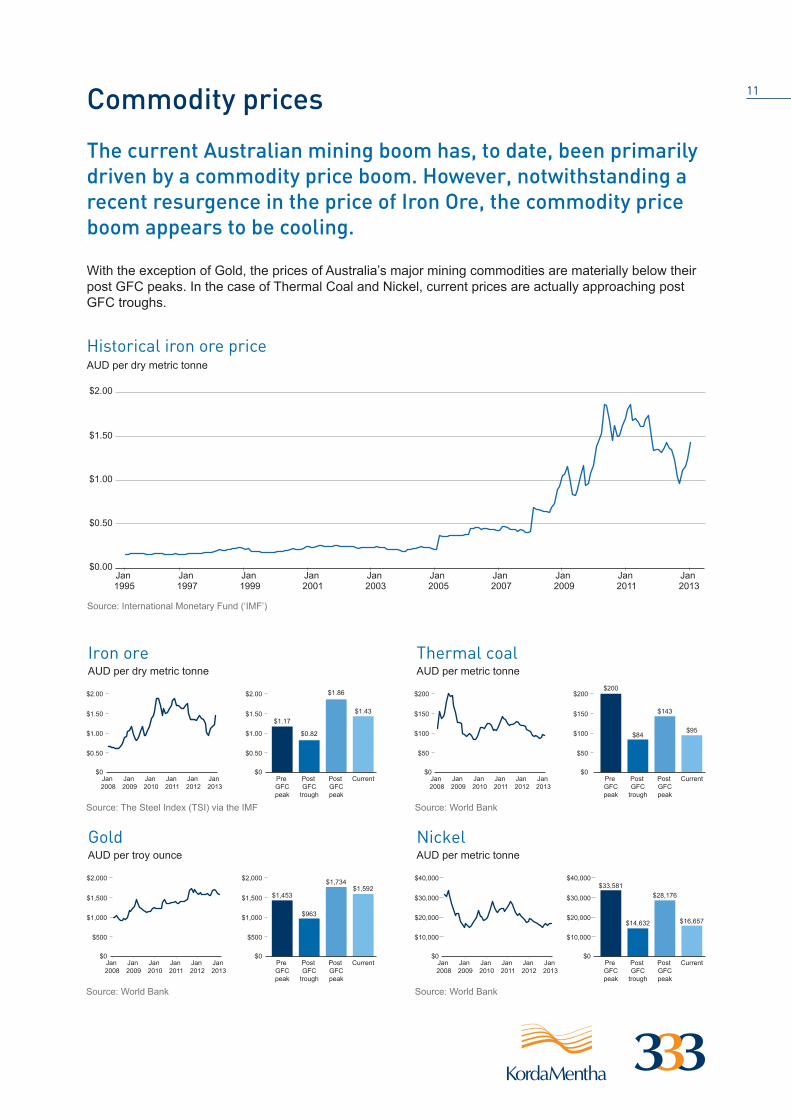
The current Australian mining boom has, to date, been primarily driven by a commodity price boom. However, notwithstanding a recent resurgence in the price of Iron Ore, the commodity price boom appears to be cooling.
Commodity prices
With the exception of Gold, the prices of Australia’s major mining commodities are materially below their post GFC peaks. In the case of Thermal Coal and Nickel, current prices are actually approaching post GFC troughs.
Source: International Monetary Fund (‘IMF’)
$0.00
$0.50
$1.00
$1.50
$2.00
Jan 1995
Jan 1997
Jan 1999
Jan 2001
Jan 2003
Jan 2007
Jan 2009
Jan 2011
Jan 2013
Jan 2005
AUD per dry metric tonneHistorical iron ore price
Iron ore
Source: The Steel Index (TSI) via the IMF
AUD per dry metric tonne
$0
$0.50
$1.00
$1.50
$2.00
Jan 2008
Jan 2009
Jan 2010
Jan 2011
Jan 2012
Jan 2013
$0
$0.50
$1.00
$1.50
$2.00
Pre GFCpeak
Post GFC
trough
Post GFCpeak
Current
$1.17
$0.82
$1.86
$1.43
Thermal coal
Source: World Bank
AUD per metric tonne
$0
$50
$100
$150
$200
Jan 2008
Jan 2009
Jan 2010
Jan 2011
Jan 2012
Jan 2013
$0
$50
$100
$150
$200
Pre GFCpeak
Post GFC
trough
Post GFCpeak
Current
$200
$84
$143
$95
Gold
Source: World Bank
AUD per troy ounce
$0
$500
$1,000
$1,500
$2,000
Jan 2008
Jan 2009
Jan 2010
Jan 2011
Jan 2012
Jan 2013
$0
$500
$1,000
$1,500
$2,000
Pre GFCpeak
Post GFC
trough
Post GFCpeak
Current
$1,453
$963
$1,734$1,592
Nickel
Source: World Bank
AUD per metric tonne
$0
$10,000
$20,000
$30,000
$40,000
Jan 2008
Jan 2009
Jan 2010
Jan 2011
Jan 2012
Jan 2013
$0
$10,000
$20,000
$30,000
$40,000
Pre GFCpeak
Post GFC
trough
Post GFCpeak
Current
$33,581
$14,632
$28,176
$16,657

12
The recent commodity price falls, and resultant deferral of some major mining projects, have prompted some commentators to call the end of the mining boom. Such comments are premature.
Is the party over?
The day after BHP Billiton announced the shelving of its USD 30 billion plus Olympic Dam project, Resources Minister Martin Ferguson declared the mining boom was over. BHP Billiton’s deferral of capex programs has not been isolated. In the face of falling prices and rising capital costs, the majority of major miners have announced deferrals of capex programs.
Recent capex updates
The growth in commodity prices over the past decade has had a lasting impact on the landscape of the Australian mining industry. Regardless of capex plans over the next few years, the capital investment in mining capacity over the past 10 years (in response to the rising commodity prices) has built a significant increase in Australian mining’s productive capacity. Between 2002 and 2012, annual mining capex increased at an annual rate of 23%, reaching a record level of $82.1 billion in 2012 (six times greater than annual average capex over the past 30 years).
And, notwithstanding recent capex deferrals, the pipeline remains strong. Historically high levels of investment will last for at least the next few years given the time it will take for some very large committed projects to reach completion.
Recent capex updates
BHP Billiton Delayed large projects
Rio Tinto Confirmed 2012 capex
Xstrata Deferred capex
Fortescue Lowered 2012 capex est.
Recent capex updates
Vale Confirmed 2012 capex
Newmont Lowered 2012 capex est.
Barrick Increased 2012 capex est.
AngloAmerican Lowered 2012 capex est.
Mining capital expenditure
Source: Australian Bureau of Statistics
Mining project pipeline
Source: Bureau of Resources and Energy Economics
0
$200
$400
$600
$800Billions
Billions
PipelineCompleted to date
Committed Feasibility stage Publicly announced
Jun1991
Jun1987
Jun1999
Jun1995
Jun2003
Jun2011
Jun2007
10
15
15
0
20
25
30
$101 billion
$268 billion
$292 billion
$133 billion

13
Over the longer term high levels of investment are unlikely to be maintained if resource commodity prices continue to fall. But production volume will continue to increase by virtue of past investment in productive capacity and growing worldwide demand. Bulk commodity exports are forecast to almost double from 783 million tonnes in 2011 to 1,498 million tonnes in 2025.
Bulk commodities
2007 2009 2011 2013 2015 2017 2019 2021 2023 2025
Additional exportvolume = 760 Mt
2011 exports = 738 Mt
0
50
100
250
300
150
200
250
300Milliontonne
Source: Bureau of Resources and Energy Economics
Export values World price
Iron ore and pellets 8% 27%
Metallurgical coal 12% 28%
Thermal coal 14% 11%
Gold 5% 4%
LNG 21% 12%
Copper 10% 4%

14
The recent peaking in commodity prices, the ongoing capital expenditure and the steady increase in productive volumes is consistent with typical mining boom life cycles.
Phase 1 - Commodity Price
The real price of iron ore rose over six-fold, the real metallurgical coal price over five-fold from 2002 to the peak at the end of 2011, and from ‘trough to peak’ the real price of thermal coal has risen more than three-fold. Prices fell in 2012 but still remain high compared to their levels before the start of the mining boom. The downward pressure in commodity prices in 2011 and 2012 (due to moderating economic growth in China and euro zone recession concerns) is expected to continue as the completion of major mining projects increases global production volumes.
Phase 2 - Capital investment
The second phase of the boom began sometime around 2008 and has yet to reach its peak.
Phase 3 - Production volume
The third phase is not likely to peak until sometime around 2025. Past and current capital investment will likely result in a tripling of Australia’s resource and energy exports (from 2002 to 2025). Unlike the first two phases, this phase is unlikely to follow a ‘peak and decline’ trajectory, but rather a levelling out of volumes. As such, these volume increases will be long lasting and will help sustain the benefits of the mining boom well beyond the peaks of 2012.
Mining boom lifecycle
Mining boom lifecycle
Phase 3Production
volume
Phase 2Capital
investment
Phase 1Commodity
price
2002 2012 2025
Phase 1 Phases 2 and 3

15
Whilst the Millennium Mining Boom has someway to run, the transition from Phase 1 to Phases 2 and 3 changes the competitive landscape for miners. In order to sustain the benefits already reaped, they will need to increasingly focus on achieving real productivity gains. This change in focus will, in turn, have significant implications for the mining services sector.
Reliance on favourable terms of trade to fuel growth is not sustainable. The ‘easy’ gains of real price increases have passed. As the mining boom enters its second and third phases, a projected decline in the terms of trade will require the Australian mining industry to substantially increase productivity growth.
The ‘goldilocks’ era of ever increasing real commodity prices is over. To avoid the ‘bad news bears’ of falling terms of trade and on-going low productivity growth (which would lead to stagnating income), the Australian mining industry must achieve higher productivity growth. Australian miners have recognised the challenges ahead. A renewed focus on costs and subsequent in-sourcing and cutting back on contracted services will have fundamental implications for the mining services sector.
Sustaining gains into the future
Terms of trade and producitivty growth
Source: Bureau of Resources and Energy Economics
Bears‘bad news’
Productivityagenda
Goldilocks
Low(2000s)
High(1990s)
Terms oftrade
Productivity GrowthDecline
Maintain
2011-12
4 Good costs and bad costsThe ‘volume over cost’ approach over the past decade is no longer sustainable. As the Australian mining industry shifts its focus to productivity and costs, the mining services sector must do the same.

A recent slowdown in the resources sector has prompted miners to cut back on contracted services.
A combination of rising capital costs due to a high Australian dollar over most of the past five years and recent lower commodity prices has resulted in lower growth rates in the Australian resources sector.
A new report has warned labour costs in Australia’s mining industry are among the highest in the world.
The Minerals Council of Australia report said the latest modelling revealed capital costs had made new thermal coal projects 66% more expensive and iron ore projects 30% more costly to build than the global average.
The paper, produced by Port Jackson Partners, found real GDP would be 5.3% lower in 2040 if Australia does not act to boost competitiveness.
The report outlined measures that could be adopted, including halting spiraling wage costs by deploying skilled immigration and sending workers in manufacturing jobs on the east coast to mining jobs in Western Australia.
As prices of key commodities such as iron ore and coking coal return to longer-term averages from the boom levels of the past decade, Australian miners will need to focus globally on being among the lowest-cost producers.
This contrasts with the ‘volume over cost’ approach taken over the past decade when a supply shortage driven by China led to a boom in prices and an opportunity to maximise profit.
171717
“As Rio puts it, there are good costs and bad costs. Good costs are associated with expanding output to allow you to maximise your throughput. Bad costs are things you look to keep under control.” BT Investment Management portfolio manager Tim Barker
April 2012 NSW engineering and foundry group Bradken reduced its earnings guidance by 12% in the wake of continued slowing of activity among coal and iron ore producers.
April 2012 NSW engineering and foundry group Bradken reduced its earnings guidance by 12% in the wake of continued slowing of activity among coal and iron ore producers.
May 2012 More than 2000 jobs have been lost in the Queensland coal sector, including at mines owned by BHP, Rio, Xstrata and Ensham Resources.
July 2012 Rio Tinto informed employees of plans to cut spending on support and services by 10% globally.
August 2012 BHP Billiton’s proposed USD 30 billion expansion of the Olympic Dam open pit postponed, with the company citing falling commodity prices and higher capital costs.Drilling company Boart Longyear, whose clients include BHP Billiton, Rio Tinto and Fortescue Metals Group, unexpectedly cut its 2012 earnings guidance.The recently listed Calibre Group retrenched 50 staff.Fortescue cut hundreds of jobs in an effort save USD 1.9 billion.
October 2012 Brisbane-based Sedgman Ltd confirmed it would cut the number of contractors it employs and initiate a voluntary redundancy program for staff “to remain competitive in the tightening market”. Sedgman is heavily exposed to the coal sector.
Cost-cutting initiatives include cutting back spending on contractors, exploration, travel and office rent as miners look to keep margins as high as possible.
Mining services providers are poised to make more cuts, as the slowdown in the resources sector puts pressure on contractors’ earnings.
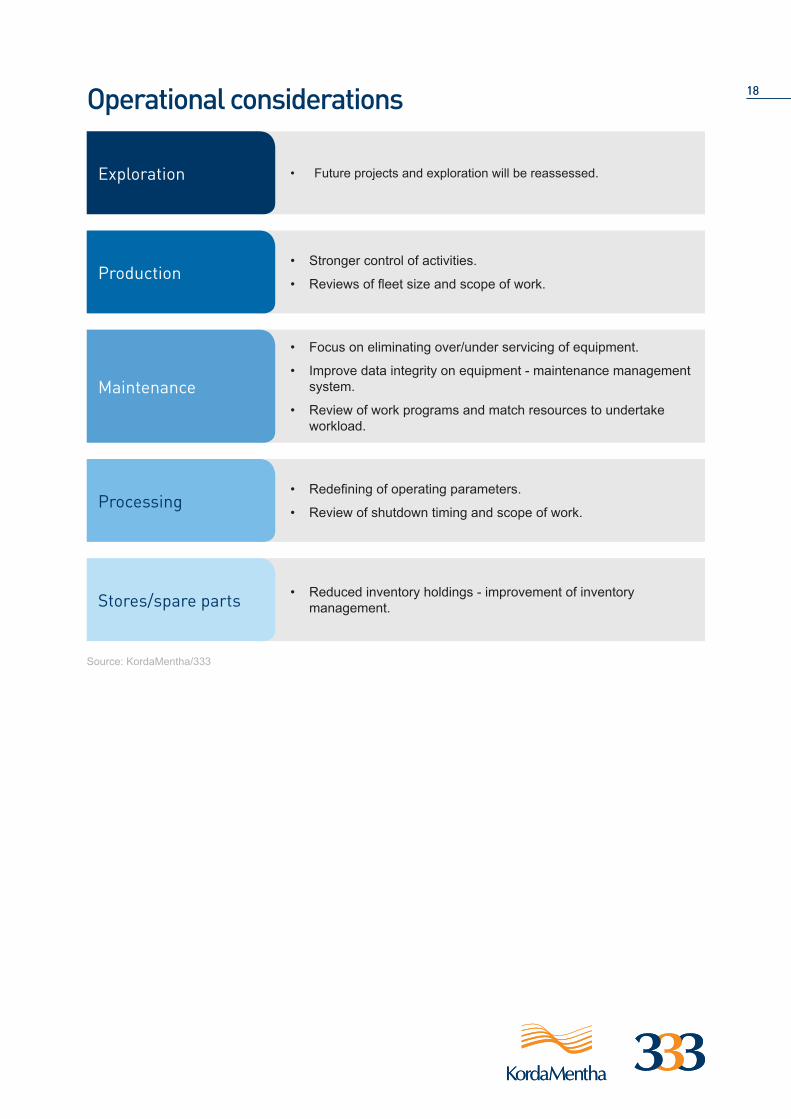
1818Operational considerations
• Future projects and exploration will be reassessed.Exploration
• Stronger control of activities.
• Reviews of fleet size and scope of work.Production
• Focus on eliminating over/under servicing of equipment.
• Improve data integrity on equipment - maintenance management system.
• Review of work programs and match resources to undertake workload.
Maintenance
• Redefining of operating parameters.
• Review of shutdown timing and scope of work.Processing
• Reduced inventory holdings - improvement of inventory management.Stores/spare parts
Source: KordaMentha/333

1919
JPMorgan’s latest measurement of sentiment among small and large contractors is sobering. The index shows expectations of both profit margins and forward order books have slumped by 30% in just six months as delays and cancellations by major miners filter through to the service companies.
The sector is recognising the challenge to improve productivity and deliver projects to clients’ expectations.
The path will be a difficult one, with casualties along the way. A number of high-profile chief executives have departed in recent months as mining contractors seek to re-align their strategy to the new market conditions.
19
A recent JPMorgan survey illustrates the gloomy mood surrounding the Australian contracting sector with expectations plummeting in the second half of 2012.
Contractors see tough times ahead
“We can’t simply expect the customers to continue to take all the risks if we’re behind schedule or we’re not coming up with the goods in terms of the workforce to perform the activities we’ve been contracted to do.”
“I do think, across the sector, the risk and reward equation has got a little bit out of balance, with certain companies perhaps taking on more than they can handle. The minute you go one project too many and you’re hiring off the street to fill your key slots, your risk profile changes dramatically.”Kevin Gallagher, Chief Executive of Clough
Sliding sentiment
2008 2009 2010 2011 2012
25
30
45
35
40
Source: JPMorgan
50
55
1H 2H 1H 2H1H 2H1H 2H1H 2H
JPMorgan Contractor Expectations Index (points)
Improving
Declining

5 Understanding and improving performance
In the new era of cost focus and cost cutting, mining service players must respond by increasing productivity through an analysis of their key value drivers and baseline costs, and follow through with performance and benefits analysis.

21
In the new era of cost focus and cost cutting, mining service players must respond by increasing productivity through an analysis of key value drivers and baseline costs and undertake and follow through with performance and benefits analysis.
Operations 21
Value drivers and cost analyses Performance analyses
Benefit analyses
End to end Impact of improving end to end serviceKey value drivers
ROCE
EBITDA
Invested capital
Revenue
• Contract structure• $/metre
advanced• $/tonne hauled• $/hr availability• Plan versus
actual
By asset, by location, by customer:• Financial
utilisation• Time utilisation• Availability
• Contract structure• $/metre advanced• $/tonne hauled• $/hr availability• Plan versus actual
Cost
• Labour• Spare parts• Consumables• Overheads
• Process alignment
• Actual v std (time)• Costs % revenue• Skills flexibility %• Workload %• Skills shortfall%
• Step change reduction in lifecycle cost
Asset Investment
• Amount of equipment
• Type/age of equipment
• Location of equipment
• Fleet age• Asset register
accuracy
• Release of cash through lower number of assets
• Redeploy to other locations
Working capital
• Debtors• Creditors• Inventory
• Inventory accuracy
• Release of cash through lower asset inventory
Source: KordaMentha/333
2222
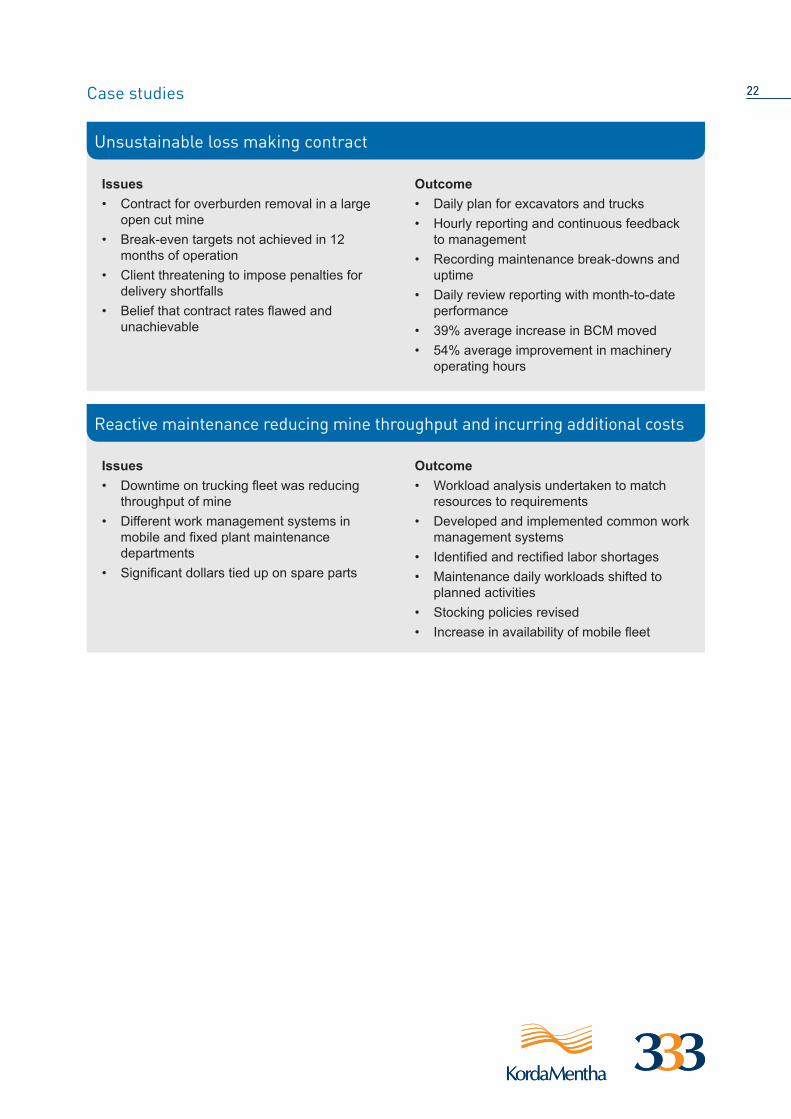
Issues • Contract for overburden removal in a large
open cut mine• Break-even targets not achieved in 12
months of operation • Client threatening to impose penalties for
delivery shortfalls • Belief that contract rates flawed and
unachievable
Outcome • Daily plan for excavators and trucks • Hourly reporting and continuous feedback
to management • Recording maintenance break-downs and
uptime• Daily review reporting with month-to-date
performance • 39% average increase in BCM moved • 54% average improvement in machinery
operating hours
Issues • Downtime on trucking fleet was reducing
throughput of mine • Different work management systems in
mobile and fixed plant maintenance departments
• Significant dollars tied up on spare parts
Outcome • Workload analysis undertaken to match
resources to requirements • Developed and implemented common work
management systems • Identified and rectified labor shortages • Maintenance daily workloads shifted to
planned activities • Stocking policies revised • Increase in availability of mobile fleet
Unsustainable loss making contract
Reactive maintenance reducing mine throughput and incurring additional costs
Case studies

Availability and utilisation are the key metrics when understanding the drivers of operational performance of mining and mining service companies.
23
Source: KordaMentha/333
Operating timeOperating time is the net available time minus all other downtime (i.e. breakdowns, set up time and maintenance)
Net available timeNet available time is the total scheduled time minus contractual required downtime (i.e. paid lunches and breaks)
Run hoursActual run hours of a piece of equipment during a shift
• Development decline • Development lateral• Stope haulage• Development haulage• Waste to surface • Production drilling• Shotcrete• Cable
• Metres/hour• Tonnes/truck• Tonnes/trucked km
• Review all PM’s in respect to timing of services• Review current performance in regard to PM’s,
planned and breakdown jobs• Establish daily plans for all operators and estimated
hours to complete• Integrate all maintenance into weekly mine plan• Ensure CMMS is capturing all relevant data• Review tracking system of run hours, PM’s,
availability and utilisation• Install resource planning/operating system• Establish integrated weekly plan• Establish 24 hour plan that ensures delivery of
weekly plan• Establish mine control shift reporting• Establish required equipment for each shift
releasing people for other tasks
• Develop delay summary by mining and maintenance• Install resource planning/operating systems• Review cycle times for each process and establish
targets for each shift for equipment based on location
• Establish weekly maintenance plan by priorities• Establish 24 hour mine plan with clear priorities• Report variances and reasons for variances to
ensure remedial action is taken• Establish key performance indicators to ensure
tracking of quarterly plans/mine plans• Develop operating system that links from the
quarterly plan, to the month forecast to the weekly plan down to each shift to ensure delivery
• Skills flexibility of workforce/skills training
Equipment availability Equipment utilisation Throughput Yield
Examples of interventions

2424
Issues • ‘Hand to mouth’ existence in terms of mine
to mineral processing • Inconsistent task assignment and follow up • ‘Black magic’ in managing the process • Reporting system complicated and time
consuming - same measure, different interpretation
• Credibility issues with performance reporting across operations
Outcome • Operating parameters and volumes
redefined and the structure of the organisation realigned
• $20 million pa savings through improvements in mining costs, processing throughputs, product recoveries and yields, maintenance activity and contractor management
Issues • Management could not understand why
utilisation was high but revenue was low • Poor work management system gave
limited visibility over the total operation • Skills shortages in maintenance and
operations • Poor working capital management
Outcome • Detailed rig by rig operational forecast
model built, improved rig performance metrics
• Restructure of the maintenance department, reduction in rig downtime
• Restructure of the back office and support function, cost savings
Switching focus from production throughput to cost reductions
Asset by asset performance assessment and turnaround
Case studies

6 Assessing the risk profile of industry participants
As the mining industry transitions from a commodity price led boom to investment-driven volume growth, the risk environment for mining contractors will change.

Those contractors who do not adequately respond to the changing environment may see their risk profile increase significantly, with a consequent rise in trading underperformance and, ultimately, business failure.
262626
Risk indicators Success factors
• Exposure to mining operations focused on peripheral commodities
• Non-niche sector with high competition
• Exposure to countries with volatile political and legislative regimes
• Concentrated service offering or lack of scale
• Exposure to production volumes as opposed to exploration and mining capex
• Exposure to key global commodities
• Niche market or service offering
Sector focus
• M&A activity that further concentrates service offerings or limits exposure to recurring revenues
• Low profit growth
• Mixture of organic and M&A growth
• Growth focus on scale, extending services and recurring revenue streams
• Maintaining utilisation level and flexibility to bring on additional capacity
Growth strategy
• Limited exposure to life cycle revenues, leading to earnings volatility
• Poor risk management and pricing, leading to long term projects becoming unprofitable or mismanaged
• Driving competition amongst service providers
• Cost curve of the mine
• Cost curve of the mine
• Diversification
• Pipeline of realistic medium term projects - Downside protection (eg. minimum guaranteed hours)
Customer mix
• Funding the ‘Mega Project’ may push ‘skinny’ balance sheets beyond their limits and not allow sufficient headroom to allow for execution risk and working capital pressures
• Poor tendering disciplines and a weak grasp of actual cost structures can lead to ‘locked-in’ contracts with margins that are unintentionally slim (or even negative). This is particularly relevant in a high inflation environment where mining costs have inflated by 7% - 8% per annum whereas long term contracts often limit cost growth to CPI.
• Recurring revenue streams with balanced sharing of risks between miner and contractor
• Strong tendering disciplines with appropriate senior management review and willingness to ‘walk away’ if profitability too low
Project mix
• High level of gearing
• High capital intensity (relative to peers)
• Weak management team, high management turnover
• Poor systems and reporting
• Strong balance sheets to execute projects and fund growth
• Seasoned management team with strong track record
• Appropriate investment in systems and controls
Other
Source: KordaMentha/333

This publication, and the information contained therein, is prepared by KordaMentha Partners and staff. It is of a general nature and is not intended to address the circumstances of any particular individual or entity. It does not constitute advice, legal or otherwise, and should not be relied on as such. Professional advice should be sought prior to actions being taken on any of the information. The authors note that much of the material presented was originally prepared by others and this publication provides a summary of that material and the personal opinions of the authors.
Limited liability under a scheme approved under Professional Standards Legislation.
Contacts
MelbourneLevel 24333 Collins StreetMelbourne 3000Victoria AustraliaTel: +61 3 8623 3333Fax: +61 3 8623 [email protected]
SydneyLevel 5 Chifley Tower2 Chifley SquareSydney 2000New South Wales, AustraliaTel: +61 2 8257 3000Fax: +61 2 8257 [email protected]
PerthLevel 1137 St Georges TerracePerth 6000Western Australia, AustraliaTel: +61 8 9220 9333Fax: +61 8 9220 [email protected]
TownsvilleLevel 675 Denham StreetTownsville 4810Queensland, AustraliaTel: +61 7 4724 5455Fax: +61 7 4724 [email protected]
Singapore30 Robinson RoadRobinson Towers#12-01Singapore 048546Tel: +65 6593 9333Fax: +65 6593 [email protected]
AdelaideLevel 470 Pirie StreetAdelaide 5000South Australia, AustraliaTel: +61 8 8212 6322Fax: +61 8 8212 [email protected]
BrisbaneLevel 1412 Creek StreetBrisbane 4000Queensland, Australia Tel: +61 7 3338 0222Fax: +61 7 3338 [email protected]
New ZealandLevel 16 Tower Centre45 Queen StreetAuckland 1010New ZealandTel: +64 9 307 7865Fax: +64 9 377 [email protected]

![Mining Investment Beyond The Boom · 2018-09-17 · Mining Investment Beyond the Boom Keaton Jenner, Aaron Walker, Cathie Close and Trent Saunders[*] Photo: Cuhrig – Getty Images](https://img.pdfslide.net/doc/110x75/5e4e6856a70e232f807b5633/mining-investment-beyond-the-boom-2018-09-17-mining-investment-beyond-the-boom.jpg)