Embed Size (px)
Citation preview
Ministry of Agriculture &
Farmers Welfare
Report of the Committee on
Doubling Farmers’ Income
Volume XIII
“Structural Reforms and
Governance Framework”
“Strengthening the Institutions, Infrastructure and
Markets that Govern Agricultural Growth”
Document prepared by the Committee on Doubling Farmers’ Income,
Department of Agriculture, Cooperation and Farmers’ Welfare,
Ministry of Agriculture & Farmers’ Welfare.
January 2018
Doubling Farmers’ Income – Volume XIII
Structural Reforms and Governance Framework
i
Foreword
The country has witnessed a series of concerted discussions dealing with the subject of
agriculture. In 1926, the Royal Commission of Agriculture was set up to examine and report
the status of India’s agricultural and rural economy. The Commission made comprehensive
recommendations, in its report submitted in 1928, for the improvement of agrarian economy
as the basis for the welfare and prosperity of India’s rural population. The urban population
was about 11 per cent of the whole, and demand from towns was small in comparison. The
Commission notes, that communication and physical connectivity were sparse and most
villages functioned as self-contained units. The Commission encompassed review of
agriculture in areas which are now part of Pakistan, Bangladesh and Myanmar. The net sown
area in erstwhile British India was reported as 91.85 million hectares and cattle including
buffaloes numbered 151 million. Almost 75 per cent of the cultivated area was under cereals
and pulses, with rice and wheat occupying 46 per cent of the net sown area. The area under
fruits and vegetables was about 2.5 per cent and that under oilseeds and non-food crops was
about 20 per cent. In the ensuing years, as well known, the country underwent vast changes in
its political, economic and social spheres.
Almost 40 years later, free India appointed the National Commission on Agriculture in 1970,
to review the progress of agriculture in the country and make recommendations for its
improvement and modernisation. This Commission released its final report in 1976. It refers to
agriculture as a comprehensive term, which includes crop production together with land and
water management, animal husbandry, fishery and forestry. Agriculture, in 1970 provided
employment to nearly 70 per cent of the working population. The role of agriculture in the
country’s economic development and the principle of growth with social justice, were core to
the discussions. The country was then facing a high population growth rate. After impressive
increase in agricultural production in the first two Five Year Plans, a period of stagnancy set in
and the country suffered a food crisis in the mid-1960s. The report in fifteen parts, suggested
ample focus on increased application of science and technology to enhance production.
Thirty years hence, the National Commission for Farmers was constituted in 2004 to suggest
methods for faster and more inclusive growth for farmers. The Commission made
comprehensive recommendations covering land reforms, soil testing, augmenting water
availability, agriculture productivity, credit and insurance, food security and farmers
competitiveness. In its final report of October 2006, the Commission noted upon ten major
goals which included a minimum net income to farmers, mainstreaming the human and gender
dimension, attention to sustainable livelihoods, fostering youth participation in farming and
post-harvest activities, and brought focus on livelihood security of farmers. The need for a
single market in India to promote farmer-friendly home markets was also emphasised.
The now constituted DFI (Doubling Farmers’ Income) Committee besides all these broad
sectoral aspects, invites farmers’ income into the core of its deliberations and incorporates it as
the fulcrum of its strategy. Agriculture in India today is described by a net sown area of 141
million hectares, with field crops continuing to dominate, as exemplified by 55 per cent of the
area under cereals. However, agriculture has been diversifying over the decades. Horticulture
now accounts for 16 per cent of net sown area. The nation’s livestock population counts at
more than 512 million. However, economic indicators do not show equitable and egalitarian
growth in income of the farmers. The human factor behind agriculture, the farmers, remain in
Doubling Farmers’ Income – Volume XIII
Structural Reforms and Governance Framework
ii
frequent distress, despite higher productivity and production. The demand for income growth
from farming activity, has also translated into demand for government to procure and provide
suitable returns. In a reorientation of the approach, this Committee suggests self-sustainable
models empowered with improved market linkage as the basis for income growth of farmers.
India today is not only self-sufficient in respect of demand for food, but is also a net exporter
of agri-products occupying seventh position globally. It is one of the top producers of cereals
(wheat & rice), pulses, fruits, vegetables, milk, meat and marine fish. However, there remain
some chinks in the production armoury, when evaluated against nutritional security that is so
important from the perspective of harvesting the demographic dividend of the country. The
country faces deficit of pulses & oilseeds. The availability of fruits & vegetables and milk &
meat & fish has increased, thanks to production gains over the decades, but affordability to a
vast majority, including large number of farmers too, remains a question mark.
The impressive agricultural growth and gains since 1947 stand as a tribute to the farmers’
resilience to multiple challenges and to their grit & determination to serve and secure the
nation’s demand for food and raw material for its agro-industries.
It is an irony, that the very same farmer is now caught in the vortex of more serious challenges.
The average income of an agricultural household during July 2012 to June 2013 was as low as
Rs.6,426, as against its average monthly consumption expenditure of Rs.6,223. As many as
22.50 per cent of the farmers live below official poverty line. Large tracts of arable land have
turned problem soils, becoming acidic, alkaline & saline physico-chemically. Another primary
factor of production, namely, water is also under stress. Climate change is beginning to
challenge the farmer’s ability to adopt coping and adaptation measures that are warranted.
Technology fatigue is manifesting in the form of yield plateaus. India’s yield averages for most
crops at global level do not compare favourably. The costs of cultivation are rising. The
magnitude of food loss and food waste is alarming. The markets do not assure the farmer of
remunerative returns on his produce. In short, sustainability of agricultural growth faces serious
doubt, and agrarian challenge even in the midst of surpluses has emerged as a core concern.
Farmers own land. Land is a powerful asset. And, that such an asset owning class of citizens
has remained poor is a paradox. They face the twin vulnerabilities of risks & uncertainties of
production environment and unpredictability of market forces. Low and fluctuating incomes
are a natural corollary of a farmer under such debilitating circumstances. While cultivation is
boundarised by the land, market need not have such bounds.
Agriculture is the largest enterprise in the country. An enterprise can survive only if it can grow
consistently. And, growth is incumbent upon savings & investment, both of which are a
function of positive net returns from the enterprise. The net returns determine the level of
income of an entrepreneur, farmer in this case.
This explains the rationale behind adopting income enhancement approach to farmers’ welfare.
It is hoped, that the answer to agrarian challenges and realisation of the aim of farmers’ welfare
lies in higher and steady incomes. It is in this context, that the Hon’ble Prime Minister shared
the vision of doubling farmers’ income with the nation at his Bareilly address on 28th February,
2016. Further, recognising the urgent need for a quick and time-bound transformation of the
Doubling Farmers’ Income – Volume XIII
Structural Reforms and Governance Framework
iii
vision into reality, a time frame of six years (2016-17 to 2022-23) was delineated as the period
for implementation of a new strategy.
At the basic level, agriculture when defined as an enterprise comprises two segments –
production and post-production. The success of production as of now amounts to half success,
and is therefore not sustainable. Recent agitations of farmers (June-July 2017) in certain parts
of the country demanding higher prices on their produce following record output or scenes of
farmers dumping tractor loads of tomatoes & onions onto the roads or emptying canisters of
milk into drains exemplify neglect of other half segment of agriculture.
No nation can afford to compromise with its farming and farmers. And much less India,
wherein the absolute number of households engaged in agriculture in 2011 (119 million)
outpaced those in 1951 (70 million).Then, there are the landless agricultural labour who
numbered 144.30 million in 2011 as against 27.30 million in 1951. The welfare of this
elephantine size of India’s population is predicated upon a robust agricultural growth strategy,
that is guided by an income enhancement approach.
This Committee on Doubling Farmers’ Income (DFI) draws its official members from various
Ministries / Departments of Government of India, representing the panoply of the complexities
that impact the agricultural system. Members drawn from the civil society with interest in
agriculture and concern for the farmers were appointed by the Government as non-official
members. The DFI Committee has co-opted more than 100 resource persons from across the
country to help it in drafting the Report. These members hail from the world of research,
academics, non-government organisations, farmers’ organisations, professional associations,
trade, industry, commerce, consultancy bodies, policy makers at central & state levels and
many more of various domain strengths. Such a vast canvas as expected has brought in a
kaleidoscope of knowledge, information, wisdom, experience, analysis and unconventionality
to the treatment of the subject. The Committee over the last more than a year since its
constitution vide Government O.M. No. 15-3/2016-FW dated 13th April, 2016 has held
countless number of internal meetings, multiple stakeholder meetings, several conferences &
workshops across the country and benefitted from many such deliberations organised by others,
as also field visits. The call of the Hon’ble Prime Minister to double farmers’ income has
generated so much of positive buzz around the subject, that no day goes without someone
calling on to make a presentation and share views on income doubling strategy. The Committee
has been, therefore, lucky to be fed pro-bono service and advice. To help collage, analyse and
interpret such a cornucopia of inputs, the Committee has adopted three institutes, namely,
NIAP, NCAER and NCCD. The Committee recognizes the services of all these individuals,
institutions & organisations and places on record their service.
Following the declaration of his vision, the Hon’ble Prime Minister also shaped it by
articulating ‘Seven Point Agenda’, and these have offered the much needed hand holding to
the DFI Committee.
The Committee has adopted a basic equation of Economics to draw up its strategy, which says
that net return is a function of gross return minus the cost of production. This throws up three
(3) variables, namely, productivity gains, reduction in cost of cultivation and remunerative
price, on which the Committee has worked its strategy. In doing so, it has drawn lessons from
the past and been influenced by the challenges of the present & the future.
Doubling Farmers’ Income – Volume XIII
Structural Reforms and Governance Framework
iv
In consequence, the strategy platform is built by the following four (4) concerns:
Sustainability of production
Monetisation of farmers’ produce
Re-strengthening of extension services
Recognising agriculture as an enterprise and enabling it to operate as such, by
addressing various structural weaknesses.
Notwithstanding the many faces of challenges, India’s agriculture has demonstrated
remarkable progress. It has been principally a contribution of the biological scientists,
supplemented by an incentivising policy framework. This Committee recognizes their valuable
service in the cause of the farmers. It is now time, and brooks no further delay, for the new
breed of researchers & policy makers with expertise in post-production technology,
organisation and management to take over the baton from the biological scientists, and let the
pressure off them. This will free the resources, as also time for the biological scientists to focus
on new science and technology, that will shift production onto a higher trajectory - one that is
defined by benchmark productivities & sustainability. However, henceforth both production &
marketing shall march together hand in hand, unlike in the past when their role was thought to
be sequential.
This Report is structured through 14 volumes and the layout, as the readers will appreciate, is
a break from the past. It prioritizes post-production interventions inclusive of agri-logistics
(Vol. III) and agricultural marketing (Vol-IV), as also sustainability issues (Vol-V & VI) over
production strategy (Vol. VIII).The readers will, for sure value the layout format as they study
the Report with keenness and diligence. And all other volumes including the one on Extension
and ICT (Vol. XI), that connect the source and sink of technology and knowledge have been
positioned along a particular logic.
The Committee benefited immensely from the DFI Strategy Report of NITI Aayog. Prof.
Ramesh Chand identified seven sources of growth and estimated the desired rates of growth to
achieve the target by 2022-23. The DFI Committee has relied upon these recommendations in
its Report.
There is so much to explain, that not even the license of prose can capture adequately, all that
needs to be said about the complexity & challenges of agriculture and the nuances of an
appropriate strategy for realising the vision of doubling farmers’ income by the year of India’s
75th Independence Day celebrations.
The Committee remains grateful to the Government for trusting it with such an onerous
responsibility. The Committee has been working as per the sound advice and counsel of the
Hon’ble Minister for Agriculture and Farmers’ Welfare, Shri Radha Mohan Singh and Dr. S.K.
Pattanayak, IAS, Secretary of the Department of Agriculture, Cooperation and Farmers’
Welfare. It also hopes, that the Report will serve the purpose for which it was constituted.
12th August, 2017 Ashok Dalwai
Chairman, Committee on
Doubling Farmers’ Income
Doubling Farmers’ Income – Volume XIII
Structural Reforms and Governance Framework
v
About Volume XIII
The thirteenth volume of the Report of the Committee on Doubling Farmers’ Income (DFI)
examines the structural weaknesses and reforms needed in the agricultural system. The
discussions in this volume range from recommending reforms in the land policy and trade
regime to defining a farmer, farmers’ welfare, measure and monitoring farmers’ income, and
overseeing the operationalisation of the strategy for doubling farmers’ income.
Normally, it is seen that focus is given to improved administrative efficiency and upgraded
management practices to achieve enhancement in delivery of goods and services with respect
to both time and quality. The DFI Committee deliberated upon this approach and concluded
that this would not suffice. Given that, doubling farmers’ income within a tight time schedule
is a leap forward that entails a totally new approach to the practice of agriculture, the structural
constraints and challenges needed to be addressed. Hence, it worked upon important
dimensions of structural reforms and governance framework as related to farmers and farm
income.
Considering that the vison to double farmers’ income correlates with developments in other
areas of public expenditure, the necessary synergy to bring improved convergence to the
interventions undertaken by various departments and ministries is also a vital discussion. The
challenge to double farmers’ income can be fulfilled when all ministries, not just agriculture
alone, offere an active partnership in meeting this target.
This volume highlights how improved use-efficiency of the farming assets, people and
regulations can accelerate the necessary changes in the agricultural system, as has been
discussed in the previous volumes of the DFI Report. As such, this volume will reiterate certain
previously discussed recommendations and will explain the structural changes required in
every aspect of the support and governance mechanism at different levels.
This volume of the Report, is expected to aid planners, governance bodies and citizens to revisit
the existing mode of functioning and appropriately redefine how the agricultural sector is
approached. A paradigm shift in attitude and action, from the erstwhile production-centric
agenda, towards income-centric sustainability for farmers and nutritional security of the
country is the future for India’s agricultural development.
Ashok Dalwai
--- --- ---
Doubling Farmers’ Income – Volume XIII
Structural Reforms and Governance Framework
vi
Doubling Farmers’ Income Volume XIII
“Structural Reforms and
Governance Framework”
Contents
Foreword ............................................................................................................................ i
About Volume XIII .................................................................................................................. v
Structural Reforms for Higher Efficiency .......................................... 1
SHIFTING THE PRODUCTION AND INCOME CURVES ........................................................................... 1
BASIC CONSTRAINTS FACING AGRICULTURE SECTOR......................................................................... 2
IMPORTANT STRUCTURAL WEAKNESSES ......................................................................................... 2
KEY EXTRACTS ............................................................................ ERROR! BOOKMARK NOT DEFINED.
Structure of Land Holding ....................................................................... 5
CHANGING AGRARIAN STRUCTURE ................................................................................................ 5
LAND SIZE AND INCOME .............................................................................................................. 5
Principal source of income and land size ........................................................................................ 7
Income and Expenditure – A farmer’s balance sheet ...................................................................... 7
Indebtedness of agricultural households ...................................................................................... 10
Relationship between farm size and productivity ......................................................................... 12
LAND POOLING AND IMPROVING OPERATIONAL EFFICIENCY ............................................................ 13
LAND POOLING VIA FARMERS MOBILISATION ................................................................................ 14
The Andhra Pradesh Licensed Cultivators Act, 2011 ..................................................................... 14
The Model Agricultural Land Lease Act, 2016 ............................................................................... 15
Contract farming ........................................................................................................................... 16
Farmer Producer Organisations (FPOs)......................................................................................... 18
OTHER LAND RELATED ISSUE ...................................................................................................... 18
Civil disputes ................................................................................................................................. 18
Developing land markets .............................................................................................................. 19
KEY EXTRACTS ............................................................................ ERROR! BOOKMARK NOT DEFINED.
Defining a Farmer for Inclusiveness.................................................. 21
AGRICULTURAL WORKERS .......................................................................................................... 21
NORMS BASED DEFINITION OF FARMER ....................................................................................... 23
KEY EXTRACTS ............................................................................ ERROR! BOOKMARK NOT DEFINED.
Uncontrolled Variables - Production & Market ............................. 25
AGRICULTURAL AND INDUSTRIAL PRODUCTION ............................................................................. 25
MULTIPLE FORMS OF NATURAL CALAMITIES ................................................................................. 26
Drought in India ............................................................................................................................ 26
Causes of recurring drought in India ............................................................................................. 27
Geographical spread of drought ................................................................................................... 28
Doubling Farmers’ Income – Volume XIII
Structural Reforms and Governance Framework
vii
Highly drought prone districts ...................................................................................................... 28
NEGATIVE IMPACT OF PRODUCTION RISKS .................................................................................... 28
INTERVENTIONS FOR REGULATING PRODUCTION AND SUPPLY ........................................................... 29
Price and demand forecast ........................................................................................................... 29
Accuracy of area coverage under various crops – production estimates...................................... 30
Other interventions to address production, price unpredictability ............................................... 32
NEGOTIATING MARKET UNPREDICTABILITY ................................................................................... 33
KEY EXTRACTS ............................................................................ ERROR! BOOKMARK NOT DEFINED.
Trade Regime and Export Promotion ............................................... 35
TRADE POLICY USED TO CONTROL DOMESTIC PRICES ..................................................................... 35
AGRICULTURAL TRADE POLICY TO PROMOTE TRADE ...................................................................... 36
Stable trade regime ...................................................................................................................... 36
Trade policy to promote exports ................................................................................................... 37
KEY EXTRACTS ............................................................................ ERROR! BOOKMARK NOT DEFINED.
Restrictive Policies – Liberalisation and Simplification............. 41
WHY LIBERALISATION?.............................................................................................................. 41
REFORMS IN CRITICAL INPUTS AND MARKETS ............................................................................... 42
SEEDS ARE THE SEEDS FOR GROWTH ............................................................................................ 42
Seed Production System ................................................................................................................ 43
Seed Certification System.............................................................................................................. 45
Seed Export / Import ..................................................................................................................... 46
Recommendations for improving the seed sector ........................................................................ 47
LIBERALISING FERTILIZER SECTOR ................................................................................................. 49
Background ................................................................................................................................... 49
FCO - key function areas ............................................................................................................... 50
Role of Governments in fertilizer sector ........................................................................................ 50
Way forward – some recommendations ....................................................................................... 50
Way Forward ................................................................................................................................ 53
PESTICIDE REGULATION IN INDIA – CONSTRAINTS AND SUGGESTIONS ............................................... 53
Pest management – current provisions and scope ....................................................................... 53
Regulations and Controls .............................................................................................................. 54
Existing penal provisions ............................................................................................................... 56
Current status & use of pesticides................................................................................................. 56
Constraints in the implementation the Act ................................................................................... 57
Proposed Pesticide Management Bill (PMB) ................................................................................. 58
AGRICULTURAL MARKET LIBERALISATION ..................................................................................... 58
Reforms in wholesale agricultural markets .................................................................................. 58
New market architecture .............................................................................................................. 60
Liberalising stock limits ................................................................................................................. 60
KEY EXTRACTS ............................................................................ ERROR! BOOKMARK NOT DEFINED.
Infrastructure constraints .................................................................... 63
KEY EXTRACTS ......................................................................................................................... 65
Climate Change – compounding agricultural risks ...................... 67
BACKGROUND ......................................................................................................................... 67
Doubling Farmers’ Income – Volume XIII
Structural Reforms and Governance Framework
viii
Climate change forces a mirror on past strategies ....................................................................... 68
WAY FORWARD FOR AGRICULTURE UNDER CHANGING CLIMATE ....................................................... 69
IMPACT OF CLIMATE CHANGE AND CHANGE MANAGEMENT ............................................................. 69
KEY RECOMMENDATIONS .......................................................................................................... 71
KEY EXTRACTS ............................................................................ ERROR! BOOKMARK NOT DEFINED.
Farmers’ Welfare ...................................................................................... 75
UNDERSTANDING WELFARE ....................................................................................................... 75
The need to emphasise on farmers’ welfare ................................................................................. 78
DEFINING FARMERS’ WELFARE ................................................................................................... 78
Farmers’ Income ........................................................................................................................... 79
Farm household income status ..................................................................................................... 80
Maslow’s Need Hierarchy and Farmers’ Welfare ......................................................................... 82
DFI’s Definition of Farmers’ Welfare ............................................................................................. 82
INDICATORS / MEASURES OF FARMERS’ WELFARE .......................................................................... 83
The approach to farmers welfare ................................................................................................. 84
KEY EXTRACTS ............................................................................ ERROR! BOOKMARK NOT DEFINED.
Planning and Review – Institutional Arrangement ...................... 87
INTRODUCTION ........................................................................................................................ 87
Three – tier system ................................................................................................................... 87
Four–tier arrangement for effective implementation .............................................................. 92
Agricultural Dispute Resolution Authority ................................................................................ 94
KEY EXTRACTS ............................................................................ ERROR! BOOKMARK NOT DEFINED.
Grassroot Level Participation .............................................................. 95
AS STRONG AS THE WEAKEST ..................................................................................................... 95
CO-OPTING THE FARMERS ......................................................................................................... 96
Gram Panchayats as delivery institutions ................................................................................ 96
Gram Panchayats as Centres of welfare .................................................................................. 97
Direct participation of farmers ................................................................................................. 98
KEY EXTRACTS ............................................................................ ERROR! BOOKMARK NOT DEFINED.
Investments, Subsidies and Inflation Management .................. 101
INTRODUCTION ...................................................................................................................... 101
AN EXAMINATION OF CAPITAL INVESTMENTS .............................................................................. 102
Public investment ................................................................................................................... 102
Private investment ................................................................................................................. 104
SUBSIDIES IN AGRICULTURE AND IMPLICATIONS ........................................................................... 107
Food subsidies in India ........................................................................................................... 112
Centripetal influence on subsidies .......................................................................................... 115
New challenge from surpluses ............................................................................................... 116
FOOD INFLATION .................................................................................................................... 117
THE OTHER SIDE OF FOOD INFLATION: INPUT COST ..................................................................... 119
BALANCING FOOD INFLATION AND GUARDING FARMERS’ INTEREST ................................................ 119
INDIA’S FOOD INFLATION: THE SUPPLY-DEMAND ANGLE .............................................................. 120
ANNOTATION ........................................................................................................................ 122
Doubling Farmers’ Income – Volume XIII
Structural Reforms and Governance Framework
ix
Mobilising Farmers - Cooperatives and Farmers Producers Organisations
125
INTRODUCTION ...................................................................................................................... 125
HISTORY OF THE CO-OPERATIVE MOVEMENT IN INDIA .................................................................. 125
DIFFERENT TYPES OF COOPERATIVES WORKING IN INDIA .............................................................. 127
NEED FOR COOPERATIVES IN AGRICULTURE ................................................................................ 127
Different types of agricultural cooperative societies ............................................................. 128
SUCCESSFUL COOPERATIVES IN INDIA ........................................................................................ 130
Major areas of concern .......................................................................................................... 130
Factors ailing rural credit cooperatives .................................................................................. 132
Continued relevance of cooperatives in agriculture ............................................................... 133
Reinvigorating cooperative credit institutions ....................................................................... 135
LINKING COOPERATIVES WITH FARMER PRODUCER ORGANISATIONS (FPOS) ................................... 136
Promoting FPOs/Cooperatives in Private-Private Partnership (PPP) ..................................... 138
Types of Farmer Producers Organisations (FPOs) .................................................................. 138
ANNOTATION ........................................................................................................................ 140
Minor Forest Produce – Core of Tribal Economy ....................... 143
TRIBAL SOCIETY AND CULTIVATION PRACTICES ............................................................................ 143
CHANGING FOREST LAWS ........................................................................................................ 143
ISSUES RELATING TO MFP ....................................................................................................... 144
RECOMMENDATIONS .............................................................................................................. 145
Support Tools .......................................................................................... 147
MEASURING OF FARMERS’ INCOME .......................................................................................... 147
Measuring Farmers’ Income – attempts so far ...................................................................... 147
MIS BASED DASHBOARD - EFFECTIVE AND QUALITATIVE IMPLEMENTATION .................................... 148
RATIONALISATION OF ORGANISATIONS ...................................................................................... 148
Restructure, Reorganise, Re-mandate ................................................................................... 149
Divisions within Ministry of Agriculture & Farmers’ Welfare ................................................. 150
REFORMS AND RANKING – EASE OF DOING AGRI-BUSINESS .......................................................... 152
Suggested Basket of Reforms ................................................................................................. 152
RANKING OF STATES ............................................................................................................... 153
ANNOTATION ........................................................................................................................ 153
KEY EXTRACTS ............................................................................ ERROR! BOOKMARK NOT DEFINED.
Operationalising DFI Strategy - An Empowered Body ............. 155
SETTING A NEW COURSE FOR AGRICULTURE ............................................................................... 155
EMPOWERED BODY ................................................................................................................ 156
Role and responsibility of the Empowered Body .................................................................... 157
References ...................................................................................................................... 159
Annexures ...................................................................................................................... 161
Doubling Farmers’ Income – Volume XIII
Structural Reforms and Governance Framework
x
Index of Figures
Figure 2.1 Percentage distribution of agriculture households by principal source of income ................................ 6 Figure 2.2 Distribution of average monthly income per agricultural households by sources ................................. 8 Figure 2.3 An agricultural household budget by land holding................................................................................ 9 Figure 2.4 Average monthly income per agricultural households from different sources for each decile class of
MPCE ................................................................................................................................................................... 10 Figure 2.5 Distribution of outstanding loans of agricultural households by source of loans ................................ 11 Figure 12.1 Annual rate of growth in private investment per rural households at 2004-05 prices ..................... 105 Figure 12.2 Trends in different subsidies across different heads (Rs crores) ..................................................... 108 Figure 12.3 Trends in interest and fertilizer subsidies (as percent of total subsidies) ........................................ 109 Figure 12.4 Power subsidy for agricultural consumers (Rs. per ha of gross cropped area) ................................ 111 Figure 12.5 FCI procurement of rice: share across states ................................................................................... 113 Figure 12.6 FCI procurement of wheat: share across states ............................................................................... 113 Figure 12.7 Wholesale Price Index (WPI) for food and non-food items ............................................................ 118 Figure 12.8 Wholesale Price Index in food items category ................................................................................ 118 Figure 15.1 EBA-World Bank: India snapshot ................................................................................................... 154
Index of Tables
Table 2.1 Distribution of agricultural households by principle source of income during the last 365 days for each
size class of land possessed. ................................................................................................................................... 7 Table 2.2 Average monthly income from different sources, consumption expenditure and net investment in
productive assets ..................................................................................................................................................... 8 Table 2.3 Average monthly income from different sources, consumption expenditure and net investment in
productive assets ..................................................................................................................................................... 9 Table 2.4 Average amount of outstanding loan (Rs ’00) per agricultural household by size class of land possessed
for major States ..................................................................................................................................................... 10 Table 2.5 Distribution of outstanding loans by source of loan taken for different size classes of land possessed 12 Table 4.1 Departure of Rainfall from Normal for Country (SW Monsoon) during successive Drought years
(percentage) .......................................................................................................................................................... 27 Table 4.2 Cropped Area falling Under Various Ranges of Rainfall in India ........................................................ 28 Table 6.1 Major policy intervention relating to seed sector ................................................................................. 42 Table 7.1 Future Public and Private Investments ................................................................................................. 63 Table 9.1 Farm-household Income and Saving .................................................................................................... 80 Table 9.2 Disparities in Agriculture and Non-agriculture Income ....................................................................... 81 Table 12.1 Classification of states as per irrigation status .................................................................................. 101 Table 12.2 Public expenditure in agriculture and irrigation (Rs. ’00 crore) and percentage share of capital
expenditure (2004-05 prices) .............................................................................................................................. 102 Table 12.3 Public expenditure per hectare (Rs.) at 2004-05 prices .................................................................... 103 Table 12.4 State-wise private investments per rural household (Rs.) at 2004-05 Prices .................................... 104 Table 12.5 State-wise percentage share of components of private investment in rural households, 2012-13 .... 106 Table 12.6 Subsidies in Indian budget across various categories/heads (Rs crores) .......................................... 107 Table 12.7 Fertilizers subsidy (Rs) per hectare of gross cropped area ............................................................... 109 Table 12.8 Power Subsidy for agricultural Consumers (Rs. per ha of gross cropped area) ................................ 111 Table 12.9 Year-wise food subsidy (Rs crore) ................................................................................................... 112 Table 12.10 Procurement of wheat and rice for the cntral pool (lakh tonnes) .................................................... 114
Doubling Farmers’ Income – Volume XIII
Structural Reforms and Governance Framework
1
Structural Reforms for Higher Efficiency
In transforming India’s agriculture, there will be basic challenges, which are structural in nature. The
planned change has to be time-bound, resource use efficient and cost effective. In order to drive the
change for desired results, the speed & quality of implementation of the action plan is important.
However efficient such execution, the outcome will be limited, if the system suffers from certain inherent
constraints. These need to identified & addressed to realise the full potential of the strategy for change.
Shifting the Production and Income Curves
The previous volumes of this Report logically analyse the constraints and challenges and offer
potential solutions to raising the farm income. The strategy essentially advocates transforming
agriculture into agri-business, which means that the outcome of agriculture should preferably
be measured in terms of income returns per unit of asset (land/waterbody/livestock/bird etc.)
as against measuring it in terms of production per unit of asset. The strategy then argues for
improving productivity, reducing cost of cultivation/production and realising remunerative
prices on the produce, for net positive returns at the farmer’s level. While various interventions
suggested in the pre-production, production and post-production stages will bring in greater
efficiency and result in higher returns to the farmer, the inherent bottlenecks that plague the
agricultural structure in India today, do not permit the factors of production to play up fully
and contribute at their optimal level. The operational efficiency realised even under best
circumstances of implementation is likely to be linear and hence incremental in impact.
Operational efficiency in agriculture can be defined as the ratio between an output gained from
an agricultural activity and an input used to run this activity. When improving an activity’s
operational efficiency, the output to input ratio improves and should drive agricultural policy.
Inputs would typically include water / fertilizer, etc., money, man-power (measured as
headcount or as the number of full-time equivalents) and time / effort. Outputs would refer to
the harvested grain, fruit, vegetable, milk, meat, fish, fibre, by-products and other material.
Both require to be computed in terms of value and not only in quantity. It is possible to shift
the production curve, as also the income curve to the next higher level by identifying and
addressing the systemic constraints.
There exist certain structural weaknesses, which when appropriately addressed will mean the
enhancement of the genetic potential of the factors of production; and expansion of the space
for these factors to express more wholesomely. Thus, the same intensity of operational
interventions will bring more visible results in the following ways:
efforts made to achieve higher productivity will shift the productivity curve;
initiatives undertaken to achieve resource use efficiency will result in greater resource
saving and cost saving; and
measures taken to improve marketing efficiency will yield higher returns on output.
Doubling Farmers’ Income – Volume XIII
Structural Reforms and Governance Framework
2
Basic Constraints Facing Agriculture Sector
Land, labour and capital have for long been recognised as the principal factors of production.
These also constitute the factors of production in industry. However, what differentiates these
two sectors, making agriculture much more complex is its biological nature. While in case of
a production system based on mechanical processes, the variables can be controlled, and hence,
there exists the scope for manoeuvring the demand and supply, agriculture sector suffers from
lack of this opportunity.
Being biologically dependent, the variables like climate & weather and their ramifications
(temperature, humidity, rainfall, etc.) which are external to the management system are not
manoeuvrable. The downside of this is, that the investments made in the factors of production
by a farmer are irrecoverable and the outcome is more a matter of chance. The statistical
probability of success is at best 50:50, and in reality is worse-off, most of the time.
Further, once the investments are made in the production process which begins with land
preparation and sowing/planting, it is Hobson’s choice with respect to the supply side. The
scope for varying the supply according to demand dynamics is non-existent. The consequence
is, that the farmers as a collective body become vulnerable to market dynamics, and tend to
suffer from price volatility and fluctuations in the market, just as they face risks in the
production environment till the harvest.
As seen above, the space available to play with the factors of production, at the farmer’s level,
is limited. Further, these challenges are compounded by the very size, availability and
accessibility of these factors. The structure of land holding and land immobility; access to
inputs including credit as obtains today do not provide a favourable environment to the farmers
to practise enterprise based and profit generating farming. On the contrary, the situation
constrains the farmer from working efficiently and effectively.
Apart from these well recognised factors of production, the new challenge that is staring at the
farmers is the certainty of climate change. The implications of climate change are multiple and
intense. The long evolved system of agricultural system itself is at risk, on account of changing
seasons as also vulnerability of crops, livestock, poultry, fishery, etc. to pests and diseases. The
cost of mitigation and adaptation to the new parameters of temperature, rainfall etc., are huge
and it is the small and marginal farmers who will experience greater pain.
Important Structural Weaknesses
The target of doubling farmers’ income by 2022-23 is only a first radical step, engendering a
fundamental shift, to the way agriculture has so far been perceived and practiced in India. If
the agriculture sector is to respond suitably to the redefined mandate (DFI Volume-VIII), it
will require continuous transformation, so that it acquires the characteristic of agri-enterprise,
whereby farmers take to agriculture as a chosen option, and are able to earn their livelihood as
entrepreneurs and simultaneously cater to the country’s strategic requirement of food security.
Doubling Farmers’ Income – Volume XIII
Structural Reforms and Governance Framework
3
It is in this context, that some basic structural issues are identified, so that appropriate reforms
can be effected. These are:
i. Land divisions and fragmentation.
ii. Definition of a farmer - many exclusions.
iii. Uncontrolled variables - production risks and market unpredictability.
iv. Controlled regime – difficulty in doing agri-business.
v. Agricultural policies – holding back income growth.
vi. Infrastructure constraints – limiting the market and income growth.
vii. Climate change – complicating the agriculture.
Addressing and mitigation of these structural concerns is discussed in following chapters.
Key Extracts
Transformation to the agricultural eco-system, will require time-bound, efficient and
effective changes. The outcomes will be limited unless certain structural weaknesses in
the system are appropriately addressed.
The structural weaknesses range from operational limitations, policy controls and
infrastructural constraints, to unpredictable variables and climate change impact.
Each of these weaknesses, if countered in isolation, will not fully address the concerns.
The targeted outcome should aim to measure a shift in the productivity curve, improved
resource use efficiency and in yielding higher returns to farmers.
Mitigating the basic structural weakness will be an important facet in implementing and
guiding the agenda to double farmers’ income.

Doubling Farmers’ Income – Volume XIII
Structural Reforms and Governance Framework
5
Structure of Land Holding
Land is the principle asset of a farmer, and it constitutes the basic input in farming. On account of
continuing division and fragmentation of land, the size of a farmer’s holding has become a concern.
The viability of farming and the income that a farmer earns thereof are posing a challenge. This chapter
examines the impact of land size on farm-incomes and identify probable solutions.
Changing Agrarian Structure
Today, Indian agriculture is dominated by small and marginal farmers, who account for more
than 86 per cent of the total number of landholdings, that counted to 11.88 crore as per 2011
census. The net arable land measures 141 million hectares. The number of land holdings have
been steadily increasing since 1951, when they were 6.99 crore in number. In the year 1995-
96, number of holdings were 11.55 crore and the average size of holding was 1.41 ha. and by
2010-11, the average size declined to 1.15 ha. The country’s population has been increasing
steadily since independence and the dependence on agricultural output has only increased.
While the population dependent on agriculture for livelihood has come down from more than
70 per cent in 1951 to 48 per cent by 2011, in absolute terms, the number of families and the
number of holdings have only increased. The NSSO’s Situation Assessment Survey (SAS),
during the agricultural year July 2012 – June 2013 shows that, of the estimated 15.61 crore
number of rural households, the number of agricultural households stood at 9.02 crore,
accounting for 57.8 per cent of the former.
Further, of the 86 per cent of the small and marginal land holdings, the majority are marginal
(equal to less than 1 ha. in size). The small size of land holdings is a challenge by itself, which
is rendered more complex by its fragmentation. While land division is linked to law of
inheritance, fragmentation is associated with the practice of dividing and sharing every piece
of land among the inheritors.
Most farms in India are thus family farms, sometimes referred to as ‘handkerchief size’
holdings. The changing agriculture structure, as it pans out in different states, is detailed in DFI
Volume-I. It is important to note, that land size has a bearing on production, input costs and
final income. The income from operational efficiency is influenced by the size of land holding.
It is difficult operationally to individually harvest the scales of economy at both production and
post-production stages, and this adversely impacts the costs of production and transaction.
Land Size and Income
As per NSSO’s 70th Round, the average annual income of an agricultural household came from
four (4) sources, namely, cultivation, livestock, non-farm business, and wages & salaries. The
average annual income was Rs. 77,976 in 2012-13.
The average ratio of farm to non-farm income as a proportion of the farmers’ income was
60.20: 39.80 (60:40 approx). It is relevant to observe, that the ratio of farm income was directly
Doubling Farmers’ Income – Volume XIII
Structural Reforms and Governance Framework
6
correlated with the size of the landholding (categorised as marginal + small, medium + semi-
medium, large) as presented below:
The income ratio from cultivation increased from 36.5 per cent (marginal + small) to
70.8 per cent (medium + semi-medium) to 85.5 per cent (large).
The income ratio from livestock declined from 14.8 per cent (marginal + small) to 11.5
per cent (medium + semi-medium) to 6.9 per cent (large).
The income ratio from wages and salaries declined from 37.5 per cent (marginal +
small) to 13.0 per cent (medium + semi-medium) to 3.2 per cent (large).
The income ratio from non-farm business declined from 7.2 per cent (marginal + small)
to 4.8 per cent (medium + semi-medium) to 4.4 per cent (large).
It is obvious, that size of the landholding impacts the percentage of income that accrues to the
farmer. It therefore, has a say on the viability of farming and the status of farmers’ income.
As per the same NSSO 70th Round (July 2012 – June 2013), while the average monthly income
of a farm household in 2012-13 was Rs. 6,426, the average monthly consumption expenditure
was Rs. 6,223, leaving a paltry surplus of Rs. 203. That, farmers owning upto 1 ha. of land are
not able to balance their farm budget is also clear from the same survey.
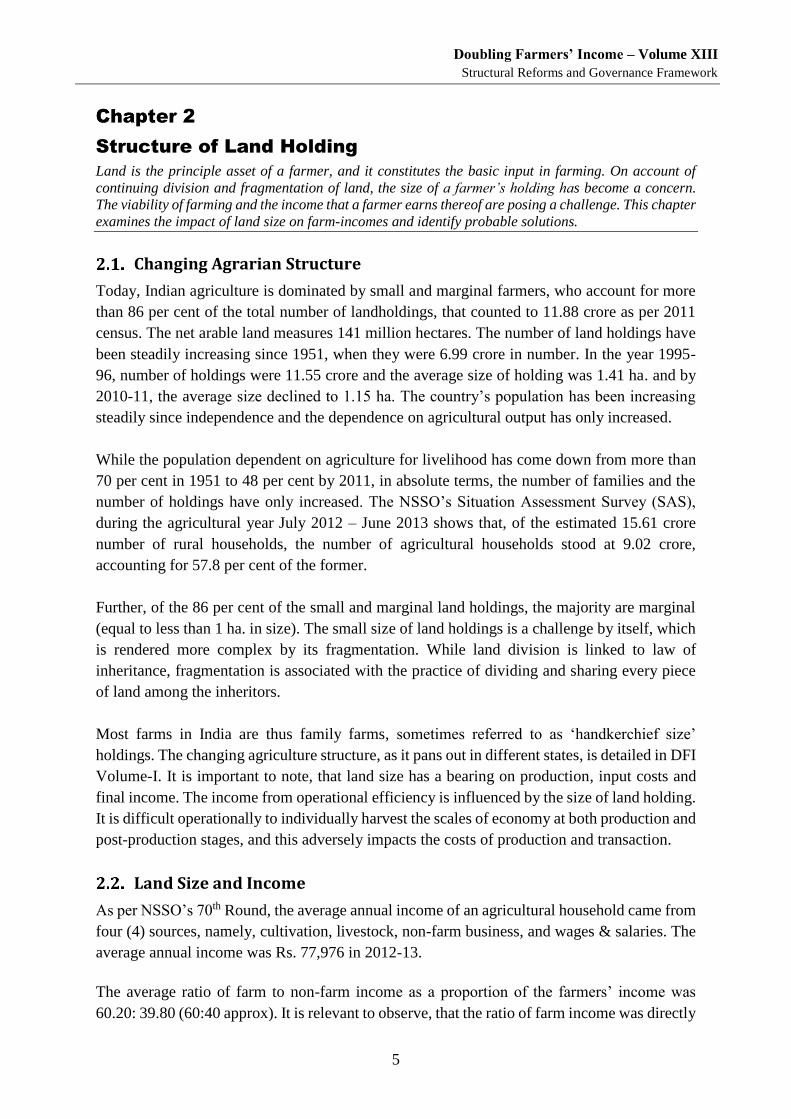
Among various sources from which the agricultural households derived at least some income
during 365 days prior to the date of survey, the source that yielded the maximum income was
taken as the principal source of income. As clear from figure 2.1 below, agricultural households
were mainly dependent on cultivation followed by wage / salaried employment for their
livelihood, as about 63.5 per cent of the agricultural households reported cultivation, and 22
per cent reported wage / salaried employment as their principal source of income.
Figure 2.1 Percentage distribution of agriculture households by principal source of income
Source: NSSO’s SAS of Agricultural Households (July 2012 – June 2013)
63.4%
3.7%
1.1%
4.7%
22.0%
5.1%
Cultivation
livestock
other agri.activity
non-agri.Enterprises
wage/salaried employment
others
Doubling Farmers’ Income – Volume XIII
Structural Reforms and Governance Framework
7
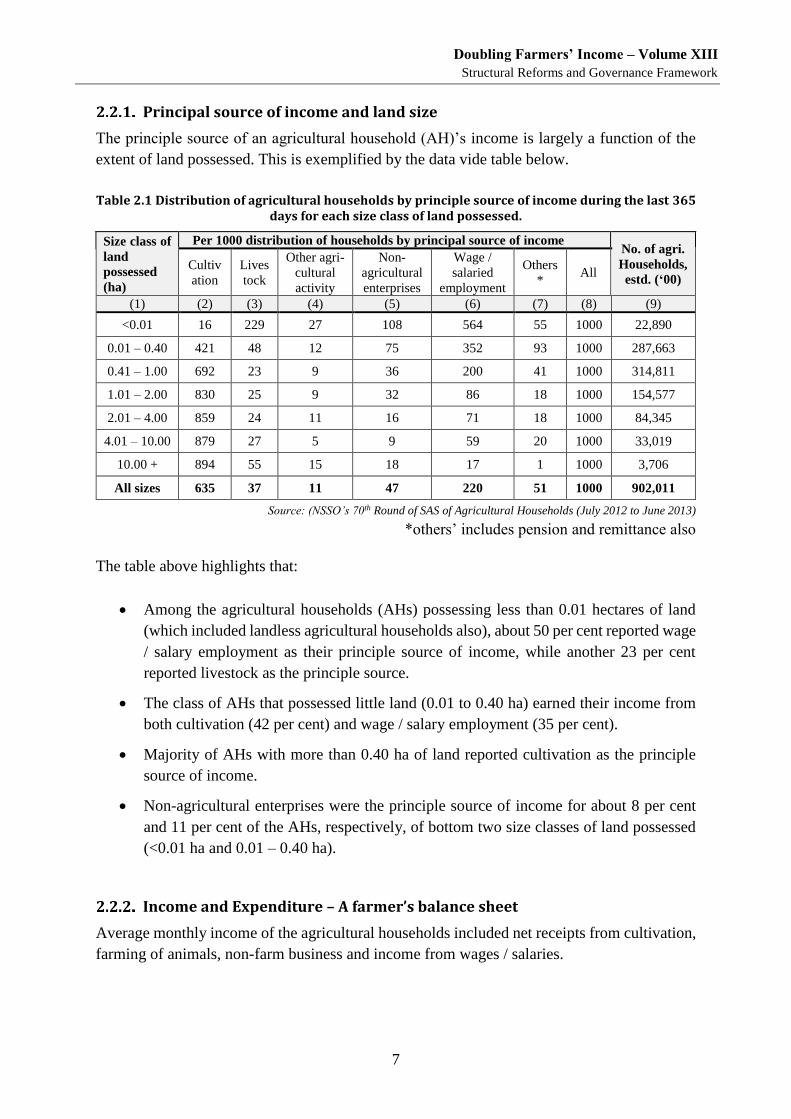
Principal source of income and land size
The principle source of an agricultural household (AH)’s income is largely a function of the
extent of land possessed. This is exemplified by the data vide table below.
Table 2.1 Distribution of agricultural households by principle source of income during the last 365 days for each size class of land possessed.
Size class of
land
possessed
(ha)
Per 1000 distribution of households by principal source of income No. of agri.
Households,
estd. (‘00) Cultiv
ation
Lives
tock
Other agri-
cultural
activity
Non-
agricultural
enterprises
Wage /
salaried
employment
Others
* All
(1) (2) (3) (4) (5) (6) (7) (8) (9)
<0.01 16 229 27 108 564 55 1000 22,890
0.01 – 0.40 421 48 12 75 352 93 1000 287,663
0.41 – 1.00 692 23 9 36 200 41 1000 314,811
1.01 – 2.00 830 25 9 32 86 18 1000 154,577
2.01 – 4.00 859 24 11 16 71 18 1000 84,345
4.01 – 10.00 879 27 5 9 59 20 1000 33,019
10.00 + 894 55 15 18 17 1 1000 3,706
All sizes 635 37 11 47 220 51 1000 902,011
Source: (NSSO’s 70th Round of SAS of Agricultural Households (July 2012 to June 2013)
*others’ includes pension and remittance also
The table above highlights that:
Among the agricultural households (AHs) possessing less than 0.01 hectares of land
(which included landless agricultural households also), about 50 per cent reported wage
/ salary employment as their principle source of income, while another 23 per cent
reported livestock as the principle source.
The class of AHs that possessed little land (0.01 to 0.40 ha) earned their income from
both cultivation (42 per cent) and wage / salary employment (35 per cent).
Majority of AHs with more than 0.40 ha of land reported cultivation as the principle
source of income.
Non-agricultural enterprises were the principle source of income for about 8 per cent
and 11 per cent of the AHs, respectively, of bottom two size classes of land possessed
(<0.01 ha and 0.01 – 0.40 ha).
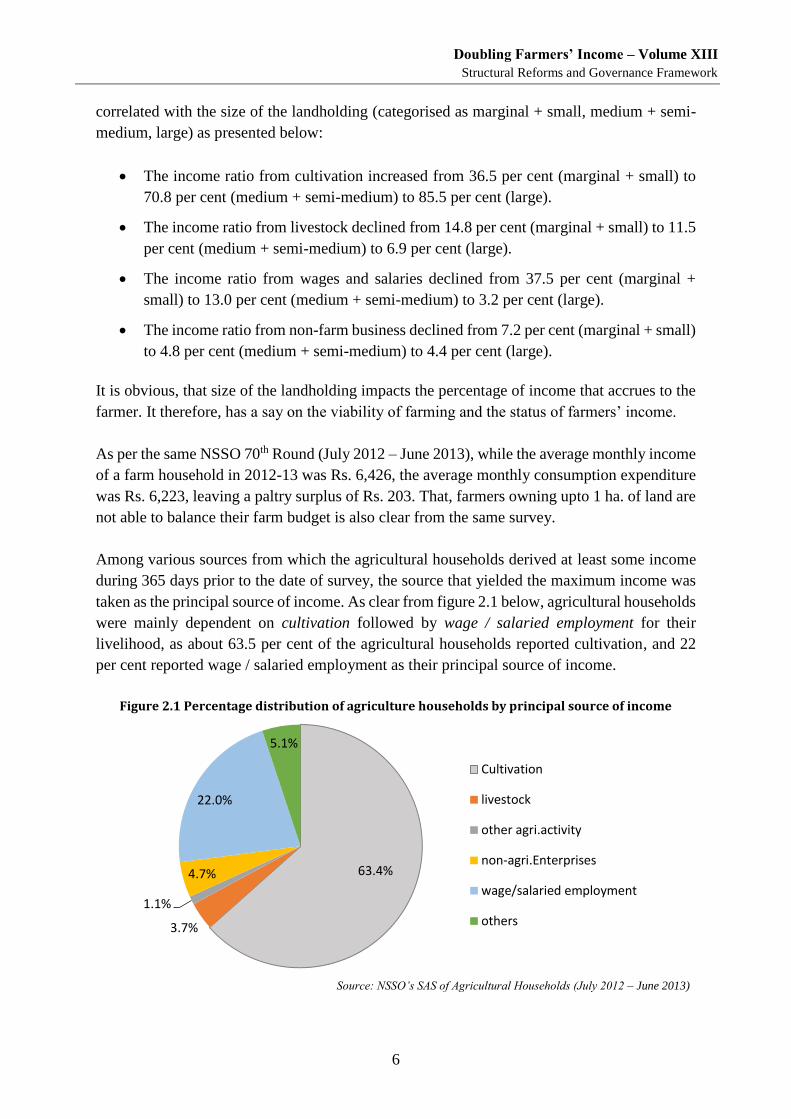
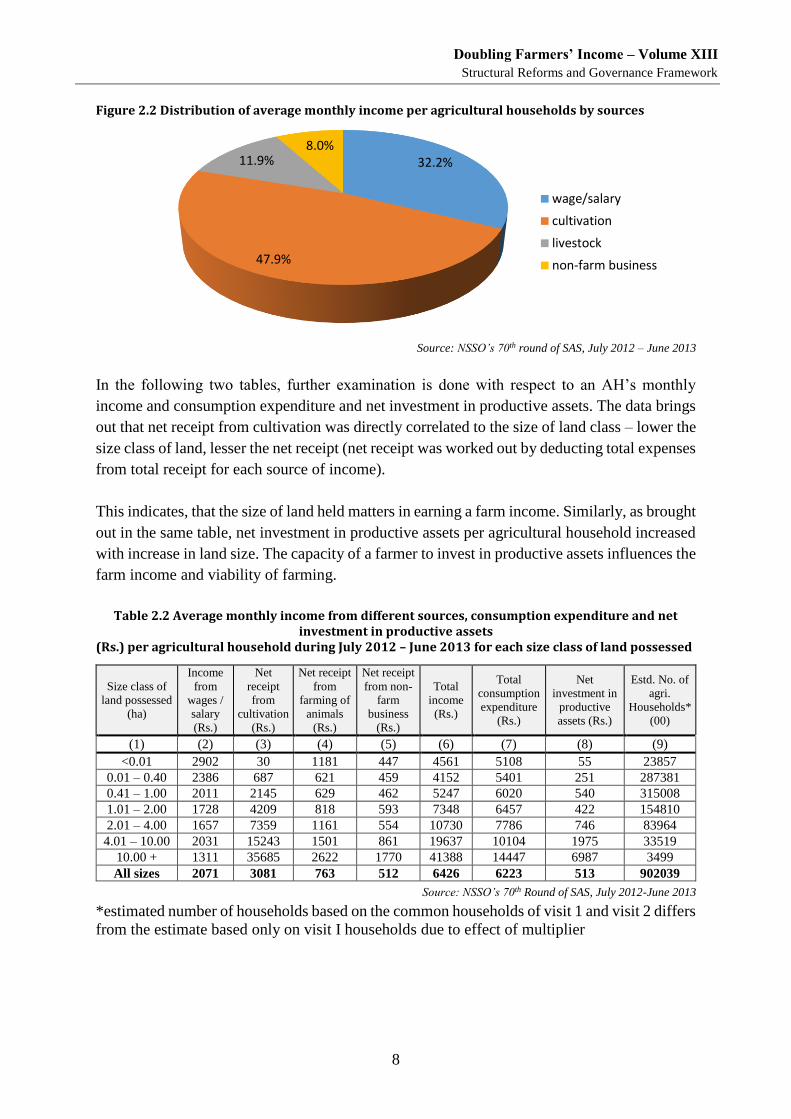
Income and Expenditure – A farmer’s balance sheet
Average monthly income of the agricultural households included net receipts from cultivation,
farming of animals, non-farm business and income from wages / salaries.
Doubling Farmers’ Income – Volume XIII
Structural Reforms and Governance Framework
8
Figure 2.2 Distribution of average monthly income per agricultural households by sources
Source: NSSO’s 70th round of SAS, July 2012 – June 2013
In the following two tables, further examination is done with respect to an AH’s monthly
income and consumption expenditure and net investment in productive assets. The data brings
out that net receipt from cultivation was directly correlated to the size of land class – lower the
size class of land, lesser the net receipt (net receipt was worked out by deducting total expenses
from total receipt for each source of income).
This indicates, that the size of land held matters in earning a farm income. Similarly, as brought
out in the same table, net investment in productive assets per agricultural household increased
with increase in land size. The capacity of a farmer to invest in productive assets influences the
farm income and viability of farming.
Table 2.2 Average monthly income from different sources, consumption expenditure and net investment in productive assets
(Rs.) per agricultural household during July 2012 – June 2013 for each size class of land possessed
Size class of
land possessed
(ha)
Income
from
wages /
salary
(Rs.)
Net
receipt
from
cultivation
(Rs.)
Net receipt
from
farming of
animals
(Rs.)
Net receipt
from non-
farm
business
(Rs.)
Total
income
(Rs.)
Total
consumption
expenditure
(Rs.)
Net
investment in
productive
assets (Rs.)
Estd. No. of
agri.
Households*
(00)
(1) (2) (3) (4) (5) (6) (7) (8) (9)
<0.01 2902 30 1181 447 4561 5108 55 23857
0.01 – 0.40 2386 687 621 459 4152 5401 251 287381
0.41 – 1.00 2011 2145 629 462 5247 6020 540 315008
1.01 – 2.00 1728 4209 818 593 7348 6457 422 154810
2.01 – 4.00 1657 7359 1161 554 10730 7786 746 83964
4.01 – 10.00 2031 15243 1501 861 19637 10104 1975 33519
10.00 + 1311 35685 2622 1770 41388 14447 6987 3499
All sizes 2071 3081 763 512 6426 6223 513 902039
Source: NSSO’s 70th Round of SAS, July 2012-June 2013
*estimated number of households based on the common households of visit 1 and visit 2 differs
from the estimate based only on visit I households due to effect of multiplier
32.2%
47.9%
11.9%8.0%
wage/salary
cultivation
livestock
non-farm business
Doubling Farmers’ Income – Volume XIII
Structural Reforms and Governance Framework
9
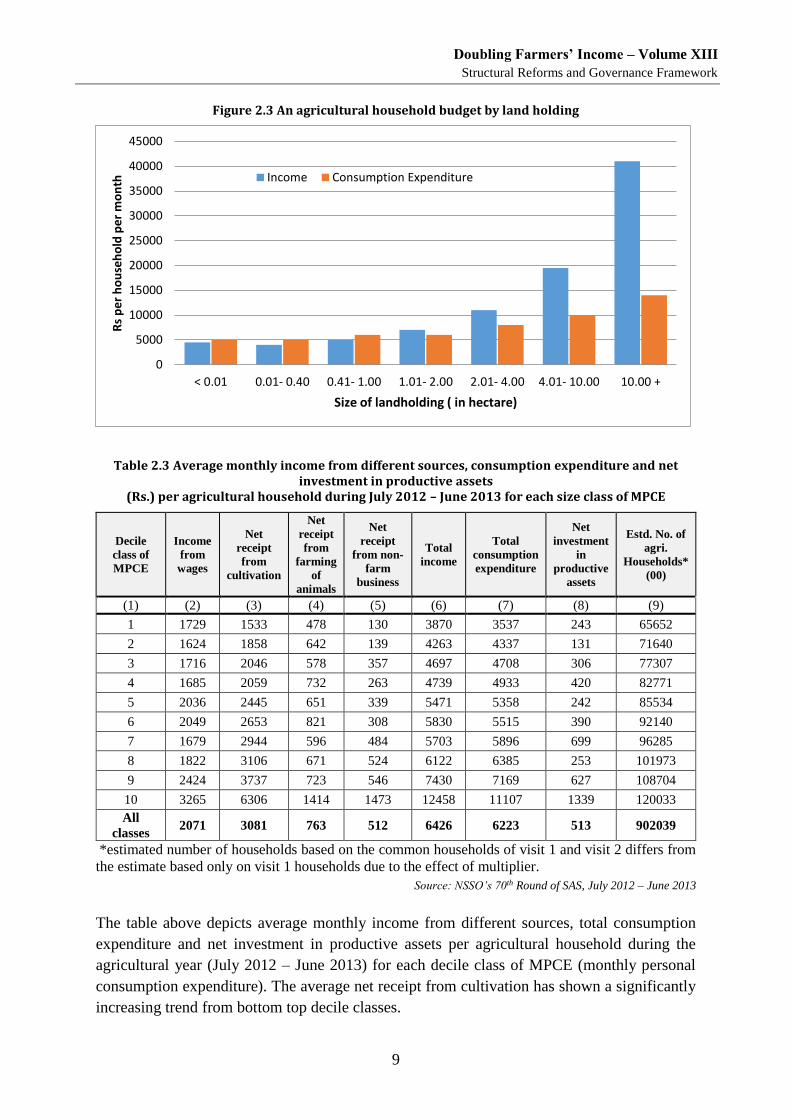
Figure 2.3 An agricultural household budget by land holding
Table 2.3 Average monthly income from different sources, consumption expenditure and net investment in productive assets
(Rs.) per agricultural household during July 2012 – June 2013 for each size class of MPCE
Decile
class of
MPCE
Income
from
wages
Net
receipt
from
cultivation
Net
receipt
from
farming
of
animals
Net
receipt
from non-
farm
business
Total
income
Total
consumption
expenditure
Net
investment
in
productive
assets
Estd. No. of
agri.
Households*
(00)
(1) (2) (3) (4) (5) (6) (7) (8) (9)
1 1729 1533 478 130 3870 3537 243 65652
2 1624 1858 642 139 4263 4337 131 71640
3 1716 2046 578 357 4697 4708 306 77307
4 1685 2059 732 263 4739 4933 420 82771
5 2036 2445 651 339 5471 5358 242 85534
6 2049 2653 821 308 5830 5515 390 92140
7 1679 2944 596 484 5703 5896 699 96285
8 1822 3106 671 524 6122 6385 253 101973
9 2424 3737 723 546 7430 7169 627 108704
10 3265 6306 1414 1473 12458 11107 1339 120033
All
classes 2071 3081 763 512 6426 6223 513 902039
*estimated number of households based on the common households of visit 1 and visit 2 differs from
the estimate based only on visit 1 households due to the effect of multiplier.
Source: NSSO’s 70th Round of SAS, July 2012 – June 2013
The table above depicts average monthly income from different sources, total consumption
expenditure and net investment in productive assets per agricultural household during the
agricultural year (July 2012 – June 2013) for each decile class of MPCE (monthly personal
consumption expenditure). The average net receipt from cultivation has shown a significantly
increasing trend from bottom top decile classes.
0
5000
10000
15000
20000
25000
30000
35000
40000
45000
< 0.01 0.01- 0.40 0.41- 1.00 1.01- 2.00 2.01- 4.00 4.01- 10.00 10.00 +
Rs
pe
r h
ou
seh
old
pe
r m
on
th
Size of landholding ( in hectare)
Income Consumption Expenditure
Doubling Farmers’ Income – Volume XIII
Structural Reforms and Governance Framework
10
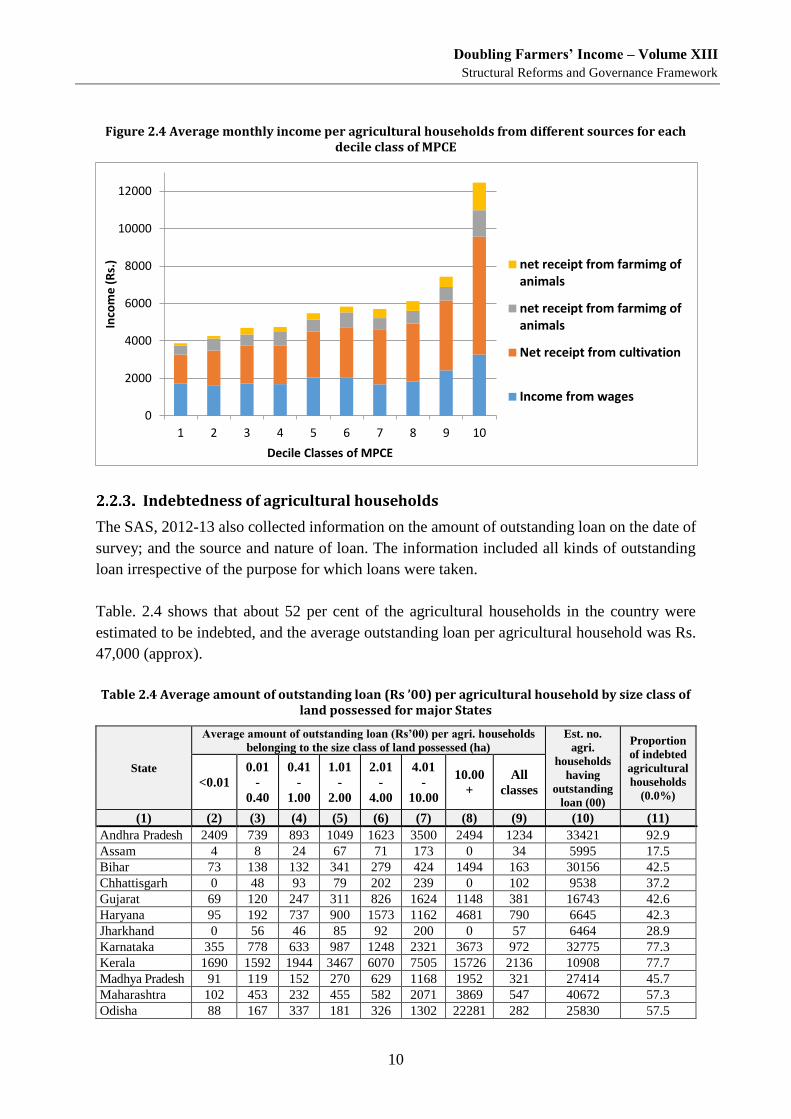
Figure 2.4 Average monthly income per agricultural households from different sources for each decile class of MPCE
Indebtedness of agricultural households
The SAS, 2012-13 also collected information on the amount of outstanding loan on the date of
survey; and the source and nature of loan. The information included all kinds of outstanding
loan irrespective of the purpose for which loans were taken.
Table. 2.4 shows that about 52 per cent of the agricultural households in the country were
estimated to be indebted, and the average outstanding loan per agricultural household was Rs.
47,000 (approx).
Table 2.4 Average amount of outstanding loan (Rs ’00) per agricultural household by size class of land possessed for major States
State
Average amount of outstanding loan (Rs’00) per agri. households
belonging to the size class of land possessed (ha)
Est. no.
agri.
households
having
outstanding
loan (00)
Proportion
of indebted
agricultural
households
(0.0%) <0.01
0.01
-
0.40
0.41
-
1.00
1.01
-
2.00
2.01
-
4.00
4.01
-
10.00
10.00
+
All
classes
(1) (2) (3) (4) (5) (6) (7) (8) (9) (10) (11)
Andhra Pradesh 2409 739 893 1049 1623 3500 2494 1234 33421 92.9
Assam 4 8 24 67 71 173 0 34 5995 17.5
Bihar 73 138 132 341 279 424 1494 163 30156 42.5
Chhattisgarh 0 48 93 79 202 239 0 102 9538 37.2
Gujarat 69 120 247 311 826 1624 1148 381 16743 42.6
Haryana 95 192 737 900 1573 1162 4681 790 6645 42.3
Jharkhand 0 56 46 85 92 200 0 57 6464 28.9
Karnataka 355 778 633 987 1248 2321 3673 972 32775 77.3
Kerala 1690 1592 1944 3467 6070 7505 15726 2136 10908 77.7
Madhya Pradesh 91 119 152 270 629 1168 1952 321 27414 45.7
Maharashtra 102 453 232 455 582 2071 3869 547 40672 57.3
Odisha 88 167 337 181 326 1302 22281 282 25830 57.5
0
2000
4000
6000
8000
10000
12000
1 2 3 4 5 6 7 8 9 10
Inco
me
(R
s.)
Decile Classes of MPCE
net receipt from farmimg ofanimals
net receipt from farmimg ofanimals
Net receipt from cultivation
Income from wages
Doubling Farmers’ Income – Volume XIII
Structural Reforms and Governance Framework
11
State
Average amount of outstanding loan (Rs’00) per agri. households
belonging to the size class of land possessed (ha)
Est. no.
agri.
households
having
outstanding
loan (00)
Proportion
of indebted
agricultural
households
(0.0%) <0.01
0.01
-
0.40
0.41
-
1.00
1.01
-
2.00
2.01
-
4.00
4.01
-
10.00
10.00
+
All
classes
(1) (2) (3) (4) (5) (6) (7) (8) (9) (10) (11)
Punjab 131 246 516 1641 2292 3266 9274 1195 7499 53.2
Rajasthan 1694 334 431 678 1031 1548 1528 705 40055 61.8
Tamil Nadu 377 674 1192 1200 2147 3224 4512 1159 26780 82.5
Telangana 563 578 794 1033 1097 1369 2690 935 22628 89.1
Uttar Pradesh 219 160 218 457 1075 1248 2178 273 79081 43.8
West Bengal 57 146 197 330 329 435 2760 178 32787 51.5
All India* 311 239 354 548 949 1827 2903 470 468481 51.9
* based on all States and UTs, including States and UTs not shown in this Statement
Source: NSSO’s 70th Round of SAS of Agricultural Households (July 2013 to June 2013)
The table further shows that higher the size class of land, higher was the outstanding debt.
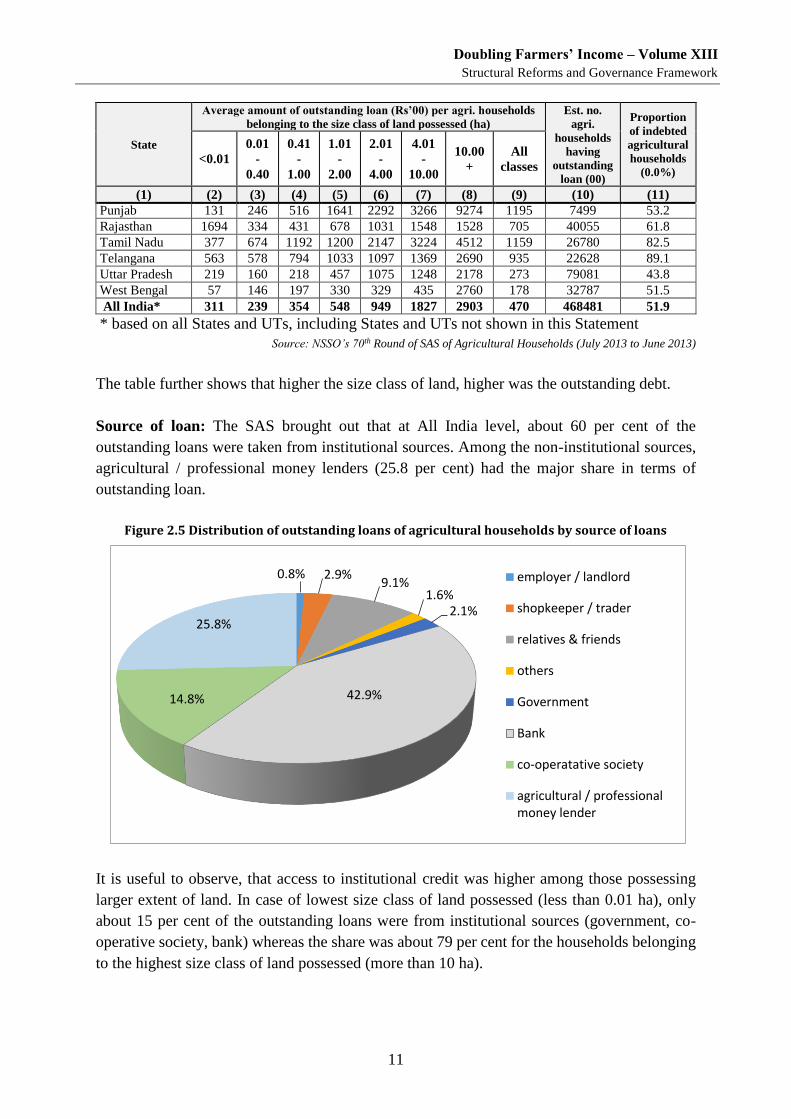
Source of loan: The SAS brought out that at All India level, about 60 per cent of the
outstanding loans were taken from institutional sources. Among the non-institutional sources,
agricultural / professional money lenders (25.8 per cent) had the major share in terms of
outstanding loan.
Figure 2.5 Distribution of outstanding loans of agricultural households by source of loans
It is useful to observe, that access to institutional credit was higher among those possessing
larger extent of land. In case of lowest size class of land possessed (less than 0.01 ha), only
about 15 per cent of the outstanding loans were from institutional sources (government, co-
operative society, bank) whereas the share was about 79 per cent for the households belonging
to the highest size class of land possessed (more than 10 ha).
0.8% 2.9%9.1%
1.6%2.1%
42.9%14.8%
25.8%
employer / landlord
shopkeeper / trader
relatives & friends
others
Government
Bank
co-operatative society
agricultural / professionalmoney lender
Doubling Farmers’ Income – Volume XIII
Structural Reforms and Governance Framework
12
Table 2.5 Distribution of outstanding loans by source of loan taken for different size classes of land possessed
Size class
of land
possessed
(ha)
Per 1000 distribution of outstanding loans by source of loan
Govt
Co-
operative
society
Bank Employer
/ landlord
Agricultural
professional
money
lender
Shopkeeper/
trader
Relatives
&
friends
Others All
(1) (2) (3) (4) (5) (6) (7) (8) (9) (10)
<0.01 4 16 129 6 637 14 175 18 1000
0.01-0.40 13 146 310 8 324 25 142 31 1000
0.41-1.00 17 139 376 8 274 66 106 14 1000
1.01-2.00 26 147 475 7 233 15 76 20 1000
2.01-4.00 19 156 500 14 238 12 58 3 1000
4.01-10.0 38 175 502 4 187 14 65 15 1000
10.0 + 11 143 635 0 161 5 38 6 1000
All sizes 21 148 429 8 258 29 91 16 1000
Relationship between farm size and productivity
The long debated question of relationship between farm size and productivity was studied
extensively by various researchers. Based on extensive analysis of both kharif and rabi crop
seasons, Sarthak Gaura and Srijit Mishra (2015) concluded that, “the efficiency of the
smallholder as a result of greater productivity has to be treated with some caution as it ignores
the low absolute levels of their returns, which raise questions about the sustainability of their
livelihoods. This is further aggravated by the fact that they pay relatively higher unit costs and
because of their greater dependence on purchased inputs”.
In as much, a study by Ramesh Chand et al (2011) finds that, “while the farm in India is superior
in terms of production performance, it is weak in terms of generating adequate income and
sustaining livelihood. Tiny holdings below 0.8 ha do not generate enough income to keep a farm
family out of poverty despite high productivity. Nearly three-fourths of small farmers in India fall
under poverty if they do not get income from non-farm sources”.
Further, authors suggest that, “serious steps should be taken to create employment avenues for
smallholders outside agriculture, but within the countryside so that the workforce in small farms
gets work and income from non-farm activities without leaving the farms. This seems to be the
only way to achieve higher productivity and to sustain agricultural growth together with
augmenting the income of smallholders for improved livelihood”.
The global trends on farm size are not very helpful either. The recent study by Sarah et al
(2016), based on extensive trend analysis from 1960 to 2000, concludes that:
there are more than 570 million farms in the world; more than 475 million farms are
smaller than 2 ha, and more than 500 million are family farms;
Doubling Farmers’ Income – Volume XIII
Structural Reforms and Governance Framework
13
from 1960 to 2000, average farm size decreased in most low and lower-middle-income
countries and in South Asia; and
globally, 84 per cent of farms are smaller than 2 ha, and they operate about 12 per cent
of farmland.
The inverse relationship between farm size and productivity based on the aggregate of all crops
has been quite pronounced in recent years. Various theories about disappearing advantages of
marginal and small farmers, and efficiency gains of large sized farmers with economic
development, are not found to be operating in Asian countries like India, China, Thailand, and
Cambodia. In converse, the key is to counter the lower net returns from small holdings, which
will require collective farming, off shared and contiguous farm lands.
Land Pooling and Improving Land Use Efficiency
Since independence, agriculture has been recognised as a primary activity that supports
majority of the Indian population. In the absence of the ability of non-farm sector to absorb
surplus manpower that is now engaged in agriculture, the primary sector has continued to be
the principle livelihood provider to a vast majority. It is only since 2005-06, that a small shift
of people from agriculture to non-agriculture sector has been noticed. In result, the number of
cultivators have decreased from 12.73 per cent in 2001 to 11.88 crore in 2011.
Further, both the society at large and successive governments in particular have treated land as
the primary asset, and that, as many families as possible should have access to it. The country’s
constitutional commitment to socialism has meant that land, the primary asset should be
equitably distributed. It is this philosophy that has inspired the states to adopt progressive Land
Revenue Acts, that:
lay down the maximum land ceiling beyond which a citizen cannot own agricultural
land;
tiller shall be the owner of the land;
a person with non-farm income beyond a certain threshold is barred from purchasing
agricultural land; and
a person not already owning a piece of agricultural land is barred from purchasing one.
These provisions have, in the past, helped the landless as also the tenants, sharecroppers and
lessees to gain ownership and unhindered access to land, thereby incentivising them to invest
in agriculture, adopt new technologies and farm management practices, and produce more.
Amongst other adoptions (high yielding variety and hybrid seed, fertilizer, water and
procurement of the produce at MSP) that constituted a positive policy framework ushering in
green revolution in the country, pro-people land reforms too provided a strong platform for
India’s celebrated agricultural revolution.
However, the contemporary antidote to the non-viability of farming, arising from continuing
Doubling Farmers’ Income – Volume XIII
Structural Reforms and Governance Framework
14
land division & fragmentation, seems to be the facilitation of land pooling. The very laws that
had earlier driven a positive change in the socio-economic status of large number of cultivating
class, by enabling a more robust production system, are in some ways now seen to be becoming
an impediment to sustaining the pace of that progress.
Various studies reveal, that on an average 5-10 per cent of the arable land remains fallow in
kharif season alone. In a densely populated India with hunger for land, it is ironical that
substantive parcels of land remain uncultivated. This is on account of the fear of leasing out
land, by those incapable of cultivating themselves for various reasons including, working
elsewhere. Though it is common to see oral land lease, it comes with several disadvantages.
The lessee does not get recognised as a farmer and hence remains deprived of access to
government sponsored schemes / programmes, relief support in case of national calamity and
institutional credit. This environment is regressive from the perspective of agricultural growth
and farmers’ welfare. Permitting land lease by law, is one way of land pooling and favouring
land use efficiency.
Apart from land division, fragmentation is another big challenge. While the consolidation laws
under the State Revenue Acts do enable exchange of land pieces spatially distributed between
/ among farmers, with a view to increasing the size of the plots and viability of farms, the
process of achieving it is not easy. Not only is it costly, but is a long drawn process, besides
inviting protracted legal entanglements.
Land Pooling via Farmers Mobilisation
Indian socio-economic ethos and constitutional spirit do not admit of reverse exchange of land
ownership, however forceful its need or appropriateness may be. No argument for it can hold
water, given the large majority of people dependent on cultivable land and related agricultural
activities; and the inability of the non-agricultural sector to absorb surplus manpower of high
magnitude. Against this backdrop, there exists a strong case for designing alternate ways of
land pooling, without breaching the spirit of equitability of asset ownership at the societal level,
and without compromising the deed of right, title and ownership at individual level. This would
aid in enhancing operational scales and resultant efficiency. Some of these are discussed in the
following sub-sections.
The Andhra Pradesh Licensed Cultivators Act, 2011
The above entitled legislation of the state of Andhra Pradesh (Act No. 18 of 2011) provides for
a good example of a legal intervention to help informal tenants to access institutional credit,
insurance and other benefits under governmental schemes. The Act provides for issuance of
loan eligibility cards (LEC) to all licensed tenants on yearly basis, which authorizes the lessees
to access bank credit, insurance subsidy etc.
However, much is left desired as regards the popularity of the Act. In the year 2011-12, of the
total of 1.74 million tenant farmers in Andhra Pradesh, 0.68 million applied for LEC, and 0.51
million were issued the same. In the following year 2012-13, the licensed cultivators reduced
Doubling Farmers’ Income – Volume XIII
Structural Reforms and Governance Framework
15
to 0.41 million, accounting for recognition of 24 per cent of the tenant farmers in the state.
Some of the reasons for this poor response are:
(i) Objection by landowners, fearing that they may lose land if tenants are registered as
licensed cultivators.
(ii) Apprehension on the part of the tenants, that they may be evicted if they try to get
registered as licensed cultivators.
The questions that arise in this context are:
(i) How does one remove fear from the minds of the landowners, that they will not lose
land rights, if they lease out, or if their leased out lands are registered for licensed
cultivation?
(ii) How does one build confidence and a trust between the landowner and his tenant, that
land leasing is a win : win solution for both?
(iii) Will it not make better sense to make necessary amendments in tenancy laws to make
land leasing legal and open and deliver the desired benefits to tenant farmers?
The Model Agricultural Land Lease Act, 2016
As discussed earlier, the fear of losing right, title and ownership over one’s own land by leasing
out, discourages the land owners even when they are themselves unable to cultivate to lease
out their parcels of land. This is the cause behind substantive extent of land remaining fallow.
The State Revenue laws provide for right to ownership by proving adverse possession for a
certain period as prescribed by the actual tiller. The census 2011 reveals, that the extent of lease
in the country is around 6 per cent. In the absence of a legal provision back-stopping such
leasing, most of it is oral and therefore does not entitle the lessee to claim the status of a farmer
and access various benefits available from the government and credit institutions. It is further
known, that a lot of land remains fallow for many do not opt to offer their piece of land on oral
lease. It is, therefore, necessary that lease is legally recognised by enacting a suitable law.
However, it should explicitly and emphatically protect the interests of the land owner, in
supersession of any other provision of law that may be in force.
The Model Agricultural Land Lease Act, 2016 prepared and approved by the NITI Aayog
offers an appropriate template for the states and UTs to draft their own piece of legislations, in
consonance with the local requirements and adopt an enabling Act. This needs to be pursued
with the states and UTs as a time bound activity. This Model Act specifically bars lease in
favour of private corporates.
Key elements of the Model Land Leasing Act
(i) Legalise land leasing to promote agricultural efficiency, equity and power
reduction. This will also help in much needed productivity improvement in
agriculture as well as occupational mobility of the people and rapid rural change.
Doubling Farmers’ Income – Volume XIII
Structural Reforms and Governance Framework
16
(ii) Legalize land leasing in all areas to ensure complete security of land ownership
right for land owners and security of tenure for tenants for the agreed lease period.
(iii) Remove the clause of adverse possession of land in the land laws of various states
as it interferes with free functioning of land lease market.
(iv) Allow automatic resumption of land after the agreed lease period without requiring
any minimum area of land to be left with the tenant even after termination of
tenancy, as laws of some states require.
(v) Allow the terms and conditions of lease to be determined mutually by the land
owner and the tenant without any fear on the part of the landowner of losing land
right or undue expectation on the part of the tenant of acquiring occupancy right for
continuous possession of leased land for any fixed period.
(vi) Facilitate all tenants including share croppers to access insurance and bank credit
against pledging of expected output.
(vii) Incentivise tenants to make investment in land improvement and also entitle them
to get back the unused value of investment at the time of termination of tenancy.
Contract farming
Contract farming refers to a pre-season agreement between the farmers and a sponsoring
company, that promises the former a price at which the latter will purchase the produce post-
the harvest. Such an agreement offers the farmers to transfer the future (post-production) price
risk to the sponsor. Given the imperfect market situation that obtains in India, a situation of
glut post-the harvest is most commonly accompanied by a sharp price drop. The perishable
nature of agri-commodities combined with immediate cash needs of the farmers, leads to
distress sale, causing non-realisation of the potential monetary value of the produce.
Contract farming, which in a way is a futures trade, helps the farmers to focus on their
production for optimal yields, without the anxiety of post-harvest price situation. Since the
contract farming agreement is generally with a group of farmers, whose land may be contiguous
or in clusters dispersed within a confined geography, the farmer-members will also come to
enjoy certain other advantages related to infrastructure and transaction facilities, which may
not be financially feasible to own individually. Some of these include facilities for pre-
conditioning, primary processing, weighing, assaying, pack-housing, pre-cooling,
transportation, storage (dry & cold), etc.
Another advantage of such contract farming, is the scope that exists for benefitting from better
input management. The group of farmers can buy inputs collectively and distribute among
themselves, which would be more cost effective than when procured in small parcels. They can
as a group purchase from authorised wholesalers and benefit from cheaper price and also a
more assured quality of the product. Input supply along with farm machinery, extension
education, etc. can also be made a responsibility of the sponsor as a part of the contract.
In effect, contract farming can generate benefits emanating from the farmers coming together
Doubling Farmers’ Income – Volume XIII
Structural Reforms and Governance Framework
17
to run their operations of input and output management collectively, thereby harvesting the
economy of higher scales, without diluting the status of their land ownership.
There have been efforts to promote contract farming in the country for more than a decade
without much success. While the intervention has not been able to scale up, there yet are many
bright examples, particularly in the horticulture sector worthy of emulation. These can be
studied for replication and scale up across the country and commodities.
One of the reasons for slow progress of contract farming has been the conflict of interest arising
from authorising the APMCs to regulate the agreements. Since the provisions relating to
contract farming have been a part of the state APMC Acts, the subject has not received the
deserved advocacy & promotion at the field level, apart from being hindered by the conflict of
interest that APMCs bring to the fore. After all, contract farming too is a form of marketing
that is also the principle mandate of the APMCs.
It is an appropriate decision of the government to draft an exclusive Model Contract Farming
Act, which found authorization in the Union Budget 2017. As a prelude to this, the Model
APLM Act, 2017 leaves out all the provisions relating to contract farming. The Committee
constituted by the Ministry of Agriculture & Farmers’ Welfare is to formulate a suitable draft
for the government and it is hoped that it will be shared with the states and UTs during the
early period of the year 2018 after receiving due approval from the competent authority.
One of the challenges of any contract farming, is to ensure that the two parties to the Agreement
honour their respective obligations and commitments. It would therefore be necessary to create
a win : win situation for both the parties by facilitating:
sharing of profits with the farmers in case the sponsoring company benefits excessively
from windfall gains; and
sacrifice of a small percentage by the farmers in case the prices plummet sharply and
the sponsor is likely to experience unsustainable loss.
The Act should provide for flexibility, so that:
The States/UTs are able to attract sponsors.
An empowered Authority in place can enforce the agreement, make rules / guidelines
to advise, guide, counsel, supervise and monitor contract farming and services, besides
promoting the same through advocacy.
Services as a contractual arrangement should also be part of this Act. The Act should also be
all encompassing, across all the sub-sectors including field crops, horticultural crops, dairy &
livestock, poultry, fishery etc. From the global experience, it is seen that contract farming has
not been able to easily attract small and marginal farmers. It is, therefore, important that the
provisions of the Act are not only attractive enough for the small and marginal farmers to enter
the fold of contract farming, while protecting their interests including land rights in particular.
Doubling Farmers’ Income – Volume XIII
Structural Reforms and Governance Framework
18
Farmer Producer Organisations (FPOs)
There already exists vast experience of bringing common interest groups together, across the
country, with different objectives. Some illustrations are Self Help Groups (SHGs) of women
in the domain of micro-finance; Joint Liability Groups of NABARD for enhancing credit
borrowing by farmers (lessees in particular); Commodity Interest Groups (CIGs) etc. In
addition, there are many successful farmer producer organisations (FPOs) registered as both
farmers’ cooperatives and companies.
Realising certain challenges and weaknesses of a cooperative FPO, efforts have been made
since 2012 to promote farmer producer companies (FPCs) registered under the Company’s Act.
Both NABARD and SFAC (Small Farmers Agri-business Consortium) have been advocating
and promoting FPCs. The rationale for promoting FPCs registered under the provisions of
Companies Act, 1956 (facilitated by a special amendment) is the possible advantage of
combining the spirit of a cooperative with the operational flexibility of a private company.
There are some among the FPCs that have demonstrated success, proving the advantages of
collective operations. However, progress has been slow and can be accelerated.
It would help if every farmer is encouraged and supported to become member of an FPC and
also integrate himself with a value chain platform. These will help him surmount the challenges
of price unpredictability at the marketing stage, and help converge his production from small
holding with others. Given the large number of small & marginal farmers in particular and the
large number of landholdings, the scale up is a daunting task. Yet, it is a necessity and the
framework for promotion and the target to be chased are discussed in Volume-IV of this Report,
which may be referred to. Large area based farming clusters in the form of Village Producer
Organisations (VPOs) is also discussed, to create village level economies of scale, both for
specific crops and for integrated farming systems.
FPOs and VPOs offer the farmers advantages that come from higher scales of operation at
various stages of the agricultural value system. The obvious advantage of collective actions is
the collective output and the increased bargaining power of each farmer-member. And the
farmer can avail of these advantages while retaining his individual ownership status. In the
view of this Committee, a minimum of 7,000 number of FPOs & VPOs should be targeted by
2022-23 and double that target number in the six years thereafter. This will be important to
address a the structural weakness of small and marginal farm holdings.
Other Land related Issue
Land Management has continued to be challenging and the owners are never at ease on account
of a plethora of issues. There is need for resolving all these and given the power of technology
- IT, ICT, geo-spatial technology etc., it is much easier today to surmount the long standing
land related challenges. Some of these are discussed below:
Civil disputes
More than 55 per cent of the civil disputes across the country are related to land. Developing
Doubling Farmers’ Income – Volume XIII
Structural Reforms and Governance Framework
19
accurate and approved land ownership records with GPS (global positioning system) and
revenue department certification would drastically reduce the profitability of civil disputes and
also the huge amounts of expenditure incurred by the farmers on court cases. This exercise can
also be carried out in Public Private Partnership mode, successful examples of these being the
Government of Karnataka’s “Urban Property Ownership Records” and Government of India-
supported scheme on land use resurvey in collaboration with state governments. Other linked
interventions are comprehensive digitisation of land records; online and location agnostic
registration of land transactions; and automatic & continuous mutation of land records that
reflects an updated ownership status.
Developing land markets
Often farmers tend to suffer loss in sale of land, due to opaque practices of land agents. The
huge price differentials underlines the need to develop a transparent land market (similar to the
share market). Providing an online platform to buy and sell land, with geo-tagging, would
enable both the seller and the buyer to negotiate a price and realise better returns. At the outset,
this will mean that land sellers will be induced to get their land size and title digitally geo-
tagged, for which GIS-based farm plot surveys will have to be carried out across the country.
Based on guidelines of the Department of Revenue, a digitally signed and geo-tagged
certificate should be issued to the actual plot owner, which an owner desirous of making a sale
can display in the land market. This exercise may be initiated on a pilot basis in select districts
in PPP mode in collaboration with the Government of India and respective state governments.
Based on the learnings and formulation of suitable guidelines, the practice can be scaled up.
Key Extracts
The country’s population has increased, adding to the demand for agricultural goods,
but fragmentation of land holding, is impacting the operational viability of farms.
Land, the principle asset of the farmer, is now handkerchief sized and this has direct
bearing on the production and associated income returns to individual farmers.
Land pooling must be incentivised through legislating the Model Land Leasing Act,
2016. The Act safeguards owners land rights while providing tenants, including share
croppers access to govt. support for cultivation.
The Committee constituted by Ministry of Agriculture & Farmers’ Welfare is to
recommend a suitable draft for a Model Contract Farming Act, including services.
Farmer producer organisations need to be encouraged, including FPCs. In accordance,
they may be given priority for cultivation on pooled land and for allied infrastructure
development so as to harvest the desired economy of scale in operations.
Comprehensive digitisation of land records including location agnostic online
registration of transactions, to generate seamless and updated record of land ownership
be carried out.

Doubling Farmers’ Income – Volume XIII
Structural Reforms and Governance Framework
21
Defining a Farmer for Inclusiveness
Governments at both central and state levels, as also credit institutions, make available support-system
in terms of inputs, technology, management practices and knowledge. Since the entitlement is linked to
possessing title deed of the land, a substantive number of farmers who cultivate land as lessees,
sharecropper, tenants, etc. stand deprived of access to the beneficial support system. In the larger
interest of agriculture, there is a need to adopt a liberal approach in defining a farmer. This chapter
examines the need and norms for farmer inclusiveness.
Agricultural workers
Agricultural Statistics defines agricultural workers to include cultivators and agricultural
labourers. In the year 1951, the total numbers of agricultural workers were 97.2 million
(cultivators 69.9 million + agricultural labourers 27.3 million). There was a steady increase in
respect of both the cultivators and the agricultural labourers from census to census conducted
decadally till 2001, when the total number of agricultural workers rose to 234.1 million,
comprising 127.3 million cultivators and 106.8 million agricultural labourers. As per 2011
census, while the total number of agricultural workers rose to 263.1 million, the number of
cultivators declined for the first time to 118.8 million and agricultural labourers increased to
144.3 million. It is indicative of the shift of cultivators between 2001 and 2011 to non-
agricultural activities. It is also possible that some cultivators may have joined the ranks of the
landless labourer.
The nomenclature of ‘agricultural worker’ for a cultivator may not be appropriate. It needs to
be appreciated, that a cultivator is an entrepreneur, who manages his land or livestock like an
industrial entrepreneur. To a cultivator, management of his asset involves decisions relating to
input and output, and negotiating several risks associated with largely a biological activity that
agriculture is. The cultivator or a livestock keeper, therefore, needs to be recognised as an
agricultural entrepreneur. The National Commission on Farmers (NCF), 2007 in its Report
considered both land owning cultivators and landless agricultural workers as farmers.
However, no specific recommendations were made to improve the welfare of the landless
agricultural labourers.
As regards cultivators per se, not all cultivators are currently recognised as farmers in reality.
A farmer is largely perceived to be the one who owns cultivable land, whether he is cultivating
it himself or not; or even directly managing it himself or not. While majority of the cultivators
are land owners too, a substantive number of cultivators are not land owners. And therein arises
the problem of exclusion of many an actual cultivator by the currently recognised definition of
a ‘farmer’.
To all intents and purposes, a farmer is one who owns land and possesses a revenue record that
establishes his right, title and ownership. This record of right (RoR) is the ‘certificate’ that
offers him a right to access all benefits – material or otherwise, that the government provides
through large number of its schemes, programmes and missions. The institutional credit – both
Doubling Farmers’ Income – Volume XIII
Structural Reforms and Governance Framework
22
short term crop loans and long term investment loans are also available based on RoR. The
tenants or lessees or sharecroppers are not considered as eligible to avail of institutional credit.
The only exception though, is when the farmer becomes a member of a Joint Liability Group
(JLG), a group of 10 members. Promoted by NABARD, there are about 1 lakh JLGs in the
country, which means a marginal coverage of farmers and cultivated area in the country.
Similarly, the relief measures under the Relief Act are also accessible only against RoR.
The vision of the Government is to double the income of the farmers. The DFI Committee
focuses on strategy to improve farm incomes, and therefore, does not directly address the issues
relating to the welfare of the landless agriculture labourers, who constitute a large section of
the rural society. It may not mean much just by including them (144.3 million, census 2011)
under the class of ‘farmers’, as they will need to be addressed separately, since their livelihood
issues, while linked to agriculture differ in many ways and are unique to them as a class.
However, the strategy recommended by DFI Committee is expected to generate additional job
opportunities for the landless labourers too in multiple agricultural activities and contribute to
their welfare. Further, the farmers earning higher net incomes can also be expected to pay the
agricultural labour at a higher level.
Various benefits like seed kit, fertilizers, pesticides, farm machinery, micro-irrigation, land
development, etc. are given to the one who can prove land ownership. As a consequence, the
actual cultivator like the lessee, share cropper, tenant, etc. who are in reality substantive in
number stand to be excluded from the system of benefits and entitlements. The outcome is, that
the objectives of the government intervention, which are all meant to improve the status of
agriculture in the country may not be equitable and inclusive.
Purely from the perspective of developing agriculture and ameliorating the condition of the
farmers, the actual cultivator also must be recognised as a farmer and rendered eligible to all
the benefits under various schemes / programmes / missions, as also institutional credit and
relief measures. Under the provisions of Land Reforms, the tiller is considered as owner,
precisely to promote agricultural development, for it is believed, that the owner of the land will
demonstrate greater commitment to professional management. However, a situation has arisen
now, where more than 65 per cent of the landholdings are less than 1 (one) ha. in size. Most in
India still perceive land as a valuable asset and the owners may not be willing to give up
ownership and tend to cling on to it. Probably, a sense of security and emotional attachment
blend together, to enhance the land-centric sentiment among most Indians. It may only be much
later in the future, when those whose principle source of income is not from farms and are
earning enough from their salaries or business / service, that they may want to dispose off their
small pieces of land, helping land consolidation as a sequel.
For the present therefore, it would be practical to liberalise the definition of farmer by
including both the land owner, and the one not owning but cultivating it as a lessee or
sharecropper or in any other way, under the definition of a farmer.

Doubling Farmers’ Income – Volume XIII
Structural Reforms and Governance Framework
23
Norms based Definition of Farmer
In the above context, it is suggested that certain norms be identified to define a farmer,
rendering him/her eligible for all agriculture related benefits. Further, the list of farmers can be
dynamic, which means that there can be both entry and exit options, based on the actual status
of ownership and / or cultivation. Some of the norms suggested are:
i. Ownership of land and/or actual cultivation.
ii. Agreement with the land owner to the effect that he/she is a lessee / sharecropper, etc.
iii. Eligibility for the period of agreement of lease, etc. with the land owner.
iv. Gender of farmer.
A portal may be developed to enable the owner and lessee, etc. to post their status, accompanied
by relevant document(s). A database can be maintained by the local Revenue Officer or Gram
Panchayat or the local Agriculture Officer. An annually authenticated village-wise database
can be made accessible to the officers of the departments of Agriculture, Horticulture, Animal
Husbandry, Fisheries, Banks, Cooperatives, Relief, etc. who are then free to offer eligible
benefits to newly defined farmers.
A web enabled application will enable the interested parties to update their status from time to
time by using their mobiles or laptops / desktops or when they do not own one, can do so from
citizen service centres (CSC) or Gram Panchayats and the like.
Key Extracts
There exists confusion when defining a farmer and a cultivator. A cultivator would be
undertaking farming activities, but may not own land.
Landless cultivators get excluded from various benefits by the government, which for
all intents are designed for farmers (those who possess a revenue record to establish
ownership of agricultural land).
Definition of Farmer, needs to be liberalised so as to include cultivators, lessee
sharecropper, etc. This will enable the cultivators to access the support-system that is
intended to buttress all those pursuing an agricultural enterprise.
An online and annually authenticated database may be developed to identify and define
a farmer, to render him/her eligible to avail agriculture related support-system.
A harmonised web-portal to enable interested individuals to upload and update their
status as farmers from time to time, will allow the support-system to optimise their
offer and reach the benefits to the most eligible beneficiaries.

Doubling Farmers’ Income – Volume XIII
Structural Reforms and Governance Framework
25
Uncontrolled Variables - Production & Market
It is well known, that agriculture being a biologically driven process is dependent on nature, and
therefore is vulnerable to production risks. The farmers also suffer from market uncertainties, due to
inefficient marketing structure. This chapter examines the nature of these risks and ways to resolve the
same, so as to impart greater certainty at both production and post-production stages. This would help
the farmers realise stability of income returns from agriculture.
Agricultural and Industrial Production
The process of agricultural activities across crop production, livestock & dairy, poultry, fishery
etc. are all nature-bound and hence, influenced by variables external, that matter to the
cultivator in respect of production, productivity, pest and disease management, resource use
etc., and are difficult to be regulated unlike in the industrial sector. The latter, which is a
mechanically driven process, also depends on various factors of production for the manufacture
of its output, these nevertheless, to a greater extent, are amenable to control and change.
Wherever the factors of production and related variables are manipulable, there exists scope to
regulate the supply in consonance with the expected demand. This is a big advantage that a
manufacturing sector enjoys vis-à-vis a biologically driven activity like that of agriculture.
Regulation of supply implies that the production can either be increased by enhancing the
capacity utilisation to meet the expected increase in the market demand or it can be reduced if
the demand is likely to be subdued.
In contrast, in agriculture which is more an open activity, bound by seasonality, there is a fixed
time (limited window) to begin the production operations and once this operation is rolled out
it cannot be held back. Seasonal nature is characterised by binary system of ‘Yes’ or ‘No’.
When it is time to sow / plant / harvest, the farmers either does it or does not and miss the
opportunity. Hence, the farmer is always dragged down by an Hobson’s choice. Inability to
regulate the supply in accordance with the dynamic changes in the market negatively impinges
on the ability of the farmer to monetize his produce appropriately.
Not only is the process of production irrevocable once it is rolled out with the first activity of
sowing / planting, but also the crop is subject to multiple vulnerabilities like variations in
temperature, rainfall, humidity, etc. Every crop has its own critical stages in production, at each
of which water the critical input is highly necessary. If the monsoon fails at this critical stage
of crop growth and there is no dependable source of water to meet the obligatory demand, then
the crop is bound to suffer in terms of vegetative growth as also its final yield. The weather
pattern also influences the probability of infestation by pests and diseases. As seen thus, all
kinds of cropping programmes face uncertainty. Likewise other agricultural activities like
dairying and livestock, poultry, fisheries etc. are also vulnerable to external weather patterns.
In India, 52 per cent of the country’s net cultivable area of 141 million ha. is rainfed. A rainfed
area is defined as one where there is no dependable source of water from either surface or
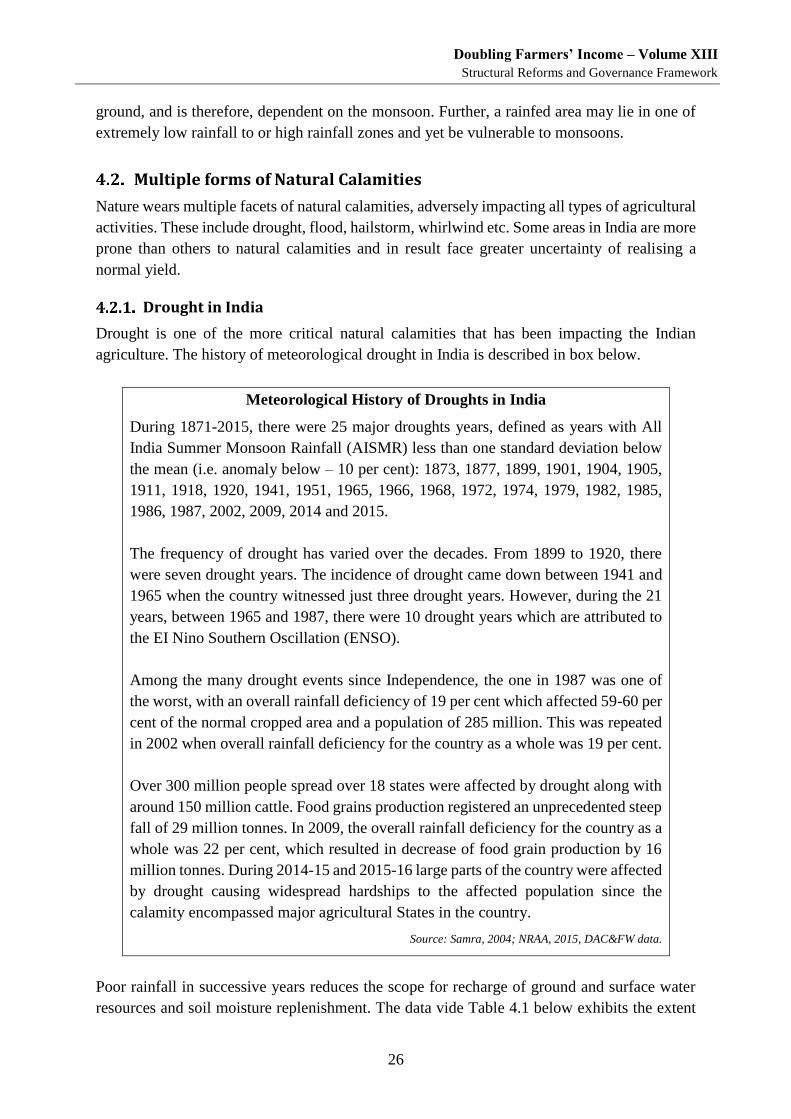
Doubling Farmers’ Income – Volume XIII
Structural Reforms and Governance Framework
26
ground, and is therefore, dependent on the monsoon. Further, a rainfed area may lie in one of
extremely low rainfall to or high rainfall zones and yet be vulnerable to monsoons.
Multiple forms of Natural Calamities
Nature wears multiple facets of natural calamities, adversely impacting all types of agricultural
activities. These include drought, flood, hailstorm, whirlwind etc. Some areas in India are more
prone than others to natural calamities and in result face greater uncertainty of realising a
normal yield.
Drought in India
Drought is one of the more critical natural calamities that has been impacting the Indian
agriculture. The history of meteorological drought in India is described in box below.
Meteorological History of Droughts in India
During 1871-2015, there were 25 major droughts years, defined as years with All
India Summer Monsoon Rainfall (AISMR) less than one standard deviation below
the mean (i.e. anomaly below – 10 per cent): 1873, 1877, 1899, 1901, 1904, 1905,
1911, 1918, 1920, 1941, 1951, 1965, 1966, 1968, 1972, 1974, 1979, 1982, 1985,
1986, 1987, 2002, 2009, 2014 and 2015.
The frequency of drought has varied over the decades. From 1899 to 1920, there
were seven drought years. The incidence of drought came down between 1941 and
1965 when the country witnessed just three drought years. However, during the 21
years, between 1965 and 1987, there were 10 drought years which are attributed to
the EI Nino Southern Oscillation (ENSO).
Among the many drought events since Independence, the one in 1987 was one of
the worst, with an overall rainfall deficiency of 19 per cent which affected 59-60 per
cent of the normal cropped area and a population of 285 million. This was repeated
in 2002 when overall rainfall deficiency for the country as a whole was 19 per cent.
Over 300 million people spread over 18 states were affected by drought along with
around 150 million cattle. Food grains production registered an unprecedented steep
fall of 29 million tonnes. In 2009, the overall rainfall deficiency for the country as a
whole was 22 per cent, which resulted in decrease of food grain production by 16
million tonnes. During 2014-15 and 2015-16 large parts of the country were affected
by drought causing widespread hardships to the affected population since the
calamity encompassed major agricultural States in the country.
Source: Samra, 2004; NRAA, 2015, DAC&FW data.
Poor rainfall in successive years reduces the scope for recharge of ground and surface water
resources and soil moisture replenishment. The data vide Table 4.1 below exhibits the extent
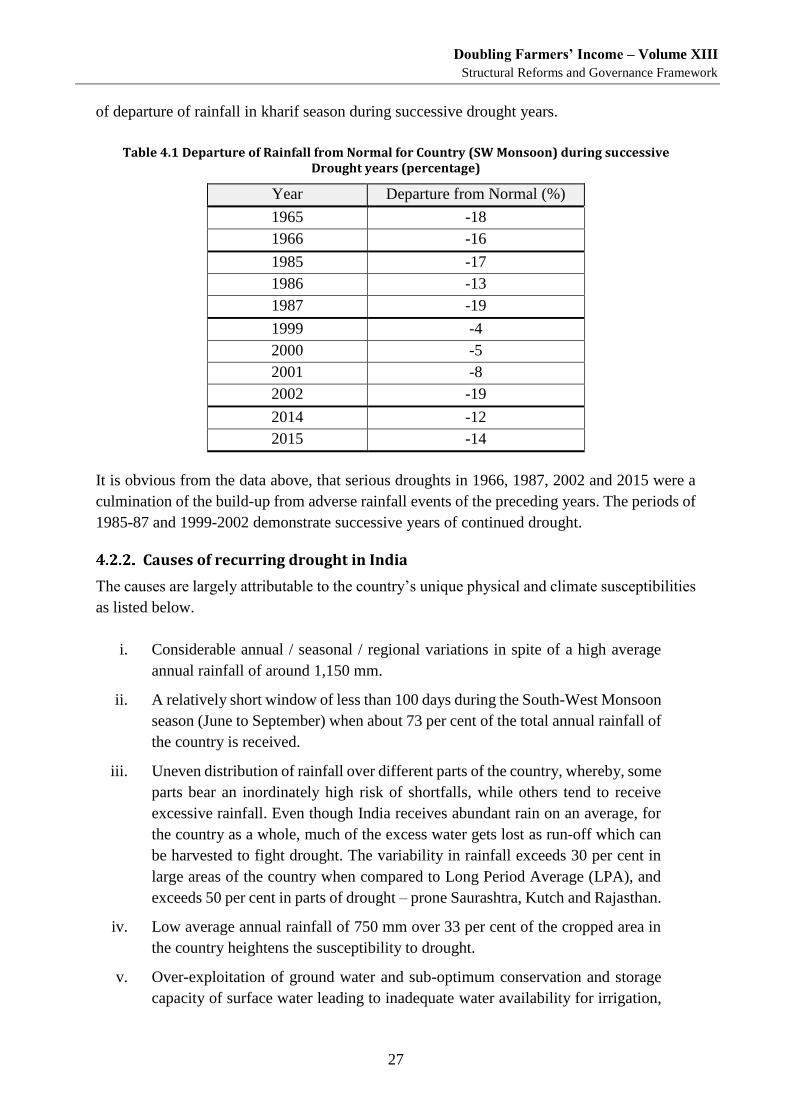
Doubling Farmers’ Income – Volume XIII
Structural Reforms and Governance Framework
27
of departure of rainfall in kharif season during successive drought years.
Table 4.1 Departure of Rainfall from Normal for Country (SW Monsoon) during successive Drought years (percentage)
Year Departure from Normal (%)
1965 -18
1966 -16
1985 -17
1986 -13
1987 -19
1999 -4
2000 -5
2001 -8
2002 -19
2014 -12
2015 -14
It is obvious from the data above, that serious droughts in 1966, 1987, 2002 and 2015 were a
culmination of the build-up from adverse rainfall events of the preceding years. The periods of
1985-87 and 1999-2002 demonstrate successive years of continued drought.
Causes of recurring drought in India
The causes are largely attributable to the country’s unique physical and climate susceptibilities
as listed below.
i. Considerable annual / seasonal / regional variations in spite of a high average
annual rainfall of around 1,150 mm.
ii. A relatively short window of less than 100 days during the South-West Monsoon
season (June to September) when about 73 per cent of the total annual rainfall of
the country is received.
iii. Uneven distribution of rainfall over different parts of the country, whereby, some
parts bear an inordinately high risk of shortfalls, while others tend to receive
excessive rainfall. Even though India receives abundant rain on an average, for
the country as a whole, much of the excess water gets lost as run-off which can
be harvested to fight drought. The variability in rainfall exceeds 30 per cent in
large areas of the country when compared to Long Period Average (LPA), and
exceeds 50 per cent in parts of drought – prone Saurashtra, Kutch and Rajasthan.
iv. Low average annual rainfall of 750 mm over 33 per cent of the cropped area in
the country heightens the susceptibility to drought.
v. Over-exploitation of ground water and sub-optimum conservation and storage
capacity of surface water leading to inadequate water availability for irrigation,
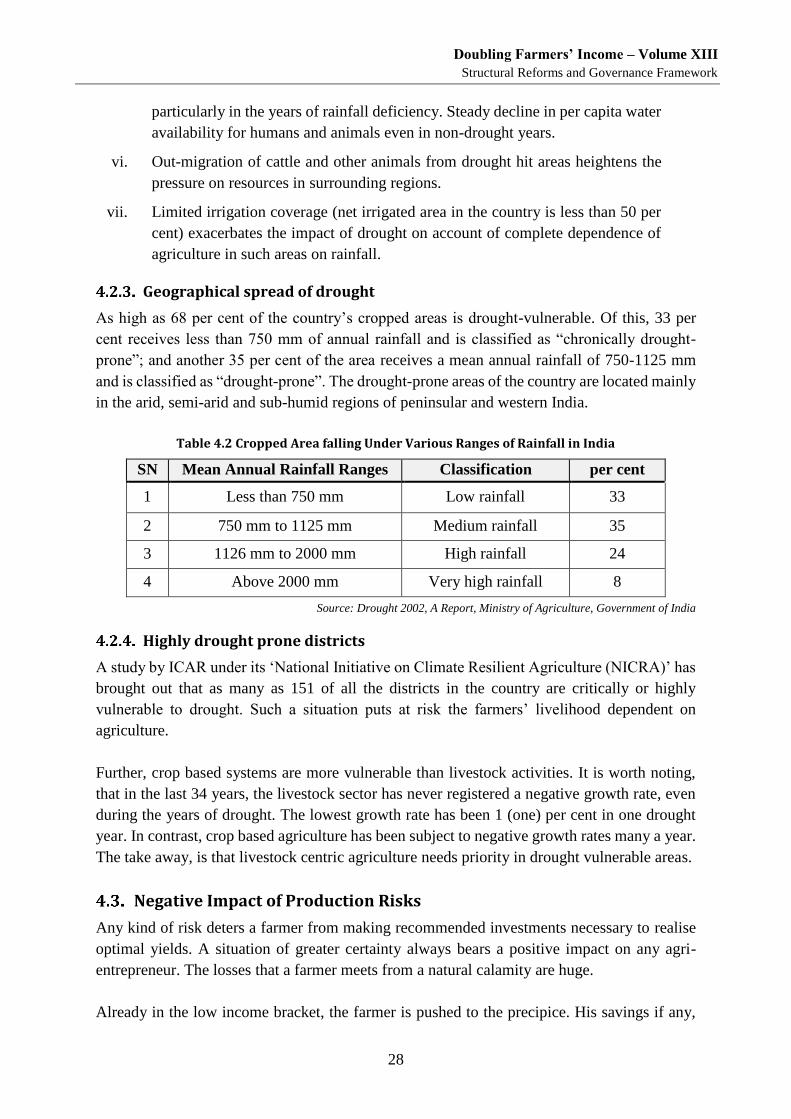
Doubling Farmers’ Income – Volume XIII
Structural Reforms and Governance Framework
28
particularly in the years of rainfall deficiency. Steady decline in per capita water
availability for humans and animals even in non-drought years.
vi. Out-migration of cattle and other animals from drought hit areas heightens the
pressure on resources in surrounding regions.
vii. Limited irrigation coverage (net irrigated area in the country is less than 50 per
cent) exacerbates the impact of drought on account of complete dependence of
agriculture in such areas on rainfall.
Geographical spread of drought
As high as 68 per cent of the country’s cropped areas is drought-vulnerable. Of this, 33 per
cent receives less than 750 mm of annual rainfall and is classified as “chronically drought-
prone”; and another 35 per cent of the area receives a mean annual rainfall of 750-1125 mm
and is classified as “drought-prone”. The drought-prone areas of the country are located mainly
in the arid, semi-arid and sub-humid regions of peninsular and western India.
Table 4.2 Cropped Area falling Under Various Ranges of Rainfall in India
SN Mean Annual Rainfall Ranges Classification per cent
1 Less than 750 mm Low rainfall 33
2 750 mm to 1125 mm Medium rainfall 35
3 1126 mm to 2000 mm High rainfall 24
4 Above 2000 mm Very high rainfall 8
Source: Drought 2002, A Report, Ministry of Agriculture, Government of India
Highly drought prone districts
A study by ICAR under its ‘National Initiative on Climate Resilient Agriculture (NICRA)’ has
brought out that as many as 151 of all the districts in the country are critically or highly
vulnerable to drought. Such a situation puts at risk the farmers’ livelihood dependent on
agriculture.
Further, crop based systems are more vulnerable than livestock activities. It is worth noting,
that in the last 34 years, the livestock sector has never registered a negative growth rate, even
during the years of drought. The lowest growth rate has been 1 (one) per cent in one drought
year. In contrast, crop based agriculture has been subject to negative growth rates many a year.
The take away, is that livestock centric agriculture needs priority in drought vulnerable areas.
Negative Impact of Production Risks
Any kind of risk deters a farmer from making recommended investments necessary to realise
optimal yields. A situation of greater certainty always bears a positive impact on any agri-
entrepreneur. The losses that a farmer meets from a natural calamity are huge.
Already in the low income bracket, the farmer is pushed to the precipice. His savings if any,
Doubling Farmers’ Income – Volume XIII
Structural Reforms and Governance Framework
29
melt soon and the farmer is left with no capacity to meet the subsequent season production
investments. The probability of his indebtedness increases.
As discussed in paragraphs 4.1 and 4.2, the risks associated with production are:
(i) Market related - inability to regulate the supply in accordance with the demand.
(ii) Production related - exposure to unpredictability and extremities of weather.
Interventions for regulating production and supply
Price and demand forecast
The prices for farm produce are a function of both local supply and demand situations. They
are also influenced by global demand and supply situations, since Indian agriculture is now
integrated with global markets. In addition, exogenous socio-political factors also tend to
exacerbate the price volatility. Price volatility is very common in the agricultural sectors
especially in the whole produce segment. Despite high production, the farmers fail to realise
proportionate income returns on account of prices dipping below normal.
Most agri-commodities are subject to ‘cobweb’ influence (see Chapter 2, Volume IV), which
means that there is high degree of correlation between situations of high production and
subdued market prices, followed by a reverse situation in the following season. The production
is seen to always face a lag of at least one season, as generally the farmers are influenced by
the past season’s prices. Guided purely by an attractive price for a particular commodity in the
previous marketing season, many farmers tend to bring additional area under that crop, only to
face a situation of glut and the corresponding price trough in the following season. This results
in a reciprocal reduction in production in the next season. Meanwhile, in tis duration, the
demand is seen to follow a near constant trend, and hence price fluctuation is more influenced
by the supply side.
This market unpredictability related income loss to the farmers can be addressed by adopting
a system of price and demand forecasting. This will help the farmers to take a rational decision
on what to grow and how much to grow. The system of demand and price forecast in India is
almost absent. As discussed in Chapter 9 of Volume-IV of this Report, price forecasting system
needs to be, and can be adopted. There exist robust econometric models, whose validity has
been successfully demonstrated in the field, that manifest in the high degree of correlation
between forecasted price and actual spot price.
The Directorate of Marketing & Inspection (DMI) under the Department of Agriculture,
Cooperation & Farmers’ Welfare can be restructured and re-mandated to own the responsibility
of price and demand forecasting. The farmers aided by better predictability of future price and
demand, will to a great extent, find answers to their current situation of market risk.
Doubling Farmers’ Income – Volume XIII
Structural Reforms and Governance Framework
30
Accuracy of area coverage under various crops – production estimates
The Ministry of Agriculture collects agricultural statistics relating to crop coverage and
production estimates for both agronomic (cereals, pulses, oilseeds, fibres, commercial) and
horticultural (fruits & vegetable) crops on a regular basis.
For every agricultural year (July-June), the Directorate of Economics & Statistics (DES),
Department of Agriculture, Cooperation and Farmers Welfare, Ministry of Agriculture and
Farmers Welfare releases four Advance Estimates (AE) followed by Final Estimates of
production of major agricultural crops of the country (Annexure-I).
Each of these five estimates is available State-wise and at the national level for the 27 identified
crops. The time of release and period covered under each of these estimates are as under:
The First Advance Estimates are released in September. These cover only kharif
crops, when kharif sowing is generally over.
The Second Advance Estimates are normally released in February of the following
year when rabi sowing is also over. The second advance estimates cover kharif as
well as rabi crops. They take into account; (i) firmed up figures on kharif area
coverage; (ii) available data on crop cutting experiments for yield assessment of
kharif crops; and (iii) tentative figures on area coverage of rabi crops.
The Third Advance Estimates incorporate revised data on area coverage for rabi
crops and better yield estimates of kharif crops. These are released in April-May.
The Fourth Advance Estimates are released in July-August. By this time fully
firmed up data on area as well as yield of kharif and rabi crops are expected to be
available with the States. As such, Fourth Advance Estimates are expected to be
very close to the Final Estimates.
Final Estimates are released about seven months after the Fourth Advance
Estimates in February of the following year. This allows the states sufficient time
to take into account even the delayed information while finalising area and yield
estimates of various crops.
No revision in the State level data is accepted after release of Final Estimates.
However, the first advance estimates are largely based on ‘eye assessment’ made by the
states/UTs and are therefore not accurate. Further, since the first advance estimate is released
in September, that is after the closure of the kharif season, and the second advance estimate in
February is released after the closure of the rabi sowing season, the data sets are not useful
inputs for the farmers to be guided in their production plans for both kharif and rabi seasons.
In case of horticultural crops, the responsibility for area coverage and production estimates is
that of the Division of Horticulture Statistics in DACFW. This Division collects data from
Doubling Farmers’ Income – Volume XIII
Structural Reforms and Governance Framework
31
multiple agencies including DACFW, Directorate of Arecanut and Spices Development
(DASD), Directorate of Cashew nut and Cocoa Development and Bee Board. The area
estimates are based on Girdawari and inputs supplied by the states. The production estimates
are mainly based on eye estimations, oral enquiry with farmers, productivity norms as
calculated by GCES and Crop Estimation Survey – Fruits & Vegetables (CES-F&W). See
Annexure-II for the details. The Horticulture Division releases three Advance Estimates and
one Final Estimate as under:
• The First Advance Estimates for the current year are finalised by 15th January of the year.
• The Second Advance Estimates for the current year are finalised by 15th May of the year.
• The Third Advance Estimates for the current year are finalised by 31st August of the year.
• The Final Estimates of the preceding year are released by 15th January.
Presently, there is no uniform methodology for estimating area and production of horticulture
crops and it is, therefore, subject to various errors. However, the Division has initiated more
robust methodologies as follows:
• CHAMAN (Coordinated Programme on Horticulture Assessment & Management
Using geoiNformatics.
• Estimate Sensing Methodology implemented by MNCFC (Mahalonobis National
Crop Forecast Centre.
• Sample Survey Methodology implemented by IASRI (Indian Agriculture Statics
Research Institute).
The quality of data collection and forecast would see improvement when these methodologies
are fully validated and adopted as a universal practice. As on date, the horticulture estimates
on area and yield, call for greater robustness.
In order to strengthen the advantages of demand and price forecasts, it would be necessary to
supplement the same with factual and progressive crop coverage data (both agronomic &
horticultural) through the season. A system has to be put in place, that will enable the farmers
to access continuously the coverage under different crops across the country in all the
cultivation seasons, namely, kharif, rabi and summer.
In all the seasons, the sowing / planting window is limited and normally spreads over a period
of 1-1/2 to 2 months. If the farmers can access the progress of area coverage on different crops
on a near daily basis, during the window of sowing / planting, they would be able to compare
it with the forecasted demand and price for the post-harvest market season, and take a decision
on whether it would be rational to take up cultivation of the intended crop.
Today, the information technology combined with geo-informatics makes it possible to
monitor the progress more accurately than relying upon eye estimates. For this purpose, a crop
Doubling Farmers’ Income – Volume XIII
Structural Reforms and Governance Framework
32
coverage area portal can be developed with open access to all the farmers across the country
and all related departments, traders and other stakeholders. What is then needed is orientation,
education and training of the farmers to diligently upload the data following their sowing /
planting on the portal. This can be suitably assisted by the agricultural extension system.
The end-of-day data would demonstrate the progressive coverage under different crops across
the country, which would be of great help in taking an informed decision on whether to persist
with the intended crop cultivation or to opt for an alternate crop, if the area already covered is
likely to end up with the output in excess of the predicted demand.
The data set, when further refined by data analytics, can provide the farmers more incisive and
useful signals. For example, total expected supply based on current season’s output and carry
over stock.
Other interventions to address production, price unpredictability
The advancement in science and technology, including IT and ICT make it possible today for
deploying them appropriately at various stages of the agri-value chain and attenuate the
vulnerabilities to varying extent.
Some suggestions in this regard are as follows:
(i) A robust weather forecast system and sharing of data and information on a real
time basis with the farmers.
(ii) Comprehensive drought-proofing of all the 151 districts identified as highly
vulnerable or critically vulnerable in a time bound manner.
(iii) Adoption of varieties, technologies and practices that will promote resistance /
tolerance to vulnerable factors (drought, flood, etc.).
(iv) Sustainable production system on the principles of rainfed agriculture,
watershed management, integrated farming system, etc.
(v) An agricultural production system in accordance with the agro-climatic
situation.
(vi) Adoption of sensor based technologies in water management, soil health
management etc. will make the activities more resource efficient.
(vii) A combination of sensors with robotics and data analytics will build a strong
IOT (Information of Things) platform and bring in higher resource use
efficiency and help tide over shortages of natural resources like water, etc.
(viii) Use of protected cultivation systems like shade nets, poly-houses, green-houses,
etc. will help in regulating the variations of the climate and protect crop being
cultivated from such vagaries. These systems are relatively more useful in case
of vegetables, flowers, etc.
Doubling Farmers’ Income – Volume XIII
Structural Reforms and Governance Framework
33
(ix) Deployment of IT & ICT at the multiple touch points along the supply-chain
will help in sharing data and information relating to sowing, pests & diseases,
weather marketing, etc. in real-time, so that the farmers are better prepared to
respond in a rational manner and thereby mitigate associated risks. Empowering
the supply chain, with decisive information in its inputs and outputs, will make
for a smarter agricultural value system and will allow each integral value chain
to optimise their roles in the system.
Negotiating Market Unpredictability
As discussed in the preceding paragraphs, the supply in agriculture system is relatively fixed,
and is therefore, not amenable to regulation in harmony with the changing market dynamics.
However, it is possible to make certain interventions post-the-harvest to regulate the release of
commodity into the market based on price situation.
One of the major problems that farmers face today is distress sale on account of their weak
capacity to withhold their stock, pressed as they are to dispose-off their produce immediately
to meet debt and consumption expenses.
Even when some farmers are capable of withholding their stock from immediate sale, they may
still not be able to do so due to perishable nature of certain agri-commodities (particularly
fruits, vegetables, milk, etc.) and absence of appropriate logistics systems in close proximity.
In order to help the farmers to hold back their produce and decide on its time, place and form
of sale, enabling systems, technology and infrastructure should be put in place. Some
suggestions in this direction are as follows:
(i) Enhance availability of post-harvest loans at concessional rates, so that the
farmers can avail of pledge loans for a certain period. The pledge loan system
warrants a strong network of accredited warehouses in close proximity to the
farm gate so that the farmers can transport and store at minimal costs.
(ii) Strengthen agri-logistics in terms of pack-houses, dry and cold storages, dry
and cold multi-modal transportation network. This will help the farmers to
precondition, transport and store their commodities, of their own volition, in a
safe and secure manner in right time and to places where they can fetch better
prices for their produce. The logistics components, identified to be of critical
importance, may be given special capital interest subvention to motivate
investment and offset shortfall. There will then arise a strong system of connect
between production and consumption centres.
(iii) Processing facilities, both small and large scale, can further help the farmers in
realising better value on the surpluses that cannot be consumed in fresh form
in both near and far markets. It is, therefore, necessary to strengthen food and
non-food processing facilities. Such industries, typically hold and stock
Doubling Farmers’ Income – Volume XIII
Structural Reforms and Governance Framework
34
inventories for their processing needs, and can be developed as a channel to
facilitate post-harvest loans to farmers.
Volumes III and IV of this Report provide detailed description and recommendations for
strengthening the capacity and scope of agri-logistics and agri-marketing infrastructure.
Key Extracts
There are various uncontrolled variables that effect the cultivation, harvest and post-
harvest stages of the farmers’ business.
Information on price and demand forecast can help mitigate some of these aggravating
factors. The Directorate of Marketing & Inspection can be restructured to take onus
for market intelligence and undertake price and demand forecasting.
The cropped area and production estimates can be modernised, using geo-spatial tools
for more accurate assessments. Farmers and other stakeholders can also supplement
the estimates by uploading data on a specially designed crop coverage area portal.
Suitable orientation to use the information from crop coverage data and demand data,
to take incisive decisions on selecting the planned cultivation can be done through the
agricultural extension system.
Comprehensive drought-proofing of the 151 districts identified as highly vulnerable
needs to be implemented in a time-bound manner.
Deploying sensor based technologies, including in combination with robotics and
analytics to build a robust IOT platform, will improve resource use efficiency.
The touch points in the various agricultural supply chains, need to be empowered with
shared data related to production, pests, weather, markets, etc., to allow farmers to
make best suited decisions in response to changed dynamics. This will contribute to
make the agricultural value system more integrated and transparent.
Post-harvest management and holding capacity of farmers needs to be improved
through enhanced availability of post-harvest loans and strengthening the allied
logistics and marketing infrastructure.
Doubling Farmers’ Income – Volume XIII
Structural Reforms and Governance Framework
35
Trade Regime and Export Promotion
Policies that affect Agricultural Trade, including export and import of agricultural produce, have
tended to ignore the interest of farmers. Trade may be structured to strengthen the farming sector.
There is the need to revisit and reorient the trade regime from the national perspective of doubling
farmers’ income.
Among various factors, farmers’ welfare is also hinged to their earning optimal and positive
net returns from agriculture. This necessitates realisation of remunerative prices on the
produce. Given that an ideal market situation, particularly in the agricultural sector, is difficult
to achieve, non-market interventions in support of the farmers become inevitable.
Given production growth and the untapped opportunity from enhancing productivity,
marketing opportunity for the produce have to be expanded beyond the domestic frontiers.
Higher production will require that the export potential be harvested. Indian agriculture under
the WTO regime is already integrated with the global market. Agreed upon market access
protocols and Trade Agreements with other countries also ensure the scope for import and
export of agricultural commodities.
Trade Policy used to Control Domestic Prices
A cursory look at the ‘Agricultural Trade Policy’ and tariff changes over the last decade, will
show that there have been frequent and short term adjustments. More currently, they can be
called as knee jerk reactions. Some examples are provided in chapter 5 of Volume-IV of the
DFI Report. The examples demonstrate that, both on the import and export sides, the policies
are changed frequently, interrupting the trade windows and trading relations. Long term market
relations are put at risk when trade policy is varied in the short term and is unstructured in
nature.
The trade policy for agriculture is approached as a price support and price stabilisation tool,
but its use is mainly tilted to favour consumers. On various occasions, a sudden reduction in
import tariffs due to an increase in consumer prices is evidenced, and they harm the immediate
interests of farmers, since the cheaper imports tend to offset the economic welfare of farmers
by causing a dip in market prices.
Similarly in case of exports, trade policy is used as an internal price control mechanism, to
adjust tariffs to curtail any increase in consumer prices. The Minimum Export Price (MEP) is
used as a tool to restrict or ban the export of a commodity in reaction to rising prices in the
domestic market to protect consumer interests once again. In either case, the agenda is to
control the supply of an agricultural commodity to the domestic market, to adjust temporary
demand-supply imbalances.
The frequent changes in export and import policies are often triggered by concerns of
consumers’ unease over domestic prices. The effect is a short term shift in supply and market
Doubling Farmers’ Income – Volume XIII
Structural Reforms and Governance Framework
36
value, but this in turn, causes disruptions in the production plans of farmers. Such disruption
can have long term implications, as they tend to affect next season’s cropping plans, resulting
in an unhealthy cobweb of production, price and trade.
The agricultural trade policy is not seen to promote agricultural trade, but is mainly used
to control prices in the domestic market, in reaction to short term circumstances.
There may be certain benefits in achieving this, but there is need to have an Agricultural Trade
Policy that supports and promotes linking Indian farmers with the global market. The
agricultural trade policy should be guided by balancing the interest of both the producers and
the consumers, in addition to long term food and nutritional security concerns of the country.
Agricultural Trade Policy to Promote Trade
There is no long term approach to Agricultural Trade Policy in the country, unlike the Foreign
Trade Policy announced by the Department of Commerce which usually takes a long term view
(3 years at present). As a supply control mechanism, short term adjustments in tariff and export
windows tend to disrupt any planning, or relationship building in international trade.
Agriculture is already unpredictable, subject to vagaries of nature on the domestic front and
markets uncertainties. A short term view of trade policy only adds to the existing risks and
uncertainties.
Stable trade regime
A stable trade regime must be designed to help both farmers and other stakeholders, and must
maintain a long term view so as to help build market relationships at the global level. Trade
cannot be one-sided and imports must also prevail, as is the case in commodities in deficit, like
oilseeds, paper, and others linked to consumer preferences.
A trade perspective over 5-10 years period is suggested. A mid-term planned review of
agriculture trade policy is another important recommendation, akin to the mid-term review
undertaken for foreign trade policy.
Trade policy as domestic consumer price intervention can be structured on pre-determined
signals, declared in a crop specific manner and for periods of the year, so that the trading
parameters can be accordingly planned for the long term.
For example, pre-set parameters on basis of production/supply estimates can be declared for
particular commodities. At the time of first estimates, if production is expected to be 10 per
cent less than the moving average of the preceding three years (for example), import tariff
reduction of 5 per cent will be implemented, to allow a synergistic increase in supply, to control
expected price rise. The pre-declared and advance information on tariff, will allow local traders
to optimise on rates and plan their import volumes. The trigger of 10 per cent is an example
and can be varied per commodity. However, the tariff announced should preferably not be
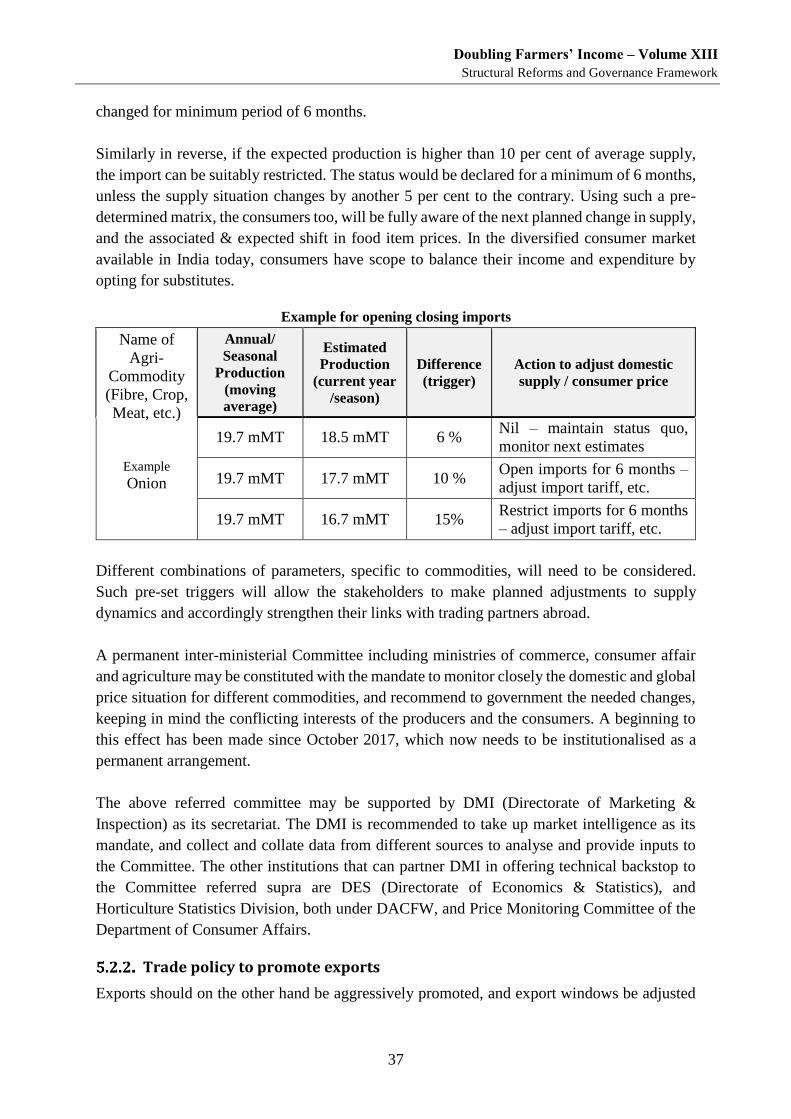
Doubling Farmers’ Income – Volume XIII
Structural Reforms and Governance Framework
37
changed for minimum period of 6 months.
Similarly in reverse, if the expected production is higher than 10 per cent of average supply,
the import can be suitably restricted. The status would be declared for a minimum of 6 months,
unless the supply situation changes by another 5 per cent to the contrary. Using such a pre-
determined matrix, the consumers too, will be fully aware of the next planned change in supply,
and the associated & expected shift in food item prices. In the diversified consumer market
available in India today, consumers have scope to balance their income and expenditure by
opting for substitutes.
Example for opening closing imports
Name of
Agri-
Commodity
(Fibre, Crop,
Meat, etc.)
Example
Onion
Annual/
Seasonal
Production
(moving
average)
Estimated
Production
(current year
/season)
Difference
(trigger)
Action to adjust domestic
supply / consumer price
19.7 mMT 18.5 mMT 6 % Nil – maintain status quo,
monitor next estimates
19.7 mMT 17.7 mMT 10 % Open imports for 6 months –
adjust import tariff, etc.
19.7 mMT 16.7 mMT 15% Restrict imports for 6 months
– adjust import tariff, etc.
Different combinations of parameters, specific to commodities, will need to be considered.
Such pre-set triggers will allow the stakeholders to make planned adjustments to supply
dynamics and accordingly strengthen their links with trading partners abroad.
A permanent inter-ministerial Committee including ministries of commerce, consumer affair
and agriculture may be constituted with the mandate to monitor closely the domestic and global
price situation for different commodities, and recommend to government the needed changes,
keeping in mind the conflicting interests of the producers and the consumers. A beginning to
this effect has been made since October 2017, which now needs to be institutionalised as a
permanent arrangement.
The above referred committee may be supported by DMI (Directorate of Marketing &
Inspection) as its secretariat. The DMI is recommended to take up market intelligence as its
mandate, and collect and collate data from different sources to analyse and provide inputs to
the Committee. The other institutions that can partner DMI in offering technical backstop to
the Committee referred supra are DES (Directorate of Economics & Statistics), and
Horticulture Statistics Division, both under DACFW, and Price Monitoring Committee of the
Department of Consumer Affairs.
Trade policy to promote exports
Exports should on the other hand be aggressively promoted, and export windows be adjusted
Doubling Farmers’ Income – Volume XIII
Structural Reforms and Governance Framework
38
to control consumer prices, only as an extremely unavoidable resort. Export opportunity should
not be restricted as controlling outwards trade is limiting the farmers’ earning opportunity to
domestic demand only.
Government needs to reconsider the approach to agricultural trade policy with mind-set to
capture international demand for ‘made in India’ produce. The policy may be structured such
that the agricultural economy has more freedom to build external markets, which is needed to
benefit from the plans to enhance production through increased productivity.
Frequent and surprise closure of export windows deprives producers and agri-traders from
planning long term targets for international trade. Export bans cause short term excesses, and
long term disruption in building export markets.
It is recommended that a long term perspective be adopted to export promotion, and that there
are no interventions disabling the associated trade relationships. Trading arrangements take
long in planning and negotiating. A trading partnership is entered into, on the assumption that
delivery will be made in full and on time (DIFOT). When policies restrict fulfilling a trade,
penalties are imposed raising costs, supply chains disrupted and long term partnerships stand
to fall. Trust and creditability are critical to trade relationships as elsewhere. In such a situation,
global markets are not readily accessible, and this denies India the opportunity to bring its
agricultural production to gainful use.
Capturing the international demand is a long drawn out process that requires changes in
production and post-production marketing, which are done to suit the target market. Blanket
and ad hoc closure to exports hurts the long term interests of farmers and disallows the private
sector from building long term relations with the farmers.
The Committee recommends, that in order to enable Indian agriculture to achieve its full
potential, the policy approach to agricultural exports be facilitative and promotional in nature,
and not be restrictive of trade or be brought into use to intervene control domestic consumer
prices. There are some price variations, which are due to other uncontrolled variables as far as
the farmer is concerned, that may be allowed as the opportunity advantage of farming.
To support growth in exports of agricultural commodities, special schemes may be devised to
provide a combination of credit, input facilitation and stock limit waivers. Such a scheme may
be implemented in mission mode and linked to the Agri-Value System Platform proposed in
Volume-IV of this Report. The support can be designed as a spearheading program with a
window of closure, such that the support for each project ends after a three year window. The
window for each project can also be linked to volume and revenue targets, such that on
achieving a milestone on each, the level of support is reduced in a staggered manner. The
scheme can be designed to exclude some sensitive commodities and / or be region specific.
The Committee recommends an aggressive strategy for developing international agricultural
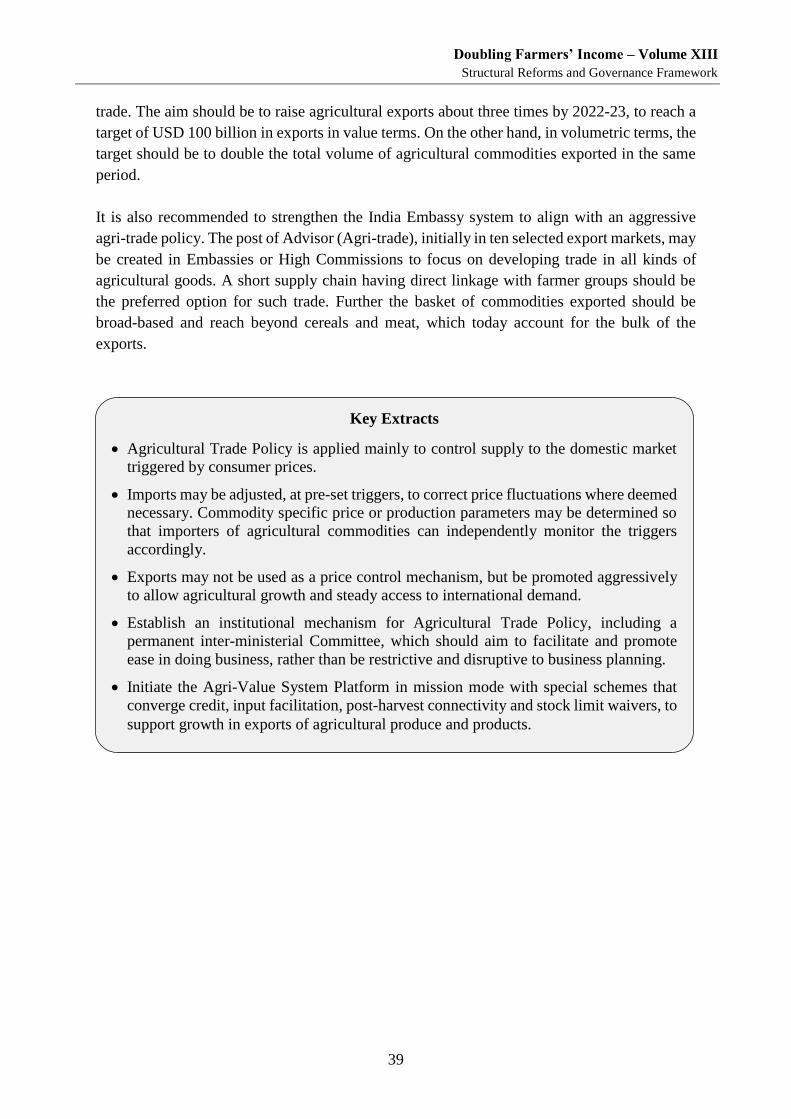
Doubling Farmers’ Income – Volume XIII
Structural Reforms and Governance Framework
39
trade. The aim should be to raise agricultural exports about three times by 2022-23, to reach a
target of USD 100 billion in exports in value terms. On the other hand, in volumetric terms, the
target should be to double the total volume of agricultural commodities exported in the same
period.
It is also recommended to strengthen the India Embassy system to align with an aggressive
agri-trade policy. The post of Advisor (Agri-trade), initially in ten selected export markets, may
be created in Embassies or High Commissions to focus on developing trade in all kinds of
agricultural goods. A short supply chain having direct linkage with farmer groups should be
the preferred option for such trade. Further the basket of commodities exported should be
broad-based and reach beyond cereals and meat, which today account for the bulk of the
exports.
Key Extracts
Agricultural Trade Policy is applied mainly to control supply to the domestic market
triggered by consumer prices.
Imports may be adjusted, at pre-set triggers, to correct price fluctuations where deemed
necessary. Commodity specific price or production parameters may be determined so
that importers of agricultural commodities can independently monitor the triggers
accordingly.
Exports may not be used as a price control mechanism, but be promoted aggressively
to allow agricultural growth and steady access to international demand.
Establish an institutional mechanism for Agricultural Trade Policy, including a
permanent inter-ministerial Committee, which should aim to facilitate and promote
ease in doing business, rather than be restrictive and disruptive to business planning.
Initiate the Agri-Value System Platform in mission mode with special schemes that
converge credit, input facilitation, post-harvest connectivity and stock limit waivers, to
support growth in exports of agricultural produce and products.

Doubling Farmers’ Income – Volume XIII
Structural Reforms and Governance Framework
41
Restrictive Policies – Liberalisation and Simplification
It is generally believed, that liberalization of the input and output management aspects of agriculture
will help farmers gain access to alternate options for choosing inputs and marketing. This chapter
discusses some important issues in this regard.
Why Liberalisation?
The production system is a function of deployment of various inputs. Of the several inputs
deployed in agriculture, some of the more important ones are seeds, fertilizers and pesticides.
The latter two include both inorganic and organic based. The cost of cultivation / production is
determined amongst others by the quality of the inputs that the farmer purchases and the price
at which he makes the purchases. The shift of farming from the traditional / conventional
system to the modern has linked agriculture to marketing more than ever before.
A large part of the agricultural production system today is driven by market forces. The farmer
purchases most of his/her input materials like seeds, nutrients and pesticides from the market.
Hence, both quality and cost of inputs become critical, if the overall cost of cultivation is to
remain rational and help increase the net farm income.
As regards post-production management, the environment for handling and monetising the
agricultural outputs has to be conducive enough to encourage capture of optimal value and
enhance the farmers’ reach into markets.
An open and liberalised environment for manufacturing and distributing the inputs is likely to
introduce competition and offer alternate options to the farmers to make a choice. It is also
likely to incentivise innovations for introduction of new and more suited types of inputs, and
also make them available to the farmers at a more reasonable cost, as a result of competition.
However, some regulation will be required to ensure that these critical inputs are available at
right time, in accordance with right quality and at rational price. There has to be room for
checking any probability of malpractice. After all, these inputs are critical to crop and livestock
production and therefore essential in nature.
Output management encompasses rules relating to trade & stock limits, and scope for free
market. Hence the need for a more liberal regime of stock limits and policies that facilitate
market participation by a wider stakeholder base.
There is a close linkage between free trade and stock limits. In a context where all produce
offered for disposal by the farmers is not procured by government agencies, private sector
participation becomes advantageous. This entails the need to facilitate alternate types of
markets and alternate forms of ownership. A pre-requisite to private trade is liberalised stock
limits. Therefore, the control orders relating to storage and Acts & Rules in respect of
marketing need to be revisited, for introducing liberalisation.
This chapter in the following paragraphs examines the restrictive environment that has largely
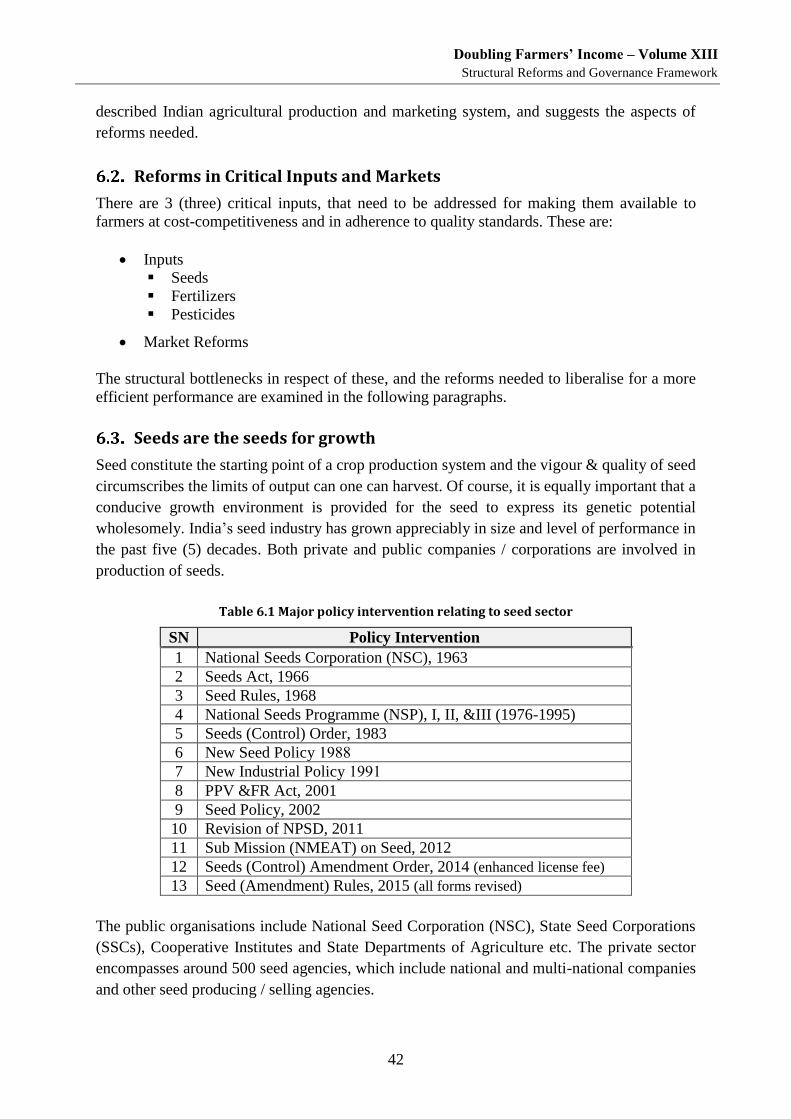
Doubling Farmers’ Income – Volume XIII
Structural Reforms and Governance Framework
42
described Indian agricultural production and marketing system, and suggests the aspects of
reforms needed.
Reforms in Critical Inputs and Markets
There are 3 (three) critical inputs, that need to be addressed for making them available to
farmers at cost-competitiveness and in adherence to quality standards. These are:
Inputs
Seeds
Fertilizers
Pesticides
Market Reforms
The structural bottlenecks in respect of these, and the reforms needed to liberalise for a more
efficient performance are examined in the following paragraphs.
Seeds are the seeds for growth
Seed constitute the starting point of a crop production system and the vigour & quality of seed
circumscribes the limits of output can one can harvest. Of course, it is equally important that a
conducive growth environment is provided for the seed to express its genetic potential
wholesomely. India’s seed industry has grown appreciably in size and level of performance in
the past five (5) decades. Both private and public companies / corporations are involved in
production of seeds.
Table 6.1 Major policy intervention relating to seed sector
SN Policy Intervention
1 National Seeds Corporation (NSC), 1963
2 Seeds Act, 1966
3 Seed Rules, 1968
4 National Seeds Programme (NSP), I, II, &III (1976-1995)
5 Seeds (Control) Order, 1983
6 New Seed Policy 1988
7 New Industrial Policy 1991
8 PPV &FR Act, 2001
9 Seed Policy, 2002
10 Revision of NPSD, 2011
11 Sub Mission (NMEAT) on Seed, 2012
12 Seeds (Control) Amendment Order, 2014 (enhanced license fee)
13 Seed (Amendment) Rules, 2015 (all forms revised)
The public organisations include National Seed Corporation (NSC), State Seed Corporations
(SSCs), Cooperative Institutes and State Departments of Agriculture etc. The private sector
encompasses around 500 seed agencies, which include national and multi-national companies
and other seed producing / selling agencies.
Doubling Farmers’ Income – Volume XIII
Structural Reforms and Governance Framework
43
Seed Production System
The Indian seed programme mainly recognizes three (3) generations of seed, namely:
• Breeder’s Seed
• Foundation Seed
• Certified Seed
The system also provides for quality assurance in seed multiplication chain to maintain the
programme of the variety, as it flows from breeder to the farmers. These three (3), are explained
below:
Breeder Seed
Breeder seed is the progeny of nucleus seed of a variety, and is produced by the originating
breeder or by a sponsored breeder. There has been a steady increase in the production of breeder
seed over the years. Breeder seed production is the mandate of the Indian Council of
Agricultural Research (ICAR) and is being undertaken with the help of;
i) ICAR Research Institutions, National Research Centers and All India Coordinated
Research Project (AICRPs) of different crops.
ii) State Agricultural Universities (SAUs)
iii) Sponsored breeders recognized by Seed Corporations.
iv) Non-Governmental Organisations, Krishi Vigyan Kendras (KVKs) etc.
Procedure for allocation of Breeder Seed: The indents from various seed producing agencies
are collected by the State Departments of Agriculture and submitted to the Department of
Agriculture and Cooperation (DAC&FW), Government of India. The DAC&FW in turn
compiles crop-wise information and sends to the Project Coordinator/Project Director of the
respective crops in ICAR for final allocation of production responsibility to different
SAUs/ICAR institutions. The indents are compiled and forwarded to ICAR at least 18 months
in advance, to enable timely and necessary arrangements. For proper evaluation of the breeder
seed production programme, monitoring teams have been constituted and reporting proforma
devised. The monitoring team consists of the breeder of the variety, the concerned Project
Director or his nominee and representative of NSC. The production of breeder seed is annually
reviewed by ICAR-DAC&FW in a specially convened meeting.
The actual production of breeder seed by different Centres is intimated to DAC&FW by ICAR,
on receipt of which, the available breeder seed is allocated to all the indenters in an equitable
manner. In the case of varieties which are relevant only to a particular State, the production
responsibility assigned to the SAUs/ICAR institutions located in the State.
Foundation Seed
Foundation seed is the progeny of breeder seed. The responsibility for production of
Doubling Farmers’ Income – Volume XIII
Structural Reforms and Governance Framework
44
Foundation seed is entrusted to the NSC, State Seed Corporations, State Departments of
Agriculture as also private seed producers, possessing the necessary infrastructure facilities.
Foundation seed is required to meet the standards of seed certification prescribed in the Indian
Minimum Seeds Certification Standards, 2013, both at the field and laboratory testing stages.
Certified Seed
Certified seed is the progeny of Foundation seed, and must meet the standards of seed
certification prescribed in the Indian Minimum Seeds Certification Standards, 2013. In case of
self-pollinated crops, certified seeds can also be produced from certified seeds provided it does
not go beyond three generations from Foundation seed stage-I.
Procedure for production and distribution of certified/quality seeds: The production and
distribution of quality/certified seeds is primarily the responsibility of the state governments.
Certified seed production is organized through State Seed Corporations, Departmental
Agricultural Farms and Cooperatives, etc. The distribution of seeds is undertaken through a
number of channels i.e. departmental outlets at block and village level, cooperatives, outlets of
seed corporations, private dealers, etc. The state government effort is supplemented by NSC
which produces varieties of national importance. NSC markets its seeds through production on
its own marketing network and including its dealer network.
The production of certified seed by NSC is organised through its own farm or through contract
growing arrangements with progressive farmers. The private sector also play an important role
in the supply of quality seeds of vegetables and crops like hybrid maize, sorghum, bajra, cotton,
castor, sunflower, paddy etc.
The requirement of certified/quality seeds is assessed by state governments on the basis of the
area sown under different crop varieties, area covered by hybrid and self-pollinated varieties
as well as the seed replacement rate (SRR) achieved. The Ministry of Agriculture & Farmers’
Welfare periodically assesses the requirement and availability of seeds through a detailed
interaction with state governments and seed producing agencies at the bi-annual Zonal Seed
Review Meetings and the National Kharif and Rabi Conferences. The DAC&FW facilitates
tie-up arrangements with seed producing agencies to ensure that the seeds requirement is
suitably met extent possible. With the collective efforts of public and private sectors the
availability of quality seeds in the country has increased from 14 lakh quintals in 1962–
63 to over 419 lakh quintals in 2017-18.
It is seen from the above, that only a close co-ordination among different agencies responsible
for production of different generations of seeds can ensure the availability of right quantities
of the needed crop seeds and varieties. In a way, the breeder seed which is the originating point
determines the basis of the final quality of seed made available to the farmers. In order to
produce the required quantities of breeder seeds in consonance with the production plan, it is
very critical that indents are compiled & shared with ICAR, at least 18 to 24 months in advance
of the sowing season. While DAC&FW takes the responsibility of compiling the indents from
Doubling Farmers’ Income – Volume XIII
Structural Reforms and Governance Framework
45
different state governments, it is the latter, who should be able to assess their requirements two
(2) years ahead of the production season, and share it with DAC&FW.
The implication is, that the broad cropping plan should be prepared by the states in time, which
unfortunately is a weak link as of now. Hence, the state governments need to be made more
sensitive to the importance of assessing and estimating their breeder seed requirement.
Seed Certification System
Seed certification is a process designed to maintain and make available to the farmers supply
of high quality seeds and propagating materials of notified varieties of crops ensuring their
traceability, the physical identity and genetic purity. Under this process, a state seed certifying
agency gives official recognition to seeds produced of a variety under a limited generation
system. Seed certification is a legally sanctioned system for quality control of seed
multiplication and production. There are 25 State Seed Certification Agencies in India
established under section 8 of Seeds Act 1966.
Seed Certification is carried out in six broad phases listed as under:
i) Verification of seed source, class and other requirements of the seed used for raising
the seed crop.
ii) Receipt and scrutiny of application.
iii) Inspection of the seed crop in the field to verify its conformity to the prescribed field
standards.
iv) Supervision at post-harvest stages including processing and packing.
v) Drawing of samples and arranging for analysis to verify conformity to the seed
standards.
vi) Grant of certificate, issue of certification tags, labelling, sealing, etc.
The production of certified seeds is the final link in the prolonged chain of seed production
system, and is disbursed across the country and is undertaken in the open fields. It therefore
requires rigorous supervision and monitoring so as to ensure that the procedures laid down are
strictly adhered to. There is vast scope for deploying technologies like sensors, drones, etc. for
diligence of production and adherence to the standards. As of now, there is left much desired
in the rigour with which certified seed production is monitored.
Considering that seed production can happen both in public and private sectors, it would be
useful to tap the vast scope that exists in creating enterprise based models for seed production.
This can generate large number of self-employment opportunities for the youth - farmers who
can be gainfully engaged in both seed production and distribution system. In Volume-VII of
this Report, the potential of using seed production to create jobs has been discussed.
Doubling Farmers’ Income – Volume XIII
Structural Reforms and Governance Framework
46
Seed Export / Import
The export and import of seeds and planting material is governed by Foreign Trade Policy
2015-2020 announced by Director General Foreign Trade (DGFT), and is discussed below:
Export of seeds and planting materials has been liberalised for all crops with the following
exceptions:
i) Breeder or Foundation seeds or seeds of wild plants
ii) Seeds or planting material of onion, berseem, cashew, nux vomica, rubber, pepper
cuttings, sandalwood, saffron, neem, forestry species, red sanders, russa grass, tufts
and seeds of tufts
The export of these seeds (i & ii above) is restricted and is only allowed on case-to-case basis
under license issued by DGFT which relies on the recommendation of DAC&FW.
The provisions regarding import of seeds and planting material are as under:
(a) Import of seeds/tubers/bulbs/cuttings/saplings of vegetables, flowers and fruits is
allowed without a license in accordance with import permit granted under Plant
Quarantine (Order), 2003 and amendments made therein.
(b) Import of seeds, planting materials and living plants for research purpose by ICAR,
etc. is allowed without a license in accordance with conditions specified by the
Ministry of Agriculture & Farmers’ Welfare.
(c) Import of seeds/tubers of potato, garlic, fennel, coriander, cumin, etc. is allowed in
accordance with import permit granted under PQ Order, 2003.
(d) Import of seeds of wheat, rye, barley, oat, maize, rice, millet, jowar, bajra, ragi, other
cereals, soybean, groundnut, linseed, palmnut, cotton, castor, sesamum, mustard,
safflower, clover, jojoba, etc. is allowed subject to the New Policy on Seed
Development, 1988 and in accordance with import permit granted under PQ Order,
2003.
The EXIM Policy reiterates that all imports of seeds and planting material would be regulated
under the Plant Quarantine Order 2003. Import licenses would be granted by DGFT only on
the basis of recommendations of DAC&FW. A small quantity of the seeds sought to be
imported is given to ICAR, or farms accredited by ICAR, for trial and evaluation for one crop
season. On receipt of applications for commercial import, DAC&FW considers the trial
/evaluation report on the performance of the seed, and its resistance to seed/soil borne diseases.
DAC&FW is required to either reject or recommend the application to DGFT for grant of
import license within 30 days of receipt. Further, all importers have to make available a small
specified quantity of the imported seeds to the ICAR at cost price for testing/accession to the
gene bank of National Bureau of Plant Genetic Resources (NBPGR). The import of seeds has
Doubling Farmers’ Income – Volume XIII
Structural Reforms and Governance Framework
47
to be cleared/rejected by Plant Protection Adviser (PPA) after quarantine checks within three
(3) weeks. The rejected consignment has to be destroyed. During quarantine, the imported
consignment is kept in a bonded warehouse at the cost of the importer. While importing seeds
and planting material, it has to be ensured that there is absolutely no compromise on plant
quarantine procedures. Every effort has to be made to prevent the entry into India of exotic
pests, diseases and weeds that are detrimental to the interests of the farmers.
An EXIM Committee has been constituted in the Seeds Division of DACFW to deal with
application for exports/imports of seeds and planting materials in accordance with the New
Policy on Seed Development and EXIM Regulations. The Committee meets every month and
examines the applications and furnishes recommendations to PPA/DGFT with respect to
license / permit for import/export of seeds and planting material. DAC&FW has recently
developed an online system for receiving application for export/import of seeds, and also
communicating its recommendations to the EXIM Committee. This has reduced the drudgery
associated with the need to submit 20 copies of application in the prescribed format.
Recommendations for improving the seed sector
There exists lot of scope in effecting improvements to the existing seed production system in
particular, and seed sector in general. Some following suggestions are made in this context:
i) Need for higher Seed and Varietal Replacement Rate
For achieving the desired levels of Seed Replacement Rate (SRR), adequate seed of good
variety has to be produced. Each state needs to prepare a State Seed Plan to meet the region –
specific requirements. The list of recommended varieties must be revisited and finalized in
consultation with the scientists of the State Agriculture University, ICAR Institutes in that
region, Crop Coordinators, State Agriculture Department officials and the seed producing
agencies. Seed production programme should be organized in each State under a
comprehensive and integrated State Seed Plan appropriate to different regions. The states
should ensure production, multiplication and replacement of seed to increase VRR and SRR
progressively, particularly in respect of regionally important crops/varieties. Varietal
Replacement Rate (VRR) is as important as SRR.
ii) Replacement of older varieties with newer varieties
A review of existing list of released and notified varieties reveals that many old varieties (more
than 15 years) still find place in the recommended package of practices. Continued use of old
varieties is non-productive, and should be replaced by new ones, and must be brought into seed
chain system on priority. SRR does not ensure high productivity if the variety is old and has
developed vulnerabilities to external factors. A rigorous exercise to weed out all old varieties
should assume priority.
iii) Promoting hybrid technology
Promotion of hybrids/ HYVs of major field crops should receive a high priority, so as to bridge
the productivity gap and increase production. In this context, both public and private sectors
Doubling Farmers’ Income – Volume XIII
Structural Reforms and Governance Framework
48
have to play a major role, as seen in the case of maize. For accelerating hybrid seed production,
the present system of receiving indents of notified hybrids by the public/private sector needs
revision by including larger number of indents for the parental lines of the hybrids.
iv) Public-Private Partnership (PPP) Models
Partnerships between the public research institutions and private sectors are desired in R&D,
as also production and distribution of seeds to the farmers. A collaborative technology park for
carrying out research for development of new varieties may be established by adopting PPP
models.
v) Use of Intellectual Property Rights (IPRs)
The facility of IPR for new and innovative technologies can incentivise investments in R&D
in both public and private sectors. Public sector research system should also protect its varieties
through PPV & FR Authority and generate the revenues which can be ploughed back into the
system as R and D investments.
vi) Stronger enforcement
The Seed Law Enforcement wing of state governments needs to be strengthened. The Seed
Inspectors have to be well trained for effective enforcement of various provisions of Seeds Act,
1966, Seeds (Control) Order 1983, Environment Protection Act, 1986 and Consumer
Protection Act, 1983. They will need continuous upgradation of knowledge to be effective in
checking spurious seeds. In addition, there is need to deploy suitable technology like bar
coding etc. Adequate number of seed testing laboratories are also needed.
vii) Strengthening of Seed testing facilities
Most State seed testing laboratories suffer from inadequate manpower and poor infrastructure
facilities. They are required to be strengthened both in terms of manpower as well as technical
capabilities. Their performance has to be monitored periodically with reference to the
preciseness and reproducibility of the test results.
viii) Uniform procedure in the country for seed licensing
Under the Seeds (Control) Order 1983, every seed dealer has to obtain the license from the
State Licensing Authority. Under Clause 5 of the Seed (Control) Order, a licensing authority
after making such enquiry as it thinks fit can grant a license to an applicant. This provision is
interpreted differently by the state governments, seeking varied nature of
information/documents which is not a business-friendly environment for those companies
doing business is more than one state. It would be useful if central government develops a
Model Guideline and Procedure for the states to adopt the same.
ix) Enhancing export of seed
India has the potential to become a leading player in seed business if it can tap the demand in
developing world. Many of these countries have limited availability of hybrid seeds and the
Indian crop germplasm has light potential of adaptability in these countries. This is a huge
Doubling Farmers’ Income – Volume XIII
Structural Reforms and Governance Framework
49
business opportunity available to the Indian seed players. The present share of India in global
seed market is less than 2 percent, which can be easily scaled up by harvesting the market in
African, SAARC and South-East Asian countries. India can achieve the target of 10 percent
of the global trade by 2020, as envisaged in the National Seeds Policy 2002. Some of the Indian
/ MNC seed companies are already doing business in some of these countries, which can be
further expanded. For this to happen, the seed industry will need to be facilitated by simplifying
the procedures for obtaining export permits etc. Further, the EXIM policy has to be steady over
reasonable period, for private traders to establish long term business relationships.
x) Seed Quality Assurance
Seed quality assurance requires considerable investment in terms of proper infrastructure,
equipment and competent human resource. Seed certification agencies, have to be adequately
equipped and made more efficient for certification of quality seeds. The Seed Testing
Laboratories should be strengthened and accredited by the International Seed Testing
Association (ISTA). Also, adequate infrastructure for seed processing must be created by state
seed corporations and private seed agencies.
i) Revamping the business strategy of Public Sector Seed Corporations
Re-structuring and revamping the public sector seed producing undertakings is also required
for product diversification/ upgradation and for improving their governance, core competence
and competitiveness. State Seed Corporations should be reformed/re-organized/restructured to
make them more vibrant.
ii) Seed Bill, 2004
The Seed Bill, 2004 is currently awaiting Parliament approval. The provisions of variety
registration in the Seed Bill will be useful in promoting variety-linked quality seeds.
Liberalising fertilizer sector
Background
As per Fertilizer Control Order, fertilizer is defined as “any substance used or intended to be
used as a fertilizer of the soil and / or crop specified under chemical fertilizers, bio-fertilizer
and organic fertilizers categories”.
The Indian fertilizer sector continues to be one of the most regulated segments of the country’s
economy. Almost every aspect of fertilizer business in India is controlled by policies, be it
investment, feedstock, distribution or sale price.
Fertilizer Control Order
Fertilizer Control Order (FCO) derives its power from section 3 of the Essential Commodities
Act, 1935. It initially came into force in 1957 to regulate sale, price and quality of fertilizers.
Recognising several changes in fertilizer technology, production and distribution system, and
the need to make the provisions more stringent with respect to quality control, by the ‘FCO
Doubling Farmers’ Income – Volume XIII
Structural Reforms and Governance Framework
50
Review Committee’ set up by the Central Government reviewed FCO, 1957 and the now in
force FCO, 1985 issued on 25.09.1985 came into force with immediate effect.
FCO - key function areas
Registration of all fertilizer manufacturers, importers and dealers.
Laying down specification of all fertilizers chemical (general- NPK, water soluble,
liquid & customized), bio-fertilizers and organic fertilizers.
Packing and labelling on fertilizer bags.
Guidelines for appointment of enforcement agencies, sampling and analysis techniques
of fertilizer samples, setting up of quality control laboratories.
Prohibiting the manufacture and sale of non-standard/spurious/adulterated fertilizers.
Penal provision includes imprisonment from 3 months to 7 years; offence declared as
non-bailable besides entailing administrative action of suspension / cancellation of
dealers / manufacturers’ certificate.
Role of Governments in fertilizer sector
i. Government of India
At GoI level, two departments- Department of Agriculture, Cooperation & Farmers Welfare
(DAC&FW) and Department of Fertilisers (DoF) are involved in setting standards for quality,
regulation of sale and distribution of fertilisers. Central Fertilizer Quality Control and Training
Institute (CFQC&TI), an attached office of DAC&FW lays down testing protocols for the
chemical fertilizers and quality control of the same. Similarly, National Centre for Organic
Farming (NCOF), another subordinate office of DAC&FW caters to the revision of standards
and testing protocols for bio and organic fertilizers and their quality control.
The mandate of the Department of Fertilizers is to ensure adequate and timely availability of
fertilizers to the farmers at affordable prices through planned production and imports, and
distribution of fertilizers in the country. It also plans for self-sufficiency in urea production.
ii. State Governments
The states are suitably empowered to draw samples of the fertilizers anywhere in the country
and take appropriate action against the sellers of non-standard fertilizers. The penal provision
includes prosecution of offenders and sentence, if convicted, upto seven (7) years of
imprisonment under the ECA, 1955 besides cancellation of authorization certificate and other
administrative action. The DoF makes deductions along with penal interest on the quantity of
the fertilizers for that have been reported as non-standard by the state governments.
Way forward – some recommendations
The fertilizer sector policies were framed in 1970s with the twin objective of encouraging
fertilizer consumption; and fostering growth & development of the domestic industry. Both
these objectives have been well served as seen from higher fertilizer consumption and food
Doubling Farmers’ Income – Volume XIII
Structural Reforms and Governance Framework
51
production; and large fertilizer production capacity. However, many deleterious impacts are
also seen, wherever the use has been indiscreet & imbalanced. Consequently, the demand today
is for soil health management, judicious use of fertilizers, sustainable farming, etc. The cost
and quality are also a concern. Hence, the need for a revisit of the fertilizer sector policies and
it is in this context that some of these are discussed below:
i. Promotion of customized fertilizers: The customized fertilizers (CFs) are multi-
nutrient carriers designed to contain macro, secondary and/or micro nutrients, from inorganic
and/or organic sources. The guidelines for production of CFs were formulated in March 2008
under clause 20-B of FCO, 1985. However, the progress in production and consumption of CFs
has been slow despite their agronomic benefits in improving yield and farm profits. Since 2008,
only 3 companies, namely, TCL, NFCL and NFL have taken up production of CFs, and their
annual/cumulative production about 74,000 metric tonnes (MTs) during 2015-16. Under the
present scheme of soil health card (SHC), the soil fertility status of all the farm holdings is
tested and corrective measures conveyed to the farmers. Although different types of fertilizers
like straight, complex, mixture, fortified etc. exist as on date, the future would be one of
customized fertilizers which are crop & area specific in nature, and hence more efficient. As
on date, customized fertilizers for 6 crops in 128 districts have been developed based on SHCs.
The need is to promote more of these to gradually replace the mixtures in future.
ii. Simplification of renewal / approval of new grade of CFs: The procedure for
renewal/approval of CFs can be simplified and time period reduced by adopting single
seasonal, multi-locational and multi-crop trials in place of 2 (two) seasonal trials as in vogue
today. Another option is to adopt CFs confining to international standards of fertilizers or by
mutual agreement. The approval of grade may be made at least 6 months prior to the next
season’s date of sowing. The proposal of new grades of fertilizer may be taken into
consideration with the Expert Technical Committee and Central Fertilizer Committee
simultaneously. This will save time. The cost of the product be fixed with minimum margin of
profit to make it cost effective to farmers. The quality of the product may be specified with
prescribed standards containing total nutrients as well as forms of nutrients with minimum
guaranteed of nutrients uniformly.
iii. Procurement of subsidised fertilizers for making customized fertilizers: The
production and sale of customized fertilizers may come under stress, as there is no provision
for procuring subsidized fertilizers for use as raw material in manufacturing customized
fertilizers. The facility of procurement of subsidized fertilizers for production of CFs may be
considered.
iv. Specifications for growth promoters, seaweed based products etc.: There is a
proliferation of growth promoting / growth regulating products - PGRs/PGPs or many other
such products which are yet to be clearly recognised either as fertilizers or insecticides. These
products need to be regulated and may appropriately be included under FCO or Central
Insecticides Act, as toxicity/bio-safety tests are a pre-requisite before allowing their use in
agriculture. It is also a fact that CIBRC (Central Insecticide Board for Registration and
Doubling Farmers’ Income – Volume XIII
Structural Reforms and Governance Framework
52
Certification) has already registered some of the PGRs under the Insecticide Act. A committee
under the chairmanship of DG, ICAR has been constituted to look into the issue and its
recommendations can guide the final process.
v. Strengthening of quality control labs at central and state level: As on date there
are 84 quality testing labs for chemical fertilizers and 24 labs for bio and organic fertilizers at
state level. Similarly at Government of India level, CFQCTI (Central Fertilizer Quality Control
and Testing Infrastructure) with its 3 branches at Kalyani (Mumbai), Chennai and NCOF,
Ghaziabad (with its 8 regional centres at Bengaluru, Bhubaneshwar, Panchkula, Ghaziabad,
Imphal, Jabalpur, Nagpur and Patna) cater to the quality testing requirements. There is a need
to strengthen these labs and make at least the referral labs NABL accredited for ensuring high
standards.
vi. Reducing the time taken for testing of samples: The stipulated time period for
testing of the sample and communicating the result to the dealer/manufacturer/importer is 57
days under the FCO. This can be reduced to 25 days by amending the concerned provisions of
FCO. This is understood to be under active consideration.
vii. Imbalanced use of primary nutrients: Selective decontrol of prices of phosphatic
(P) and potassic (K) fertilizers in 1992 and then selective implementation of Nutrient Based
Subsidy (NBS) scheme for these fertilizers in 2010 has resulted in huge distortion in prices of
different products at the farmers’ level. For example, price ratio of DAP:Urea which was about
2:1 in 2009-10 now stands at about 4:1. Amongst other reasons, this is one cause of imbalanced
use of primary nutrients (N, P & K). There is a case for revising the fertilizer pricing policy to
provide a level playing field to all the fertilizers. Farmers are more likely to be influenced
positively by the SHC recommendations. For example, Indian soils which were known to be
rich in potassium (K) are now suffering from deficiency due to its mining over the last 4
decades without replenishing it.
viii. Micro-nutrients need more support: The present pricing and subsidy polices need
change to support micro-nutrients. For example, the additional MRP allowed for zincated urea
containing 2 per cent zinc is only Rs.542 per metric tonne (MT) of urea which does not
adequately cover even the cost of raw material. Similarly, complex fertilizers fortified with 0.5
per cent zinc content are given additional subsidy support of Rs. 500 per MT of product. There
is a similar treatment in case of fertilizers fortified with boron (Bo). Such an inadequate and
non-remunerative compensation for fortifying fertilizer products with micro-nutrients has
hindered production of fortified urea and fortified complex fertilizers. In addition, GST on
micro-nutrients is 12 per cent compared to 5 per cent on other fertilizers. The regulatory
environment should become more conducive to use of micro-nutrients.
ix. Development of innovative products: In recent times, Ministry of Agriculture &
Farmers’ Welfare has streamlined the procedure for approval of new fertilizer products. It has
helped to include expeditiously new products under FCO. However, fertilizer pricing and
subsidy policies need to be such as to promote development of markets and use of new and
Doubling Farmers’ Income – Volume XIII
Structural Reforms and Governance Framework
53
more efficient products. For example, it is well known that use efficiency of nitrogen is only
in the range of 30-50 per cent. There are number of additives and coating agents available
which can enhance the use efficiency of urea. An additive of urea and sulphur can address the
sulphur deficiency. However, under the present controlled regime, additional cost of these
value added products is not allowed to be recovered except for coating with neem oil. Hence,
a policy and pricing revision is in order.
x. Neem Coated Urea (NCU): Coating of entire quantity of urea production with neem
oil was made mandatory w.e.f. 25th May, 2015. Later on imported urea was also notified to be
compulsorily neem coated. Earlier, only a part of urea was permitted to be coated with neem
oil. An additional amount of Rs. 268 per metric tonne has been permitted to be charged from
farmers for neem coated urea. NCU has been a highly progressive initiative of the government.
Apart from checking unauthorised diversion of urea for non-agricultural purposes, its use in
agriculture has resulted in saving due to use efficiency and increased productivity. It is,
therefore considered good to continue providing proportionate cost recovery facilitation, on
neem coated urea.
Way Forward
To sum up, there is need for a re-think on fertilizer related policy and pricing policy, with a
singular aim of making available most efficient fertilizer products. This in supplement with
soil test based nutrient recommendation holds great opportunity for sustaining the soil health,
reducing cost of cultivation and increasing yield levels. Simultaneously, both quality and cost
of the products need to be taken care of.
Promoting development of innovative products by providing them a level playing field.
Farmers are not responsive to new products because of substantive price difference
between subsidised and non-subsidised fertilizer products.
The fertilizer subsidy policy should be such as to encourage balanced use of primary,
secondary and micro-nutrients.
Secondary and micro-nutrients need special support, may be by placing of them on NBS
platform on the lines of P and K.
In the interest of balanced use of fertilizers, and sustained soil health management, the
transition should happen from general fertilizers to specific fertilizers. An appropriate
policy framework and education of farmers, are needed.
Pesticide Regulation in India – Constraints and Suggestions
Pest management – current provisions and scope
As a result of food poisoning arising from contamination of foodgrain with insecticides in late
1950s & early 60s, there were a number of unfortunate many deaths in the States of Kerala and
Madras (now Tamil Nadu). The Government of India appointed Kerala and Tamil Nadu Food-
poisoning Cases Enquiry Commission to enquire into and report the circumstance under which
the foodstuffs came to be contaminated and the measures needed to be taken against such
Doubling Farmers’ Income – Volume XIII
Structural Reforms and Governance Framework
54
recurrence. The Commission’s recommendations were accepted by the Government, following
which it appointed an Inter-Ministerial Committee to suggest measures to give effect to the
recommendations. The Inter-Ministerial Committee suggested certain short-term and long-
term measures. The long-term measures envisaged the enactment of a legislation to regulate
manufacture, sale, storage, transport, distribution and use of insecticide including herbicides,
plant growth regulators (PGRs) and fungicides in the country. The Insecticides Act, 1968 and
the Insecticides Rules, 1971 thus came to be adopted.
A brief about the Insecticides Act, 1968
Herbicides, insecticides & fungicides broadly known as ‘pesticides’ are one of the essential
inputs in sustaining agricultural production and these are regulated under the provisions of the
Act and Rules. The Act comprises 38 sections with 46 facilitating rules. Broadly, the Act
provides for,
i) Mandatory licensing in order to ensure infrastructural facilities and safety in
manufacture and handling of pesticides.
ii) Monitoring of pesticide quality to ensure their effectiveness, when used in the manner
prescribed.
iii) Measures to check import, manufacture, distribution, sale, etc. in contravention of law.
iv) Restricting or banning of pesticides to ensure public safety.
v) Penal provisions to discourage violation of provisions of the Act or the Rules by the
companies or individuals.
Regulations and Controls
A pesticide is subject to regulation at various stages under the provisions of the Insecticide Act
and these are as follows:
i) Registration process
A substance exhibiting insecticidal, herbicidal, fungicidal & related properties, is necessary to
be included in the Schedule to the Act to qualify as an insecticide (broadly, pesticide). So far,
870 such molecules have been included in the Schedule to the Act. Such inclusion is done by
the central government on the recommendation of the Central Insecticide Board (CIB), which
too is constituted by the government through a Gazette notification under section 4 of the Act.
The Board advises the central and state governments’ technical issues arising from the
administration of this Act. The array of issues include risks to human beings or animals and
safety measures necessary to prevent such risks; and manufacture, sale, storage, transport and
distribution of the insecticides. The primary concern in regulation is safety of human and
animal population.
Any person desiring to import or manufacture any herbicides/ insecticides/ fungicides/ PGR is
required to make an application to the Registration Committee (RC), constituted by the central
government under section 5 of the Act and obtain a registration under section 9. The main
function of the Registration Committee is to scrutinize the formulae of pesticides and verify
Doubling Farmers’ Income – Volume XIII
Structural Reforms and Governance Framework
55
claims regarding their efficacy and safety to human beings, animals and environment. The RC
has the powers to adopt its own procedure in conduct of its business. The RC frames guidelines
for different categories of registration, so as to avoid arbitrariness in scrutinising applications
and achieving satisfaction with regard to efficacy and safety of pesticides before granting
registration, i.e. before permitting their use.
As per recommendation of the Joint Parliamentary Committee (JPC) on pesticide residues in
food and safety standards for the soft drinks, fruit juice and beverages, no registration for use
of pesticides in agriculture is granted without fixing of Maximum Residue Limits (MRLs)
except in case of certain exemptions. Registration Committee grants three 93) following types
of registrations under section 9 of the Act:
(i) Provisional registration on the basis of minimum data for two years for first time
introduction of pesticides under section 9 (3B) to facilitate complete scientific data
generation;
(ii) a regular of original” registration under section 9 (3) based complete scientific data
as per the guidelines of the Registration Committee; and
(iii) a repeat or “me too” registration for the same pesticide on same conditions under
section 9 (4) as already granted under section 9 (3). Registration for import or
manufacture for the purpose of export only is also granted under section 9 (3) on
fast track mode to facilitate exports, wherein no scientific data is sought.
Registration of pesticides is on such conditions as may be laid down by the Registration
Committee and can be modified from time-to-time. A pesticide can be refused registration, if
the claims on its efficacy or safety are not supported by scientific data, and a registration, if
already issued can also be cancelled in the interest of public safety. No person can import or
manufacture a pesticide in contravention of the provisions of the Act or the Rules.
Registrations for bio-pesticides are also granted under section 9 (3B) and 9 (3) for
commercialization to encourage their use and promote environment-friendly integrated pest
management (IPM) approach to plant protection. As on date, 279 technical, along with their
600 formulations have been registered for use in the country, of which 18 are bio-pesticides
with formulations. There is no repeat or “me too” registration for bio-pesticides as
chemical equivalence cannot be established, for they are culture-based products.
ii) Manufacturing license
Once the registration has been obtained, it is also necessary to obtain a license from the state
government (where the business is proposed to be conducted) to manufacture, stock, distribute
and sell the product. The RC has already formed guidelines for the minimum infrastructure
needed for manufacture of technical grade pesticides, their formulations & bio-pesticides.
However, for issuance of license for stocking, distribution, retails sale or commercial pest
control operations, registration is not a pre-requisite.
Doubling Farmers’ Income – Volume XIII
Structural Reforms and Governance Framework
56
iii) Quality control
The Act makes the central and state governments jointly responsible for monitoring the quality
of pesticides. Both can appoint Insecticide Inspectors to inspect manufacturing, stocking or
sale premises at any reasonable time to ensure compliance to the conditions of registration and
licensing, and also take copies of records besides sample of products manufactured, stocked,
distributed or sold by them and have them tested/ analysed as per the specifications approved
by the RC. Interfering with the duties of an Insecticide Inspector is a punishable offence under
the Act. The first analysis of a sample is carried out by an Insecticide Analyst, who can be
appointed by the central or state government, and in case of its non-conformation to the relevant
specification and challenge, there is a provision for appellate testing/ analysis at the Central
Insecticides Laboratory (CIL), whose results are conclusive evidence of the facts stated therein.
There are 68 SPTL (State Pesticide Testing Laboratories) across the states with an analysis
capacity of about 71,000 samples per annum. There are two laboratories at Chandigarh &
Kanpur under the control of central government to supplement the resources of the states.
Existing penal provisions
Any person, who contravenes any provision of the Act or the Rules is liable to administrative
action, viz. suspension or cancellation of license, etc. and punishment as per the penal
provisions laid down under section 29 of the Act. It envisages fine upto Rs.10,000 to
Rs.50,000/- in case of first offence, as well as imprisonment varying from six months to two
years in case of certain categories of offence, including publication of name and address of the
offender in the newspapers in case of frequent commitment of offences by the same person.
Current status & use of pesticides
A wide range of compounds including insecticides, fungicides, herbicides, rodenticides,
molluscicides, nematicides, plant growth regulators, bio-pesticides, botanicals and the like
have been termed as pesticides. Among these, organo-chlorine (OC) insecticides have been
used successfully in pest management. The introduction of other synthetic insecticides- organo-
phosphate (OP) insecticides in 1960s, carbamates in 1970s and pyrethroids in 1980s; and the
introduction of herbicides and fungicides during 1970s-1980s have aided in controlling the
pests in both foodgrain and horticultural sectors.
There has been a steady growth in the production of technical grade pesticides in India, from
5,000 metric tons (MTs) in 1958 to 102,240 MTs in 1998. The annual production capacity of
pesticides in the country is more than 1,50,000 MTs (Industry source) with more than 219
technical grade/ manufacturing Units, and over 4000 formulation Units.
The total number of pests infesting major crops has increased significantly since the 1940s. For
instance, the number of pests which are harmful to crops such as rice have increased from 10
to 17; and from 2 to 19 in case of wheat. This underscores the importance of a comprehensive
approach to pest management in the interest of the country’s agri-production. The most recent
example is the large scale whitefly infestation of Bt cotton crop in North India in the year 2015-
Doubling Farmers’ Income – Volume XIII
Structural Reforms and Governance Framework
57
16, which resulted in a decline of cotton area in Punjab & Haryana by 27 per cent in 2016-17.
Constraints in the implementation the Act
The provisions of the Insecticide Act are implemented jointly by central as well as state
governments and their role and responsibilities are defined under the Act. The experience with
this Act show the need for amendments for greater clarity, resolution of constraints, ease of
doing agri-business and effective enforcement to protect the safety concerns relating to both
human and animal world. Some issues in this context are discussed below:
i. Registration of new molecule takes about 3-4 years. In fact, the average time
required in practice is about 5-6 years. Time needs to be brought down to 2.5 to
3 years, so as to promote innovations and alternatives to the farmers.
ii. Lack of R & D initiative on new molecule by Indian Pesticide Industry.
iii. Lack of data protection – causing delay in farmers getting access to new and
green chemistry pesticides in comparison to developed world.
iv. Most of the manufacturing units lack equipments required for Good
Manufacturing Practices (GMP).
v. Limited quality control infrastructure - hardly one sample from one metric tonne
of pesticides.
vi. Need for improving enforcement to ensure safety standards & measures in the
interest of industry workers and environment.
vii. Lack of safe and appropriate storage conditions at stock/ sale points.
viii. Illegal import and sale of pesticides – enforcement needs up-gradation.
ix. Need for better education/ training of farmers about safe & judicious use of
pesticides.
x. Non-use of plant protection equipments (PPE), exposing the users to health &
life hazards.
xi. Use of non-label pesticides is creating problem of residues in export; besides
adversely affecting human health.
xii. Lack of adequate regulatory mechanism at the level of use.
xiii. Lack of proper use of application technology for herbicides.
xiv. Empty container management is emerging as a challenge. Its safe disposal and
incineration need a systems to be put in place, and farmers educated about it as
part of ‘Swachha Bharat’.
xv. Post- registration feedback mechanism is absent.
xvi. Inadequate mechanism for post-registration evaluation under field conditions &
re-registration.
xvii. There is a necessity of inserting a provision of compensating the farmer in the
event of crop loss/animal loss/death of self on account of usage of a pesticide,
Doubling Farmers’ Income – Volume XIII
Structural Reforms and Governance Framework
58
and it is proved that it was no fault of the user. Simultaneously, a more stringent
penal provision is necessary.
xviii. Life time registration validity.
xix. Lack of stringent panel provision.
xx. Lack of provisions for compensation of farmers in the event of crop loss/ death.
Proposed Pesticide Management Bill (PMB)
A new Bill now under examination would probably address the constraints and suggestions for
improvement listed in the preceding section. While the new approach is Integrated Pest
Management (IPM), the usage of pesticides will continue as a component of the pest
management bouquet. It is, therefore, important that pesticides, comprising a range of products,
are available to the farmers. Their quality, safety and effectiveness deserve focus. The proposed
Bill should facilitate:
i. Incentivise Research and Development (R&D) activities by the pesticide industry
within the country.
ii. Encourage competition all products and reduce dependence on imported formulations.
iii. Promote ‘Make in India’ and reduction of dependency on imported formulations. This
will reduce input cost substantively, besides creating local jobs.
iv. Aim at increasing export of Indian agri-inputs. Export by Indian industries (both
domestic and MNCs) will help reduce the cost of local products (on account of
economy of scale and adoption of best practices by the industry to become globally
competitive). This is beneficial to the farmers.
v. Facilitate access to farmers to new molecules from across the world.
vi. Enable a robust retail network, managed by qualified dealers, so that they are able to
provide extension service apart from just selling pesticides to the farmers.
vii. Provide for a strong enforcement through a pro-active partnership between centre and
state officials. The intervention needed is orientation & training of officials and
strengthening of laboratory infrastructure. Suitable penal provisions that will deliver
proportionate, effective and in time justice to the affected party will hold the key.
Agricultural Market Liberalisation
Reforms in wholesale agricultural markets
In 2017, Government of India formulated the Model Agricultural Produce and Livestock
Marketing, (Promotion and Facilitation) Act, 2017, known in short as APLM Act. This Act, as
in its name, is less about regulation and more to do with promotion and facilitation of marketing
for reaping higher efficiency.
Provisions are incorporated to attract new players and make the marketing system more
competitive by doing away with the monopolistic and oligopolistic tendencies in the present
Doubling Farmers’ Income – Volume XIII
Structural Reforms and Governance Framework
59
agricultural markets, set up under the provisions of the State APMC Acts.
The distinguishing features of the Model APLM Act, 2017 are:
(i) Abolition of fragmentation of market within the State/UT by removing the concept
of notified market area in so far as enforcement of regulation by Agricultural
Produce and Livestock Market Committee (APLMC) is concerned (State/UT level
single market).
(ii) Full democratisation of Market Committee and State/UT Marketing Board.
(iii) Dis-intermediation of food supply chain by integration of farmers with processors,
exporters, bulk retailers and consumers
(iv) Clear demarcation of the powers and functions between Director of Agricultural
Marketing and Managing Director of State/UT Agricultural Marketing Board with
the objective that the former will have to largely carry out regulatory functions, while
the latter will be mandated with developmental responsibilities under the Act.
(v) Creation of a conducive environment for setting up and operating private wholesale
market yards and farmer consumer market yards, so as to enhance competition
among different markets and market players for the farmer’s produce, to the
advantage of the latter.
(vi) Promotion of direct interface between farmers and processors/ exporters/ bulk-
buyers/ end users so as to reduce the price spread bringing advantage to both the
producers & the consumers.
(vii) Enabling declaration of warehouses/ silos/ cold storages and other structures/ space
as market sub-yard to provide better market access/ linkages to the farmers.
(viii) Giving freedom to the agriculturalists to sell their produce to the buyers and at the
place & time of their choice, to whom so ever and wherever they get better prices.
(ix) Promotion of e-trading to enhance transparency in trade operations and integration
of markets across geographies.
(x) Provisions for single point levy of market fee across the State and unified single
trading licence to realise cost-effective transactions.
(xi) Promotion of national market for agriculture produce through provisioning of inter-
state trading licence, grading and standardization and quality certification.
(xii) Rationalization of market fee & commission charges.
(xiii) Provision for Special Commodity Market yard(s) and Market yard(s) of National
Importance (MNI).
(xiv) Providing a level playing field to the licensees of private market yard, private market
sub-yard, electronic trading and direct marketing vis-à-vis the APLMCs and
Doubling Farmers’ Income – Volume XIII
Structural Reforms and Governance Framework
60
removing the conflict of interest that the latter are likely to practise, if both
development and regulatory functions are centred in the same authority.
The provision for declaring warehouses / silos / cold storages or other such structure or place
as market sub yards is made to provide better market access / linkages to farmers. This
development will help integrate the warehouses / silos / cold storages etc., into the online e-
platform. In turn, this will help to facilitate operationalisation of warehouse receipt system and
capturing of information for a responsive market information system.
Under the new legislative Model Act, APMC will not be the regulator of private markets and
licensee of such markets can collect the user charges and retain with him, thus, making it an
economically viable proposition. A wider competition base, and the proposed caps on market
fees will bring efficiency in supply chain, build transparency in trade operations and an
equitable environment in marketing. The new model Act also has provision for promoting
online or spot (e-national agriculture market) market platforms and ensure that all these
measures are revenue neutral for States.
The Model APLM Act 2017 provides the states to adopt an approach that facilitates
liberalisation on the output side of agriculture. The various provisions made for private markets
is with intent of “ease of doing business”, as it provides for level playing field both for APMC
market and private market.
States are recommended to adopt or adapt the Model APLM Act, 2017, to initiate necessary
changes in agriculture marketing and to encourage a single national agriculture market.
New market architecture
To facilitate small & marginal farmers to integrate with organised marketing structure, primary
retail markets in close proximity of their farm gates are essential. There exists scope to upgrade
the existing 22,000 (approx) haats in the country into aggregation platforms and enable villages
to link directly with wholesale markets, domestic and international. This initiative can be
expected to answer the current challenges of transacting small lots of marketable surpluses, at
low cost and from a position of bargaining strength that comes from farmers-collectives into
FPOs. The upgraded haats should be kept outside the ambit of APMC and designed to continue
to serve local direct retail, with the added function of aggregation, assaying, packaging, and
wholesale dispatch to terminal consumption points. The activities and functions of such
aggregation cum marketing hubs with the associated logistics are described in Volumes III and
IV of this Report. These proposed markets should be placed under the Directorate of
Agriculture so that they are developed to bring strategic advantage to all sub-sectors of
agriculture (including horticulture, livestock and fisheries), and for market-led operations.
Liberalising stock limits
A structural limitation arises when stock limits disallow wholehearted inclusion of the private
sector in agricultural trade. Volume-IV of this Report recommends ways of involving the
Doubling Farmers’ Income – Volume XIII
Structural Reforms and Governance Framework
61
private sector in procurement and trade of agricultural produce, initially in case of notified
commodities. To facilitate such private sector participation, and to build on the opportunity to
develop international trade, conditional exemption in stock limits needs to be considered. This
could include conditional exemption for private sector agencies that procures notified
commodities at MSP rates directly from farmers, with associated autonomy on international
trade free of any variable export window limitations. It is expected that liberalisation of stock
limits, coupled with freedom to link with international markets, will provision for an economic
case to viability increase farm productivity and production.
A special Task Force may be constituted to evaluate business models with liberalised stock
limits, such that it will relieve market distress of farmers, while promoting various
opportunities to capture a larger share of the global demand.
Key Extracts
Large part of the agricultural production system is already driven by market forces,
and reforms are needed to ensure farmers have a greater choice of inputs, at right
quality and rational costs.
The Seed chain, from production to supply, including development of new varieties
can be liberalised. A series of recommendations are proposed in this chapter.
The fertilizer sector policies were framed at the time when the need was intensive
farming. These need a revisit in light of soil health management, sustainable farming
and the need to be judicious to lower input costs. A series of reforms are suggested.
The pesticide regulations need to be rationalised and a series of recommendations are
made, including the need for checks and balance of Inspectors.
The output market environment needs to be liberalised to invite private sector
participants. States need to modernise their agricultural market architecture and
legislate the Model APLM Act 2017.
Upgrade the existing 22,000 (approx) haats into aggregation platforms, keeping
outside the ambit of APMC, to link farm gate organically with wholesale terminal
markets, national and international. The upgraded haats should be designed to
continue to serve local direct retail, with the added function of aggregation, assaying,
packaging, and wholesale dispatch to terminal consumption points.
A special Task Force may be constituted to evaluate appropriate business models with
liberalised stock limits, such that it will relieve market distress of farmers, while
promoting other opportunities to capture a larger share of the global demand.

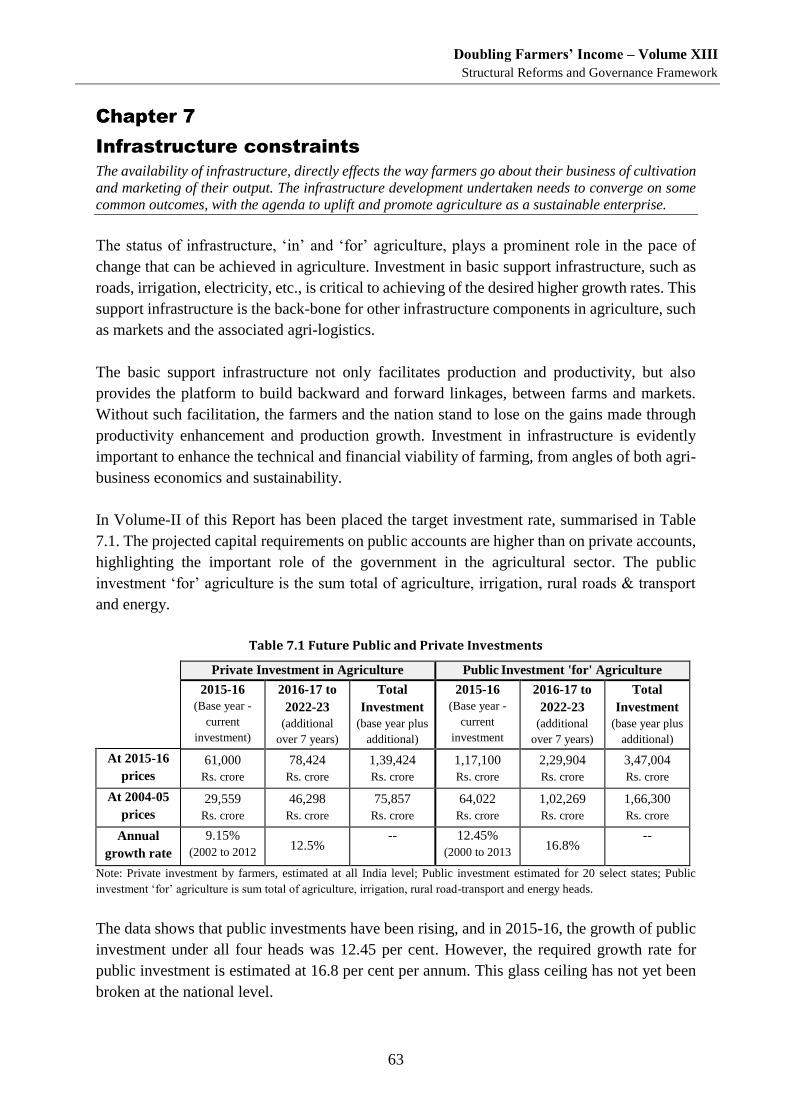
Doubling Farmers’ Income – Volume XIII
Structural Reforms and Governance Framework
63
Infrastructure constraints
The availability of infrastructure, directly effects the way farmers go about their business of cultivation
and marketing of their output. The infrastructure development undertaken needs to converge on some
common outcomes, with the agenda to uplift and promote agriculture as a sustainable enterprise.
The status of infrastructure, ‘in’ and ‘for’ agriculture, plays a prominent role in the pace of
change that can be achieved in agriculture. Investment in basic support infrastructure, such as
roads, irrigation, electricity, etc., is critical to achieving of the desired higher growth rates. This
support infrastructure is the back-bone for other infrastructure components in agriculture, such
as markets and the associated agri-logistics.
The basic support infrastructure not only facilitates production and productivity, but also
provides the platform to build backward and forward linkages, between farms and markets.
Without such facilitation, the farmers and the nation stand to lose on the gains made through
productivity enhancement and production growth. Investment in infrastructure is evidently
important to enhance the technical and financial viability of farming, from angles of both agri-
business economics and sustainability.
In Volume-II of this Report has been placed the target investment rate, summarised in Table
7.1. The projected capital requirements on public accounts are higher than on private accounts,
highlighting the important role of the government in the agricultural sector. The public
investment ‘for’ agriculture is the sum total of agriculture, irrigation, rural roads & transport
and energy.
Table 7.1 Future Public and Private Investments
Private Investment in Agriculture Public Investment 'for' Agriculture
2015-16
(Base year -
current
investment)
2016-17 to
2022-23
(additional
over 7 years)
Total
Investment
(base year plus
additional)
2015-16
(Base year -
current
investment
2016-17 to
2022-23
(additional
over 7 years)
Total
Investment
(base year plus
additional)
At 2015-16
prices
61,000
Rs. crore
78,424
Rs. crore
1,39,424
Rs. crore
1,17,100
Rs. crore
2,29,904
Rs. crore
3,47,004
Rs. crore
At 2004-05
prices
29,559
Rs. crore
46,298
Rs. crore
75,857
Rs. crore
64,022
Rs. crore
1,02,269
Rs. crore
1,66,300
Rs. crore
Annual
growth rate
9.15%
(2002 to 2012 12.5%
-- 12.45%
(2000 to 2013 16.8%
--
Note: Private investment by farmers, estimated at all India level; Public investment estimated for 20 select states; Public
investment ‘for’ agriculture is sum total of agriculture, irrigation, rural road-transport and energy heads.
The data shows that public investments have been rising, and in 2015-16, the growth of public
investment under all four heads was 12.45 per cent. However, the required growth rate for
public investment is estimated at 16.8 per cent per annum. This glass ceiling has not yet been
broken at the national level.
Doubling Farmers’ Income – Volume XIII
Structural Reforms and Governance Framework
64
There are examples like the state of Madhya Pradesh and Gujarat, which having made higher
investment in recent years in irrigation, were able to register high growth rates in production
and productivity. Likewise initiative needs to be taken in all the states across the country as
well. It is simultaneously, important to note that, investment in any one area is not sufficient
without proportionate investments in other related activities. For example, the resulting
increase in production from irrigation, needs associated investment in roads and transport, and
energy to enable the output to be suitably market linked. Therefore, a systems approach is
recommended to maximise the outcome for greater capital use efficiencies.
Absence of infrastructure is a basic constraint and needs to be addressed. It must also be
understood, that private corporate sector investment also follows public expenditure in rural
roads and energy. Data shows that the bulk of private sector investment in agriculture has
happened by farmers themselves. This investment is largely for their enterprise related
activities like land development, small irrigation etc. There is need to incentivise private
investments by the corporate sector, so that common facilities like agri-logistics, processing
and such linkages come into existence as examined in Volume-III of this Report.
Public investment in rural connectivity (roads, transport, electricity, communication) allows
for a growth in the traffic of agricultural produce, from farms to markets. Greater involvement
of the corporate sector is desired to organise and integrate the flow of agricultural goods and
commensurate value. This optimal blend, in turn, organises the overall input and output supply
chain making for an optimised agri-value system. The current measures of marginal effects,
from public investment in rural roads-transport, energy and communication, on farmers’
income, may not be fully capturing the growth from associated investment in agri-business,
marketing, and the growth in productivity that also accrues.
The accelerated momentum in public investment needs to be increased to achieve the targeted
rate of 16.45 per cent, spread over the various heads in agriculture. Volume-II of this Report
presents the strategy for public and private investment to be followed when making plans at
state and district levels. A holistic approach to fill the gaps and bring convergence in the
resources available across different public sector agencies, as also in the private sector should
be adopted by the states. For example, investment in irrigation and energy must be met with
commensurate investment in roads and in modernising marketing infrastructure. An apt
measure of outcome to adopt is the growth in income or the total quantity of production
trafficked.
The data analysis has shown that private investment by farmers belonging to the states in the
eastern region is much lower relative to their counterparts in the northern region. This may also
be due to comparative shortfall in the reach of rural roads and energy. A preference is also
visible that households have invested in house improvements, which is undertaken at the
expense of investment in agriculture.
A good strategy to adopt is to have private investment targets linked to public investment
Doubling Farmers’ Income – Volume XIII
Structural Reforms and Governance Framework
65
spending. Currently, the added investment in the seven years after 2015-16, by public and
private sectors, is Rs. 102,269 and 46,298 crores respectively (a ratio of 1 : 2 approx.). Apart
from ongoing private investment by farmers, these is little investment by corporate sector.
Since, corporate private investment would, to a significant level, be linked to availability of
basic infrastructure, the States can have a target equivalent to at least 10 per cent of the public
investment made in agriculture. This will drive emphasis on making public investments in
appropriate supporting infrastructure, as needed by the private sector to plan and make their
own investment in agri-business projects.
Public investment measures can include factors or indicators that link to increased corporate
sector investment in agriculture, especially in agri-business areas (market upgradation, agri-
logistics, agro-processing, etc.). This will also bring about an increase in the marginal effects
of public investment and lead to greater use efficiency of public capital invested.
This Committee has recommended a Division of Investments and Enterprise as part of
restructuring and reorganising of Divisions in the Ministry of Agriculture and Farmers’
Welfare. A similar approach is suggested to the States. It must be noted that guiding public
investments ‘for’ agriculture and promoting investments in agricultural enterprises and will be
vital to achieving the agenda of doubling farmers’ income. It is noted that currently the scheme
implementing agencies, whose achievements are guided by financial and physical targets, are
also loaded with related policy formulation responsibilities. This, at times tends to disallow the
necessary holistic intent and outcome based approach in policy making. Segregating
implementation activities from policy making, will help make the policies more outcome
oriented and allow for better monitoring of the implementation. Tasking a separate division
with the charge of integrating investment policies ‘in’ and ‘for’ agriculture will be beneficial
way forward and provide suitable impetus to capital formation in agriculture.
Key Extracts
Key Extracts
Public investment in infrastructure is vital to achieve the target growth rates in farmers’
income. Investment in irrigation, rural roads-transport and energy is also critical to
attract larger private sector investment in agriculture.
Public expenditure can be coordinated into organically linked investment heads so as
to make the environment attractive to private corporate investment
Suitable focus on investment ‘in’ and ‘for’ agriculture is envisaged by setting up a
dedicated Division for Investment & Enterprises, as part of restructuring and
reorganising of the Ministry of Agriculture & Farmers’ Welfare.
There is need to segregate implementing agencies from policy making responsibilities,
to develop result oriented plans and outcome based monitoring of implementation.

Doubling Farmers’ Income – Volume XIII
Structural Reforms and Governance Framework
67
Climate Change – compounding agricultural risks
Climate change is a harsh reality, and is already evidenced in a shift observed in some cropping
patterns. Climate has direct impact on cultivation, including farm profitability and the long term
changes in weather patterns will also affect associated food security.
Background
Agriculture continues to be fundamentally dependent on the weather and will remain sensitive
to short term variations in weather and to seasonal, annual and long-term changes in climate.
Climate change is not just the warming of air temperature, but the linked long term alteration
in established weather patterns. The change manifests initially in weather disruptions such as
un-seasonal rains, winds, floods, droughts, extreme warming or cooling and other incidents.
Over the long run, it can cause a drastic shift in the agro-ecology with flora and fauna forced
to adjust their life cycles or turn extinct.
There are many examples of how extreme weather events have impacted farmers in the short
term, such as when (to mention a few):
- lakhs of poultry died in May and June 2003 in Andhra Pradesh due to heat wave;
- high rainfall in 1998 & 2005 ( > 1500 mm) affected kharif and late kharif crop of onion
and damaged rabi nursery;
- cold wave in north in 2006 caused frost and ice damage to crops;
- flowering occurred on already bearing mango trees in Bengaluru in February 2010; and
- heat wave causing lower milk yield from cattle and fish mortality in shallow water ponds.
These and many such instances on record, are occurring more frequently and un-predictably,
and are seen as indicators of changing atmospherics. When such extremes in weather become
more frequent or a norm, then the impact is permanent on agriculture. Scientists all over the
world agree that climate change is occurring, and its full impact is yet to be realised.
Most northerners in India will share how over the past decade, the winter is setting in late and
the spring has almost become non-existent. Summers are becoming warmer and such changes
are borne out by significant statistics. The Himalayan Glaciers, which get a substantial part of
their moisture from summer monsoons have retreated. Changes in farming are also observed,
like the traditional orange growing area of Nagpur having shifted northwards into Rajasthan;
and how apple & strawberry growing is said to have migrated to higher elevations in the
Himalayan hills. Studies indicate that the rise in average air temperatures have prevented
achieving expected yields in wheat and rice, despite increasing fertilizer application. Critical
growth stage of rabi crops are facing higher temperatures, shortening crop duration as a result.
Long term shift in weather patterns, or climate change, will also bring about a shift in pathogen
and pest populations & infestation zones, a changed situation in water availability and various
Doubling Farmers’ Income – Volume XIII
Structural Reforms and Governance Framework
68
other associated biological variations. The previous categorisations of agro-climatic zones will
change (in fact some changes are already visible) and entire agricultural economies will
undergo a transition. Such a transition has to be planned for.
Climate change forces a mirror on past strategies
As part of the drive for a green revolution, the kharif season got dominated by paddy, sugarcane
and cotton. Provided safety through price support by the government, these were considered
cash crops, and they quickly took over the area that was traditionally devoted to millets and
pulses (which were more suited to the local ecology). The crops are irrigation heavy, and access
to ground water and other irrigation was increased, which resulted in farmers shifting form
semi-arid cereals to cash crops which also require a heavy dose of chemical fertilizers. The
regions’ ground water got depleted and soil stressed.
Sugarcane is an example in particular. With advocacy by industrialists and interest shown by
the cooperative sector, Maharashtra developed a wide network of sugar mills, creating a ready
market for farmers. This influenced them to take up sugarcane cultivation, a water-intensive
crop, in areas not naturally endowed with water. Growing sugarcane in rainfall vulnerable
regions, made these areas more vulnerable when rains were not as expected. The same areas
traditionally grew millets and oilseeds, which required less water. Cultivation of paddy in semi-
arid Punjab is another example, which with changes in glacial melt and already depleted ground
water, will be increasingly vulnerable to changes in weather patterns.
Now, as a result of climate change, including erratic or changed rainfall patterns, these regions,
where cropping patterns were changed in disharmony to natural ecology, are facing higher
vulnerability and stress. Similar examples can be seen where drought prone regions in Andhra
Pradesh have taken to papaya and citrus, and Himachal Pradesh is producing exotic vegetables
at the cost of traditional crops like legume.
Climate change effects have brought forth some of these past errors and omissions and hastened
the learning curve. These learnings can be used for good, to plan a shift from unsustainable
cultivation practices of the recent past. The motivation of the Paramparagat Krishi Vikas Yojna,
is to counter such incidents, where insufficient knowledge and forethought now requires a
course correction.
The impact of climate change, current and expected are constantly debated and should be well
known to the involved. Temperature will effect yields of crop and livestock, water will impact
production and productivity, extremes will cause crop damage, nutrient quality of soil will get
impacted, pests will change zones, bees will be hurt, et al. Areas which could not grow certain
crops will find new life and areas currently under cultivation may get depleted (due to
inundation from rising sea levels or due to lack or water).
Agriculture continues to be fundamentally dependent on the weather and will remain sensitive
to short term variations in weather and to seasonal, annual and long-term in climate.
Doubling Farmers’ Income – Volume XIII
Structural Reforms and Governance Framework
69
Way forward for agriculture under changing climate
Inter-governmental Panel on Climate Change (IPCC) in their Fifth Assessment Report (AR5)
has stated that warming of the climate system is unequivocal. A report published by the World
Bank1 analyses the global impact of climate change, including in South Asia. This assessment
is buttressed by studies undertaken by CRIDA (Central Research Institute for Dryland
Agriculture) and others in the ICAR network. The August 2017 Report (39th) of the Standing
Committee on Agriculture (2016-17)2, deliberated on climate change concerns in regards to
Indian Agriculture.
The impact of climate change is well established from various reports. These include, partial
gains in productivity in some crops due to CO2 rise, but decrease in productivity in many others
due to temperature stress. Possibly some improvements in yields of chickpea, rabi maize,
sorghum and millets; and coconut in west coast. Horticulture will be severely affected due to
changes relating to flowering pollination and weather linked yield losses. Loss of arable lands
is expected where sea level rises will inundate coastal and river delta areas. Milk production
and reproductive function of livestock will be adversely affected with temperatures rises, the
highest in case of crossbred cattle and the lowest in case of indigenous breeds. Fishery
spawning and maturity will be curtailed and birds are likely to suffer.
These and many others, including the impact on soil health, glacial rivers, fisheries, etc., are
discussed in Volume-V and VI of this Report.
Climate change concerns have brought to forefront, the agenda of sustainability in agriculture
and is narrowing the boundaries under which agriculture operates, thereby adding great
responsibility on the science behind agriculture. It is understood, that climate change will
impose and enforce changed farming practices, and this will require constant and monitoring
of various interventions planned. Care must be taken that practices that are made attractive by
short term financial gains are not at the cost of long term welfare of the farmer or the
environment. Crop diversification, more efficient water use, and improved soil management
practices, together with the development of drought-resistant crops can help reduce some of
the negative impacts. There is a need to approach climate change with dedicated focus, not
only from the perspective of protecting farmers’ welfare, but from also from the view to
safeguard food and nutritional security of the nation.
Impact of Climate change and change management
Agriculture a biologically controlled activity is totally dependent on climate. It is over the
millennia that the current global agricultural systems have evolved as shaped by nature. The
changes effected to these naturally evolved agricultural systems by science and technology,
particularly in the last two centuries have made only marginal and cosmetic changes to the
1 World Bank. 2013. Turn Down the Heat: Climate Extremes, Regional Impacts, and the Case for Resilience. A report for
the World Bank by the Potsdam Institute for Climate Impact Research and Climate Analytics. 2 "Comprehensive Agriculture Research based on Geographical Conditions and Impact of Climatic Changes to ensure Food
Security in the Country”, Thirty Ninth Report of Standing Committee On Agriculture - Lok Sabha Secretariat (2017)
Doubling Farmers’ Income – Volume XIII
Structural Reforms and Governance Framework
70
creations of the nature-scientist. In consonance with the climatic parameters inclusive of
rainfall, temperature, humidity, etc., agricultural systems & sub-systems have taken shape. The
basic principles of natural evolution have created the appropriateness of different agricultural
sub-sectors to varying climatic conditions. This could be water guzzling paddy which may be
more suited to semi-temperate climates and millets in arid and sub-arid tropics; or template
horticulture on the upper reaches of the Himalayas and dryland horticulture in the sub-tropics;
or buffalo based dairying in hot and humid climates of the Deccan Plateau and Sahiwal cow in
North India; and so on their forth. Similar patterns would be visible across the continents.
Further, in accordance with the principles of survival of the fittest, the agricultural fauna and
flora have also adapted themselves to the geographical situations. Thus has evolved the stable
agricultural system of today catering to mankind’s basic requirements of food, fodder,
industrial raw material etc. It would be more appropriate to say that the agriculture system ever
since it originated about 10,000 years ago and transitioned man from hunting to settled stage
sowed the seeds of the first civilization. Since then there at best have been only marginal or
insignificant changes “in principles” season-bound to the ‘in principles’ season-bound
agricultural practices. The mankind including in India has adopted and shaped his civilization
around agriculture.
Agriculture has defined the contours of India’s civilization and culture and nurtured the same
through centuries. Agriculture has served as the anchor of the majority of India’s population
dependent as they are on farming for their livelihood. Any basic change in the stability of the
agricultural system is bound to impact the farming community in several ways.
With climate change implications resulting in shift in seasons and cropping systems, the life of
a farmer, relating to both his profession and cultural life, can be expected to face an unsettled
environment. The changes are likely to be substantive, impinging upon the farmers directly,
calling upon the need for major re-adjustments. The agricultural practices, which are a natural
habit formed not just within a farmer’s lifetime but over generations, transferred like inherited
traits would be hard to change. The demand for change would be at both mental and operational
levels. A farmer’s ability to adjust himself to the new environment would be challenged. There
would be demand for appropriate skills and resilience. At the simplest level, the farmer would
now be required to change the cropping pattern because of shift in season and consequential
and new response system in respect of seeds, farm practices, farming equipments & machinery
etc. In short, the new challenges would amount to “change management”.
The Change Management would involve a certain period of transition from the existing to the
new system and it is during this period of transition that the challenges of moving smoothly to
a new situation will have to be dealt with by the farmers. The ability of the farmers to manage
this fundamental change will depend upon his level of information, knowledge, skill, attitude
and above all financial strength. Considering that more 86 per cent of the agricultural
households are small and marginal, the fiscal space available to them to cater to the change
demands is severely restricted. The levels of literacy and general awareness are also a concern.
Doubling Farmers’ Income – Volume XIII
Structural Reforms and Governance Framework
71
Obviously the change management under such circumstances is going to be difficult and would
require the Government to provide them both support and counsel. It would, therefore, be
necessary that a comprehensive plan and a time bound roadmap are designed and adopted by
all government agencies to guide and handhold the farmers through this difficult process of
change. The small & marginal farmers, as also the landless agricultural labour would require
special attention. This would mean adoption of a package of mitigation and adaptation
measures for guiding climate change induced impact on agriculture and farmers.
In this regard, the National Action Plan on Climate Change (NAPCC) comprising, inter alia,
eight National Missions in specific areas of Solar Energy, Enhanced Energy Efficiency,
Sustainable Habitat, Water, Sustaining the Himalayan Eco-system, Green India, Sustainable
Agriculture and Strategic knowledge for Climate Change was released in June 2008.
Key Recommendations
The National Mission on Sustainable Agriculture (NMSA) derives its mandate from the
NAPCC. However, global scientific knowledge on climate change and related technologies is
updated regularly. The strategy and components of the NMSA may be reviewed with an option
to revise every two years, so that its various planned interventions are most appropriate and the
best available technologies are adopted.
In view of climate change and other ecologically diverse changes that have occurred there is a
need to revisit and map anew the agro-ecological regions and climatic zones in the country.
This will help provide fresh direction in respect of all other sustainable strategies and practices.
Science will play and a big role to mitigate effects of climate change and greater focus needs
to be laid on R&D to develop technologies, such as biotic stress resilient crop varieties and
livestock breeds. Widespread dissemination of climate change concerns and economic impact
may be undertaken in participation with KVKs and the ATMA network.
Key Extracts
More rigorous monitoring of climate change and technologies to mitigate adverse
impact is needed. The agricultural system, including farmers has to be prepared for
possible shifts in practices and habits that have developed over generations.
The NMSA strategies may be reviewed periodically to maintain relevance with best
available technologies and new scientific developments on climate change and agro-
ecological regions and climatic zones be re-categorised.
The expected transition in cropping system, crop selection, livestock care and
adoption of new technologies has to be extensively propagated.

Doubling Farmers’ Income – Volume XIII
Structural Reforms and Governance Framework
Volume XIII-B
Governance Framework

Doubling Farmers’ Income – Volume XIII
Structural Reforms and Governance Framework
75
Farmers’ Welfare
The term ‘welfare’ is practically understood across the world, as taking care of the weaker. It refers to
a set of support systems that governments offer to their citizens to ensure equitability and general well-
being. While at the generic level, it is well explained by Economists, Sociologists and Political
Scientists, the term ‘farmers’ welfare’ is yet to be defined appropriately. Now, that the Government is
speaking of agriculture not just as a profession or enterprise, but in terms of farmers, the human element
assumes greater importance. This chapter deals with the paradigm of ‘farmers’ welfare’ and the
approach and set of interventions needed to achieve the general well-being of the farmers.
Understanding Welfare
The term ‘welfare’ has a long history and has been a subject of discussions across various
disciplines including economics, sociology, political economy, psychology, etc.
The Oxford dictionary defines welfare as:
i. The health, happiness, and fortunes of a person or group.
ii. (a) Statutory procedure or social effort designed to promote the basic physical and
material well-being of people in need.
(b) North American: Financial support given to those who are unemployed or otherwise
in need.
The Merriam Webster dictionary defines welfare as:
i. the state of doing well especially in respect to good fortune, happiness, well-being, or
prosperity
ii. (a) aid in the form of money or necessities for those in need;
(b) an agency or program through which such aid is distributed
Welfare in terminology can be defined as a minimal level of well-being and provision of social
services and support for citizens and other eligible residents who do not possess sufficient
current means to satisfy their basic needs. In most developed countries, welfare is mainly
provided by the government from tax revenues, and to a lesser extent by NGOs, charities,
informal social groups, religious groups, and inter-governmental organisations.
Development also contributes to the welfare of people. For example the building of rural road
networks or electrification leads to an improved status of well-being and brings greater
opportunities for the region to fare well in their living. In such a case, the development
empowers the people to progress and live better.
Social Welfare: Social welfare is defined a little more definitively in the lexicon. It is seen as
the social well-being in terms of health and economic matters as well as the organised social
services provided to the disadvantaged.
Doubling Farmers’ Income – Volume XIII
Structural Reforms and Governance Framework
76
The Oxford dictionary defines social welfare as:
“The well-being of a community or society, especially with regard to health and
economic matters”.
The Merriam Webster dictionary defines social welfare as:
“Organised public or private social services for the assistance of disadvantaged
groups”.
The provision of social services to the disadvantaged or to the population in general, seems to
be the relevance here. For example, the availability and access to the basic amenities of the
times like food, hospitals, schools, etc. are inferred.
Social Security expands on this concept, especially in welfare states, by providing all
inhabitants with various social services such as universal healthcare, unemployment insurance,
student financial aid (in addition to free education upto a certain level), and others. In its 1952
Social Security (Minimum Standards) Convention (nr. 102), the International Labour
Organisation (ILO) defined the traditional contingencies covered by social security.
‘The welfare’ as terminology possesses different connotations in different countries. For
example, the general term for an action programme in support of the well-being of the poor in
United States is called a welfare programme and the general term for all such programmes is
simply called as welfare. In the United Kingdom, the term welfare means not only the minimal
help of people in need but also services traditionally called benefits and social security and this
holds good in most of the English speaking countries except the United States. The term is
even used to include government help in finding employment.
The welfare support offered by the governments to the people has had long history. In the
Roman Empire, the first emperor Augustus provided the Cura Annonae or grain dole for
citizens who could not afford to buy food every month. Early welfare programmes in Europe
included ‘English Poor Law of 1601’, which gave parishes the responsibility for providing
welfare payments to the poor. This system was substantially modified by the 19th century Poor
Law Amendment Act, which introduced the system of workhouses.
However, it was predominantly in the late 19th and early 20th centuries, that an organised system
of state welfare provision was introduced in many countries including Germany, Britain etc.
The national insurance system was introduced in Great Britain in 1911. During the great
depression (1929), when emergency relief measures were introduced under President Franklin
D. Roosevelt’s ‘New Deal’ the focus was mainly on a programme of providing work and
stimulating the economy through public spending on projects, rather than on cash payment.
The various interventions referred above in different countries at different points of time in
world history demonstrate the wide canvas of the concept of welfare. As seen, it may include
Doubling Farmers’ Income – Volume XIII
Structural Reforms and Governance Framework
77
distribution of food to the poor, providing houses to the weaker section, offering insurance
support to the poor at concessional premium payments, and creating job opportunities by
reserving public spends on projects. In modern India, the basket of welfare has included all
these and many more. In all these interventions, economics linked support is provisioned to
allow the beneficiary to attain a better state in the standard of living.
Economics Definition of Welfare: Alfred Marshall a pioneer neo-classical Economist
redefined his field of study by attempting the welfare definition of economics. This definition
enlarges the field of economic science to a larger study of humanity. In his view, economics
studies all the action that people take in order to achieve economic welfare. In his words “man
earns money to get material welfare”. It is on account of this, that economists since Marshall
have described his definition as welfare definition of economics. This definition widens the
scope of economic science by emphasising a combined study of wealth and humanity, rather
than wealth alone. In his well-known book, ‘Principles of Economics published’ in 1890,
Marshall defined economics as follows:
“Political Economy or Economics is a study of mankind in the ordinary business of
life; it examines that part of individual and social action which is most closely
connected with the attainment and with the use of material requisites of well-being”.
Some recent economists such as Lionel Robbins have criticized the above definition by saying,
that Marshall’s definition of material welfare excludes non-material welfare like services of
doctors, lawyers, teachers, engineers, etc. which also promote human welfare. However, this
argument of Robbins has been countered by others by highlighting that Marshall’s definition
of ‘material’ includes both goods and services.
Broadly, economic welfare is the level of prosperity and standard of living of either an
individual or a group of persons. It refers to that part of social welfare that can be fulfilled
through economic activity.
Economic welfare is measured in different ways depending on the preferences of those
measuring it. Factors used to measure the economic welfare of a population include: GDP,
literacy, access to health care, and the like.
Ministry of Agriculture & Farmers’ Welfare: The erstwhile Ministry of Agriculture was
renamed by the government, appending the phrase “Farmers’ Welfare”. The term ‘welfare’
used here, is translated from the phrase Kalyaan (from कृषि एवं ककसान कल्याण मंत्रालय). This is
not merely a name change, but indicates the government’s agenda to add focus on farmers, and
not on agriculture as a sector alone. In any enterprise or organisation, the human resource is
more important that all other resources. In agriculture, farmer is the human resource.
How the notion of kalyaan is interpreted by development agencies, is important to how they
drive the associated programmes. Would it be appropriate to link kalyaan only to social
Doubling Farmers’ Income – Volume XIII
Structural Reforms and Governance Framework
78
services? Or is this more about economic welfare, associated with long term well-being, to be
achieved by empowering farmers with the right knowledge, tools and facilitation. Has the
concept of kalyaan been lost in translation? It is important to understand ‘welfare’ from the
perspective of empowerment and not limit the interpretation in relation to gratuitous patronage
or daan. Farmers too have repeatedly expressed they seek opportunity to progress in economic
terms, and not a dependence in perpetuity. This is also evidenced in recent demands by farmers
to find optimal value at markets, and support in optimising their business opportunity.
As heads of farming enterprises, like all business owners, farmers seek facilitation to achieve
growth through support to mitigate uncontrolled risks, enabling market access and a business
environment that is not restrictive. Economic well-being is expected to lead to self-reliant
living, a higher standard of life and a state of contentment. However, the rural backdrop is
typically remote from other kinds of development, and therefore farmers’ welfare would also
need to integrate delivery of social services, of rural welfare programmes such as for health,
medical facilities, pension schemes, etc. Farmers’ welfare would therefore not find wholesome
acceptance in economic terms alone, but would include aspects of social support system.
Social welfare is not the same as standard of living but is more concerned with the quality of
life that include factors such as the quality of the environment (air, soil, water), level of crime,
availability of essential social services, as well as the spiritual aspects of life.
The need to emphasise on farmers’ welfare
It is well recognised that:
i. Farmers are engaged in producing food and non-food commodities to meet the
nation’s requirement
ii. Farmers are engaged in agriculture as a livelihood, and are self-employed. They are
to that extent releasing the government of an obligation of providing alternate jobs to
a large population.
iii. Agriculture which is a biological process is highly risk prone along its entire chain.
iv. Farmers constitute a singularly largest professional section of the society.
These four factors create a case for considering farming and farmer as a special category,
warranting priority attention to the status of their welfare. Hence, it is important that the term
“farmers’ welfare” is well defined and a set of comprehensive support systems adopted, that
would guarantee their specific well-being.
Defining Farmers’ Welfare
The above definitions and explanations drive home a point, that economic status would
constitute a critical component in defining “farmers’ welfare”. In a socialist country like India,
economic welfare of any individual or a class of people, including that of the farmers, is catered
to by governments through various schemes that offer direct support besides creating or
Doubling Farmers’ Income – Volume XIII
Structural Reforms and Governance Framework
79
facilitating generation of job opportunities. For example, these include wage employment
guarantee schemes (MGNREGA), pension schemes (old age pension, widow pension etc.), free
education upto a certain stage, food subsidy under public distribution system, welfare of
children and mothers under ICDS, free primary health services, developmental schemes under
different departments (including agriculture), life and non-life insurance (crop insurance under
PMFBY is a good illustration). The implication is that both personal incomes and
governmental support determine the intensity and extent of welfare that is available to
the people of India including the farmers.
Farmers’ Income
As discussed in detail in Volume-II of this Report, there are no standardised and fixed interval
measures of farmers’ income in India. One of the more acceptable estimates of farmers’ income
is the NSSO’s Situation Assessment Survey (SAS) vide 59th and 70th Rounds. As per 70th
Round of SAS conducted during the period of July 2012 to June 2013, the average income of
an agricultural household was Rs. 6,426/- and the average monthly consumption expenditure
was Rs. 6,223/-. This leaves a paltry saving of just Rs. 203/-.
Notwithstanding various welfare and social welfare support systems of governments (central
and state) available to the farmers, the average monthly income of Rs. 6,426/- in the agricultural
year 2012-13 is not good enough considering that the average monthly consumption
expenditure (MPE) of an agricultural household is also high. It is not possible for an average
agricultural household to meet various other additional expenses that the family would need to
on account of education, health, entertainment, social obligations (like marriage ceremonies at
home). It is in fact such expenses that drive a farmer to borrow from the private moneylenders
at usurious rates of interest.
With no adequate savings, the borrower-farmers unable to make timely repayments ship into a
debt trap. Such precipitous situations lead to negative social implications including loss of face,
anxiety and stress. The consequential state of mental tension cannot but compromise the well-
being of a farmer. The logical conclusion is, that promotion of a farmer’s welfare warrants
generation of adequate income which can cover all nature of consumption expenditure and
leave savings that can:
(i) cater to higher human needs like entertainment, travel, culture, etc.;
(ii) meet unforeseen family expenses arising from exigencies;
(iii) generate surpluses that can be ploughed back into agriculture by way of
infrastructure, technologies and management practices for high productivity and
production.
It is this virtuous cycle that can create a happy environment and a state of well-being.
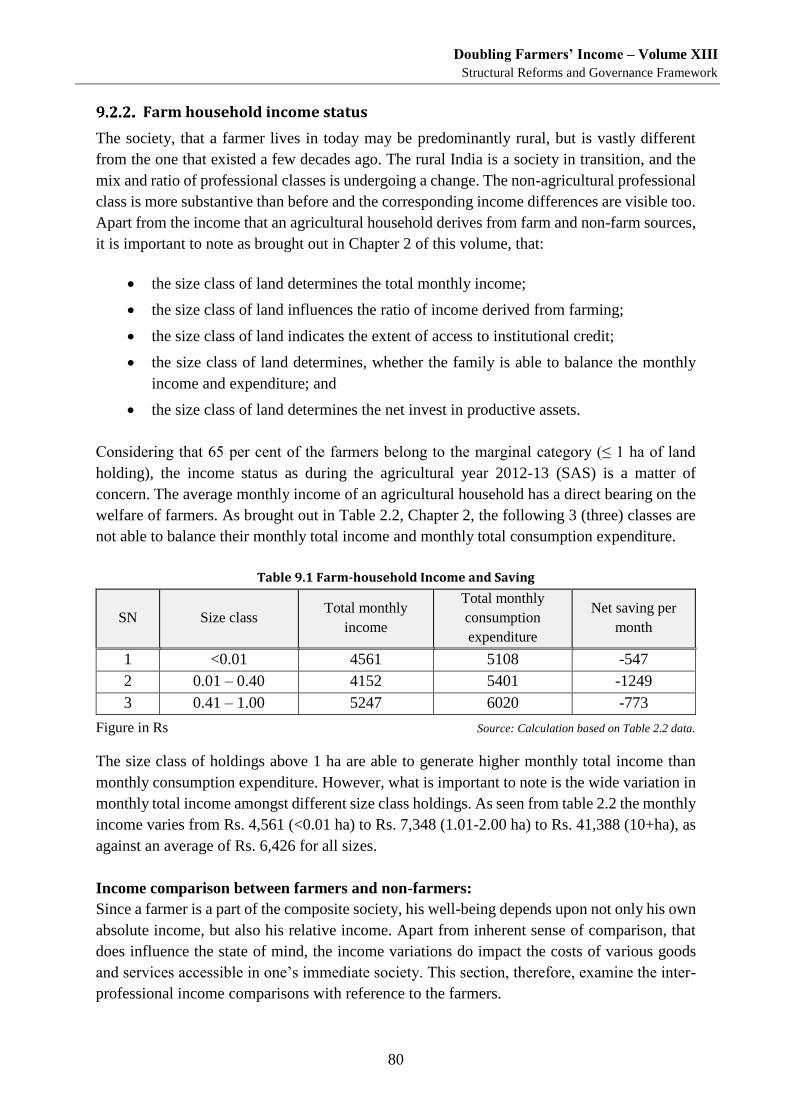
Doubling Farmers’ Income – Volume XIII
Structural Reforms and Governance Framework
80
Farm household income status
The society, that a farmer lives in today may be predominantly rural, but is vastly different
from the one that existed a few decades ago. The rural India is a society in transition, and the
mix and ratio of professional classes is undergoing a change. The non-agricultural professional
class is more substantive than before and the corresponding income differences are visible too.
Apart from the income that an agricultural household derives from farm and non-farm sources,
it is important to note as brought out in Chapter 2 of this volume, that:
the size class of land determines the total monthly income;
the size class of land influences the ratio of income derived from farming;
the size class of land indicates the extent of access to institutional credit;
the size class of land determines, whether the family is able to balance the monthly
income and expenditure; and
the size class of land determines the net invest in productive assets.
Considering that 65 per cent of the farmers belong to the marginal category (≤ 1 ha of land
holding), the income status as during the agricultural year 2012-13 (SAS) is a matter of
concern. The average monthly income of an agricultural household has a direct bearing on the
welfare of farmers. As brought out in Table 2.2, Chapter 2, the following 3 (three) classes are
not able to balance their monthly total income and monthly total consumption expenditure.
Table 9.1 Farm-household Income and Saving
SN Size class Total monthly
income
Total monthly
consumption
expenditure
Net saving per
month
1 <0.01 4561 5108 -547
2 0.01 – 0.40 4152 5401 -1249
3 0.41 – 1.00 5247 6020 -773
Figure in Rs Source: Calculation based on Table 2.2 data.
The size class of holdings above 1 ha are able to generate higher monthly total income than
monthly consumption expenditure. However, what is important to note is the wide variation in
monthly total income amongst different size class holdings. As seen from table 2.2 the monthly
income varies from Rs. 4,561 (<0.01 ha) to Rs. 7,348 (1.01-2.00 ha) to Rs. 41,388 (10+ha), as
against an average of Rs. 6,426 for all sizes.
Income comparison between farmers and non-farmers:
Since a farmer is a part of the composite society, his well-being depends upon not only his own
absolute income, but also his relative income. Apart from inherent sense of comparison, that
does influence the state of mind, the income variations do impact the costs of various goods
and services accessible in one’s immediate society. This section, therefore, examine the inter-
professional income comparisons with reference to the farmers.
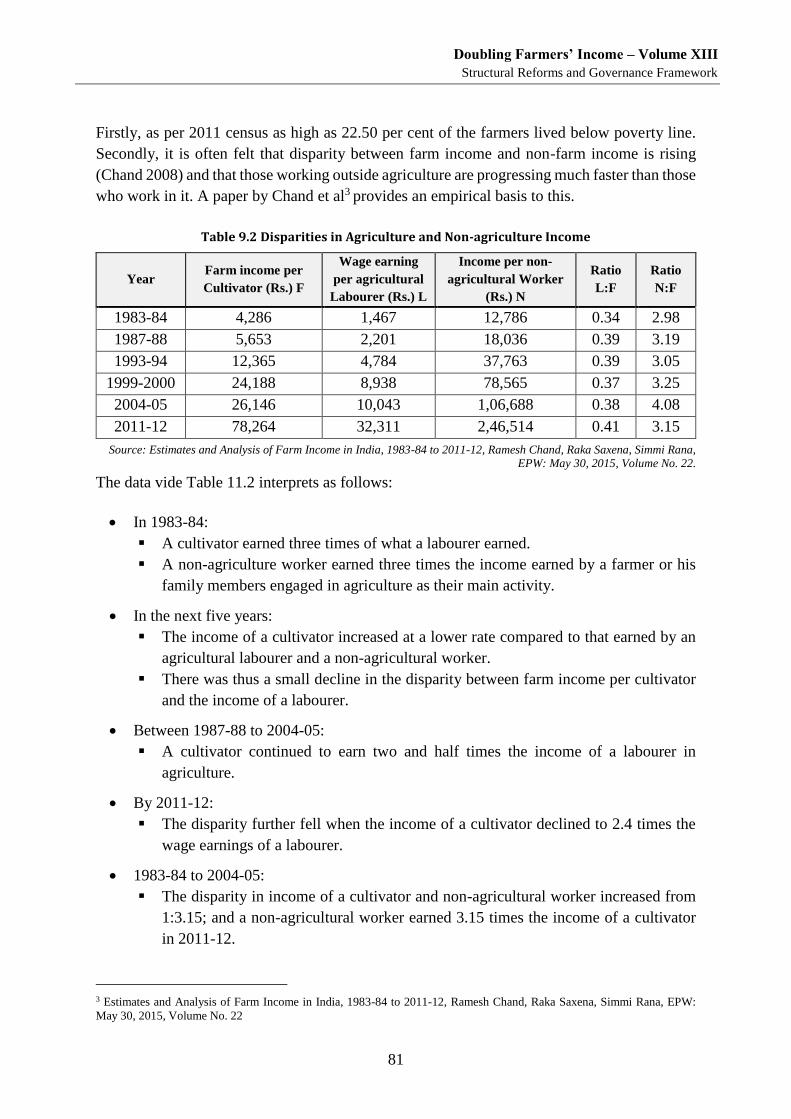
Doubling Farmers’ Income – Volume XIII
Structural Reforms and Governance Framework
81
Firstly, as per 2011 census as high as 22.50 per cent of the farmers lived below poverty line.
Secondly, it is often felt that disparity between farm income and non-farm income is rising
(Chand 2008) and that those working outside agriculture are progressing much faster than those
who work in it. A paper by Chand et al3 provides an empirical basis to this.
Table 9.2 Disparities in Agriculture and Non-agriculture Income
Year Farm income per
Cultivator (Rs.) F
Wage earning
per agricultural
Labourer (Rs.) L
Income per non-
agricultural Worker
(Rs.) N
Ratio
L:F
Ratio
N:F
1983-84 4,286 1,467 12,786 0.34 2.98
1987-88 5,653 2,201 18,036 0.39 3.19
1993-94 12,365 4,784 37,763 0.39 3.05
1999-2000 24,188 8,938 78,565 0.37 3.25
2004-05 26,146 10,043 1,06,688 0.38 4.08
2011-12 78,264 32,311 2,46,514 0.41 3.15
Source: Estimates and Analysis of Farm Income in India, 1983-84 to 2011-12, Ramesh Chand, Raka Saxena, Simmi Rana, EPW: May 30, 2015, Volume No. 22.
The data vide Table 11.2 interprets as follows:
In 1983-84:
A cultivator earned three times of what a labourer earned.
A non-agriculture worker earned three times the income earned by a farmer or his
family members engaged in agriculture as their main activity.
In the next five years:
The income of a cultivator increased at a lower rate compared to that earned by an
agricultural labourer and a non-agricultural worker.
There was thus a small decline in the disparity between farm income per cultivator
and the income of a labourer.
Between 1987-88 to 2004-05:
A cultivator continued to earn two and half times the income of a labourer in
agriculture.
By 2011-12:
The disparity further fell when the income of a cultivator declined to 2.4 times the
wage earnings of a labourer.
1983-84 to 2004-05:
The disparity in income of a cultivator and non-agricultural worker increased from
1:3.15; and a non-agricultural worker earned 3.15 times the income of a cultivator
in 2011-12.
3 Estimates and Analysis of Farm Income in India, 1983-84 to 2011-12, Ramesh Chand, Raka Saxena, Simmi Rana, EPW:
May 30, 2015, Volume No. 22
Doubling Farmers’ Income – Volume XIII
Structural Reforms and Governance Framework
82
Acceleration in growth of agricultural output and a decline in the number of cultivators,
between 2004-05 to 2011-12, checked the rising disparity between the incomes of farmers and
non-farmers.
In sum, from the above it can be concluded that the cultivator relative to non-agricultural
worker earns much less. And, that the relative income status of a cultivator can be improved if
agriculture is able to register robust annual growth and the terms of trade are oriented in favour
of the sector. It would help keeping in mind that equitability is as important as the level of
one’s income.
Maslow’s Need Hierarchy and Farmers’ Welfare
It would be appropriate to take note of Maslow’s need hierarchy theory to examine its
appropriateness in defining welfare approach to farmers. According to Maslow, the well-
known psychologist, human being has a hierarchy of needs and he aims to fulfil them. These
in ascending order are as follows:
Food security
Biological security
Social security
Recognition
Self-actualisation
For the farmer in this case to move up from the food security to the stage of self-actualization,
he needs to have adequate income, apart from a supportive and positive societal environment,
that he lives in.
DFI’s Definition of Farmers’ Welfare
After deliberating upon the definitions & explanations of welfare adopted in different parts of
the world and in different contexts, and after examining the well-being framework of farmers
in India, the DFI Committee defines farmers’ welfare in two different ways as follows:
“Farmer’s welfare refers to a state of his general well-being, wherein an agricultural
household aided by its own farm and non-farm incomes and social security support
is able to satisfy economic, social and psychological needs of all its members, besides
the investments, required for sustainable agricultural operations”.
“Farmers’ welfare can be said to have been achieved, when a farm-family is able to
generate adequate, stable and sustainable incomes from farm and non-farm
enterprises, which is not only sufficient to meet the multiple needs associated with
human dignity, but is also left with savings that can be shipped back into farming as
investments”.
Doubling Farmers’ Income – Volume XIII
Structural Reforms and Governance Framework
83
Indicators / measures of farmers’ welfare
In the light of the above discussions, a farmer’s welfare can be defined / calculated in terms of:
both absolute and relative average income;
availability and accessibility to social security system – education, health, etc.;
facilitating the farmer in moving up Maslow’s need hierarchy beyond social security.
Some of the measures suggested are:
average monthly income and consumption expenditure and the resultant saving /
surplus;
income spread amongst agricultural households belonging to different size classes
of land holding;
comparative monthly income of agricultural households vis-à-vis other professional
classes;
relative monthly income of agricultural households vis-à-vis the national average of
the whole population;
percentage of farmers below poverty line.
Some additional measures of welfare suggested for adoption are:
average size of indebtedness and access to institutional credit;
average amount of investments in creating productive assets;
average rate of literacy; and
state of health of the family [life expectancy at birth, Infant Mortality Rate (IMR),
Material Mortality Rate (MMR)]
Measuring farmers’ income and farmers’ welfare – standardised methodology and interval:
As of now, there is no fixed interval estimates of farmers’ income. In the absence of a
standardised approach, reliance for evaluating the state of farmers’ income is sample survey
based estimates of NSSO (2002-03 and 2012-13 agricultural years); and estimates by
researchers. These are not only not enough, but also do not meet the requirement of monitoring
the change in farmers’ income in the light of the vision of doubling farmers’ income by 2022.
It is, therefore, suggested that:
A comprehensive parametric based scale be developed to measure farmers’ income
and welfare (economic and social parameters be incorporated).
The interval of measure should be annual, based on a sample survey; and five yearly,
based on universal survey.
Doubling Farmers’ Income – Volume XIII
Structural Reforms and Governance Framework
84
The approach to farmers welfare
Section 12.1.1 mentions the four factors that create a case for warranting special attention on
farmers’ welfare. To ensure that such intention is achieved and is inclusive, a broad approach
is suggested as follows:
i. Income enhancement – as brought out in chapter 2, para 2.2, the size class of land
holding has a bearing on income, investments in productive assets and access to institutional
credit, and infers that greater attention is needed for this class of farmers. Yet, in adopting the
strategy for doubling farmers’ income, the relative growth among the landless, small and
marginal farmers; and the relatively less developed regions should be pegged at higher level.
ii. Social security cover – all farmers eligible for coverage under ongoing welfare & social
welfare schemes of the government (centre & state) should be given priority. As an urgent
intervention, it is suggested that the District Administrations / Zilla Parishads should be advised
to take up a campaign approach to ensure 100 per cent coverage as per applicable criteria. A
farmers’ digital data base needs to be maintained for purpose of continuous monitoring.
iii. Access to Institutional credit – all farmers, particularly the small and marginal farmers
must be supported to avail themselves of institutional credit in respect of:
short term crop loans;
medium and long term investments; and
warehousing based post-harvest loans
iv. Risk cover – vulnerability to nature and unpredictability of markets are the core threats
to farmers’ income, stability and welfare. Appropriate risk covers should be made available to
the farmers at low premium rates covering
crop and livestock insurance (PMBSY is a Model example for scale-up and
replication);
accidents and professional risk insurance; and
health insurance.
v. Access to Knowledge – all farmers need to be empowered with knowledge and
technology support. Timely, relevant and applicable information can enable the farmer to take
incisive decisions to counter the various uncontrolled variables and optimise on their resource
use. The knowledge base needs to cover:
accessibility to above support systems;
planning and managing production in sustainable manner;
planning and managing post-production and marketing; and
preparing and counselling for contingencies on farm and home.
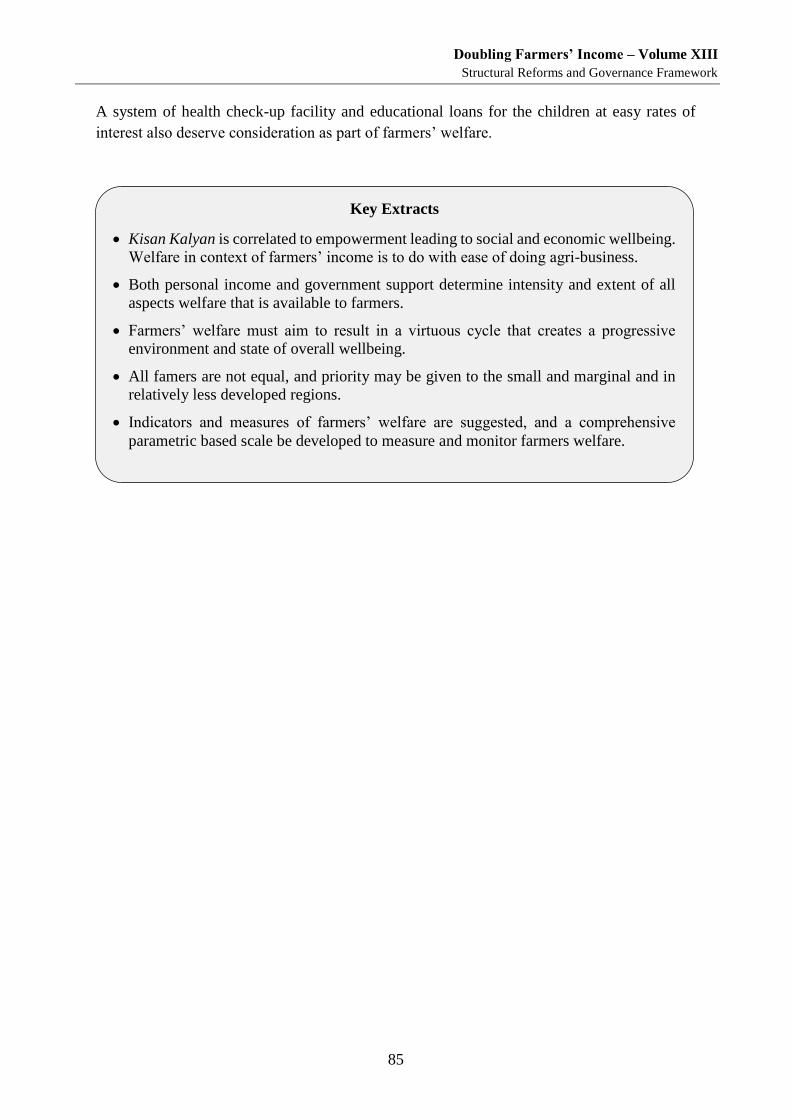
Doubling Farmers’ Income – Volume XIII
Structural Reforms and Governance Framework
85
A system of health check-up facility and educational loans for the children at easy rates of
interest also deserve consideration as part of farmers’ welfare.
Key Extracts
Kisan Kalyan is correlated to empowerment leading to social and economic wellbeing.
Welfare in context of farmers’ income is to do with ease of doing agri-business.
Both personal income and government support determine intensity and extent of all
aspects welfare that is available to farmers.
Farmers’ welfare must aim to result in a virtuous cycle that creates a progressive
environment and state of overall wellbeing.
All famers are not equal, and priority may be given to the small and marginal and in
relatively less developed regions.
Indicators and measures of farmers’ welfare are suggested, and a comprehensive
parametric based scale be developed to measure and monitor farmers welfare.

Doubling Farmers’ Income – Volume XIII
Structural Reforms and Governance Framework
87
Planning and Review – Institutional Arrangement
The agricultural sector enjoys both breadth and depth. This is its strength, for it can facilitate building
supplementary and complementary relations amongst different resources and realise thereby their use
optimization. Simultaneously, its strength is its weakness too, for the complexity emanating from
pluralistic stakeholders, multiple resources and uncontrolled external variable warrant a strong
institutional system from the village to the national level to achieve the set goals and listed objectives.
Introduction
As per constitutional arrangements, agriculture is a state subject. Hence, both production and
marketing are primarily viewed as the responsibilities of a state machinery. The world has
always recognised the importance of a vast market. Hence the globalisation the world
experiences. India as a nation with its enviable geographical expanse, facilitative agro-climatic
basket and elephantine consumer base should not fail to recognise the advantage of pan-India
production and marketing design. After all, there always is an inter-play of several vectors
across the states, as also across the nations influencing overall growth and development.
This entails a continuum of planning, implementation, review and monitoring between the
Gram Panchayat and Krishi Bhawan, via the District and State headquarters. This is however
not to suggest, that agriculture should be moved out from the state jurisdiction. It is only to
emphasise that dismantling of state-bound mind-set in production planning and boundaries in
marketing would help the farmers take a more rational decision vis-à-vis both production plans
and market access. Against this understanding, following institutional systems are suggested –
one led by the political leadership, another by the bureaucratic executive and the third as a
domain authority.
i. Three-tier system for planning, reviewing and monitoring.
ii. Four-tier arrangement for convergence of resources, coordination of efforts and
synergy of execution.
iii. Omnibus agricultural regulatory authority for dispute resolution of all issues.
Three – tier system
The Department of Agriculture, Cooperation and Farmers’ Welfare (DAC&FW) has already
advised the state governments vide its letter, dated, 22.3.3017 to put in place the following
systems at state and district levels and has issued Guidelines to this effect. The main objectives
to be achieved by these Committees are as follows:
i. Focus on increasing the net income from each unit of farm by reducing the cost of
cultivation / production, increasing per unit yield and higher market return on the
farmers’ produce.
ii. Make efforts to offer security to farmers against unpredictable nature of agriculture
through comprehensive crop insurance, unified insurance package (UIP), speedy &
Doubling Farmers’ Income – Volume XIII
Structural Reforms and Governance Framework
88
efficient delivery of relief entitlements and the like.
iii. Enhance access to institutional credit, both by increasing the volume of credit and also
by better targeting.
iv. Supplement the farmers’ income, particularly during off-season times by creating an
enabling environment for generating alternate off- farm activities.
v. Build farmers’ resilience and prepare them to negotiate unpredictable nature of farm
activities and low level of income by coverage under various welfare schemes of the
Government.
vi. Check every probability of farmer-suicide by working to remove indigence and
vulnerability among the farming community.
vii. Improve Governance with a view to achieving efficiency and transparency in delivery
of agricultural services.
Composition and Terms of References of the Committee
Composition of Committees
A. District Level Review and Monitoring Committee
1. Minister In-charge of the District Chairman
2. Member of Parliament (Lok Sabha) (in case of more than one
MP (LS) from one district, State Government will decide one to
be Co-chairman and remaining MP(LS) will be member)
Co-Chairman
3. Chairman, Zila Parishad Vice Chairman
4. Members of Legislative Assembly (MLAs) and Members of
Legislative Council (MLCs) representing the district
Members
5. Chief Executive Officer, Zila Parishad Member
6. Special Deputy Commissioner/ Joint Collector/ Additional
District Magistrate-Incharge of Revenue
Member
7. District Head-Incharge of Health and Family Welfare Member
8. All District Heads-Incharge of Agriculture, Animal Husbandry
& Dairy, Fishery Development, Soil Conservation/Water Shed
Development and Sugar
Member
9. District Heads-Incharge of Major, Medium and Minor Irrigation Member
10. District Heads-Incharge of Electricity/Energy Member
11. District Heads-Incharge of Cooperation & Agriculture
Marketing
Member
12. Secretary of the District Central Cooperative Bank (DCCB) Member
13. District Manager, Lead Bank Member
14. District Manager, NABARD Member
15. District Head-Incharge of Public Distribution System (PDS) Member
16. District Head-Incharge of Welfare (SCs/STs/OBCs) Member
Doubling Farmers’ Income – Volume XIII
Structural Reforms and Governance Framework
89
17. District Head-Incharge of Social Welfare Member
18. District Head-Incharge of Women and Child Development Member
19. District Head-Incharge of Mid-Day-Meal Scheme Member
20. Two Representatives of Agriculture & Allied
Universities/ICAR/ Central Agriculture Universities preferably
from the centre/ institution operating in the District (to be
nominated by the Chairman, as per availability within District)
Member
21. Project Coordinator, KVK in the District Member
22. Two progressive farmers recommended by Project Coordinator,
KVK in the District
Member
23. Deputy Commissioner/Collector/DM Member Secretary
B. State Level Review and Advisory Committee
i. Chief Minister Chairman
ii. Minister of Agriculture Vice Chairman
iii. Ministers Incharge of Finance, Agriculture, Horticulture,
Animal Husbandry & Dairying, Fishery Development,
Agricultural Marketing & Cooperation, Food/ Agro-Processing,
Sugar, Sericulture, Energy, Welfare, Social Welfare, Women &
Child Development
Members
iv. All Members of Parliament (Lok Sabha and Rajya Sabha) Members
v. Chief Secretary Member
vi. Addl Chief Secretary/Development Commissioner / Agriculture
Production Commissioner (APC)
Member
vii. Principal Secretaries/Secretaries- Incharge of Finance, Revenue
and Disaster Management, Agriculture, Horticulture, Animal
Husbandry & Dairy, Fisheries Department, Agriculture
Marketing, Cooperation, Sugar, Sericulture, Energy, Welfare,
Social Welfare, Women& Child Development
Members
viii. Convener, State Level Bankers Committee Member
ix. Chief General Manager, NABARD Member
x. One Vice Chancellor each representing Agriculture,
Horticulture, Animal Husbandry, Dairy and Fisheries
(nominated by the State Government as per availability)
Members
xi. Two Representatives from State Level Farmers’ Associations Members
xii. Director/Project Director, ICAR - Regional Member
xiii. Two progressive farmers recommended by Director/Project
Director, ICAR - Regional
Members
xiv. Two Women representatives working in the domain of welfare
in the State
Members
xv. Development Commissioner/Agriculture Production
Commissioner/Principal Secretary (Agriculture) (to be decided
by the State Government
Member Secretary
Doubling Farmers’ Income – Volume XIII
Structural Reforms and Governance Framework
90
Interval of Meetings
Both the District level and State Level Committees may conduct meetings at least three times
in a year i.e. in the months of January, May and September. State Level Committee meeting
may follow the District Level Committee meetings, so as to benefit from the data, information
and recommendations of the District Level Committees. The State Governments may also
make necessary changes to the suggested composition of the Committee at both District and
State Levels, as felt necessary.
Agenda for Review:
a. Growth and Development
i. Physical and financial progress under various schemes of Agriculture, Horticulture,
Animal Husbandry & Dairy, Sericulture and Fishery Development – central sector
programmes, centrally sponsored and state programmes, etc.
ii. Physical and financial progress under externally aided projects, special-projects,
missions etc. relating to Agriculture, Animal Husbandry and Dairy, Fishery
Development, Sericulture.
iii. Convergence of resources for development of agriculture and allied sectors (funds
available under Rural Development and Panchayati Raj, Tribal Welfare and
Development, Water Resources, RKVY, RIDF, Special Projects etc.)
iv. Weather and crop situation.
v. Promotion of integrated farming, organic farming, rainfed agriculture, rainfed
horticulture, agro-forestry etc.
vi. Status of reservoirs and availability of water for irrigation for agriculture.
vii. Status of Farmers Produce Organisations (FPOs) etc. to promote efficiency in input
and output management.
viii. Promotion of ancillary enterprises like bee keeping, mushroom cultivation, poultry
etc.
b. Input management
ix. Review of various inputs (seeds, fertilizers and pesticides) with respect to
availability, access, quality and enforcement.
x. Institutional credit – cooperatives and commercial banks, JLGs.
xi. Farm mechanization (since labour substitution is important to achieve cost
efficiency and timelines in operation).
c. Marketing
xii. Procurement operations – FCI, NAFED, States Procurement Agencies, CCI, Milk
Cooperatives etc. Interventions in cases where commodity prices fall below MSP.
xiii. Marketing operations – APMCs, Direct Sale, National Agriculture Marketing.
xiv. Payment of sale proceeds by sugar factories to the sugarcane growers.
Doubling Farmers’ Income – Volume XIII
Structural Reforms and Governance Framework
91
d. Welfare
xv. xv. Coverage under Crop Insurance – PMFBY, WBCIS and UIP. Payment position
w. r. t. claims.
xvi. Status of coverage of farmers and their families under a bouquet of welfare
activities including PDS, Pension, Health Insurance, ICDS, Mid-Day Meal Scheme
etc. operated by both Central and State Governments.
xvii. Cases of farmers’ suicides, if any and other vulnerabilities among farmers and
relief/compensation offered & steps taken to prevent eventualities.
e. Relief measure
xviii. Activities under NDRF/SDRF releases and relief measures undertaken.
f. Governance
xix. Adoption of Direct Benefit Transfer (DBT) in delivery of services related to
agriculture and allied sectors.
g. Any other issue that is relevant to welfare of the farmers and growth of agriculture
sector.
Based on the illustrative list of agenda as above, the State may like to adopt an agenda
appropriate to their situation. While the District Level Committees should focus on
implementation, state level committee may like to focus on providing policy, coordination and
budgetary support.
C. National Level Policy and Planning Committee
The suggested composition of this Committee is as follows:
Minister Agriculture and Farmers’ Welfare - Chairman
Minister Rural Development and Panchayati Raj - Member
Minister Food and Consumer Affairs - Member
Minister Water Resources - Member
Minister Commerce - Member
Minister Food Processing - Member
Minister Forest, Environment and Ecology - Member
Minister MSME - Member
MoS in charge of DACFW - Member
MoS in charge of DAHDF - Member
MoS in charge of DARE - Member
The Committee should also have on board all the Secretaries of the above mentioned ministries
/ departments and Additional Secretary in charge of Policy and Farmers’ Welfare / DFI in the
DACFW may serve as the member-convener. The chairman may however include or co-opt
anyone else including experts as members.
Doubling Farmers’ Income – Volume XIII
Structural Reforms and Governance Framework
92
The broad terms of reference for the Committee are suggested below:
i. Review of production plan, progress and status for the DFI period and the year.
ii. Review policy framework including trade regime to achieve comprehensive reforms
and liberalization.
iii. Review status of money-pool from budgetary allocations & extra-budgetary allocations
at individual ministry / department level and collective level (based on delineation ‘for’
agriculture related activities).
iv. Review and promote coordination among all concerned ministries & departments and
institutions thereunder.
v. Review and facilitate convergence of resources from government, private and CSR
(Corporate Social Responsibility) sources and recommend conducive policy framework
for accelerating the pace of capital formation in agriculture
vi. Review the growth of GVA in agriculture, status of targeted income growth of farmers
and their welfare at large.
The ICAR-NIAP (National Institute of Agricultural Economics and Policy Research), New
Delhi which has been identified as the Knowledge Partner by DACFW in preparing the DFI
strategy may provide the technical backstopping to this body. The Committee may meet at least
twice year, just before the annual Kharif and Rabi conferences, so that the states and UTs are
provided inputs on national goals and implementation strategy apart from policy framework.
It is also important to use the well-established system of Kharif and Rabi conference to develop
greater synergy in planning and implementation between the Centre and the States/UTs.
However, the Conference outcomes can be made more comprehensive, relevant and
meaningful if all the departments that handle various agricultural sub-sectors at the state and
UT levels are invited. Today it is mostly centred around State Agriculture Departments, that
have their mandated crops limited to cereals, pulses, oilseeds and commercial crops like
sugarcane, cotton & jute. It is important to integrate all other state departments including
horticulture, animal husbandry, fishery, sericulture, marketing and cooperation.
Four–tier arrangement for effective implementation
Following and in harmony with the decisions of the three-tier institutional mechanism as
discussed in the preceding section, a robust system for ensuring effective coordination in
implementation is necessary at all appropriate levels. The following system is suggested:
National level: Agricultural Development and Farmers Welfare Group.
The system of domain-dedicated “Group of Secretaries (GoS)” introduced over the last 3 years
has proved to be very effective in breaking thought barriers and mainstreaming annual strategic
interventions. This system can be institutionalised with following composition.
Secretary DACFW - Chairman
Secretaries of DAHDF, DARE, RD, PR, WoRD, - Member
Doubling Farmers’ Income – Volume XIII
Structural Reforms and Governance Framework
93
Fertilizer, Food, Consumer Affairs and Commerce
Joint Secretary in charge of Policy and FW in DACFW - Member-Secretary
The Chairman may be authorised to co-opt or invite heads of various organisations, experts
and officers of member departments to participate in the meetings.
The broad terms of reference of the Group are suggested below:
i. To finalize and review national plan for production and income for the DFI period and
the year.
ii. To effect convergence of institutions & manpower and promote harmony of
approaches & interventions.
iii. To review, monitor and guide the progress as per goals and objectives.
The Committee may meet at least once in a quarter and more as decided by the members.
At the State Level: Agricultural Development and Farmers’ Welfare Group
The Group can be chaired by the Development Commissioner / Agricultural Production
Commissioner of the State. The composition of the Committee can be on lines similar to the
suggested national committee. The vice chancellors of the State Agricultural Universities
(SAUs) may be taken as regular members, while keeping open the option of co-opting and
inviting anyone else as needed.
At the District and Block Levels
ATMA (Agricultural Technology and Management Agency) can serve the purpose of
preparing “Comprehensive District Plan (CDP) based on “Block Action Plans (BAPs)”.
ATMA should work in close coordination with the proposed “District Agri-Value System
Platform” (Volume-IV of DFI Report), so as to couple production and post-production plans
in a seamless way. Both district and block level action plans should be market-led, so that the
farmers are enabled to grow what can sell in the market and what can fetch relatively higher
market price for their produce.
Another important aspect of effective delivery is to ensure that the multiple sub-sectors of the
larger agricultural sector are given due emphasis and the approach is to priorities those sub-
sectors that (i) possesses high growth potential; (ii) bear low hanging fruits; and (iii) engage
larger section of the agricultural society.
As observed by the DFI Committee in this Report, farm income has to be buttressed with non-
farm income. Therefore, the action plans should examine and adopt ways of using the natural
resources generated on farm and in the common properties like forests, waste lands, fodder
reserves, water bodies, etc. for promoting enterprise. Also, in the larger interest of the
agricultural sector, the interests of the landless agricultural labour should also be addressed and
catered to through the Block and District Action Plans as far as possible.
Doubling Farmers’ Income – Volume XIII
Structural Reforms and Governance Framework
94
It is also necessary for the District Committee to achieve harmony any synergy among different
plans that are prepared. Some of these include:
SREP (Strategic Research Extension Plan) of ATMA
C-DAP (Comprehensive District Action Plan) of RKVY – RAFTAR
(DIP) District Irrigation Plan of PMKSY.
NICRA (National Initiative of Climate Resilient Agriculture) of ICAR
Comprehensive Drought Proofing District Action Plans of NRAA (National Rainfed
Area Authority).
Agri-Value System Platform (proposed in Volume-IV of this Report)
All these plans should respect the bottom-up approach, beginning with village and block level
action plans.
The District Level Committee should be guided by the following:
i. Convergence of different action plan to achieve commonality of objectives.
ii. Resource plan for optimization of all resources available across the government
departments and in other sectors – NGOs, private, CSR etc.
iii. Manpower plan to achieve optimal deployment through coordination of efforts.
iv. Technology plan – directly relating to agricultural activities and ICT.
Agricultural Dispute Resolution Authority
The government may consider an authority for agricultural dispute resolution. This proposed
Authority would serve as a fast track redressal mechanism for matters such as disagreements
relating to crop insurance, land leasing, contract farming, and other implementation issues. This
will offer an alternative to disputes in various areas that effect the farmers’ economic activities.
The Authority could be omnibus and quasi-judicial, and hence do away with the need for
individual authorities for agricultural matters like contract farming, land lease, etc.
Key Extracts
The existing planning and review mechanism needs to be strengthened with an
institutional arrangement that includes both the state and central machinery.
A three-tier planning, review and monitoring Committee is recommended at District
level, State level and National level.
A four-tier arrangement for coordination and convergence in implementation is
recommended, which includes Block level to include a bottom-up approach.
Establish an omnibus agricultural authority to resolve disputes relating to contract
farming, land lease, crop insurance and other implementation disputes.
Doubling Farmers’ Income – Volume XIII
Structural Reforms and Governance Framework
95
Grassroots Level Participation
All technologies, policies, advocacies, schemes, programmes and missions are meant to reach the farm
and co-opt farmer in the process of change. What therefore marks the efficiency and effectiveness of
the agricultural delivery is the strength of the cutting edge system at the farm level
As Strong as the Weakest
As put concisely by Leibig in his “Law of the Minimum”, the strength of a chain is the strength
of its weakest link. It holds good in governance, administration and management relating to
agriculture sector too. Take the case of average yields across various crops and sectors in India.
The high global ranking of India in terms of volumes of production is more a function of area
or number (e.g. of bovines). However in terms of productivity, there is so much to catch up.
The average gap between the FLD (farm level demonstration) and farmer field level yields
varies from 28 to 63 per cent depending upon the crop. If one measures the farm yield against
the research plot claim, the scene only worsens. This illustrates, that notwithstanding the high
yield potential of a variety at the research station, most of it does not manifest at the farmer’s
field level on account of several reasons, and therefore in this case, it is the farm and farmer
who constitute the weakest link. In the final analysis, the strength / potential of the ‘variety’ is
equivalent to that of the farm and farmer.
The delivery pipeline should therefore focus on identifying various constraints and challenges,
which if surmounted will enhance the capacity of the weakest link and improve the efficiency
of the delivery system. The challenge as identified and elaborated in the preceding volumes
can be categorised under: technology, manpower, material, finance, knowledge and human
resource. The most sensitive and critical of all these is the ‘end-user’ the farmer. Hence, intense
involvement of the farmer in the process of decision making and implementation can enhance
the capacity of the weakest link.
In the opinion of the DFI Committee, the farmer also needs to be reoriented and capacitated in
respect of the following:
Awareness, knowledge and skill
Openness to new ideas and technology
Perception of agriculture as an enterprise – transition from subsistence (production-
dominant) to commercial (market-centric) practice
Willingness to join interest groups like FPO, value chain platform, FLG, cluster etc.
The government’s public extension system (PES) in particular has to make this transformation
its mission. The corollary is that the PES itself has in the first place undergone a basic shift in
its orientation, skill and commitment. It calls, therefore, for a total overhaul of the extension
machinery as examined and suggested in Volume-XI of this Report.
Doubling Farmers’ Income – Volume XIII
Structural Reforms and Governance Framework
96
Co-opting the Farmers
It is a common complaint of the farming community, that they are not adequately represented
in making decisions that concern their interests.
At the macro-level, it is presumed that the elected representatives of the people (of whom
farmers are a dominant sub-section) represent the farmers’ interests. There is no denying, that
they do, as is manifested in several legislations at parliamentary and state assembly levels.
Thanks to 73rd Constitutional Amendment, the decentralised democracy has taken decision
making process closer to the farmers through the system of Panchayat Raj Institutions (PRIs).
In fact, these PRIs at the district (Zilla Parishad), taluk / block (Taluk / Panchayat Samiti) and
village (Gram Panchayat) levels are closely and intensely engaged in agriculture related
decision making, more specifically with reference to implementation.
There are also state / national level Boards, Cooperatives and Corporations, that have places
reserved for those representing interests of the farmers.
Then there are Gram Sabhas, Watershed Committees, Forest Management Committees, Milk
Societies, PACSs (Primary Agriculture Cooperative Societies), APMCs (Agricultural Produce
Marketing Committees), WAUs (Water User Associations) and the like which are further
decentralised institutions, that operate right at the cutting edge operation & maintenance.
There are innumerable other non-formal or more correctly voluntary-in-nature based grass-root
level bodies. Some such examples are SHGs (Self Help Groups), JLGs (Joint Liability Groups),
Commodity Interest Groups (CIGs), FPOs (Farmer Producer Organisations – both cooperatives
and companies), etc.
Not to forget are the pressure groups of farmers. These are mostly the farmers associations with
varying degree of ability to influence decision making at government level, besides creating an
opinion in the society.
Despite these plethora of formal and informal institutions, organisations and platforms, a large
majority of the farmers feel that they are not well represented in decision making and that their
interests are not well protected. The challenge therefore lies in evolving systems that will
facilitate wider and more genuine participation from all type of farmers.
Gram Panchayats as delivery institutions
Gram Panchayats (GPs) are the lowest level, decentralised and integrated developmental
institutions headed by peoples’ representatives, and supported by field level bureaucracy.
Hence, they constitute the most appropriate centres for dovetailing developmental and welfare
programmes. Since the 73rd Constitutional Amendment, these centres are getting consolidated,
capable of shouldering multifarious responsibilities. Rural development activities, including
wage employment initiatives under MGNREGA are channelled through GPs. Agriculture
Doubling Farmers’ Income – Volume XIII
Structural Reforms and Governance Framework
97
sector is the basic and most expansive development intervention that relates to the majority of
the rural society.
It is, therefore, both appropriate and important to make GPs responsible for agricultural
development encompassing planning and execution. The village level action plan should be
prepared at GP level and integrated into Block Action Plan (BAP).
It is possible to make GPs robust and active Centres of Agricultural Planning and Execution.
Convergence of resources, manpower and efforts is possible. The major advantage is the
critical partnership between elected representatives & field officials, who together can interface
with the farmers meaningfully. With use of IT and ICT, the GPs can become more effective in
service as the fulcrum of two way communication between farmers and higher levels (Block
and District units).
Gram Panchayats can serve as single window centres for delivery of extension services. The
experience of Karnataka in the form of Ryotu Sampark Kendras (RSKs) is encouraging. At
these places, the Extension Officers of various departments of agriculture, horticulture, animal
husbandry etc. besides experts from SAUs meet at fortnightly interval and offer single window
service to the farmer. These Centres also cater to input demand including seeds, etc.
Gram Panchayats as Centres of welfare
Farmers’ welfare deserves special emphasis. In relation to this, the care of both land owing /
cultivating farmers and landless agricultural workers should become the mandate of Gram
Panchayats (GPs). In discussing the governance framework, some of the critical welfare
responsibilities of the GPs can be as follows:
i. Coverage under welfare schemes – these include old age pension (OAP),
widow pension (WP), public distribution system (PDS), crop and livestock
insurance, girl-child benefits, ICDS, etc.
ii. Counselling for stress management – risk and unpredictability associated
with agriculture result in precipitate livelihood situations for the farmers. Economic
stress gets mixed with social pressures for the farmers living in a close knit rural
environment. Unlike in urban centres, where anomy provides a dubious seclusion for
a family under stress, it works reverse in rural society, where nothing can be hidden.
The farmers in such circumstances who stand exposed are highly vulnerable. They
need counselling to bring them to see reason and attain homeostasis (inner balance).
The Gram Panchayats are the most appropriate is donning the role of a counselling
Centre. These centres can become substitute for the traditional social support system,
which ironically is increasingly becoming scarce in villages, while not preventing the
exposure of real or perceived ignominy, say for example of indebtedness.
Doubling Farmers’ Income – Volume XIII
Structural Reforms and Governance Framework
98
iii. Guidance for transition management – migration to urban and industrial
centres will always exist. The migrants take time to rehabilitate themselves in the
new setting and also face challenges of acclimatisation. It may be useful to handhold
such migration at GP level. Some basic support includes documenting and
maintaining their new address, offering them skill for professional engagement and
social skills for acclimatisation.
The skill imparted can be useful to take to a small enterprise in the village itself or
enable him to seek a skilled job in the place of migration. More importantly, the GPs.
should be able to provide social security to the family members staying back in the
village. This assumes critical importance, when migration is under distress and the
state of indigence of women, aged and children left behind requires sensitive &
timely support through available welfare activities.
iv. Maintenance of farmers’ database - centralised database of farmers needs to
be maintained. As also discussed vide para 3.2 of chapter 3 of this Volume,
inclusiveness of farmers warrants norm based definition of a farmer. Further, the
database should contain minimum data of all the family members including names,
age, gender, education, farm size, other assets (livestock etc.), non-farm sources of
income, total income, welfare coverage, etc. The database will be used for monitoring
income and welfare of individual farm families.
This facility for continuous updation of farmer database can be assigned to the Gram
Panchayats. Maintenance of databased with changing status of each farm family can
be an important responsibility of the GPs.
Direct participation of farmers
With increasing awareness and negotiation skills, the farmers, and the youth in particular are
eager to participate in the decision making process. Gram Sabhas provide a good platform for
intense deliberations and decentralised decision making.
Deeper penetration of IT network and mobile usage (both smart & basic), make it possible for
virtual interaction. With deployment of portals, IVRs, skype and video-conferencing facilities,
the intensity of farmers’ participation can be deepened. It is important to take advantage of
technology, that bears the capacity to neutralise hierarchy, break down barriers, jump decision
making stages and create a friendlier & hassle free and flat & horizontal partnership.
As a resolution of the challenges of operational efficiency of small and marginal farms, FPOs
/ VPOs have been suggested in Volumes III, IV, VIII, IX and more. It is worth aiming to scale
up formation of large number of FPOs / VPOs across the multitudes of small and marginal
farmers. As a collective group, including as cooperatives, the farmers get a voice that can be
deployed effectively to be heard in decision making.
Doubling Farmers’ Income – Volume XIII
Structural Reforms and Governance Framework
99
The FPOs can further be federated at district, state and national levels based on common
interests. This will make it easy for decision making institutions from the lowest to the highest
levels to engage the farmers in a systemic manner. It is difficult to practise direct democracy
in a country with vast geography and dense demography. There is thus an added advantage of
promoting FPOs as alternatives to promote participative governance.
Key Extracts
For more inclusive grassroot level participation of farmers, Gram Panchayats can be
made responsible for agricultural development. Village level action plans should be
prepared at Gram Panchayat level.
Farmers must be facilitated to take advantage of IT network to break bottleneck of
hierarchy and to allow a more user-friendly and horizontal partnership with
government.
For decentralised decision making, the Gram Sabhas provide a platform for
deliberations that included direct participation of farmers. Such participation can be
expanded and made location agnostic through greater deployment of portals, IVR and
video conferencing facilities.
Gram Panchayats (GPs) are optimally positioned to become last mile outreach centres
for various welfare schemes, including pension, insurance, girl-child benefits, stress
counselling, etc.
GPs can be developed as Centres of agriculture planning and execution, as well as for
welfare monitoring and transition management.
FPOs in their various formats, can be federated into larger regional entities so as to
engage farmers with common interests in participative governance.

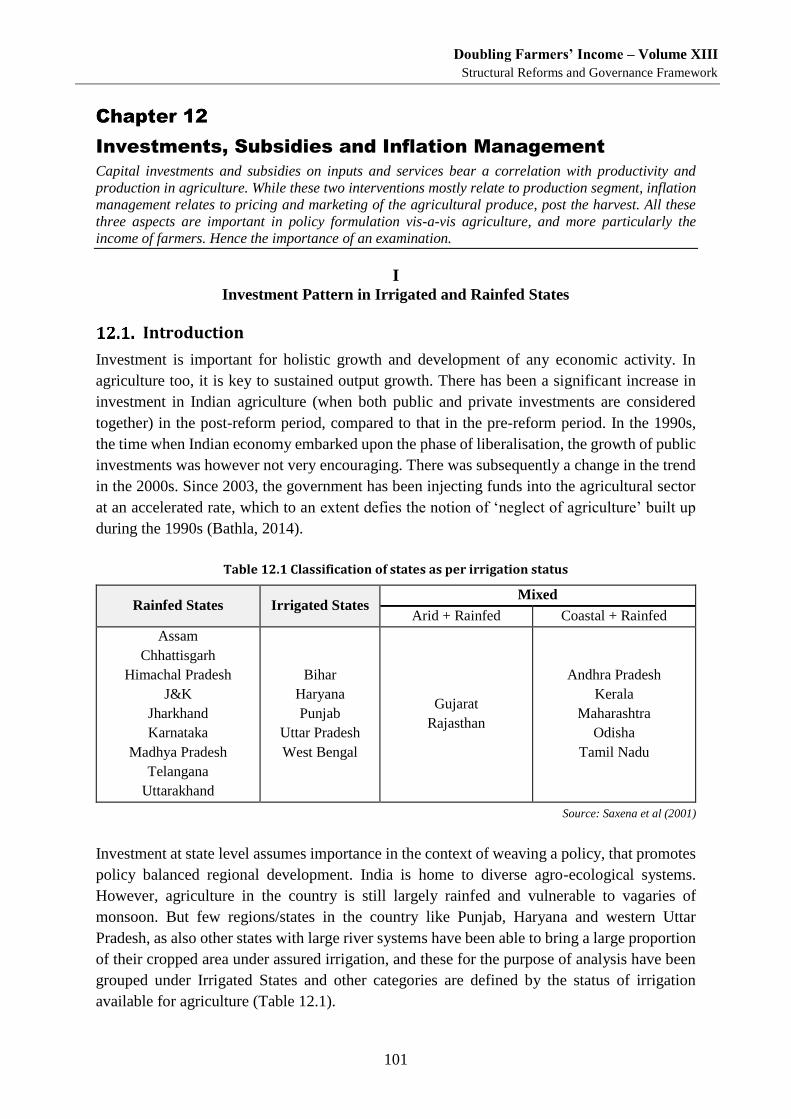
Doubling Farmers’ Income – Volume XIII
Structural Reforms and Governance Framework
101
Investments, Subsidies and Inflation Management
Capital investments and subsidies on inputs and services bear a correlation with productivity and
production in agriculture. While these two interventions mostly relate to production segment, inflation
management relates to pricing and marketing of the agricultural produce, post the harvest. All these
three aspects are important in policy formulation vis-a-vis agriculture, and more particularly the
income of farmers. Hence the importance of an examination.
I Investment Pattern in Irrigated and Rainfed States
Introduction
Investment is important for holistic growth and development of any economic activity. In
agriculture too, it is key to sustained output growth. There has been a significant increase in
investment in Indian agriculture (when both public and private investments are considered
together) in the post-reform period, compared to that in the pre-reform period. In the 1990s,
the time when Indian economy embarked upon the phase of liberalisation, the growth of public
investments was however not very encouraging. There was subsequently a change in the trend
in the 2000s. Since 2003, the government has been injecting funds into the agricultural sector
at an accelerated rate, which to an extent defies the notion of ‘neglect of agriculture’ built up
during the 1990s (Bathla, 2014).
Table 12.1 Classification of states as per irrigation status
Rainfed States Irrigated States Mixed
Arid + Rainfed Coastal + Rainfed
Assam
Chhattisgarh
Himachal Pradesh
J&K
Jharkhand
Karnataka
Madhya Pradesh
Telangana
Uttarakhand
Bihar
Haryana
Punjab
Uttar Pradesh
West Bengal
Gujarat
Rajasthan
Andhra Pradesh
Kerala
Maharashtra
Odisha
Tamil Nadu
Source: Saxena et al (2001)
Investment at state level assumes importance in the context of weaving a policy, that promotes
policy balanced regional development. India is home to diverse agro-ecological systems.
However, agriculture in the country is still largely rainfed and vulnerable to vagaries of
monsoon. But few regions/states in the country like Punjab, Haryana and western Uttar
Pradesh, as also other states with large river systems have been able to bring a large proportion
of their cropped area under assured irrigation, and these for the purpose of analysis have been
grouped under Irrigated States and other categories are defined by the status of irrigation
available for agriculture (Table 12.1).
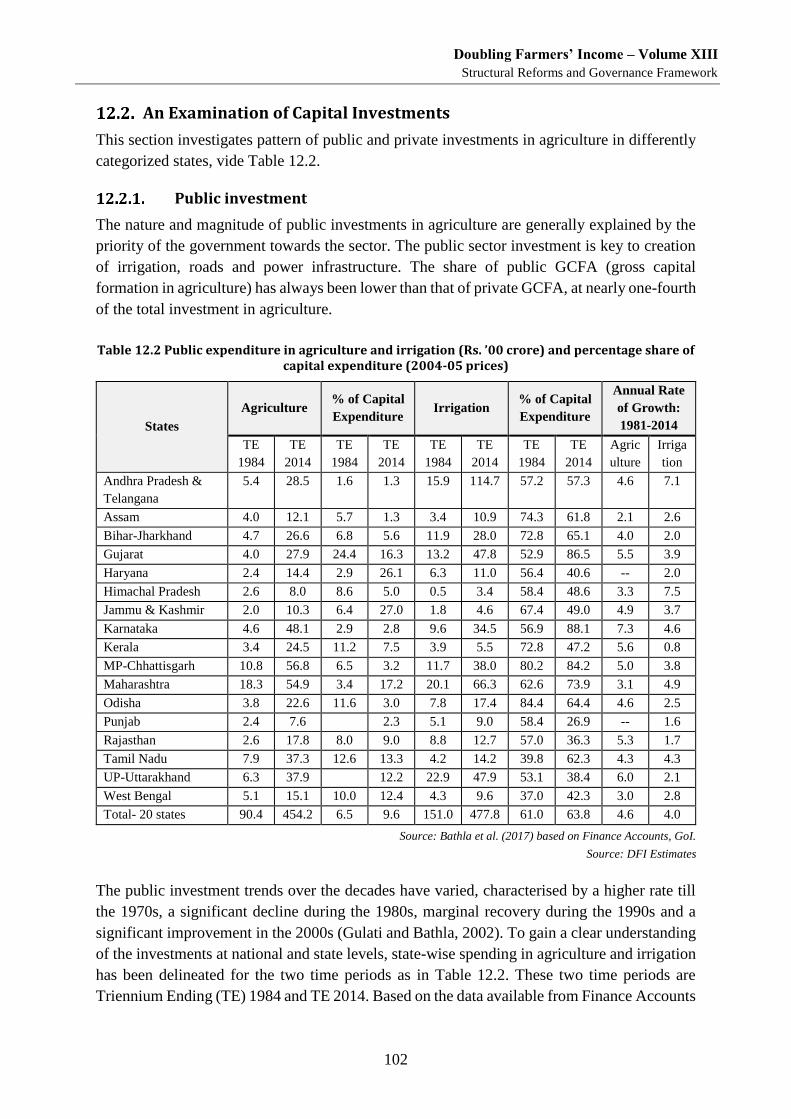
Doubling Farmers’ Income – Volume XIII
Structural Reforms and Governance Framework
102
An Examination of Capital Investments
This section investigates pattern of public and private investments in agriculture in differently
categorized states, vide Table 12.2.
Public investment
The nature and magnitude of public investments in agriculture are generally explained by the
priority of the government towards the sector. The public sector investment is key to creation
of irrigation, roads and power infrastructure. The share of public GCFA (gross capital
formation in agriculture) has always been lower than that of private GCFA, at nearly one-fourth
of the total investment in agriculture.
Table 12.2 Public expenditure in agriculture and irrigation (Rs. ’00 crore) and percentage share of capital expenditure (2004-05 prices)
States
Agriculture % of Capital
Expenditure Irrigation
% of Capital
Expenditure
Annual Rate
of Growth:
1981-2014
TE
1984
TE
2014
TE
1984
TE
2014
TE
1984
TE
2014
TE
1984
TE
2014
Agric
ulture
Irriga
tion
Andhra Pradesh &
Telangana
5.4 28.5 1.6 1.3 15.9 114.7 57.2 57.3 4.6 7.1
Assam 4.0 12.1 5.7 1.3 3.4 10.9 74.3 61.8 2.1 2.6
Bihar-Jharkhand 4.7 26.6 6.8 5.6 11.9 28.0 72.8 65.1 4.0 2.0
Gujarat 4.0 27.9 24.4 16.3 13.2 47.8 52.9 86.5 5.5 3.9
Haryana 2.4 14.4 2.9 26.1 6.3 11.0 56.4 40.6 -- 2.0
Himachal Pradesh 2.6 8.0 8.6 5.0 0.5 3.4 58.4 48.6 3.3 7.5
Jammu & Kashmir 2.0 10.3 6.4 27.0 1.8 4.6 67.4 49.0 4.9 3.7
Karnataka 4.6 48.1 2.9 2.8 9.6 34.5 56.9 88.1 7.3 4.6
Kerala 3.4 24.5 11.2 7.5 3.9 5.5 72.8 47.2 5.6 0.8
MP-Chhattisgarh 10.8 56.8 6.5 3.2 11.7 38.0 80.2 84.2 5.0 3.8
Maharashtra 18.3 54.9 3.4 17.2 20.1 66.3 62.6 73.9 3.1 4.9
Odisha 3.8 22.6 11.6 3.0 7.8 17.4 84.4 64.4 4.6 2.5
Punjab 2.4 7.6
2.3 5.1 9.0 58.4 26.9 -- 1.6
Rajasthan 2.6 17.8 8.0 9.0 8.8 12.7 57.0 36.3 5.3 1.7
Tamil Nadu 7.9 37.3 12.6 13.3 4.2 14.2 39.8 62.3 4.3 4.3
UP-Uttarakhand 6.3 37.9
12.2 22.9 47.9 53.1 38.4 6.0 2.1
West Bengal 5.1 15.1 10.0 12.4 4.3 9.6 37.0 42.3 3.0 2.8
Total- 20 states 90.4 454.2 6.5 9.6 151.0 477.8 61.0 63.8 4.6 4.0
Source: Bathla et al. (2017) based on Finance Accounts, GoI.
Source: DFI Estimates
The public investment trends over the decades have varied, characterised by a higher rate till
the 1970s, a significant decline during the 1980s, marginal recovery during the 1990s and a
significant improvement in the 2000s (Gulati and Bathla, 2002). To gain a clear understanding
of the investments at national and state levels, state-wise spending in agriculture and irrigation
has been delineated for the two time periods as in Table 12.2. These two time periods are
Triennium Ending (TE) 1984 and TE 2014. Based on the data available from Finance Accounts
Doubling Farmers’ Income – Volume XIII
Structural Reforms and Governance Framework
103
of Government of India, the analysis has been made for 20 major states. In case of states, which
have undergone division, names of the reorganised states have been indicated in the Table.
The data in Table 12.2 above highlights existence of large variations among states as regards
the share of agriculture in capital expenditure. It declined in most of the states in Triennium
Ending (TE) 2014 from the previous considered period, but there was a marked increase in
case of Haryana, J&K and Maharashtra. Further, there was a marginal increase in the states of
Tamil Nadu and West Bengal. For the 20 states as a whole, the share of agriculture as a
percentage of capital expenditure increased from 6.5 (TE 1984) to 9.6 (TE 2014). The
investment in irrigation accentuated in few states like Gujarat, Karnataka, Madhya Pradesh,
Maharashtra, Tamil Nadu and West Bengal. In respect of other states, it declined. However, all
the 20 states taken together, there was an increase in irrigation investment as a percentage of
capital expenditure. It rose from 61 per cent (TE 1984) to 63.8 per cent (TE 2014).
Table 12.3 Public expenditure per hectare (Rs.) at 2004-05 prices
State Agricultural R&D/Ha Irrigation/ha
TE 1984 TE 2014 TE 1984 TE 2014
Andhra Pradesh-Telangana 164 1838 1376 10106
Assam 573.7 2183 686 2128
Bihar-Jharkhand 239.9 2432 1347 3071
Gujarat 191.2 1620 1332 4561
Haryana 285.5 1281 1481 2910
Himachal Pradesh 2043 5351 803 5626
J&K 780 4969 1959 4646
Karnataka 160.6 1770 920 3646
Kerala 705.7 4398 1600 2193
MP-Chhattisgarh 137.6 762 615 1891
Maharashtra 210.8 1560 1093 3790
Odisha 259.9 2301 1222 3719
Punjab 317.6 1049 1082 1868
Rajasthan 61.4 532 553 713.8
Tamil Nadu 571.6 4341 729 2150
UP-Uttarakhand 182 1195 1265 2537
West Bengal 297.3 1264 596 1037
Total (20 States) 222.4 1532 1012 3206
Source: Based on Finance Accounts and Bathla, Joshi and Kumar (2017).
Note: TE indicates triennium ending
Given the large variations in the size of states and also population in each, it would be more
pertinent to assess the expenditure on these services on a per unit basis. There are large inter-
state variations in agricultural R&D spends with the highest being Rs. 4,968 per hectare in
J&K, and the lowest at Rs. 531 per hectare in Rajasthan (Table 12.3). During TE 2014, in
respect of Andhra Pradesh, it was the state of Andhra Pradesh that spent the maximum amount
Doubling Farmers’ Income – Volume XIII
Structural Reforms and Governance Framework
104
(Rs. 10,105 per hectare) while Rajasthan, spent the least at Rs. 714 per ha. It is seen that the
developed states relatively spent more on roads, rural energy, education and health, which
stems from their higher spending power linked to higher economic growth.
Private investment
The private investment comprises investments by household sector as well as the corporate
sector. So far, the major share of investment is accounted for by the household sector and the
score in case of corporate sector as a percentage of private sector investments is as low as 2-3.
While public sector investment has been a primary contributor to capital formation in
agriculture through creating irrigation, roads and power infrastructure, the role of private sector
is important too and its role is gaining recognition in moving the agriculture to next stage of
development.
Table 12.4 furnishes state-wise fixed capital expenditure in farm business (FCEFB -
synonymous with private investment in agriculture and allied activities) per rural household at
2004-05 prices over the period. Three states, viz., Haryana, Bihar and Tamil Nadu experienced
a significant decline in the share of investment in agriculture in gross investment. This also
points to an increasing expenditure on residential land or other investments by the rural
households, which may have been undertaken at the expense of farm investments.
Table 12.4 State-wise private investments per rural household (Rs.) at 2004-05 Prices
Type States
1981-82 1991-92 2002-03 2012-13
FCEFB FCEFB/
GCE FCEFB
FCEFB/
GCE FCEFB
FCEFB/
GCE FCEFB
FCEFB/
GCE
Irrigated Bihar 186 9.82 142 15.68 73 6.53 172 6
Haryana 2029 27.73 1429 10.93 2646 18.75 2593 10.75
Punjab 3245 36.19 1940 29.14 2091 23.21 4720 37.49
Uttar Pradesh 769 18.86 703 17.05 831 19.63 2253 29.82
West Bengal 232 10.31 194 9.73 119 3.87 263 4.15
Rainfed Assam 248 13.84 80 6.37 119 10.65 303 14.86
Himachal
Pradesh
496 12.29 783 11.72 1228 6.63 3412 19.01
J & K 538 7.62 520 14.17 711 9.13 1475 9.69
Karnataka 1045 19.19 1902 38.67 586 17.43 2430 19.09
Madhya
Pradesh
664 22.02 1589 40.1 353 18.73 3019 40.63
Telangana -- -- -- -- -- -- 1013 14.6
Jharkhand -- -- -- -- 76 6.53 300 8.59
Chhattisgarh -- -- -- -- 272 12.49 1685 26.68
Uttarakhand -- -- -- -- 1170 21.76 1451 23.19
Arid+
Rainfed
Gujarat 1405 39.08 781 23.37 1220 29.56 3163 38.93
Rajasthan 1134 23.42 1677 33.83 1605 23.25 3442 23.59
Doubling Farmers’ Income – Volume XIII
Structural Reforms and Governance Framework
105
Type States
1981-82 1991-92 2002-03 2012-13
FCEFB FCEFB/
GCE FCEFB
FCEFB/
GCE FCEFB
FCEFB/
GCE FCEFB
FCEFB/
GCE
Coastal+
Rainfed
Andhra
Pradesh
687 20.3 533 21.55 484 16.12 1287 17.25
Kerala 686 8 658 7.73 703 5.09 2188 7.16
Maharashtra 1129 28.95 1367 31.51 1015 22.46 2674 26
Odisha 181 8.42 134 7.42 327 10.81 350 11.16
Tamil Nadu 634 20.63 791 20.51 620 11.89 626 5.21
Note: GCE-Gross capital expenditure Source: DFI Committee Estimates
Figure 12.1 presents the annual rate of growth in private investments during the different
periods of 1981-91, 1991-2002, and 2002-12. With a few exceptions, most of the states
recorded negative rates of growth in private investment during the 1980s and 1990s. This
confirms a deceleration in its growth reported at the national level, followed by revival during
the subsequent decade i.e. 2002-12. The impressive investment in the states of Madhya Pradesh
in agriculture during the recent period (2002-12) coincides with the much applauded record
growth rate of agricultural sector in the state. It demonstrates the correlation between capital
investment in agriculture and growth rate.
With exception of few states like Odisha and Tamil Nadu, massive public investments in
irrigation, provision of input subsidies, favourable terms of trade, and increased flow of credit
seem to have pushed up private investments in almost all the states, where agriculture is mostly
rainfed and heavily monsoon dependent.
Figure 12.1 Annual rate of growth in private investment per rural households at 2004-05 prices
Source: DFI Committee Estimates
-15
-10
-5
0
5
10
15
20
1981-91 1991-2002 2002-2012
Doubling Farmers’ Income – Volume XIII
Structural Reforms and Governance Framework
106
The composition of private investments in agriculture sector shows, that in majority of the
states, investment has primarily happened in livestock and farm machinery & transport
segments (Table 12.5). However, it is noteworthy here that few states where farming is mainly
rainfed, a significant proportion of the investment has been channelized into irrigation. Further,
it is seen that farmers in the hilly regions tend to spend less on irrigation structures and more
on land improvement. This is understandable considering the topography of the region.
Table 12.5 State-wise percentage share of components of private investment in rural households, 2012-13
Type States
Land
Improve
-ment
Orcha
rds
Irriga
tion
Farm
machinery &
transport
Farm
Buildings Others Livestock
Irrigated Bihar 0.15 17.04 5.5 36.15 9.61 3.18 28.37
Haryana 3.26 0 22.99 43.61 0.74 0.11 29.29
Punjab 3.04 0 10.2 63.86 1.21 0.82 20.87
Uttar Pradesh 2.31 0.15 3.26 73.37 0.84 0.28 19.8
West Bengal 1.06 1.91 4.99 41.85 12.32 0.46 37.41
Rainfed Assam 3.35 3.19 8.9 40.3 20.38 1.92 21.96
Himachal
Pradesh
17.02 4.42 32.56 6.07 23.28 0.09 16.56
J & K 3.99 16.27 0.41 13.54 2.33 0.18 63.27
Karnataka 10.5 0.01 46.09 17.74 1 0.31 24.35
Madhya
Pradesh
13.84 0.05 33.01 31.87 0.73 4.24 16.26
Telangana 8.98 0.05 33.43 21.76 2.78 0.06 32.94
Jharkhand 2.96 3.55 9.34 40.47 18.24 3.26 22.18
Chhattisgarh 2.15 1.35 3.42 70.73 1.46 0.48 20.41
Uttarakhand 20.45 1.01 4.9 19.75 2.62 13.29 37.97
Coastal+
Rainfed
Andhra
Pradesh
10.61 0.08 9.59 27.53 4.58 0.02 47.6
Kerala 4.38 3.33 12.24 60.69 1.56 5.59 12.2
Maharashtra 17.39 5.17 33.73 21.09 2.68 1.3 18.65
Odisha 19.5 0.41 20.07 27.02 11.74 1.71 19.55
Tamil Nadu 5.54 0.8 47.78 17.94 16.8 1.03 10.11
Arid+
Rainfed
Gujarat 9.33 0.18 23.64 36.54 6.15 1.08 23.09
Rajasthan 5.37 0.46 30.16 25.46 5.98 0.46 32.11
Source: DFI Committee Estimates
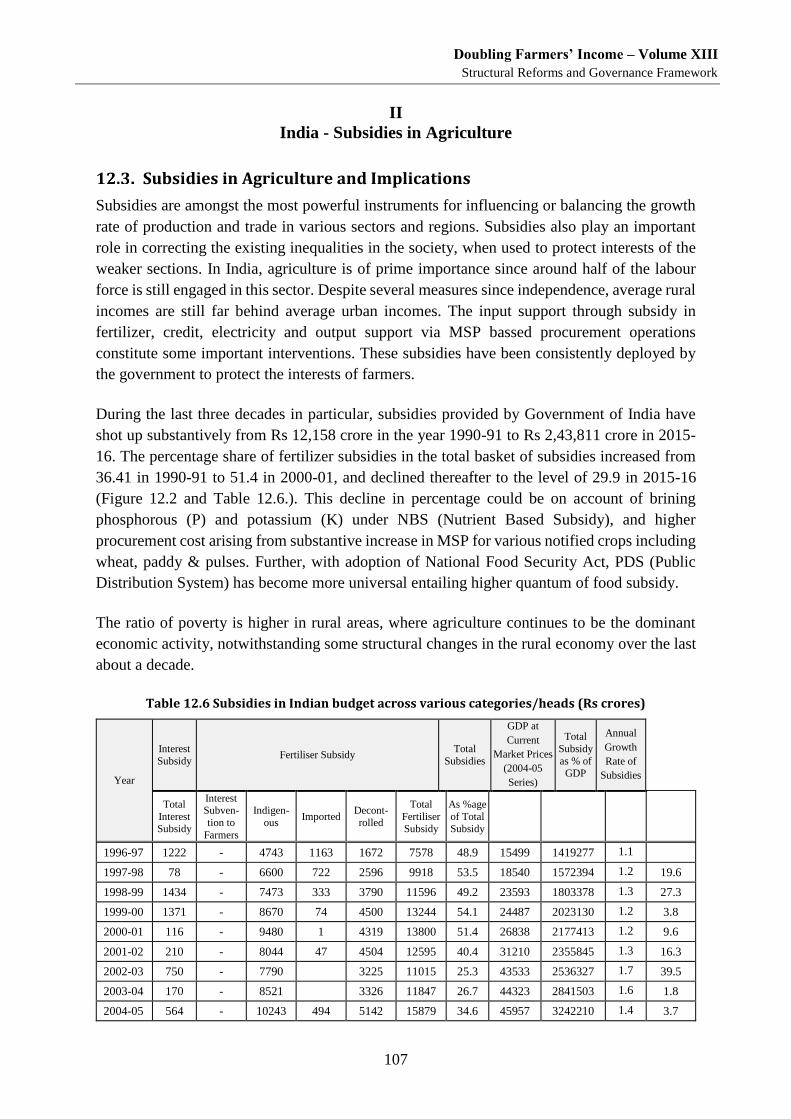
Doubling Farmers’ Income – Volume XIII
Structural Reforms and Governance Framework
107
II
India - Subsidies in Agriculture
Subsidies in Agriculture and Implications
Subsidies are amongst the most powerful instruments for influencing or balancing the growth
rate of production and trade in various sectors and regions. Subsidies also play an important
role in correcting the existing inequalities in the society, when used to protect interests of the
weaker sections. In India, agriculture is of prime importance since around half of the labour
force is still engaged in this sector. Despite several measures since independence, average rural
incomes are still far behind average urban incomes. The input support through subsidy in
fertilizer, credit, electricity and output support via MSP bassed procurement operations
constitute some important interventions. These subsidies have been consistently deployed by
the government to protect the interests of farmers.
During the last three decades in particular, subsidies provided by Government of India have
shot up substantively from Rs 12,158 crore in the year 1990-91 to Rs 2,43,811 crore in 2015-
16. The percentage share of fertilizer subsidies in the total basket of subsidies increased from
36.41 in 1990-91 to 51.4 in 2000-01, and declined thereafter to the level of 29.9 in 2015-16
(Figure 12.2 and Table 12.6.). This decline in percentage could be on account of brining
phosphorous (P) and potassium (K) under NBS (Nutrient Based Subsidy), and higher
procurement cost arising from substantive increase in MSP for various notified crops including
wheat, paddy & pulses. Further, with adoption of National Food Security Act, PDS (Public
Distribution System) has become more universal entailing higher quantum of food subsidy.
The ratio of poverty is higher in rural areas, where agriculture continues to be the dominant
economic activity, notwithstanding some structural changes in the rural economy over the last
about a decade.
Table 12.6 Subsidies in Indian budget across various categories/heads (Rs crores)
Year
Interest
Subsidy Fertiliser Subsidy
Total
Subsidies
GDP at
Current
Market Prices
(2004-05
Series)
Total
Subsidy
as % of GDP
Annual
Growth
Rate of
Subsidies
Total
Interest
Subsidy
Interest Subven-
tion to
Farmers
Indigen-
ous Imported
Decont-
rolled
Total
Fertiliser
Subsidy
As %age
of Total
Subsidy
1996-97 1222 - 4743 1163 1672 7578 48.9 15499 1419277 1.1
1997-98 78 - 6600 722 2596 9918 53.5 18540 1572394 1.2 19.6
1998-99 1434 - 7473 333 3790 11596 49.2 23593 1803378 1.3 27.3
1999-00 1371 - 8670 74 4500 13244 54.1 24487 2023130 1.2 3.8
2000-01 116 - 9480 1 4319 13800 51.4 26838 2177413 1.2 9.6
2001-02 210 - 8044 47 4504 12595 40.4 31210 2355845 1.3 16.3
2002-03 750 - 7790 3225 11015 25.3 43533 2536327 1.7 39.5
2003-04 170 - 8521 3326 11847 26.7 44323 2841503 1.6 1.8
2004-05 564 - 10243 494 5142 15879 34.6 45957 3242210 1.4 3.7
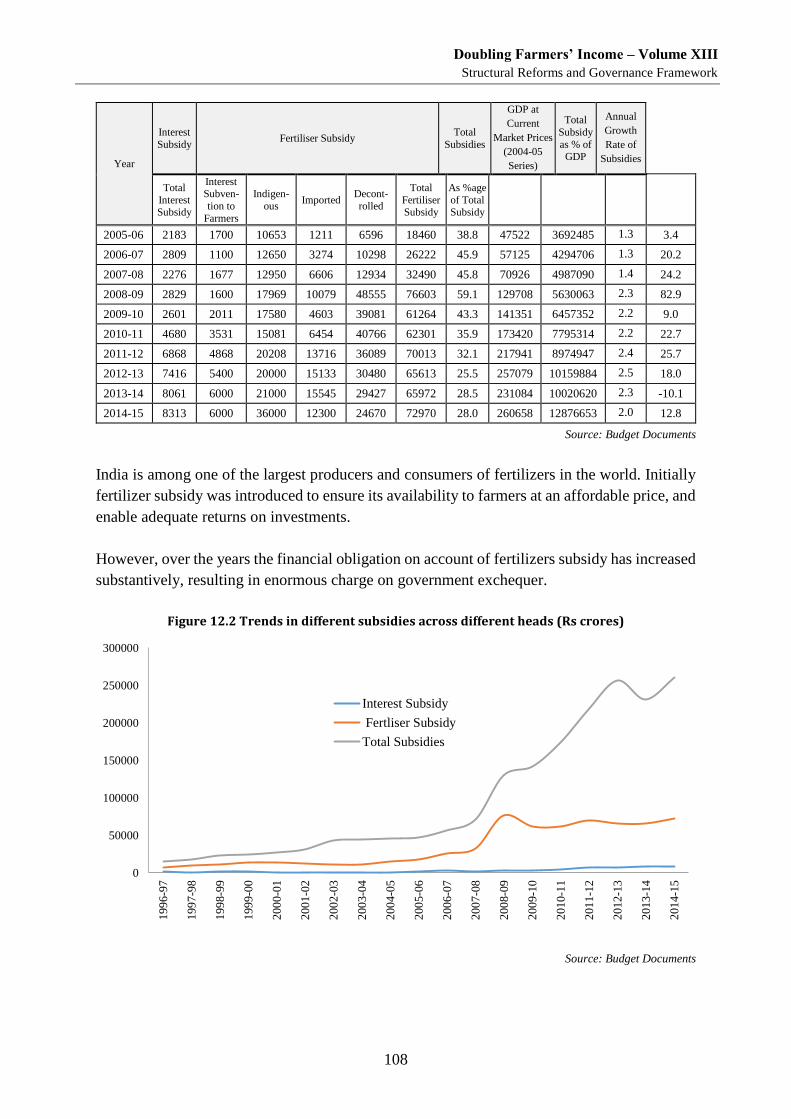
Doubling Farmers’ Income – Volume XIII
Structural Reforms and Governance Framework
108
Year
Interest
Subsidy Fertiliser Subsidy
Total
Subsidies
GDP at
Current
Market Prices
(2004-05
Series)
Total
Subsidy
as % of GDP
Annual
Growth
Rate of
Subsidies
Total
Interest Subsidy
Interest Subven-
tion to
Farmers
Indigen-
ous Imported
Decont-
rolled
Total
Fertiliser Subsidy
As %age
of Total Subsidy
2005-06 2183 1700 10653 1211 6596 18460 38.8 47522 3692485 1.3 3.4
2006-07 2809 1100 12650 3274 10298 26222 45.9 57125 4294706 1.3 20.2
2007-08 2276 1677 12950 6606 12934 32490 45.8 70926 4987090 1.4 24.2
2008-09 2829 1600 17969 10079 48555 76603 59.1 129708 5630063 2.3 82.9
2009-10 2601 2011 17580 4603 39081 61264 43.3 141351 6457352 2.2 9.0
2010-11 4680 3531 15081 6454 40766 62301 35.9 173420 7795314 2.2 22.7
2011-12 6868 4868 20208 13716 36089 70013 32.1 217941 8974947 2.4 25.7
2012-13 7416 5400 20000 15133 30480 65613 25.5 257079 10159884 2.5 18.0
2013-14 8061 6000 21000 15545 29427 65972 28.5 231084 10020620 2.3 -10.1
2014-15 8313 6000 36000 12300 24670 72970 28.0 260658 12876653 2.0 12.8
Source: Budget Documents
India is among one of the largest producers and consumers of fertilizers in the world. Initially
fertilizer subsidy was introduced to ensure its availability to farmers at an affordable price, and
enable adequate returns on investments.
However, over the years the financial obligation on account of fertilizers subsidy has increased
substantively, resulting in enormous charge on government exchequer.
Figure 12.2 Trends in different subsidies across different heads (Rs crores)
Source: Budget Documents
0
50000
100000
150000
200000
250000
300000
199
6-9
7
199
7-9
8
199
8-9
9
199
9-0
0
200
0-0
1
200
1-0
2
200
2-0
3
200
3-0
4
200
4-0
5
200
5-0
6
200
6-0
7
200
7-0
8
200
8-0
9
200
9-1
0
201
0-1
1
201
1-1
2
201
2-1
3
201
3-1
4
201
4-1
5
Interest Subsidy
Fertliser Subsidy
Total Subsidies
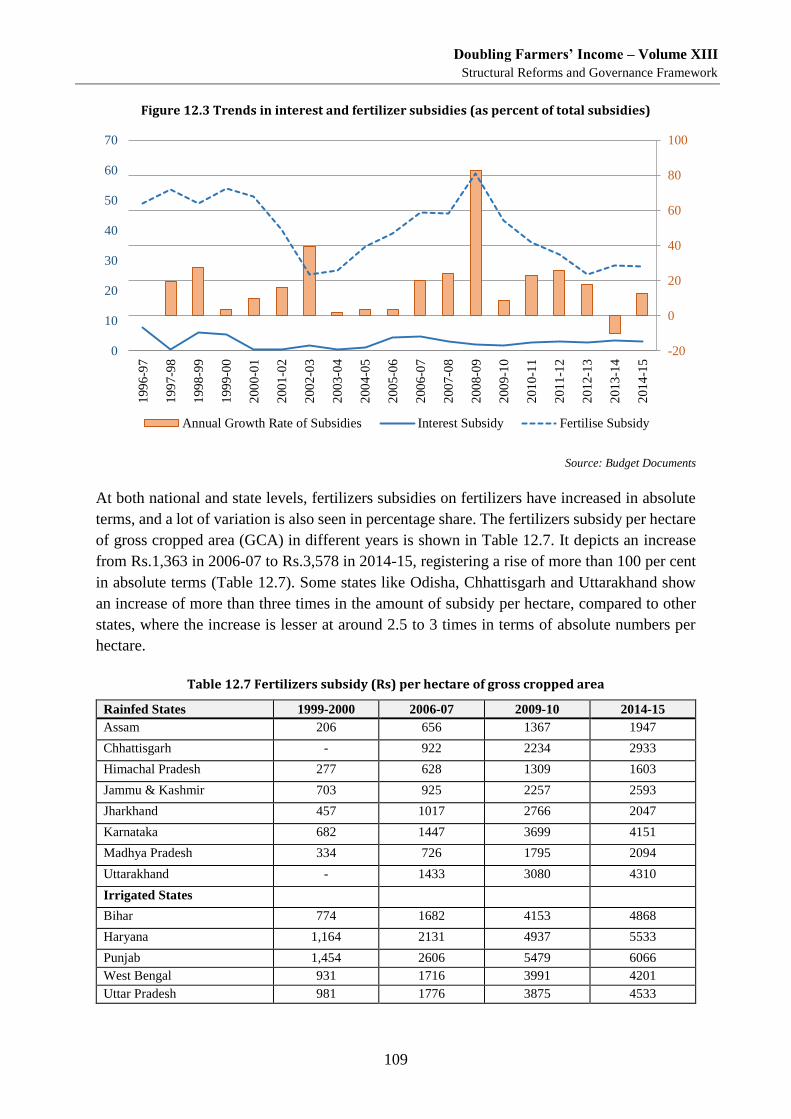
Doubling Farmers’ Income – Volume XIII
Structural Reforms and Governance Framework
109
Figure 12.3 Trends in interest and fertilizer subsidies (as percent of total subsidies)
Source: Budget Documents
At both national and state levels, fertilizers subsidies on fertilizers have increased in absolute
terms, and a lot of variation is also seen in percentage share. The fertilizers subsidy per hectare
of gross cropped area (GCA) in different years is shown in Table 12.7. It depicts an increase
from Rs.1,363 in 2006-07 to Rs.3,578 in 2014-15, registering a rise of more than 100 per cent
in absolute terms (Table 12.7). Some states like Odisha, Chhattisgarh and Uttarakhand show
an increase of more than three times in the amount of subsidy per hectare, compared to other
states, where the increase is lesser at around 2.5 to 3 times in terms of absolute numbers per
hectare.
Table 12.7 Fertilizers subsidy (Rs) per hectare of gross cropped area
Rainfed States 1999-2000 2006-07 2009-10 2014-15
Assam 206 656 1367 1947
Chhattisgarh - 922 2234 2933
Himachal Pradesh 277 628 1309 1603
Jammu & Kashmir 703 925 2257 2593
Jharkhand 457 1017 2766 2047
Karnataka 682 1447 3699 4151
Madhya Pradesh 334 726 1795 2094
Uttarakhand - 1433 3080 4310
Irrigated States
Bihar 774 1682 4153 4868
Haryana 1,164 2131 4937 5533
Punjab 1,454 2606 5479 6066
West Bengal 931 1716 3991 4201
Uttar Pradesh 981 1776 3875 4533
-20
0
20
40
60
80
100
0
10
20
30
40
50
60
701
99
6-9
7
199
7-9
8
199
8-9
9
199
9-0
0
200
0-0
1
200
1-0
2
200
2-0
3
200
3-0
4
200
4-0
5
200
5-0
6
200
6-0
7
200
7-0
8
200
8-0
9
200
9-1
0
201
0-1
1
201
1-1
2
201
2-1
3
201
3-1
4
201
4-1
5
Annual Growth Rate of Subsidies Interest Subsidy Fertilise Subsidy
Doubling Farmers’ Income – Volume XIII
Structural Reforms and Governance Framework
110
Rainfed States 1999-2000 2006-07 2009-10 2014-15
Arid+ Rainfed
Gujarat 651 1445 3756 3658
Rajasthan 322 527 1142 1487
Coastal+ Rainfed
Andhra Pradesh 1096 2348 5638 6222
Kerala 455 867 2296 2215
Maharashtra 637 1212 3136 3327
Odisha 314 545 2180 2679
Tamil Nadu 1,104 2332 4969 4697
Source: States category based on Saxena et al (2001), data compiled from various issues of agricultural statistics at a
glance.
Sale of fertilizers at highly subsidized price incentivized the farmers, to use a critical input, that
was important to realise higher per unit yields, particularly in case of high yielding varieties of
paddy & wheat grown under irrigated system. This has helped in achieving high foodgrain
output in the country. However, studies in the recent years suggest that during the last few
years, the marginal response of crop productivity to additional fertilizer usage across different
states has fallen sharply, leading to near stagnation in agricultural productivity and
concomitantly agricultural production. It has also been reported that low price on urea relative
to potassium & phosphorous has led to imbalanced use of soil nutrients.
Since the year 2008-09, P and K have come under NBS system, which means that the quantum
of subsidy offered by the government is fixed, and the MRP (Maximum Retail Price) is not
regulated. However, urea continues to benefit from fixed MRP, and the subsidy (the difference
between MRP and manufacturing/importing cost) being fully borne by the government.
Disproportionate ratio in application of NPK (in deviation of recommended dosage) causes
multi-nutrient deficiency resulting in less than desired growth of crop productivity.
Now, taking up the critical need of power (electricity) in agriculture, it is observed that in
absolute terms, the power (electricity) subsidy in terms of rupees per hectare of gross cropped
area has increased in all the states except Bihar, Gujarat and Madhya Pradesh. The value has
also increased at all India level by more than two times (Figure 12.4). A comparison of the year
2001-02 with the year 2013-14 brings outs that, in Andhra Pradesh the subsidy amount
quadrupled whereas in case of Maharashtra, Punjab Tamil Nadu and Uttar Pradesh the amount
tripled (Table 12.8).
Initially the power subsidy was offered to help the farmers to use ground water and secure their
production. It is now seen, that paddy and wheat have come to garner major share of power
subsidy as also that of fertilizer subsidy, esspecially in irrigated states like Bihar, Haryana,
Punjab, Uttar Pradesh and West Bengal, where more than 60 per cent of the total gross cropped
area is under these two resource guzzlers. In fact, in case of Punjab more than 80 per cent of
the gross cropped area is under wheat and rice (2014-15). This reflects lopsided support through
subsidies in favour of limited crops and further benefitting largely irrigated areas.
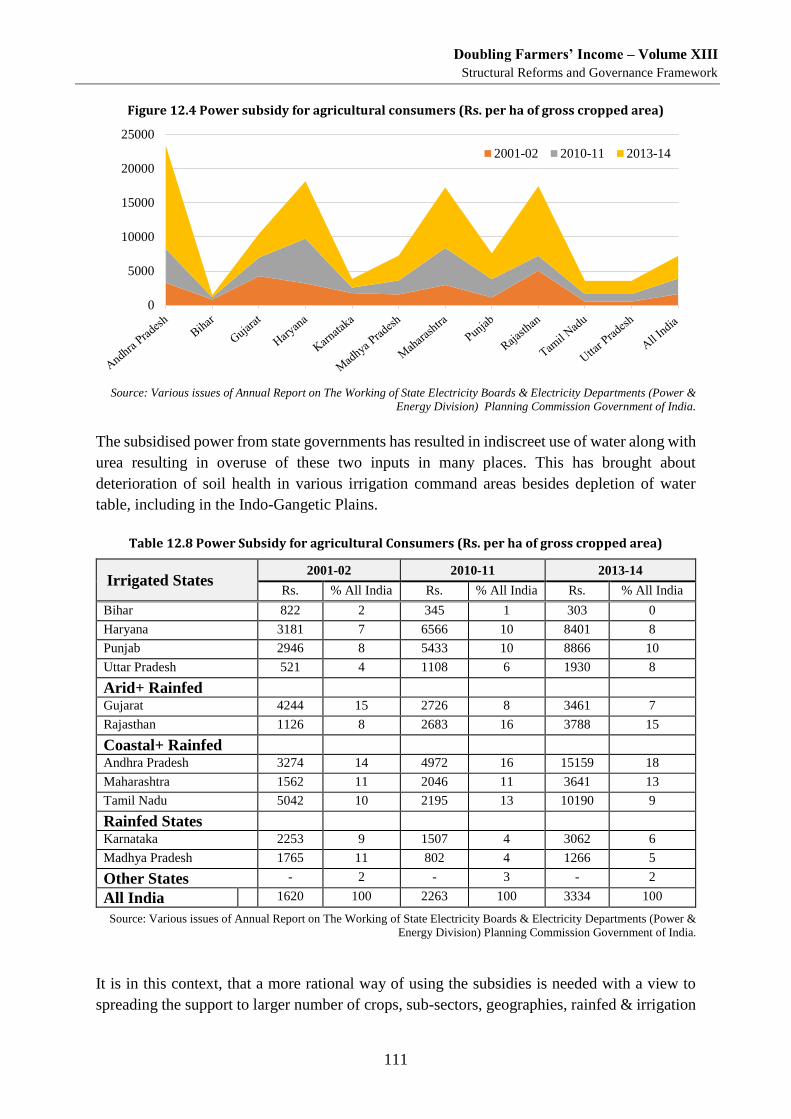
Doubling Farmers’ Income – Volume XIII
Structural Reforms and Governance Framework
111
Figure 12.4 Power subsidy for agricultural consumers (Rs. per ha of gross cropped area)
Source: Various issues of Annual Report on The Working of State Electricity Boards & Electricity Departments (Power &
Energy Division) Planning Commission Government of India.
The subsidised power from state governments has resulted in indiscreet use of water along with
urea resulting in overuse of these two inputs in many places. This has brought about
deterioration of soil health in various irrigation command areas besides depletion of water
table, including in the Indo-Gangetic Plains.
Table 12.8 Power Subsidy for agricultural Consumers (Rs. per ha of gross cropped area)
Irrigated States 2001-02 2010-11 2013-14
Rs. % All India Rs. % All India Rs. % All India
Bihar 822 2 345 1 303 0
Haryana 3181 7 6566 10 8401 8
Punjab 2946 8 5433 10 8866 10
Uttar Pradesh 521 4 1108 6 1930 8
Arid+ Rainfed
Gujarat 4244 15 2726 8 3461 7
Rajasthan 1126 8 2683 16 3788 15
Coastal+ Rainfed
Andhra Pradesh 3274 14 4972 16 15159 18
Maharashtra 1562 11 2046 11 3641 13
Tamil Nadu 5042 10 2195 13 10190 9
Rainfed States
Karnataka 2253 9 1507 4 3062 6
Madhya Pradesh 1765 11 802 4 1266 5
Other States - 2 - 3 - 2
All India 1620 100 2263 100 3334 100
Source: Various issues of Annual Report on The Working of State Electricity Boards & Electricity Departments (Power &
Energy Division) Planning Commission Government of India.
It is in this context, that a more rational way of using the subsidies is needed with a view to
spreading the support to larger number of crops, sub-sectors, geographies, rainfed & irrigation
0
5000
10000
15000
20000
25000
2001-02 2010-11 2013-14
Doubling Farmers’ Income – Volume XIII
Structural Reforms and Governance Framework
112
systems and farmers. Increase in irrigated area (by tapping ground water) through subsidised
electricity in states like Punjab and Haryana has led to assured incomes, but also to groundwater
depletion, income inequality, and unsustainable agriculture.
Food subsidies in India
The subsidy obligations of Government of India on account of foodgrains have increased
significantly over the last two decades from Rs. 6,066 crore in 1996-97 to about Rs. 1,22,676
crore in 2014-15, an increase of over 20 times. Since 1996-97, food subsidy as a percentage of
total subsidy grew from 39 per cent to 57 per cent in 2003-04, and thereafter declined to 47 per
cent in 2014-15 (Table 12.9). The government’s foodgrain policy is mainly carried out by the
Food Corporation of India (FCI). It is the FCI or its selected state government agencies, who
acquire paddy and wheat from farmers at the notified minimum support price (MSP). The
Government of India utilizes the procured wheat and rice under Targeted Public Distribution
System (TPDS) and other welfare schemes and for maintaining the buffer stock of foodgrains
so as to ensure food security. The quantum of wheat and rice meant for TPDS is issued to the
states and union territories at a highly subsidized rate. The differential between the procured
and issued price is met by the central government. While this is a huge financial obligation, it
integrates the loop between procurement and disposal of the commodities. While the
consumers benefit from subsidized food, the farmers benefit from assured market at MSP.
However, several studies have shown, that this system has benefited only a few states, and
further the relatively larger farmers within these states, with higher marketable surplus ratios.
It is also no gain saying, that it has benefited only 2 crops – wheat & paddy.
Table 12.9 Year-wise food subsidy (Rs crore)
Year Food Subsidy YOY Growth
(%)
Total
Subsidies
Food Subsidy
as percentage
of total
Subsidy
1996-97 6,066
15499 39
1997-98 7,900 30 18540 43
1998-99 9,100 15 23593 39
1999-00 9,434 4 24487 39
2000-01 12,060 28 26838 45
2001-02 17,499 45 31210 56
2002-03 24,176 38 43533 56
2003-04 25,181 4 44323 57
2004-05 25,798 2 45957 56
2005-06 23,077 -11 47522 49
2006-07 24,014 4 57125 42
2007-08 31,328 30 70926 44
2008-09 43751 40 129708 34
2009-10 58443 34 141351 41
2010-11 63844 9 173420 37
2011-12 72822 14 217941 33
2012-13 85000 17 257079 33
2013-14 92000 8 231084 40
2014-15 122676 33 260658 47
Source: Various Budget Documents
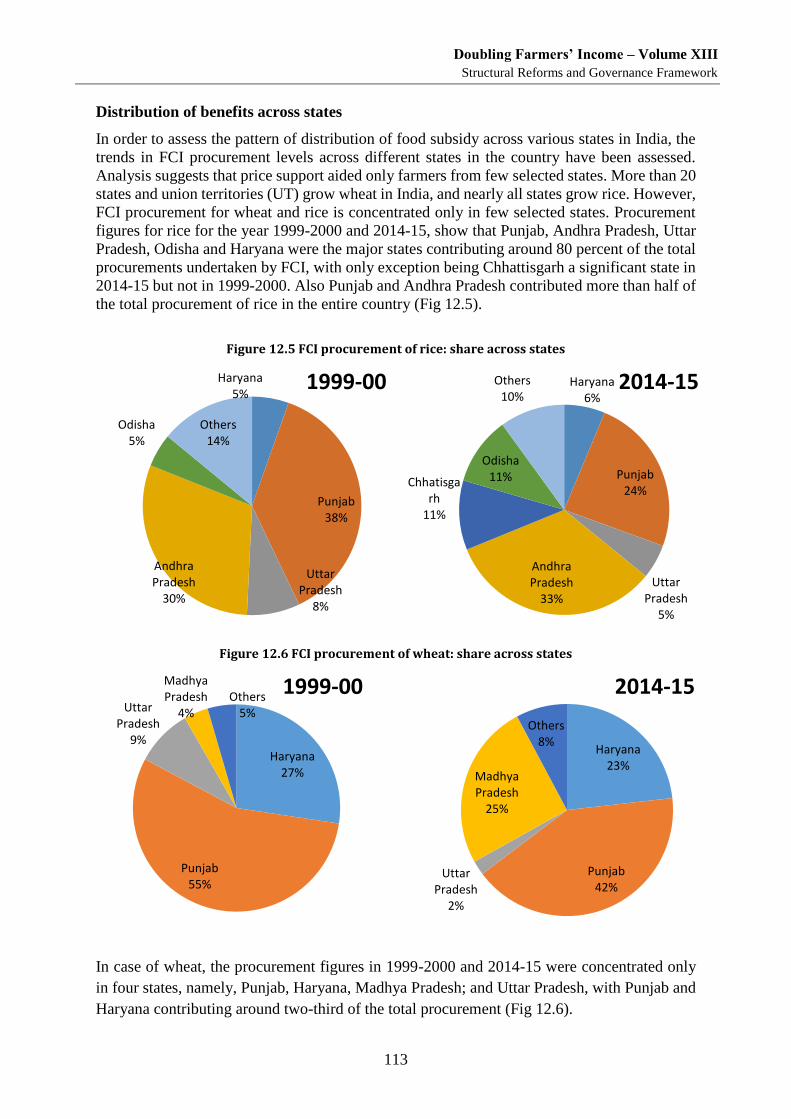
Doubling Farmers’ Income – Volume XIII
Structural Reforms and Governance Framework
113
Distribution of benefits across states
In order to assess the pattern of distribution of food subsidy across various states in India, the
trends in FCI procurement levels across different states in the country have been assessed.
Analysis suggests that price support aided only farmers from few selected states. More than 20
states and union territories (UT) grow wheat in India, and nearly all states grow rice. However,
FCI procurement for wheat and rice is concentrated only in few selected states. Procurement
figures for rice for the year 1999-2000 and 2014-15, show that Punjab, Andhra Pradesh, Uttar
Pradesh, Odisha and Haryana were the major states contributing around 80 percent of the total
procurements undertaken by FCI, with only exception being Chhattisgarh a significant state in
2014-15 but not in 1999-2000. Also Punjab and Andhra Pradesh contributed more than half of
the total procurement of rice in the entire country (Fig 12.5).
Figure 12.5 FCI procurement of rice: share across states
Figure 12.6 FCI procurement of wheat: share across states
In case of wheat, the procurement figures in 1999-2000 and 2014-15 were concentrated only
in four states, namely, Punjab, Haryana, Madhya Pradesh; and Uttar Pradesh, with Punjab and
Haryana contributing around two-third of the total procurement (Fig 12.6).
Haryana5%
Punjab38%
Uttar Pradesh
8%
Andhra Pradesh
30%
Odisha5%
Others14%
1999-00 Haryana6%
Punjab24%
Uttar Pradesh
5%
Andhra Pradesh
33%
Chhatisgarh
11%
Odisha11%
Others10%
2014-15
Haryana27%
Punjab55%
Uttar Pradesh
9%
Madhya Pradesh
4%Others
5%
1999-00
Haryana23%
Punjab42%
Uttar Pradesh
2%
Madhya Pradesh
25%
Others8%
2014-15
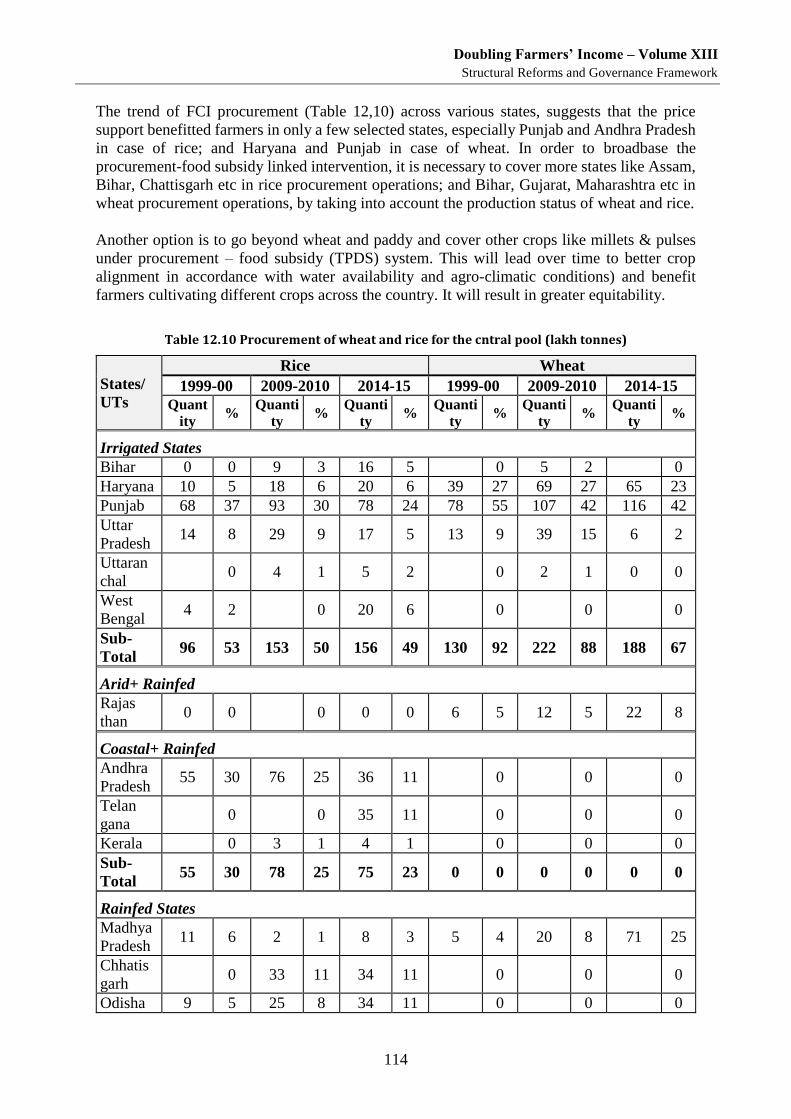
Doubling Farmers’ Income – Volume XIII
Structural Reforms and Governance Framework
114
The trend of FCI procurement (Table 12,10) across various states, suggests that the price
support benefitted farmers in only a few selected states, especially Punjab and Andhra Pradesh
in case of rice; and Haryana and Punjab in case of wheat. In order to broadbase the
procurement-food subsidy linked intervention, it is necessary to cover more states like Assam,
Bihar, Chattisgarh etc in rice procurement operations; and Bihar, Gujarat, Maharashtra etc in
wheat procurement operations, by taking into account the production status of wheat and rice.
Another option is to go beyond wheat and paddy and cover other crops like millets & pulses
under procurement – food subsidy (TPDS) system. This will lead over time to better crop
alignment in accordance with water availability and agro-climatic conditions) and benefit
farmers cultivating different crops across the country. It will result in greater equitability.
Table 12.10 Procurement of wheat and rice for the cntral pool (lakh tonnes)
States/
UTs
Rice Wheat
1999-00 2009-2010 2014-15 1999-00 2009-2010 2014-15
Quant
ity %
Quanti
ty %
Quanti
ty %
Quanti
ty %
Quanti
ty %
Quanti
ty %
Irrigated States
Bihar 0 0 9 3 16 5 0 5 2 0
Haryana 10 5 18 6 20 6 39 27 69 27 65 23
Punjab 68 37 93 30 78 24 78 55 107 42 116 42
Uttar
Pradesh 14 8 29 9 17 5 13 9 39 15 6 2
Uttaran
chal 0 4 1 5 2 0 2 1 0 0
West
Bengal 4 2 0 20 6 0 0 0
Sub-
Total 96 53 153 50 156 49 130 92 222 88 188 67
Arid+ Rainfed
Rajas
than 0 0 0 0 0 6 5 12 5 22 8
Coastal+ Rainfed
Andhra
Pradesh 55 30 76 25 36 11 0 0 0
Telan
gana 0 0 35 11 0 0 0
Kerala 0 3 1 4 1 0 0 0
Sub-
Total 55 30 78 25 75 23 0 0 0 0 0 0
Rainfed States
Madhya
Pradesh 11 6 2 1 8 3 5 4 20 8 71 25
Chhatis
garh 0 33 11 34 11 0 0 0
Odisha 9 5 25 8 34 11 0 0 0
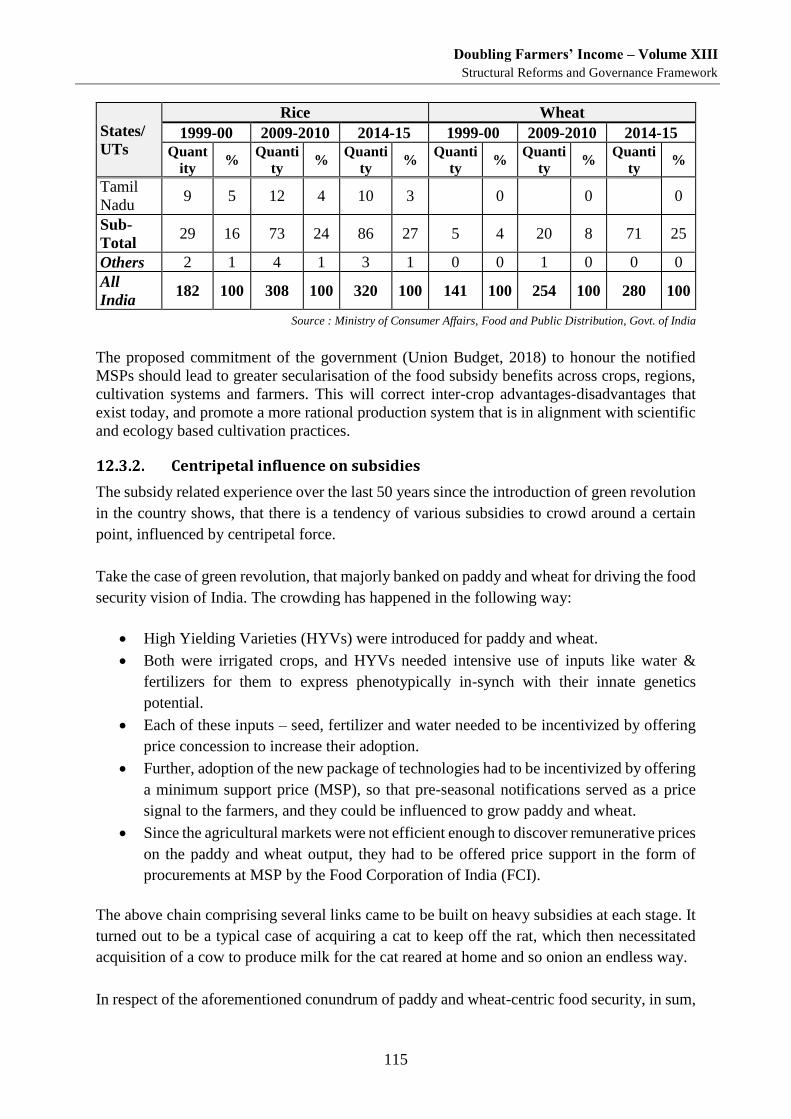
Doubling Farmers’ Income – Volume XIII
Structural Reforms and Governance Framework
115
States/
UTs
Rice Wheat
1999-00 2009-2010 2014-15 1999-00 2009-2010 2014-15
Quant
ity %
Quanti
ty %
Quanti
ty %
Quanti
ty %
Quanti
ty %
Quanti
ty %
Tamil
Nadu 9 5 12 4 10 3 0 0 0
Sub-
Total 29 16 73 24 86 27 5 4 20 8 71 25
Others 2 1 4 1 3 1 0 0 1 0 0 0
All
India 182 100 308 100 320 100 141 100 254 100 280 100
Source : Ministry of Consumer Affairs, Food and Public Distribution, Govt. of India
The proposed commitment of the government (Union Budget, 2018) to honour the notified
MSPs should lead to greater secularisation of the food subsidy benefits across crops, regions,
cultivation systems and farmers. This will correct inter-crop advantages-disadvantages that
exist today, and promote a more rational production system that is in alignment with scientific
and ecology based cultivation practices.
Centripetal influence on subsidies
The subsidy related experience over the last 50 years since the introduction of green revolution
in the country shows, that there is a tendency of various subsidies to crowd around a certain
point, influenced by centripetal force.
Take the case of green revolution, that majorly banked on paddy and wheat for driving the food
security vision of India. The crowding has happened in the following way:
High Yielding Varieties (HYVs) were introduced for paddy and wheat.
Both were irrigated crops, and HYVs needed intensive use of inputs like water &
fertilizers for them to express phenotypically in-synch with their innate genetics
potential.
Each of these inputs – seed, fertilizer and water needed to be incentivized by offering
price concession to increase their adoption.
Further, adoption of the new package of technologies had to be incentivized by offering
a minimum support price (MSP), so that pre-seasonal notifications served as a price
signal to the farmers, and they could be influenced to grow paddy and wheat.
Since the agricultural markets were not efficient enough to discover remunerative prices
on the paddy and wheat output, they had to be offered price support in the form of
procurements at MSP by the Food Corporation of India (FCI).
The above chain comprising several links came to be built on heavy subsidies at each stage. It
turned out to be a typical case of acquiring a cat to keep off the rat, which then necessitated
acquisition of a cow to produce milk for the cat reared at home and so onion an endless way.
In respect of the aforementioned conundrum of paddy and wheat-centric food security, in sum,
Doubling Farmers’ Income – Volume XIII
Structural Reforms and Governance Framework
116
various subsidies came to centre around just two crops (paddy & wheat) grown in irrigated
areas, supported through subsidy on seeds, fertilizers, water, electric/diesel power and finally
procurement.
In effect, it was the selected section of farmers in irrigated areas growing paddy & wheat, who
came to benefit majorly from the large subsidy-kitty, and creating islands of privileges.
The per ha. consumption of subsidy on different components will stand as testimony to this
biasness, when it is examined by crops, irrigated vs. rainfed regions and other like parameters.
However, this analysis and interpretation should not be misread. After all, India faced a crisis
of food deficit in the 1960s, and the situation warranted an emergent intervention by deploying
a readily available package of technology, which could be imported and adopted to suit Indian
conditions. This is how Mexican varieties of wheat were brought from Internal Centre for
Maize and Wheat (CYMMYT) in 1967, followed by rice varieties from International Rice
Research Institute (IRRI), Philippines in 1968-69, which together triggered a high production
curve in the country. The rest, as they say, is history.
New challenge from surpluses
The current times in the history of India’s agriculture is faced by a challenge of another nature,
which emanates from a situation of surpluses, and ironically disfavouring the farmers from
realising remunerative prices. This is however not an insurmountable problem. Several market
reforms rolled out by the government, supplemented by the proposed broadbased procurement
operations will come to benefit the farmers.
Over the years, government sponsored subsidies to farmers in terms of fertilizers, irrigation,
electricity and procurement-subsidy system have witnessed an annual increase. Of the total
planned revenue expenditure for agriculture, significant part is spent on subsidies leaving a
very small amount earmarked for capital investment in agriculture. As a result, agriculture
sector in India seems to be more dependent on input subsidies relative to other large emerging
economies. The need is to priortise capital investments over subsidies, reserving the latter to
the truly needy among the farmers. Further, subsidy transfer can be efficiently targeted by
adopting Aadhaar linked Direct Benefit Transfer (DBT). Savings achieved by this, should
however be retained for agriculture sector and added to the yearly normal budgetary allocations
for enhancing capital investments for basic infrastructure like irrigation, power, roads,
communication, post-harvest agri-logistics, markets and the like.
What is further worth appreciation vis-à-vis the present situation of surpluses, is the window
that is now available to make wholesome changes to the policy support including Agri-R&D
and broadbase agricultural transformation, besides making it income-centric. Towards this
directional change, the substantive size of subsidy that is annually offered can be restructured
and apportioned for right investments and for the targeted farmers, who need support of
subsidy.
Doubling Farmers’ Income – Volume XIII
Structural Reforms and Governance Framework
117
III
Inflation Management: Need for a Rational Approach
Food Inflation
Food inflation trends in India over the past few decades show that diverse commodities have
been the reason for food inflation in different years, and that no specific commodity can be
held accountable for high inflation. Studies show that eggs, milk, meat, fish, vegetables and
cereals were the main influencers vis-a-vis the most recent food inflation.
Vegetables and fruits revealed a much higher degree of intra-year volatility; high-weight
commodities in the national consumption basket also showed very high inflation rates; and the
contribution of pulses and edible oils remained low in terms of inflation. Shekhar et. al. (2016)
established that both supply and demand factors are the reasons for inflation.
Prices of commodities such as cereals and edible oils seem to be driven by supply-side factors
such as wage rates, level of production and minimum support prices, whereas in case of pulses,
the effects of both supply- and demand-side factors appear almost equal. The prices of eggs,
meat, fish, milk, and fruits and vegetables appear to be driven mainly by demand-side factors.
Over the past decade (2007-18), India has seen a prolonged period of high rate of general
inflation (Figure 12.7), largely driven by persistently high food inflation. Past trend suggests
that in the absence of a stronger food supply growth response, food inflation may outdo non-
food inflation by 2.5–3 percentage points per year.
The country has recently adopted a flexible inflation targeting framework, under which it has
set for itself a long term inflation target contained at 4 per cent. Some of the important factors
relating to agriculture, that can help in sustaining this inflation target include strengthening of
food supply, agricultural market-based pricing, and reducing price distortion externalities.
Several studies like those of Anand et al. (2016), Meenakshi (2016) and Shekhar et. al. (2016)
have also highlighted the importance of these factors in shaping India’s inflation dynamics and
determining the conduct of monetary policy. Sonna et al (2014) provides substantial evidence
on the importance of demand forces. The study shows that rising real rural incomes have had
the major impact on food inflation while cost-push factors have a relatively smaller impact.
Gokarn, S. (2012), in his comprehensive analysis of India’s key food price issues for more than
fifty years summarises, that rise in food prices is because of stagnation in food supply and food
inflation cannot be contained until and unless food supply is regularised.
The Committee needs to spotlight, that in the face of ever rising production, barring a few
produce types, it is evident that it is the supply and distribution system that fails or stagnates,
to feeding inflationary pressure. Therefore, upgradation of market architecture and agri-
logistics is to be given utmost priority.
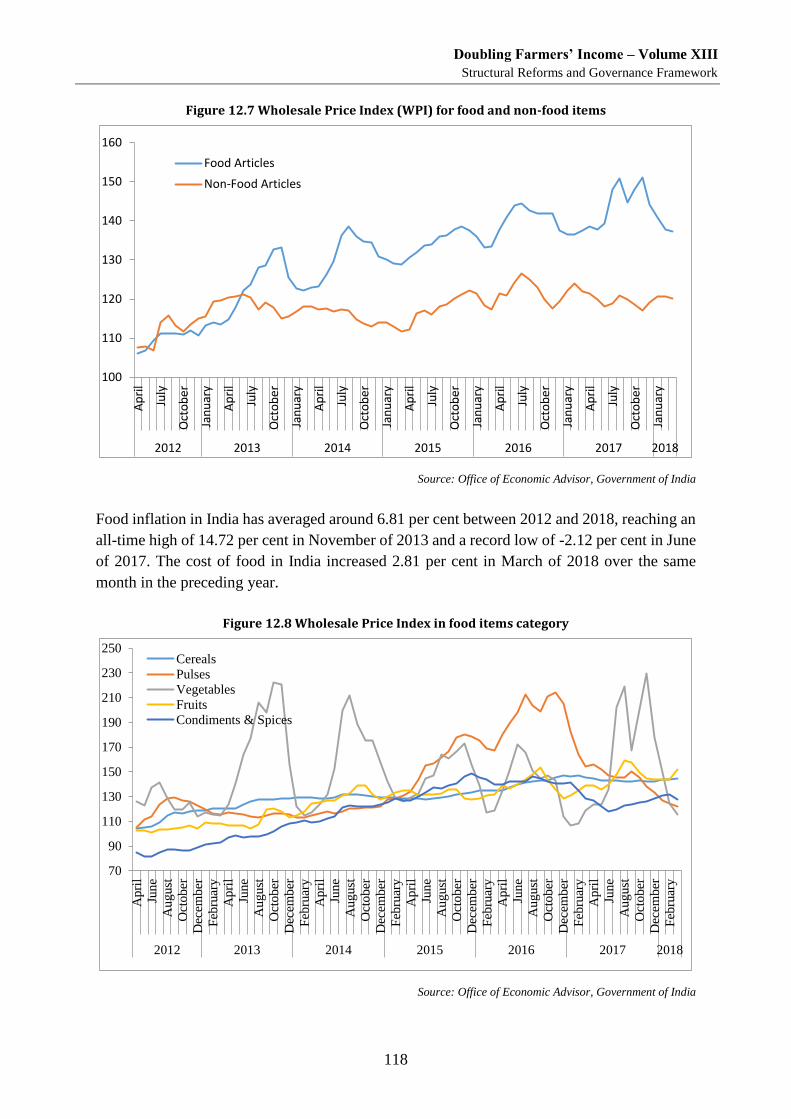
Doubling Farmers’ Income – Volume XIII
Structural Reforms and Governance Framework
118
Figure 12.7 Wholesale Price Index (WPI) for food and non-food items
Source: Office of Economic Advisor, Government of India
Food inflation in India has averaged around 6.81 per cent between 2012 and 2018, reaching an
all-time high of 14.72 per cent in November of 2013 and a record low of -2.12 per cent in June
of 2017. The cost of food in India increased 2.81 per cent in March of 2018 over the same
month in the preceding year.
Figure 12.8 Wholesale Price Index in food items category
Source: Office of Economic Advisor, Government of India
100
110
120
130
140
150
160A
pri
l
July
Oct
ob
er
Jan
uar
y
Ap
ril
July
Oct
ob
er
Jan
uar
y
Ap
ril
July
Oct
ob
er
Jan
uar
y
Ap
ril
July
Oct
ob
er
Jan
uar
y
Ap
ril
July
Oct
ob
er
Jan
uar
y
Ap
ril
July
Oct
ob
er
Jan
uar
y
2012 2013 2014 2015 2016 2017 2018
Food Articles
Non-Food Articles
70
90
110
130
150
170
190
210
230
250
Ap
ril
Jun
e
Au
gust
Oct
ob
er
Dec
emb
er
Feb
ruar
y
Ap
ril
Jun
e
Au
gust
Oct
ob
er
Dec
emb
er
Feb
ruar
y
Ap
ril
Jun
e
Au
gust
Oct
ob
er
Dec
emb
er
Feb
ruar
y
Ap
ril
Jun
e
Au
gust
Oct
ob
er
Dec
emb
er
Feb
ruar
y
Ap
ril
Jun
e
Au
gust
Oct
ob
er
Dec
emb
er
Feb
ruar
y
Ap
ril
Jun
e
Au
gust
Oct
ob
er
Dec
emb
er
Feb
ruar
y
2012 2013 2014 2015 2016 2017 2018
Cereals
Pulses
Vegetables
Fruits
Condiments & Spices
Doubling Farmers’ Income – Volume XIII
Structural Reforms and Governance Framework
119
The Other Side of Food Inflation: Input Cost
In the recent past, there has been a significant increase in agricultural cost of production. To
analyse the extent to which increase in cost of production in agriculture has contributed to food
price inflation, agricultural input price indices have been used, which consisted of major farm
inputs like fertilisers, pesticides, electricity, high speed diesel, light speed diesel oil, fodder,
cattle feed, tractor, agricultural machinery & implements and lubricants. Within the category
of agricultural inputs, light diesel oil recorded the highest inflation, followed by high-speed
diesel and lubricants. Another traditional explanation for rising food prices has been the input
supply-side shocks related to climatic conditions, either because of droughts or floods. Often,
it is observed that the sudden slump in food supply associated with climatic conditions has led
to food price inflation. (RBI, 2014).
Balancing Food Inflation and Guarding Farmers’ Interest
The rising food inflation has been regulated by adopting different measures over the years.
Some of these include subsidies on food and fertilisers, imports of food, and prevention of
hoarding of farm produce. Though they did succeed in stabilising prices, such crisis
management practices have been able to provide only short-lived respite, failing to check a
continuous upward trend of food prices since 2007.
Over-emphasis on containing food inflation is good for the consumers, but bad for the farmer-
producers. By causing stagnation in prices of food items, food production is rendered
unattractive to the farmers. This approach will make food prices less remunerative; and
discourage investments in agriculture, putting further stress on supply-side in the long run
triggering inflationary pressure as a sequel. An effective strategy to keep food inflation at
optimal level, while also benefiting the farmers from higher returns consists of enhancing per
ha. yield (through more efficient production system) and an efficient agricultural marketing
system (through market integration and a robust agri-logistics), that will ensure, a higher share
of the farmer in the consumers’ rupee. Merely increasing the prices in the market may not
ensure better returns to farmers, as it may benefit only the intermediaries. From the farmers’
income perspective, higher prices in the market constitute only a necessary condition, but not
a sufficient condition. Capturing a higher share of the final value is therefore of more relevance.
Several other steps are needed to increase farmers’ share in the consumer’s price. The need is
to lower the transaction costs. The farmer pays for transportation over long distances for his
produce, before actually knowing the value at which his produce would be sold. The journey
from farm gate to final consumer involves multiple levels of conveyance, labour expenses,
commissions of agents and a market fee & cess, roughly adding to nearly one-fifth cost to food
prices. There is need for large outlays to set up climate-controlled infrastructure to enhance the
shelf life of farm produce. The public private partnership (PPP) could play a significant role in
boosting the investment and adding value to the infrastructure. There is also need to add value
to farm produce by facilitating food processing on a much larger scale, as food-processing
industries can enhance both shelf life and add value to the products. However, some regulations
like the Essential Commodities Act (ECA), which imposes strict restrictions on stock limits
Doubling Farmers’ Income – Volume XIII
Structural Reforms and Governance Framework
120
and curbs movements, creates uncertainty, dis-incentivising long-term investments. This calls
for reforms and liberalisation, and assume importance in the overall strategy for doubling
enhancing farmers income
India’s Food Inflation: The Supply-Demand Angle
Story of Pulses (2016-17)
Despite an increase in minimum support price (MSP) and government procurement in the
agriculture year 2016-17, profit margins of all pulses except gram declined by about 30 per
cent. The year saw record high production of pulses. However, prices of gram (chickpeas),
which has a high share of 40-45 per cent in total pulses production and over 60 per cent in
exports, bucked the trend, and shot up in the last six years. Unlike other pulses, there is no
restriction on export of gram; so profitability remained higher for gram farmers as the
international market was ready to absorb the excess domestic supply. (CRISIL, 2017).
The period of 2013-14 to 2015-16 (lesson from previous price volatility)
Two consecutive bad monsoons resulted in a fall in pulses production (driven by both acreage
and yield declines) from 19.8 million tonnes in 2013-14 to 17.2 million tonnes in 2014-15 and
finally a five-year low of 16.5 million tonnes in 2015-16. As a result, wholesale prices of gram,
the principal pulse, rose by 65 per cent between August 2015 and August 2016, and 43 per cent
between August 2014 and August 2015. This as expected impacted retail prices. For example,
prices in Delhi rose by 49 and 38 per cents respectively during the years ending August 2016
and August 2015 (CRISIL, 2017). Some facts/information relating to controlling price
volatility are given below:
i. The principal pulses are under the government’s price support regime, with minimum
support prices (MSPs) being set on a cost-plus basis to provide a remunerative floor to
market prices.
ii. In bad harvest years, the government adopts policies to match supply with demand by
encouraging imports, setting limits on stockholding by the private trade and restricting
exports.
In the context of the sharp fall in domestic production from 2013-14 to 2015-16, the
government had responded with similar measures to shore up domestic supply. Consequently,
imports of pulses rose from 3.7 million tonnes in 2013-14 to 4.6 million tonnes in 2014-15 and
5.8 million tonnes in 2015-16. Exports fell from 0.34 million tonnes to 0.22 million tonnes
between 2013-14 and 2014-15 and stood at 0.26 million tonnes in 2015-16.
Farmer-centric policy for inflation management: The following suggestions are made:
i. Focus on increasing domestic production of pulses to strengthen supply side.
ii. Procure pulses at MSP under price support scheme (PSS) or any other available
procurement tool, whenever prices fall below MSP in the market.
iii. A stable trade regime that checks imports and promotes exports be adopted, so that
domestic market remains buoyant, even when production goes up.
Doubling Farmers’ Income – Volume XIII
Structural Reforms and Governance Framework
121
iv. Since 82 per cent of the area sown under pulses is un-irrigated, more investments are
needed in expanding water-conservation techniques like small ponds, micro-irrgiation
and ferti-irrigation, and up-gradation of roads, storage and transportation facilities.
v. Combination of market dependence and government interventions to balance the dual
interest of consumer as well as farmers is needed.
It is noteworthy, that since 2016-17, the government’s policy orientation and efforts have been
on the above lines. A five year roadmap beginning 2016-17 to enhance production through
productivity gains mainly, and using post-kharif fallow; and supported by higher MSP and top-
up bonus has catalysed production. Procurement of pulses under PSS (Price Support Scheme)
has also helped. This has led to record output of 23 million tonnes of pulses in 2016-17, and is
expected to be surpassed in 2017-18. The trade regime-import & export policy has also been
re-oriented in favour of the farmers.
Story of onion
Onion crop has received greater attention because of extreme price volatility (Saxena & Chand
(2017). In case of extreme price rise, the farmers tend to bring additional area under cultivation
of onion from other competing crops. Such decisions lead to glut in the following season and
farmers sometimes are not even able to recover the cost of production incurred. This situation
suggests, that marketing and price scenarios need to be effectively examined and monitored to
understand the linkages between/among markets and nature of volatility in onion prices.
The major policy instrument to regulate onion export and stabilise domestic market is MEP
(Minimum Export Price). The other policy instrument is physical regulation of exports through
quantitative restrictions (QRs) or total ban or canalising (routing) the exports through state
trading enterprises. The motive behind such policies is the stabilisation of domestic supply of
onion and to contain domestic price rise. This approach is obviously consumer-centric, and
also at the cost of farmers’ interests. Time series data on onion prices indicates that 2013 price
situation was the most severe, with intense price shock. Such a situation drew immediate
attention of policy makers, consequent upon which the MEPs were kept at the historically high
levels. As the crises became intense, the government responded by repeatedly raising the MEP
which went up to $1150/MT. The situation eased only at the end of December 2013. A similar
price crises situation re-emerged in 2015, which appeared to be relatively less severe as
compared to the one of 2013. An MEP level of $700/MT was notified in August 2015, which
was 8 per cent higher as compared to August 2013 MEP. No further notifications were issued
except in December 2015, when the price situation eased.
Saxena and Chand (2017) established that imposition of higher MEP in November 2013, July
2014 and June 2015 was able to lower the onion inflation in subsequent months i.e. December
2013, August 2014 and July 2015 respectively. If the farmer-centric policy approach is
adopted, with a view to let the farmers take advantage of high price situations, it entails that
MEP is determined with due objectivity and care. When prices are let to be little higher so as
to protect the interests of farmers, the low income consumers need to be supported through
Doubling Farmers’ Income – Volume XIII
Structural Reforms and Governance Framework
122
PDS supply of the commodity in question. For example, onion in this case.
In the long run though, supply management calls for proper management. Onion is cultivated
in certain pockets of the country, but consumed all over implying that a robust agri-logistics
can alone ensure distribution of onion from its production centres over space (i.e., all India).
Further, its production is seasonal in nature (late Kharif and early Rabi), which means that
onion has to be stored scientifically for demand-based release over time (i.e. throughout the
year). This once again suggests the importance of storage godowns (like ventilated godowns)
or processing and the like.
Annotation
There has been impressive growth in investments in Indian agriculture during the post-reform
period. The initial decline of public investments in the 1990s was corrected and made up for in
the decade of 2000s. However, a significant variation exists in the magnitude and direction of
the investments across Indian states. An examination brings up inter-state disparities in both
public and private spending in agriculture, particularly between irrigated and rainfed states. In
consonance with the fact, that public spending in agriculture largely depends on fiscal resources
and the priority the government attaches to the sector, the share of public investment vis-a-vis
gross capital formation in agriculture has increased markedly in well-endowed states like
Haryana and Maharashtra during recent periods.
As a large percentage of agriculture in the country continues to be monsoon-dependent, many
of the states which are largely rainfed are seen to have diverted a significant proportion of their
expenditure in strengthening and expanding irrigation coverage. The growth rate of private
investment in agriculture has also been substantive in the rainfed states during the recent period.
The case of developing states particularly Madhya Pradesh, is an example of agricultural
transformation by enhancing public spends in terms of credit flow, subsidies and irrigation
infrastructures. Water is the most critical input in a biological production system like
agriculture.
Effective public-private inter-linkages to deepen capital formation in agriculture, can be
replicated in all the states as well. Such public–private coordination for investment in
agriculture is particularly important in those states which are largely rainfed. In these states,
the critical need is to increase coverage of area under irrigation and water use efficiency.
In contrast to capital investments that go towards infrastructure build up, subsidies are in the
nature of production support. The subsidies on critical inputs like fertilizers, water, power and
MSP-linked procurements have increased substantively from Rs.12,158 crore in the year 1990-
91 to Rs.2,43,811 crore in 2015-16. However, the green revolution technology conditional
upon input guzzling crops and varieties has channelled a major part of the subsidies into
irrigated belts, and majorly around a few crops.
Inflation management that targets to confine inflation to a certain threshold tends to suppress
Doubling Farmers’ Income – Volume XIII
Structural Reforms and Governance Framework
123
the food prices, since food commodities account for a major weightage in the inflation basket.
By and large, food prices have been managed with a view to protect the interests of the
consumers, and not the farmers. Towards this the instruments of Price Stabilisation Fund (PSF),
import-export duties and market operations have been used by the government. This approach
may have been appropriate during the periods, when India suffered from food deficiency. But
the current times when India’s farmers are generating food surpluses, the challenge is one of
ensuring remunerative prices on their produce. In this context, balancing the inflation and the
need for ensuring fair & remunerative prices on the farmers’ produce is a challenge. It needs
to be addressed on priority for sustaining higher production.

Doubling Farmers’ Income – Volume XIII
Structural Reforms and Governance Framework
125
Mobilising Farmers – Cooperatives and Farmer Producer
Organisations
“The fact that food companies are prospering but farmers are not, shows that profits are in the market,
not the farm”. With increasing density of population, the size of farms is only declining apart from
being subjected to the additional challenge of fragmentation. An optimal solution to achieve efficiency
in agriculture lies in mobilising the farmers into farmer producer organisations (FPOs), including
cooperatives of various nature.
Introduction
Cooperatives are present in most of the countries and in almost all the sectors, including
agriculture, food, finance, health care, marketing, insurance & credit. A cooperative is an
autonomous association of persons, united voluntarily to meet their common economic, social
and cultural needs and aspirations through a jointly owned and democratically controlled
enterprise.
Cooperatives have inherent advantages, for addressing issues of poverty alleviation, food
security and employment generation, considered to have immense potential to deliver goods
and services in areas where both the public and private sectors have failed. Since its formal
launch in 1904 in India, the Indian Cooperative Movement has played very important role in
the Indian economy, especially in the development of the agriculture and rural domains
combining the strengths of both public and private sectors. In particular, the small and marginal
farmers and weaker sections have benefited from cooperatives.
Agriculture sector, which still employs 48 per cent of the total workforce in India and
contributes around 15.5 percent to the country's GDP (2016-17), needs sturdy cooperatives so
as to overcome many of the difficulties faced by the farmers, especially in the context that 86
per cent of the farmers belong to small and marginal category. Farmers in India usually buy
their inputs at retail price and sell their produce at wholesale prices, thus loosing at both stages.
Organisations built on the concept of collectives (cooperatives and FPOs), could play key role
in numerous areas like input purchase farm advisory, value addition and branding, storage
facilities, soil-water-seed testing, purchase or hiring of customize farm machinery sale of
output.
History of the Co-operative Movement in India
The prevalence of widespread distress in the country in the 1800’s, the growing volume of rural
debt and the machinations of the money-lenders, led to certain voluntary efforts in the field of
rural credit, in the then Madras Presidency were organised into ‘Nidhis’ or Mutual-Loan
Associations. Based on the co-operative principle, these associations attained significant
success. By 1901, there existed 200 nidhis with more than 36,000 members and subscribed
capital of more than Rs.2 crore. In Punjab, a society on co-operative lines was started as early
as 1891 at Panjawar in Hoshiarpur district. The interest shown by local farmers in these

Doubling Farmers’ Income – Volume XIII
Structural Reforms and Governance Framework
126
societies and the powerful support lent by the Indian Famine Commission (1901) induced the
government to set up a working group to report on the introduction of co-operative societies in
India. Thus the first Co-operative Societies Act came to be passed in the year 1904.
The introduction of the Co-operative Credit Societies Act in 1904 marked the commencement
of the cooperative movement in the country. The goal, as specified in the preamble of this Act,
was to boost thrift, self-help and co-operation amongst farmers, artisans and persons of limited
means.
However, the movement did not make the progress expected of it. By 1911, there were only
8,177 credit societies consisting of around 4 lakh members throughout the country, with a share
capital of around Rs. 50.5 lakh. This concern pushed the government to take stock of the
circumstances, and a committee headed by Sir Edward Maclagan, was appointed in 1915, to
study and report whether the cooperative movement was proceeding on reasonable and
financially sound lines. The Committee submitted its Report in 1915 and it resulted in
reorganisation and thorough overhauling of the whole administration of Co-operatives.
An attempt was made to get rid of societies which did not live up to the ideals of co-operation,
and in particular, to insist upon prompt repayments. Under the Reforms Act of 1919, co-
operation became a transferred subject with the result, that the control and course of the
movement passed completely into the hands of the new Provincial Governments. This gave the
movement the advantage of greater flexibility since it could now be modified in accordance
with the needs of every province. Thereafter, the Government in the year 1945 appointed the
Cooperative Planning Committee to draw up a plan of cooperative development in the country.
With the achievement of independence and the advent of planning, the role of cooperatives
underwent a radical change. It was in this context that the Rural Credit Survey Committee was
appointed in 1951. A distinct shift in cooperative guidelines happened in 1958 when the
National Development Council passed a resolution, which in effect, led to ‘the rejection of the
old large-sized credit society and the emergence of small sized ‘Service Cooperatives’.
Over the years, the co-operative movement made rapid progress, but was, however, not uniform
across all the states. The progress was more marked in the states of Maharashtra, Punjab, Tamil
Nadu, Gujarat and Madhya Pradesh; and the movement was weak in the eastern region
comprising the states of Assam, Bengal, Bihar, Orissa (now Odisha), Manipur and Tripura. A
most welcome development during the plan period was the diversification of the movement. A
major breakthrough was witnessed in the field of agricultural marketing and processing. The
development of consumers’ stores and industrial co-operatives was also significant. But the
movement, somewhere, failed to fulfil all the aspirations attached with it initially, since still a
large percentage of rural population remained outside the fold of cooperatives, and for most of
their credit needs (specially small and marginal farmers) continued to depend on agencies
other than the co-operative society.
Doubling Farmers’ Income – Volume XIII
Structural Reforms and Governance Framework
127
Different Types of Cooperatives in India
Consumers’ Cooperatives: are formed by the consumers to obtain their daily requirements at
reasonable prices. Consumers’ cooperatives or cooperative stores are working primarily in
urban areas in India. Such a society buys goods directly from companies and wholesalers so as
to eliminate the profits that middlemen garner.
Producers’ Cooperatives: Producers or industrial cooperatives are voluntary organisations of
small producers and artisans, who stick together to impart efficiency to their operations.
Housing Cooperatives: These societies are formed by low and middle income group people
in urban areas to have a house of their own. Housing cooperatives are of different types. Some
societies acquire land and give the plots to the members for constructing their own houses.
They also arrange loans from financial institutions and government agencies. Other societies
themselves construct houses and allot them to the members who make payment in instalments.
Credit Cooperatives: These societies are formed by needy people to benefit from financial
support and to develop the habit of savings among members. They help to protect members
from exploitation of money lenders who charge exorbitant rates of interest on their lending.
Credit cooperatives are found in both urban and rural areas. In rural areas, agricultural credit
societies provide loans to members mainly for agricultural activities. In urban areas, non-
agricultural societies or urban banks offer credit facilities to the members for household needs.
Marketing Cooperatives: These are voluntary associations of independent producers who
want to sell their output at remunerative prices. The National Agricultural Cooperative
Marketing Federation (NAFED) under the Ministry of Agriculture and Farmers’ Welfare is an
example of marketing cooperative in India. The output of different members is pooled and sold
through a centralised agency to keep away middlemen. The sale proceeds are distributed among
the members in the ratio of their outputs. As a central sales agency, the society may also
perform important marketing functions such as processing, grading and packaging the output,
advertising and exporting products, warehousing and transportation, etc.
Cooperative Farming Societies: These are voluntary associations of small farmers who come
together to obtain the economies of large scale farming. Indian farmers are small and also
fragmented. In their individual capacity, the farmers are unable to use modern tools, seeds,
fertilizers, etc. They pool their lands and do farming collectively with the help of modern
technology to maximise agricultural output.
Need for Cooperatives in Agriculture
Lack of sufficient numbers significantly reduces the bargaining power of small and marginal
farmers both in case of input procurement as well as sale of produce. Small and marginal
farmers require agricultural inputs in small quantities, which they procure from local traders at
a considerably higher price than the wholesale rate. Most of the times, inferior quality of these
inputs further aggravates the problem. Often for small and marginal farmers transporting small
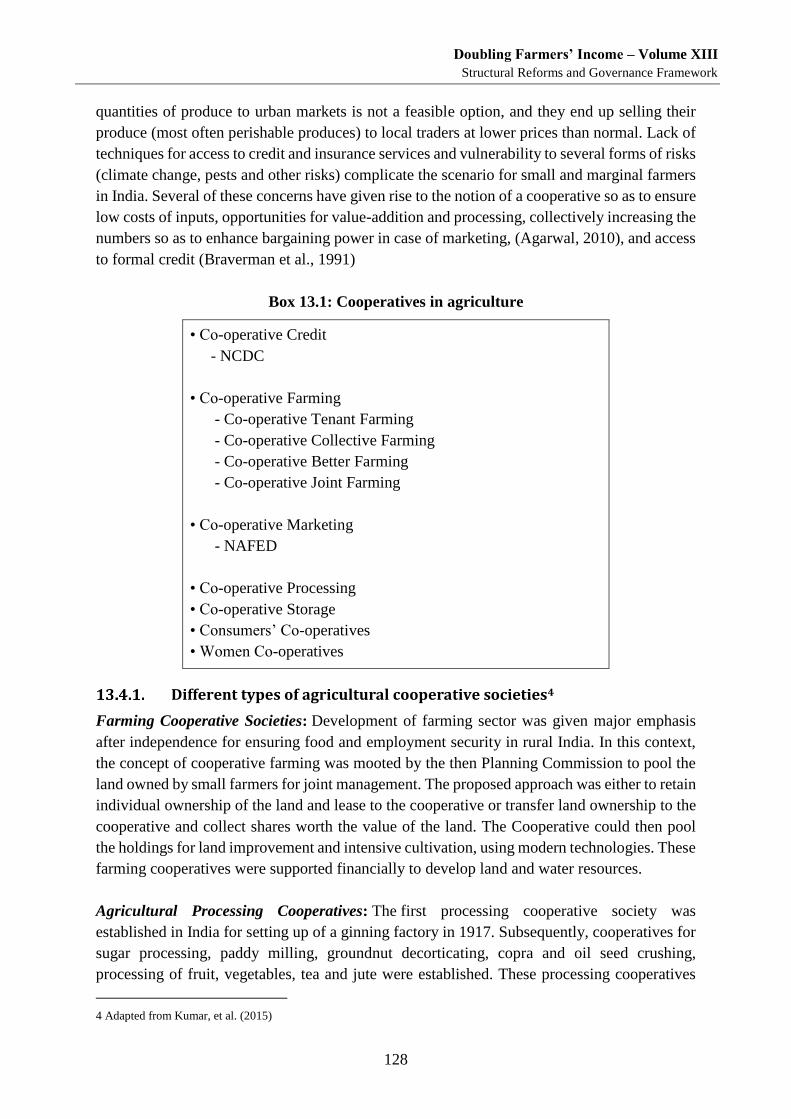
Doubling Farmers’ Income – Volume XIII
Structural Reforms and Governance Framework
128
quantities of produce to urban markets is not a feasible option, and they end up selling their
produce (most often perishable produces) to local traders at lower prices than normal. Lack of
techniques for access to credit and insurance services and vulnerability to several forms of risks
(climate change, pests and other risks) complicate the scenario for small and marginal farmers
in India. Several of these concerns have given rise to the notion of a cooperative so as to ensure
low costs of inputs, opportunities for value-addition and processing, collectively increasing the
numbers so as to enhance bargaining power in case of marketing, (Agarwal, 2010), and access
to formal credit (Braverman et al., 1991)
Box 13.1: Cooperatives in agriculture
• Co-operative Credit
- NCDC
• Co-operative Farming
- Co-operative Tenant Farming
- Co-operative Collective Farming
- Co-operative Better Farming
- Co-operative Joint Farming
• Co-operative Marketing
- NAFED
• Co-operative Processing
• Co-operative Storage
• Consumers’ Co-operatives
• Women Co-operatives
Different types of agricultural cooperative societies4
Farming Cooperative Societies: Development of farming sector was given major emphasis
after independence for ensuring food and employment security in rural India. In this context,
the concept of cooperative farming was mooted by the then Planning Commission to pool the
land owned by small farmers for joint management. The proposed approach was either to retain
individual ownership of the land and lease to the cooperative or transfer land ownership to the
cooperative and collect shares worth the value of the land. The Cooperative could then pool
the holdings for land improvement and intensive cultivation, using modern technologies. These
farming cooperatives were supported financially to develop land and water resources.
Agricultural Processing Cooperatives: The first processing cooperative society was
established in India for setting up of a ginning factory in 1917. Subsequently, cooperatives for
sugar processing, paddy milling, groundnut decorticating, copra and oil seed crushing,
processing of fruit, vegetables, tea and jute were established. These processing cooperatives
4 Adapted from Kumar, et al. (2015)
Doubling Farmers’ Income – Volume XIII
Structural Reforms and Governance Framework
129
with individual farmers, cooperative marketing societies and local service cooperatives as
members are regulated under the cooperative rules and by-laws.
There were 716 installed sugar factories in the country as on 31-March-2016, of which 326
were under the cooperative sector. The sugar industry has a huge annual turnover, ensuring
livelihood for lakhs of sugarcane growing families and a large mass of agricultural labourers.
Dairy cooperative is another success story in India. Presently, 170 Milk Producers' Cooperative
Unions and 15 State Cooperative Milk Marketing Federations are involved in milk processing.
However, many of these dairy federations have failed to function successfully, in the true spirit
of a people’s movement. However, some positive exceptions exist in a few States.
Nevertheless, the dairy cooperatives account for the major share of processed liquid milk
marketed in the country. Dairy cooperatives have been instrumental in transforming the rural
economy on the lines of cooperative sugar factories in several states like Gujarat, Maharashtra,
Karnataka, etc.
Agricultural Marketing Societies: Establishment of marketing cooperatives was encouraged
to provide marketing facilities to small farmers. The anticipated advantages were increase in
bargaining strength of farmers, removal of intermediaries and direct interaction with
consumers. There was also scope for availing credit and cheaper transport, storage facilities,
grading and processing of agricultural produce to fetch better prices.
The National Agricultural Cooperative Marketing Federation of India Ltd. (NAFED) was
established in 1958 for promoting cooperative marketing of agricultural produce. NAFED
procure foodgrains, pulses, oilseeds, spices, cotton, tribal produce, jute products, eggs, fresh
fruits and vegetables from farmers through its cooperative network in selected areas
whenever farmers have faced problems of marking their produce as manifest in low
remunerative in the market. The Indian Farmers’ Fertiliser Cooperative Limited (IFFCO) was
established in 1967 to produce and distribute fertilisers through cooperatives. Presently, over
40,000 cooperative societies are members of IFFCO.
The advantages of cooperative marketing are increased bargaining strength of farmers, direct
dealing with consumers, credit availability, cheaper transport, storage, grading and
processing facilities and market intelligence.
Agricultural Service Cooperatives: Cooperatives play an important role in disbursement of
agricultural credit. These cooperatives have been aiming at increasing agricultural production
through credit supply to agricultural producers, agricultural labourers, artisans, supply of
agricultural inputs, arranging storage, marketing and processing of agricultural produce,
arranging raw materials for industries and providing technical guidance, while promoting
social and economic welfare. The Primary Agricultural Cooperative Credit Society (PACS)
at the village level is the base for many of these activities. They federate into Central
Cooperative Bank at the district level (DCCB) and further into Apex Bank at State level.
Doubling Farmers’ Income – Volume XIII
Structural Reforms and Governance Framework
130
Allied Agricultural Cooperatives: These cooperatives cover activities like dairy farming,
poultry, piggery, etc, but most of them suffered from inadequate financial and technical
support and lack of coordination between and amongst production, storage and marketing.
Successful Cooperatives in India
In the first few decades after independence, the sector played a pivotal role in the economy,
especially in respect of primary sector production. Maharashtra, for example, has been home
to some successful cooperative movements in agriculture, with the strong emergence of
sugarcane farming and sugar production cooperatives, as well as in consolidation of
cooperative credit banking system. The dairy cooperative is another success story in India. The
Anand model for cooperative milk marketing in Gujarat launched in the year 1946, with its
well-recognized Amul brand, provided later the blueprint for replicating its success elsewhere
under the National Dairy Development Board program, contributing to the success of
Operation Flood.
In case of fertilizer production and distribution, the Indian Farmers Fertilizer Cooperative
(IFFCO) controls over 35 per cent of the market. In the production of sugar, the cooperative
share of the market is 58 per cent, while in the marketing and distribution of cotton it is 60 per
cent. Cooperative sector accounts for 55 per cent of the production in the hand-woven textiles
sector, whereas cooperative marketing and distribution channels account for 50 per cent of the
edible oil market in India. Dairy cooperatives in India, operating under the leadership of the
National Dairy Development Board (NDDB), collectively, are the largest producers of milk in
the world.
Notwithstanding the significant gains made by the cooperative movement, the sector has of
late shown signs of slowing down with several issues emerging. Unfortunately, the notable
successes have remained limited to some apex groups, while most of grass-root cooperatives
continue to remain fragile and continue to depend on outside agencies for their survival.
Major areas of concern5
a. Government interference: A major factor responsible for the poor performance of
the movement was the lack of skilled/professional leaders on a scale proportionate with the
considerable expansion that took place in the movement. Right from the beginning, the
cooperative movement in India has been patronized by the government, which also provided
a window for interference. Cooperative institutions were treated as if they were part and
parcel of the administrative set up of the government making such intrusion an indispensable
element in working of these institutions. In most of the cases the movement’s independence
and self-reliance existed only on paper. Though there has been some change in the attitude it
has not been adequate. This has restricted the full blossoming of the cooperative movement
of the people. Cooperatives have always depend on the governments for support, which has
held this back from developing as separate independent entities. Also, often cooperative
5 Adapted from Das et al. (2006)
Doubling Farmers’ Income – Volume XIII
Structural Reforms and Governance Framework
131
societies are enforced upon the people irrespective of their desire or willingness for such
togetherness. This top down approach has only brought about increase in number of
members, while compromising the cooperative spirit.
b. Mismanagement and manipulation: The essence of the cooperative movement is
that it gives the farmers the status of shareholders and assures them of agricultural,
educational and medical facilities. Over the years, this truly democratic idea got corrupted
and farmers with larger holdings grew more powerful. A more disturbing trend, however,
was the domination of co-operative institutions by group politics. Various other parochial
interest associate into its vitals. The result was that either a society did not do much work or
there was favouritism and nepotism in the grant of loans restricting the benefits to favoured
members. There were instances where members of rival faction persuaded people not to repay
their dues. Such narrow and sectoral interests have succeeded in causing more harm to the
movement.
c. Lack of awareness: People are not well informed about the objectives of the
movement, the contributions it can make in rebuilding the society and the rules and
regulations of cooperative institutions. Members did not understand and appreciate the aims,
objectives, and the possibilities of the movement. They joined a society only as ‘clients of
convenience’ and deserted it after their needs were met. There was no genuine urge to
develop the movement. People look upon these institutions as means for obtaining facilities
and concessions from the government, and till such time as these expectations are met, they
see to it that societies somehow continue to function. Lack of education, politics of the
village, caste-ridden elections to the offices of cooperative societies, bureaucratic attitudes
of the government officers, particularly, at the lower rank are some of the hurdles in diffusion
of right information and spread of cooperative spirit.
d. Restricted coverage: The cooperative movement has also suffered on account of two
important limitations in its working. One, is that the size of these societies has been very
small. Most of these societies are confined to a few members and their operations extend to
only one or two villages. As a result, their resources remain limited, which makes it
impossible for them to expand their means and extend their operations. Two, most of the
societies have been single purpose societies, rendering them unable to take a total view of
the persons seeking help, nor be able to analyse and solve problems from different angles.
Under these circumstances it has not been possible for these societies to make much progress.
After all, an individual has multiple needs which should be recognized.
e. Functional weakness: The cooperative movement has suffered from inadequacy of
trained personnel right from its inception. As a consequence, often co-operative institutions
suffered with issues such as the lack of proper accounting, irregularities of loans,
maintenance of records etc. Despite the introduction of training programme, the quality of
staff in the co-operative institutions has failed to attain high standard of efficiency. Lack of
trained personnel has been caused by two major factors. In the first place, there has been a
Doubling Farmers’ Income – Volume XIII
Structural Reforms and Governance Framework
132
lack of institutional support for robust training of personnel. Secondly, because of
unsatisfactory working of cooperative institutions, efficient and committed personnel did not
feel sufficiently attracted or motivated towards them. The functioning of the cooperative
societies, too suffers from several weakness. Some of these are, taking no care of the need of
credit seekers or their repaying capacity at the time of granting loans, making no adequate
provision for the return of loans, poor keeping of accounts, factional politics in it
management, lack of coordination among various divisions of the cooperative structure, too
much dependence on outside sources of finance, lack of adequate auditing, etc.
Factors ailing rural credit cooperatives
Considering the importance of institutional credit in the rural and agricultural sectors, the health
of the rural credit cooperatives assumes importance. As of date, about 47 per cent of the farmers
alone have access to institutional credit. Hence, some of the factors impairing the health &
progress of rural credit cooperatives are discussed below:
i. Need for prudent interest rate policies
The cooperatives have the freedom to tailor their interest rates on both deposits and advances,
in a manner that they are able to generate revenues for sustainability. In many cases, they
exhibit unprofessional visional approach by borrowing at unsustainably high rates and lend in
an imprudent manner without reference to cost of borrowing and profit margins. They need to
be more prudent in this regard, such that they are able to build revenues and surpluses.
ii. Viability a question
Many primary agricultural credit societies are neither viable, nor potentially viable and are
therefore not capable of offering production loans.
iii. Target-centric growth
A large number of primary societies have been established, without concern about their
viability or quality of performance. Many a time, the state governments have not ensured
adherence by these societies to the legal provisions of the State Cooperative Societies Act.
There is compromise in respect of governance, lending, including transparency, audit, internal
checks & controls, recovery of dues, recruitment of qualified personnel etc.
iv. Below par governance
State governments are the dominant shareholders, and this position is used to interfere where
not needed. Board members of the societies need to be given the autonomy and security of their
tenure, so that they can provided appropriate leadership and also be held accountable.
However, in some states where independent Election Commissioners for Cooperatives have
been appointed, there is progress in respect of conducting fair elections.
v. Duality of control
As per constitutional arrangement, ‘Cooperation’ is a state subject governed by the respective
State Cooperative Societies Acts. They contain the provisions relating to registration,
incorporation, management, election and audits. However, aspects relating to banking activities
are regulated and supervised by the Reserve Bank of India (RBI)/NABARD under the Banking
Doubling Farmers’ Income – Volume XIII
Structural Reforms and Governance Framework
133
Regulation Act, 1949 (as applicable to cooperative societies). Banking functions need to be
brought under the total control of the Banking Regulation Act, and let them override the
provisions of State Acts/bye-laws/rules, when there is overlap or conflict.
vi. Loan policies unfavourable to the farmers
The cooperatives continue to lend crop loans to the farmers against the collateral of land and
not the anticipated crop. Effectively, large number of farmers, particularly the lessees,
sharecroppers, tenants etc. actually cultivating the land are left out. Even actual owners stand
to lose sometimes, on account of ownership rights not being updated. Further, due to poor
financial position, many societies tend to lend much below the scale of finance, thereby not
fulfilling the full credit needs of a farmer.
vii. Favouring the better off
Many cooperatives have become ‘a combination of the strong not for the weak but against
them’. Theoretically, cooperative credit is supposed to be personal-credit based upon the
character and repayment capacity of the cultivator; but in practice, it is the medium and large
farmers who benefit more relative to the small & marginal farmers, who are in true need of
credit.
viii. Partial approach to lending
A farmer who derives his income from both farm and non-farm activities needs credit for
multiple activities. These include farming, dairy, irrigation, marketing, cottage industry, etc.,
but all these are treated in a mutually exclusive manner and the comprehensive credit needs of
a rural family are seldom met.
Continued relevance of cooperatives in agriculture
The above-mentioned imperfections and weaknesses notwithstanding, the co-operative move-
ment in India still remains an instrument with excellent potential for the economic and social
emancipation of the poor and the weak. Some of the key areas where cooperatives can help and
integrate the efforts for doubling farmer’s income are:
Information and Farm Advisory Centre: Cooperatives can play an effective role in
providing extension and advisory services for crop cultivation and animal husbandry,
fishery and aqua-culture.
Market Led Extension: Cooperative personnel can be trained for linking farmer
produce to the market.
Value Creation, Processing and Branding: Individual farmers can be organized
through cooperatives to go for value creation and brand building of their produce.
Farmers can bring their produce to cooperatives for value addition and market
integration.
Storage and Warehousing: Warehousing of agricultural produce and inputs can be
effectively done by the cooperatives as they present at village level and are I close
proximity to the farmer fields.
Doubling Farmers’ Income – Volume XIII
Structural Reforms and Governance Framework
134
Better Market Price Realisation: Cooperative registered warehouse can act as a
mandi (market) or hub for shifting produce, physical grading, cold-chains for
perishables, etc. so that better price realisation of farmers produce is possible. Farm
produce can further be assayed for export purpose.
Soil-Water-Seed-Fertiliser Testing: Cooperatives can be provide accredited services
for soil testing, water testing, seed and fertilizer testing, etc. This will help farmers get
assured product quality for higher crop yields and also diversification of business
cooperatives.
Farm Machinery and also Other Facilities for Custom Hiring: Cooperatives can
provide custom hiring services for farm mechanisation. They can also tender their
services for farmers for transportation of their farm produce.
Agricultural cooperatives have long been the primary form of farmer communes; however over
time, the cooperatives have had to experience too many limitations thus affecting their
efficiency. Notwithstanding the significant gains made by the cooperative movement most
notably in dairy sector, the concept has not proved much successful in case of agriculture
produce. Illiteracy, geographic remoteness and lack of professional skills among farmers are
major constraints in developing cooperative self-reliance. However, the cooperatives cannot
be wished away.
It is well said that the answer to failure of democracy is offering more democracy. Similarly,
in case of cooperatives too, the secret of success lies in infusing the movement with more
dollops of cooperative spirit of right quality. Cooperatives have a place in all the sub-sectors
of the broader agriculture sector, and at every stage of the value chain. The relevance is greater
today, when the scale of efficiency can be brought in, only by mobilising small and marginal
cultivators of land and release of livestock.
In order to promote the cooperatives, the approach has to be bottom-up, wherein people are
able to identify their common interests and come together. The provisions of law should
facilitate this without being unduly overbearing. The learning from Khaira District Milk Union,
popularly known as Anand Milk Union Ltd (AMUL), is that the leadership was provided by a
committed and pro-people Shri Tribhuvandas Patel and professional management came from
Dr. Kurien. Any cooperative needs to be infused with a spirit of togetherness and commonality
of interests; simultaneously it has to be run professionally, for which a competent personnel
need to be brought in and given due independence to carry out the day to day activities.
The leadership needs to be an example of integrity and concern for society. In the words of Dr.
Kurien, “I have often spoken of integrity as the most important of these values, realising that
integrity – and personal integrity at that – is being honest to yourself. If you are always honest
to yourself, it does not take much effort in always being honest with others”.
Doubling Farmers’ Income – Volume XIII
Structural Reforms and Governance Framework
135
Reinvigorating cooperative credit institutions
Some suggestions are made in this regard which may be seen below:
i. Recapitalisation of all the remaining PACSs
A number of Committees set up by the government have submitted their report on improving
the performance of the cooperative credit structure, the latest one being the Vaidyanathan
Committee set up in 2004. Based on the latter’s recommendations, the Government of India
rolled out in January-2006, a package for revival of the Short-Term Rural Cooperative Credit
Structure (STCCS). The Task Force also suggested wide-ranging reforms in the governance
and management of STCCS including carrying out critical amendments to the respective State
Cooperative Societies Acts. And these were to precede the recommended one-time
capitalization jointly by the Central Government, the State governments and the STCCS of the
state itself.
As against the above, 25 state governments signed the MoU with Government of India and
NABARD. As on December, 2012, only 21 states had amended their respective Acts. Further,
the status of amendments to the Rules and adoption of Bye-laws in respect of both State
Cooperative Banks and District Central Cooperative Banks varies across the states and districts.
A sum of Rs.9,003 crore was released by NABARD as Government of India share, while the
state governments released Rs.855.33 crore as their share of recapitalization of 53,202 eligible
PACSs in 17 states.
Recapitalisation assistance could not be released in many cases as the states did not complete
all the necessary benchmark activities within the stipulated period. The stipulated period for
settlement was three years in case of those who signed the MoU. Since, many PACSs have
remained without the benefit of recapitalization due to various reasons, it is recommended, that
the Central government may consider to take up this exercise once again giving a special
window in respect of all states & UTs, which now wish to undertake recapitalization in respect
of uncovered PACSs, subject to fulfilling the conditions laid down in the MoU.
ii. Licensing of rural cooperative banks
The Committee on Financial Sector Assessment (under the chairmanship of Dr. Rakesh
Mohan) set up in 2006 recommended relaxation of norms in respect of cooperative banks, a
large number of which were functioning without license. The relaxed norms were Capital to
Risk-weighted Assets Ratio (CRAR) – minimum 4 per cent; and Compliance with CRR (Credit
Requirement Ratio) and SLR (Statutory Liquidity Ratio) for the previous one year (default on
one or two occasions were permitted). This relaxation helped many unlicensed banks to qualify
and brought down the number of unlicensed banks from 73 as on 29-February-2012 to 23 as
on 30-June-2013. There has been further progress thereafter. As on date, of the total of 33 State
Cooperative Banks and 363 District Central Cooperative Banks, there are only 3 unlicensed
District Central Cooperative Banks (DCCBs) in the country.
Doubling Farmers’ Income – Volume XIII
Structural Reforms and Governance Framework
136
It is recommended that all the unlicensed banks as on date may be supported to acquire
qualification for a license. This will help in further strengthening the credit structure in the
areas served by these 3 District Central Cooperative Banks.
iii. Core Banking Solution (CBS)
The RBI has permitted State Cooperative Banks and District Central Cooperative Banks to
participate in the payment system and offer RTGS/ECS/NEFT facilities to their customers.
Many Cooperative Banks have adopted CBS either through NABARD assisted project or on
their own. There still remain some State and District Cooperative Banks without CBS
integration. They need to be brought onboard, and offer better services to the customers
associated with the cooperative credit institutions.
iv. National Cooperative Development Corporation (NCDC)
In the recent four years, NCDC has shown substantial growth in lending to cooperatives.
NCDC utilises internal accruals, market borrowings, including international assistance and
allocations from Government of India to meet the credit requirements of cooperatives. In FY
2017-18, NCDC released nearly 22,000 crore of loans. The experience and strength of NCDC
must be taken advantage of, to reach out and meet the credit needs of more cooperatives. A
target of one lakh crore in lending by 2022-23 may be considered for NCDC. To service the
training needs of cooperatives, the Laxmanrao Inamdar National Academy for Co-operative
Research and Development (LINAC), has been initiated as a centre of excellence. Besides
training, LINAC of NCDC should also assume the role of creating downstream institutional
linkages for cooperatives.
Linking Cooperatives with Farmer Producer Organisations (FPOs)
Cooperatives being traditional in structure, lack linkages with buyers, input suppliers, etc., who
are vital actors across the larger supply chain. This undermines long term sustainability of
cooperatives. Thus came a new form of collectives called Farmer Producer Organisations
(FPOs) to address the challenges faced by the small and marginal farmers, particularly those to
do with enhanced access to investments, technological advancements, and efficient inputs and
markets (Hellin et al., 2009). These collective efforts, evidently offer means for small and
marginal farmers to contribute in the otherwise imperfect markets of the developing countries
(De Janvry et al., 1991).
The basic purpose envisioned for the FPOs is to collectivise the small farmers for backward
linkage for inputs like seeds, fertilizers, credit, insurance, knowledge and extension services;
and forward linkages such as collective marketing, processing, and market-led agriculture
production (Mondal, 2010). While cooperatives entail benefits to farmers via state intervention,
FPOs are perceived to empower farmers through collective bargaining along with imparting an
entrepreneurial quality to farming, which otherwise is practised as a subsistence, particularly
by the small and marginal farmers.
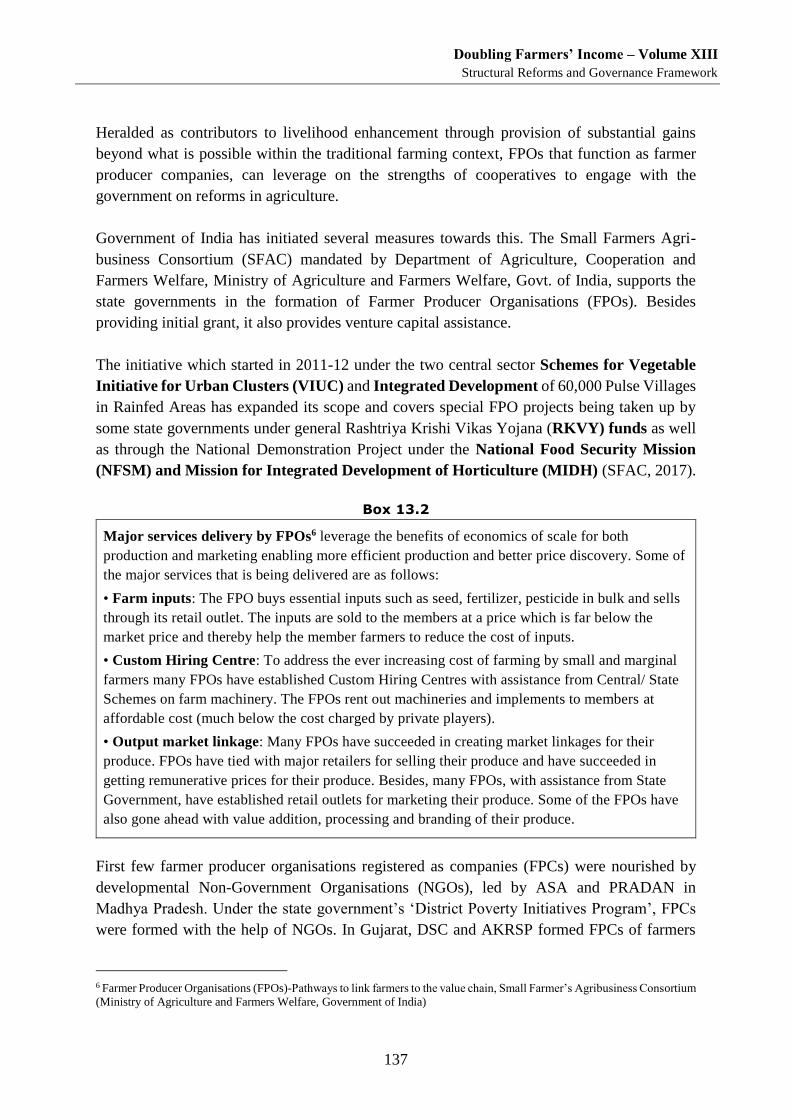
Doubling Farmers’ Income – Volume XIII
Structural Reforms and Governance Framework
137
Heralded as contributors to livelihood enhancement through provision of substantial gains
beyond what is possible within the traditional farming context, FPOs that function as farmer
producer companies, can leverage on the strengths of cooperatives to engage with the
government on reforms in agriculture.
Government of India has initiated several measures towards this. The Small Farmers Agri-
business Consortium (SFAC) mandated by Department of Agriculture, Cooperation and
Farmers Welfare, Ministry of Agriculture and Farmers Welfare, Govt. of India, supports the
state governments in the formation of Farmer Producer Organisations (FPOs). Besides
providing initial grant, it also provides venture capital assistance.
The initiative which started in 2011-12 under the two central sector Schemes for Vegetable
Initiative for Urban Clusters (VIUC) and Integrated Development of 60,000 Pulse Villages
in Rainfed Areas has expanded its scope and covers special FPO projects being taken up by
some state governments under general Rashtriya Krishi Vikas Yojana (RKVY) funds as well
as through the National Demonstration Project under the National Food Security Mission
(NFSM) and Mission for Integrated Development of Horticulture (MIDH) (SFAC, 2017).
Box 13.2
Major services delivery by FPOs6 leverage the benefits of economics of scale for both
production and marketing enabling more efficient production and better price discovery. Some of
the major services that is being delivered are as follows:
• Farm inputs: The FPO buys essential inputs such as seed, fertilizer, pesticide in bulk and sells
through its retail outlet. The inputs are sold to the members at a price which is far below the
market price and thereby help the member farmers to reduce the cost of inputs.
• Custom Hiring Centre: To address the ever increasing cost of farming by small and marginal
farmers many FPOs have established Custom Hiring Centres with assistance from Central/ State
Schemes on farm machinery. The FPOs rent out machineries and implements to members at
affordable cost (much below the cost charged by private players).
• Output market linkage: Many FPOs have succeeded in creating market linkages for their
produce. FPOs have tied with major retailers for selling their produce and have succeeded in
getting remunerative prices for their produce. Besides, many FPOs, with assistance from State
Government, have established retail outlets for marketing their produce. Some of the FPOs have
also gone ahead with value addition, processing and branding of their produce.
First few farmer producer organisations registered as companies (FPCs) were nourished by
developmental Non-Government Organisations (NGOs), led by ASA and PRADAN in
Madhya Pradesh. Under the state government’s ‘District Poverty Initiatives Program’, FPCs
were formed with the help of NGOs. In Gujarat, DSC and AKRSP formed FPCs of farmers
6 Farmer Producer Organisations (FPOs)-Pathways to link farmers to the value chain, Small Farmer’s Agribusiness Consortium
(Ministry of Agriculture and Farmers Welfare, Government of India)
Doubling Farmers’ Income – Volume XIII
Structural Reforms and Governance Framework
138
they were working with. Bhartiya Agro Industries Foundation (BAIF) also established a
producer company of mango and cashew growers in Vansda in south Gujarat. In few cases,
such as Vishakhapatnam in Andhra Pradesh, an existing dairy farmers’ cooperative converted
itself into an FPC. Rangasutra was organised around the craft groups of URMUL in Rajasthan.
As on 31-March-2017, against a target of 7.40 lakh farmers to be mobilized 6.15 lakh small &
marginal farmers have been identified and formed into 36,214 Farmer Interest Groups (FIGs).
These FIGs have further been federated into FPOs and so far 586 FPOs have been registered
and 152 are under the process of registration SFAC (2017).
Several State governments and NABARD are extensively promoting FPOs. However, the
spread of FPOs is limited to selected region. Credit expansion across different regions and farm
size classes would further help in enhancing efficiency of FPOs and upgrade their business
running capacity. Integration with existing agricultural product value chains, deployment of
ICT, professional management, demand led operations, etc. will impart greater efficiency to
their operations.
Types of Farmer Producers Organisations (FPOs)
Farmers can be mobilised into farmer producers organisations (FPOs) through different
instruments. These include:
FPOs registered under Societies Act.
FPOs registered under State Cooperatives Act.
FPOs registered under Indian Companies Act.
FPOs registered under the Companies Act are called as farmer producers companies (FPCs).
Various constraints relating to cooperatives in India have been discussed above. In order to
negotiate such constraints and challenges, the Government initiated on forming FPCs. These
are a hybrid that combine the strength of cooperatives and companies.
FPCs stand to benefit from the collective spirit of a cooperative society and management
flexibility of a private company. It would, therefore, be worth it to promote FPCs in the interest
of farmers and agriculture.
With the union budgetary announcement for the financial year 2018-19, that agricultural
income of FPCs will also benefit from tax exemption under the Income Tax Act, they now
stand on a level playing field vis-à-vis other FPOs. This was a long standing demand, which
has come to be met now and removes the hurdle that FPCs were facing.
Promoting FPCs/Cooperatives in Private-Private Partnership (PPP)
Leveraging the initiatives of NABARD along with that of various government
departments/schemes could be effective in promotion of FPOs. Corporates may be roped in so
as to converge with various government programme of forming FPOs in various locations.
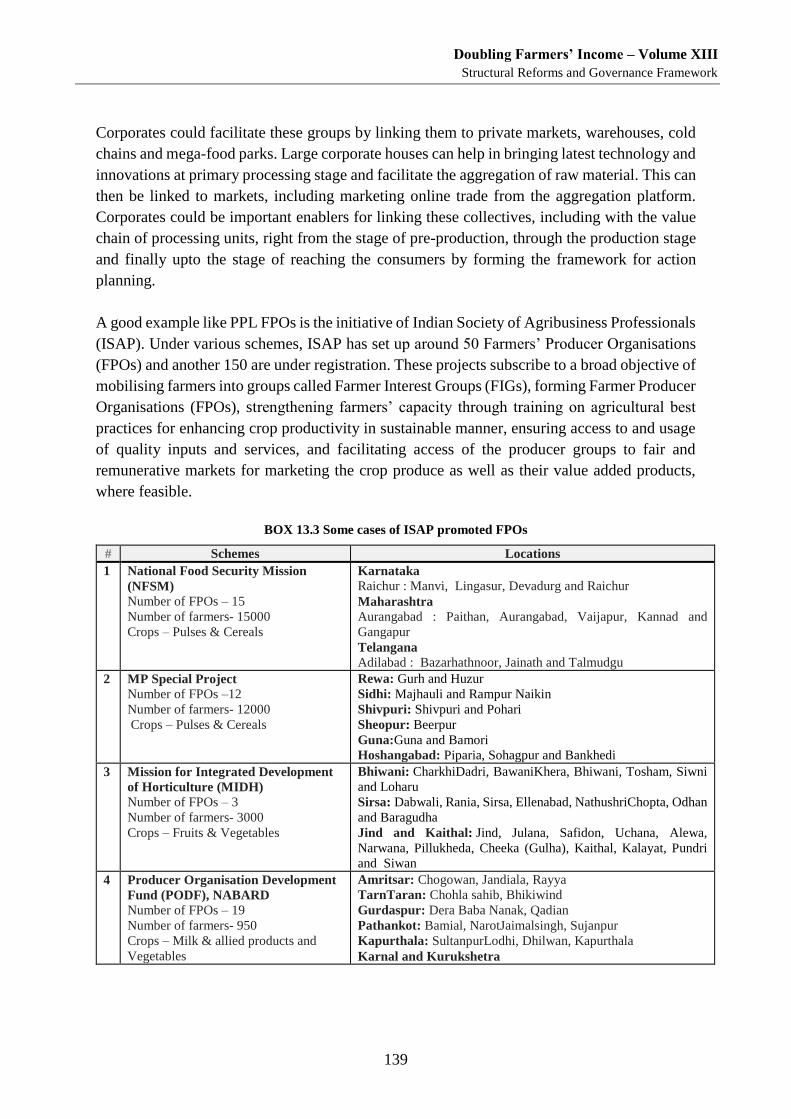
Doubling Farmers’ Income – Volume XIII
Structural Reforms and Governance Framework
139
Corporates could facilitate these groups by linking them to private markets, warehouses, cold
chains and mega-food parks. Large corporate houses can help in bringing latest technology and
innovations at primary processing stage and facilitate the aggregation of raw material. This can
then be linked to markets, including marketing online trade from the aggregation platform.
Corporates could be important enablers for linking these collectives, including with the value
chain of processing units, right from the stage of pre-production, through the production stage
and finally upto the stage of reaching the consumers by forming the framework for action
planning.
A good example like PPL FPOs is the initiative of Indian Society of Agribusiness Professionals
(ISAP). Under various schemes, ISAP has set up around 50 Farmers’ Producer Organisations
(FPOs) and another 150 are under registration. These projects subscribe to a broad objective of
mobilising farmers into groups called Farmer Interest Groups (FIGs), forming Farmer Producer
Organisations (FPOs), strengthening farmers’ capacity through training on agricultural best
practices for enhancing crop productivity in sustainable manner, ensuring access to and usage
of quality inputs and services, and facilitating access of the producer groups to fair and
remunerative markets for marketing the crop produce as well as their value added products,
where feasible.
BOX 13.3 Some cases of ISAP promoted FPOs
# Schemes Locations
1 National Food Security Mission
(NFSM) Number of FPOs – 15
Number of farmers- 15000
Crops – Pulses & Cereals
Karnataka Raichur : Manvi, Lingasur, Devadurg and Raichur
Maharashtra Aurangabad : Paithan, Aurangabad, Vaijapur, Kannad and
Gangapur
Telangana Adilabad : Bazarhathnoor, Jainath and Talmudgu
2 MP Special Project Number of FPOs –12
Number of farmers- 12000
Crops – Pulses & Cereals
Rewa: Gurh and Huzur
Sidhi: Majhauli and Rampur Naikin
Shivpuri: Shivpuri and Pohari
Sheopur: Beerpur
Guna:Guna and Bamori
Hoshangabad: Piparia, Sohagpur and Bankhedi
3 Mission for Integrated Development
of Horticulture (MIDH) Number of FPOs – 3
Number of farmers- 3000
Crops – Fruits & Vegetables
Bhiwani: CharkhiDadri, BawaniKhera, Bhiwani, Tosham, Siwni
and Loharu
Sirsa: Dabwali, Rania, Sirsa, Ellenabad, NathushriChopta, Odhan
and Baragudha
Jind and Kaithal: Jind, Julana, Safidon, Uchana, Alewa,
Narwana, Pillukheda, Cheeka (Gulha), Kaithal, Kalayat, Pundri
and Siwan
4 Producer Organisation Development
Fund (PODF), NABARD Number of FPOs – 19
Number of farmers- 950
Crops – Milk & allied products and
Vegetables
Amritsar: Chogowan, Jandiala, Rayya
TarnTaran: Chohla sahib, Bhikiwind
Gurdaspur: Dera Baba Nanak, Qadian
Pathankot: Bamial, NarotJaimalsingh, Sujanpur
Kapurthala: SultanpurLodhi, Dhilwan, Kapurthala
Karnal and Kurukshetra
Doubling Farmers’ Income – Volume XIII
Structural Reforms and Governance Framework
140
# Schemes Locations
5 Karnataka Special Project Number of FPOs – 15
Number of farmers- 15000
Crops – Fruits & Vegetables
Gadag: Gadag
Ballary: Hospet,
Koppal: Koppal, Kushtagi
Bidar: Humnabad
Raichur: Raichur
Yadgiri: Yadgiri
Gulbarga: Aland
Hassan: Channaraypattan, Belur
Kodagu: Madikeri
Dharwad: Hubli, Dharwad
Haveri: Haveri, Hangal
6 Vegetable Initiative for Urban
Clusters (VIUC) Number of FPOs – 2
Number of farmers- 2000
Crops – Vegetables
Ajmer : Peesangan and Sri Nagar
Source: http://www.isapindia.org
Annotation
Creation of farmer groups such as Cooperatives, Farmer Producer Organisations (FPOs),
Village Producer Organisations (VPOs), etc., in which farmers are equal partners is very crucial
for imparting efficiency of agriculture at various stages of the operation. They are particularly
helpful in linking farmers directly with the markets and for scaling up post-harvest operations.
The aggregation of farmer into FPOs (Cooperatives/SHGs/FIGs/Company), augment their
integration into the supply chain, and in taking up roles traditionally operated by market
intermediaries. Strengthening the post-harvest logistics does increase the demand for farmers’
produce and benefits them in a less direct manner.
The main advantage of strengthening the post-harvest logistics goes to those engaged in this
business. No doubt, this does increase the non-farm income component in the rest of the
economy. However, where farmers get involved in the post-production operations, a more
direct benefit is extended. The most critical point in the entire supply chain of farm harvest, is
the initial aggregation and preparation of marketable logistics loads, so as to efficiently connect
with terminal markets of own volition. The benefits also depend on the extent to which the
farmer is directly involved as a partner in the post-harvest activities and logistics. Unless the
farmer is part of an FPO and/or a cooperative society, his share of the benefits is going to be
rather small in terms of the remunerative price and/or enhanced sale of his produce.
FPOs have performed well in states like Maharashtra, Madhya Pradesh and Kerala; farmers
there have been able to realise higher returns for their produce. But still most of the FPOs
remain engrossed in addressing issues of technology infusion, crop planning, input supply and
primary marketing. They are supposed to expand their roles further up the value chain, entering
into post-harvest management, transport, storage and value added processing and engage in
contract production of primary agricultural produce, for which cooperatives could play a very
crucial role. Thus, linking FPOs with already existing cooperatives would facilitate aggregation
and pooling of the output from farms and in establishing the market linkages, decreasing post-
Doubling Farmers’ Income – Volume XIII
Structural Reforms and Governance Framework
141
harvest losses as well as optimising transaction costs.
It is also necessary to encourage FPOs into crop activity specific cultivation on contiguous
parcels of land for better efficiency. To take advantage of higher scales of operations, there is
need for FPOs to collaborate and federate into Village Producer Organisations (VPOs).

Doubling Farmers’ Income – Volume XIII
Structural Reforms and Governance Framework
143
Minor Forest Produce – Core of Tribal Economy
In pockets where the concentrations of tribal population is high and where they live in close relation
with the forests, the gathering of non-timber forest products (NTFPs) and what are commonly called
as minor forest produces (MFPs) contribute substantive income to the families. Simultaneously,
agriculture in these regions is very difficult and the farm incomes are low. It is, therefore, important
that gathering of MFPs is considered at par with agriculture and provided necessary environment for
high level monetisation.
Tribal Society and Cultivation Practices
As per 2011 Census, the Tribal community population of the country accounts for 8 per cent.
While the tribal population is spread across the nation’s geography, the concentrated pockets
mostly pan across the Central Indian, Eastern and North-Eastern States. In a number of eastern
states like Jharkhand, Odisha and Chhattisgarh the tribal population goes up to as high as 23
per cent, and within these states there are districts with tribal community as the majority
population. The social and economic life of these communities is woven around the forests,
dwell as they amidst the forests.
In majority of such areas, not only is agricultural land not settled under individual ownership
and continues as community owned land, the practice of agriculture is also not sustainable.
Since agriculturally fertile land as the ratio of the total land in their dwelling region is less, the
tribal society practices shifting cultivation along the slopes of hillocks which goes by different
names like jhum, podu, etc. The practice in essence is slash and burn, where under the
vegetation is put to fire during summers and the land is readied for raising millets and pulses.
After raising the crops in successive years for about 3-4 seasons, they move onto the next
hillock, to let the cultivated space rejuvenate. The cycle of such cultivation has gradually
dwindled on account of growing population and restrictions brought under the Forest Act,
making cultivation unsustainable.
The tribal communities gather different kinds of ‘minor forest produces’ (MFP) from the forest
areas and this constitutes a major source of income.
Changing Forest Laws
Over the civilizational times, the traditional forest was a mixed forest that yielded a range of
non-timber forest products (NTFP). These encompassed tree/bush borne oilseeds, fruits,
flowers, roots, shoots, leaves, bark and herbs. They were the source of food and medicine, apart
from constituting the ecology.
The rights of forest were entirely usufructs rights, which meant that there was no claim over
the land. The Forest Act, 1927, changed the nature of relationship between the tribal society
and the forests as the latter came to be notified as ‘out of bound’ for the tribal communities.
With this piece of law, the tribal communities who had been living in symphony with forests
for ages came to be rendered as trespassers. While this position continued for many decades,
Doubling Farmers’ Income – Volume XIII
Structural Reforms and Governance Framework
144
including after independence, the provisions of the Panchayats (Extension to Scheduled Areas)
Act, 1996, commonly known as ‘PESA’ made a favourable breakthrough in favour of the
tribals. However, while the Act conferred the ownership of ‘minor forest produces (MFP)’, it
did not define the term leaving a critical lacuna. In addition, no mechanism was provided for
framing of rules at state level, so that a clear definition could emerge based on the local
circumstances.
Another major deficiency of this Act was that the ownership of MFP was conferred on the
Gram Sabha and not the NTFP gatherers. A favourable change in this regard was came to be
achieved through the Scheduled Tribes and Other Traditional Forest Dwellers (Recognition of
Forest Rights) Act, 2006. This Act commonly known as Forest Rights Act was brought into
correct the deficiencies of PESA. That, this Act confers the tribal-gatherers a legal ownership
over the MFP is a positive measure in the relationship between the tribal society and the forests.
With proper implementation of the provisions of this Act, the rights of tribals society can be
well protected.
Issues relating to MFP
Over the period, large extent of MFP bearing forests have made way for timber plantations
thereby reducing the availability of minor forest produce. The estimated value of MFP in raw
form collected by the tribal communities is around Rs.2 lakh crore a year and these produces
gathered by the tribals find their way for use in various pharmaceuticals, FMCG items and
confectionaries. Various Forest Surveys have brought out that the canopy cover in many for
various forest regions is need of restoration. In order to impart greater relevance to the legal
right that Forests Rights Act, 2016 confers upon the tribal communities in respect of MFPs, it
is important that these forests are developed comprehensively to improve the density and yield
levels. It is estimated that if this is done the value of MFPs in raw form itself would multiply
at least five to six times implying that greater income can be transferred to the tribal
communities.
Apart from the need to develop these forest bearing MFPs, another challenge relates to
capturing the value in favour of the tribal communities. This is akin to what a general farmer
faces in case of the farm grown produces. It estimated that the MFP gatherers received not
more than 20 per cent of the value of their produce and the major share is cornered by the
middle-men. The gatherers are mostly dependent on weekly haats for marketing their produce.
Though there are state corporations dedicated to serve the marketing needs of the MFPs, they
have not fully succeeded in transferring right value to the gatherers. The practices at the weekly
haats are opaque and there exists no marketing system to ensure fairness & efficiency of
transactions. The share of the gatherers in the consumer’s rupee in case of MFP at 20 per cent
is lower even than a horticulture producer’s share, which stands at 50 per cent and is much
lower than that in case of a cereal producer whose share is anywhere around 70 per cent. The
challenge and answer to improving the incomes from MFPs in favour of the tribal communities
lies in creating an efficient marketing structure that will remove intermediaries who do not add
Doubling Farmers’ Income – Volume XIII
Structural Reforms and Governance Framework
145
any value, and thereby increase the share of the MFP gatherers in consumers’ rupee to a
minimum level of 50 per cent. Along with efficient marketing, other dimensions of
monetization include logistics (storage, transportation etc.); and value addition which will
further push up the share in the consumers’ rupee. The scope for promoting value addition
facilities in case of MFPs is vast.
Recommendations
(i) It is necessary to recognize non-timber forest products (NTFPs) as a source of income
at par with agriculture in case of the tribal communities and facilitate them to improve
the practices of gathering MFPs. This requires proper training and orientation, use of
appropriate mechanization process and harvesting practices.
(ii) It would help to promote the self-help groups (SHGs) of the gatherers and provide them
with a well-appointed place (drying yard, storage, primary processing support etc.) so
that the small lots can be aggregated and traded more efficiently.
(iii) The trading of MFPs can also be integrated with online agriculture trade platforms like
e-NAM by developing needed standards, rates etc. and developing assaying labs. The
provision for trading in MFP including online trading can become part of the State
Marketing Act APLM or if the states feel necessary they may enact a separate Act on
similar lines as that of Agricultural Marketing. The Act can be called as Minor Forest
Produce Marketing (Promotion and Facilitation) Act. The Union Ministry of Tribal
Welfare can develop and share Model Act and Rules with the states for adoption.
(iv) Comprehensive development of the NTFPs may be taken up and funds available under
various ongoing schemes like MGNREGA, Tribal sub-plans etc. can be used.
(v) MFP value-system supported by integrated value-chain and supply-chain management
may be put in place.
(vi) Now that the government is promoting agro-forestry and bamboo under the National
Bamboo Mission outside the forest areas, even these products can become part of the
MFP value-system.

Doubling Farmers’ Income – Volume XIII
Structural Reforms and Governance Framework
147
Support Tools
The process of transformation of agriculture and re-positioning it as an income-yielding enterprise
calls for certain tools that help measure the farm income, monitor performance in real time and forecast
demand and price for an array of agri-commodities enabling the farmer to make rational production
and marketing decision. This chapter deals with some of these needed support intervention.
Measuring of Farmers’ Income
The progress of agriculture so far has been monitored more in terms of area coverage,
production and productivity. These are no adequate mechanisms existing, if income changes
are to be measured. There is no system of direct measurement of farmers’ income at fixed
intervals. This would be a sine-qua-non, considering that the strategy for doubling farmers’
income is time bound. Even if there is no such time-bound target, it would help in annual
measurement of farmers’ income (farm + non-farm income) to evaluate the progress and make
necessary interventions. This would be a very effective instrument in transitioning agriculture
as an agri-business, besides serving as one of the important measures of farmers’ welfare.
Measuring Farmers’ Income – attempts so far
The attempts / approaches so far have not been direct and comprehensive in estimating the farm
income. They have been largely based on point information, besides not being comprehensive
on account of paucity of data and aggregation issues. The approaches adopted hitherto are:
i. Farm business income from CACP data.
ii. Aggregate and disaggregate farm income using CSO and NSSO data.
iii. Income estimates based on Situation Assessment Survey (SAS) of NSSO
It is the estimates of this survey (SAS, July 2012-June 2013) that have been used by the DFI
Committee in working out the base year (2015-16) farmers’ income, and to estimate therefrom
the needed annual growth rates to double farmers’ income by 2022-23 (Chapter 6, Volume-II
of DFI Report).
It would help knowing, that NSSO’s SASs were carried out based on a sample survey in the
year 2002-03 (59th Round) and 2012-13 (70th Round). While the 59th Round was called the
situation Assessment Survey of Farmers’ the 70th Round (July 2012 to June 2013) was called
the SAS of Agricultural Households. Notwithstanding some variation between the two Rounds
in defining the farmer / agricultural household, the respective estimates of income per
agricultural households are comparable after suitable normalization. As per these Surveys, the
total income per agricultural household grew at an annual rate of 11.75 per cent from Rs. 25,380
in 2002-03 to Rs. 77,112 in 2012-13. As a result, the income in nominal terms doubled in 6
years. When measured in real terms (after neutralising the effect of inflation), the annual
income growth was 5.24 per cent.
A wholesome and accurate approach to monitoring of farmers’ income calls for adopting a
Doubling Farmers’ Income – Volume XIII
Structural Reforms and Governance Framework
148
standardised methodology. This has been examined by National Institute of Agricultural
Economics and Policy (NIAP), whose concept note is enclosed as Annexure-III to this Volume.
A standard approach to estimation of farmers’ income would help in:
quantifiable route to measure the changes over time and adopt corrective interventions;
measure intra-farmer class income spread and move towards equitability; and
measure inter-profession (agriculture vs. other sectors, as also national averages)
income behaviour and move towards equitability
Regular surveys to measure farmer’s income, having defined a farmer, is necessary and this
should be taken up on a priority basis.
MIS Based Dashboard - Effective and Qualitative Implementation
There is surfeit of data collected at various hierarchical and horizontal levels by different
divisions & organisations within the department / ministry, as also across the departments /
ministries. Unfortunately, the data structure is not uniform. The architecture of Applications,
Portals, Websites and other data / information collection points is not standardised. The result
is isolated databases, that cannot talk to one another. Required, and possible today, is an
effective tool for real time evaluation and monitoring of the performance vis-a-vis the laid out
targets. An inter-operable and open source architecture will help in seamless integration
through cross DB intelligence and use the power of big data analytics and its interpretation for
visualising patterns & trends and delineating the messages.
An appropriately designed Management Information System (MIS), operated via dashboard,
will serve as a command and control system. When installed on need to know basis, at various
hierarchies – Gram Panchayat - Block/Taluk – District – State - National levels, it will provide
for seamless sharing of data and information, and interpreted in a harmonised language and
format. It is then possible to work for a shared vision, common mission and for universally
accepted objectives & targets.
This will also facilitate an efficient and effective implementation at various levels. The quality
of implementation has always remained an issue. MIS will help in adopting outcome based
implementation strategy, so that one is monitoring beyond quantitative targets of works and
expenditure. It is possible to adopt key performance indicators for each of the programmes &
projects and monitor their progress from a qualitative perspective.
Rationalisation of Organisations
In response to specific needs arising from time to time, several organisations have come up
over the years. They may be within an individual department or ministry or outside. These
organisations are generally in the nature of autonomous bodies, attached offices, corporations,
boards and directorates.
Doubling Farmers’ Income – Volume XIII
Structural Reforms and Governance Framework
149
There are overlaps in mandates across these, leading to not just duplication, but at times also
leads to cross-purpose work or differing messaging. This is in addition to the avoidable
establishment costs on men and material.
Within the Ministry of Agriculture itself, there are several such organisations under each of its
three (3) departments (DAC&FW, DAHD&F and DARE/ICAR).
Restructure, Reorganise, Re-mandate
From the stand point of improving the efficiency and effectiveness of service delivery for the
farmers, it would be useful to undertake an exercise that will lead to restructuring &
reorganisation, as also re-mandating of various organisations / institutions / divisions within
the Department / Ministry of Agriculture to address the current and future needs of India’s
agriculture. In doing so, the Ministry will stand to benefit from deriving optional outcomes
from its organisations at both individual and collective levels.
As an illustration, there can be supplementary work relationship between the Directorate of
Crops (now under Crops Division of DAC&FW) and Directorate of Plant Protection (35 units
of CIPMCs, 6 units Locust Forecast Centres) under the Plant Protection Division of
DAC&FW). The Crops Division which monitors the crop situation across the country can
benefit from inputs from PP Division. A synergy is possible if the two Directorates are able to
work in close coordination.
Further, from the cost-saving perspective, the two Directorates may find it useful to share their
infrastructure. Sometimes, the two Directorates are located in two different buildings at the
same location. A physical integration through sharing of buildings will help in sharing and
supplementing / complementing each other’s work, besides offering the farmers and other
stakeholders a single window service facility.
Taking another case of probable overlap in mandates, the Directorate of Extension and
MANAGE (National Institute of Agricultural Management and Extension) need to have well
defined roles and responsibilities for maximising their reach in terms of extension research,
knowledge and diffusion. While these two are under the Division of Extension of DAC&FW,
there is NIAM (National Institute of Agricultural Marketing) under the Marketing Division of
DAC&FW. There is some amorphousness in marketing domain between MANAGE and
NIAM. At the least, there should be sharper clarity for greater coordination.
The DMI (Directorate of Marketing and Inspection), an attached office of the DACFW, is
another appropriate candidate as an example of the suggested restructuring, reorganisation and
re-mandating. DMI was set up in the year 1939 with a primary mandate to support market
inspection. It now maintains the AGRIMARKNET portal, AGMARK standards and
laboratories. It is more of a regulatory body. Over the period, some sundry activities have been
assigned to DMI like inspection of storage godowns under the DACFW’s ISAM. The
organisation hosts several field units and laboratories across the country and is manned by well
Doubling Farmers’ Income – Volume XIII
Structural Reforms and Governance Framework
150
qualified personnel with domain knowledge in agricultural Marketing, chemistry etc.
As discussed in Chapter 9 of Volume IV and chapter 4 of this Volume, demand and price
forecasting are essential to help the farmers with information on these two important aspects
of marketing. There is thus a need for setting up an institutional mechanism for this, which
DMI can handle after subjecting it to suitable restructuring and reorganisation. The DMI can
further be supported in this respect by CACP (Commission on Costs and Prices) and DES
(Directorate of Economics and Statistics), both working in the Ministry of Agriculture itself.
DES collects cost of production data for CACP to examine and recommend MSPs for 25
commodities. DES also monitors area and production statistics for various crops and releases
4 Advance Estimates and 1 (one) Final Estimate of area and production. An institutional
mechanism can bring all these 3 institutions along with the Price Monitoring Systems of the
Department of Consumer Affairs to offer to the farmers’ price and demand forecast based
signals. This will form the basis for a rational decision by the farmers.
Going beyond a single department or ministry, one finds that there are a plethora of institutions,
whose output can be utilised for agriculture sector. But there is no institutional arrangement to
build conduits across these and create a common pool of knowledge.
Taking the case of Public Extension Service providers under different departments and
ministries of Government of India alone, there are as many as 68 institutions. In addition, there
are at least 22 number of inter-governmental institutions; and many at the state level too (refer
Annexure II of Volume-XI). All these are concerned with the farmer in one or more of his
activities. The challenge of governance, therefore, is to bring about coordination and
convergence among them in optimal service of Indian agriculture. Re-mandating some of these
organisations to meet the current challenges is useful.
The DFI Committee, therefore, suggests that a Group from within the Ministry of Agriculture
may be set up to study and make suitable recommendations on:
i. Building a conduit among various institutions, so as to reconcile their services and
optimise delivery at the level of department, farmers and other stakeholders.
ii. Identifying institutions that need to be strengthened or restructured, reorganised, re-
mandated and relocated.
iii. Promoting single window services.
If such an exercise is taken up by the states too, greater efficiency can be achieved. While doing
so, the supplementary relationship and partnership focus among national and state level
institutions may be kept in mind.
Divisions within Ministry of Agriculture & Farmers’ Welfare
As laboured through the preceding Volumes of this Report, the approval advocated is to
transform agriculture into agri-business, for bringing focus on management of agriculture as a
Doubling Farmers’ Income – Volume XIII
Structural Reforms and Governance Framework
151
professional and profit making enterprise. This entails enlarging the attention of the policy
makers and implementing agencies beyond the production segment. Though changes are
visible over the last few years, much sharper and focused emphasis is necessary.
The need is to reorganize some of the Divisions so as to bring into focus some new aspects like
agri-logistics, investments for capital formation, primary processing etc. while a
comprehensive exercise may be needed, some following suggestions are made:
(i) Division of Marketing and Agri-logistics: Presently, the Division of Marketing in
DAC&FW does not concern itself much about the varied aspects of agri-logistics except for
dry storage. Other aspect like cold storage and transport is dealt by the Division of Horticulture
and the overall policy is not coordinated at any single point of decision. For effective promotion
of a restructured market system and -logistics, one of the Divisions needs to be mandated with
policy formulation and coordination, even when different segments and its implementation are
the subject domains of other Divisions. It is, therefore, suggested that the Division of Marketing
be reorganised as ‘Division of Agricultural Marketing and Agri-logistics’.
(ii) Division of Investments and Secondary Agriculture in DAC&FW: Now, there is
a Division of RKVY-RAFTAAR, that handles the allocations under RKVY. This is a scheme
that promotes strategic investment in production and post-production investments. As
recommended in Volume-II, the importance of capital formation in accelerating the growth of
agriculture has been highlighted. There is an urgency to scale up the magnitude of investments
under public and private sectors. It is suggested that Division of RKVY is upgraded as the
‘Division of Investment and Secondary Agriculture’. It may be mandated to draw up policies
for promoting Gross Capital Formation (GCF) in agriculture, and coordinate with different
Divisions and various departments and Ministries, so as to deliver convergence where needed
and optimisation of investments. This Division may also look after promotion of enterprises
linked to agriculture, i.e. secondary agriculture.
(iii) Division of Investments and Secondary Agriculture in DAHDF: As mentioned in
case of DAC&FW, a similar division on investment and secondary agriculture, is
recommended in the Department of Animal Husbandry, Dairying & Fisheries, which will focus
on livestock sector.
(iv) Division of Crops and Primary Processing: The Division of Crops majorly focuses
on production activities. Considering the need for capturing the value from agri-commodities,
the Division may be restructured as the ‘Division of Crops and Primary Processing’ to bring
focus on primary processing of the harvested produce at farm gate level. Additionally, the
Division should also concern itself with grain storage and small storage systems at individual
farm level. For this purpose, the Division may need to coordinate with erstwhile Division of
Marketing, as also the Division of Horticulture.
There are a few examples, and a diligent exercise by the Departments will help in positioning

Doubling Farmers’ Income – Volume XIII
Structural Reforms and Governance Framework
152
their existing Divisions to meet the new requirements arising from income based approach to
agriculture.
Reforms and Ranking – Ease of Doing Agri-business
As well recognised by now, the reforms and liberalization story of India’s economy that begins
in 1991 has left out agriculture sector to a large sector. Nevertheless, there were some good
initiatives taken as well, in agricultural marketing (Model APMC Act, 2003 and Model APMC
Rules) and agricultural trade (removal of stock limits under control orders in 2006). However,
the agriculture sector still needs to adopt comprehensive reforms with a view to ease:
(i) Pooling of land
(ii) Mobilisation of farmers
(iii) Promoting marketing efficiency
(iv) Developing logistics infrastructure for market connectivity
(v) Making available inputs that are low in cost and high in quality
The reforms and modalities involved are many and these need to continue to evolve over time,
to remain in context with other developments.
Suggested Basket of Reforms
To promote land pooling
i. Adoption Land Lease Act
ii. An Act to facilitate licensing of land cultivation
To promote farmers’ pooling
i. Contract Farming and Services Act
ii. Farmer Producer Organisations (FPOs)
To promoting market efficiency
i. Adoption of Model APLM Act, 2017
ii. Agri-value system platform
iii. Strengthening of primary Rural (grameen) Agricultural Markets (GrAMs)
iv. Strengthening of unified National Agricultural Market – online trade
v. Strengthening decentralised procurement – adoption of ‘Market Assurance
Scheme (MAS)” and other measures.
All the above basket of reforms vide paras 10.5.1, 10.5.2 and 10.5.3 have been discussed in
detail in different Volumes and chapters – mainly Vol. III, IV and XIII-A, may be referred.
Liberalisation of input supply
Apart from land, other important inputs that are important in the production system are seeds,
fertilizers and pesticides (both chemical and biological). They need to be made available to the
farmers in right time, in right form / formulation, in right quality and at right rate. In fact, these
Doubling Farmers’ Income – Volume XIII
Structural Reforms and Governance Framework
153
three inputs account for a bulk of cost of cultivation. Their production / manufacture, therefore
needs to be competitive, so that multiple options are available to the farmers. Today, both cost
and spuriousness have become a cause of concern. The laws relating to registration and
licensing in respect of these 3 inputs are as follows:
i. Seed Act
ii. Fertilizer Control Order
iii. Insecticide Act
All 3 of these pieces of legislation need to be reformed in farmers’ interest. They have been
discussed in chapter 6 of this Volume.
Ranking of States
Competition can bring in a healthy spirit of achieving excellence and performing better than
others. The “Ease of Doing Business” ranking of the World Bank at global level has
demonstrated, that nations tend to compete and perform better. Within the country too, the
“State of States” ranking by India Today magazine has introduced an element of healthy
competition. The Prime Minister’s Civil Services Awards by evaluating the performance of
Districts in respect of Government of India’s flagship schemes has also proved, that healthy
competition can trigger change.
The NITI Aayog has identified five states and 200 districts that are lagging in terms of
development, based on five domains including agriculture. In order to enhance the overall
economic growth of the country on a sustainable basis, the NITI Aayog recommends special
focus on these identified states and districts. The NITI Aayog is aiming at live competition for
all the stakeholders based on measureable achievements in respect of the five domains. This is
initiative is also with the rationale that competition will bring out the best among all the
stakeholders and lead them into better performance than hitherto.
On similar lines, it is suggested that inter-se ranking of all states and UTs may be taken up on
an annual basis on “Ease of Doing Agri-business”. A quantifiable, parameter based evaluation
of states and UTs vis-à-vis the reforms done during the year to effect simplification of
procedures, transparency, objectivity, etc. may be adopted. Such recognition itself is expected
to position the states appropriately and help them attract investments. However, care must be
taken to build an evaluation scale that is agreeable to all parties and is conducted by a third
party in a credible manner.
Annotation
The EBA Project of the World Bank Group, refers to the assessment of data from various
countries, on laws and regulations that impact the enabling business environment for
agriculture. Commenced in 2013, the project has released three reports on ‘Enabling the
Business of Agriculture’ (EBA). The EBA2017 report covers a total of 63 countries and
included India for the first time. The report studied 12 core topics that relate to ease of business
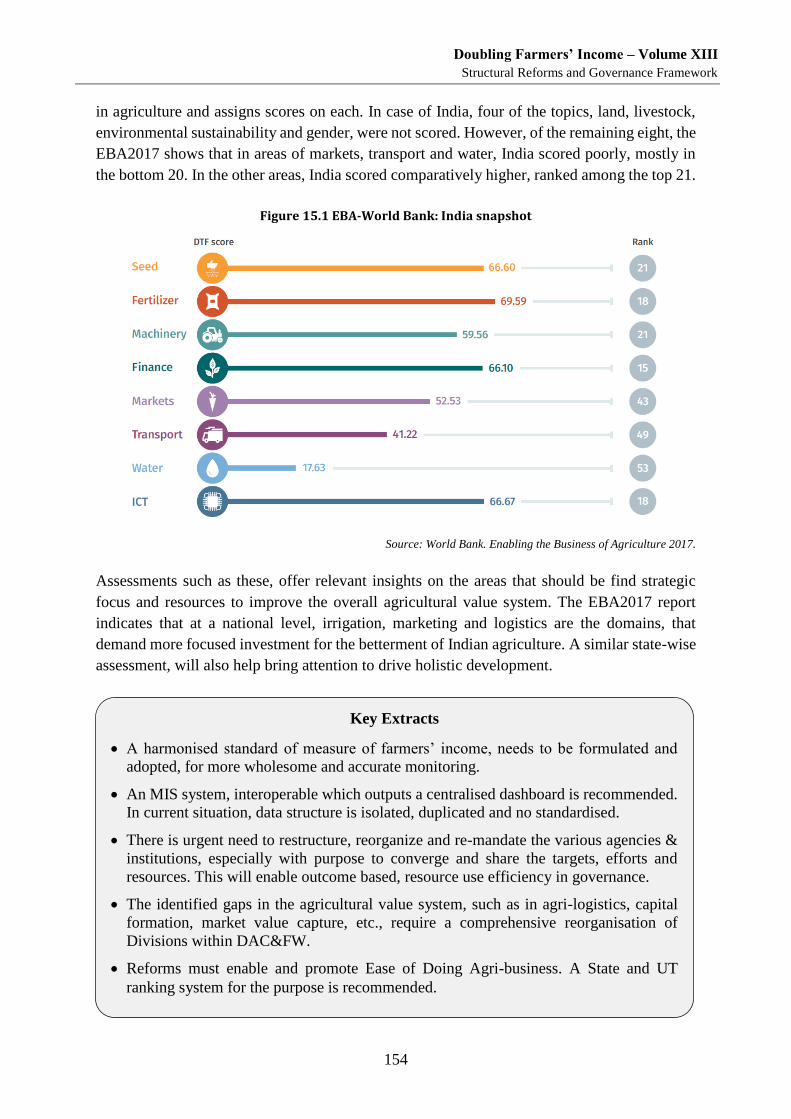
Doubling Farmers’ Income – Volume XIII
Structural Reforms and Governance Framework
154
in agriculture and assigns scores on each. In case of India, four of the topics, land, livestock,
environmental sustainability and gender, were not scored. However, of the remaining eight, the
EBA2017 shows that in areas of markets, transport and water, India scored poorly, mostly in
the bottom 20. In the other areas, India scored comparatively higher, ranked among the top 21.
Figure 15.1 EBA-World Bank: India snapshot
Source: World Bank. Enabling the Business of Agriculture 2017.
Assessments such as these, offer relevant insights on the areas that should be find strategic
focus and resources to improve the overall agricultural value system. The EBA2017 report
indicates that at a national level, irrigation, marketing and logistics are the domains, that
demand more focused investment for the betterment of Indian agriculture. A similar state-wise
assessment, will also help bring attention to drive holistic development.
Key Extracts
A harmonised standard of measure of farmers’ income, needs to be formulated and
adopted, for more wholesome and accurate monitoring.
An MIS system, interoperable which outputs a centralised dashboard is recommended.
In current situation, data structure is isolated, duplicated and no standardised.
There is urgent need to restructure, reorganize and re-mandate the various agencies &
institutions, especially with purpose to converge and share the targets, efforts and
resources. This will enable outcome based, resource use efficiency in governance.
The identified gaps in the agricultural value system, such as in agri-logistics, capital
formation, market value capture, etc., require a comprehensive reorganisation of
Divisions within DAC&FW.
Reforms must enable and promote Ease of Doing Agri-business. A State and UT
ranking system for the purpose is recommended.
Doubling Farmers’ Income – Volume XIII
Structural Reforms and Governance Framework
155
Operationalising DFI Strategy - An Empowered Body
The process of transformation of agriculture and re-positioning it as an income-yielding enterprise
calls for focused inter-ministerial coordination and constant monitoring. Further, regular stewardship
will be required, to re-orient and support both the policy formulation and the implementation apparatus
to achieve the desired outcome in a time-bound manner.
Setting a New Course for Agriculture
The Prime Minister of India has, in sharing a new vision for the farmers of the country, laid
out a challenge, to double farmers’ income by the time the country celebrates its 75th year of
Independence in 2022. This challenge, though on the face of it, targets primarily the farmers,
it in reality touches all Indians. For everyone, including the consumers, are affected by the
status of agriculture and financial health of the farmers. The target is achievable with a good
strategy, well-designed programmes, adequate resources and efficient governance framework
for implementation.
The strategy is discussed in the various volumes of this Report, including making specific
recommendations in Volume XIV. New interpretations have been tabled by this Committee by
redefining various concepts that were in vogue for long. Many of the policies & programmes
that can support the DFI strategy are in place, and will serve the purpose better with appropriate
changes. And, there is need for new ones too. It is in this context, that certain recommendations
have been made to restructure the existing ones, including the governance mechanism, and also
adopt new ones as needed. It is also important, that the available resources are prioritised and
the strategy does allow to suitably improve upon the capital and resource use efficiency, as
efforts are made to channel additional resources by creating a stake for multiple agencies.
The vision requires a grass root level shift in the attitude towards agriculture, in all citizens of
the country, including among farmers and in the government agencies at different levels of
hierarchy. The DFI Committee in its discussions felt that there is an urgent need to bring about
a mind-set change amongst all stakeholders. What logically follows is the usefulness of
creating a dedicated ‘Centre-Point’. Otherwise, with diffused responsibility, the historical
agenda that seeks to bring about a farmers’ income revolution, can get lost. Sometimes, it may
be a situation of missing the wood for the tree. The DFI Committee through its multi-
stakeholder consultations, intra-committee deliberations and dissection of the complex
agricultural value system was drawn to a logical conclusion, that the DFI strategy implies
“Farmers’ Income Revolution”.
The agriculture sector needs an overhaul, and not just a transformation, if farmers’ income is
to be enhanced substantively and consistently. This makes a case for a change in the narrative,
that the time has come to transcend from ‘Green Revolution’ to ‘Income Revolution’, to give
meaning to a comprehensive change. Green revolution, with its major emphasis on production
attempts, is only a partial treatment of the agricultural sector. Income revolution impresses
upon production through productivity, sustainability, marketability and an orientation shift
Doubling Farmers’ Income – Volume XIII
Structural Reforms and Governance Framework
156
towards farmers’ income as outcome.
Agriculture is a large field, that cuts across multiple disciplines and domains. The vast number
of recommendations listed in this Report, especially those requiring coordination and
convergence among the disciplines, may get mislaid without appropriate guidance. The
Committee observed, that the valuable recommendations of various commissions and
committees, tend to get lost when translating into implementation, not just in agriculture but
elsewhere too. The loss may be attributable to various factors including the absence of a
dedicated centre-point to shoulder the responsibility and drive the mandate into actuality.
In reviewing the array of interventions that are planned for agriculture, it is amply clear, that
land is no more the principle laboratory where the change has to be initiated. The new
lab to effect change is the mind, and the market is the new theatre of operations. To
reiterate, a complete overhaul and not mere tinkering with the approach is required. It is
apparent, that there is need to direct ardent efforts that will advocate this required change in
thinking among farmers in their demands, scientists in their endeavours, market actors in their
operations, and of course the policy formulation apparatus in its approach. The governance
system will also require a paradigm shift, and adopt an orientation that is outcome linked.
It is common experience, that the administrative machinery is many a time held responsible for
poor implementation. Integrity of implementation is as important as tailoring a comprehensive
policy and structuring field-appropriate programmes. The challenge gets more daunting, when
it is a complex and risk-prone enterprise, like that of Agriculture. The task gets further uphill,
when it is to be implemented for 120 million farm families living across a vast geography.
That, agriculture is a state subject and calls for partnership between Centre and States/UTs (as
many as 35) is another facet that needs to be factored in. Hence, there is the need for an
‘Empowered Body’ led by an adequately senior person & supported by a small team of
professionally competent resources; and appropriately empowered. This ‘Body’ is not to
substitute the existing system, but to own bottom line responsibility for carrying forward the
roll out of the DFI strategy. It shall be the Department of Agriculture, Cooperation and
Farmers’ Welfare, that anchors the implementation of DFI strategy. In this capacity, DAC&FW
shall coordinate with and enable synergy of efforts of all other concerned departments /
ministries who are to translate all their specific recommendations into action, just as it acts
upon its own set of recommendations.
Empowered Body
However, the officers down the line beginning with Secretary of the Department/Ministry are
extremely occupied with multiple and administrative tasks. They may hence be challenged, by
both time and the mind space needed to create the implementation framework vis-a-vis the
recommendations. An ‘Empowered Body’ can build such a framework and offer the needed
support system to the principle stakeholders, namely, the DAC&FW and other Departments/
Ministries. As an illustration, one of the DFI recommendations is to popularise the post-harvest
interest subvention based loans. This will call for development of ‘Guidelines’ and an
Doubling Farmers’ Income – Volume XIII
Structural Reforms and Governance Framework
157
‘Operational Strategy’. The Empowered Body should be able to meet this requirement.
Similarly, Model Rules following the adoption of Model APLM Act, 2017 and Model Contract
Farming & Services Act, 2018 will need to be developed. The DFI Report contains several
such recommendations, that need close attention, but may be difficult for the Ministries /
Departments to allot the required time. It is the Empowered Body, that can own such additional
responsibilities and provide the much needed ‘reform and restructuring support’.
Role and responsibility of the Empowered Body
The proposed Body housed in the Ministry of Agriculture and Farmers’ Welfare will require
to coordinate directly with Secretaries of various miniseries and departments, centre and state.
The following roles & responsibilities are suggested to be assigned:
i. Develop necessary Acts, Rules and Regulations for the concerned ministry/department,
so as to assist states and the centre to fast track the required restructuring and
governance reforms.
ii. Draft executive orders and guidelines for the concerned ministry/department, that will
help ease specific bottlenecks in implementation of programs and in executing the
support planned by the government.
iii. Help undertake necessary capacity building and advocacy, to build a greater
understanding among general public, polity, academia and farmers, on the related set
of changes they need to incorporate in their approach towards agriculture.
iv. Coordinate between and among ministries/departments to help bring about a
convergence in the financial resources deployed, for greater resource use efficiency;
and synergy of efforts. This can be initiated for selected activities and regions, at first
instance.
v. Prepare the schedule and monitor the data on income status of farmers on an annual
basis.
vi. Suggest interventions needed for course correction in policy or implementation, which
need may arise, as the agricultural system undergoes transformation.
The DFI Committee views this ‘Empowered Body’, by whatever name it goes, as the final
necessary resource centre. It would be expected to study the recommendations and the logic
behind them, and provide a comprehensive support to the implementing ministries and
departments.
Since the suggested ‘Body’ is expected to coordinate, monitor, guide and mentor the efforts of
multiple ministries and departments, for driving an income revolution for the farmers in the
country, it should be constituted at an appropriate level and in a format that is enabling.
-- X --

Doubling Farmers’ Income – Volume XIII
Structural Reforms and Governance Framework
159
References
Agarwal, B. (2010). Rethinking agricultural production collectivities. Economic and Political Weekly,
27 February, 55(9), 64–78.
Aggarwal, P.K., P.K.Joshi, J.S.I. Ingram, and R.K. Gupta. (2004). Adapting food systems of the Indo-
Gangetic plains to global environmental change: Key information needs to improve policy
formulation. Environ. Sci. Policy. 7:487-498.
Anand, R., Kumar, N., & Tulin, V. (2016). Understanding India's Food Inflation through the Lens of
Demand and Supply. Taming Indian Inflation: Washington, IMF Publications,75-111.
Bathla, Seema (2014). “Public and Private Capital Formation and Agricultural Growth: State-wise
Analysis of Inter-linkages during Pre- and Post-reform Periods”, Agriculture Economics
Research Review, 27(1): 19–36.
Bathla, Seema, P.K. Joshi and Anjani Kumar (2017). “Revisiting Investments and Subsidies to Achieve
Higher and Equitable Income and Poverty Alleviation in Rural Areas across Indian states”,
Report (Unpublished), New Delhi: International Food Policy Research Institute (IFPRI).
Braverman, A., Guasch, L., Huppi, M., &Pohlmeier, L. (1991). Promoting rural cooperatives in
developing countries: The case of Sub-Saharan Africa World Bank discussion paper.
Washington: The World Bank.
CRISIL Research Report (2017) “Pulses and Rhythms: Analysing volatility, cyclicality and the cobweb
phenomenon in prices”.
Das B., Palai N.K., Das K. (2006).Problems and Prospects of the Co-operative Movement in India under
the Globalization Regime, XIV International Economic History Congress, Helsinki, 2006.
De Janvry, A., Fafchamps, M. and Sadoulet, E. (1991). 'Peasant household behavior with missing
markets: Some paradoxes explained', Economic Journal, 101(409): 1400- 1417.
DFI Report Volume-I – August 2017 (draft), Committee for Doubling Farmers’ Income
DFI Report Volume-II – August 2017 (draft), Committee for Doubling Farmers’ Income
DFI Report Volume-III – August 2017 (draft), Committee for Doubling Farmers’ Income
DFI Report Volume-IV – August 2017 (draft), Committee for Doubling Farmers’ Income
DFI Report Volume-V – December 2017 (draft), Committee for Doubling Farmers’ Income
DFI Report Volume-VI – January 2017 (draft), Committee for Doubling Farmers’ Income
Gokarn, S. (2012), ‘Food Inflation: This Time It’s Different,’ Reserve Bank of India Bulletin, vol. 56,
January.
Gulati, Ashok and Seema Bathla (2002). Capital Formation in Indian Agriculture: Trends, Composition
and Implications for Growth”, Mumbai: National Bank for Agriculture and Rural Development.
Hellin, J., Lundy, M. & Meijer, M. (2009) Farmer Organization, Collective Action and Market Access
in Meso-America. Food Policy, 34, pp. 1622
Kumar, V., Wankhede, K.G. and Gena, H.C. (2015). ‘Role of cooperatives in improving livelihood of
farmers on sustainable basis’, American Journal of Educational Research, 3(10), pp. 1258–1266.
Lok Sabha Secretariat (2017) "Comprehensive Agriculture Research based on Geographical Conditions
Doubling Farmers’ Income – Volume XIII
Structural Reforms and Governance Framework
160
and Impact of Climatic Changes to ensure Food Security in the Country”, Thirty Ninth Report of
Standing Committee On Agriculture
Meenakshi, J. V., 2016. Trends and Patterns in The Triple Burden of Malnutrition in India. Agricultural
Economics, 47(S1), 115-134.
Mondal, A. (2010). 'Farmers’ Producer Company (FPC) Concept, Practices and Learning: A Case from
Action for Social Advancement', Financing Agriculture, 42(7): 29-33.
NSSO (2003): “Situation Assessment Survey of Farmers: Some Aspects of Farming,” Report No.
496(59/33/3), 59th Round (January–December 2003), National Sample Survey Organization,
Ministry of Statistics and Programme Implementation, Government of India, New Delhi.
NSSO (2014): “Key Indicators of Situation of Agricultural Households in India,” 70th Round (January–
December 2013), Ministry of Statistics and Programme Implementation, National Sample Survey
Office, New Delhi.
Raka Saxena, Suresh Pal and P.K. Joshi, (2001) Delineation and Characterization of Agro-Ecoregions,
PME Notes 6, ICAR-NIAP, New Delhi
Salvi Gouri, ‘ I too had a Dream’, Verghese Kurien, 2014.
Saxena, R. & Chand., R. (2017). “Understanding the Recurring Onion Price Shocks: Revelations from
Production-Trade-Price Linkages”. Policy Paper-National Centre for Agricultural Economics and
Policy Research, (33).
SFAC.(2017).Small Farmers’ Agri-Business Consortium “Annual Report 2016-17”, Department of
Agriculture, Cooperation and Farmers’ Welfare, Ministry of Agriculture and Farmers’ Welfare,
Government of India.
Shekhar, C., Roy, D. and Bhatt, Y. (2017). “Food Inflation and Food Price Volatility in India: Trends
and Determinants” IFPRI Discussion Paper 01640, Washington DC.
Sonna, T., Joshi, H., Sebastin, A., & Sharma, U. (2014). Analytics of food inflation in India (No. id:
6174).
ToI publication 28th June, 2018 “The One Dhan Route to Gram Swaraj: What it will take to treble tribal
income in two years” (Prabir Krishna, MD, TRIFED)
World Bank. 2013. Turn Down the Heat: Climate Extremes, Regional Impacts, and the Case for
Resilience. A report for the World Bank by the Potsdam Institute for Climate Impact Research
and Climate Analytics.
World Bank Group. 2017. Enabling the Business of Agriculture 2017. World Bank, Washington, DC.
https://openknowledge.worldbank.org/handle/10986/25966 License: CC BY 3.0 IGO
Annexures Doubling Farmers’ Income – Volume XIII
Structural Reforms and Governance Framework
161
Annexures
Annexure-I
System of Collection of Agricultural Statistics and Crop Forecast
For every agricultural year (July-June), the Directorate of Economics & Statistics (DES),
Department of Agriculture, Cooperation and Farmers Welfare, Ministry of Agriculture and
Farmers Welfare releases four Advance Estimates (AE) followed by Final Estimates of
production of major agricultural crops of the country. Each of these five estimates are available
State-wise and at the national level for the 27 identified crops. The time of release and period
covered under each of these estimates are as under:-
The First Advance Estimates are released in September. These cover only Kharif crops,
when Kharif sowing is generally over.
The Second Advance Estimates are normally released in February, the following year
when rabi sowing is also over. The second advance estimates cover kharif as well as
rabi crops. They take into account; (i) firmed up figures on kharif area coverage; (ii)
available data on crop cutting experiments for yield assessment of Kharif crops and (iii)
tentative figures on area coverage of rabi crops.
The Third Advance Estimates incorporate revised data on area coverage for rabi crops
and better yield estimates of Kharif crops. These are released in April-May.
The Fourth Advance Estimates are released in July-August. By this time fully firmed
up data on area as well as yield of Kharif crops and rabi crops are expected to be
available with the States. As such, Fourth Advance Estimates are expected to be very
close to the Final Estimates.
Final Estimates are released about seven months after the Fourth Advance Estimates in
February of the following year. This allows sufficient time to States to take into account
even the delayed information while finalising area and yield estimates of various crops.
No revision in the State level data is accepted after release of Final Estimates.
2. The agricultural estimates at all-India level are prepared on the basis of crop-wise data
on area, production and yield furnished by State Governments. For this purpose, the State
Governments have designated one of their Departments viz. Departments of Agriculture/Land
Records or Directorate of Economics & Statistics as State Agricultural Statistics Authority
(SASA). SASAs finalize State level estimates on the basis of district-wise data on area,
production and yield. At district level, there is a system of effective collaboration between the
officials of SASA and Revenue Department.
3. The district level estimates of production of different crops are obtained through
multiplication of area coverage and average yield of respective crops in a district. For
assessment of area coverage, a comprehensive system has been laid down in each State/UT.
Annexures Doubling Farmers’ Income – Volume XIII
Structural Reforms and Governance Framework
162
Under the above system, the primary worker of Revenue Department i.e. Patwari/Lekhpal visits
each field/survey number and records the crop sown and area during Kharif as well as Rabi
seasons. For this purpose, a sample of 20% villages is selected in such a way that over a period
of 5 years all the villages in a State/UT are covered. For each of the 20% villages selected in
the sample for a particular year, the Patwari prepares a Village Abstract indicating total area
under different crops in the particular village. The area figures are progressively added over
blocks/circles/tehsils/district to arrive at total crop composition in the sample villages in a
district. This multiplied by 5 gives the crop-wise area estimates in the particular district.
4. For assessment of crop-wise yield, the Crop Cutting Experiments (CCEs) are conducted
under the General Crop Estimation Surveys (GCES) of States/UTs. The CCEs are also
conducted by the Revenue Authorities. The number of CCEs for a crop are in proportion to the
area under different crops in a district. A district having 80,000 hectares or more area under a
particular crop is considered as a major district for the crop. Even if the area under the crop in
a district lies between 40,000 hectare to 50,000 hectare but it is higher than the average area
per district for the crop in the State then also the district is considered as a major district for the
crop. All other districts are considered as minor districts for the purpose of conducting CCEs
in a particular crop. Normally, in a major district 80 to 120 CCEs and in a minor district 44 to
46 CCEs for a crop are conducted.
5. For CCEs, a multi-stage stratified random sampling is adopted. Tehsils within a district
are considered as strata and villages within tehsils are taken as first stage sampling units. After
preparing the list of survey numbers with the specified crop in a selected village, two survey
numbers are selected as second stage units for conducting CCEs. In each of the two survey
numbers selected, an experimental plot of specified size is earmarked and the crop within the
specified plot is harvested to arrive at the yield per hectare for the plot. The average yield of
all the CCEs on a crop in the particular district is taken as the yield for the district. The CCEs
are conducted in the villages selected from within the 20% villages identified for area
enumeration. Out of total 1,20,000 villages selected for area enumeration in a particular year,
a sample of about 10,000 villages is selected for checking/supervision of area enumeration and
conduct of CCEs by the staff of SASA, Agriculture Department and National Sample Survey
Office.
6. While finalising all-India level estimates, the crop-wise data on area, production and
yield received from State Governments are thoroughly scrutinized on the basis of information
from alternative sources on area, production and yield such as Mahalanobis National Crop
Forecast Centre (MNCFC) and Institute of Economic Growth (IEG) under Forecasting
Agricultural output using Space Agro-meteorology and Land based observations (FASAL)
Scheme, rainfall conditions, previous crop-wise trends of area, production and yield in the
respective States as well as commodity-wise trends in prices, procurements etc.
7. Thus Government has a well-established system of regular assessment of production of
major agricultural crops in the country on the basis of reports on area, production and yield of
major agricultural crops received from State Agricultural Statistics Authorities (SASAs) in
Annexures Doubling Farmers’ Income – Volume XIII
Structural Reforms and Governance Framework
163
various States/UTs. This system allows the Ministry to get an assessment of State-wise area,
production and yield of major crops within the shortest time after the sowing of crops in a
season is over. Thus, Government is in a position to take policy decisions regarding import,
export, procurement, etc. of agricultural commodities. The very purpose of having a series of
four successive estimates during the year is that the estimates of agricultural production in the
country may be refined and improved as the year progresses and better, firmer data on sowing
and yields become available. However, though the estimates are periodically revised, the
preliminary estimates for kharif released, in September, and those for rabi, released in
February, can be used for policy decisions related to import, export and pricing.
*****
Annexures Doubling Farmers’ Income – Volume XIII
Structural Reforms and Governance Framework
164
Annexure-II
NOTE ON HORTICULTURE STATISTICS
Coverage:
Horticulture sector covers wide range of sub-sectors viz. fruits, vegetables, spices, floriculture,
aromatic and medicinal plants, honey etc. Government is maintaining the data for about 161
major crops.
Relevance of Horticulture Statistics
Horticulture, which has gained commercial importance in the recent years, is an important
component of Agriculture, having very significant share in the economy of the country. India
has the advantage of diverse agro-climatic conditions which enables it to produce a wide range
of horticultural crops round the year. The horticulture crops also provide better alternative for
diversification of Indian agriculture in view of higher return. It plays an important role in
country’s nutritional security as well, including poverty alleviation and employment
generation.
Present Status of Horticulture Data
At present horticulture data is available in respect of area and production. Multiple agencies
like Department of Agriculture & Cooperation through State Horticulture Department;
Directorate of Arecanut & Spices Development (DASD) for Arecanut and spice Crops,
Directorate of Cashewnut and Cocoa Development for Cashewnut and Cocoa and Honey
Board for honey are involved in collection/ compilation of this data.
While the estimates of area are based on Girdawari and on the basis of input supplied etc.,
estimates of production are based on eye estimation, oral enquiry from farmers, productivity
norms as calculated by GCES, Crop estimation survey- Fruits & vegetables (CES-F&V).
Estimates so prepared are consolidated by the Horticulture Statistics Division of DAC and
approved by a Review Committee under the Chairmanship of Principal Adviser, Department
of Agriculture and Cooperation, Economic and Statistical Adviser, DAC&FW, Joint Secretary
(MIDH), DAC&FW, Horticulture Commissioner, DAC&FW, Managing Director, National
Horticulture Board, DG, CSO and Adviser (Hort) DAC. as members. The Schedule of Release
of data is as under:-
Estimates Date of finalization Date of receipt of data
from States/UTs
• 1st Advance Estimates of the current year
• Final Estimates of previous year
15th January 10th December
2nd Advance Estimates of Current Year 15th May 1st May
3rd Advance Estimates of Current year 31st August 10th August
Annexures Doubling Farmers’ Income – Volume XIII
Structural Reforms and Governance Framework
165
Methodology
As at present there is no uniform methodology followed by the State Horticulture
departments for estimating area and production of horticulture crops, it is pertinent that the
alternative methodology developed by IASRI, on the recommendations of National
Statistical Commission, is tested on pilot basis in 6 states. It would facilitate in improving
the area and production estimates of horticultural crops and once the testing of the
methodology is completed and is found to be reliable and cost effective, it could be
considered for replication in all the States / UTs of the country.
NEW INITIATIVES TAKEN by the HORTICULTURE STATISTICS DIVISION
1. CHAMAN: (Coordinated programme on Horticulture Assessment &
Management using geoiNformatics ):
This is a new technological initiative taken by this Division using the Remote
Sensing technology and Sample Survey Methodology for development of sound
methodology for assessment of Horticultural crops. This Project was launched
during September, 2014 and expected to be completed by March 2018 at an
estimated cost of Rs. 13.38 Cr. The programme has the objective to develop and firm
up methodology for estimation of area and production under horticulture crops using
“Remote Sensing Technology” and “Sample Survey Methodology”.
Remote Sensing Methodology: The programme is implemented by Mahalanobis
National Crop Forecast Centre (MNCFC). Under this component 7 major crops, viz.
Banana, Mango, Citrus, Onion, Potato, Tomato and Chilli are being covered for Area
and production assessment in 11 major producing states. Besides this Geospatial
Applications studies are being conducted for Horticultural Development and
Management Planning and detailed scientific field level studies are being conducted
for developing technology for crop identification, yield modelling and disease
assessment, through Remote Sensing. The states covered are Tamilnadu, Andhra
Pradesh, Mahrashtra, Gujarat, Karnataka, UP, MP, Bihar, Punjab, West Bengal and
Odisha.
Sample Survey Methodology: This component is implemented by the Indian
Agricultural Statistics Research Institute (IASRI) as “Study to test the developed
alternative methodology for estimation of area and production of horticultural
crops”. Under this component IASRI is covering all major fruits and vegetables in
is making the assessment using sample survey methodology in Five states viz.:
Karnataka, Tamil Nadu, Andhra Pradesh, Himachal Pradesh and Maharashtra.
2. HAPIS: Horticulture Area and Production Information System: Under this
initiative the Division launched a program called HAPIS, with the help of NIC in Feb, 2015
for collection of Horticulture Area, Production statistics from states online. The system
provides online interface to enable crop-wise data in respect of horticulture crops, flow from
block to district, district to states and there-on to the centre after consolidation, validation and
verification by states/districts. Provision has been made for data entry by various agencies
Annexures Doubling Farmers’ Income – Volume XIII
Structural Reforms and Governance Framework
166
providing horticulture data like MNCFC for CHAMAN, Directorate of Arecanut & Spice
Development (DASD) for Arecanut and spice crops, Directorate of Cashewnut and Cocoa
development (DCCD) for cashewnut and cocoa. Under this program all states & above
mentioned agencies have been provided trainings and they are now submitting District level
estimates in respect of 160 horticulture crops along with State level estimates for 78
horticulture crops Online. Recently provision has been made for collection of data on crops
grown under protected cultivation separately through HAPIS.
3. Publication of Horticulture Statistics: For the first time in the history of DAC&FW,
a Publication namely, Horticultural Statistics at a Glance has been brought out which contains
detailed information on the Area, Production Productivity of major crops since 1991-92 till
date. This publication presents a comprehensive picture of the Indian horticulture sector by
using statistical data across states, districts and time periods, covering diverse aspects such as
area, production, productivity, growth trends, percentage share, value of output and so on for
major horticultural crops. Other aspects covered are outlays and expenditure under
horticultural activities; monthly series of prices and arrivals over past year in respect of onion,
potato and tomato; inputs for horticultural crops; exports and imports; infrastructure
availability; India’s position in world scenario of horticulture production and so on.
4. Periodical Reports: The Horticulture Statistics Division has started bringing out
periodical reports on Onion and Potato, giving a comprehensive picture of these crops
regarding production, sowing, arrivals, price trends, exports etc. This is to provide intelligence
reports to the Senior Govt. officers for taking timely decision for ensuring adequate supply and
thereby control prices in the markets.
*****
Annexures Doubling Farmers’ Income – Volume XIII
Structural Reforms and Governance Framework
167
Annexure-III
Concept Note on
Methodology for Estimation of Farmers’ Income
1. Backdrop
The agricultural sector, being prime sector of Indian economy, received continuous attention
of the policy makers and stakeholders. A number of initiative were undertaken to improve the
performance of this sector. For the first time in our history, Hon’ble Prime Minister of India
exhorted to “Double the Farmers’ Income” by 2021-22”and this slogan has enthused and
fuelled lot of energy and motivation among the government organizations and other
stakeholders and helped in channelizing the efforts in the unified direction. Now, a holistic
approach is being followed from top to bottom in an integrated manner and the slogan is
catching the momentum and attention of one and all. DFI goal was also coupled with many
new and well-thought out schemes on crop insurance for mitigating losses (Pradhan Mantri
Fasal Bima Yojana), ensuring effective marketing and marketing reforms through unified
national agricultural marketing platform (e-National Agricultural Market), and improving soil
health via promoting organic farming through Paramparagat Krishi Vikas Yojana for maximising
the gains from farming. The irrigation programs are coordinated with great thrust and direction
under the Pradhan Mantri Krishi Sichai Yojana. These programmes and schemes, with a sound
implementation strategy will bring lot of reforms and modernization in the agricultural sector.
To ensure that DFI mission is moving in the desired direction within stipulated time frame and
taking the corrective action to rectify any imbalances in the economy, it is extremely important
that accurate information on certain indicators which reflect the farmers’ income and welfare
is generated and made available for their monitoring. The most appropriate measure of farmers’
well-being is the level of farm income. A few attempts made by some scholars to prepare
estimates of farm income in the past are based either on a sample of farmers or a particular
segment of agriculture. The researchers and academicians have come out with various
methodologies which provide estimates of farmers’ income; however, the estimates are
available only on point basis. The studies have largely referred to the growth in agricultural
output (VOP/AgGDP/GSDP), output and input price behaviour along with price spread, rise in
wages, rising indebtedness, to indicate the given state of Indian framing.
2. Earlier Attempts
A number of attempts have been made in India to estimate the farm income; however, these
attempts were largely based on the point information. Also, in some cases, the approach could
not cover the sector as a whole due to paucity of data and aggregation issues. An account of
these is given below:
2.1 Farm business income from CACP data: The comprehensive cost of
cultivation scheme of DAC&FW was started in the year 1970-71, which collects and
compiles the data on costs and receipts of selected agricultural crops. Farm Business
income, is thus calculated by deducting the relevant costs from the receipts by the farmers
Annexures Doubling Farmers’ Income – Volume XIII
Structural Reforms and Governance Framework
168
i.e., value added in crop production less factor payments. Such incomes provide a good
indication at the region and commodity level, however, may not be useful in estimating the
aggregate farm business income for the sector as a whole. Farmers’ welfare is closely linked
to the level and trends in farm incomes. Estimates of value added from crop production
can, of course, be obtained for the sector as a whole without detailed cost of product ion
studies – by combining estimates of physical crop production (from area estimates and
results of crop cutting experiments on yields) with estimates of farm-gate prices to obtain
the gross value of output, and by deducting from this estimates of input use obtained by
product-flow methods (state of Indian Farmers). But this shall be largely confined to field
crops. Sen and Bhatia (2004) estimated farm business income using data from the central
Government’s Comprehensive Scheme for Studying the Cost of Cultivation of Principal Crops
in India (COC) from 1981-82 to 1999-00 and included the farm business income both from
crop cultivation and livestock. This was the first comprehensive step towards preparing
estimates of farm income in the country. Though the cost of cultivation data is representative
of crops or crop complexes in major growing states, it does not cover horticultural crops and
several minor crops. Horticultural sector is tremendously growing in India and excluding this
does ignore the major source of potential growth. The data on income from the livestock sector
is not appropriately captured in the cost of cultivation schedules, which do not intend to do so,
thus the farm business income derived from the COC data is not an adequate measure of actual
farm business income in the country or a state (Chand et al., 2015).
2.2 Aggregate and disaggregate farm income using CSO and NSSO data: Chand
et. al. (2015) derived the farm income by deducting the capital consumption and wage bill for
hired labour employed in agriculture from GDP of Agriculture and allied sector. The wage bill
for agriculture and allied sector was computed by multiplying the number of hired labourers
employed in agriculture with per day agricultural wage earnings and the number of days of
wage employment in a year in agriculture and allied activities based on various rounds of the
NSSO on employment and unemployment and also the Rural Labour Enquiry Reports (RLER).
The estimates of farm income were prepared for various points corresponding to six rounds of
the National Sample Survey Organization (NSSO) on Employment and Unemployment—1983
(38th Round), 1987-88 (43rd Round), 1993-94 (50th Round), 1999-00 (55th Round), 2004-05
(61st Round), and 2011-12 (68th Round). Farm income obtained at current prices from equation
was deflated by the CPIAL to arrive at the real farm income. This was the maiden attempt in
India to estimate the aggregate farm income for the agricultural sector as a whole, which was
also computed on per cultivator, per household and per unit of net sown area to reflect the
scenario at the disaggregated level.
2.3 Income purely on the basis of Situation Assessment Survey of NSSO: Besides the
above approaches, NSSO carried out two separate rounds on Situation Assessment Survey
(SAS) of Agricultural Households (59th and 70th Rounds), which included all possible
dimensions for determining the socio-economic status of agricultural households. As per the
SAS, the total income per agricultural households grew annually 11.75 per cent from Rs.
25,380 in 2002-03 to Rs. 77,112 in 2012-13, the income doubled in about 6 years; however,
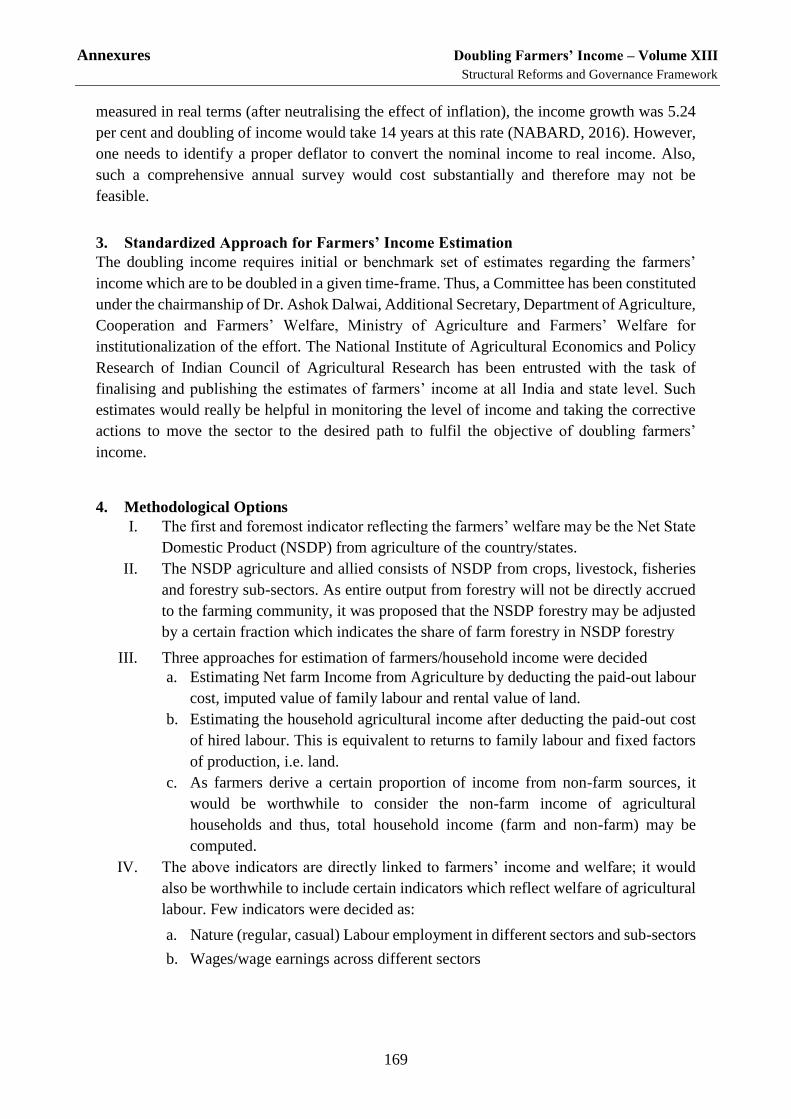
Annexures Doubling Farmers’ Income – Volume XIII
Structural Reforms and Governance Framework
169
measured in real terms (after neutralising the effect of inflation), the income growth was 5.24
per cent and doubling of income would take 14 years at this rate (NABARD, 2016). However,
one needs to identify a proper deflator to convert the nominal income to real income. Also,
such a comprehensive annual survey would cost substantially and therefore may not be
feasible.
3. Standardized Approach for Farmers’ Income Estimation
The doubling income requires initial or benchmark set of estimates regarding the farmers’
income which are to be doubled in a given time-frame. Thus, a Committee has been constituted
under the chairmanship of Dr. Ashok Dalwai, Additional Secretary, Department of Agriculture,
Cooperation and Farmers’ Welfare, Ministry of Agriculture and Farmers’ Welfare for
institutionalization of the effort. The National Institute of Agricultural Economics and Policy
Research of Indian Council of Agricultural Research has been entrusted with the task of
finalising and publishing the estimates of farmers’ income at all India and state level. Such
estimates would really be helpful in monitoring the level of income and taking the corrective
actions to move the sector to the desired path to fulfil the objective of doubling farmers’
income.
4. Methodological Options
I. The first and foremost indicator reflecting the farmers’ welfare may be the Net State
Domestic Product (NSDP) from agriculture of the country/states.
II. The NSDP agriculture and allied consists of NSDP from crops, livestock, fisheries
and forestry sub-sectors. As entire output from forestry will not be directly accrued
to the farming community, it was proposed that the NSDP forestry may be adjusted
by a certain fraction which indicates the share of farm forestry in NSDP forestry
III. Three approaches for estimation of farmers/household income were decided
a. Estimating Net farm Income from Agriculture by deducting the paid-out labour
cost, imputed value of family labour and rental value of land.
b. Estimating the household agricultural income after deducting the paid-out cost
of hired labour. This is equivalent to returns to family labour and fixed factors
of production, i.e. land.
c. As farmers derive a certain proportion of income from non-farm sources, it
would be worthwhile to consider the non-farm income of agricultural
households and thus, total household income (farm and non-farm) may be
computed.
IV. The above indicators are directly linked to farmers’ income and welfare; it would
also be worthwhile to include certain indicators which reflect welfare of agricultural
labour. Few indicators were decided as:
a. Nature (regular, casual) Labour employment in different sectors and sub-sectors
b. Wages/wage earnings across different sectors
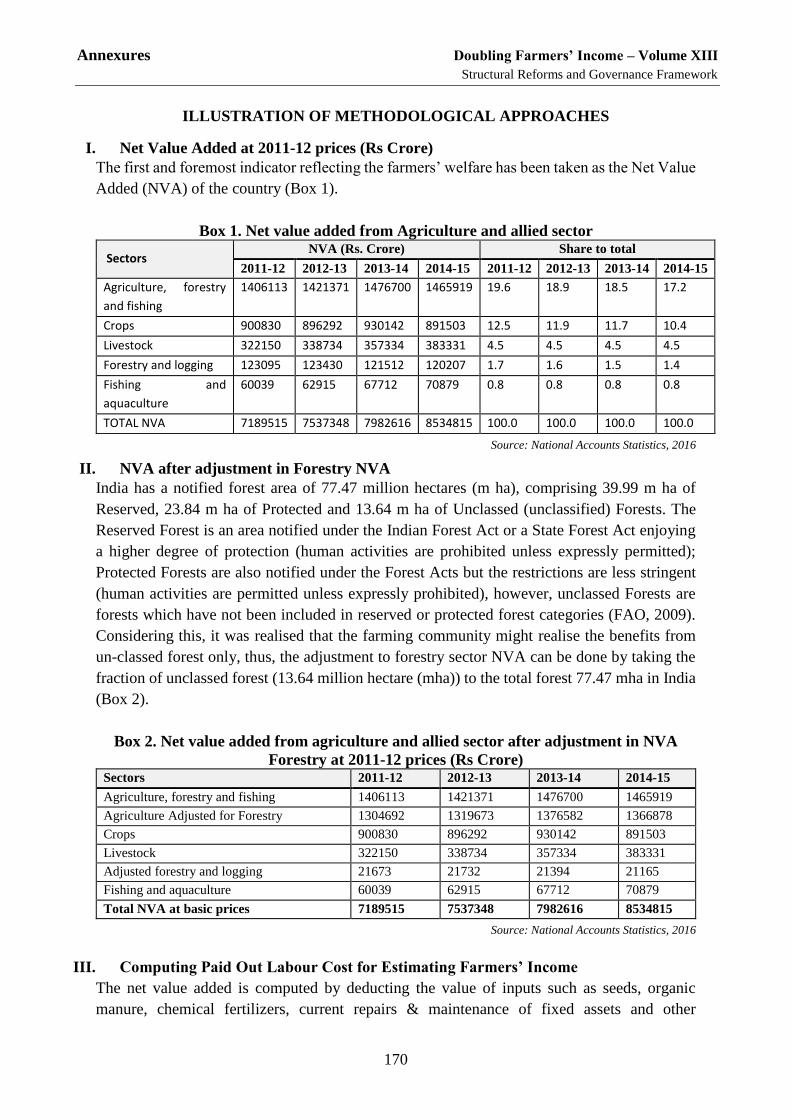
Annexures Doubling Farmers’ Income – Volume XIII
Structural Reforms and Governance Framework
170
ILLUSTRATION OF METHODOLOGICAL APPROACHES
I. Net Value Added at 2011-12 prices (Rs Crore)
The first and foremost indicator reflecting the farmers’ welfare has been taken as the Net Value
Added (NVA) of the country (Box 1).
Box 1. Net value added from Agriculture and allied sector
Sectors NVA (Rs. Crore) Share to total
2011-12 2012-13 2013-14 2014-15 2011-12 2012-13 2013-14 2014-15
Agriculture, forestry
and fishing
1406113 1421371 1476700 1465919 19.6 18.9 18.5 17.2
Crops 900830 896292 930142 891503 12.5 11.9 11.7 10.4
Livestock 322150 338734 357334 383331 4.5 4.5 4.5 4.5
Forestry and logging 123095 123430 121512 120207 1.7 1.6 1.5 1.4
Fishing and
aquaculture
60039 62915 67712 70879 0.8 0.8 0.8 0.8
TOTAL NVA 7189515 7537348 7982616 8534815 100.0 100.0 100.0 100.0
Source: National Accounts Statistics, 2016
II. NVA after adjustment in Forestry NVA
India has a notified forest area of 77.47 million hectares (m ha), comprising 39.99 m ha of
Reserved, 23.84 m ha of Protected and 13.64 m ha of Unclassed (unclassified) Forests. The
Reserved Forest is an area notified under the Indian Forest Act or a State Forest Act enjoying
a higher degree of protection (human activities are prohibited unless expressly permitted);
Protected Forests are also notified under the Forest Acts but the restrictions are less stringent
(human activities are permitted unless expressly prohibited), however, unclassed Forests are
forests which have not been included in reserved or protected forest categories (FAO, 2009).
Considering this, it was realised that the farming community might realise the benefits from
un-classed forest only, thus, the adjustment to forestry sector NVA can be done by taking the
fraction of unclassed forest (13.64 million hectare (mha)) to the total forest 77.47 mha in India
(Box 2).
Box 2. Net value added from agriculture and allied sector after adjustment in NVA
Forestry at 2011-12 prices (Rs Crore) Sectors 2011-12 2012-13 2013-14 2014-15
Agriculture, forestry and fishing 1406113 1421371 1476700 1465919
Agriculture Adjusted for Forestry 1304692 1319673 1376582 1366878
Crops 900830 896292 930142 891503
Livestock 322150 338734 357334 383331
Adjusted forestry and logging 21673 21732 21394 21165
Fishing and aquaculture 60039 62915 67712 70879
Total NVA at basic prices 7189515 7537348 7982616 8534815
Source: National Accounts Statistics, 2016
III. Computing Paid Out Labour Cost for Estimating Farmers’ Income
The net value added is computed by deducting the value of inputs such as seeds, organic
manure, chemical fertilizers, current repairs & maintenance of fixed assets and other
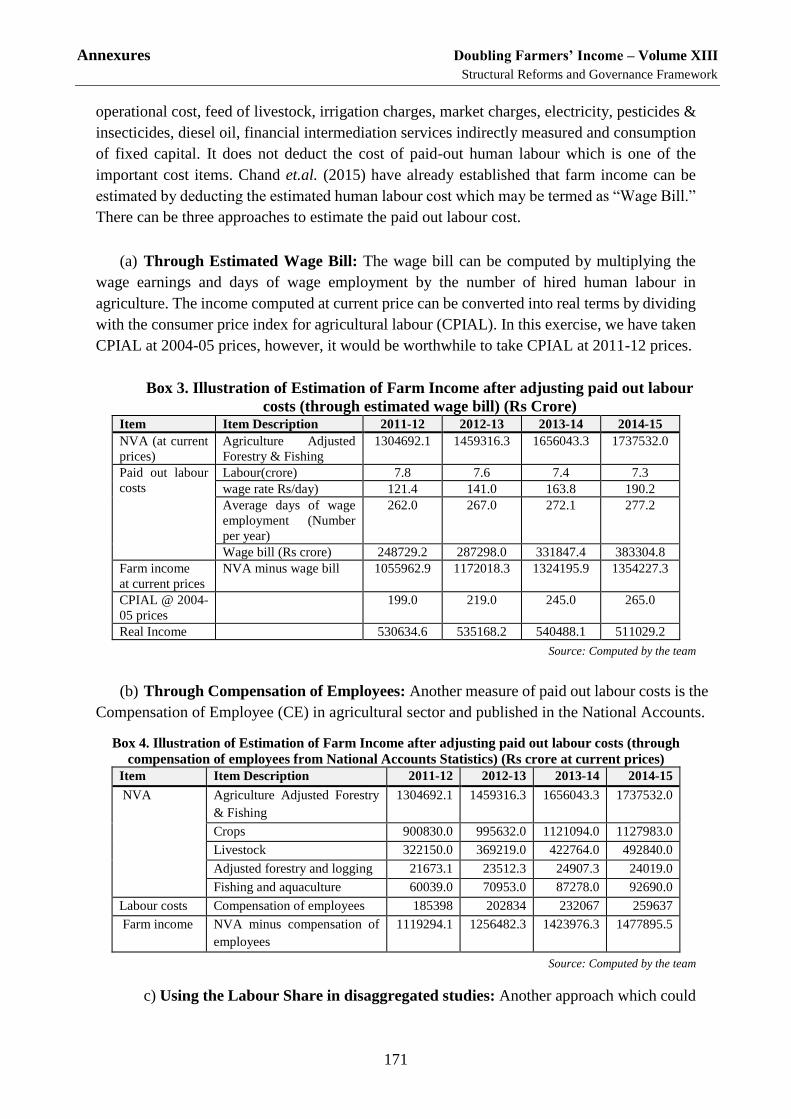
Annexures Doubling Farmers’ Income – Volume XIII
Structural Reforms and Governance Framework
171
operational cost, feed of livestock, irrigation charges, market charges, electricity, pesticides &
insecticides, diesel oil, financial intermediation services indirectly measured and consumption
of fixed capital. It does not deduct the cost of paid-out human labour which is one of the
important cost items. Chand et.al. (2015) have already established that farm income can be
estimated by deducting the estimated human labour cost which may be termed as “Wage Bill.”
There can be three approaches to estimate the paid out labour cost.
(a) Through Estimated Wage Bill: The wage bill can be computed by multiplying the
wage earnings and days of wage employment by the number of hired human labour in
agriculture. The income computed at current price can be converted into real terms by dividing
with the consumer price index for agricultural labour (CPIAL). In this exercise, we have taken
CPIAL at 2004-05 prices, however, it would be worthwhile to take CPIAL at 2011-12 prices.
Box 3. Illustration of Estimation of Farm Income after adjusting paid out labour
costs (through estimated wage bill) (Rs Crore) Item Item Description 2011-12 2012-13 2013-14 2014-15
NVA (at current
prices)
Agriculture Adjusted
Forestry & Fishing
1304692.1 1459316.3 1656043.3 1737532.0
Paid out labour
costs
Labour(crore) 7.8 7.6 7.4 7.3
wage rate Rs/day) 121.4 141.0 163.8 190.2
Average days of wage
employment (Number
per year)
262.0 267.0 272.1 277.2
Wage bill (Rs crore) 248729.2 287298.0 331847.4 383304.8
Farm income
at current prices
NVA minus wage bill 1055962.9 1172018.3 1324195.9 1354227.3
CPIAL @ 2004-
05 prices
199.0 219.0 245.0 265.0
Real Income 530634.6 535168.2 540488.1 511029.2
Source: Computed by the team
(b) Through Compensation of Employees: Another measure of paid out labour costs is the
Compensation of Employee (CE) in agricultural sector and published in the National Accounts.
Box 4. Illustration of Estimation of Farm Income after adjusting paid out labour costs (through
compensation of employees from National Accounts Statistics) (Rs crore at current prices)
Item Item Description 2011-12 2012-13 2013-14 2014-15
NVA
Agriculture Adjusted Forestry
& Fishing
1304692.1 1459316.3 1656043.3 1737532.0
Crops 900830.0 995632.0 1121094.0 1127983.0
Livestock 322150.0 369219.0 422764.0 492840.0
Adjusted forestry and logging 21673.1 23512.3 24907.3 24019.0
Fishing and aquaculture 60039.0 70953.0 87278.0 92690.0
Labour costs Compensation of employees 185398 202834 232067 259637
Farm income NVA minus compensation of
employees
1119294.1 1256482.3 1423976.3 1477895.5
Source: Computed by the team
c) Using the Labour Share in disaggregated studies: Another approach which could
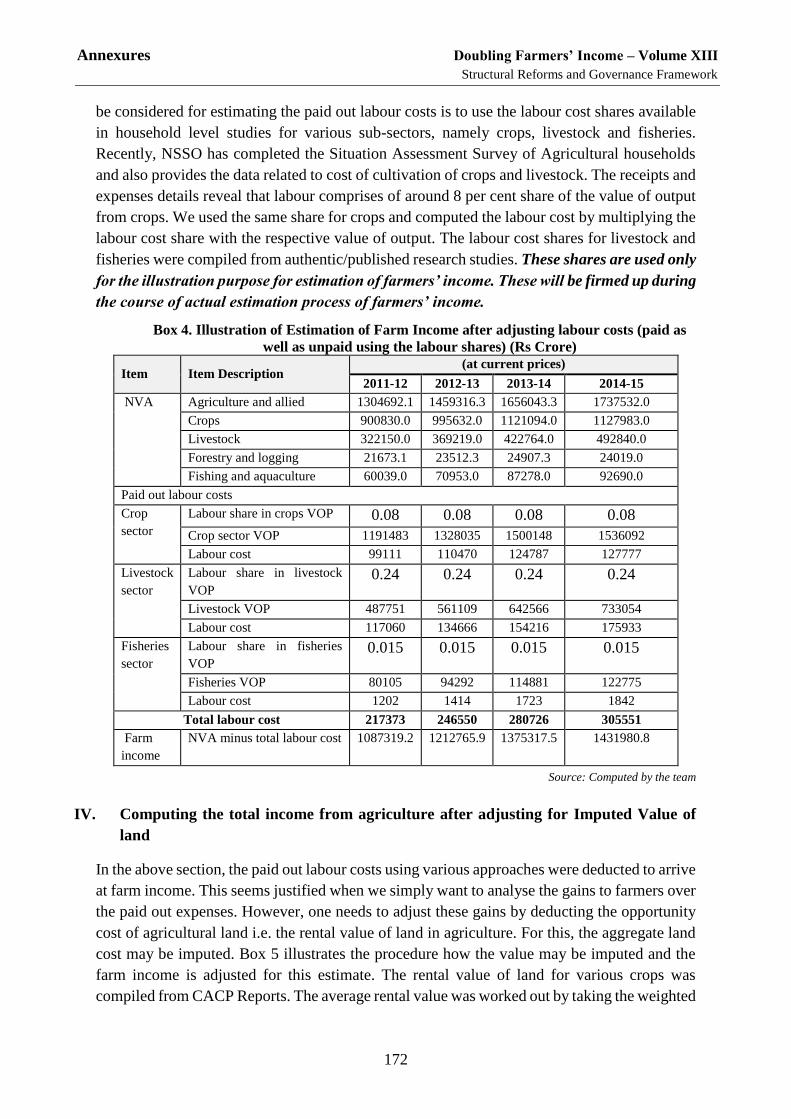
Annexures Doubling Farmers’ Income – Volume XIII
Structural Reforms and Governance Framework
172
be considered for estimating the paid out labour costs is to use the labour cost shares available
in household level studies for various sub-sectors, namely crops, livestock and fisheries.
Recently, NSSO has completed the Situation Assessment Survey of Agricultural households
and also provides the data related to cost of cultivation of crops and livestock. The receipts and
expenses details reveal that labour comprises of around 8 per cent share of the value of output
from crops. We used the same share for crops and computed the labour cost by multiplying the
labour cost share with the respective value of output. The labour cost shares for livestock and
fisheries were compiled from authentic/published research studies. These shares are used only
for the illustration purpose for estimation of farmers’ income. These will be firmed up during
the course of actual estimation process of farmers’ income.
Box 4. Illustration of Estimation of Farm Income after adjusting labour costs (paid as
well as unpaid using the labour shares) (Rs Crore)
Item Item Description (at current prices)
2011-12 2012-13 2013-14 2014-15
NVA
Agriculture and allied 1304692.1 1459316.3 1656043.3 1737532.0
Crops 900830.0 995632.0 1121094.0 1127983.0
Livestock 322150.0 369219.0 422764.0 492840.0
Forestry and logging 21673.1 23512.3 24907.3 24019.0
Fishing and aquaculture 60039.0 70953.0 87278.0 92690.0
Paid out labour costs
Crop
sector
Labour share in crops VOP 0.08 0.08 0.08 0.08
Crop sector VOP 1191483 1328035 1500148 1536092
Labour cost 99111 110470 124787 127777
Livestock
sector
Labour share in livestock
VOP
0.24 0.24 0.24 0.24
Livestock VOP 487751 561109 642566 733054
Labour cost 117060 134666 154216 175933
Fisheries
sector
Labour share in fisheries
VOP
0.015 0.015 0.015 0.015
Fisheries VOP 80105 94292 114881 122775
Labour cost 1202 1414 1723 1842
Total labour cost 217373 246550 280726 305551
Farm
income
NVA minus total labour cost 1087319.2 1212765.9 1375317.5 1431980.8
Source: Computed by the team
IV. Computing the total income from agriculture after adjusting for Imputed Value of
land
In the above section, the paid out labour costs using various approaches were deducted to arrive
at farm income. This seems justified when we simply want to analyse the gains to farmers over
the paid out expenses. However, one needs to adjust these gains by deducting the opportunity
cost of agricultural land i.e. the rental value of land in agriculture. For this, the aggregate land
cost may be imputed. Box 5 illustrates the procedure how the value may be imputed and the
farm income is adjusted for this estimate. The rental value of land for various crops was
compiled from CACP Reports. The average rental value was worked out by taking the weighted
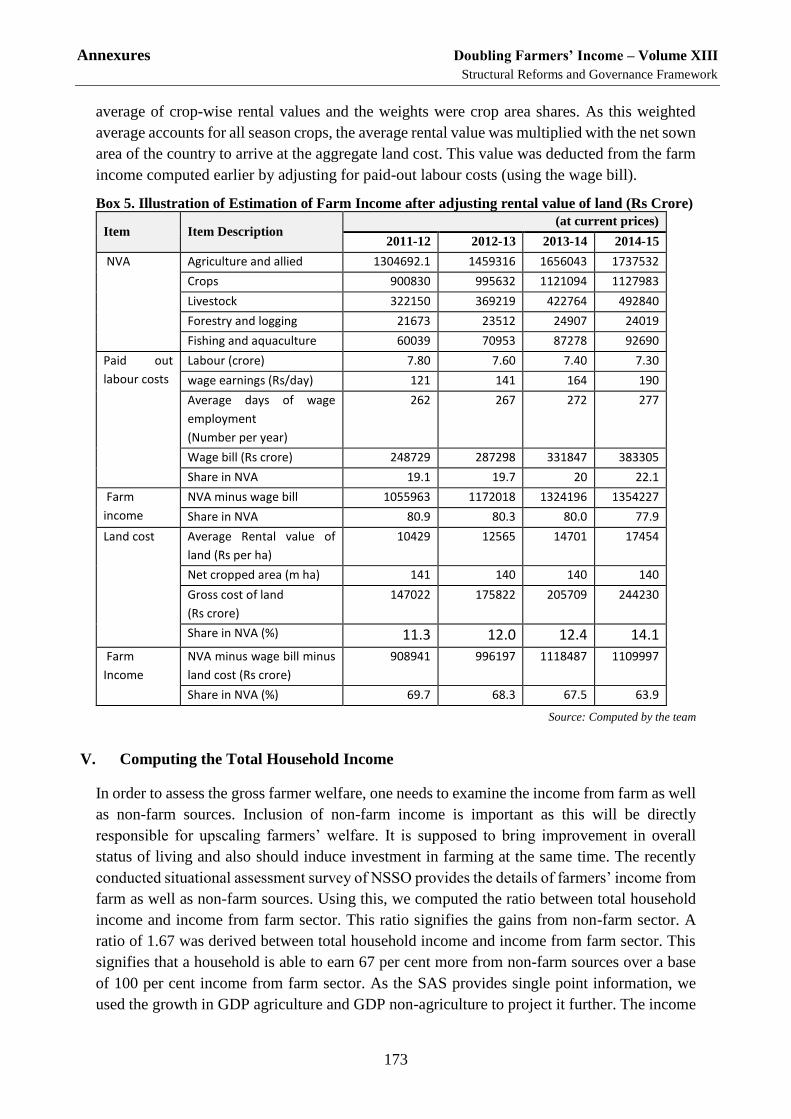
Annexures Doubling Farmers’ Income – Volume XIII
Structural Reforms and Governance Framework
173
average of crop-wise rental values and the weights were crop area shares. As this weighted
average accounts for all season crops, the average rental value was multiplied with the net sown
area of the country to arrive at the aggregate land cost. This value was deducted from the farm
income computed earlier by adjusting for paid-out labour costs (using the wage bill).
Box 5. Illustration of Estimation of Farm Income after adjusting rental value of land (Rs Crore)
Item Item Description (at current prices)
2011-12 2012-13 2013-14 2014-15
NVA
Agriculture and allied 1304692.1 1459316 1656043 1737532
Crops 900830 995632 1121094 1127983
Livestock 322150 369219 422764 492840
Forestry and logging 21673 23512 24907 24019
Fishing and aquaculture 60039 70953 87278 92690
Paid out
labour costs
Labour (crore) 7.80 7.60 7.40 7.30
wage earnings (Rs/day) 121 141 164 190
Average days of wage
employment
(Number per year)
262 267 272 277
Wage bill (Rs crore) 248729 287298 331847 383305
Share in NVA 19.1 19.7 20 22.1
Farm
income
NVA minus wage bill 1055963 1172018 1324196 1354227
Share in NVA 80.9 80.3 80.0 77.9
Land cost Average Rental value of
land (Rs per ha)
10429 12565 14701 17454
Net cropped area (m ha) 141 140 140 140
Gross cost of land
(Rs crore)
147022 175822 205709 244230
Share in NVA (%) 11.3 12.0 12.4 14.1
Farm
Income
NVA minus wage bill minus
land cost (Rs crore)
908941 996197 1118487 1109997
Share in NVA (%) 69.7 68.3 67.5 63.9
Source: Computed by the team
V. Computing the Total Household Income
In order to assess the gross farmer welfare, one needs to examine the income from farm as well
as non-farm sources. Inclusion of non-farm income is important as this will be directly
responsible for upscaling farmers’ welfare. It is supposed to bring improvement in overall
status of living and also should induce investment in farming at the same time. The recently
conducted situational assessment survey of NSSO provides the details of farmers’ income from
farm as well as non-farm sources. Using this, we computed the ratio between total household
income and income from farm sector. This ratio signifies the gains from non-farm sector. A
ratio of 1.67 was derived between total household income and income from farm sector. This
signifies that a household is able to earn 67 per cent more from non-farm sources over a base
of 100 per cent income from farm sector. As the SAS provides single point information, we
used the growth in GDP agriculture and GDP non-agriculture to project it further. The income
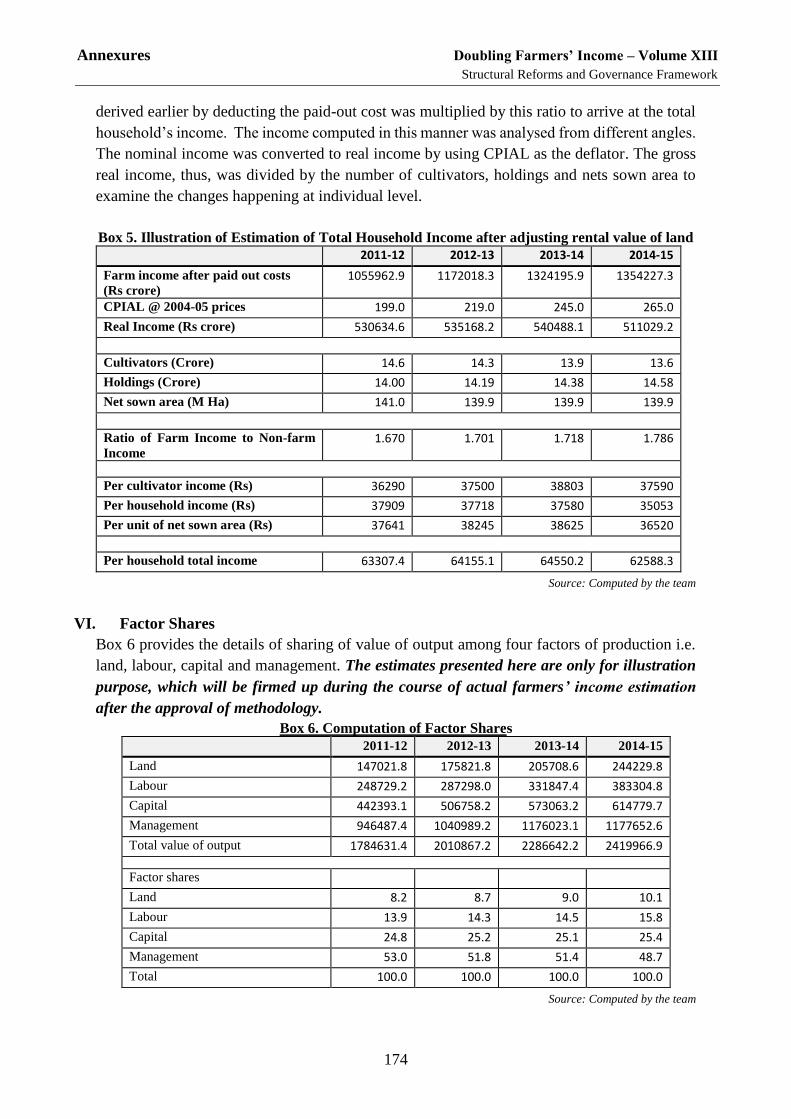
Annexures Doubling Farmers’ Income – Volume XIII
Structural Reforms and Governance Framework
174
derived earlier by deducting the paid-out cost was multiplied by this ratio to arrive at the total
household’s income. The income computed in this manner was analysed from different angles.
The nominal income was converted to real income by using CPIAL as the deflator. The gross
real income, thus, was divided by the number of cultivators, holdings and nets sown area to
examine the changes happening at individual level.
Box 5. Illustration of Estimation of Total Household Income after adjusting rental value of land
2011-12 2012-13 2013-14 2014-15
Farm income after paid out costs
(Rs crore)
1055962.9 1172018.3 1324195.9 1354227.3
CPIAL @ 2004-05 prices 199.0 219.0 245.0 265.0
Real Income (Rs crore) 530634.6 535168.2 540488.1 511029.2
Cultivators (Crore) 14.6 14.3 13.9 13.6
Holdings (Crore) 14.00 14.19 14.38 14.58
Net sown area (M Ha) 141.0 139.9 139.9 139.9
Ratio of Farm Income to Non-farm
Income
1.670 1.701 1.718 1.786
Per cultivator income (Rs) 36290 37500 38803 37590
Per household income (Rs) 37909 37718 37580 35053
Per unit of net sown area (Rs) 37641 38245 38625 36520
Per household total income 63307.4 64155.1 64550.2 62588.3
Source: Computed by the team
VI. Factor Shares
Box 6 provides the details of sharing of value of output among four factors of production i.e.
land, labour, capital and management. The estimates presented here are only for illustration
purpose, which will be firmed up during the course of actual farmers’ income estimation
after the approval of methodology.
Box 6. Computation of Factor Shares 2011-12 2012-13 2013-14 2014-15
Land 147021.8 175821.8 205708.6 244229.8
Labour 248729.2 287298.0 331847.4 383304.8
Capital 442393.1 506758.2 573063.2 614779.7
Management 946487.4 1040989.2 1176023.1 1177652.6
Total value of output 1784631.4 2010867.2 2286642.2 2419966.9
Factor shares
Land 8.2 8.7 9.0 10.1
Labour 13.9 14.3 14.5 15.8
Capital 24.8 25.2 25.1 25.4
Management 53.0 51.8 51.4 48.7
Total 100.0 100.0 100.0 100.0
Source: Computed by the team
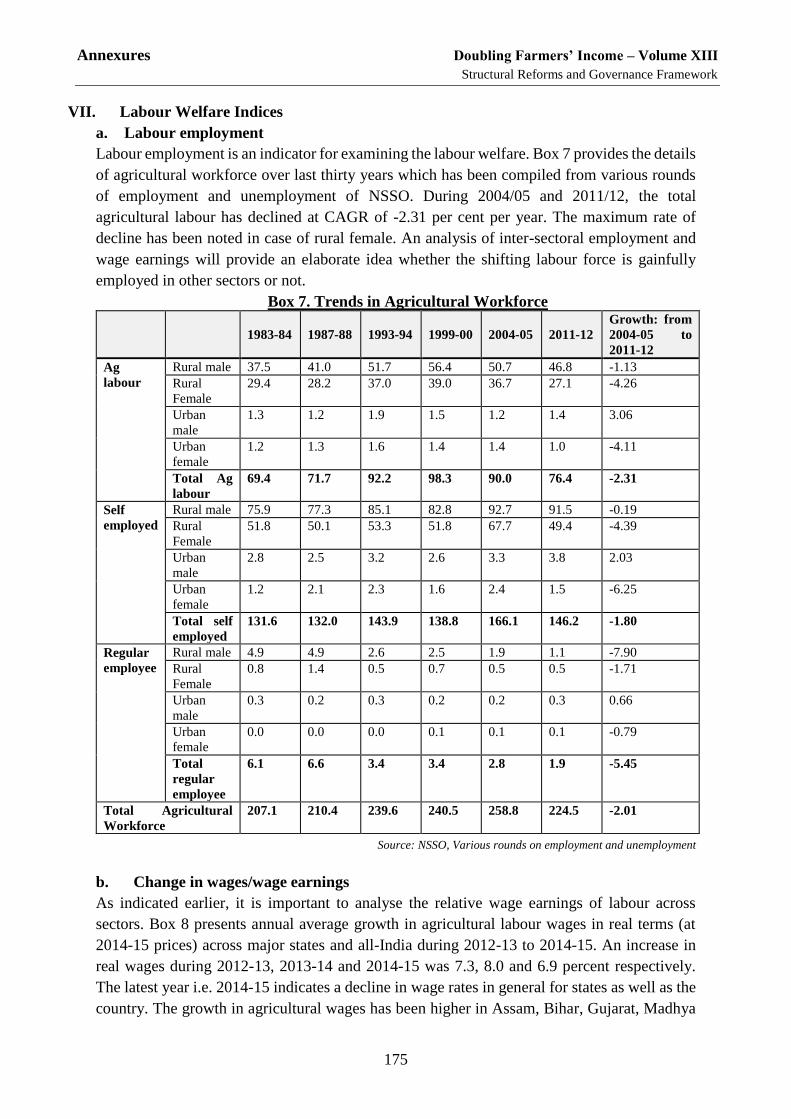
Annexures Doubling Farmers’ Income – Volume XIII
Structural Reforms and Governance Framework
175
VII. Labour Welfare Indices
a. Labour employment
Labour employment is an indicator for examining the labour welfare. Box 7 provides the details
of agricultural workforce over last thirty years which has been compiled from various rounds
of employment and unemployment of NSSO. During 2004/05 and 2011/12, the total
agricultural labour has declined at CAGR of -2.31 per cent per year. The maximum rate of
decline has been noted in case of rural female. An analysis of inter-sectoral employment and
wage earnings will provide an elaborate idea whether the shifting labour force is gainfully
employed in other sectors or not.
Box 7. Trends in Agricultural Workforce
1983-84 1987-88 1993-94 1999-00 2004-05 2011-12
Growth: from
2004-05 to
2011-12
Ag
labour
Rural male 37.5 41.0 51.7 56.4 50.7 46.8 -1.13
Rural
Female
29.4 28.2 37.0 39.0 36.7 27.1 -4.26
Urban
male
1.3 1.2 1.9 1.5 1.2 1.4 3.06
Urban
female
1.2 1.3 1.6 1.4 1.4 1.0 -4.11
Total Ag
labour
69.4 71.7 92.2 98.3 90.0 76.4 -2.31
Self
employed
Rural male 75.9 77.3 85.1 82.8 92.7 91.5 -0.19
Rural
Female
51.8 50.1 53.3 51.8 67.7 49.4 -4.39
Urban
male
2.8 2.5 3.2 2.6 3.3 3.8 2.03
Urban
female
1.2 2.1 2.3 1.6 2.4 1.5 -6.25
Total self
employed
131.6 132.0 143.9 138.8 166.1 146.2 -1.80
Regular
employee
Rural male 4.9 4.9 2.6 2.5 1.9 1.1 -7.90
Rural
Female
0.8 1.4 0.5 0.7 0.5 0.5 -1.71
Urban
male
0.3 0.2 0.3 0.2 0.2 0.3 0.66
Urban
female
0.0 0.0 0.0 0.1 0.1 0.1 -0.79
Total
regular
employee
6.1 6.6 3.4 3.4 2.8 1.9 -5.45
Total Agricultural
Workforce
207.1 210.4 239.6 240.5 258.8 224.5 -2.01
Source: NSSO, Various rounds on employment and unemployment
b. Change in wages/wage earnings
As indicated earlier, it is important to analyse the relative wage earnings of labour across
sectors. Box 8 presents annual average growth in agricultural labour wages in real terms (at
2014-15 prices) across major states and all-India during 2012-13 to 2014-15. An increase in
real wages during 2012-13, 2013-14 and 2014-15 was 7.3, 8.0 and 6.9 percent respectively.
The latest year i.e. 2014-15 indicates a decline in wage rates in general for states as well as the
country. The growth in agricultural wages has been higher in Assam, Bihar, Gujarat, Madhya
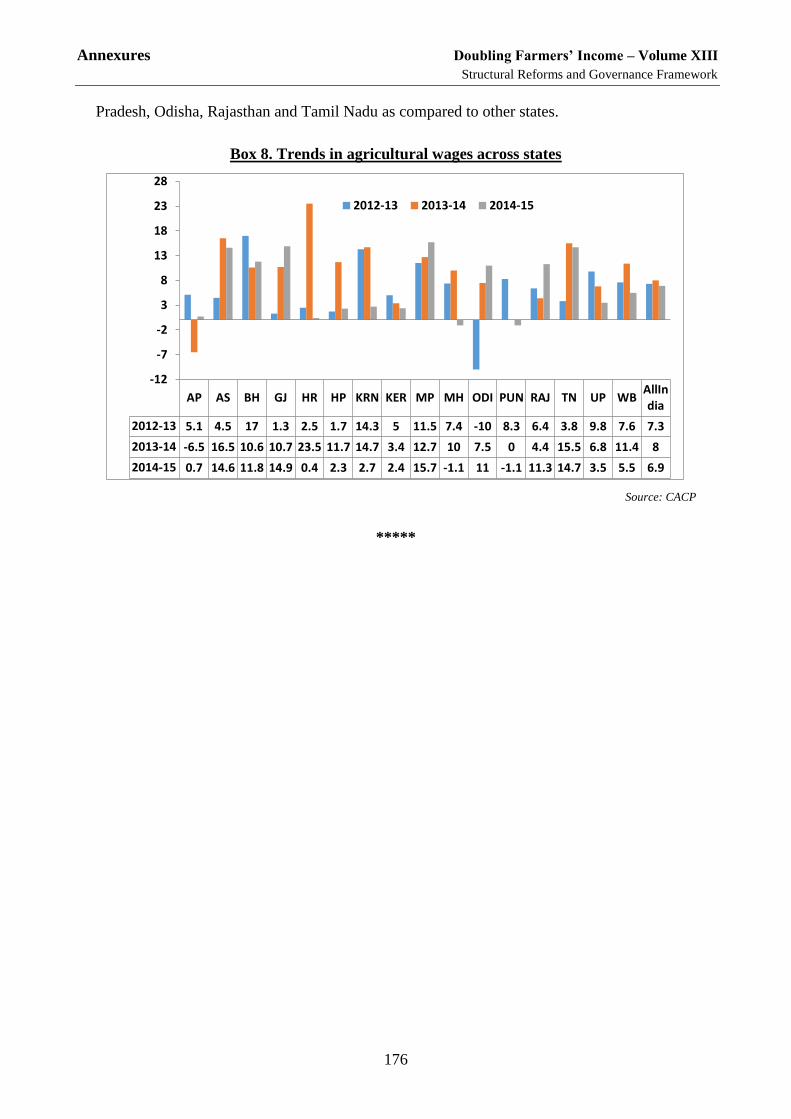
Annexures Doubling Farmers’ Income – Volume XIII
Structural Reforms and Governance Framework
176
Pradesh, Odisha, Rajasthan and Tamil Nadu as compared to other states.
Box 8. Trends in agricultural wages across states
Source: CACP
*****
AP AS BH GJ HR HP KRN KER MP MH ODI PUN RAJ TN UP WBAllIndia
2012-13 5.1 4.5 17 1.3 2.5 1.7 14.3 5 11.5 7.4 -10 8.3 6.4 3.8 9.8 7.6 7.3
2013-14 -6.5 16.5 10.6 10.7 23.5 11.7 14.7 3.4 12.7 10 7.5 0 4.4 15.5 6.8 11.4 8
2014-15 0.7 14.6 11.8 14.9 0.4 2.3 2.7 2.4 15.7 -1.1 11 -1.1 11.3 14.7 3.5 5.5 6.9
-12
-7
-2
3
8
13
18
23
28
2012-13 2013-14 2014-15