Embed Size (px)
Citation preview

Credit Quality S&P
Long Term Long TermShort Term Short Term
Moody’s
Highest AAA Aaa Very High AA+ Aa1 AA Aa2 AA- Aa3 High A+ A1 A A2 A- A3 Good BBB+ Baa1 BBB Baa2 BBB- Baa3 Speculative BB+ Ba1 B Ba2 BB- Ba3 Highly Speculative B+ B1 B B2 B- B3 Substantial Credit Risk CCC+ Caa1 CCC+ Caa2 CCC- Caa3 Very High Level of Credit Risk CC Ca Exceptionally High Levels of Credit Risk C C Under Regulatory Supervision R Selective/ Restricted Default SD Default D
A-1+
Invest
ment
Grad
eSp
ecula
tive G
rade
P1
P1 OR P2P2
P2 OR P3P3
NOT PRIME
A-1
A-2
A-3
B
C
JANUARY 2014MINISTRY Of ECONOMY AND TRADELEBANESE ECONOMIC HIGHLIGHTS
SOVEREIGN CREDIT RATINGS AND THEIR EVOLUTION IN LEBANON
OVERVIEw Of CREDIT RATINGS AND DEBT OBLIGATIONS• Credit ratings, in the wider sense, are ratings that are used to determine a debtor’s ability to pay back its debt obligations (principal and interest) as well as its likelihood of default, by analyzing its capacity to re-service its debt. Behind all this, risk and the subsequent potential to make major losses, are the major motives behind the need to conduct risk assessments.
• Credit Rating Agencies (CRAs) are the entities responsible for assessing credit risk and assigning suitable ratings. They are part of a highly concentrated industry, with the “Big Three” CRAs— Moody’s, S&P and fitch Ratings — controlling approximately 95% of the business, of which the former two control 80%.
• Although the types of debtors and the debt instruments issued in the marketplace are wide ranging, this issue will only focus on Sovereign Debt issued by the Lebanese Government, otherwise known as Treasuries, and the evolution in their credit ratings. Although the “Big Three” are actively rating sovereign debt in Lebanon, this issue will prioritize the ratings of S&P and Moody’s, since they make more regular assessments and hence, have greater data availability.
• Throughtheirassignmentofcreditscores,CRAsplayasignificantinfluence on the allocation of funds and investment potential. Essentially, a credit rating has the following impact for issuers and hence, highlights the significance of maintaining sound creditratings.
- wider Access to Capital: A credit rating is a “credit passport” that provides access to both domestic and international pools of debt capital.
- financing flexibility: Research produced by rating agencies allows a wider market access and hence reduced funding costs, especially for higher rates issuers. It also allows rated issuers to enter the capital markets more frequently and more economically and to sell larger offerings at longer maturities.
- Market Stability: Research reports produced by CRAs help to maintain and stabilize investor confidence, especially during periods of market stress.
CREDIT RATINGS, THEIR SIGNIfICANCE AND KEY DETERMINANTS• Table 1 shows a quick summary of the Credit Rating Categories for S&P and Moody’s. Credit quality is rated through alphabetical scores, which are typically divided into investment and speculative grades.
TABLE1: Summary of Sovereign Ratings Categories for S&P and Moody’s
JANUARY 2014MINISTRY Of ECONOMY AND TRADELEBANESE ECONOMIC HIGHLIGHTS
TABLE2: Key factors in Sovereign Credit Rating Analysis according to CRAs
TABLE3: S&P Sovereign Credit Ratings on foreign and Local Currencies
CREDIT RATINGS IN LEBANONBuilding upon these key factors, a table depicting the evolution in the long and short term Sovereign Ratings on foreign and Local Currencies in Lebanon since 2007 was compiled using data from S&P and Moody’s. The factors resulting in an upgrade or dowmgrade in ratings were also noted.
In Lebanon, the sovereign rating on long term local and foreign currencies is essentially the same.
This is because the Lebanese Pound is pegged to the Dollar, which reduces exchange rate risk. furthermore, Lebanon’s sovereign debt ratings range between B and CCC+ for S&P and B1 to B3 for Moody’s, that is, between the “speculative” range and being exposed to “substantial credit risk” in the former and the “Highly Speculative” range in the latter.
Table 3 and 4 show the evolution in the sovereign credit ratings by S&P and Moody’s respectively, for both foreign and local currencies in both the long and short term.
* Please note that the time series shown in the table is only taking into consideration the periods where Ratings Indices witnessed a change
S&P Moody’s
Analyzes sovereign performance over past economic and political cycles and looksatfactorsthatsuggestgreaterorlesserfiscalandmonetaryflexibilityover the course of future economic cycles
Political ScorePolitical and Security Risks, Institutional EffectivenessEconomic ScoreIncome and Economic Structure, Economic Performance, Growth Prospects fiscal Score fiscal Performance and flexibility, Government Debt Burden Monetary Score Monetary flexibility External ScoreExternal Liquidity and Debt Burden, International Investment PositionDefault History
Institutional ScorePolitical Dynamics, Government Structure, Institutional & Public Policy frameworksEconomic ScoreIncome and Economic Structure, Economic Performance fiscal Score FiscalPerformance,GovernmentDebtBurdenProfileMonetary, External Vulnerability and Liquidity Score Monetary flexibility External ScoreExternal Liquidity and Debt BurdenDefault History
Uses a multidisciplinary or “universal” approach to risk analysis, which aims to bring an understanding of all relevant risk factors and viewpoints to every rating analysis
focu
s of A
nalys
is Ke
y fac
tors in
Sove
reign
Cred
it Rati
ng An
alysis
2007H2
2008H1 H2 H2 H2 H1 H1 H2
2009 2010 2011 2012 2013
Difficulties: End of Presidential Term w/ no agreement on successor: Caretaker Government in Power
Political difficulties raise pressure on already riskypublicfinancesAffirmation in ratings however, reflects strong supportofpublicfinancesby external regional/ global powers
PositiveStableNegative
X
X X XX X X X X
X
X
X
X XX
XB
B-
BC
CCC+
Short Term
PositiveStableNegative
PositiveStableNegative
Political and Institutional factors
Economic factors (Economic, fiscal, Monetary and External)
Downgrade due to political concerns: - No president yet elected.
Concern that political situation may: - Delay needed structural reforms. -Shakeconfidenceinfinancialsector&thus,bank ability to lend to Gvt. However, downgrade is cushioned by history of strong economic resilience &financialcommitmentfrom external powers
Upgrade due to ease in political Tensions following Doha Agreement.
Political improvement - Reduction in risk of deposit withdrawal - Reduction in Gvt financingriskbybanks
Upgrade reflects positive dvlpmts in political situation:- May elections provide stable outlook- New cross party consensus allowed PM to form a national unity Gvt
Upgrade reflects view that: - Public finances and Banking system have proven resilient in the face of political turmoil and excellent resistance to Global financial Crisis (GfC) over last 3 years.
Positive outlook regarding political stability
Political stability: - Progress on structural reforms But ratings constrained by: - High public debt burden - Large external imbalances - Risk in breakdown of Gvt consensus (following Special Int. Tribunal in early 2011)
Political instability as Hezbollah and Coalition allies withdraw from unity Gvt Caretaker Gvt is expected to struggle
Syrian Conflict spillover Rise in domestic tensions between pro and anti-Assad factions in Lebanon
Despite unstable security environment, affirmation ratings reflects Lebanon’s political and macroeconomic resilience
Syrian Conflict spillover. Rise in Syrian Refugees
Downgrade as Syrian crisis hit macroeconomic fundamentals:-Fallinpublicfinances- Rise in debt:GDP - fall in resources Ratings supported by confidenceinbankswhichsupport: - Gvt needs for borrowing - Deposit inflows - Cash reserves
• CreditRatingsareusuallyassessedaccordingtoawiderangeofvariables, includingeconomic,politicalandinstitutional,fiscal,monetaryandexternalones.Table2presentsthesevariablesaccording to S&P and Moody’s Analysis.

MINISTRY Of ECONOMY AND TRADELEBANESE ECONOMIC HIGHLIGHTS
JANUARY 2014
2006H2
2008 2009H1 H1H2 H2 H1 H2
2010 2013
Negative Outlook reflects ongoing deterioration in domestic political environment , which undermines Lebanon’s ability to implement much needed economic reforms
Moody’shasconfidenceinLebanon since it believes:- GoL is willing to service massive debt burden- Lebanese Banking system is attractive to Depositors - GoL will continue to receiveexternalfinancialsupport
PositiveStableNegative
XX
X
XX
XX
X X X XX X X
B1
B2
Not Prime
B3
Short Term
PositiveStableNegative
PositiveStableNegative
Political and Institutional factors
Economic factors (Economic, fiscal, Monetary and External)
Ongoing impasse over a replacement for the presidential vacancy and turbulent domestic political events
Upgrade in Outlook due to resilience of Lebanon’s publicfinances,despitepolitical instability and Global financial Crisis (GfC). In fact:- Improvement in GoL’s repayment abilities-Strongfinancialcommitment from external donors- Large stocks of foreign Exchange and Gold - Massive Inflows of deposits despite GfC
Signature of Doha Agreement in May has allowed country to gain momentum. following 3 actions agreed: - Elect new president - form Unity Government - Pass new electoral law
Upgrade in Ratings due to:- Continued resilience of publicfinancestoshocks.- Continued Attractiveness of Banking Sector by depositors, especially during GfC- Improvement in Lebanon’s political and economic environment since the Doha Agreement
Upgrade in Ratings reflects: - Improvement in external liquidity - Resilience of public financestoshocks- willingness and ability of resilient banking systemtofinancefiscaldeficits-Historyoffinancialsupport from committed external donors
Upgrade in Outlook due to amelioration of the domestic political situation following the formation of a consensus government
Upgrade in Outlook prompted by:- Continued Improvement in External Liquidity - Strengthened ability of the country’s resilient bankingsystemtofinancefiscaldeficits
Upgrade in Sovereign Ratings reflects amelioration of the domestic political situation following the formation of a consensus government in Nov 2009
Upgrade in Outlook reflects :- Continued Improvement in External Liquidity - Strengthened ability of the country’s resilient banking system to financefiscaldeficits
Downgrade in Outlook reflects Impact of Syria’s ongoing civil war on Lebanon, which is expected to lead to political instability at the domestic level
Affirmation of B1 Rating, supported by:- Abundant foreign exchange liquidity in the Lebanese Banking system - Proven resilience of domestic banks, which continuetofinancethegovernmentdeficit- A sound creditor baseHowever, the Syrian crisis in 2014 is expected to: - Suppress economic growth -Increasefiscaldeficits - Increase the GoL’s already high debt burden
*Please note that the time series shown in the table is only taking into consideration the periods where Ratings Indices witnessed a change
In each case, the change in ratings is highly influenced by political and economic factors. In fact, several trends are observed:
- The domestic and regional political and security situations are a major determinant of ratings
-Theconcernthatgovernment’sinabilitytofinanceitsfiscaldeficitandhence,servicethe debt burden, and the opposing belief that the government can reach out to the resilient bankingsectorwhoisalwayswillingtofinancethefiscaldeficits,createsalevelingoutin the rating scores.
- The large stock of foreign exchange and gold reserves being held by the Central Bank as well as the strong commitment from external donors in times of stress provide a protective cushion to ratings, as they are prevented from further down-grades
Giventheimportanceofcreditratingsoninvestorconfidenceandaccesstocapital,Lebanonisina vulnerable position should the variables affecting it in negative matter continue to deteriorate. In retrospect, maintaining a sound banking system and a large stock of foreign reserves and gold should continue to keep ratings in check.
TABLE3: Moody’s Sovereign Credit Ratings on foreign and Local Currencies

for more information or assistance, please do not hesitate to contact the Economic Research Unit at the Ministry of Economy and Trade:Tel: +961 1 982 294
Caroline Bitar (ext: 1609): [email protected] Dandache (ext: 1615): [email protected]
Disclaimer:The most recent month is highlighted for each of the following indicators:•CoincidenceIndicator:November2013•RealEstate:December2013•Tourism:December2013•TradeStatistics:December2013•BankingSectorDeposits:November2013•ForeignAssets:November2013•GoldReserves:November2013
MONTHLY ECONOMIC TRENDS:
•ECoNoMICFoRECASTSThe Coincident Indicator — a compound index of a number of economic indicators published byBDLthatestimateseconomicperformance—sawarecoveryinitsfiguresinNovember2013,byrecordingaYTDincreaseof6.2%inthefirstelevenmonthsof2013relativetothe1.8%fallattainedinthefirstelevenmonthsof2012.
•REALESTATERealEstatefiguresshowedadeclinein2013.TheValue of Real Estate Sales fell by 5.1% in 2013 relative to the same 2012 while the Number of Sale Transactions by foreigners and locals fell by 7.7% and 7.2% respectively. This was mainly due to the uncertainty arising from the regional turmoil that has left a negative impact on investor and consumer sentiments at large.
•TouRISM- for the third year running, Number of Touristswitnessed a fall in their figures from thepeak attained in 2010. The number of tourists fell from 2,167,989 in 2010 down to 1,655,051, 1,365,845 and 1,274,362 in the same period in 2011, 2012 and 2013 respectively. Similarly, Hotel Occupancy Rates reached a low of 51% by November. This downturn continues to be the result of the local and regional situation deterring Arab tourists from visiting the country.
- The Number of Arab tourists also declined over this period, falling 55.1% from 894,724 in 2010 to 402,080 in 2013. As such, they now represent 31.6% of total tourists versus 41.3% in the same period of their peak year. Europeans on the hand, continued to hold the top spot, as they captured 34.1% share of tourists in 2013 relative to 25.3% in 2010.
- In addition, Tourism Spending fell 9% in 2013 relative to the previous year according to Global Refund. This compares to the year on year 6% drop attained in 2012.
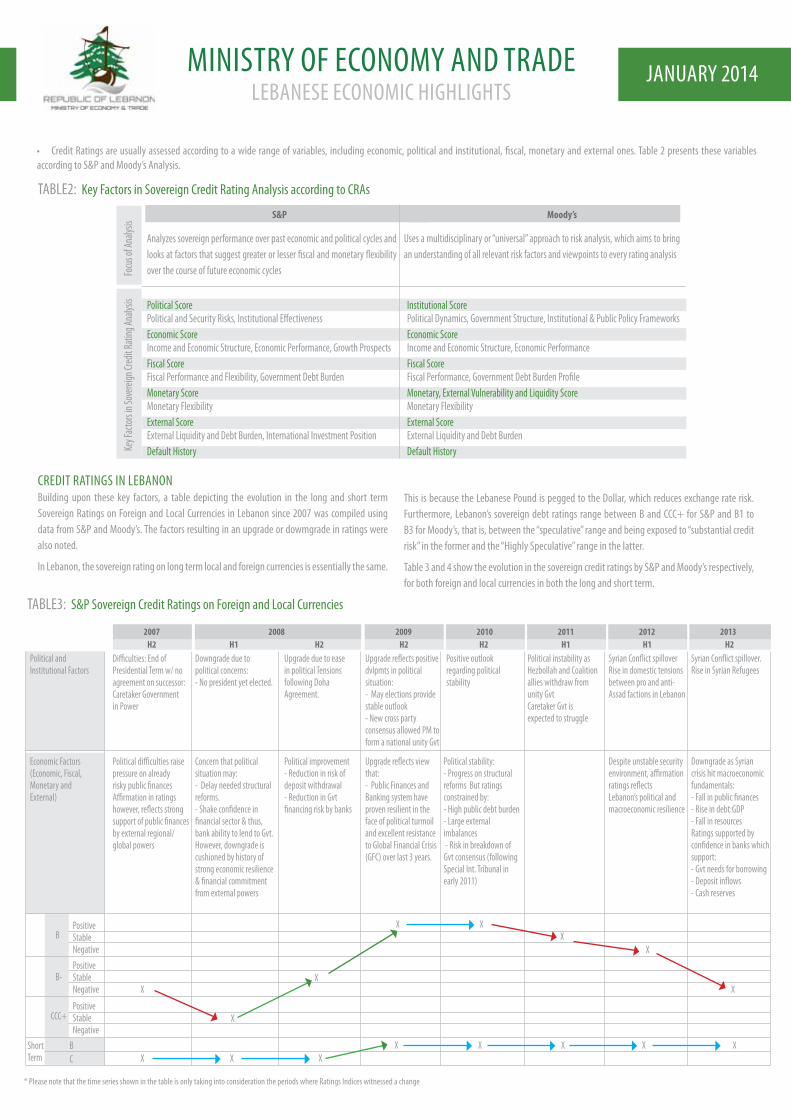
•TRADE- Value of Imports saw a 0.2% drop by the end of 2013 relative to 2012, to reach USD 21,230 Million while Volume of Imports rose by 1.6%. Removing the effects of oil imports however leads to a steeper rise in both the value and vol-ume of imports, the former climbing by 5.5% while the later rises by 14.0%.
- Value of Exportshoweversawa9.4%declineinfiguresbytheendof2013,reachinguSD4,060 Million relative to the USD 4,483 Million attained a year earlier. This was mainly due to the sharp decline in jewelry exports, which fell 55.4% in 2013 relative to the same period in 2012, to make up only 17% of total exports compared to the 38% report-ed last year. The Volume of Exports however rose by 6.5%. This is mainly attributed to the 288% rise in the volume of mineral fuel oils, which now make up 12% of total exports compared to the 3% reported last year, as demand of oil products from Syria skyrocketed since the start of the conflict. In fact, value of exports to Syria rose 78% in 2013 rela-tive to the previous year.
- As such, the Value of the Trade Deficit in 2013 showed a rise of 2.2% when oil products are included in the equation. Removing oil products however leads to a year on year surge in the tradedeficitin2013sothatitrisesby11.6%rela-tiveto2012.
- The Balance of Paymentsevensawanetimprovementin2013,asitsdeficitfelltouSD1,130Million from the USD 1,537 Million attained in the same period in 2012. This improvement came aboutdespitethe2.2%riseinthetradedeficit,asthe4.8%riseinCapital Inflows made up for the decline over the said period.
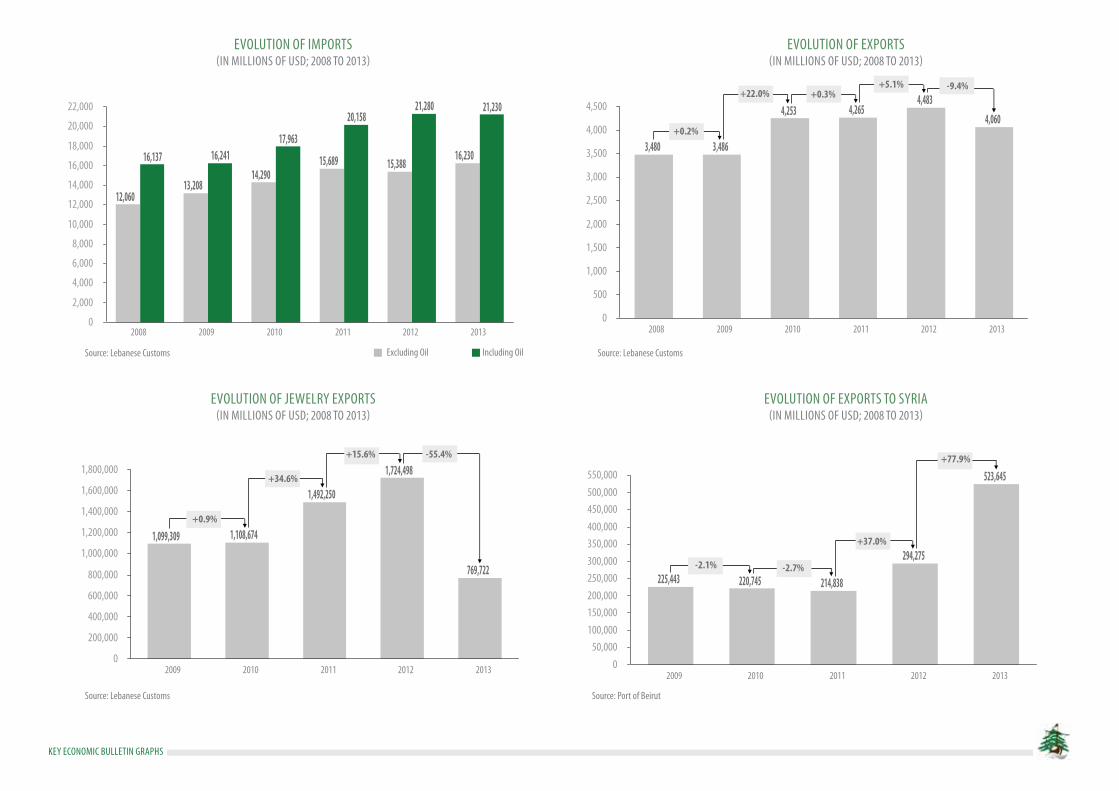
•BANkING- Private Sector Deposits continued to grow in the first elevenmonths of 2013. Year toDategrowth in2013 specificallywitnesseda slight improvementwhencompared to theYTDgrowth attained in 2012, given that the former reached 6.5% compared to 6.4% in the latter. Nevertheless, private sector deposits surpassed USD 133 Billion, accounting for 83% of total commercial bank assets by November 2013.
- Foreign Assets fell by 4.4% in thefirst elevenmonths of 2013 relative to the 1.1% riseobserved in the same period a year earlier. The reduction was mainly the result of the continued plunge in the value of Gold Reserves,which fell 24.9% in the first elevenmonths of 2013relative to the 10.7% rise witnessed in the same period in 2012.
MINISTRY Of ECONOMY AND TRADELEBANESE ECONOMIC HIGHLIGHTS
JANUARY 2014

Key economic indicators
Key economic indicatorsJanuary 2014 issue
GeneraL indices
construction and reaL estate
LaBor
Footnote Period 2012 2011 2010 2009 20082013/2012
% Δ2012/2011
% Δ2013
nominal GdP (Billions usd) cas 1 Jan-dec - 42.9 40.1 7.0% 38.0 35.1 28.8 imF 2 Jan-dec 43.5 41.3 39.0 5.9% 37.1 34.7 29.7 World Bank 3 Jan-dec - 42.9 40.1 7.0% 37.1 34.7 30.1 real economic Growth rate (%) cas 1 Jan-dec - 2.5% 2.0% 8.0% 10.3% 9.1% imF 2 Jan-dec 1.5% 1.5% 1.5% 7.0% 9.0% 8.6% World Bank 3 Jan-dec 0.7% 1.4% 3.0% 7.0% 8.5% 9.3%coincidence indicator (1993 =100) 4 nov 278.8 260.8 6.9% 260.60 0.1% 266.7 242.7 209.8 Growth in Coincident Indicator (%) 4 ytd nov 6.2% -1.8% 2.0% 10.9% 15.8% 11.8%inflation rate (%) 1 Jan-dec 130.9 129.5 1.1% 117.6 10.1% 114.1 109.10 105.5electricity Production (millions Kwh) 4 Jan-nov 11,004 10,016 9.9% 11,481 -12.8% 11,460 10,919 10,213number of new car registrations 5 Jan-dec 36,109 35,477 1.8% 32,455 9.3% 33,403 32,177 33,428number of industrial Licenses 6 Jan-dec 415 339 22.4% 375 -9.6% - - -
number of renewed Work Permits given to Foreign Workers 7 Jan-dec - 137,034 123,975 10.5% 114,810 - -number of 1st time Work Permits given to Foreign Workers 7 Jan-dec - 53,985 60,981 -11.5% 45,005 - -
cement deliveries (000s tons) 4 Jan-nov 5,545 4,942 12.2% 5,104 -3.2% 4,827 4,578 3,930construction Permits area (000s of sq m) 8 Jan-dec 12,925 14,678 -11.9% 16,465 -10.9% 17,625 14,343 16,067total number of new Permits 8 Jan-dec 16,743 18,194 -8.0% 18,347 -0.8% 17,922 15,438 13,727total Value of real estate sales (millions of usd) 9 Jan-dec 8,708 9,176 -5.1% 8,841 3.8% 9,479 6,955 6,481total number of Property sales, of which: 9 Jan-dec 69,198 74,569 -7.2% 82,984 -10.1% 94,202 83,622 81,709 Sales to Locals 9 Jan-dec 67,920 73,184 -7.2% 81,454 -10.2% 92,282 81,314 79,763 Sales to Foreigners 9 Jan-dec 1,278 1,385 -7.7% 1,530 -9.5% 1,920 2,308 1,946
[1] Lebanese central administration of statistics (cas) [2] imF regional economic outlook report, november 2013, [3] World Bank [4] Banque du Liban, [5] association of car importers in Lebanon,[6] ministry of industry, [7] ministry of Labor [8] order of architects in Beirut and tripoli, [9] real estate directorateLast updated: February 4th, 2014

Key economic Bulletin Graphs
cas imF World Bank
local sales Foreign sales
Gdp GroWth(in percentaGe; 2008-2013F)
evolution oF the numBer oF property sales(in numBer oF sales; 2008-2013)
evolution in consumer price index(dec 2007=100)
evolution in the numBer oF tourists and airport passenGers(2008-2013)
source: 2004 to 2010- lebanese national accountsnote; no cas Gdp Growth projection for 2013
source: central administration of statistics source: ministry of tourism and rafic hariri airporttourismairport passengers
source: central administration of statistics

Key economic indicators
tradeFootnote Period 2012 2011 2010 2009 2008
2013/2012 % Δ
2012/2011 % Δ2013
exports Value (millions of usd), of which: 10 Jan-dec 4,060 4,483 -9.4% 4,265 5.1% 4,253 3,486 3,480exports Volume (millions of tons) 10 Jan-dec 2.77 2.60 6.5% 2.72 -4.4% 3.11 2.96 3.52imports Value (millions of usd), of which: 10 Jan-dec (21,230) (21,280) -0.2% (20,158) 5.6% (17,963) (16,241) (16,137) Mineral Fuels and Oils 10 Jan-dec 5,000 5,892 -15.2% 4,469 31.8% 3,673 3,232 4,077 Imports Value, excl Oil Products 10 Jan-dec (16,230) (15,388) 5.5% (15,689) -1.9% (14,290) (13,009) (12,060) imports Volume (millions of tons), of which: 10 Jan-dec 15.87 15.62 1.6% 15.05 3.8% 15.00 14.63 12.51 Mineral Fuels and Oils 10 Jan-dec 5.56 6.58 -15.5% 5.55 18.6% 5.96 6.48 5.23 Imports Value, excl Oil Products 10 Jan-dec 10.31 9.04 14.0% 9.50 -4.8% 9.04 8.15 7.28trade deficit (millions of usd) 10 Jan-dec (17,170) (16,797) 2.2% (15,893) 5.7% (13,710) (12,755) (12,657)trade deficit, excl oil Products 10 Jan-dec (12,170) (10,905) 11.6% (11,424) -4.5% (10,037) (9,523) (8,580)industrial exports (excluding Gold ingots) 6 Jan-nov 2,862 2,688 6.5% 3,044 -11.7% 2,920 2,295 -industrial machinery 6 Jan-nov 280 263 6.6% 228 15.2% 209 182 172capital inflows (millions of usd), of which: Jan-dec 15,990 15,260 4.8% 13,897 9.8% 17,035 20,654 16,118Balance of Payments (millions of usd) 4 Jan-dec (1,130) (1,537) -26.5% (1,996) -23.0% 3,325 7,899 3,461Value of transit Goods (millions of usd) 10 Jan-dec 459.5 344.3 33.5% 408.1 -15.6% 387.8 428.8 339.3Port activity (000s tons of Goods) 11 Jan-dec 8,269 7,333 12.8% 6,677 9.8% 6,470 6,324 5,746Port revenues (millions of usd) 11 Jan-dec 219.1 174.7 25.4% 158.8 10.0% 166.8 165.3 132.5total teu (twenty Foot equivalent unit) of which: 11 Jan-dec 1,117,334 1,041,756 7.3% 1,034,249 0.7% 948,350 994,601 945,112 TEU to Local Market 11 Jan-dec 758,058 634,969 19.4% 585,220 8.5% 599,433 591,190 527,209 Transshipment 11 Jan-dec 359,276 406,787 -11.7% 449,029 -9.4% 348,917 403,411 417,903
number of tourists 12 Jan-dec 1,274,362 1,365,845 -6.7% 1,655,051 -17.5% 2,167,989 1,850,000 1,332,551Hotel occupancy rates 13 Jan-nov 51% 55% -7.3% 58% -4.4% 69% 73% 53%evolution in tourism spending 14 Jan-dec -9% -6% number of airport Passengers (in millions) 15 Jan-dec 6.26 5.96 5.1% 5.65 5.4% 5.55 4.99 4.09
Last updated: February 4th, 2014
tourism
[10] Lebanese customs at ministry of Finance, [6] ministry of industry, [4] Banque du Liban, [11] Port of Beirut[12] ministry of tourism, [13] ernst and young Hotel Benchmark survey report november 2013, [14] Global Blue [15] rafic Hariri airport
Key economic indicatorsJanuary 2014 issue
Key economic Bulletin Graphs
evolution oF imports(in millions oF usd; 2008 to 2013)
evolution oF exports(in millions oF usd; 2008 to 2013)
evolution oF exports to syria(in millions oF usd; 2008 to 2013)
source: lebanese customs
source: lebanese customs source: port of Beirut
source: lebanese customsexcluding oil including oil
evolution oF JeWelry exports(in millions oF usd; 2008 to 2013)

Key economic indicators
BanKinGFootnote Period 2012 2011 2010 2009 2008
2013/2012 % Δ
2012/2011 % Δ2013
commercial Banks indicators:commercial Banking assets (millions usd) 4 nov 161,916 150,382 7.7% 139,433 7.9% 127,572 113,570 91,758 Growth in Commercial Banking Assets (%) 4 ytd nov 6.6% 7.0% 8.2% 10.7% 20.5% 11.6% Private sector deposits (millions usd) 4 nov 133,151 123,124 8.1% 114,145 7.9% 105,015 94,063 75,598 Growth in Private Sector Deposits (%) 4 ytd nov 6.5% 6.4% 6.5% 9.7% 20.9% 12.4% Loans to the Private sector (millions of usd) 4 nov 46,812 42,937 9.0% 39,601 8.4% 34,919 28,814 24,687 Growth in Loans to the P.S (%) 4 ytd nov 7.7% 7.4% 13.4% 23.1% 15.1% 20.9% BdL indicators:Foreign assets (millions of usd), of which: 4 nov 43,287 45,724 -5.3% 46,650 -2.0% 40,408 35,599 23,917 Growth in Foreign Assets (%) 4 ytd nov -4.4% 1.1% 12.1% 13.1% 41.9% 37.3% Foreign currency reserves 4 nov 31,784 29,786 6.7% 30,815 -3.3% 27,738 24,811 16,418 Growth in Foreign Currency Reserves (%) 4 ytd nov 6.0% -3.3% 7.8% 8.1% 45.4% 67.9% Gold reserves 4 nov 11,503 15,937 -27.8% 15,835 0.6% 12,670 10,788 7,500 Growth in Gold Reserves(%) 4 ytd nov -24.9% 10.7% 21.7% 25.9% 34.3% -1.8% Lebanese Pound deposit rate (%) 4 nov 5.47 5.38 1.7% 5.59 -3.8% 5.68 6.81 7.27Lebanese Pound Lending rate (%) 4 nov 7.01 7.11 -1.4% 7.31 -2.7% 7.98 9.13 10.08usd deposit rate (%) 4 nov 2.97 2.85 4.2% 2.84 0.4% 2.80 3.07 3.47usd Lending rate (%) 4 nov 6.88 7.09 -3.0% 6.99 1.4% 6.96 7.25 7.543-month tB yield (%) 4 nov 4.44 4.43 0.2% 3.93 12.7% 3.93 4.64 5.186 month tB yield (%) 4 nov 4.99 4.99 0.0% 4.50 10.9% 4.52 5.82 7.1612 month tB yield (%) 4 nov 5.35 5.35 0.0% 4.81 11.2% 4.81 5.99 7.6636-month tB coupon (%) 4 nov 6.61 6.61 0.0% 6.03 9.6% 6.03 7.35 9.24
Last updated: February 4th, 2014
[4] Banque du Liban
Key economic indicatorsJanuary 2014 issue

Key economic Bulletin Graphs
total loans to the private (resident and non resident) and puBlic sector(millions oF usd; 2008-2013)
value oF ForeiGn assets held By Bdl(in millions usd; 2008-2013)
value oF BanK deposits (leBanese and ForeiGn currency)(in millions usd; 2008-2013)
lBp and usd deposit and loan rates(in percentaGe; 2008-2013)
source: Banque du liban
source: Banque du liban source: Banque du liban lBp deposit usd depositlBp loan usd loan
note: Bank deposits defined as resident private sector deposits (excluding public sector)source: Banque du liban
total loans to the private sectortotal loans to the public sector
Gold Foreign currency
lebanese depositsForeign currency deposits

Key economic indicators
Finance
Finance
eXcHanGe rate marKets
Footnote
Footnote
Footnote
Period
Period
Period
2012
2012
2012
2011
2011
2011
2010
2010
2010
2009
2009
2009
2008
2008
2008
2013/2012 % Δ
2013/2012 % Δ
2013/2012 % Δ
2012/2011 % Δ
2012/2011 % Δ
2012/2011 % Δ
2013
2013
2013
m3 money supply (million usd) 4 nov 109,338 102,894 6.3% 96,323 6.8% 90,998 81,039 67,078 Growth in M3 Money (%) 4 ytd nov 5.1% 5.8% 4.5% 10.9% 18.0% 12.1% Value of Kafalat Loans (millions usd) 17 Jan-dec 118.2 138.0 -14.3% 165.0 -16.4% 169.4 139.6 126.2number of Kafalat Loans 17 Jan-dec 871 1,025 -15.0% 1,272 -19.4% 1,404 1,050 908Value of cleared checks (millions of usd) 4 Jan-nov 66,064 64,996 1.6% 65,250 -0.4% 62,415 51,730 48,482number of cleared checks (in millions) 4 Jan-nov 12.12 11.97 1.3% 11.89 0.7% 12.25 11.08 10.52
market capitalization (millions usd) 16 Jan 11,049 10,853 1.8% 10,291 5.5% 12,660 12,652 8,764Value of traded shares (millions of usd) 16 Jan 33.3 15.4 117.0% 30.1 -49.0% 47.6 961.7 40.9Volume of traded shares (millions of shares) 16 Jan 3.3 3.0 10.9% 4.7 -36.7% 5.3 104.5 2.6
yoy usd-LBP exchange rate 18 Jan close 1,502.5 1,502 0.0% 1,502 0.0% 1,507.5 1,501.0 1507.5yoy euro-usd exchange rate 19 Jan close 1.3486 1.3567 -0.6% 1.3144 3.2% 1.3694 1.3971 nayoy GBP-usd exchange rate 19 Jan close 1.6439 1.5801 4.0% 1.571 0.6% 1.6014 1.6137 nayoy usd-JPy exchange rate 19 Jan close 102.04 91.08 12.0% 76.35 19.3% 82.04 89.92 na
Last updated: February 4th, 2014
[4] Banque du Liban [16] Beirut stock exchange, [17] Kafalat [18] BLom Bank “Lebanon Brief” reports, [19] Bloomberg.com - interactive currency charts
Key economic indicatorsJanuary 2014 issue
Key economic Bulletin Graphs
value oF marKet capitalization(in millions usd; 2008-2013)
evolution oF value oF KaFalat loans(in millions usd; 2008-2013)
evolution oF the value oF cleared checKs(in millions usd; 2008-2013)
evolution oF edl transFers(in millions oF usd; 2008-2013)
source: Beirut stock exchange
source: Kafalat s.a.l source: Banque du liban
source: Banque du liban

Key economic indicators
[20] ministry of Finance- Fiscal Performance sheet [21] Byblos report issue 337, [22] Public Finance monitor
PuBLic Finance [24]Footnote Period 2012 2011 2010 2009 2008
2013/2012 % Δ
2012/2011 % Δ2013
total revenues (million usd) 20 Jan-oct 7,921 8,097 -2.2% 7,853 3.1% 6,911 7,111 5,879total expenditures (million usd) 20 Jan-oct 11,439 10,774 6.2% 9,366 15.0% 9,419 9,523 7,958Fiscal Balance (million usd) 20 Jan-oct (3,519) (2,676) 31.5% (1,514) 76.8% (2,508) (2,412) (2,079)total Primary Balance (million usd) 20 Jan-oct (313) 434 -172.2% 1,830 -76.3% 959 904 892Public debt (Billions usd) 21 Jan-nov 63.25 57.6 9.9% 54.1 6.5% 51.8 50.5 46.8Budget revenues (millions usd), of which: 20 Jan-oct 7,463 7,726 -3.4% 7,464 3.5% 6,541 6,759 5,465 tax revenues, of which: 20 Jan-oct 5,861 5,925 -1.1% 5,638 5.1% 5,730 5,102 3,987 misc tax rev 20 Jan-oct 2,726 2,736 -0.4% 2,519 8.6% 2,302 1,935 1,713 customs rev 20 Jan-oct 1,192 1,248 -4.5% 1,208 3.3% 1,566 1,480 788 Vat rev 20 Jan-oct 1,943 1,941 0.1% 1,912 1.5% 1,862 1,687 1,486 non tax rev 20 Jan-oct 1,603 1,801 -11.0% 1,826 -1.4% 811 1,657 1,478Budget expenditures (millions of usd), of which: 20 Jan-oct 8,973 8,376 7.1% 8,788 -4.7% 8,476 7,114 6,011 General expenditures, of which: 20 Jan-oct 5,767 5,265 9.5% 5,444 -3.3% 5,009 3,797 3,040 edL 20 Jan-oct 1,797 1,871 -4.0% 1,427 31.2% 1,012 1,290 1,201 interest Payments, of which: 20 Jan-oct 3,044 2,945 3.4% 3,152 -6.6% 3,287 3,163 2,778 Lebanese Lira interest Payments 20 Jan-oct 1,889 1,881 0.5% 1,989 -5.4% 2,111 1,953 1,606 Foreign currency interest Payments 20 Jan-oct 1,155 1,065 8.5% 1,163 -8.5% 1,176 1,210 1,172 Principal repayments 20 Jan-oct 161 165 -2.5% 191 -13.6% 180 153 193treasury revenues (millions of usd) 20 Jan-oct 457 372 23.0% 388 -4.2% 369 352 414treasury expenditures (millions of usd) 20 Jan-oct 2,467 2,398 2.9% 578 314.6% 943 2,410 1,946Budget expenditures (millions of usd) , of which: 22 Jan-oct 10,469 9,906 5.7% 8,824 12.3% 8,570 8,444 7,329 Personnel cost, of which: 22 Jan-oct 3,533 3,690 -4.2% 2,844 29.7% 2,797 2,697 2,149 salaries and Wages 22 Jan-oct 2,316 2,403 -3.6% 1,938 24.0% 1,857 1,822 1,443 retirement + end of service 22 Jan-oct 1,019 1,049 -2.9% 729 43.9% 772 707 598 transfers to edL 22 Jan-oct 1,796 1,871 -4.0% 1,427 31.1% 1,012 1,290 1,201 debt service, of which: 22 Jan-oct 3,205 3,110 3.0% 3,343 -7.0% 3,467 3,317 2,970 Lebanese Lira interest Payments 22 Jan-oct 1,889 1,881 0.5% 1,989 -5.4% 2,111 1,953 1,606 Foreign currency interest Payments 22 Jan-oct 1,155 1,065 8.5% 1,164 -8.5% 1,176 1,211 1,172 capital expenditures 22 Jan-oct 568 374 51.8% 324 15.6% 376 282 271treasury expenditures (millions of usd) 22 Jan-oct 970 867 11.9% 541 60.2% 848 1,080 628
Last updated: February 4th, 2014
Key economic indicatorsJanuary 2014 issue

Key economic Bulletin Graphs
evolution oF total revenues, expenditures and Fiscal Balancein millions usd; 2008-2013)
evolution oF Gross puBlic deBt(in Billions oF usd; 2008-2013)
evolution oF the Fiscal Balance, deBt servicinG and primary Balance(in millions usd; 2008-2013)
evolution oF deBt/Gdp, deFicit/Gdp, revenues/Gdp and expenditures/Gdp(in percentaGe; 2008-2012)
source: ministry of Finance
source: ministry of Financesource: Banque du liban
source: Banque du liban
debt/ Gdp deficit/ Gdp expenditures/ Gdpa revenues/ Gdp
revenues expenditures Fiscal Balance debt servicing Fiscal Balance primary Balance