Embed Size (px)
Citation preview

Powerful statistical software everyone can use
Minitab®
minitab.com/products/minitab1 2
Powerful statistical software everyone can use
Download your 30-day free trial today!
Minitab®
Minitab Statistical Software can visualize, analyze, and harness the power of your data to solve your toughest challenges from anywhere on the cloud.
Minitab has the market’s most trusted statistical tools on your desktop or the cloud to get the most out
of your data, discover trends, find and predict patterns, uncover hidden relationships between variables,
and create stunning visualizations to tackle even the most daunting challenges and opportunities.
With the power of statistics, industry-leading data analytics, and dynamic visualizations on your side, the
possibilities are endless.
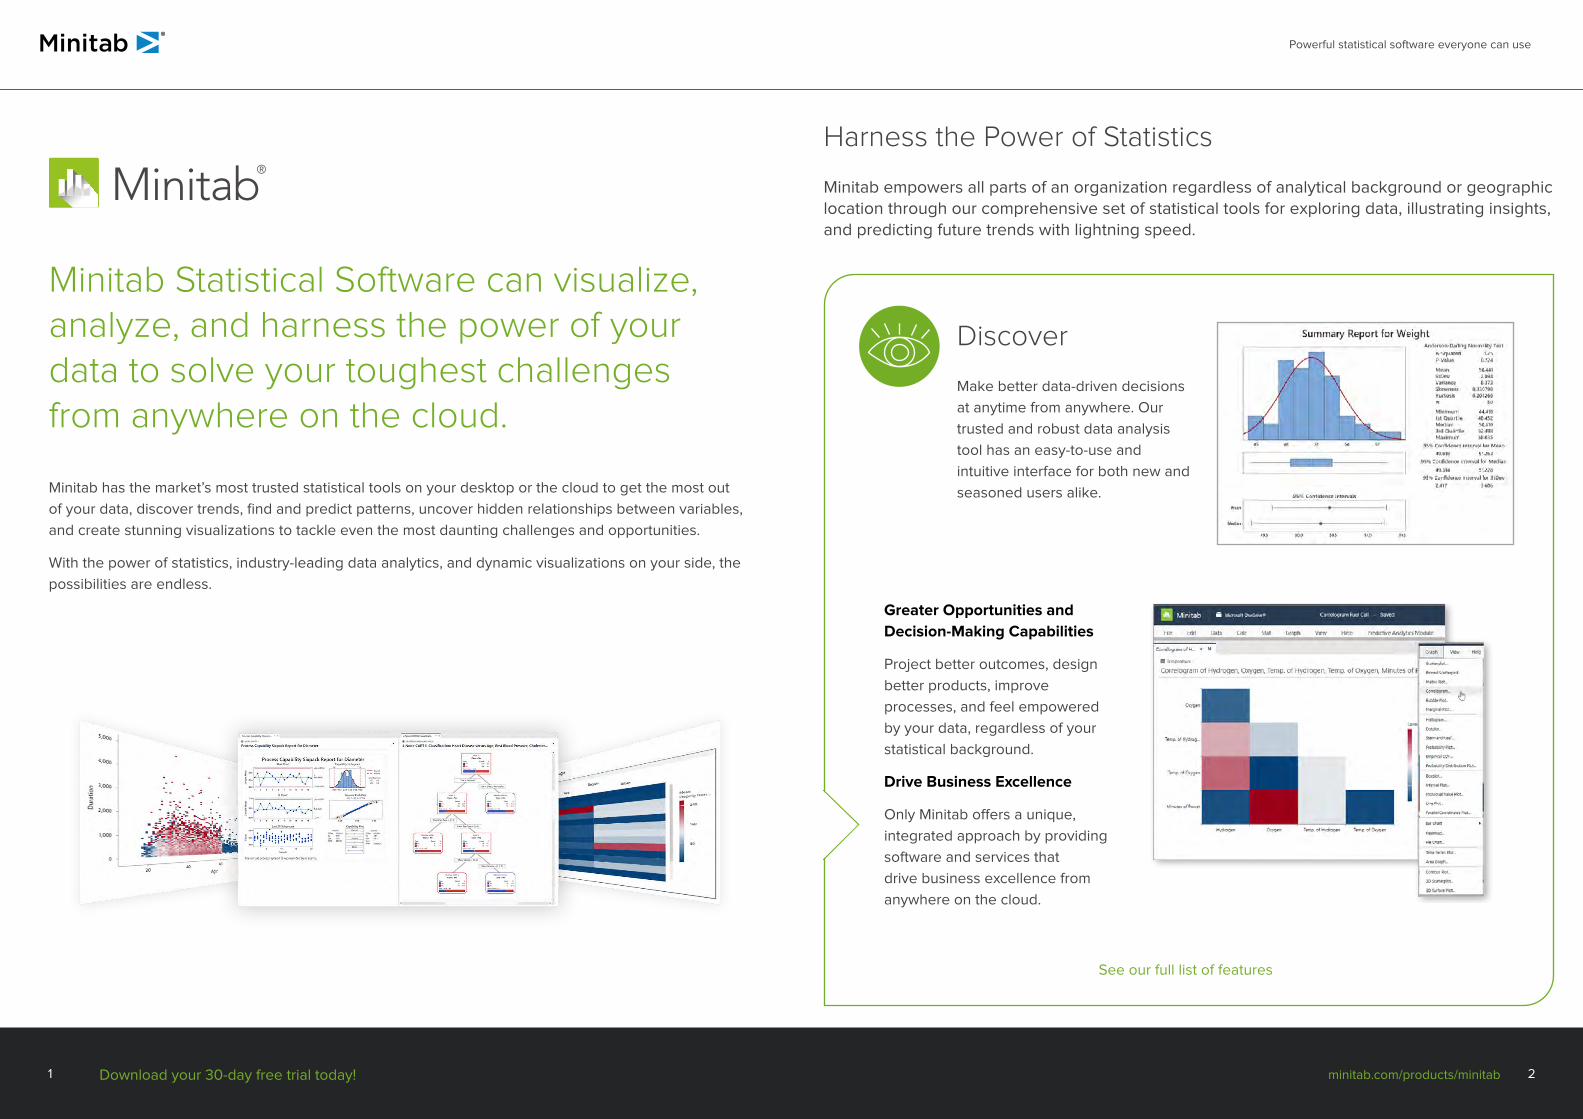
Discover
Make better data-driven decisions
at anytime from anywhere. Our
trusted and robust data analysis
tool has an easy-to-use and
intuitive interface for both new and
seasoned users alike.
Greater Opportunities and Decision-Making Capabilities
Project better outcomes, design
better products, improve
processes, and feel empowered
by your data, regardless of your
statistical background.
Drive Business Excellence
Only Minitab offers a unique,
integrated approach by providing
software and services that
drive business excellence from
anywhere on the cloud.
Harness the Power of Statistics
Minitab empowers all parts of an organization regardless of analytical background or geographic location through our comprehensive set of statistical tools for exploring data, illustrating insights, and predicting future trends with lightning speed.
Minitab®
See our full list of features
minitab.com/products/minitab3 4
Powerful statistical software everyone can use
Download your 30-day free trial today!
Minitab®
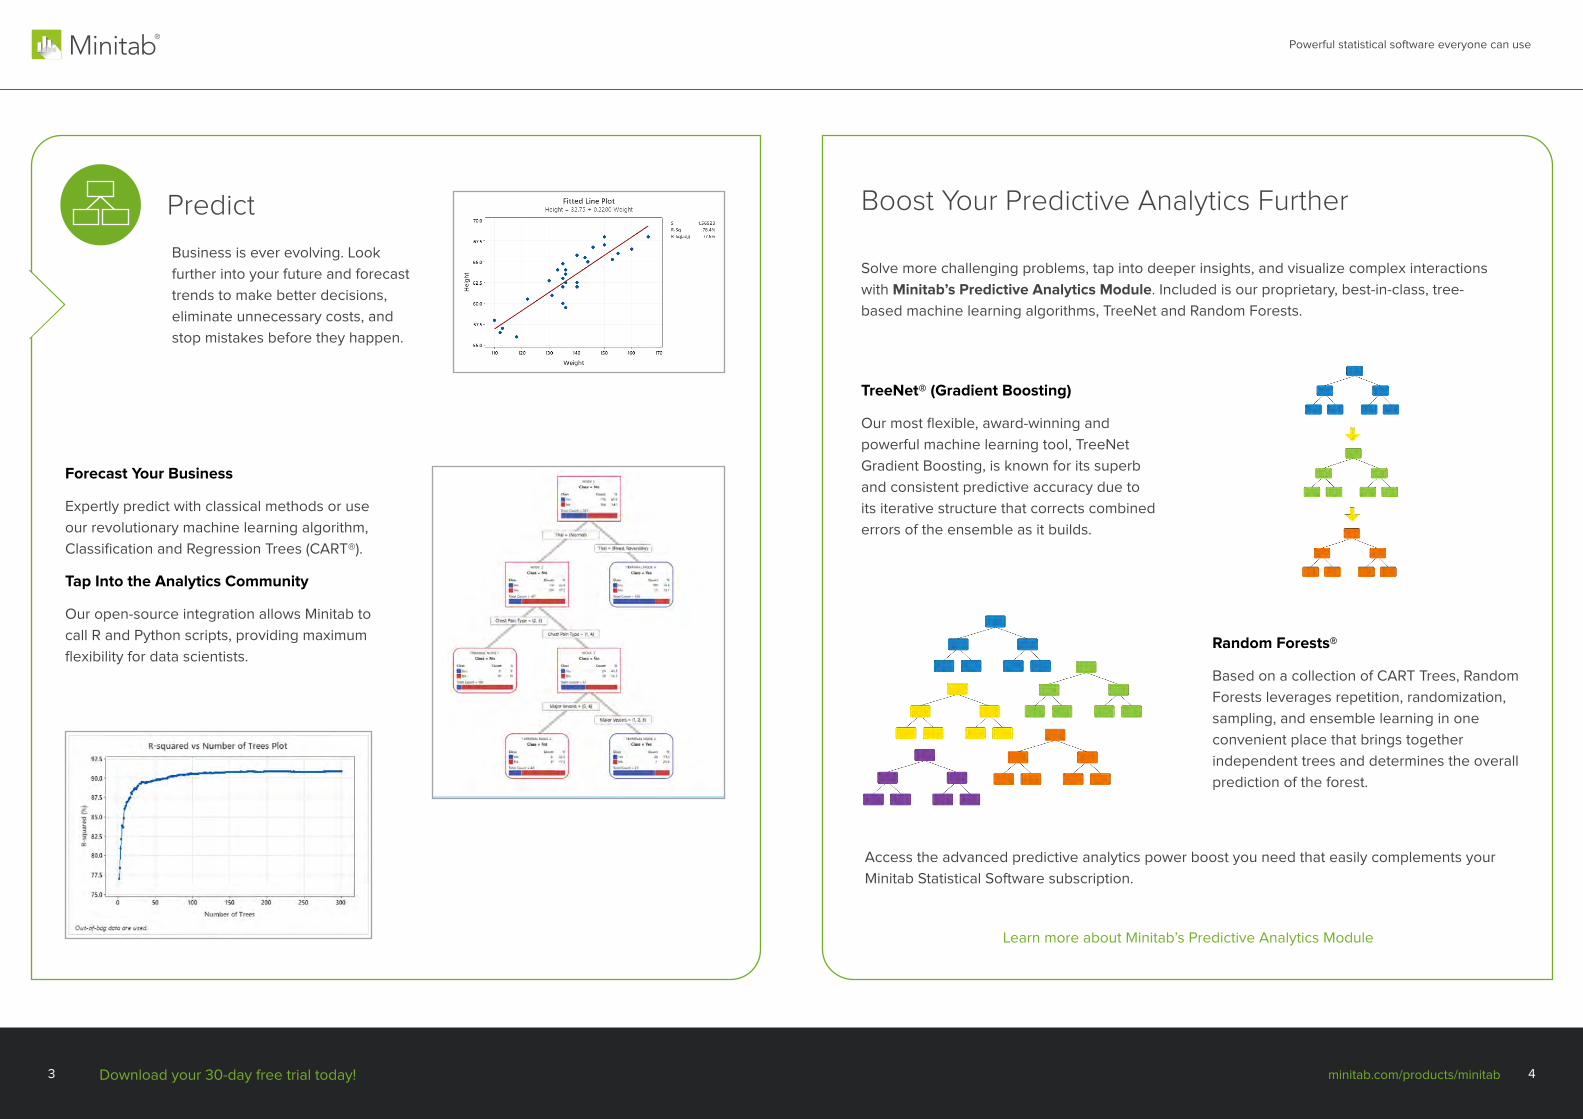
Predict
Business is ever evolving. Look
further into your future and forecast
trends to make better decisions,
eliminate unnecessary costs, and
stop mistakes before they happen.
Forecast Your Business
Expertly predict with classical methods or use
our revolutionary machine learning algorithm,
Classification and Regression Trees (CART®).
Tap Into the Analytics Community
Our open-source integration allows Minitab to
call R and Python scripts, providing maximum
flexibility for data scientists.
Boost Your Predictive Analytics Further
Solve more challenging problems, tap into deeper insights, and visualize complex interactions
with Minitab’s Predictive Analytics Module. Included is our proprietary, best-in-class, tree-
based machine learning algorithms, TreeNet and Random Forests.
TreeNet® (Gradient Boosting)
Our most flexible, award-winning and
powerful machine learning tool, TreeNet
Gradient Boosting, is known for its superb
and consistent predictive accuracy due to
its iterative structure that corrects combined
errors of the ensemble as it builds.
Learn more about Minitab’s Predictive Analytics Module
Random Forests®
Based on a collection of CART Trees, Random
Forests leverages repetition, randomization,
sampling, and ensemble learning in one
convenient place that brings together
independent trees and determines the overall
prediction of the forest.
Access the advanced predictive analytics power boost you need that easily complements your
Minitab Statistical Software subscription.
minitab.com/products/minitab5 6
Powerful statistical software everyone can use
Download your 30-day free trial today!
Minitab®
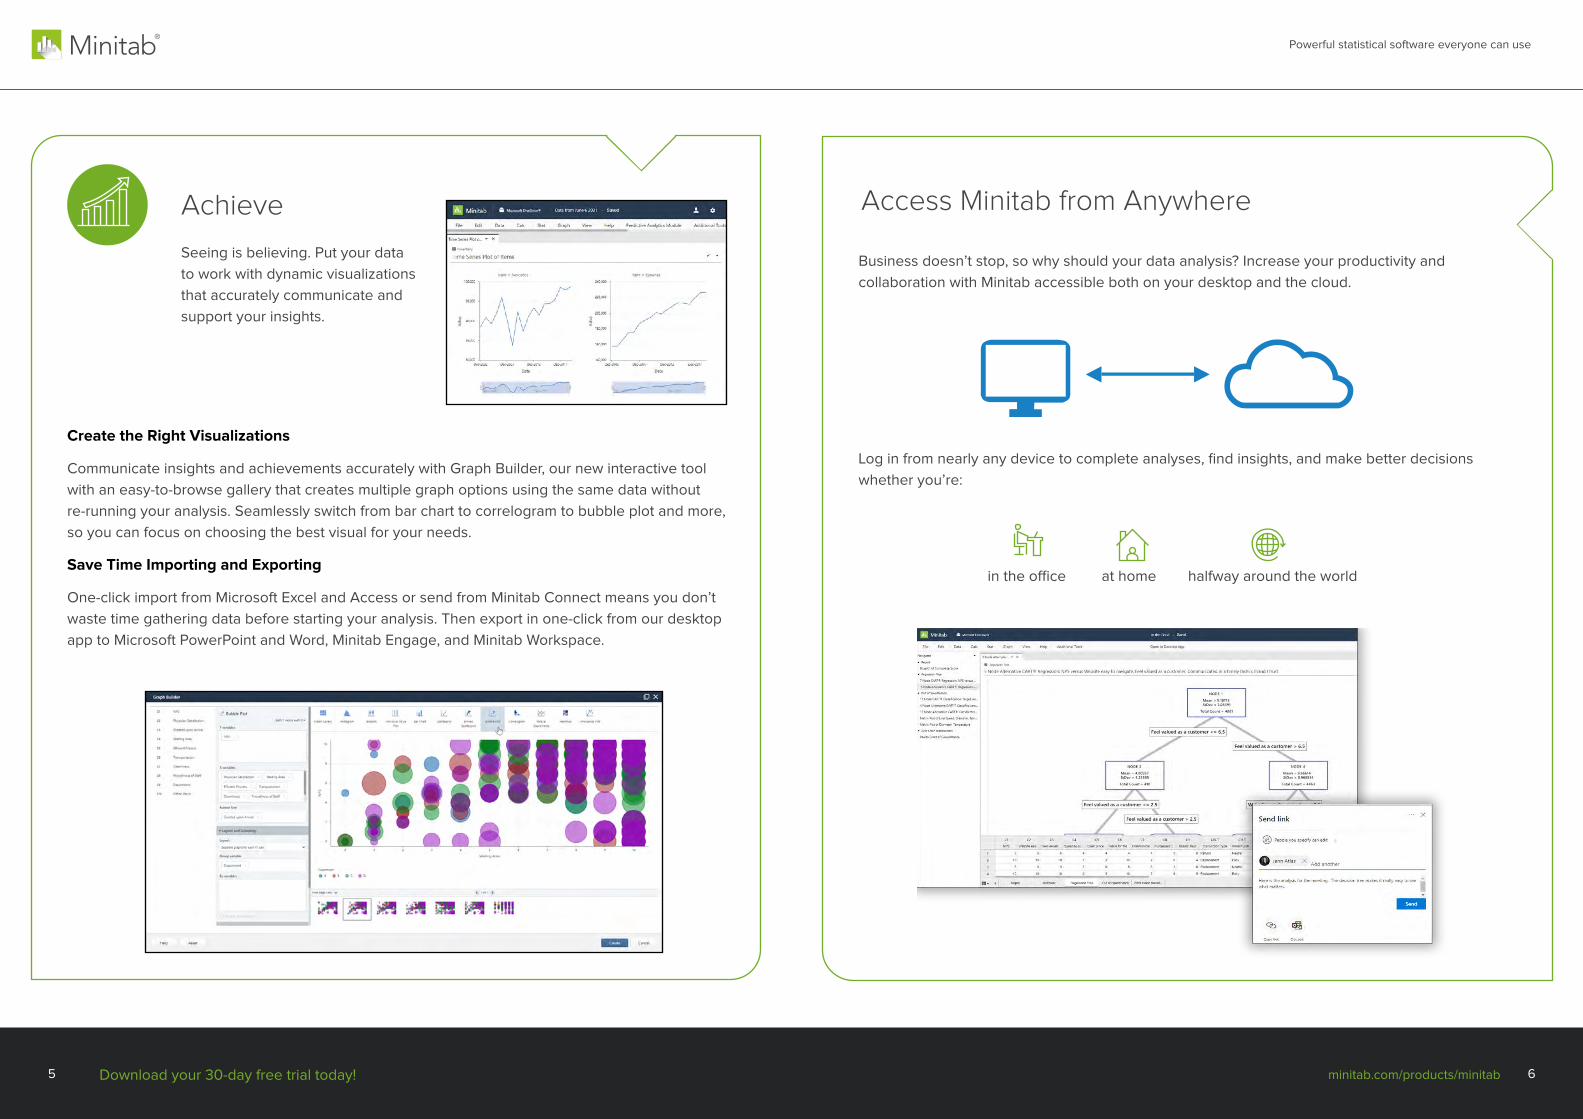
Achieve
Seeing is believing. Put your data
to work with dynamic visualizations
that accurately communicate and
support your insights.
Create the Right Visualizations
Communicate insights and achievements accurately with Graph Builder, our new interactive tool
with an easy-to-browse gallery that creates multiple graph options using the same data without
re-running your analysis. Seamlessly switch from bar chart to correlogram to bubble plot and more,
so you can focus on choosing the best visual for your needs.
Save Time Importing and Exporting
One-click import from Microsoft Excel and Access or send from Minitab Connect means you don’t
waste time gathering data before starting your analysis. Then export in one-click from our desktop
app to Microsoft PowerPoint and Word, Minitab Engage, and Minitab Workspace.
Business doesn’t stop, so why should your data analysis? Increase your productivity and
collaboration with Minitab accessible both on your desktop and the cloud.
Access Minitab from Anywhere
Log in from nearly any device to complete analyses, find insights, and make better decisions
whether you’re:
in the office at home halfway around the world
minitab.com/products/minitab7 8
Powerful statistical software everyone can use
Download your 30-day free trial today!
Minitab®
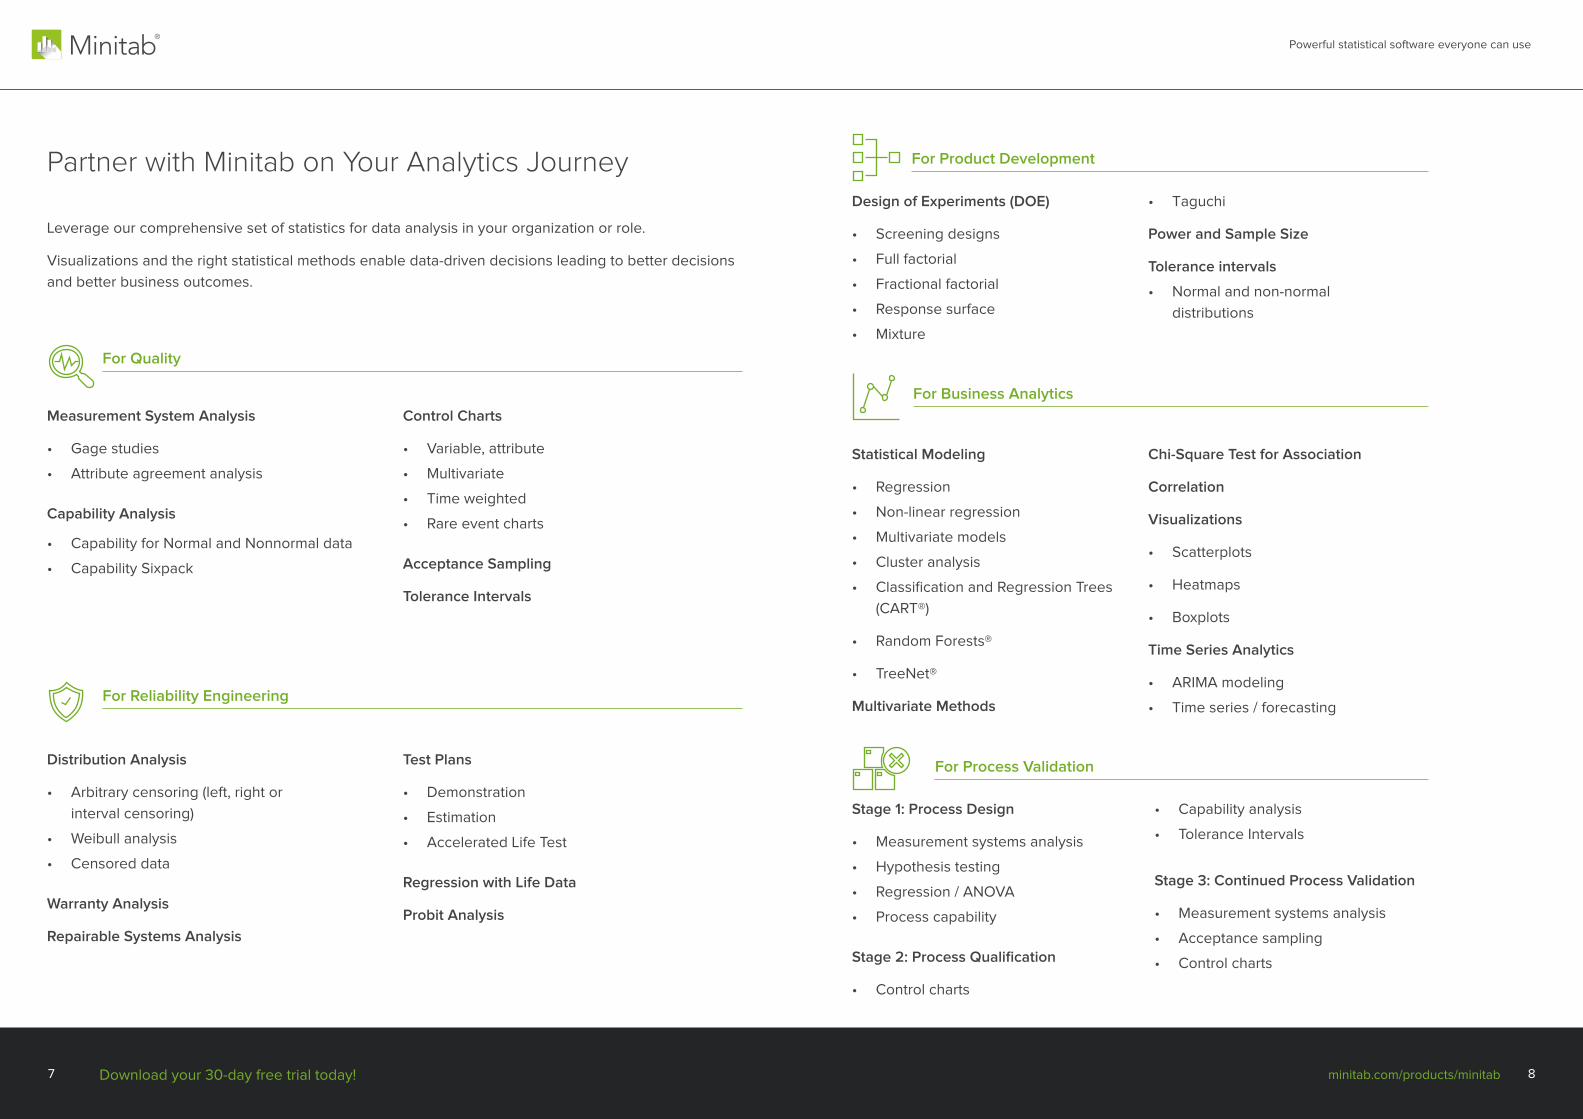
Partner with Minitab on Your Analytics Journey
Measurement System Analysis
• Gage studies
• Attribute agreement analysis
Capability Analysis
• Capability for Normal and Nonnormal data
• Capability Sixpack
Control Charts
• Variable, attribute
• Multivariate
• Time weighted
• Rare event charts
Acceptance Sampling
Tolerance Intervals
Distribution Analysis
• Arbitrary censoring (left, right or
interval censoring)
• Weibull analysis
• Censored data
Warranty Analysis
Repairable Systems Analysis
Test Plans
• Demonstration
• Estimation
• Accelerated Life Test
Regression with Life Data
Probit Analysis
For Quality
For Reliability Engineering
Leverage our comprehensive set of statistics for data analysis in your organization or role.
Visualizations and the right statistical methods enable data-driven decisions leading to better decisions
and better business outcomes.
Design of Experiments (DOE)
• Screening designs
• Full factorial
• Fractional factorial
• Response surface
• Mixture
• Taguchi
Power and Sample Size
Tolerance intervals
• Normal and non-normal
distributions
For Product Development
Statistical Modeling
• Regression
• Non-linear regression
• Multivariate models
• Cluster analysis
• Classification and Regression Trees
(CART®)
• Random Forests®
• TreeNet®
Multivariate Methods
Chi-Square Test for Association
Correlation
Visualizations
• Scatterplots
• Heatmaps
• Boxplots
Time Series Analytics
• ARIMA modeling
• Time series / forecasting
For Business Analytics
Stage 1: Process Design
• Measurement systems analysis
• Hypothesis testing
• Regression / ANOVA
• Process capability
Stage 2: Process Qualification
• Control charts
• Capability analysis
• Tolerance Intervals
Stage 3: Continued Process Validation
• Measurement systems analysis
• Acceptance sampling
• Control charts
For Process Validation
minitab.com/products/minitab9 10
Powerful statistical software everyone can use
Download your 30-day free trial today!
Minitab®
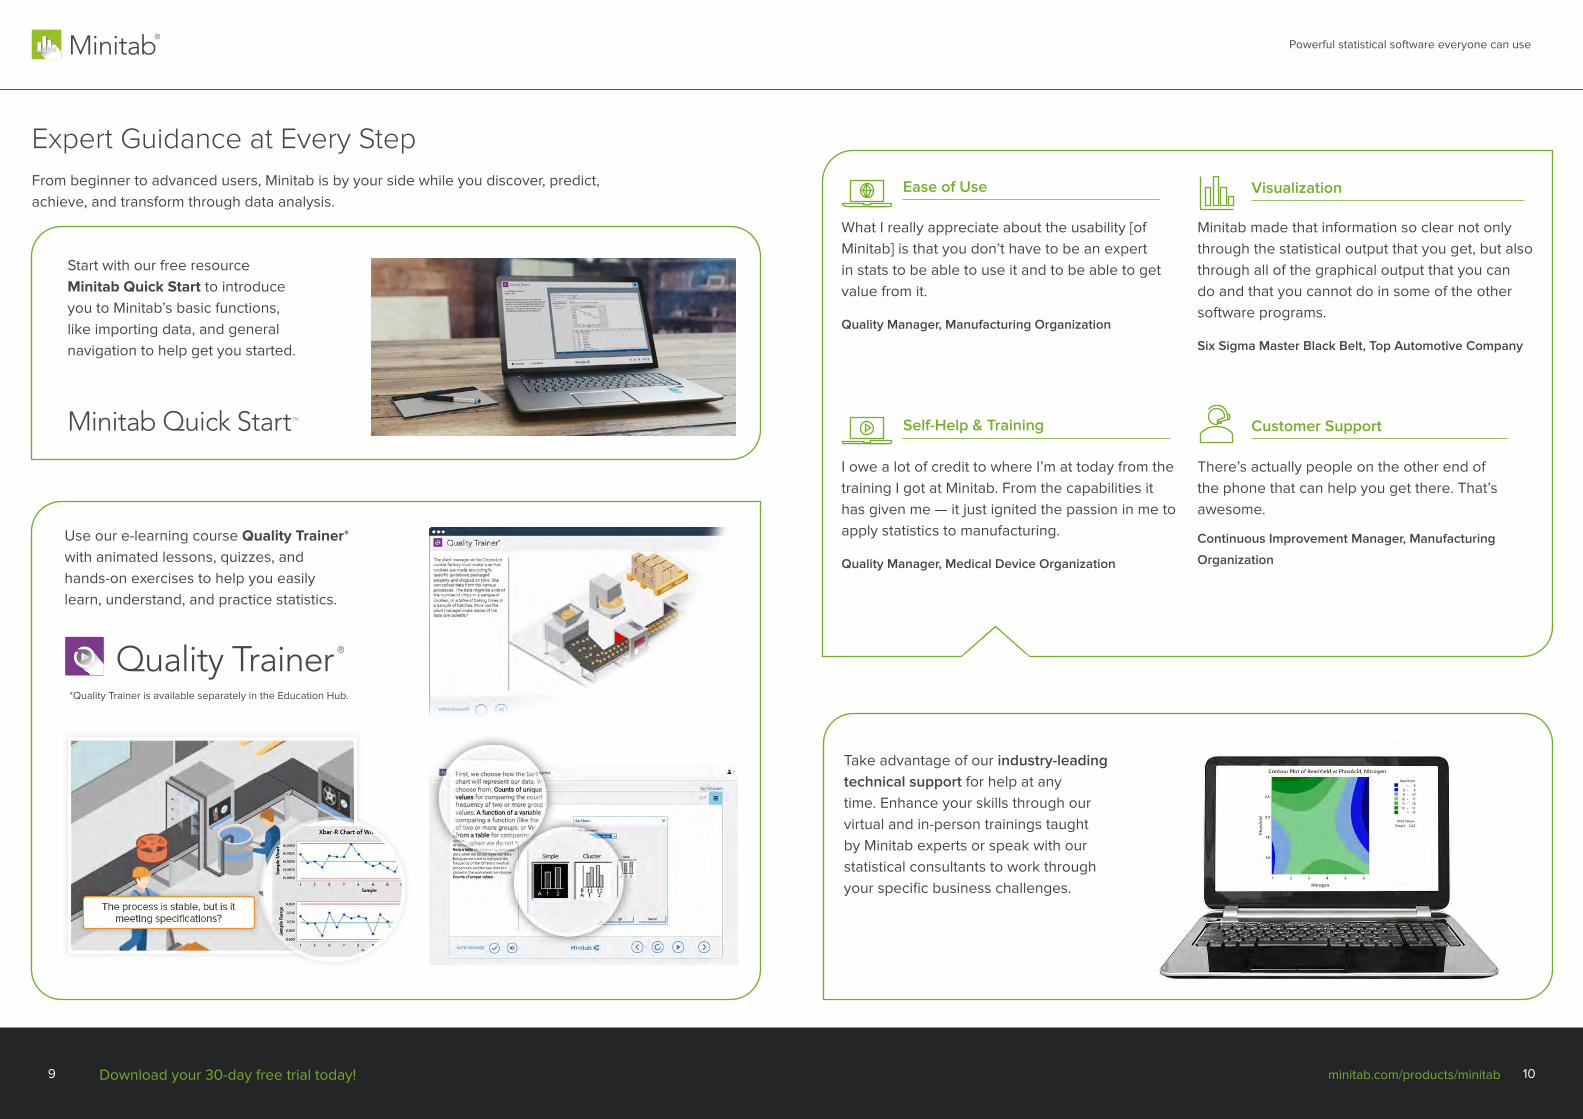
Expert Guidance at Every Step
From beginner to advanced users, Minitab is by your side while you discover, predict,
achieve, and transform through data analysis.
Use our e-learning course Quality Trainer* with animated lessons, quizzes, and
hands-on exercises to help you easily
learn, understand, and practice statistics.
*Quality Trainer is available separately in the Education Hub.
Start with our free resource
Minitab Quick Start to introduce
you to Minitab’s basic functions,
like importing data, and general
navigation to help get you started.
Quality Trainer
Minitab Quick StartTM
There’s actually people on the other end of
the phone that can help you get there. That’s
awesome.
Continuous Improvement Manager, Manufacturing
Organization
I owe a lot of credit to where I’m at today from the
training I got at Minitab. From the capabilities it
has given me — it just ignited the passion in me to
apply statistics to manufacturing.
Quality Manager, Medical Device Organization
What I really appreciate about the usability [of
Minitab] is that you don’t have to be an expert
in stats to be able to use it and to be able to get
value from it.
Quality Manager, Manufacturing Organization
Minitab made that information so clear not only
through the statistical output that you get, but also
through all of the graphical output that you can
do and that you cannot do in some of the other
software programs.
Six Sigma Master Black Belt, Top Automotive Company
Take advantage of our industry-leading technical support for help at any
time. Enhance your skills through our
virtual and in-person trainings taught
by Minitab experts or speak with our
statistical consultants to work through
your specific business challenges.
Ease of Use Visualization
Self-Help & Training Customer Support
Minitab® and the Minitab® logo are registered trademarks of Minitab, LLC in the United States and other countries.
See minitab.com/legal/trademarks for more information.
©2019, Minitab, LLC. All Rights Reserved.
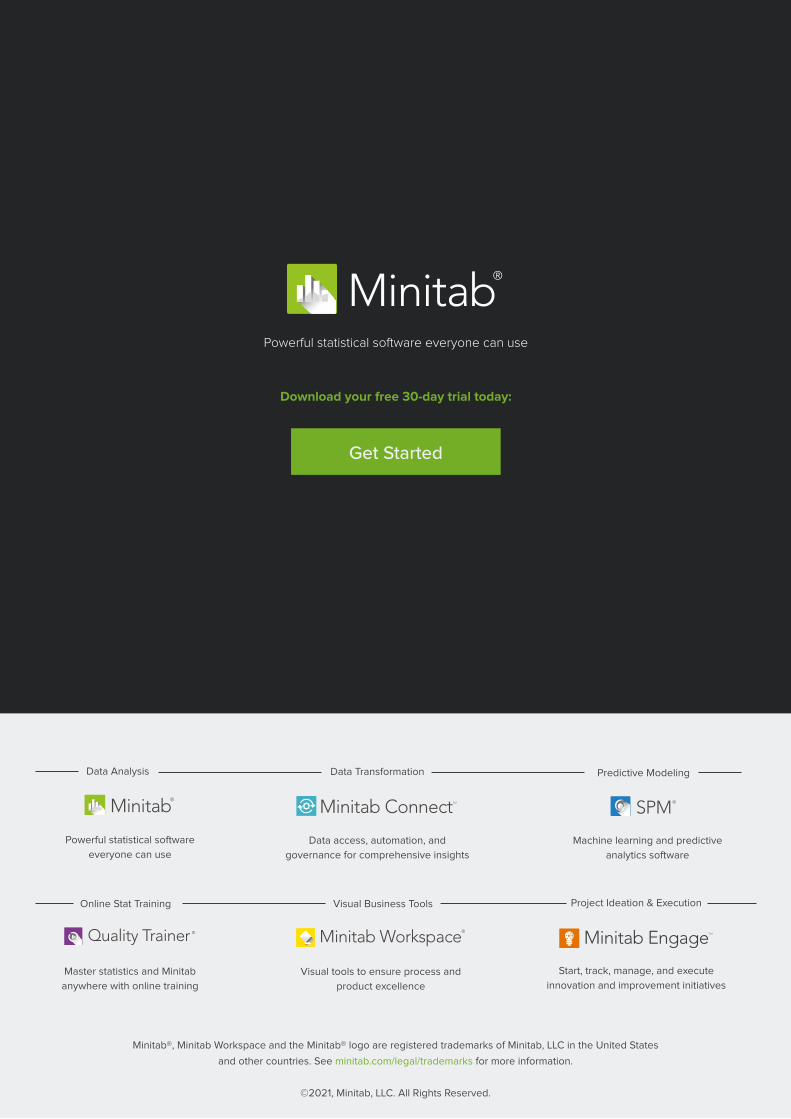
Minitab®
Powerful statistical software everyone can use
Download your free 30-day trial today:
Minitab®, Minitab Workspace and the Minitab® logo are registered trademarks of Minitab, LLC in the United States
and other countries. See minitab.com/legal/trademarks for more information.
©2021, Minitab, LLC. All Rights Reserved.
Powerful statistical software
everyone can use
Machine learning and predictive
analytics software
Start, track, manage, and execute
innovation and improvement initiatives
Master statistics and Minitab
anywhere with online training
Data Analysis Predictive Modeling
Project Ideation & ExecutionOnline Stat Training
Data access, automation, and
governance for comprehensive insights
Data Transformation
Quality Trainer
Minitab®
SPM
Visual tools to ensure process and
product excellence
Visual Business Tools
Minitab Workspace®
Minitab ConnectTM
Minitab EngageTM
Get Started