Embed Size (px)
Citation preview

Volume 33 http://acousticalsociety.org/
175th Meeting of the Acoustical Society of AmericaMinneapolis, Minnesota
7-11 May 2018
Architectural Acoustics: Paper 4aAAb3
New research on low-frequency membrane absorbersJohn CalderMarketing, Acoustical Surfaces, Inc., Chaska, MN, 55318; [email protected]
Low-frequency (LF) room modes are one of the greatest issues for accurate sound recording and reproduc-tion. Effective LF absorbers can mitigate modes in professional and consumer audio rooms. However, fiber-and foam-based absorbers act on sound velocity; membrane absorbers act on sound pressure (greatest athard surfaces and corners). Velocity at hard surfaces is zero; thus, fiber and foam absorbers work far lesseffectively than membrane absorbers under 200Hz. Additionally, most independent testing laboratories areonly large enough to accurately measure absorption results above 160Hz (per Schroeder frequency) but notbelow. Only one lab is large enough to be accurate down to 40Hz. A new LF membrane-based absorberproduct was designed to compliment the frequency range of an existing product. Both were separatelytested for LF absorption down to 40Hz at the above-referenced lab. Ten LF absorber tests revealed that thetype of absorber, and its location and orientation in a room, are critical to LF absorber effectiveness. Someunexpected results, however, showed clearly that without standardized laboratory absorption testing in alab capable of accurately testing down to 40Hz, it is not possible to state conclusively that low-frequencyabsorber products perform as claimed.
Published by the Acoustical Society of America
© 2018 Acoustical Society of America. https://doi.org/10.1121/2.0000816 Proceedings of Meetings on Acoustics, Vol. 33, 015001 (2018)
Page 1

Introduction: In 2011 Acoustic Geometry, a brand of Acoustical Surfaces, Inc., created the Curve Diffusor, a cylindrical phase-coherent diffusor with a built-in Mass-Loaded Vinyl (MLV) membrane low-frequency (LF) absorber. In August 2015, the improved Version 2 Curve was tested for low-frequency absorption effectiveness at NWAA Labs, and in 2017 the CornerSorber MLV membrane LF absorber was also tested at NWAA Labs. This paper is an overview of the results of those tests.
The Room Problem: Room modes are one of the greatest problems in accurate sound recording and reproduction. First-order (axial) modes result from sound resonances in rooms at frequencies with wavelengths matching the room’s dimensions (length, width, and height). Modes at resonant frequencies, also called standing waves or eigentones, consist of nodes (causing energy cancellations) and anti-nodes (causing energy additions), with all modes present in trihedral corners. At frequency wavelengths longer than room dimensions (Schroeder Frequency), the room will “cross-over” and sound becomes pressure instead of velocity; unmitigated reverberation below crossover also creates recording and reproduction problems.
The Product Problem: Low-frequency absorbers (also called “bass absorbers” or “bass traps”) can be used to mitigate the destructive effects of modes in professional and consumer audio rooms. Fiber and foam absorbers act only on sound velocity, whereas membrane absorbers act on sound pressure. Velocity in air, 1130 feet-per-second, is zero at hard reflective surfaces (boundaries); pressure is maximum at hard reflective surfaces. For this reason, fiber- and foam-based absorbers do not work well at boundaries or below the room crossover, and membrane absorbers do work well at boundaries and below the room crossover, usually between 160Hz and 200Hz in small rooms.
The Testing Problem: Nearly all independent acoustical testing laboratories have reverber-ant chambers of under 300 cubic meters in volume, which is increasingly inaccurate below the Schroeder Frequency. This is a serious problem when attempting to test LF absorber products designed to work below approximately 160Hz. Currently, there is only one commercial test lab large enough, with a volume of 738 cubic meters, to be accurate for measuring absorption down to 40Hz with better than 95% precision and bias (variation): NWAA Labs, in Elma, WA.
Figure 1: Curve Diffusor LF membrane test array at NWAA Labs, August 2015, with author
A note about NWAA Labs: Until this unique facility opened in 2010 (in a never-activated nuclear reactor plant), no one had access to an essential tool for accurately testing LF absorber performance. No in-situ or imped-ance-tube testing, or ‘extrapola-tion’, can take the place of a very large accurate testing laboratory. We are grateful it exists.
Testing for absorption at NWAA Labs requires a minimum total surface area of 120 square feet (ft²) for units under test, based on the size of NWAA Labs main reverberation chamber. The Curve LF test array is shown in Figures 1, 2, & 3.
J. Calder New research on low-frequency membrane absorbers
Proceedings of Meetings on Acoustics, Vol. 33, 015001 (2018) Page 2

Product Design Goals: Based on what we learned from testing the Curve Diffusor’s low-frequency absorption, we wanted to design a new membrane-based LF absorber product (later named the CornerSorber) to work at different frequency ranges in order to compliment the capabilities of the Curve Diffusor’s back-side MLV membrane absorber (see Figure 15).
We also wanted to create a more effective low-frequency absorber than other LF absorber products by using membranes in close-corner placements to maximize mitigation of room mode energy and below-Schroeder-frequency reverberation.
Product Test Methods & Results: Our initial goal was to use different membrane densities to offer different frequency ranges for the same enclosure, making them easily interchangeable in manufacturing. To test the effects of different membrane densities, we built 18 wood enclosures with slide-in frame retainers (see insert, Figure 10) to hold 18 aluminum frames per density with three different sets of MLV membrane densities:¼#, ½#, and 1# / ft² (lbs. per sq. ft.). Figure 4 shows 12 of the 18 test units assembled into two of the three test arrays in NWAA Labs main chamber. The total membrane surface area of all test units was 126 ft² (7 ft² per enclosure); the area greater than 120 ft² was accounted for in calculations. A single 6-foot high test array with the units set in horizontal configuration is shown in Figures 5, 6, & 7.
Figure 4: CornerSorber test arrays, 6 units in each of 3 corners,2 corners shown, NWAA Labs September 2017
Figure 5: CornerSorber test array membrane view
Figure 3: Curve Diffusor array side viewFigure 2: Curve Diffusor array assembly
J. Calder New research on low-frequency membrane absorbers
Proceedings of Meetings on Acoustics, Vol. 33, 015001 (2018) Page 3
1) Absorber membrane density changes: Figure 8, below, shows that absorption ranges and center frequencies, as well as absorber effectiveness, did not change significantly between ¼# (orange line) and ½# /ft² (yellow line) membrane densities on the same enclosures in the same locations. The 1# (blue line) density membranes showed a different absorption profile, but it was not consistent with our design assumptions.
Figure 8: three membrane densities corner-positioned at 3” from each wall surface: ¼#, ½#, and 1# /ft²Note: horizontal scale is 40Hz to 500Hz; vertical scale is 0 to 160 Sabins.
There were three design questions: 1) Does changing the density of the membrane change the absorption characteristics? 2) Is close-corner membrane placement more effective than elsewhere in the room? 2b - or with enclosures reversed?3) Does the distance from the corner wall surfaces affect membrane effectiveness?When the test results were examined, one outcome was different from our predictions, based on various resonance theories and subsequent logical assumptions, and others were validated.
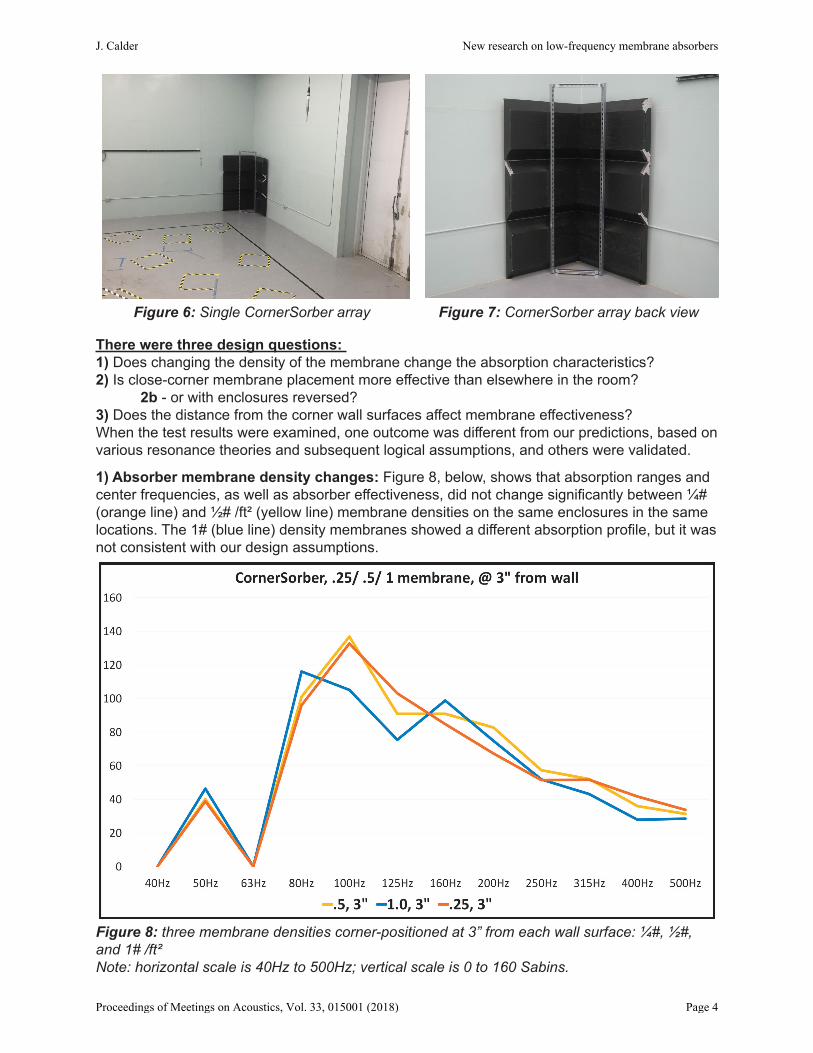
Figure 6: Single CornerSorber array Figure 7: CornerSorber array back view
J. Calder New research on low-frequency membrane absorbers
Proceedings of Meetings on Acoustics, Vol. 33, 015001 (2018) Page 4

2) Absorber membrane placement in the “Pressure Zone”: Sound velocity is 1130 fps in ‘free-air’, and velocity is zero at solid boundary surfaces. We thought that membranes placed parallel with, facing, and close to corner wall surfaces should be more effective for absorbing low-frequency modes than at other room placements and orientations, or other product types.
The test results show that to be true - Figure 9, below, shows testing results for enclosures grouped in arrays with a mix of ¼# and ½# density membranes (50% each) at two different locations: parallel with, facing, and at 3” from the corner wall surfaces (orange line); the arrays were then moved away from any wall surface at a distance of least 1 meter (purple line). The absorption peak for enclosures located at least 1 meter from wall surfaces (labelled “@ center...”, purple line) is 160Hz at 121.6 Sabins; the absorption peak for enclosures located at 3” from each corner wall surface (labelled “@ 3”, orange line) is 100Hz at 136.4 Sabins.
Placing low-frequency absorber membranes parallel with, facing, and close to corner wall surfaces (the “pressure zone”), does yield greater absorption effectiveness, and more importantly, at a lower frequency.
Figure 9: CornerSorbers with a mix of ¼# and ½# /ft² density membranes (50% each) at 3” distance from corner wall surfaces, and more than 1 meter from any wall surface.Note: horizontal scale is 40Hz to 500Hz; vertical scale is 0 to 160 Sabins.
Therefore, our goal of manufacturing a single absorber enclosure and changing only the density of the membranes in order to achieve different LF absorption frequency ranges was not met.
It also appears that attaining a wider range of absorbed frequencies was not possible with this design, and may not be possible with any LF absorber, due to the large increase in wavelengths as frequencies decrease. An approximately one-octave effective bandwidth seemed about the limit for these designs.
J. Calder New research on low-frequency membrane absorbers
Proceedings of Meetings on Acoustics, Vol. 33, 015001 (2018) Page 5

2b) Absorber membrane positions reversed: When the enclosures were reversed, that is, with the backs of the enclosures placed against the walls and the membranes facing into the test chamber, the results, shown below in Figure 11, were approximately 2/3 octave higher in range and center frequency (blue line) and less effective, similar to the 1-meter distance results (see Figure 9, purple line), than when parallel with, facing, and close to the walls (orange line).
Figure 11: CornerSorbers with ½# /ft² density at 3” from corner wall surfaces, and with membranes facing into test room with enclosure backs against wall surfaces. Note: horizontal scale is 40Hz to 500Hz; vertical scale is 0 to 160 Sabins.
The CornerSorber test enclosures utilized aluminum slide-in frame retainers, shown in the insert close-up (with arrow) in Figure 10, to hold the membrane frames in order to easily and quickly change MLV membrane densities.
Figure 10 also shows this test array at a 3” distance from the corner wall surfaces. These enclosures have no membrane frames yet, as this photo was taken while the arrays were being positioned. Plastic gliders were used under the enclosures and frameworks (to which the enclosures were attached) in order to move the arrays to test different positions in the chamber.
Figure 10: CornerSorber test array side view with membrane frame retainer shown in insert
J. Calder New research on low-frequency membrane absorbers
Proceedings of Meetings on Acoustics, Vol. 33, 015001 (2018) Page 6

We did not test with the membranes oriented horizontally, as membranes are less effective when at a right angle to gravity due to membrane displacement.
While the difference was not large, the 3” membrane distance is recommend for these products because the absorption profile is more effective and smoother.
Figure 12: CornerSorbers with ¼# /ft² density at 1” and 3” distances from corner wall surfaces.Note: horizontal scale is 40Hz to 500Hz; vertical scale is 0 to 140 Sabins.
3) Absorber membrane distance from corner wall surfaces: Testing also revealed the mosteffective membrane distance from the wall for the new design. Figure 12, below, shows the result at 3” from the wall surfaces (orange line) was better than the 1” spacing (gray line), which is also the membrane distance for earlier-tested Curve Diffusors at 1” from and parallel with the wall surface (see Figure 3).
Figure 13: CornerSorbers at recommended corner placement distance (3”)
The most effective MLV density for the final product design was shown to be ¼#, which is the density used in current production units.
Also, the most effective distance from corner wall surfaces proved to be at 3”, with the membranes in parallel with the surfaces. The prototypes in Figure 13 are placed at the recommended 3” distance from the corner wall surfaces. The units may also be placed in hori-zontal orientation (see Figure 10) at the same 3” distance from wall surfaces.
J. Calder New research on low-frequency membrane absorbers
Proceedings of Meetings on Acoustics, Vol. 33, 015001 (2018) Page 7

Individual product test results: Figure 14, below, shows Curve Diffusor test results (blue line), and CornerSorber (as manufactured, ¼# / ft² MLV density) test results (orange line). The number of units for each test is shown, per NWAA Labs requirement (=/> 120 ft² surface area). CornerSorbers are 2-3 times more efficient than Curves - the ratio of approximately 3:1 is recommended for combining these products for LF absorption (see Figure 16).
Figure 14: Individual Test results for Curve Diffusors and CornerSorbersNote: horizontal scale is 40Hz to 500Hz; vertical scale is 0 to 140 Sabins.
Figure 15: Curve Diffusor and CornerSorber production units showing membrane sides
Test Report Specifications: Both low-frequency absorber products - Curve Diffusors with back-side MLV membranes and CornerSorbers with surface-facing MLV membranes, shown in Figure 15 - were tested per ASTM C423 at NWAA Labs in Elma, WA., with the world’s largest independent sound absorption test chamber (approximately 738 cubic meters in volume), which can accurately test with better than 95% precision and bias (variation) down to 40Hz. Both product tests were conducted with the test units mounted as they would be in real-use configurations, which is critical to judging and comparing test results.
J. Calder New research on low-frequency membrane absorbers
Proceedings of Meetings on Acoustics, Vol. 33, 015001 (2018) Page 8

Figure 17: Curves & CornerSorbers in typical room application
Combined products: Figure 16, below, shows the total absorption in Sabins for different Curve Diffusor and CornerSorber combinations. The Combination chart utilizes single-unit Sabin amounts as tested, multiplied by the number of units in each suggested example.
Figure 16: Combined LF absorption amounts for Curve Diffusors and CornerSorbersNote: horizontal scale is 40Hz to 500Hz; vertical scale is 0 to 50 Sabins.
Recommended placements for 8 Curve Diffusors and 4 CornerSorbers (sold in pairs) in rectangular (“shoebox”) rooms are shown in Figure 17, below. The Curves are centered at both quarter-wavelength long and wide dimension positions (except the rear Curves, centered and oriented horizontally); the CornerSorbers are placed at 3” from each front corner wall surface.
J. Calder New research on low-frequency membrane absorbers
Proceedings of Meetings on Acoustics, Vol. 33, 015001 (2018) Page 9

Acknowledgements:We wish to thank Ron Sauro (NWAA Labs) and D. Michael Shields for their invaluable help in conceptualizing and fact-checking this paper.
NWAA Labs, Inc. is located at:90 Tower Blvd.Elma, WA 98541253-973-1018
Conclusions: The type of absorber, and its location and orientation in a room, are critical to LF absorber effectiveness. This set of tests also proves the value of actual laboratory LF testing: if we had released these products based only on our design assumptions, without accurately testing them first, our claims of frequency ranges and effectiveness would have been incorrect. Without standardized testing in a laboratory capable of accurately testing down to 40Hz, we would not be able to honestly state that our LF absorber products perform as claimed. We believe this is applicable to all other low-frequency absorber products, and we advise consumers to request that manufacturers supply test results only from laboratories large enough to provide accurate LF test measurements, and - importantly - with products tested in their intended mounting and room placement configurations.
It seems clear to us, due to the current availability of a laboratory in which to accurately test LF absorbers, that much more low-frequency absorber product development and testing needs to be done by everyone involved in researching and manufacturing acoustical products intended to control low-frequencies in rooms.
References:There are no References for this paper due to the lack of prior papers on low-frequency membrane testing in laboratories large enough to be accurate with better than 95% precision and bias (variation), per Schroeder Frequency, down to 40Hz. As previously noted, until NWAA Labs was created in late 2010, there were no laboratories in which LF absorbers could be tested accurately.
J. Calder New research on low-frequency membrane absorbers
Proceedings of Meetings on Acoustics, Vol. 33, 015001 (2018) Page 10