Embed Size (px)
Citation preview
1
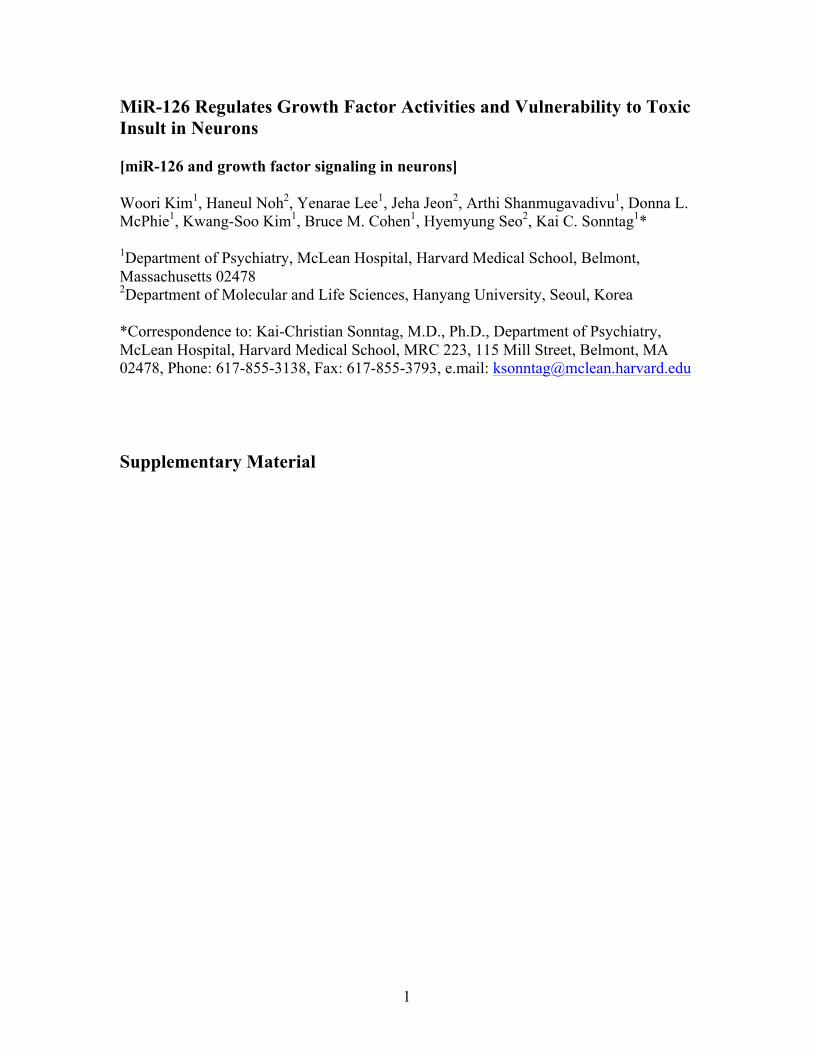
MiR-126 Regulates Growth Factor Activities and Vulnerability to Toxic Insult in Neurons [miR-126 and growth factor signaling in neurons] Woori Kim1, Haneul Noh2, Yenarae Lee1, Jeha Jeon2, Arthi Shanmugavadivu1, Donna L. McPhie1, Kwang-Soo Kim1, Bruce M. Cohen1, Hyemyung Seo2, Kai C. Sonntag1* 1Department of Psychiatry, McLean Hospital, Harvard Medical School, Belmont, Massachusetts 02478 2Department of Molecular and Life Sciences, Hanyang University, Seoul, Korea *Correspondence to: Kai-Christian Sonntag, M.D., Ph.D., Department of Psychiatry, McLean Hospital, Harvard Medical School, MRC 223, 115 Mill Street, Belmont, MA 02478, Phone: 617-855-3138, Fax: 617-855-3793, e.mail: [email protected] Supplementary Material
2
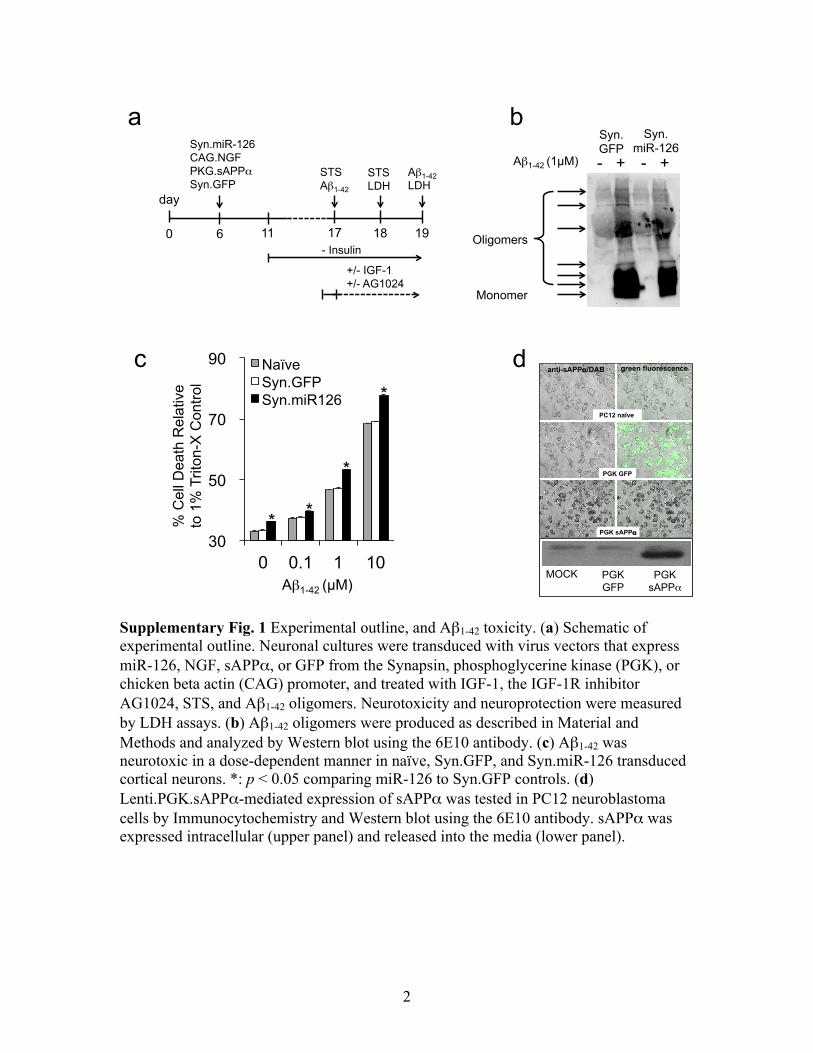
Supplementary Fig. 1 Experimental outline, and Aβ1-42 toxicity. (a) Schematic of experimental outline. Neuronal cultures were transduced with virus vectors that express miR-126, NGF, sAPPα, or GFP from the Synapsin, phosphoglycerine kinase (PGK), or chicken beta actin (CAG) promoter, and treated with IGF-1, the IGF-1R inhibitor AG1024, STS, and Aβ1-42 oligomers. Neurotoxicity and neuroprotection were measured by LDH assays. (b) Aβ1-42 oligomers were produced as described in Material and Methods and analyzed by Western blot using the 6E10 antibody. (c) Aβ1-42 was neurotoxic in a dose-dependent manner in naïve, Syn.GFP, and Syn.miR-126 transduced cortical neurons. *: p < 0.05 comparing miR-126 to Syn.GFP controls. (d) Lenti.PGK.sAPPα-mediated expression of sAPPα was tested in PC12 neuroblastoma cells by Immunocytochemistry and Western blot using the 6E10 antibody. sAPPα was expressed intracellular (upper panel) and released into the media (lower panel).
a
day
0 6 17
Syn.miR-126 CAG.NGF PKG.sAPPα"Syn.GFP
- Insulin
STS Aβ1-42"
Aβ1-42 LDH"
19
+/- IGF-1 +/- AG1024
18
STS LDH"
11 Oligomers
Monomer
Aβ1-42 (1µM)
Syn. GFP
Syn. miR-126
- + - +
b
c d
PC12 naïve
PGK GFP
anti-sAPP!/DAB
PGK sAPP!
green fluorescence
MOCK PGK GFP
PGK sAPP!
30
50
70
90
0 0.1 1 10
Naïve Syn.GFP Syn.miR126
% C
ell D
eath
Rel
ativ
e to
1%
Trit
on-X
Con
trol
Aβ1-42 (µM)
* *
*
*
3
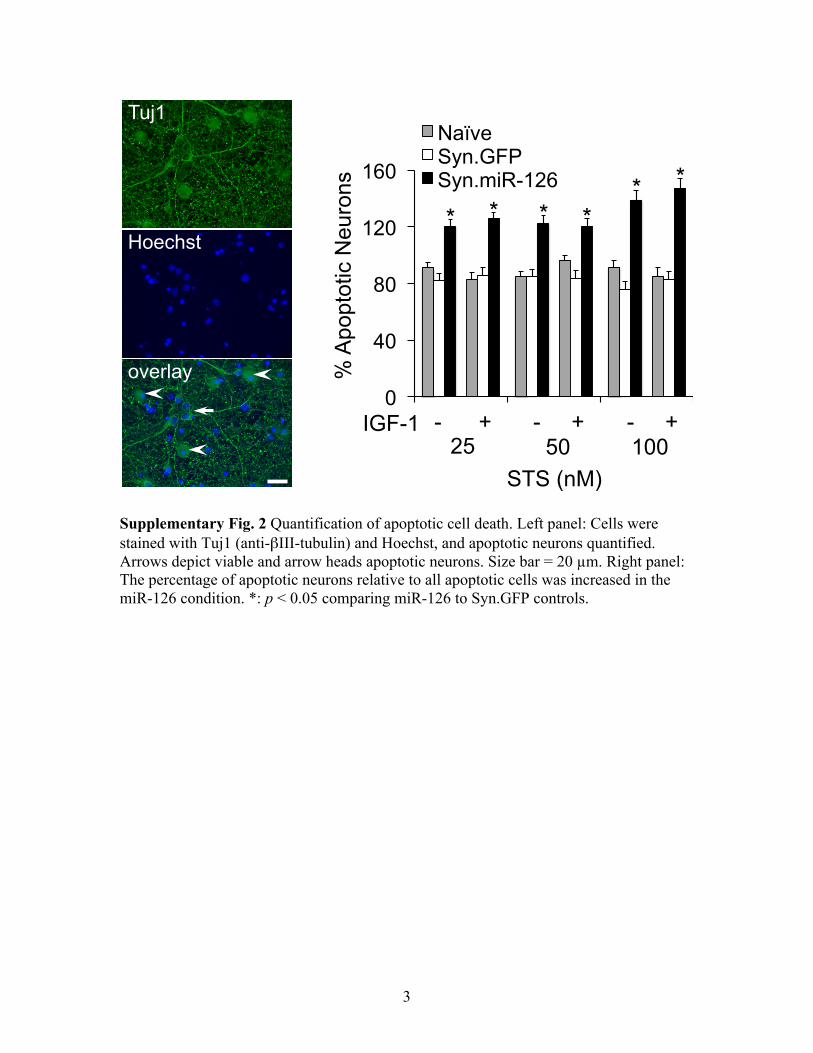
Supplementary Fig. 2 Quantification of apoptotic cell death. Left panel: Cells were stained with Tuj1 (anti-βIII-tubulin) and Hoechst, and apoptotic neurons quantified. Arrows depict viable and arrow heads apoptotic neurons. Size bar = 20 µm. Right panel: The percentage of apoptotic neurons relative to all apoptotic cells was increased in the miR-126 condition. *: p < 0.05 comparing miR-126 to Syn.GFP controls.
Tuj1
overlay
Hoechst
0
40
80
120
160
Naïve Syn.GFP Syn.miR-126
% A
popt
otic
Neu
rons
STS (nM)
- + - + - + 25 50 100
IGF-1
* * * * * *
4
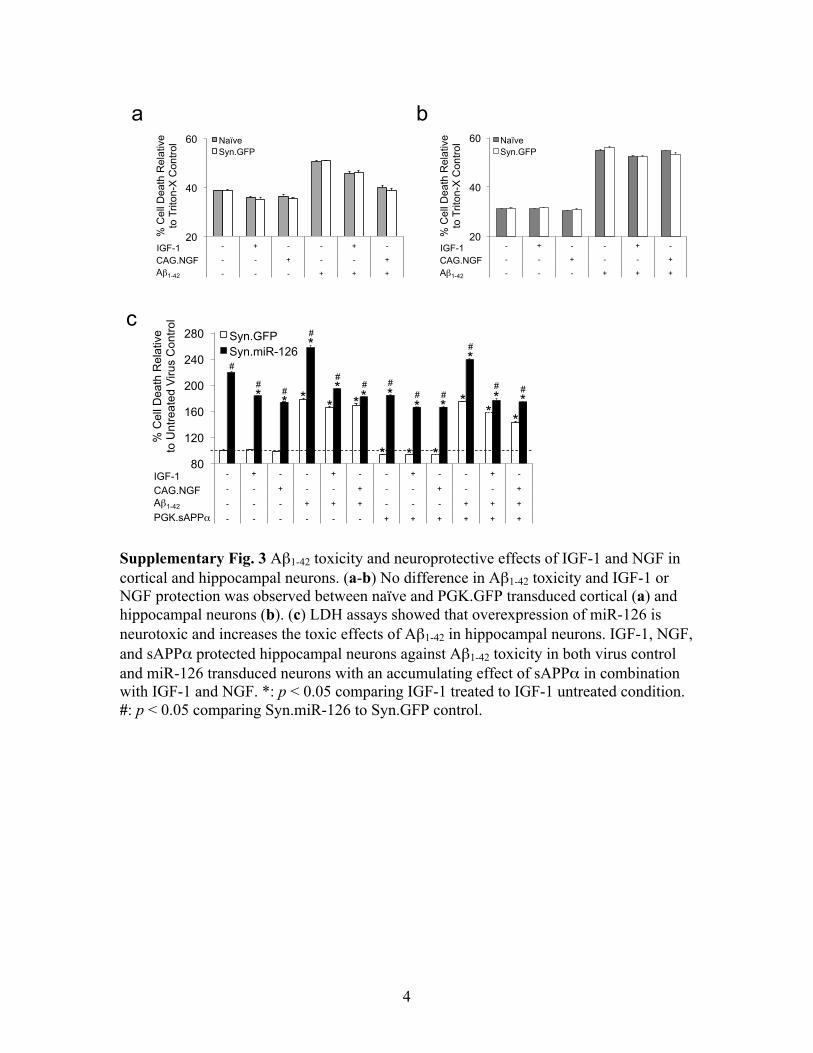
Supplementary Fig. 3 Aβ1-42 toxicity and neuroprotective effects of IGF-1 and NGF in cortical and hippocampal neurons. (a-b) No difference in Aβ1-42 toxicity and IGF-1 or NGF protection was observed between naïve and PGK.GFP transduced cortical (a) and hippocampal neurons (b). (c) LDH assays showed that overexpression of miR-126 is neurotoxic and increases the toxic effects of Aβ1-42 in hippocampal neurons. IGF-1, NGF, and sAPPα protected hippocampal neurons against Aβ1-42 toxicity in both virus control and miR-126 transduced neurons with an accumulating effect of sAPPα in combination with IGF-1 and NGF. *: p < 0.05 comparing IGF-1 treated to IGF-1 untreated condition. #: p < 0.05 comparing Syn.miR-126 to Syn.GFP control.
a b
c
80
120
160
200
240
280
- + - - + - - + - - + -
- - + - - + - - + - - +
- - - + + + - - - + + +
- - - - - - + + + + + +
Syn.GFP Syn.miR-126
PGK.sAPPα"
% C
ell D
eath
Rel
ativ
e to
Unt
reat
ed V
irus
Con
trol
CAG.NGF IGF-1
Aβ1-42
* * *
*
* * * *
* *
* * * *
*
* * *
#
# #
#
# # #
# #
#
# #
*
*
CAG.NGF IGF-1
Aβ1-42
% C
ell D
eath
Rel
ativ
e to
Trit
on-X
Con
trol
20
40
60
- + - - + -
- - + - - +
- - - + + +
Naïve Syn.GFP
CAG.NGF IGF-1
Aβ1-42
% C
ell D
eath
Rel
ativ
e to
Trit
on-X
Con
trol
20
40
60
- + - - + -
- - + - - +
- - - + + +
Naïve Syn.GFP
5
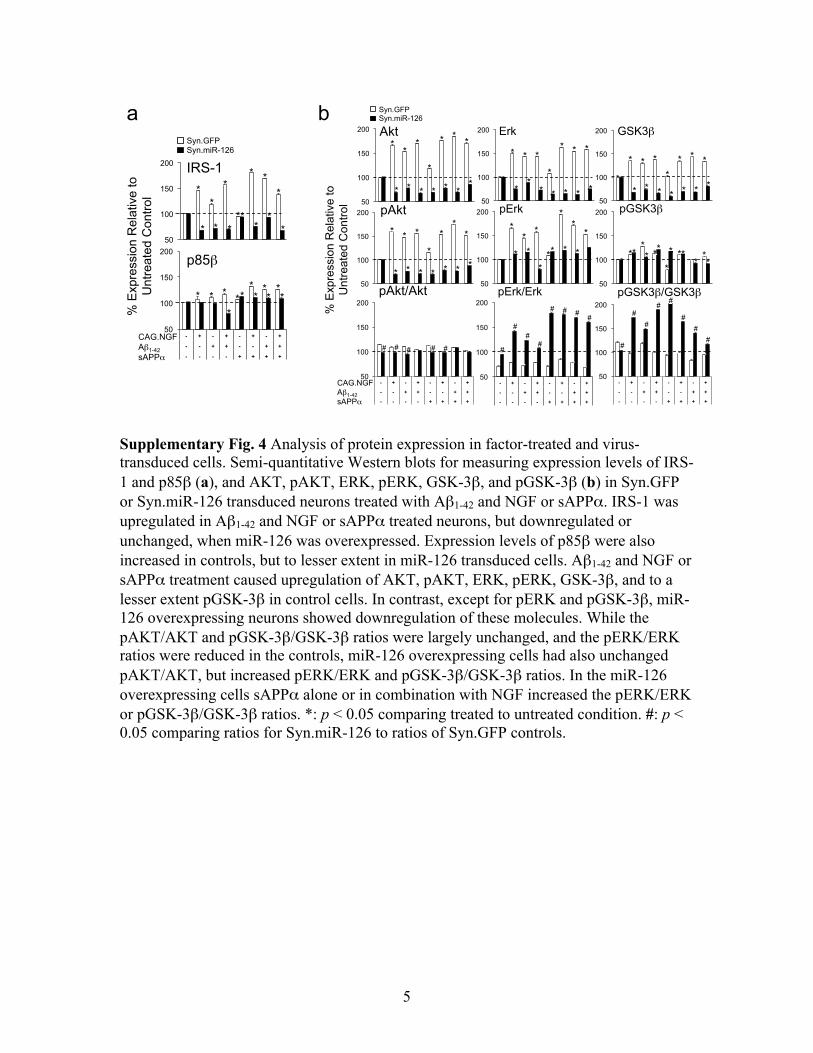
Supplementary Fig. 4 Analysis of protein expression in factor-treated and virus-transduced cells. Semi-quantitative Western blots for measuring expression levels of IRS-1 and p85β (a), and AKT, pAKT, ERK, pERK, GSK-3β, and pGSK-3β (b) in Syn.GFP or Syn.miR-126 transduced neurons treated with Aβ1-42 and NGF or sAPPα. IRS-1 was upregulated in Aβ1-42 and NGF or sAPPα treated neurons, but downregulated or unchanged, when miR-126 was overexpressed. Expression levels of p85β were also increased in controls, but to lesser extent in miR-126 transduced cells. Aβ1-42 and NGF or sAPPα treatment caused upregulation of AKT, pAKT, ERK, pERK, GSK-3β, and to a lesser extent pGSK-3β in control cells. In contrast, except for pERK and pGSK-3β, miR-126 overexpressing neurons showed downregulation of these molecules. While the pAKT/AKT and pGSK-3β/GSK-3β ratios were largely unchanged, and the pERK/ERK ratios were reduced in the controls, miR-126 overexpressing cells had also unchanged pAKT/AKT, but increased pERK/ERK and pGSK-3β/GSK-3β ratios. In the miR-126 overexpressing cells sAPPα alone or in combination with NGF increased the pERK/ERK or pGSK-3β/GSK-3β ratios. *: p < 0.05 comparing treated to untreated condition. #: p < 0.05 comparing ratios for Syn.miR-126 to ratios of Syn.GFP controls.
50
100
150
200
50
100
150
200
50
100
150
200
- + - + - + - +
- - + + - - + +
- - - - + + + +
50
100
150
200
50
100
150
200
50
100
150
200
- + - + - + - +
- - + + - - + +
- - - - + + + +
50
100
150
200
50
100
150
200
50
100
150
200
- + - + - + - +
- - + + - - + +
- - - - + + + +
CAG.NGF Aβ1-42 sAPPα#
pAkt/Akt
Akt
pAkt
Syn.GFP Syn.miR-126#
Erk
pErk
pErk/Erk
GSK3β#
pGSK3β#
pGSK3β/GSK3β#
% E
xpre
ssio
n R
elat
ive
to
Unt
reat
ed C
ontro
l
*
*
*
*
*
*
*
*
*
*
*
*
*
*
*
*
*
*
*
*
*
*
*
*
*
*
*
*
# # # # #
* * *
*
* * *
* *
* * * * *
* *
*
*
* *
*
* *
*
* * * *
#
# #
# # #
# #
* * *
* * * *
* * * * * * *
* *
* *
* *
* * * * * *
*
#
#
# #
#
#
#
#
a b
50
100
150
200
- + - + - + - +
- - + + - - + +
- - - - + + + +
50
100
150
200
CAG.NGF Aβ1-42 sAPPα#
IRS-1
p85β#
Syn.GFP Syn.miR-126#
% E
xpre
ssio
n R
elat
ive
to
Unt
reat
ed C
ontro
l * *
* * *
*
* * * * *
*
* * * * * *
* *
* *
* * * *