Embed Size (px)
Citation preview

MIR-17-92 CLUSTER REGULATION IN DIFFERENTIATED T-CELLS
by
Gary Kohanbash
BS, University of Pittsburgh, 2007
Submitted to the Graduate Faculty of
Graduate School of Public Health in partial fulfillment
of the requirements for the degree of
Master of Science
University of Pittsburgh
2009

ii
UNIVERSITY OF PITTSBURGH
GRADUATE SCHOOL OF PUBLIC HEALTH
This thesis was presented
by
Gary Kohanbash
It was defended on
July 29, 2009
and approved by
Hideho Okada M.D., Ph.D., Associate Professor Neurological Surgery and Surgery, School of Medicine,
University of Pittsburgh
Todd Reinhart, ScD, Professor, Assistant Chairman and Director of Graduate Programs Infectious Diseases and Microbiology, Graduate School of Public Health,
University of Pittsburgh
Jeremy Martinson, DPhil, Assistant Professor Infectious Diseases and Microbiology, Graduate School of Public Health,
University of Pittsburgh

iii
Copyright © by Gary Kohanbash
2009

iv
Data from our group and others have demonstrated that tumor-derived factors directly
skew T-cell differentiation from an effective tumor fighting Th1 state to a less effective Th2
state, allowing for tumor growth. Why the Th1 response is more effective is largely still
unknown. The recently discovered microRNAs (miRNAs) are a large family of small regulatory
RNAs that control diverse aspects of cell functions such as cell proliferation, apoptosis,
development, differentiation and immune regulation. We thereby sought to examine miRNAs
differentially expressed in Th1 and Th2 cells in an effort to better understand the enhanced
ability of Th1 cells in tumor immunity. MicroRNA microarray analyses revealed that the miR-
17-92 cluster of microRNAs (miR-17-92) is consistently over-expressed in murine Th1 cells
compared to Th2 cells. Quantitative RT-PCR confirmed that the miR-17-92 cluster expression
was consistently higher in Th1 cells than Th2 cells. Furthermore, disruption of IL-4 signaling
through either IL-4 neutralizing antibody or knockout of STAT6 reversed the miR-17-92 cluster
suppression in Th2 cells. MiR-17-92 expression correlated with differential proliferation
capacity as Th1 cells proliferated at higher levels than Th2 cells, dependent on IL-4 and STAT6.
Th1 cells consistently expressed lower levels of anti-proliferative transcription factors E2F1 and
E2F2, which are the known targets of miR-17-92. Collectively, our data suggests that the Th2
skewing tumor microenvironment can induce the down-regulation of miR-17-92 expression in
CD4+T cells, thereby diminishing the effective proliferation of tumor-specific T cells and tumor
Hideho Okada M.D., Ph.D.
MIR-17-92 CLUSTER REGULATION IN DIFFERENTIATED T-CELLS
Gary Kohanbash, M.S.
University of Pittsburgh, 2009

v
destruction. This has significant public health relevance as we propose that therapy targeting
miR-17-92 cluster may provide enhanced T-cell function and prevent tumor growth.

vi
TABLE OF CONTENTS
ACKNOWLEGEMENTS ........................................................................................................ XII
1.0 INTRODUCTION ........................................................................................................ 1
1.1 GLIOBLASTOMA MULTIFORME ................................................................. 1
1.2 MICRORNA ........................................................................................................ 2
1.2.1 MicroRNA Biology........................................................................................ 2
1.2.2 MiRNA Processing and Function ................................................................ 3
1.2.3 MiR-17-92 Cluster of MiRNAs .................................................................... 3
1.3 T-CELL FUNCTION IN CANCER ................................................................... 5
1.3.1 Relevance of Th1 and Th2 Cell Response in Cancer ................................. 5
1.3.2 Immunotherapeutic Approaches to GBMs ................................................ 6
2.0 THESIS AIMS .............................................................................................................. 7
2.1 SPECIFIC AIMS ................................................................................................. 8
3.0 MATERIALS AND METHODS ................................................................................ 9
3.1 REAGENTS ......................................................................................................... 9
3.2 TH1 AND TH2 CELL CULTURE ................................................................... 10
3.3 MIRNA MICROARRAY .................................................................................. 11
3.4 QUANTITATIVE RT-PCR .............................................................................. 11
3.5 PROLIFERATION ASSAYS ........................................................................... 12

vii
4.0 AIM 1 RESULTS ....................................................................................................... 13
4.1 IN VITRO DIFFERENTIATION OF TH1 AND TH2 CELLS .................... 13
4.2 MICRORNA MICROARRAY OF TH1 AND TH2 CELLS ......................... 14
4.3 QUANTITATIVE RT-PCR OF MATURE MIRNA ISOLATED FROM
TH1 AND TH2 CELLS .............................................................................................................. 17
4.4 EXPRESSION OF MIR-17-92 PARALOG CLUSTERS .............................. 18
4.5 PROLIFERATION OF TH1 AND TH2 CELLS IN CULTURE .................. 20
4.5.1 CFSE Staining of Th1 and Th2 Cells ........................................................ 20
4.5.2 WST-1 Proliferation Assay of Th1 and Th2 Cells ................................... 21
4.6 EXPRESSION OF E2F’S IN TH1 AND TH2 ................................................. 22
5.0 AIM 1 CONCLUSION .............................................................................................. 24
6.0 AIM 2 RESULTS ....................................................................................................... 25
6.1 BLOCKING IL-4 REGULATED THE EXPRESSION OF MIR-17-92
CLUSTER………………………………………………………………………………………25
6.2 MIR-17-92 EXPRESSION IN STAT6 DEFICIENT T-CELLS .................... 26
6.3 DOSE RESPONSE OF CD4+ T-CELLS TO IL-4 ......................................... 28
6.4 NEUTRALIZATION OF IL-4 ENHANCES CD4+ T-CELL
PROLIFERATION ..................................................................................................................... 29
6.5 STAT6 DEFICIENT CD4+ T-CELLS ENHANCE TH2
PROLIFERATION……………………………………………………………………………..30
7.0 AIM 2 CONCLUSION .............................................................................................. 32
8.0 DISCUSSION ............................................................................................................. 33
9.0 FUTURE DIRECTIONS ........................................................................................... 37

viii
9.1 MURINE STUDIES ........................................................................................... 37
9.1.1 Mir-17-92 Expression from Tumor Bearing Mice ................................... 37
9.1.2 Overexpression of MiR-17-92 in CD4+ T-cells ........................................ 37
9.1.3 Adoptive Therapy of MiR-17-92 Overexpressing T-cells ........................ 38
9.2 HUMAN STUDIES ............................................................................................ 39
9.2.1 Mir17-92 Expression in Human Th1 vs. th2 ............................................ 39
9.2.2 MiR-17-92 Expression in GBM patient CD4+ T-cells ............................. 40
9.2.3 Overexpression of MiR-17-92 in Human CD4+ T-cells .......................... 40
9.3 OTHER FUTURE PLANS ............................................................................... 41
BIBLIOGRAPHY........................................................................................................................57
ix
LIST OF TABLES
Table 1: MiRNA overexpression in Th1/Th2 cells. ...................................................................... 16
x
LIST OF FIGURES
Figure 1: Flow cytometry analysis of Th1 and Th2 differentiated T-cells. .................................. 14
Figure 2: MiRNA microArray Chip. ............................................................................................ 15
Figure 3: Hierarchal clustering of Th1 vs. Th2 differentially expressed miRNAs……..……….. 16
Figure 4: Quantitative RT-PCR of all miRNA from the miR-17-92 cluster. ............................ 17
Figure 5: Quantitative RT-PCR of miR-106a and miR-106b expression in Th1 and Th2 cultured
cells. .............................................................................................................................................. 19
Figure 6: Proliferative ability of Th1 vs. Th2 cells examined through CFSE assay. ................... 20
Figure 7: WST-1 Assay of Th1 and Th2 cultured cells. ............................................................... 21
Figure 8: Western blot Analysis of E2F1 and E2F2 from Th1 and Th2 protein lysates. ............. 22
Figure 9: MiR-17-5p and miR-92 expression on neutral CD4+ T-cells after addition of IL-4
neutralizing antibody .................................................................................................................... 26
Figure 10: Down-regulation of miR-17-5 and miR-92 in Th2 cultured cells is STAT6-dependent.
....................................................................................................................................................... 27
Figure 11: Dose response of miR-17-5p to IL-4 treatment. .......................................................... 28
Figure 12: Proliferation of CD4+ cells in the presence of IL-4 neutralizing antibody examined
through a CFSE assay. .................................................................................................................. 29

xi
Figure 13: STAT6 deficient Th2 cells have enhanced proliferation that is not enhanced by
neutralization of IL-4. ................................................................................................................... 30
Figure 14: Model of miR-17-92 signaling pathway. Based on our current data we propose that
IL-4 from Th2 skewing conditions such as the tumor environment downregulates miR-17-92
through the STAT6 pathway. ........................................................................................................ 34

xii
ACKNOWLEGEMENTS
Words cannot begin to express my gratitude to my mentor and thesis advisor Dr. Hideho Okada.
Your research is truly phenomenal and it is such a pleasure working in your lab. It is amazing to
see how dedicated you are to making a difference for those with brain tumors and to see vaccines
and vaccine strategies developed in your lab being tested in patients; there could be no greater
motivation for me than having the ability to help these patients as well. I want to thank you
greatly for your mentorship. I truly feel that you established my project specifically around my
interests. Your willingness and drive to try new things really kept my research fun and exciting.
Even when my experiments totally failed time and time again you never lost patience and your
positive supportive attitude provided constant enthusiasm for me to keep trying. Thank you for
the countless hours of your time reviewing my data, designing new experiments, establishing
collaborators and continuous tips on growing as a scientist. Beyond the science and mentorship, I
also want to say thank you for always being there and caring about my personal growth and well
being. After my accident countless times you visited me at the hospital and at home. At our
weekly meetings when you always started by asking me how I was doing, it made a tremendous
impact knowing how much you cared. Thank you again Dr. Okada for all the opportunity,
mentorship, support, time and compassion that you have given me.
I must also give credit and thanks to many awesome members of the Okada lab who
always were there to teach me, help me complete projects when I needed to run to class, or just

xiii
be a friend. Specifically, thank you Dr. Kotaro Sasaki, without you my project would have never
worked nearly as well as it did. Thank you for being extremely instrumental in designing the
experiments. Thank you for your constant help teaching me the art of primary T-cell culture.
Additionally, thank you for your very precious time offering me lots of help while completing
your medical residency program.
Dr. Mitsugu Fujita, you are really incredible. You are one of the most well rounded
individuals I have ever met. Your kindness really shows in the incredible amount of time you
helped me and everyone else in the lab. I know whenever I have a challenging question I can
come to you. Thank you for all your help learning how to properly take care of mice, help
learning various methods for setting up brain tumor models and all the many other things that
you have taught me.
Dr. Ryo Ueda, thank you for all your help whenever I had a question. Just by watching
and working with you I was able to see how a well organized experiment should be conducted. I
still reference figures from your papers for ideas on making my own figures. I hope you are
enjoying married life in Japan; hopefully I will have a chance to work with you again in the
future.
Dr. Xinmei Zhu, thank you for all your help whenever I needed it. Thank for your
support when experiments didn’t go well and for motivating me until they did. Thank you also
for the many times you reviewed my math in preparation of my experiments, and thank you even
more for the times when you corrected them.
Heather McDonald, my life would not ever have been the same if I had not met you.
Thank you for always helping me with my experiments when I was busy especially during my
times in the hospital. Thank you for giving me tons of advice on everything, I needed it. Thank

xiv
you for all the times you proof read my papers late at night before submission. You have been a
tremendous asset and friend to me and my experiments and I will never forget all that you have
done for me.
Hisashi Kato, thank you for all you have taught me for teaching me how to do flow
cytometry. Thank you for helping me so many times making sure I had proper controls, doing
compensation, analyzing my data, and just all being there to help troubleshoot. I am so fortunate
to have had such a good colleague like you. I will also never forget the times we had driving
back from happy hours!
Aki Hoji, thank you for always telling me to look things up whenever I asked you a
question. Thank you for always reminding me that science experiments don’t always work. I
have always been impressed by how much you know; you are a true role model of mine.
To all the students that have been in our lab Sandra, Mina, Louis, Stephanie, Natalie,
Kayla and Ted, thank you for all you have taught me and for all the times you guys helped me.
You guys all helped me more than you know. I really hope I see you all around in the future.
Mom and Dad, David, Mickey, Leah, Daniel, Binyamin and Yosef thank you for always
being by my side. When I was busy with school you guys always were there to help out. You
guys always gave me advice on life and you guys were always there to find my missing stuff, it
meant so much just to know you were there. You guys all mean the world to me and I love you
all so much, thank you.
To all my grandparents, especially Bubby Safrin, thank you for always asking about my
work, always listening, and always wanting the best for me. Thank you.

xv
Lionel Levine, thank you for being the best friend I could ever imagine. You are to me
like a brother. Thank you for your constant favors and helping me out whenever I was in a jam.
Thank you for being by my side through all my ups and downs.
To each of my fellow IDM students, thank you for being my friend. It was always fun
going to class knowing I would see you. I look forward to seeing you guys as we continue to
become the generation that will find cures for the many devastating diseases.
I never could have imagined learning so much in just two years. Starting my MS I figured
it was just going to be another two years of undergrad. I was wrong! I have learned so much I
can hardly believe it. I feel like I have grown tremendously and for that I need to thank the entire
IDM faculty for their devotion and time vested into my growth. I would like to specially thank
Dr. Reinhart and Dr. Martinson thank you for not only being on my committee but for being
there as people for me to look up to as both scientists and people.
Finally, I would like to thank my fiancé Moussia you mean the world to me. Thank you
for listening to me explain my projects so many times; and thank you for making me explain it
until you understood it yourself, it always helped me put together my ideas and come up with
new ones. You have always been very supportive of me even when I doubted myself. I love you,
Thanks!

1
1.0 INTRODUCTION
1.1 GLIOBLASTOMA MULTIFORME
Glioblastoma Multiforme (GBM) is the most common and one of the most malignant forms of
brain tumors. The primary factors that cause GMBs are still mostly unknown. However these
factors lead to epidermal growth factor receptor (EGFR) and phosphatase and tensin homolog
(PTEN) mutations with P53 deletions in many cases. Furthermore GBMs are characterized by
necrosis, microvascular proliferation and glial cell mitosis 1.
As reviewed by Ohgaki 2, GBM occurrence seems most prevalent in industrialized
countries with Caucasians having greater incidence than both African and Asian populations.
Limited data is available on causes of GBM however many occupational exposures have been
shown to be associated with GMB such as plastics, formaldehyde and lead. Other factors such as
smoking and electromagnetic field have shown no association with GMB (in most studies).
According to Ohgaki the only factor “unequivocally associate” with GBM is X-irradiation, a
therapy used to treat acute lymphoblastic leukemia.
With over 12,000 new cases diagnosed in the United States each year and a median
survival time of less than 15 months GBM tumors represent a significant public health problem.
One of the most common forms of GMB is the astrocytoma. Of the astrocytomas the World

2
Health Organization-designated stages of malignancy from I-IV, GBMs represent the highest
grade IV tumors 3.
Current treatments for GBM include: chemotherapy, radiotherapy, and surgical resection
4. However, even the most effective treatments over the past 25 years have at best added 3
months to the 15-month median survival time. There are many challenges in effectively treating
GBMs. GBM’s malignant nature tumor cells spread to areas throughout the brain and tumor
recurrence after resection is typically unavoidable. Additionally, the microvasculature around the
brain and the blood brain barrier restricts the passage of many drugs into the brain 3. For these
reason, together with the findings that immune cells do enter the brain, much work has been
devoted to immunotherapy, and enhancing the natural response to control the tumor.
1.2 MICRORNA
1.2.1 MicroRNA Biology
MicroRNAs (miRNAs) are endogenous small single-stranded RNA molecules which are 18-24
nucleotides in length 5. MiRNAs are highly conserved between species and have been identified
in plants, animals and viruses 6, 7. These small RNA are located in various parts of the genome,
usually in segments not associated with known genes. Mature miRNA molecules have the ability
to repress translation and therefore serve an important role in regulating post transcriptional

3
activities 8. There are over 300 microRNAs in the human genome which are predicted to
regulated 2/3 of all genes 9, 10.
1.2.2 MiRNA Processing and Function
Genes encoding miRNAs are transcribed by RNA polymerase II into long primary miRNA
sequences (pri-miRNAs) with a 5’ cap, 3’ untranslated region (UTR), and a hairpin sequence that
encodes the mature miRNA. The hairpin of the pri-miR is then cleaved by the enzyme Drosha to
form precursor microRNAs (pre-miRNAs). Pre-miRNAs and are then transported via Exportin V
to the cytoplasm. Once in the cytoplasm dicer, an Rnase III superfamily member cleaves one of
the strands and attaches the mature miRNA to an RNA-induced silencing complex (RISC)
complex. The full RISC complex (miRNA and RISC) are then able to bind to 3’ UTR regions of
mRNAs, and inhibit translation. Translational inhibition may occur either through mRNA
degradation or translational suppression. When there is complete complementarity of the miRNA
to the mRNA 3’ UTR, the mRNA is degraded, however, partial complementarity of the miRNA
to the 3’ UTR sequence results in inhibition of the circularization of the mRNA needed for
ribosomal attachment 11.
1.2.3 MiR-17-92 Cluster of MiRNAs
Findings over the past five years strongly support a role for miRNAs in the regulation of crucial
processes such as cell proliferation 12, apoptosis 13, development 14, differentiation 15, metabolism
16, and immune regulation17, 18.

4
Many of the known microRNAs appear in clusters on single polycistronic transcripts 19.
MiR-17-92 cluster codes for 7 mature miRNAs. Mir17-92 has two paralog clusters, miR-106a
cluster and miR-106b cluster 19. Mir-17-92 and its paralog clusters together consist of miR-17,
miR-18, miR-19a, miR-19b, miR-20, miR-25, miR-92, miR-93, miR-106a, and miR-106b 19.
MiRNAs in miR-17-92 clusters are reported to be amplified in various tumor types, such as B-
cell lymphoma and lung cancers 5, 20-22 . Recently, these miRNAs have been found to induce
proliferation and confer anti-apoptotic function in tumors thereby promoting tumor-progression,
and function as oncogenes 6, 20, 21.
Knockout and transgenic studies of the miR-17-92 cluster in mice have demonstrated the
importance of this cluster in mammalian biology. While knockout of the mir-17-92 cluster
results in immediate post natal death of all progeny, knockout of either or both the miR-106a or
miR-106b cluster demonstrated no apparent change in phenotype. However, when the miR-17-
92 cluster was knocked out together with miR-106a or 106b cluster the result was embryonic
lethality 23. Further studies have been done in transgenic mice with miR-17-92 overexpressed in
lymphocytes through the CD2-CRE in a CRE-Lox system. These mice demonstrated
lymphoproliferative disorder and autoimmunity but not cancer 24. However, transgenic mice
overexpressing both miR-17-92 and c-Myc in lymphocytes develop early onset
lymphomagenesis disorders. These findings demonstrate a critical role for miR-17-92 cluster in
T-cell cell biology.
Many transcription factors have been identified that regulate expression of this cluster,
including the E2 transcription factor (E2F) family members 25, c-Myc 5, and signal transducer
and activator of transcription-3 (STAT3) 26. Additionally, miR-17-92 cluster miRNAs have been
shown to regulate many genes including: E2F1, E2F2, E2F3, P21, TSP1, CTGF, BIM and

5
PTEN5, 25, 27-29. These genes are all involved in cell cycle regulation, further supporting the
importance of miR-17-92 cluster in T-cell biology.
1.3 T-CELL FUNCTION IN CANCER
1.3.1 Relevance of Th1 and Th2 Cell Response in Cancer
T-cell immune responses are classified into distinct effector cell types based on their cytokine-
secreting profiles 30-32. Type-2 T-cells include T-helper (Th2) and T-cytotoxic cells (Tc2), which
preferentially secrete interleukin IL-4, IL-5, and IL-10, whereas type-1 T cells [T-helper (Th1)
and T-cytotoxic cell (Tc1)] predominantly secrete interferon(IFN)-γ.
Data from our group and others indicate that a type-1 T-cell response is favorable for
anti-tumor immunity 33, 34. Cancers, including GBMs, secrete numerous Type-2 driving
cytokines 35-38 that serve to promote tumor proliferation 35, 39, 40, immune escape 41, 42, and skew
the T-cell response towards the Type-2 41-43. All of these events commonly correlated with poor
prognosis in cancer patients 43-45. However, the exact mechanisms as to why type-1 immune
responses are favorable for anti-tumor immunity are largely unknown. We therefore seek to
better understand T-cell biology to establish the means to skew the T-cell response toward type-
1.

6
1.3.2 Immunotherapeutic Approaches to GBMs
A major challenge in current immunotherapy for progressive malignant glioma is the systemic
suppression of immunity due to chemo-/radiotherapy, tumor elaboration of immunosuppressive
substances, and Th2 skewing factors 46-48. While active immunization for GBM relies on intact
host-immune reactivity in order to elicit potent anti-tumor immune responses, it seems promising
to generate genetically-modified tumor-specific T-cells ex vivo, which are resistant to tumor-
mediated immune suppression and possess robust anti-tumor responses. As previously discussed,
miR-17-92 miRNAs have the potential to regulate the cell cycle and confer resistance of
adoptively transferred T-cells to tumor-derived immunosuppressive factors. Therefore, further
characterization of the role of miR-17-92 cluster may provide us with strong bases to develop
novel immunotherapy strategies with genetically engineered T cells with improved abilities to
mediate anti-tumor effects.

7
2.0 THESIS AIMS
Enhancing the host immunological response to tumors remains a challenge for glioma
researchers. As mentioned previously a Th1 immune response is favorable for anti-tumor
immunity. As miRNAs represent a novel class of regulatory molecules we decided to examine
the differential expression of miRNAs in Th1 versus the tumor-skewed Th2 cells. We
hypothesize that miRNAs overexpressed in Th1 cells may play a critical role in the promoting
the anti-tumor response. Therefore, the overall goal of this study was to examine differences in
miRNA expression between Th1 and Th2 cells and study immunoregulatory factors present in
the tumor microenvironment that may regulate these important miRNA.

8
2.1 SPECIFIC AIMS
Specific Aim #1: Characterize miRNA expression profile and phenotype of Th1 and Th2 cells.
Hypothesis: We expect to identify miRNA that are upregulated in Th1 over Th2.
Results: Th1 cells demonstrated increased miR-17-92 cluster expression, better ability to
proliferate, and decreased expression of anti proliferative factors E2F1 and E2F2 than Th2 cells.
Specific Aim #2: Examine specific mechanisms that regulate miRNA-17-92 expression.
Hypothesis: Type-2 cytokines and their intracellular signaling pathway affect the expression
levels of differentially expressed microRNAs.
Results: Suppression of IL-4 or IL-4 signaling resulted in increased miR-17-92 expression and
increased proliferative ability of CD4+ T-cells.

9
3.0 MATERIALS AND METHODS
3.1 REAGENTS
RPMI 1640, FBS, L-glutamine, sodium pyruvate, 2-mercaptoethanol, nonessential amino acids,
and penacilin/streptomycin all were obtained from Invitrogen Life Technologies. Recombinant
murine (rm) IL-12 was purchased from Cell Sciences Technologies. RmIL-4 and recombinant
human IL-2 were purchased from PeproTech. Purified mAbs against IL-12 (C15.6), IFN-γ (R4 –
6A2), IL-4 (11B11), CD3 (145-2C11), were all purchased from BD Pharmingen. All quantitative
real time PCR (quantitative RT-PCR) reagents and primers were purchased from Applied
Biosystems and analyzed on a BioRad IQ5. WST-1 reagent was purchased from Roche.
C57BL/6 mice (5–9 wk of age) and C57BL/6 background STAT6 deficient mice were purchased
from The Jackson Laboratory in Bar Harbor, Maine. Animals were handled in the Hillman
Cancer Center Animal Facility at University of Pittsburgh per an Institutional Animal Care and
Use Committee-approved protocol.
10
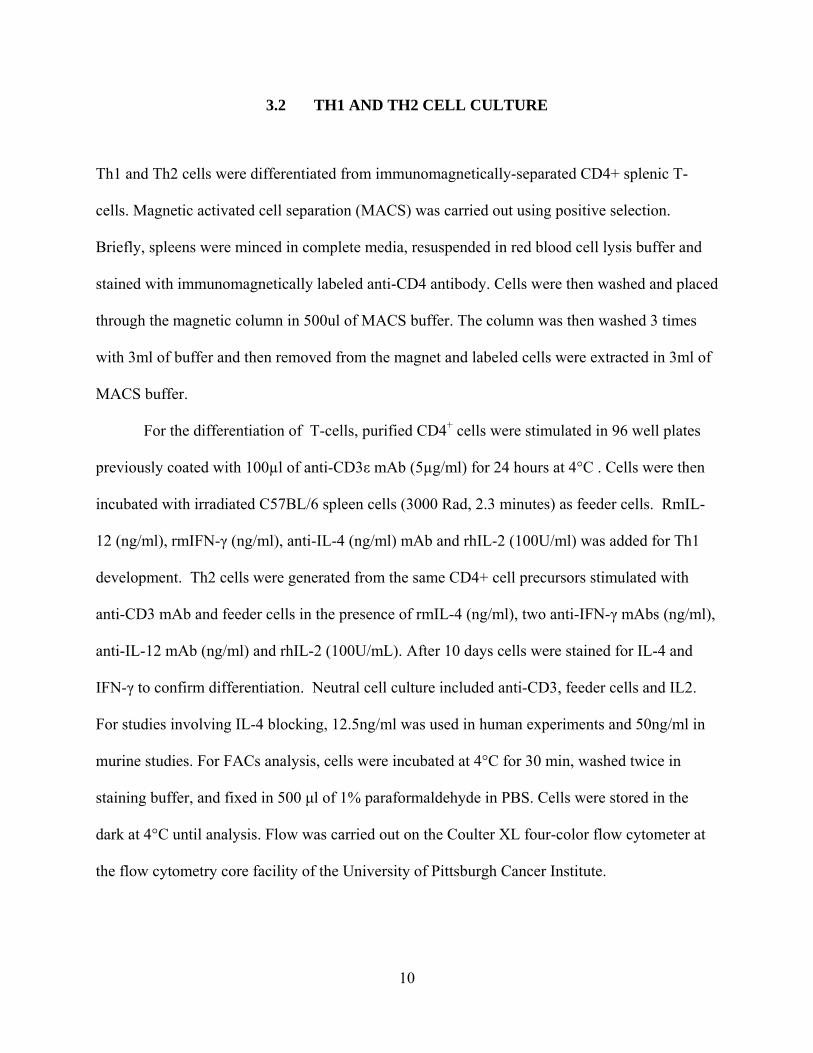
3.2 TH1 AND TH2 CELL CULTURE
Th1 and Th2 cells were differentiated from immunomagnetically-separated CD4+ splenic T-
cells. Magnetic activated cell separation (MACS) was carried out using positive selection.
Briefly, spleens were minced in complete media, resuspended in red blood cell lysis buffer and
stained with immunomagnetically labeled anti-CD4 antibody. Cells were then washed and placed
through the magnetic column in 500ul of MACS buffer. The column was then washed 3 times
with 3ml of buffer and then removed from the magnet and labeled cells were extracted in 3ml of
MACS buffer.
For the differentiation of T-cells, purified CD4+ cells were stimulated in 96 well plates
previously coated with 100µl of anti-CD3ε mAb (5µg/ml) for 24 hours at 4°C . Cells were then
incubated with irradiated C57BL/6 spleen cells (3000 Rad, 2.3 minutes) as feeder cells. RmIL-
12 (ng/ml), rmIFN-γ (ng/ml), anti-IL-4 (ng/ml) mAb and rhIL-2 (100U/ml) was added for Th1
development. Th2 cells were generated from the same CD4+ cell precursors stimulated with
anti-CD3 mAb and feeder cells in the presence of rmIL-4 (ng/ml), two anti-IFN-γ mAbs (ng/ml),
anti-IL-12 mAb (ng/ml) and rhIL-2 (100U/mL). After 10 days cells were stained for IL-4 and
IFN-γ to confirm differentiation. Neutral cell culture included anti-CD3, feeder cells and IL2.
For studies involving IL-4 blocking, 12.5ng/ml was used in human experiments and 50ng/ml in
murine studies. For FACs analysis, cells were incubated at 4°C for 30 min, washed twice in
staining buffer, and fixed in 500 μl of 1% paraformaldehyde in PBS. Cells were stored in the
dark at 4°C until analysis. Flow was carried out on the Coulter XL four-color flow cytometer at
the flow cytometry core facility of the University of Pittsburgh Cancer Institute.

11
3.3 MIRNA MICROARRAY
Total RNA was harvested from Th1 and Th2 using the Qiagen RNeasy kit and quality was
confirmed with a A260/A280 ratio greater than 1.85. RNA was labeled with either Cy5 (red;
Th1) or Cy3 (yellow; Th2) fluorescent dyes. The total RNA samples were next mixed and
applied to miRNA array slides prepared by Drs. Ena Wang and Francesco Marincola (the NIH)
using robotics for the spotting of 714 murine, human and viral sequences complementary to
different mammalian miRNAs, and analyzed with a microarray chip reader. Differentially
expressed miRNAs were analyzed by hierarchical clustering of Th1/Th2 pair of miRNA
microarray signal. MiRNAs changed with ratio>2fold were considered significant.
3.4 QUANTITATIVE RT-PCR
Total RNA was extracted using the Qiagen RNeasy kit and quality was confirmed with a
A260/A280 ration greater than 1.85. RNA (10 ng) was subjected to quantitative RT-PCR
analysis using the TaqMan microRNA Reverse Transcription Kit, microRNA Assays (Applied
Biosystems), and the Real-Time thermocycler iQ5 (Bio-Rad). The small nucleolar SNO202 was
used as the housekeeping small RNA reference gene for all murine samples. All reactions were
done in triplicate and relative expression of RNAs was calculated using the ΔΔCT method.

12
3.5 PROLIFERATION ASSAYS
For WST-1 proliferation assays 1x 10⁴ cells were cultured in a 96 well plate for 24-48 hours in
100ul of complete media. After this time 10ul of WST-1 reagent was added to each well. Cells
were incubated at 370C, 5% CO2 for 4 hours, and placed on a shaker for 1 min. The plates were
then read on a micro plate reader with a wavelength of 420 nm and a reference at 620 nm.
For CFSE assays 5 x 10⁵ immunomagnetically-separated CD4+ splenic T-cells were cultured
under Th1 or Th2 polarizing conditions. On day 10 cells were labeled with 0.5uM CFSE and on
day 15 cells were then harvested and CFSE dilution was assessed by flow-cytometry.

13
4.0 AIM 1 RESULTS
4.1 IN VITRO DIFFERENTIATION OF TH1 AND TH2 CELLS
As discussed in the Background section, functional effecter T-cells include those polarized to
either Th1 or Th2 phenotypes by environmental instruction. There are also less prevalent
functionally-differentiated T-cells such as: Tregs and Th17 [Th17 follow a similar trend in miR-
17-92 expression as Th1 (data not shown)].
From immunomagnetically isolated murine CD4+ splenic T-cells, Th1 cells were induced by
culture in complete media containing IL-2, IL-12 and anti-IL-4 neutralizing antibody for 10
days, whereas Th2 cells were generated in media containing IL-4, neutralizing antibodies against
IFN-γ and IL-12. Both groups were stimulated with anti-CD3 antibody and feeder cells on days 0
and 2, and further maintained with hIL2. After 10 days these differentiated T-cells exhibited
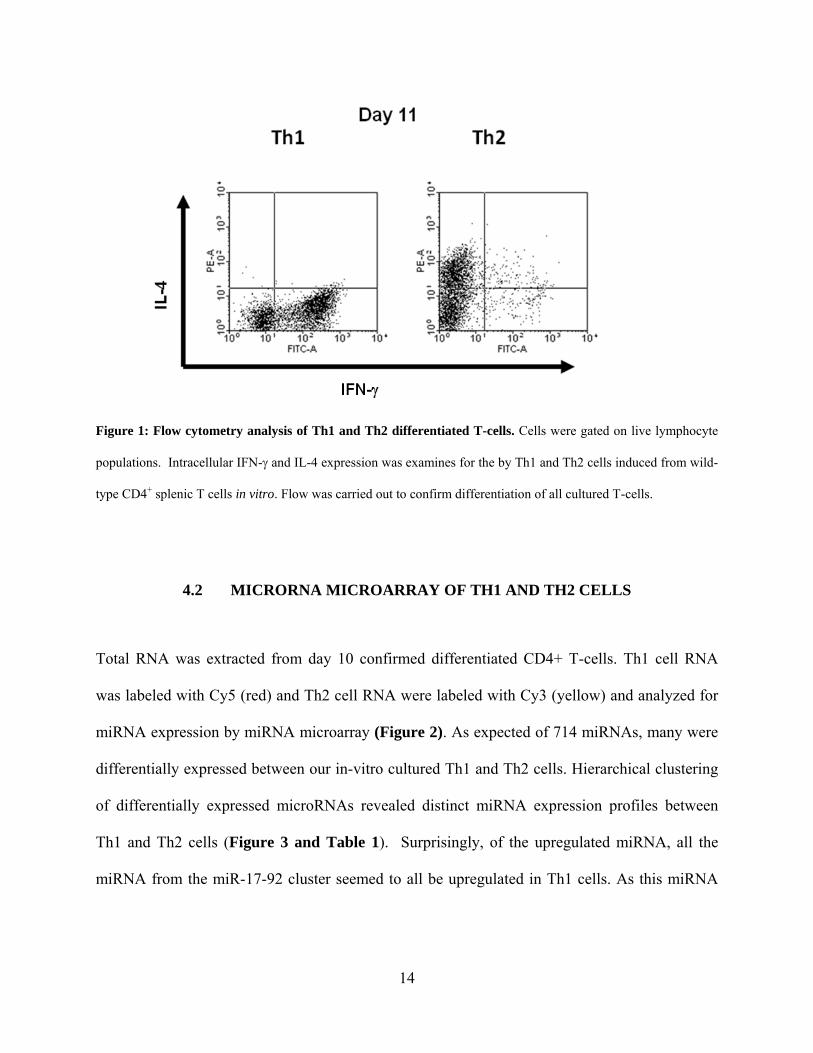
expected cytokine profiles as shown using flow cytometry (Figure 1). Th1 cells predominantly
produced IFN-γ but not IL-4, while Th2 cells produced mostly IL-4 consistent with what we
expected.
14
Figure 1: Flow cytometry analysis of Th1 and Th2 differentiated T-cells. Cells were gated on live lymphocyte
populations. Intracellular IFN-γ and IL-4 expression was examines for the by Th1 and Th2 cells induced from wild-
type CD4+ splenic T cells in vitro. Flow was carried out to confirm differentiation of all cultured T-cells.
4.2 MICRORNA MICROARRAY OF TH1 AND TH2 CELLS
Total RNA was extracted from day 10 confirmed differentiated CD4+ T-cells. Th1 cell RNA
was labeled with Cy5 (red) and Th2 cell RNA were labeled with Cy3 (yellow) and analyzed for
miRNA expression by miRNA microarray (Figure 2). As expected of 714 miRNAs, many were
differentially expressed between our in-vitro cultured Th1 and Th2 cells. Hierarchical clustering
of differentially expressed microRNAs revealed distinct miRNA expression profiles between
Th1 and Th2 cells (Figure 3 and Table 1). Surprisingly, of the upregulated miRNA, all the
miRNA from the miR-17-92 cluster seemed to all be upregulated in Th1 cells. As this miRNA

15
cluster has been shown to regulate many genes we decided to further examine expression of this
miRNA cluster.
Figure 2: MiRNA microArray Chip. A representative miRNA array chip hybridized with Th1 and Th2
derived total RNA. Total RNA was harvested from Th1 and Th2 cells and labeled with either Cy5 (red; Th1)
or Cy3 (yellow; Th2) fluorescent dyes. The total RNA samples were next mixed and applied to miRNA array
slides prepared by using robotics for the spotting of 714 murine, human and viral sequences complementary to
different mammalian miRNAs. Each dot represents one mature miRNA. Red dots represent miRNAs
upregulated in Th1 cells and yellow dots represent miRNAs upregulated in Th2 cells

16
Table 1
Figure 3: Hierarchal clustering of Th1 vs. Th2 differentially expressed miRNAs. Differentially expressed miRNAs were analyzed by hierarchical clustering. Red indicates upregulation in Th1 cell RNA and green represents up-regulation in Th2 cell RNA. MiRNAs changed with ratio>2 fold are shown.
Table 1: MiRNA overexpression in Th1/Th2 cells. MiRNA were ranked in terms of relative fold expression of Th1/Th2 cells. Arrows indicate members of the miR-17-92 cluster. miRNAs with a relative expression of >2 fold are shown

17
4.3 QUANTITATIVE RT-PCR OF MATURE MIRNA ISOLATED FROM TH1 AND
TH2 CELLS
To confirm expression of miR-17-92 as seen in the microRNA microarray we performed
quantitative RT-PCR for each of the mature miRNA in the miR-17-92 cluster (Figure 4).
Figure 4: Quantitative RT-PCR of all miRNA from the miR-17-92 cluster. Data represent relative expression
of mature microRNA expression of each miRNA from Th1 or Th2 cell RNA. SNO202 was used as the internal
control and 2ΔΔCT method was used to examine expression relative to the Th2 cell value. Error bars indicate the
standard deviation. Columns indicate the mean of 2 separate experiments, each experiment with 3 wells and Error
Bars indicate standard deviation across these 2 experiment. Statistical analysis was carried out on graphpad prism
using the student t test. All values were significant with a p<.01 for miR-92 and p<.0001 for all others.
0.01.02.03.04.05.0
Th1 Th2
Rel
ativ
e Ex
pres
sion
mir-17-5p
0.0
1.0
2.0
3.0
4.0
Th1 Th2
Rel
ativ
e Ex
pres
sion
miR-18a
0.0
1.0
2.0
3.0
4.0
Th1 Th2
Rel
ativ
e Ex
pres
sion
miR-19a
0.0
1.0
2.0
3.0
4.0
Th1 Th2
Rel
ativ
e Ex
pres
sion
mir-20a
0.0
1.0
2.0
3.0
4.0
Th1 Th2
Rel
ativ
e Ex
pres
sion
miR-19b
0.0
1.0
2.0
3.0
4.0
Th1 Th2
Rel
ativ
e Ex
pres
sion
miR-92

18
We thus concluded that relative expression of all miRNAs from miR-17-92 cluster were
consistently upregulated in Th1 vs. Th2.
4.4 EXPRESSION OF MIR-17-92 PARALOG CLUSTERS
As mentioned previously, miR-17-92 cluster has 2 paralog clusters: miR-106a-92 and miR-106b-
25. These paralog clusters target similar mRNAs as miR-17-92 cluster 49 . If Th2 cells
overexpressed the 2 paralog clusters and Th1 cells overexpressed miR-17-92 cluster similar
mRNAs would be suppressed in both cell types and no resulting change in phenotype would be
expected. However if these 2 paralog clusters were overexpressed in Th1 we could expect to see
an amplified response and further downregulation of mIR-17-92 targets. To establish if these
paralog microRNA clusters were overexpressed in our Th1 versus Th2 cells we next ran
quantitative RT-PCR for multiple miRNAs in each of these clusters. Representative for these
paralog clusters are miR-106a and miR106b (Figure 5).

19
Figure 5: Quantitative RT-PCR of miR-106a and miR-106b expression in Th1 and Th2 cultured cells. Data
represent relative expression of each mature miRNA from Th1 or Th2 cell RNA. SNO202 was used as the internal
control and 2ΔΔCT method was used to examine expression relative to the Th2 cell value. Data is representative of 2
experiments. Data represent the mean of a single experiment containing triplicate samples for quantitative RT-PCR.
Error Bars indicate standard deviation of the triplicate samples. Statistical analysis was carried out on graphpad
prism using the student t test. Samples are significant with a p<.001 for miR-16a and a p<.05 for miR106b.
These data demonstrate that the paralog clusters of miRNA were also overexpressed in
Th1 cells over Th2 and that the effect of the miR-17-92 cluster can be enhances 49. Despite the
similar trend relative expression levels seemed varied between the miR-17-92 cluster and its
paralog clusters. Because these miRNA are on separate chromosomes it is likely that other
factors also participate in their regulation.
0.01.02.03.04.05.06.07.08.0
Th1 Th2
Rel
ativ
e Ex
pres
sion
miR-106a
0.00.51.01.52.02.53.03.5
Th1 Th2
Rel
ativ
e Ex
pres
sion
miR-106b

20
4.5 PROLIFERATION OF TH1 AND TH2 CELLS IN CULTURE
4.5.1 CFSE Staining of Th1 and Th2 Cells
As previously discussed, miR-17-92 and its paralog clusters have been predicted and
demonstrated to regulate many genes involved in proliferation and the cell cycle 12-14. We thus
next sought to examine if proliferation of our Th1 and Th2 cells correlated with miR-17-92
cluster expression using a CFSE proliferation assay (Figure 6).
Figure 6: Proliferative ability of Th1 vs. Th2 cells examined through CFSE assay. immunomagnetically-
separated CD4+ splenic T cells derived from Wild-type mice and then cultured with Th1 or Th2 cytokine conditions
on day 10 cells were labeled with 0.5µM of CFSE on day 15, cells were harvested and CFSE dilution was assessed
by flow-cytometry.
As CFSE labeled cells proliferate CFSE intensity is diluted and mean florescent intensity
(MFI) of is decreased 50. Here we demonstrate that Th1 cells exhibited increased growth relative
to Th2 cultured cells.
21
4.5.2 WST-1 Proliferation Assay of Th1 and Th2 Cells
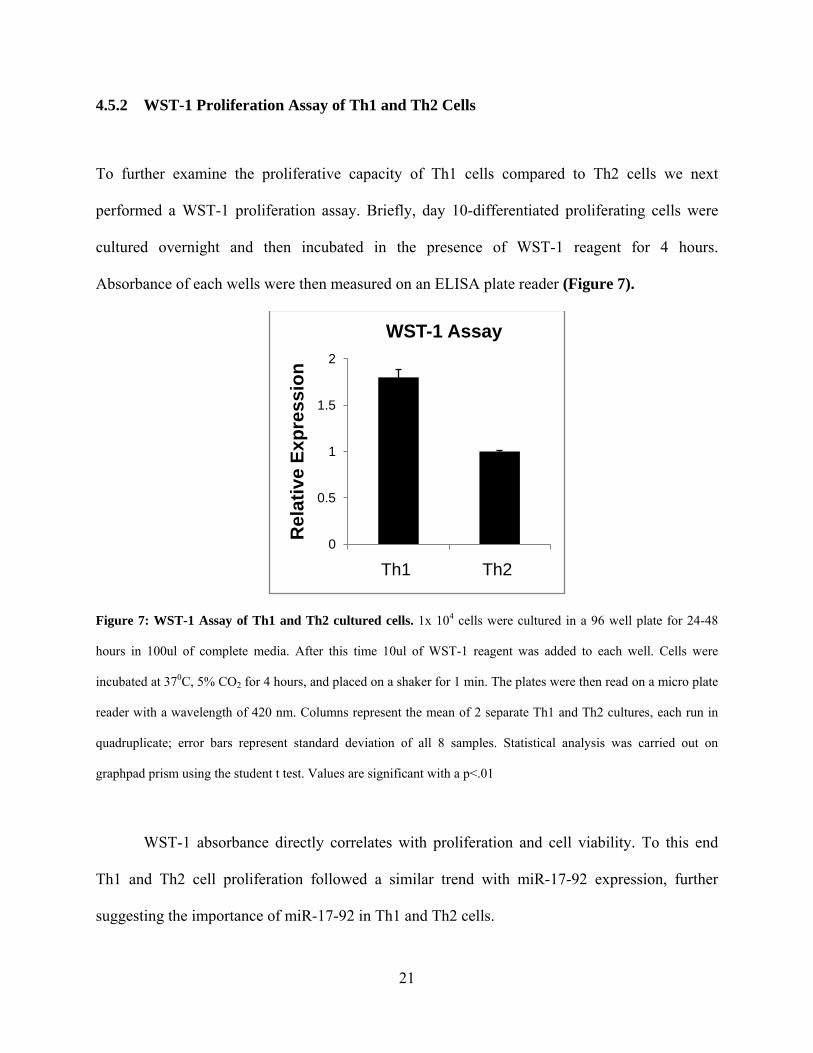
To further examine the proliferative capacity of Th1 cells compared to Th2 cells we next
performed a WST-1 proliferation assay. Briefly, day 10-differentiated proliferating cells were
cultured overnight and then incubated in the presence of WST-1 reagent for 4 hours.
Absorbance of each wells were then measured on an ELISA plate reader (Figure 7).
Figure 7: WST-1 Assay of Th1 and Th2 cultured cells. 1x 10⁴ cells were cultured in a 96 well plate for 24-48
hours in 100ul of complete media. After this time 10ul of WST-1 reagent was added to each well. Cells were
incubated at 370C, 5% CO2 for 4 hours, and placed on a shaker for 1 min. The plates were then read on a micro plate
reader with a wavelength of 420 nm. Columns represent the mean of 2 separate Th1 and Th2 cultures, each run in
quadruplicate; error bars represent standard deviation of all 8 samples. Statistical analysis was carried out on
graphpad prism using the student t test. Values are significant with a p<.01
WST-1 absorbance directly correlates with proliferation and cell viability. To this end
Th1 and Th2 cell proliferation followed a similar trend with miR-17-92 expression, further
suggesting the importance of miR-17-92 in Th1 and Th2 cells.
0
0.5
1
1.5
2
Th1 Th2
Rel
ativ
e Ex
pres
sion
WST-1 Assay

22
4.6 EXPRESSION OF E2F’S IN TH1 AND TH2
The E2F family members are predicted targets of miR-17-92. E2Fs are transcription factors
known to be important in regulating many cell cycle genes 51. Specifically, E2F1 and E2F2 are
known negative regulators of T-cell proliferation. We therefore proposed that miR-17-92 may be
downregulating the E2F pathways in Th1 cells resulting in the observed enhanced proliferation
over Th2. We collected protein lysates from Th1 and Th2 cells and ran a western blot to examine
E2F1 and E2F2 expression (Figure 8).
Figure 8: Western blot Analysis of E2F1 and E2F2 from Th1 and Th2 protein lysates. Protein fractions were
extracted from day 10-confirmed Th1 and Th2 cells on 2 independent occasions. Twenty micrograms of protein
from each sample were then loaded onto 3 separate 10% SDS-PAGE gels(one gel for each antibody). Proteins were
transferred to a Polyvinylidene fluoride (PVDF) membrane and each membrane was immunostained for E2F1, E2F2
or b-Actin primary antibody followed by horseradish peroxidase HRP conjugated secondary antibody and exposed
using Millipore western blot exposure reagent.

23
Our results demonstrate that as expected Th1 cells with upregulated miR-17-92 have
lower expression of E2F1 and E2F2 molecules. This supports our hypothesis that miR-17-92
promotes better proliferation of differentiated T-cells.

24
5.0 AIM 1 CONCLUSION
Our conclusion for Aim 1 is that many miRNAs are differentially expressed between Th1 and
Th2 cells. Of these differentially expressed miRNA, the miR-17-92 cluster and its paralog
clusters all were overexpressed in Th1 cultured cells relative to Th2 cultured cells. Since these
miRNAs have been implicated in cell growth, we also demonstrated that overexpression of these
miRNAs correlated with higher proliferation in Th1 versus Th2 cells and reduced expression of
the anti-proliferative transcription factors E2F1 and E2F2.

25
6.0 AIM 2 RESULTS
6.1 BLOCKING IL-4 REGULATED THE EXPRESSION OF MIR-17-92 CLUSTER
After demonstrating the difference in miR-17-92 cluster expression between Th1 and Th2 cells
we next aimed to determine factors that may regulate the cluster. After addition of IL-4
neutralizing antibodies to neutral cell cultures RNA was extracted from these cells and
quantitative RT-PCR was used to examine expression of the first and last microRNA in the miR-
17-92 cluster (Figure 9).

26
Figure 9: MiR-17-5p and miR-92 expression on neutral CD4+ T-cells after addition of IL-4 neutralizing
antibody. Neutral treated (anti-CD3, feeder cells, and hIL2) cells were cultured from immunomagnetically isolated
CD4+ T-cells with 5µg/ml plated anti-CD3, feeder cells and 100U/mL hIL2. Two and one half µg/mL of anti-IL-4
was added to the appropriate wells and cultured for 5 days prior to extraction of RNA. Quantitative RT-PCR data is
representative of 2 identical experiments. Columns represent the mean of triplicates from a single experiment and
error bars represent standard deviation. Statistical analysis was carried out on graphpad prism using the student t
test. MiR-17-5p and miR-92 were significant with p<.001 and p<.005, respectively.
These data suggest that blockade of endogenously produced IL-4 is sufficient to
upregulate miR-17-92 expression by approximately 50%, and IL-4 produced in the tumor
microenvironment can potentially cause a decrease in miR-17-92 cluster expression.
6.2 MIR-17-92 EXPRESSION IN STAT6 DEFICIENT T-CELLS
To further illustrate the effect of IL-4 signaling on miR-17-92 cluster expression we next isolated
CD4+ T-cells from mice deficient of the critical IL-4 signaling molecule, STAT6. After isolation
0.00
0.50
1.00
1.50
2.00
2.50
Neutral Neutral + anti-IL-4
Rel
ativ
e Ex
pres
sion
miR-17-5p
0.00
0.50
1.00
1.50
2.00
2.50
Neutral Neutral +anti-IL-4
Rel
ativ
e Ex
pres
sion
mir-92
27
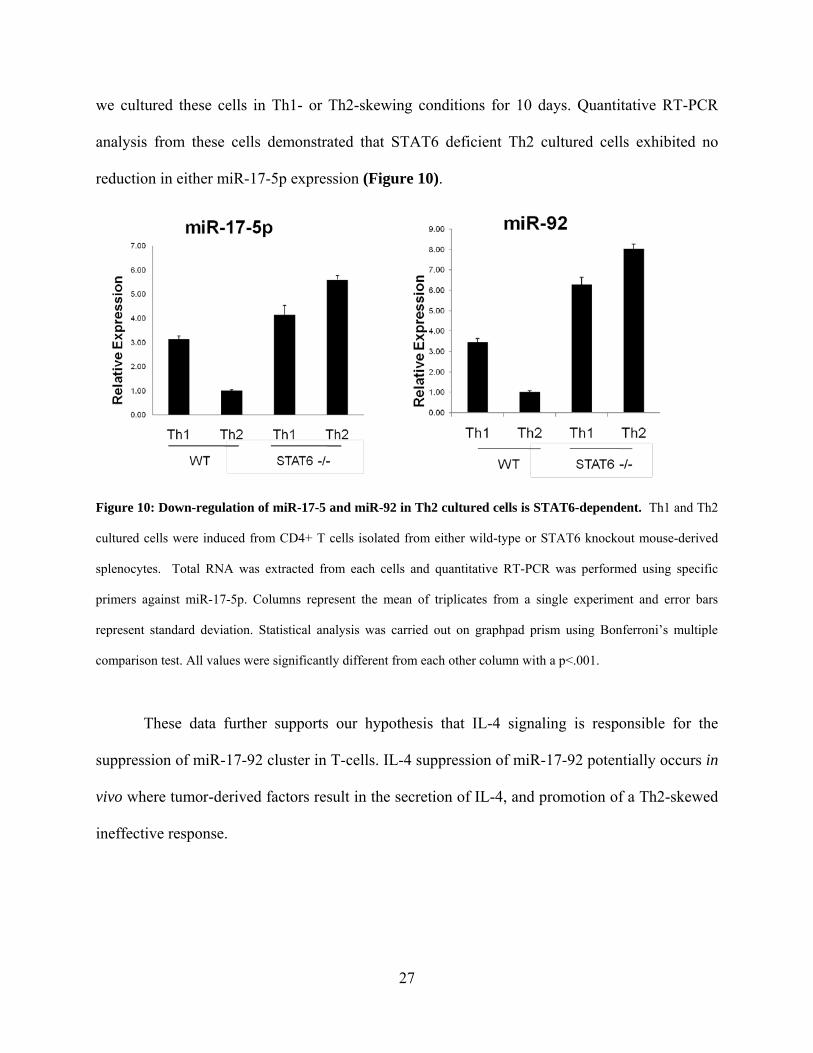
we cultured these cells in Th1- or Th2-skewing conditions for 10 days. Quantitative RT-PCR
analysis from these cells demonstrated that STAT6 deficient Th2 cultured cells exhibited no
reduction in either miR-17-5p expression (Figure 10).
Figure 10: Down-regulation of miR-17-5 and miR-92 in Th2 cultured cells is STAT6-dependent. Th1 and Th2
cultured cells were induced from CD4+ T cells isolated from either wild-type or STAT6 knockout mouse-derived
splenocytes. Total RNA was extracted from each cells and quantitative RT-PCR was performed using specific
primers against miR-17-5p. Columns represent the mean of triplicates from a single experiment and error bars
represent standard deviation. Statistical analysis was carried out on graphpad prism using Bonferroni’s multiple
comparison test. All values were significantly different from each other column with a p<.001.
These data further supports our hypothesis that IL-4 signaling is responsible for the
suppression of miR-17-92 cluster in T-cells. IL-4 suppression of miR-17-92 potentially occurs in
vivo where tumor-derived factors result in the secretion of IL-4, and promotion of a Th2-skewed
ineffective response.

28
6.3 DOSE RESPONSE OF CD4+ T-CELLS TO IL-4
To determine if the dose of IL-4 plays a role in the suppression of miR-17-92 cluster we next
treated CD4+ T-cells with increasing doses of IL-4 at either 0ng/ml, 10ng/ml, 50ng/ml or
100ng/ml and measured miR-17-5p expression with quantitative RT-PCR (Figure 11).
Figure 11: Dose response of miR-17-5p to IL-4 treatment. Neutral treated (anti-CD3, feeder cells, and hIL2) cells
were cultured with anti-CD3, feeder cells, and hIL-2 and varying amounts of IL-4 for 5 day. RNA was then
extracted and analyzed by quantitative RT-PCR for miR-17-5p expression. Columns represent mean of a single
experiment carried out in triplicate. **indicates P<.001 using ANOVA test. Curve was further analyzed using post
test for linear trend (graphpad prism) and was significant (p<.001)
These data demonstrate that the mIR-17-92 suppression occurs in a dose-dependent manner and
that partial blockade of IL-4 should be sufficient to enhance T-cell microRNA levels.

29
6.4 NEUTRALIZATION OF IL-4 ENHANCES CD4+ T-CELL PROLIFERATION
To further examine our hypothesis that IL-4 regulation of miR-17-92 and the E2F pathways
control proliferation of CD4+ T-cells through E2F signaling we next evaluated proliferation of
non differentiated T-cells in the presence of IL-4-neutralizing antibody (Figure 12).
Figure 12: Proliferation of CD4+ cells in the presence of IL-4 neutralizing antibody examined through a
CFSE assay. Immunomagnetically-separated CD4+ splenic T-cells derived from wild-type mice and then cultured
with or without IL-4 neutralizing antibody in neutral conditions (anti-CD3, feeder cells, and hIL2). On day 10 cells
were labeled with 0.5µM of CFSE. On day 15, cells were harvested and CFSE dilution was assessed by flow-
cytometry.
Our results demonstrate that in the presence of IL-4-neutralizing antibody there is
increase in CD4+ T-cell proliferation. Additionally, cells treated with IL-4-neutralizing antibody
had decreased expression of E2F1 and E2F2 as determined by western blot (data not shown).
MFI: 51 MFI: 21
NeutralNeutral+anti-IL-4 mAb
MFI: 51 MFI: 21
NeutralNeutral+anti-IL-4 mAb
CFSE

30
These results support our hypothesis that enhanced CD4+ T-cell proliferation is associated with
increased miR-17-92 cluster expression.
6.5 STAT6 DEFICIENT CD4+ T-CELLS ENHANCE TH2 PROLIFERATION
To further examine our hypothesis we next examined proliferation of day FACs 10 confirmed
Th1 and Th2 cells derived from either wild type C57BL/6 mice or STAT6 deficient mice
(Figure 13).
Figure 13: STAT6 deficient Th2 cells have enhanced proliferation that is not enhanced by neutralization of
IL-4. Immunomagnetically-separated CD4+ splenic T cells derived from Wild-type or STAT6 -/- mouse CD4+
cells were labeled with 0.5µM CFSE and then cultured under Th1, Th2 Neutral, or Neutral+anti-IL-4 mAb cytokine
conditions as described in the methods. At day 15, cells were harvested and CFSE dilution was assessed by flow-
cytometry.
Th1 Th2 NeutralNeutral+anti-IL-4 mAb
Th1 Th2 NeutralNeutral+anti-IL-4 mAb
MFI: 35 MFI: 22 MFI: 23 MFI: 20
CFSE
STA
T6K
O
MFI: 35 MFI: 22 MFI: 23 MFI: 20
CFSE
STA
T6K
O

31
Our results demonstrate that unlike wild-type mice, STAT6-deficient mice exhibit
increased proliferation of CD4+ splenocytes cultured in Th2 conditions relative to those in Th1
culture conditions. Additionally, this increased proliferation is not accelerated by neutralization
of IL-4. These data further support our hypothesis that miR-17-92 cluster is involved in T-cell
proliferation and regulated by IL-4.

32
7.0 AIM 2 CONCLUSION
Based on the present data we conclude that IL-4 suppresses miR-17-92 through a STAT6
dependant pathway in a dose dependent manner. Furthermore, enhanced proliferation of Th1
cells vs. Th2 cells is dependent on the IL-4 and STAT6 signaling pathway as STAT6 deficient
mice and addition of IL-4 neutralizing ab resulted in an increase in proliferation of cells cultured
under Th2 cytokine conditions.

33
8.0 DISCUSSION
Based on the present data we conclude that miR-17-92 is more highly expressed in the Th1 cells
phenotype as compared to Th2 cells. We have shown that in Th2 cells IL-4 suppresses this miR-
17-92 through the STAT6 signaling pathway. Furthermore, as miR-17-92 expression is predicted
to regulate the cell cycle, we have shown that miR-17-92 cluster expression correlated with cell
proliferation, and that predicted miR-17-92 targets E2F1 and E2F2 were downregulated. We
propose a model in which IL-4 from Th2 skewing cells or from the tumor environment 52 are
able to decrease the proliferative ability of T-cells and how Th1 skewing conditions can increase
the proliferative ability(Figure 14).

34
Figure 14: Model of miR-17-92 signaling pathway. Based on our current data we propose that IL-4 from Th2
skewing conditions such as the tumor environment downregulates miR-17-92 through the STAT6 pathway. This
downregulation of mIR-17-92 results in upregulation of anti proliferative E2F1 and E2F2 molecules resulting in
decreased proliferation relative to Th1. Conversely Th1 conditions lack activation of STAT6 and therefore have
upregulation of miR-17-92, decreased E2F1 and E2F2, and increase proliferation relative to Th2.
To be able to potentially regulate this cluster, it is important to better understand how IL-
4-STAT6 controls miR-17-92 expression. Although we are uncertain of the mechanism in which
IL-4-STAT6 regulates miR-17-92 cluster, we have identified a potential STAT6 binding site
between miR-19a and miR20a. We acknowledge that transcription factors bind and regulate at
the promotor regions of genes, however, this may represent a novel method of transcriptional
regulation. In this regulation, the transcription factor STAT6 could bind directly to the miR-17-
92 cluster and blocks transcription. There are however no known reports of STAT molecules
inhibiting translation. We will also examine the effect of STAT6 on other factors that have the
ability to regulate miR-17-92 expression at its promotor.

35
The Th1 and Th2 cells used in our model were induced in vitro from murine CD4+ cells.
While this allowed for a very controlled system to study differentiated T-cells we acknowledge
that there are inherent issues that must be addressed in the future. The ability of IL-4, a single
cytokine to skew miR-17-92 expression raises the possibility that other factors from the tumor
environments may interfere and regulate miR-17-92 expression. Another concern of our current
system is the use of only one animal strain. This raises the concern that a single strain might be
unique and not representative. Ideally we would like to examine our system in multiple animal
strains and eventually in human Th1 and Th2 cells.
We acknowledge that some of our experiments were only done one time and therefore
lack statistical proof. However we believe that taken together our data strongly illustrates the role
of IL-4-STAT6 in miR-17-92 expression and that this pathway reflects the proliferative ability of
CD4+ T-cells.
Future work is needed to demonstrate a direct linkage between miR-17-92 and T-cell
proliferation. Our results together with the results of others strongly suggest that miR-17-92
overexpression will enhance T-cell proliferation. Our future studies will aim at overexpressing
and knocking down of miR-17-92 to determine how proliferation is affected by this cluster.
Furthermore, we will examine other potentially therapeutic benefits of this cluster, including
resistance to activation induced cell death, chemotherapeutic responses and TGF-β suppression.
One of the major limitations to cancer immunotherapy is the short duration of T-cell
survival after adoptive transfer 53. Therefore we hypothesize that transgene-mediated expression
of miR17-92 will promote the survival and function of anti-tumor T cells. Our future goal will
be to test the ability of miR-17-92 cluster to provide better T-cell immunity in GMB patients in a
clinical trial. We propose that overexpression of miR-17-92 cluster in T-cells of GBM patients

36
alone or in combination with other immunotherapy strategies will lead to an enhance immune
response, able to fight the tumor.

37
9.0 FUTURE DIRECTIONS
9.1 MURINE STUDIES
9.1.1 Mir-17-92 Expression from Tumor Bearing Mice
To further our findings in an in vivo system we will examine the miR-17-92 expression in CD4+
T-cells from tumor bearing mice. In order to skew the systemic immune response and have
sufficient numbers of T-cells for analysis we will use an invasive melanoma model tumor. One
million B16 tumor cells will be inoculated into the right flank of C57BL/6 mice. After 2 weeks
we will harvest the spleen, isolate CD4+ cells with negative immuno-magnetic separation and
examine miR-17-92 expression. We will also confirm using an ELISA for IFN-γ whether the
cells are Th1 or Th2 skewed phenotype cells. Our hypothesis is that miR-17-92 expression will
be downregulated and these cells will be Th2 skewed.
9.1.2 Overexpression of MiR-17-92 in CD4+ T-cells
To show that miR-17-92 cluster directly affects proliferation and function of CD4+ T-cells we
will next produce stable miR-17-92 overexpressing CD4+ T-cells. For this we will use
nucleofection of 2 plasmids in a transposon/ transposase system. We have cloned the entire miR-
17-92 gene segments under a CMV promotor and GFP under its own SV40 promotor between

38
two IR/DR site (sites needed for transposase). With an Amaxa neucleofection kit we will
nucleofect our miR-17-92 plasmid together with another plasmid encoding the transposase
enzyme. This will allow us to create stable miR-17-92 overexpressing cells. These cells will be
selected using GFP and miR-17-92 overexpression will be confirmed. We will then examine a
variety of functional tests on these cells including: WST-1 proliferation assay, chemotherapy
drug resistance assay, activation induced cell death/apoptosis assay, and other in vitro assays. We
will also examine the effect of Th1 and Th2 skewing under various cytokine conditions. Our
hypothesis is that miR-17-92 overexpression in CD4+ T-cells will skew Th1 and that these cells
will proliferate better in suppressive and inhibitory conditions.
9.1.3 Adoptive Therapy of MiR-17-92 Overexpressing T-cells
As T-cell suppression remains a potent mechanism of tumor immune escape and because Th1
skewed T-cells has been shown to be preferential in tumor immunity over Th2 we predict miR-
17-92 overexpressing cells will restrict tumor growth and provide increased protection against
the tumor. To test this hypothesis we will evaluate the effect of adoptively transferred T-cells in
protection against a GL261 tumor. Using a Hamilton syringe, 1 x 10⁵ GL261 cells will be
stereotactically injected through an entry site at the bregma, 3 mm to the right of sagittal suture
and 4 mm below the surface of the skull of anesthetized mice using a stereotactic frame. On day
10, 5 mice per group will receive an i.v. injection with 2 x 10⁷ miR-17-92 overexpressing or
control transduced CD4+ cells, and cultured for 9 days with 100 U/ml of hIL-2. Mice will be
closely monitored for any neurological signs, or any signs of weakness or malaise, which are
considered to be an endpoint and mice will be sacrificed. Additionally some mice will be
sacrificed 6 days after adoptive transfer, brain infiltrating lymphocytes (BILs) will be isolated

39
and GFP+ cells will be analyzed for proliferation and apoptosis between the two groups. We
hypothesize that animals with miR-17-92 overexpressing CD4+ T-cells will have longer survival
than those without miR-17-92 overexpression. Additionally the adoptively transferred miR-17-
92 CD4+ cells will have better ability to proliferate and decreased levels of apoptosis than
control cells.
9.2 HUMAN STUDIES
9.2.1 Mir17-92 Expression in Human Th1 vs. th2
To determine if the data obtained from mouse Th1 and Th2 cells are relevant to the human
immune system, we will induce Th1 and Th2 cells from human PBMC in vitro and examine the
miR-17 cluster expression. Human Th1 and Th2 cells will be generated from naïve
CD4+CD45RA+ T cells as described previously54. Briefly, naïve CD4+CD45RA+ T cells will be
isolated using naïve CD4+ T cell isolation kit (Myltenyi Biotec) and be stimulated with plate-
bound anti-CD3 (1 µg/ml; clone OKT3) and anti-CD28 (2 µg/ml; clone 15E8; BioLegends) and
rIL-2 (50 units/ml; Peprotech). For Th1 differentiation, rIL-12 (2.5 ng/ml; R&D Systems), anti-
IL-4 mAb (5 µg/ml; clone MP4–25D2; BD Biosciences), and anti-IL-10 mAb (5 µg/ml; clone
JES3–9D7; BioLegends) will be added. For Th2 differentiation, rIL-4 (12.5 ng/ml; R&D
Systems), anti-IFN-γ mAb (5 µg/ml; clone B-B1; BioLegends), and anti-IL-10 mAb (5 µg/ml;
clone JES3–9D7; BioLegends) will be added. After 4 days, the cells will be expanded under the
same conditions in the absence of anti-CD3 or anti-CD28.

40
Total RNA will be isolated from resting Th1/Th2 cells or cells that will have been
activated for 4 h with PMA/ionomycin after 14, 21, or 28 days of differentiation, and
quantitative RT-PCR will be carried out with primers for miRNAs in miR-17-92 cluster.
Following analysis of miR-17-92 cluster we will examine the proliferative ability of these T-cells
with a WST-1 and a CFSE assay.
9.2.2 MiR-17-92 Expression in GBM patient CD4+ T-cells
To further examine the role of miR-17-92 cluster we next will obtain frozen PBMCs from
glioma patients as well as healthy donors. From these cells we will isolate CD4+ cells. A fraction
of the cells will be stimulated with anti-CD3 (OKT3 or UCHT1) used for human IFN-γ ELISA
to determine whether these cells are Th1 or Th2 skewed. RNA will then be extracted and miR-
17-92 cluster expression will be analyzed from both ex vivo CD4+ cells and stimulated CD4+
cells. We hypothesize that GBM patient CD4+ cells are Th2 skewed and that miR-17-92 will be
down regulated.
9.2.3 Overexpression of MiR-17-92 in Human CD4+ T-cells
As described in 9.1.2 we will utilize a transposon/transposase system to examine miR-17-92
overexpression in murine CD4+ T-cells. We will use the same systems to overexpress mIR-17-
92 in human CD4+ T-cells. Human CD4+ T-cells will be isolated from fresh PBMCs using
negative magnetic bead selection. Cells will be stimulated for 24 hours followed by
neucleofection. We will continue culture for 7 days and then confirm stable expression of miR-
17-92 expression and functional analysis of these cells.

41
9.3 OTHER FUTURE PLANS
All future plans mentioned to this point focused on the role of Th1 and Th2 CD4+ T-cells.
Differentiated Tc1 vs. Tc2 CD8+ T-cells may follow a similar trend to Th1 vs. Th2 and also
have improved proliferative ability. For this reason all our experiments and future plans will be
adapted for Tc1 and Tc2 and CD8+ human and murine cells.
Furthermore our methods of transduction may also include lenti viral vector system
which we are currently working on. This will allow for a less invasive method of transfection.
The reason we have chosen the transposon/transposase based system is for its relative safety in
patient use.
Although not mentioned, in addition to overexpression studies we would like to do
knockdown studies. In these studies we will use anti-sense microRNA to bind to the miR-17-92
cluster block the miR-17-92 function. We will expect to see decreased proliferation and opposite
phenotype as when we overexpress the same miRNA.
We have also obtained mice with miR-17-92 flanked by lox-p sites and Lck-Cre mice.
This will allow us to overexpress miR-17-92 cluster in T cells of mice and will hopefully lead to
the development of more projects.
Finally in these experiments we have been examining miR-17-92 cluster expression as a
whole which contains 7 mature microRNAs. Before miR-17-92 can be used in patients we will
examine each mature miRNA individually in different combinations to find the most effective
strategy of bettering T-cells

42
BIBLIOGRAPHY
1. Ohgaki, H. & Kleihues, P. Population-based studies on incidence, survival rates, and genetic alterations in astrocytic and oligodendroglial gliomas. J Neuropathol Exp Neurol 64, 479-489 (2005).
2. Ogaki, H. Epidemiology of Brain Tumors, Vol. 472, Edn. 2009. (Humana Press, 2009). 3. Okada, H. et al. Immunotherapeutic approaches for glioma. Crit Rev Immunol 29, 1-42
(2009). 4. Gautschi, O.P., van Leyen, K., Cadosch, D., Hildebrandt, G. & Fournier, J.Y.
[Fluorescence guided resection of malignant brain tumors - breakthrough in the surgery of brain tumors]. Praxis (Bern 1994) 98, 643-647 (2009).
5. He, L. et al. A microRNA polycistron as a potential human oncogene. Nature 435, 828-833 (2005).
6. Matsubara, H. et al. Apoptosis induction by antisense oligonucleotides against miR-17-5p and miR-20a in lung cancers overexpressing miR-17-92. Oncogene 26, 6099-6105 (2007).
7. Scaria, V., Hariharan, M., Maiti, S., Pillai, B. & Brahmachari, S.K. Host-virus interaction: a new role for microRNAs. Retrovirology 3, 68 (2006).
8. Elmen, J. et al. LNA-mediated microRNA silencing in non-human primates. Nature 452, 896-899 (2008).
9. Ueda, R. et al. Dicer-regulated microRNAs 222 and 339 promote resistance of cancer cells to cytotoxic T-lymphocytes by down-regulation of ICAM-1. Proc Natl Acad Sci U S A 106, 10746-10751 (2009).
10. Hammond, S.M. RNAi, microRNAs, and human disease. Cancer Chemother Pharmacol 58 Suppl 1, s63-68 (2006).
11. Ying, S.Y. & Lin, S.L. Intron-mediated RNA interference and microRNA biogenesis. Methods Mol Biol 487, 387-413 (2009).
12. Cheng, A.M., Byrom, M.W., Shelton, J. & Ford, L.P. Antisense inhibition of human miRNAs and indications for an involvement of miRNA in cell growth and apoptosis. Nucleic Acids Res 33, 1290-1297 (2005).
13. Xu, P., Guo, M. & Hay, B.A. MicroRNAs and the regulation of cell death. Trends Genet 20, 617-624 (2004).
14. Karp, X. & Ambros, V. Developmental biology. Encountering microRNAs in cell fate signaling. Science 310, 1288-1289 (2005).
15. Chen, C.Z., Li, L., Lodish, H.F. & Bartel, D.P. MicroRNAs modulate hematopoietic lineage differentiation. Science 303, 83-86 (2004).
16. Poy, M.N. et al. A pancreatic islet-specific microRNA regulates insulin secretion. Nature 432, 226-230 (2004).
17. Thai, T.H. et al. Regulation of the germinal center response by microRNA-155. Science 316, 604-608 (2007).
18. O'Connell, R.M., Taganov, K.D., Boldin, M.P., Cheng, G. & Baltimore, D. MicroRNA-155 is induced during the macrophage inflammatory response. Proc Natl Acad Sci U S A 104, 1604-1609 (2007).
19. Tanzer, A. & Stadler, P.F. Molecular evolution of a microRNA cluster. J Mol Biol 339, 327-335 (2004).
43
20. Hayashita, Y. et al. A polycistronic microRNA cluster, miR-17-92, is overexpressed in human lung cancers and enhances cell proliferation. Cancer Res 65, 9628-9632 (2005).
21. Lawrie, C.H. MicroRNA expression in lymphoma. Expert Opin Biol Ther 7, 1363-1374 (2007).
22. Rinaldi, A. et al. Concomitant MYC and microRNA cluster miR-17-92 (C13orf25) amplification in human mantle cell lymphoma. Leuk Lymphoma 48, 410-412 (2007).
23. Xiao, C. & Rajewsky, K. MicroRNA control in the immune system: basic principles. Cell 136, 26-36 (2009).
24. Xiao, C. et al. Lymphoproliferative disease and autoimmunity in mice with increased miR-17-92 expression in lymphocytes. Nat Immunol 9, 405-414 (2008).
25. Sylvestre, Y. et al. An E2F/miR-20a autoregulatory feedback loop. J Biol Chem 282, 2135-2143 (2007).
26. Brock, M. et al. Interleukin-6 modulates the expression of the bone morphogenic protein receptor type II through a novel STAT3-microRNA cluster 17/92 pathway. Circ Res 104, 1184-1191 (2009).
27. Ivanovska, I. et al. MicroRNAs in the miR-106b family regulate p21/CDKN1A and promote cell cycle progression. Mol Cell Biol 28, 2167-2174 (2008).
28. Koralov, S.B. et al. Dicer ablation affects antibody diversity and cell survival in the B lymphocyte lineage. Cell 132, 860-874 (2008).
29. Dews, M. et al. Augmentation of tumor angiogenesis by a Myc-activated microRNA cluster. Nat Genet 38, 1060-1065 (2006).
30. Carter, L.L. & Dutton, R.W. Type 1 and type 2: a fundamental dichotomy for all T-cell subsets. Curr Opin Immunol 8, 336-342 (1996).
31. Croft, M., Carter, L., Swain, S.L. & Dutton, R.W. Generation of polarized antigen-specific CD8 effector populations: reciprocal action of interleukin (IL)-4 and IL-12 in promoting type 2 versus type 1 cytokine profiles. J Exp Med 180, 1715-1728 (1994).
32. Sad, S., Marcotte, R. & Mosmann, T.R. Cytokine-induced differentiation of precursor mouse CD8+ T cells into cytotoxic CD8+ T cells secreting Th1 or Th2 cytokines. Immunity 2, 271-279 (1995).
33. Nishimura, F. et al. Adoptive transfer of type 1 CTL mediates effective anti-central nervous system tumor response: critical roles of IFN-inducible protein-10. Cancer Res 66, 4478-4487 (2006).
34. Goto, S. et al. Analysis of Th1 and Th2 cytokine production by peripheral blood mononuclear cells as a parameter of immunological dysfunction in advanced cancer patients. Cancer Immunol Immunother 48, 435-442 (1999).
35. Kemp, R.A. & Ronchese, F. Tumor-specific Tc1, but not Tc2, cells deliver protective antitumor immunity. J Immunol 167, 6497-6502 (2001).
36. Gold, L.I. The role for transforming growth factor-beta (TGF-beta) in human cancer. Crit Rev Oncog 10, 303-360 (1999).
37. Weller, M. & Fontana, A. The failure of current immunotherapy for malignant glioma. Tumor-derived TGF-beta, T-cell apoptosis, and the immune privilege of the brain. Brain Res Brain Res Rev 21, 128-151 (1995).
38. Nitta, T., Hishii, M., Sato, K. & Okumura, K. Selective expression of interleukin-10 gene within glioblastoma multiforme. Brain Res 649, 122-128 (1994).
39. Jarnicki, A.G., Lysaght, J., Todryk, S. & Mills, K.H. Suppression of antitumor immunity by IL-10 and TGF-beta-producing T cells infiltrating the growing tumor: influence of

44
tumor environment on the induction of CD4+ and CD8+ regulatory T cells. J Immunol 177, 896-904 (2006).
40. Prokopchuk, O., Liu, Y., Henne-Bruns, D. & Kornmann, M. Interleukin-4 enhances proliferation of human pancreatic cancer cells: evidence for autocrine and paracrine actions. Br J Cancer 92, 921-928 (2005).
41. Rahaman, S.O. et al. Inhibition of constitutively active Stat3 suppresses proliferation and induces apoptosis in glioblastoma multiforme cells. Oncogene 21, 8404-8413 (2002).
42. Seo, N., Hayakawa, S., Takigawa, M. & Tokura, Y. Interleukin-10 expressed at early tumour sites induces subsequent generation of CD4(+) T-regulatory cells and systemic collapse of antitumour immunity. Immunology 103, 449-457 (2001).
43. Sakaguchi, S. et al. Immunologic tolerance maintained by CD25+ CD4+ regulatory T cells: their common role in controlling autoimmunity, tumor immunity, and transplantation tolerance. Immunol Rev 182, 18-32 (2001).
44. Fujita, M. et al. Inhibition of STAT3 promotes the efficacy of adoptive transfer therapy using type-1 CTLs by modulation of the immunological microenvironment in a murine intracranial glioma. J Immunol 180, 2089-2098 (2008).
45. Ito, N., Nakamura, H., Tanaka, Y. & Ohgi, S. Lung carcinoma: analysis of T helper type 1 and 2 cells and T cytotoxic type 1 and 2 cells by intracellular cytokine detection with flow cytometry. Cancer 85, 2359-2367 (1999).
46. Hishii, M. et al. Human glioma-derived interleukin-10 inhibits antitumor immune responses in vitro. Neurosurgery 37, 1160-1166; discussion 1166-1167 (1995).
47. Bellone, G. et al. Tumor-associated transforming growth factor-beta and interleukin-10 contribute to a systemic Th2 immune phenotype in pancreatic carcinoma patients. Am J Pathol 155, 537-547 (1999).
48. Tatsumi, T. et al. Disease stage variation in CD4+ and CD8+ T-cell reactivity to the receptor tyrosine kinase EphA2 in patients with renal cell carcinoma. Cancer Res 63, 4481-4489 (2003).
49. Mendell, J.T. miRiad roles for the miR-17-92 cluster in development and disease. Cell 133, 217-222 (2008).
50. Strauss, L., Czystowska, M., Szajnik, M., Mandapathil, M. & Whiteside, T.L. Differential responses of human regulatory T cells (Treg) and effector T cells to rapamycin. PLoS One 4, e5994 (2009).
51. Moroni, M.C. et al. Apaf-1 is a transcriptional target for E2F and p53. Nat Cell Biol 3, 552-558 (2001).
52. Roussel, E., Gingras, M.C., Grimm, E.A., Bruner, J.M. & Moser, R.P. Predominance of a type 2 intratumoural immune response in fresh tumour-infiltrating lymphocytes from human gliomas. Clin Exp Immunol 105, 344-352 (1996).
53. Lizee, G., Cantu, M.A. & Hwu, P. Less yin, more yang: confronting the barriers to cancer immunotherapy. Clin Cancer Res 13, 5250-5255 (2007).
54. Weaver, C.T., Hatton, R.D., Mangan, P.R. & Harrington, L.E. IL-17 family cytokines and the expanding diversity of effector T cell lineages. Annu Rev Immunol 25, 821-852 (2007).