Embed Size (px)
Citation preview
Mirror adaptive random testing*
T.Y. Chen, F.-C. Kuo*, R.G. Merkel, S.P. Ng
School of Information Technology, Swinburne University of Technology, Hawthorn, Victoria 3122, Australia
Available online 9 September 2004
Abstract
Recently, adaptive random testing (ART) has been introduced to improve the fault-detection effectiveness of random testing for non-point
types of failure patterns. However, ART requires additional computations to ensure an even spread of test cases, which may render ART less
cost-effective than random testing. This paper presents a new technique, namely mirror ART, to reduce these computations. It is an
integration of the technique of mirroring and ART. Our simulation results clearly show that mirror ART does improve the cost-effectiveness
of ART.
q 2004 Elsevier B.V. All rights reserved.
Keywords: Mirroring; Adaptive random testing; Random testing; Black-box testing; Test case selection; Software testing
1. Introduction
Testing is the most commonly used method to ensure
the quality of a software system. Generally speaking, a
tester attempts to uncover as many faults as possible
with the given testing resources. There are two common
approaches to test case generation: white-box and black-
box. White-box testing selects test cases by referring to
the structure of the program, while black-box testing
selects test cases without referring to the structure [14].
Our study focuses on some black-box techniques, namely
random testing and some enhanced variants, under the
assumption of uniform distribution of inputs. Since
random testing is intuitively simple, easy to implement,
and can be used to estimate reliability of the software
system, it is one of the commonly used testing techniques
by practitioners [8,11,13]. However, some researchers
think that random testing is a poor method because it does
not make use of any information about the program or
specifications to guide the selection of test cases [12].
Chan et al. [1] have observed that failure-causing inputs
form certain kinds of patterns. They have classified these
0950-5849/$ - see front matter q 2004 Elsevier B.V. All rights reserved.
doi:10.1016/j.infsof.2004.07.004
* A preliminary version of this paper was presented at the Third
International Conference on Quality Software (QSIC 2003) [6].
* Corresponding author. Tel.: C61-3-9214-5505; fax: C61-3-9819-
0823.
E-mail address: [email protected] (F.-C. Kuo).
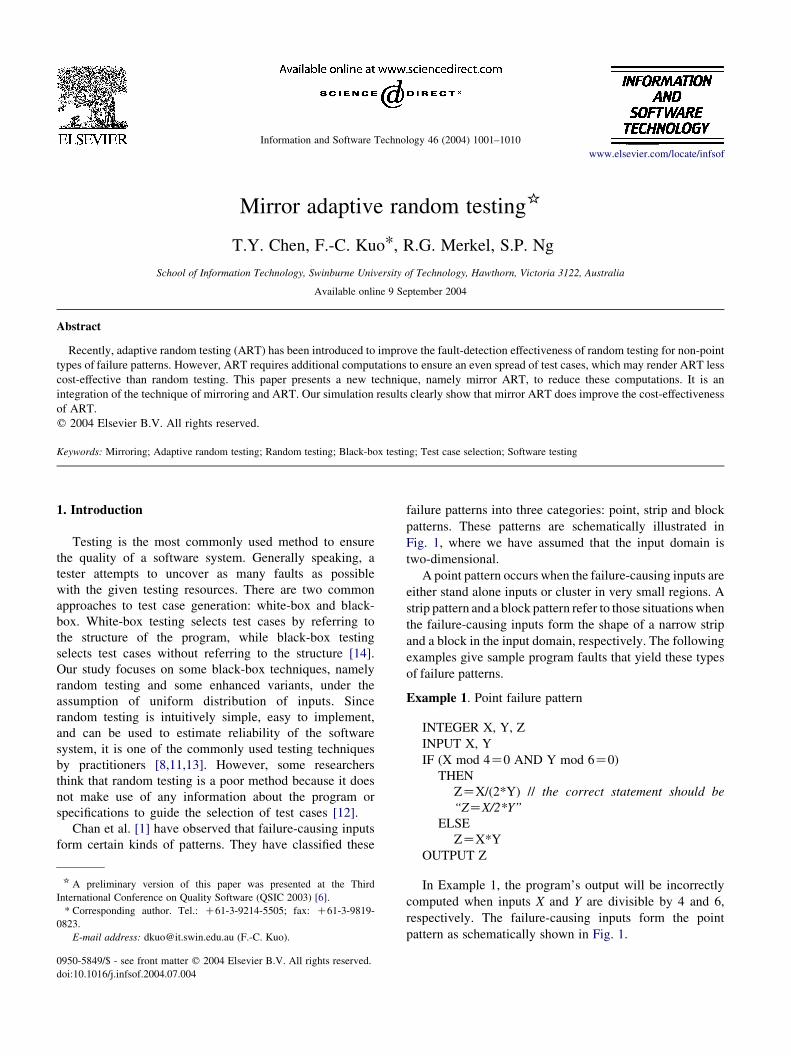
failure patterns into three categories: point, strip and block
patterns. These patterns are schematically illustrated in
Fig. 1, where we have assumed that the input domain is
two-dimensional.
A point pattern occurs when the failure-causing inputs are
either stand alone inputs or cluster in very small regions. A
strip pattern and a block pattern refer to those situations when
the failure-causing inputs form the shape of a narrow strip
and a block in the input domain, respectively. The following
examples give sample program faults that yield these types
of failure patterns.
Example 1. Point failure pattern
INTEGER X, Y, Z
INPUT X, Y
IF (X mod 4Z0 AND Y mod 6Z0)
THEN
ZZX/(2*Y) // the correct statement should be
“ZZX/2*Y”
ELSE
ZZX*Y
OUTPUT Z
In Example 1, the program’s output will be incorrectly
computed when inputs X and Y are divisible by 4 and 6,
respectively. The failure-causing inputs form the point
pattern as schematically shown in Fig. 1.
Information and Software Technology 46 (2004) 1001–1010
www.elsevier.com/locate/infsof
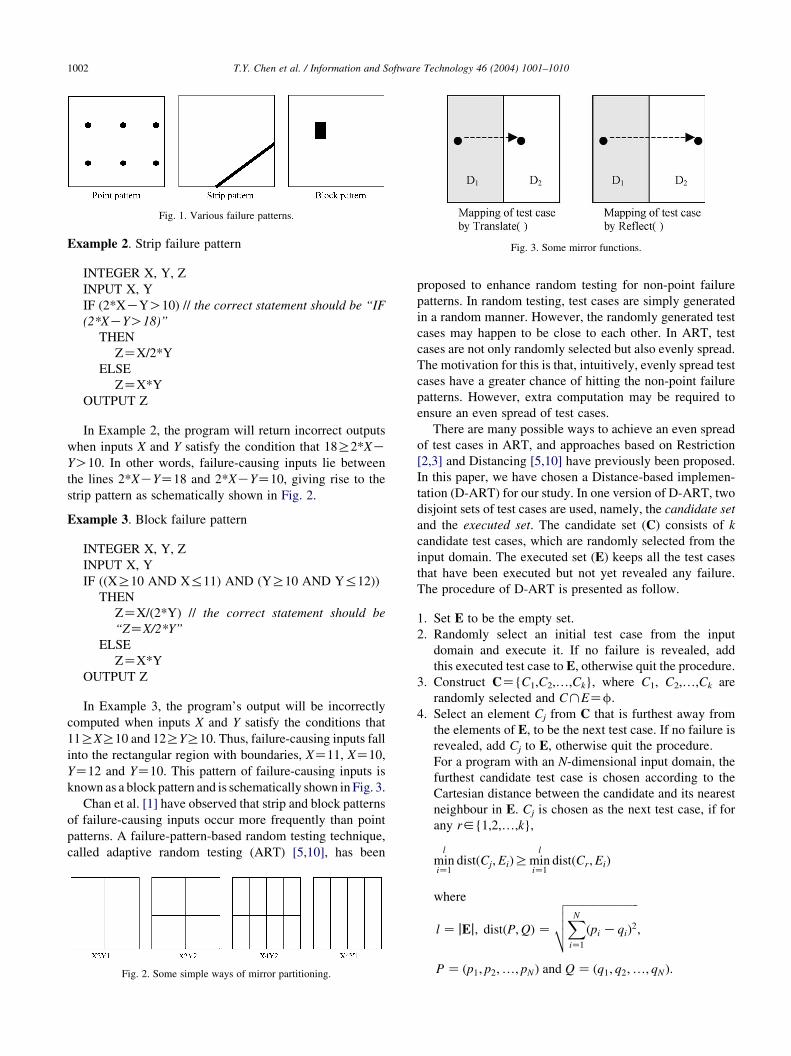
Fig. 1. Various failure patterns.
Fig. 3. Some mirror functions.
T.Y. Chen et al. / Information and Software Technology 46 (2004) 1001–10101002
Example 2. Strip failure pattern
INTEGER X, Y, Z
INPUT X, Y
IF (2*XKYO10) // the correct statement should be “IF
(2*XKYO18)”
THEN
ZZX/2*Y
ELSE
ZZX*Y
OUTPUT Z
In Example 2, the program will return incorrect outputs
when inputs X and Y satisfy the condition that 18R2*XKYO10. In other words, failure-causing inputs lie between
the lines 2*XKYZ18 and 2*XKYZ10, giving rise to the
strip pattern as schematically shown in Fig. 2.
Example 3. Block failure pattern
INTEGER X, Y, Z
INPUT X, Y
IF ((XR10 AND X%11) AND (YR10 AND Y%12))
THEN
ZZX/(2*Y) // the correct statement should be
“ZZX/2*Y”
ELSE
ZZX*Y
OUTPUT Z
In Example 3, the program’s output will be incorrectly
computed when inputs X and Y satisfy the conditions that
11RXR10 and 12RYR10. Thus, failure-causing inputs fall
into the rectangular region with boundaries, XZ11, XZ10,
YZ12 and YZ10. This pattern of failure-causing inputs is
known as a block pattern and is schematically shown in Fig. 3.
Chan et al. [1] have observed that strip and block patterns
of failure-causing inputs occur more frequently than point
patterns. A failure-pattern-based random testing technique,
called adaptive random testing (ART) [5,10], has been
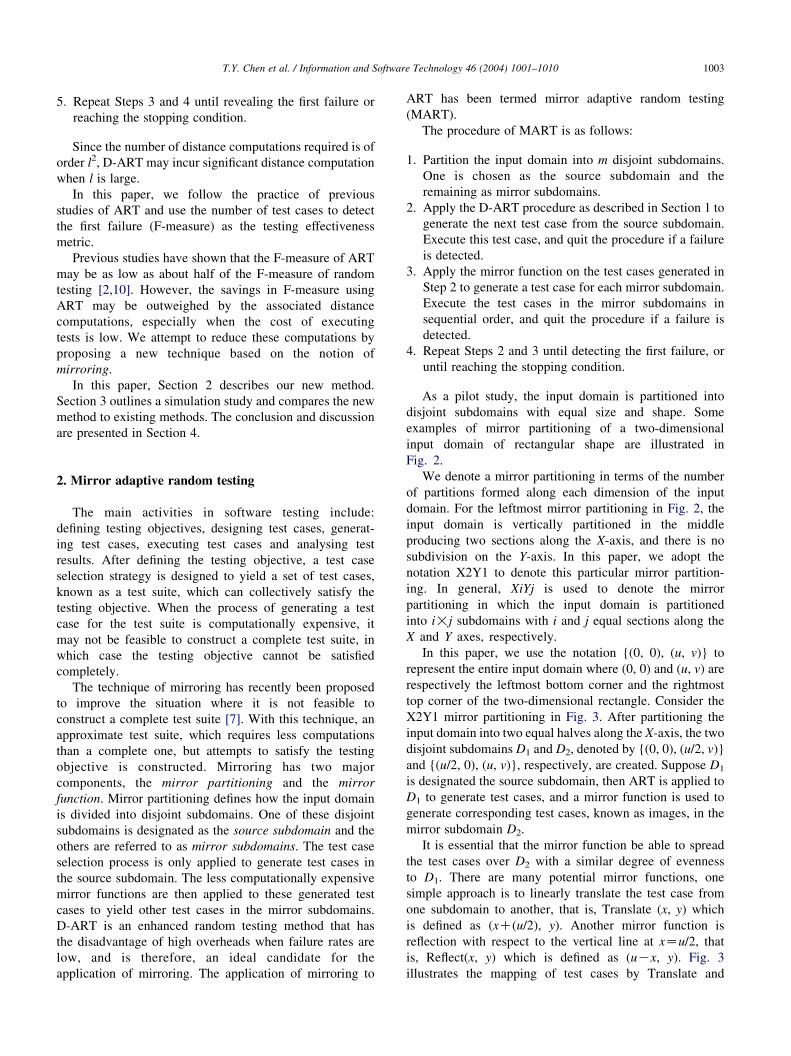
Fig. 2. Some simple ways of mirror partitioning.
proposed to enhance random testing for non-point failure
patterns. In random testing, test cases are simply generated
in a random manner. However, the randomly generated test
cases may happen to be close to each other. In ART, test
cases are not only randomly selected but also evenly spread.
The motivation for this is that, intuitively, evenly spread test
cases have a greater chance of hitting the non-point failure
patterns. However, extra computation may be required to
ensure an even spread of test cases.
There are many possible ways to achieve an even spread
of test cases in ART, and approaches based on Restriction
[2,3] and Distancing [5,10] have previously been proposed.
In this paper, we have chosen a Distance-based implemen-
tation (D-ART) for our study. In one version of D-ART, two
disjoint sets of test cases are used, namely, the candidate set
and the executed set. The candidate set (C) consists of k
candidate test cases, which are randomly selected from the
input domain. The executed set (E) keeps all the test cases
that have been executed but not yet revealed any failure.
The procedure of D-ART is presented as follow.
1.
Set E to be the empty set.2.
Randomly select an initial test case from the inputdomain and execute it. If no failure is revealed, add
this executed test case to E, otherwise quit the procedure.
3.
Construct CZ{C1,C2,.,Ck}, where C1, C2,.,Ck arerandomly selected and ChEZf.
4.
Select an element Cj from C that is furthest away fromthe elements of E, to be the next test case. If no failure is
revealed, add Cj to E, otherwise quit the procedure.
For a program with an N-dimensional input domain, the
furthest candidate test case is chosen according to the
Cartesian distance between the candidate and its nearest
neighbour in E. Cj is chosen as the next test case, if for
any r2{1,2,.,k},
minl
iZ1distðCj;EiÞRmin
l
iZ1distðCr;EiÞ
where ffiffiffiffiffiffiffiffiffiffiffiffiffiffiffiffiffiffiffiffiffiffiffiffiffiffiv
l Z jEj; distðP;QÞ ZXN
iZ1
ðpi KqiÞ2
uut ;
P Z ðp1; p2;.; pNÞ and Q Z ðq1; q2;.; qNÞ:
T.Y. Chen et al. / Information and Software Technology 46 (2004) 1001–1010 1003
5.
Repeat Steps 3 and 4 until revealing the first failure orreaching the stopping condition.
Since the number of distance computations required is of
order l2, D-ART may incur significant distance computation
when l is large.
In this paper, we follow the practice of previous
studies of ART and use the number of test cases to detect
the first failure (F-measure) as the testing effectiveness
metric.
Previous studies have shown that the F-measure of ART
may be as low as about half of the F-measure of random
testing [2,10]. However, the savings in F-measure using
ART may be outweighed by the associated distance
computations, especially when the cost of executing
tests is low. We attempt to reduce these computations by
proposing a new technique based on the notion of
mirroring.
In this paper, Section 2 describes our new method.
Section 3 outlines a simulation study and compares the new
method to existing methods. The conclusion and discussion
are presented in Section 4.
2. Mirror adaptive random testing
The main activities in software testing include:
defining testing objectives, designing test cases, generat-
ing test cases, executing test cases and analysing test
results. After defining the testing objective, a test case
selection strategy is designed to yield a set of test cases,
known as a test suite, which can collectively satisfy the
testing objective. When the process of generating a test
case for the test suite is computationally expensive, it
may not be feasible to construct a complete test suite, in
which case the testing objective cannot be satisfied
completely.
The technique of mirroring has recently been proposed
to improve the situation where it is not feasible to
construct a complete test suite [7]. With this technique, an
approximate test suite, which requires less computations
than a complete one, but attempts to satisfy the testing
objective is constructed. Mirroring has two major
components, the mirror partitioning and the mirror
function. Mirror partitioning defines how the input domain
is divided into disjoint subdomains. One of these disjoint
subdomains is designated as the source subdomain and the
others are referred to as mirror subdomains. The test case
selection process is only applied to generate test cases in
the source subdomain. The less computationally expensive
mirror functions are then applied to these generated test
cases to yield other test cases in the mirror subdomains.
D-ART is an enhanced random testing method that has
the disadvantage of high overheads when failure rates are
low, and is therefore, an ideal candidate for the
application of mirroring. The application of mirroring to
ART has been termed mirror adaptive random testing
(MART).
The procedure of MART is as follows:
1.
Partition the input domain into m disjoint subdomains.One is chosen as the source subdomain and the
remaining as mirror subdomains.
2.
Apply the D-ART procedure as described in Section 1 togenerate the next test case from the source subdomain.
Execute this test case, and quit the procedure if a failure
is detected.
3.
Apply the mirror function on the test cases generated inStep 2 to generate a test case for each mirror subdomain.
Execute the test cases in the mirror subdomains in
sequential order, and quit the procedure if a failure is
detected.
4.
Repeat Steps 2 and 3 until detecting the first failure, oruntil reaching the stopping condition.
As a pilot study, the input domain is partitioned into
disjoint subdomains with equal size and shape. Some
examples of mirror partitioning of a two-dimensional
input domain of rectangular shape are illustrated in
Fig. 2.
We denote a mirror partitioning in terms of the number
of partitions formed along each dimension of the input
domain. For the leftmost mirror partitioning in Fig. 2, the
input domain is vertically partitioned in the middle
producing two sections along the X-axis, and there is no
subdivision on the Y-axis. In this paper, we adopt the
notation X2Y1 to denote this particular mirror partition-
ing. In general, XiYj is used to denote the mirror
partitioning in which the input domain is partitioned
into i!j subdomains with i and j equal sections along the
X and Y axes, respectively.
In this paper, we use the notation {(0, 0), (u, v)} to
represent the entire input domain where (0, 0) and (u, v) are
respectively the leftmost bottom corner and the rightmost
top corner of the two-dimensional rectangle. Consider the
X2Y1 mirror partitioning in Fig. 3. After partitioning the
input domain into two equal halves along the X-axis, the two
disjoint subdomains D1 and D2, denoted by {(0, 0), (u/2, v)}
and {(u/2, 0), (u, v)}, respectively, are created. Suppose D1
is designated the source subdomain, then ART is applied to
D1 to generate test cases, and a mirror function is used to
generate corresponding test cases, known as images, in the
mirror subdomain D2.
It is essential that the mirror function be able to spread
the test cases over D2 with a similar degree of evenness
to D1. There are many potential mirror functions, one
simple approach is to linearly translate the test case from
one subdomain to another, that is, Translate (x, y) which
is defined as (xC(u/2), y). Another mirror function is
reflection with respect to the vertical line at xZu/2, that
is, Reflect(x, y) which is defined as (uKx, y). Fig. 3
illustrates the mapping of test cases by Translate and
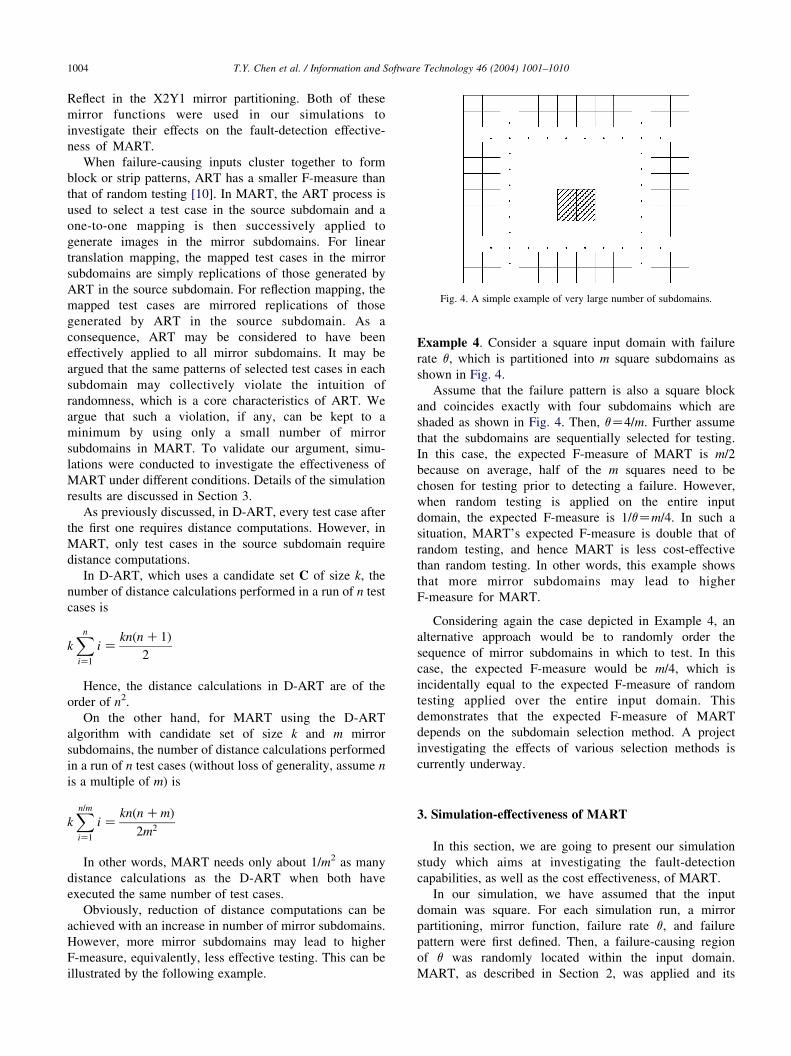
Fig. 4. A simple example of very large number of subdomains.
T.Y. Chen et al. / Information and Software Technology 46 (2004) 1001–10101004
Reflect in the X2Y1 mirror partitioning. Both of these
mirror functions were used in our simulations to
investigate their effects on the fault-detection effective-
ness of MART.
When failure-causing inputs cluster together to form
block or strip patterns, ART has a smaller F-measure than
that of random testing [10]. In MART, the ART process is
used to select a test case in the source subdomain and a
one-to-one mapping is then successively applied to
generate images in the mirror subdomains. For linear
translation mapping, the mapped test cases in the mirror
subdomains are simply replications of those generated by
ART in the source subdomain. For reflection mapping, the
mapped test cases are mirrored replications of those
generated by ART in the source subdomain. As a
consequence, ART may be considered to have been
effectively applied to all mirror subdomains. It may be
argued that the same patterns of selected test cases in each
subdomain may collectively violate the intuition of
randomness, which is a core characteristics of ART. We
argue that such a violation, if any, can be kept to a
minimum by using only a small number of mirror
subdomains in MART. To validate our argument, simu-
lations were conducted to investigate the effectiveness of
MART under different conditions. Details of the simulation
results are discussed in Section 3.
As previously discussed, in D-ART, every test case after
the first one requires distance computations. However, in
MART, only test cases in the source subdomain require
distance computations.
In D-ART, which uses a candidate set C of size k, the
number of distance calculations performed in a run of n test
cases is
kXn
iZ1
i Zknðn C1Þ
2
Hence, the distance calculations in D-ART are of the
order of n2.
On the other hand, for MART using the D-ART
algorithm with candidate set of size k and m mirror
subdomains, the number of distance calculations performed
in a run of n test cases (without loss of generality, assume n
is a multiple of m) is
kXn=miZ1
i Zknðn CmÞ
2m2
In other words, MART needs only about 1/m2 as many
distance calculations as the D-ART when both have
executed the same number of test cases.
Obviously, reduction of distance computations can be
achieved with an increase in number of mirror subdomains.
However, more mirror subdomains may lead to higher
F-measure, equivalently, less effective testing. This can be
illustrated by the following example.
Example 4. Consider a square input domain with failure
rate q, which is partitioned into m square subdomains as
shown in Fig. 4.
Assume that the failure pattern is also a square block
and coincides exactly with four subdomains which are
shaded as shown in Fig. 4. Then, qZ4/m. Further assume
that the subdomains are sequentially selected for testing.
In this case, the expected F-measure of MART is m/2
because on average, half of the m squares need to be
chosen for testing prior to detecting a failure. However,
when random testing is applied on the entire input
domain, the expected F-measure is 1/qZm/4. In such a
situation, MART’s expected F-measure is double that of
random testing, and hence MART is less cost-effective
than random testing. In other words, this example shows
that more mirror subdomains may lead to higher
F-measure for MART.
Considering again the case depicted in Example 4, an
alternative approach would be to randomly order the
sequence of mirror subdomains in which to test. In this
case, the expected F-measure would be m/4, which is
incidentally equal to the expected F-measure of random
testing applied over the entire input domain. This
demonstrates that the expected F-measure of MART
depends on the subdomain selection method. A project
investigating the effects of various selection methods is
currently underway.
3. Simulation-effectiveness of MART
In this section, we are going to present our simulation
study which aims at investigating the fault-detection
capabilities, as well as the cost effectiveness, of MART.
In our simulation, we have assumed that the input
domain was square. For each simulation run, a mirror
partitioning, mirror function, failure rate q, and failure
pattern were first defined. Then, a failure-causing region
of q was randomly located within the input domain.
MART, as described in Section 2, was applied and its
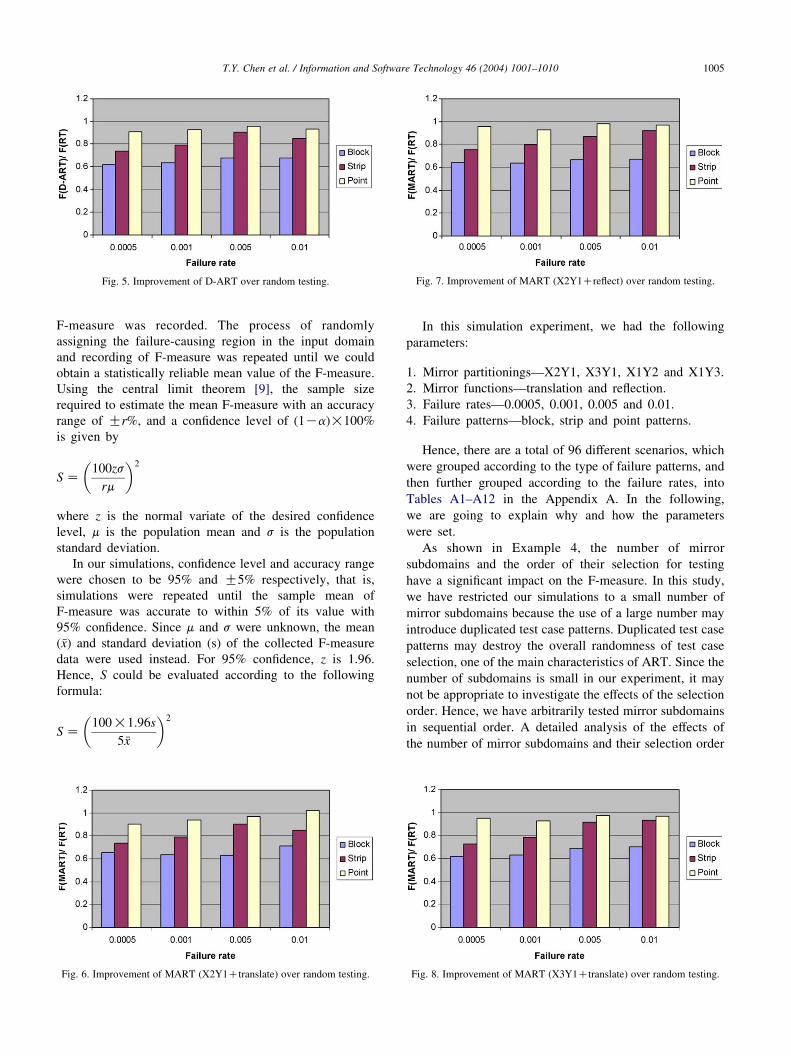
Fig. 5. Improvement of D-ART over random testing. Fig. 7. Improvement of MART (X2Y1Creflect) over random testing.
T.Y. Chen et al. / Information and Software Technology 46 (2004) 1001–1010 1005
F-measure was recorded. The process of randomly
assigning the failure-causing region in the input domain
and recording of F-measure was repeated until we could
obtain a statistically reliable mean value of the F-measure.
Using the central limit theorem [9], the sample size
required to estimate the mean F-measure with an accuracy
range of Gr%, and a confidence level of (1Ka)!100%
is given by
S Z100zs
rm
� �2
where z is the normal variate of the desired confidence
level, m is the population mean and s is the population
standard deviation.
In our simulations, confidence level and accuracy range
were chosen to be 95% and G5% respectively, that is,
simulations were repeated until the sample mean of
F-measure was accurate to within 5% of its value with
95% confidence. Since m and s were unknown, the mean
ð �xÞ and standard deviation (s) of the collected F-measure
data were used instead. For 95% confidence, z is 1.96.
Hence, S could be evaluated according to the following
formula:
S Z100!1:96s
5 �x
� �2
Fig. 6. Improvement of MART (X2Y1Ctranslate) over random testing.
In this simulation experiment, we had the following
parameters:
1.
Fi
Mirror partitionings—X2Y1, X3Y1, X1Y2 and X1Y3.
2.
Mirror functions—translation and reflection.3.
Failure rates—0.0005, 0.001, 0.005 and 0.01.4.
Failure patterns—block, strip and point patterns.Hence, there are a total of 96 different scenarios, which
were grouped according to the type of failure patterns, and
then further grouped according to the failure rates, into
Tables A1–A12 in the Appendix A. In the following,
we are going to explain why and how the parameters
were set.
As shown in Example 4, the number of mirror
subdomains and the order of their selection for testing
have a significant impact on the F-measure. In this study,
we have restricted our simulations to a small number of
mirror subdomains because the use of a large number may
introduce duplicated test case patterns. Duplicated test case
patterns may destroy the overall randomness of test case
selection, one of the main characteristics of ART. Since the
number of subdomains is small in our experiment, it may
not be appropriate to investigate the effects of the selection
order. Hence, we have arbitrarily tested mirror subdomains
in sequential order. A detailed analysis of the effects of
the number of mirror subdomains and their selection order
g. 8. Improvement of MART (X3Y1Ctranslate) over random testing.
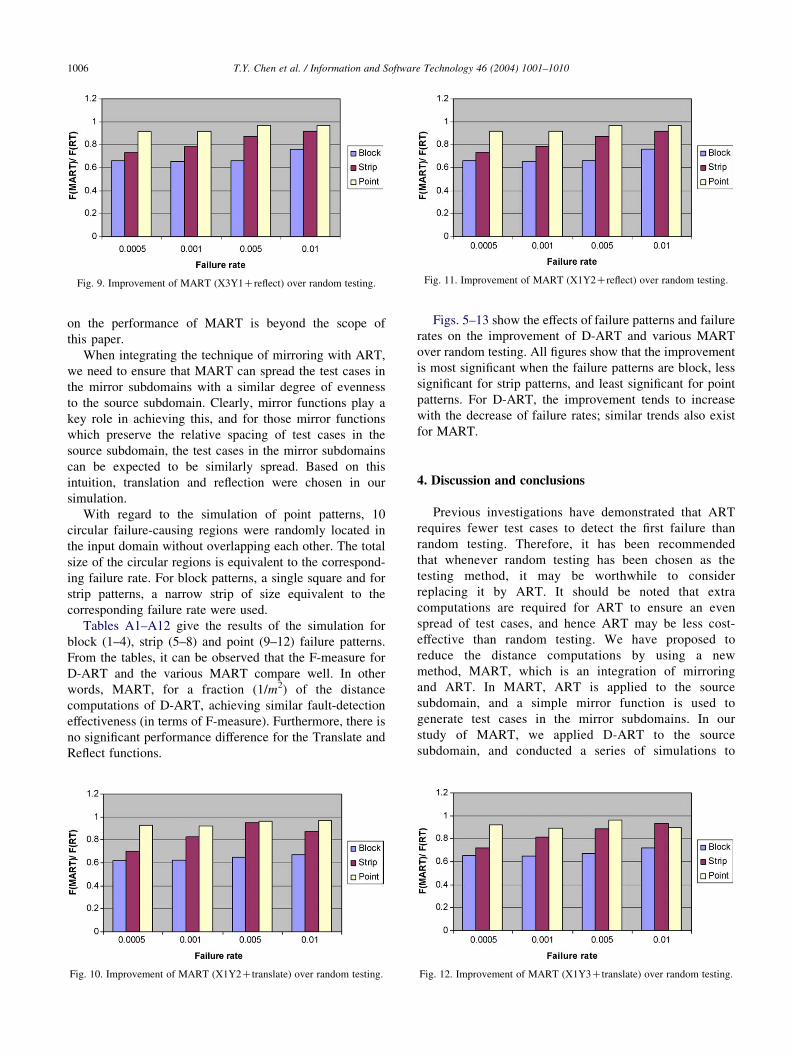
Fig. 11. Improvement of MART (X1Y2Creflect) over random testing.Fig. 9. Improvement of MART (X3Y1Creflect) over random testing.
T.Y. Chen et al. / Information and Software Technology 46 (2004) 1001–10101006
on the performance of MART is beyond the scope of
this paper.
When integrating the technique of mirroring with ART,
we need to ensure that MART can spread the test cases in
the mirror subdomains with a similar degree of evenness
to the source subdomain. Clearly, mirror functions play a
key role in achieving this, and for those mirror functions
which preserve the relative spacing of test cases in the
source subdomain, the test cases in the mirror subdomains
can be expected to be similarly spread. Based on this
intuition, translation and reflection were chosen in our
simulation.
With regard to the simulation of point patterns, 10
circular failure-causing regions were randomly located in
the input domain without overlapping each other. The total
size of the circular regions is equivalent to the correspond-
ing failure rate. For block patterns, a single square and for
strip patterns, a narrow strip of size equivalent to the
corresponding failure rate were used.
Tables A1–A12 give the results of the simulation for
block (1–4), strip (5–8) and point (9–12) failure patterns.
From the tables, it can be observed that the F-measure for
D-ART and the various MART compare well. In other
words, MART, for a fraction (1/m2) of the distance
computations of D-ART, achieving similar fault-detection
effectiveness (in terms of F-measure). Furthermore, there is
no significant performance difference for the Translate and
Reflect functions.
Fig. 10. Improvement of MART (X1Y2Ctranslate) over random testing.
Figs. 5–13 show the effects of failure patterns and failure
rates on the improvement of D-ART and various MART
over random testing. All figures show that the improvement
is most significant when the failure patterns are block, less
significant for strip patterns, and least significant for point
patterns. For D-ART, the improvement tends to increase
with the decrease of failure rates; similar trends also exist
for MART.
4. Discussion and conclusions
Previous investigations have demonstrated that ART
requires fewer test cases to detect the first failure than
random testing. Therefore, it has been recommended
that whenever random testing has been chosen as the
testing method, it may be worthwhile to consider
replacing it by ART. It should be noted that extra
computations are required for ART to ensure an even
spread of test cases, and hence ART may be less cost-
effective than random testing. We have proposed to
reduce the distance computations by using a new
method, MART, which is an integration of mirroring
and ART. In MART, ART is applied to the source
subdomain, and a simple mirror function is used to
generate test cases in the mirror subdomains. In our
study of MART, we applied D-ART to the source
subdomain, and conducted a series of simulations to
Fig. 12. Improvement of MART (X1Y3Ctranslate) over random testing.
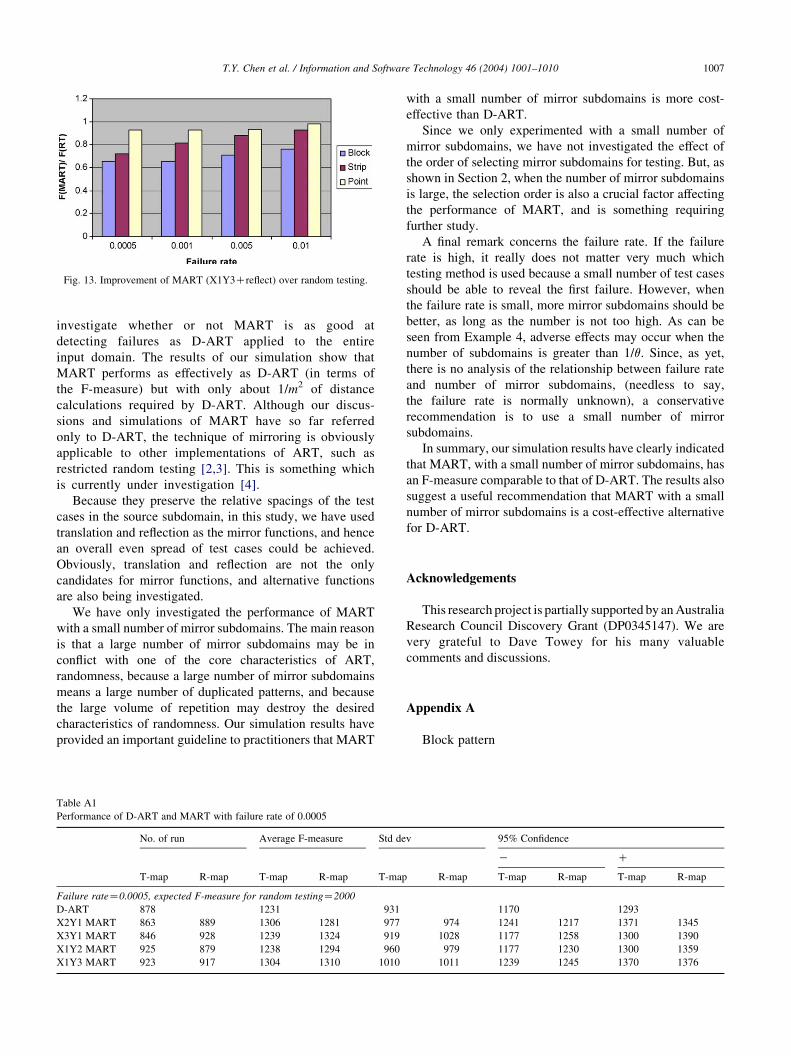
Fig. 13. Improvement of MART (X1Y3Creflect) over random testing.
T.Y. Chen et al. / Information and Software Technology 46 (2004) 1001–1010 1007
investigate whether or not MART is as good at
detecting failures as D-ART applied to the entire
input domain. The results of our simulation show that
MART performs as effectively as D-ART (in terms of
the F-measure) but with only about 1/m2 of distance
calculations required by D-ART. Although our discus-
sions and simulations of MART have so far referred
only to D-ART, the technique of mirroring is obviously
applicable to other implementations of ART, such as
restricted random testing [2,3]. This is something which
is currently under investigation [4].
Because they preserve the relative spacings of the test
cases in the source subdomain, in this study, we have used
translation and reflection as the mirror functions, and hence
an overall even spread of test cases could be achieved.
Obviously, translation and reflection are not the only
candidates for mirror functions, and alternative functions
are also being investigated.
We have only investigated the performance of MART
with a small number of mirror subdomains. The main reason
is that a large number of mirror subdomains may be in
conflict with one of the core characteristics of ART,
randomness, because a large number of mirror subdomains
means a large number of duplicated patterns, and because
the large volume of repetition may destroy the desired
characteristics of randomness. Our simulation results have
provided an important guideline to practitioners that MART
Table A1
Performance of D-ART and MART with failure rate of 0.0005
No. of run Average F-measure Std de
T-map R-map T-map R-map T-map
Failure rateZ0.0005, expected F-measure for random testingZ2000
D-ART 878 1231 931
X2Y1 MART 863 889 1306 1281 977
X3Y1 MART 846 928 1239 1324 919
X1Y2 MART 925 879 1238 1294 960
X1Y3 MART 923 917 1304 1310 1010
with a small number of mirror subdomains is more cost-
effective than D-ART.
Since we only experimented with a small number of
mirror subdomains, we have not investigated the effect of
the order of selecting mirror subdomains for testing. But, as
shown in Section 2, when the number of mirror subdomains
is large, the selection order is also a crucial factor affecting
the performance of MART, and is something requiring
further study.
A final remark concerns the failure rate. If the failure
rate is high, it really does not matter very much which
testing method is used because a small number of test cases
should be able to reveal the first failure. However, when
the failure rate is small, more mirror subdomains should be
better, as long as the number is not too high. As can be
seen from Example 4, adverse effects may occur when the
number of subdomains is greater than 1/q. Since, as yet,
there is no analysis of the relationship between failure rate
and number of mirror subdomains, (needless to say,
the failure rate is normally unknown), a conservative
recommendation is to use a small number of mirror
subdomains.
In summary, our simulation results have clearly indicated
that MART, with a small number of mirror subdomains, has
an F-measure comparable to that of D-ART. The results also
suggest a useful recommendation that MART with a small
number of mirror subdomains is a cost-effective alternative
for D-ART.
Acknowledgements
This research project is partially supported by an Australia
Research Council Discovery Grant (DP0345147). We are
very grateful to Dave Towey for his many valuable
comments and discussions.
Appendix A
Block pattern
v 95% Confidence
K C
R-map T-map R-map T-map R-map
1170 1293
974 1241 1217 1371 1345
1028 1177 1258 1300 1390
979 1177 1230 1300 1359
1011 1239 1245 1370 1376
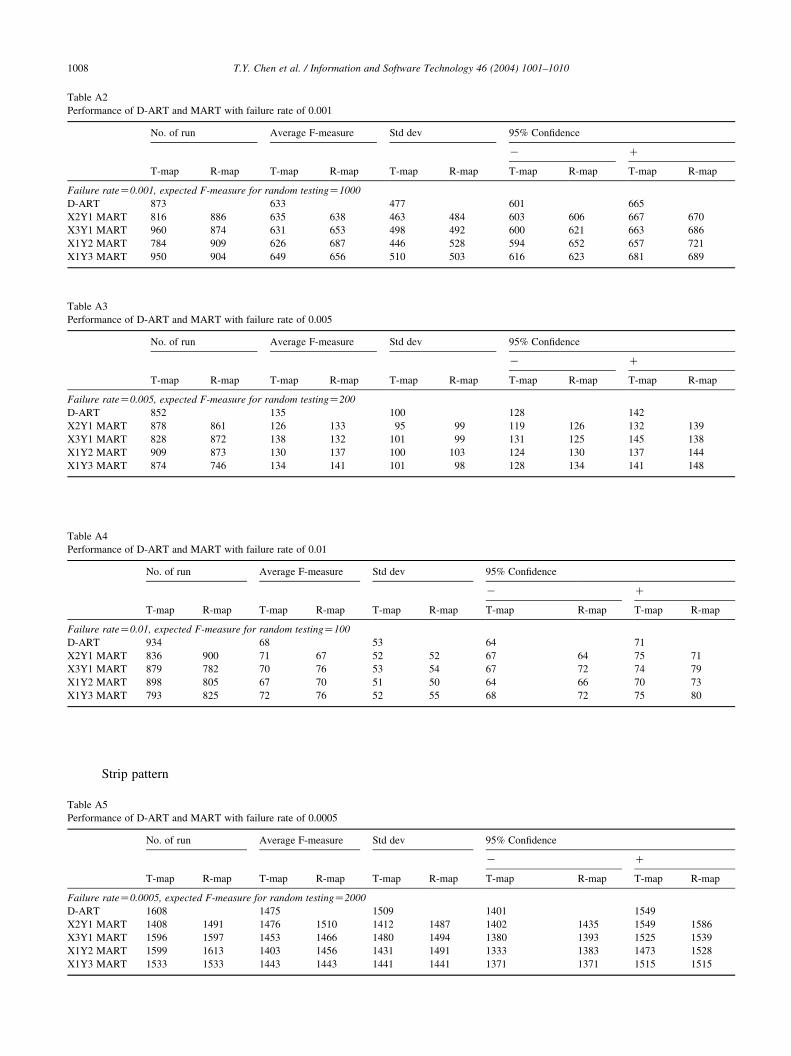
Table A2
Performance of D-ART and MART with failure rate of 0.001
No. of run Average F-measure Std dev 95% Confidence
K C
T-map R-map T-map R-map T-map R-map T-map R-map T-map R-map
Failure rateZ0.001, expected F-measure for random testingZ1000
D-ART 873 633 477 601 665
X2Y1 MART 816 886 635 638 463 484 603 606 667 670
X3Y1 MART 960 874 631 653 498 492 600 621 663 686
X1Y2 MART 784 909 626 687 446 528 594 652 657 721
X1Y3 MART 950 904 649 656 510 503 616 623 681 689
Table A3
Performance of D-ART and MART with failure rate of 0.005
No. of run Average F-measure Std dev 95% Confidence
K C
T-map R-map T-map R-map T-map R-map T-map R-map T-map R-map
Failure rateZ0.005, expected F-measure for random testingZ200
D-ART 852 135 100 128 142
X2Y1 MART 878 861 126 133 95 99 119 126 132 139
X3Y1 MART 828 872 138 132 101 99 131 125 145 138
X1Y2 MART 909 873 130 137 100 103 124 130 137 144
X1Y3 MART 874 746 134 141 101 98 128 134 141 148
Table A4
Performance of D-ART and MART with failure rate of 0.01
No. of run Average F-measure Std dev 95% Confidence
K C
T-map R-map T-map R-map T-map R-map T-map R-map T-map R-map
Failure rateZ0.01, expected F-measure for random testingZ100
D-ART 934 68 53 64 71
X2Y1 MART 836 900 71 67 52 52 67 64 75 71
X3Y1 MART 879 782 70 76 53 54 67 72 74 79
X1Y2 MART 898 805 67 70 51 50 64 66 70 73
X1Y3 MART 793 825 72 76 52 55 68 72 75 80
T.Y. Chen et al. / Information and Software Technology 46 (2004) 1001–10101008
Strip pattern
Table A5
Performance of D-ART and MART with failure rate of 0.0005
No. of run Average F-measure Std dev
T-map R-map T-map R-map T-map
Failure rateZ0.0005, expected F-measure for random testingZ2000
D-ART 1608 1475 1509
X2Y1 MART 1408 1491 1476 1510 1412
X3Y1 MART 1596 1597 1453 1466 1480
X1Y2 MART 1599 1613 1403 1456 1431
X1Y3 MART 1533 1533 1443 1443 1441
95% Confidence
K C
R-map T-map R-map T-map R-map
1401 1549
1487 1402 1435 1549 1586
1494 1380 1393 1525 1539
1491 1333 1383 1473 1528
1441 1371 1371 1515 1515
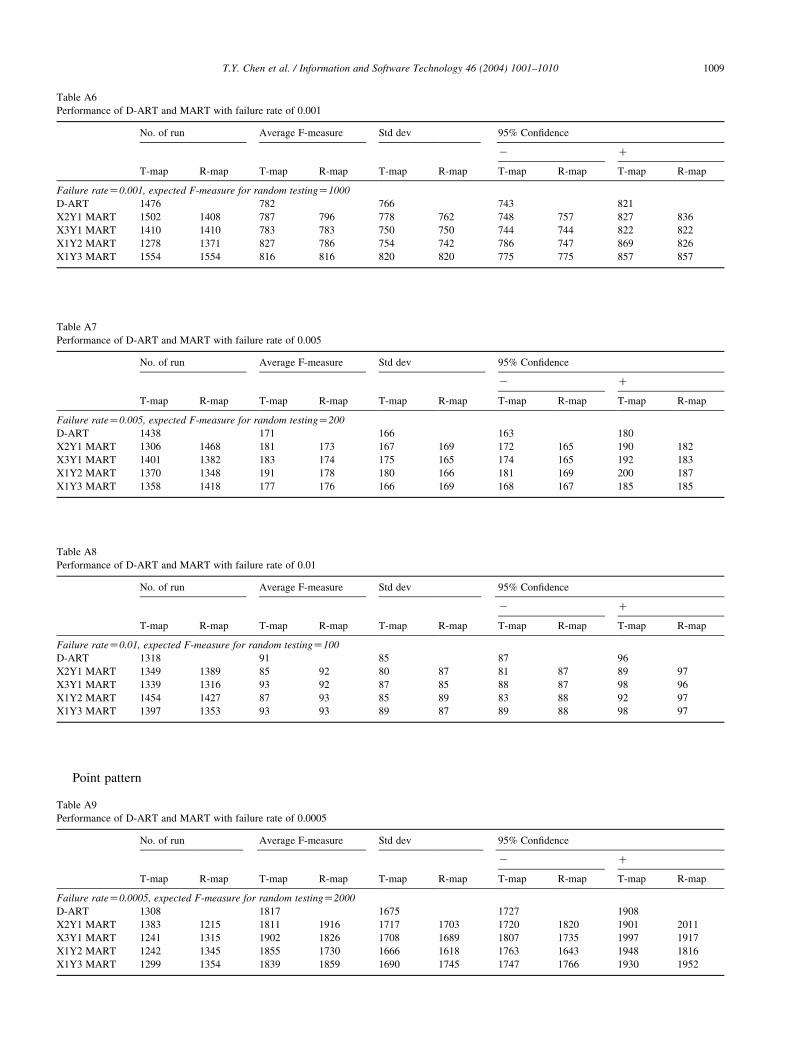
Table A7
Performance of D-ART and MART with failure rate of 0.005
No. of run Average F-measure Std dev 95% Confidence
K C
T-map R-map T-map R-map T-map R-map T-map R-map T-map R-map
Failure rateZ0.005, expected F-measure for random testingZ200
D-ART 1438 171 166 163 180
X2Y1 MART 1306 1468 181 173 167 169 172 165 190 182
X3Y1 MART 1401 1382 183 174 175 165 174 165 192 183
X1Y2 MART 1370 1348 191 178 180 166 181 169 200 187
X1Y3 MART 1358 1418 177 176 166 169 168 167 185 185
Table A8
Performance of D-ART and MART with failure rate of 0.01
No. of run Average F-measure Std dev 95% Confidence
K C
T-map R-map T-map R-map T-map R-map T-map R-map T-map R-map
Failure rateZ0.01, expected F-measure for random testingZ100
D-ART 1318 91 85 87 96
X2Y1 MART 1349 1389 85 92 80 87 81 87 89 97
X3Y1 MART 1339 1316 93 92 87 85 88 87 98 96
X1Y2 MART 1454 1427 87 93 85 89 83 88 92 97
X1Y3 MART 1397 1353 93 93 89 87 89 88 98 97
Table A6
Performance of D-ART and MART with failure rate of 0.001
No. of run Average F-measure Std dev 95% Confidence
K C
T-map R-map T-map R-map T-map R-map T-map R-map T-map R-map
Failure rateZ0.001, expected F-measure for random testingZ1000
D-ART 1476 782 766 743 821
X2Y1 MART 1502 1408 787 796 778 762 748 757 827 836
X3Y1 MART 1410 1410 783 783 750 750 744 744 822 822
X1Y2 MART 1278 1371 827 786 754 742 786 747 869 826
X1Y3 MART 1554 1554 816 816 820 820 775 775 857 857
T.Y. Chen et al. / Information and Software Technology 46 (2004) 1001–1010 1009
Point pattern
Table A9
Performance of D-ART and MART with failure rate of 0.0005
No. of run Average F-measure Std de
T-map R-map T-map R-map T-map
Failure rateZ0.0005, expected F-measure for random testingZ2000
D-ART 1308 1817 1675
X2Y1 MART 1383 1215 1811 1916 1717
X3Y1 MART 1241 1315 1902 1826 1708
X1Y2 MART 1242 1345 1855 1730 1666
X1Y3 MART 1299 1354 1839 1859 1690
v 95% Confidence
K C
R-map T-map R-map T-map R-map
1727 1908
1703 1720 1820 1901 2011
1689 1807 1735 1997 1917
1618 1763 1643 1948 1816
1745 1747 1766 1930 1952
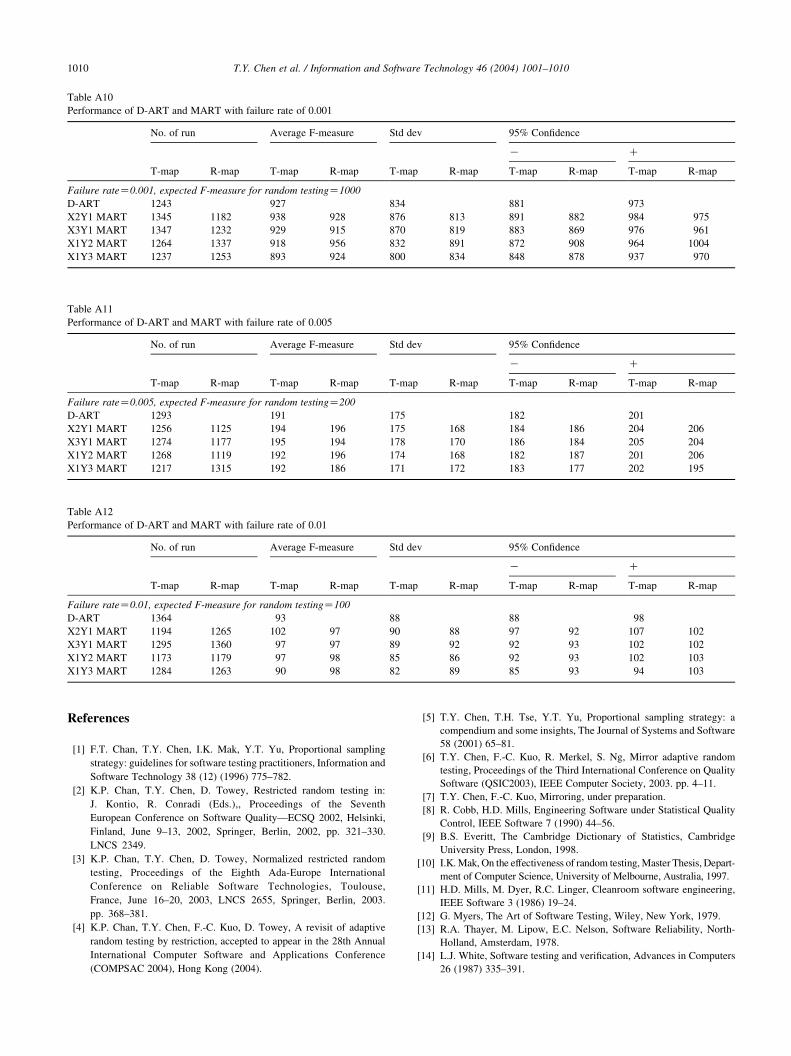
Table A12
Performance of D-ART and MART with failure rate of 0.01
No. of run Average F-measure Std dev 95% Confidence
K C
T-map R-map T-map R-map T-map R-map T-map R-map T-map R-map
Failure rateZ0.01, expected F-measure for random testingZ100
D-ART 1364 93 88 88 98
X2Y1 MART 1194 1265 102 97 90 88 97 92 107 102
X3Y1 MART 1295 1360 97 97 89 92 92 93 102 102
X1Y2 MART 1173 1179 97 98 85 86 92 93 102 103
X1Y3 MART 1284 1263 90 98 82 89 85 93 94 103
Table A10
Performance of D-ART and MART with failure rate of 0.001
No. of run Average F-measure Std dev 95% Confidence
K C
T-map R-map T-map R-map T-map R-map T-map R-map T-map R-map
Failure rateZ0.001, expected F-measure for random testingZ1000
D-ART 1243 927 834 881 973
X2Y1 MART 1345 1182 938 928 876 813 891 882 984 975
X3Y1 MART 1347 1232 929 915 870 819 883 869 976 961
X1Y2 MART 1264 1337 918 956 832 891 872 908 964 1004
X1Y3 MART 1237 1253 893 924 800 834 848 878 937 970
Table A11
Performance of D-ART and MART with failure rate of 0.005
No. of run Average F-measure Std dev 95% Confidence
K C
T-map R-map T-map R-map T-map R-map T-map R-map T-map R-map
Failure rateZ0.005, expected F-measure for random testingZ200
D-ART 1293 191 175 182 201
X2Y1 MART 1256 1125 194 196 175 168 184 186 204 206
X3Y1 MART 1274 1177 195 194 178 170 186 184 205 204
X1Y2 MART 1268 1119 192 196 174 168 182 187 201 206
X1Y3 MART 1217 1315 192 186 171 172 183 177 202 195
T.Y. Chen et al. / Information and Software Technology 46 (2004) 1001–10101010
References
[1] F.T. Chan, T.Y. Chen, I.K. Mak, Y.T. Yu, Proportional sampling
strategy: guidelines for software testing practitioners, Information and
Software Technology 38 (12) (1996) 775–782.
[2] K.P. Chan, T.Y. Chen, D. Towey, Restricted random testing in:
J. Kontio, R. Conradi (Eds.),, Proceedings of the Seventh
European Conference on Software Quality—ECSQ 2002, Helsinki,
Finland, June 9–13, 2002, Springer, Berlin, 2002, pp. 321–330.
LNCS 2349.
[3] K.P. Chan, T.Y. Chen, D. Towey, Normalized restricted random
testing, Proceedings of the Eighth Ada-Europe International
Conference on Reliable Software Technologies, Toulouse,
France, June 16–20, 2003, LNCS 2655, Springer, Berlin, 2003.
pp. 368–381.
[4] K.P. Chan, T.Y. Chen, F.-C. Kuo, D. Towey, A revisit of adaptive
random testing by restriction, accepted to appear in the 28th Annual
International Computer Software and Applications Conference
(COMPSAC 2004), Hong Kong (2004).
[5] T.Y. Chen, T.H. Tse, Y.T. Yu, Proportional sampling strategy: a
compendium and some insights, The Journal of Systems and Software
58 (2001) 65–81.
[6] T.Y. Chen, F.-C. Kuo, R. Merkel, S. Ng, Mirror adaptive random
testing, Proceedings of the Third International Conference on Quality
Software (QSIC2003), IEEE Computer Society, 2003. pp. 4–11.
[7] T.Y. Chen, F.-C. Kuo, Mirroring, under preparation.
[8] R. Cobb, H.D. Mills, Engineering Software under Statistical Quality
Control, IEEE Software 7 (1990) 44–56.
[9] B.S. Everitt, The Cambridge Dictionary of Statistics, Cambridge
University Press, London, 1998.
[10] I.K. Mak, On the effectiveness of random testing, Master Thesis, Depart-
ment of Computer Science, University of Melbourne, Australia, 1997.
[11] H.D. Mills, M. Dyer, R.C. Linger, Cleanroom software engineering,
IEEE Software 3 (1986) 19–24.
[12] G. Myers, The Art of Software Testing, Wiley, New York, 1979.
[13] R.A. Thayer, M. Lipow, E.C. Nelson, Software Reliability, North-
Holland, Amsterdam, 1978.
[14] L.J. White, Software testing and verification, Advances in Computers
26 (1987) 335–391.