Embed Size (px)
Citation preview

Catherine E. McCarthyHathaway Brown School, Shaker Heights, Ohio
Bruce A. BanksAlphaport, Inc., Cleveland, Ohio
Kim K. de GrohGlenn Research Center, Cleveland, Ohio
MISSE 2 PEACE Polymers Experiment AtomicOxygen Erosion Yield Error Analysis
NASA/TM—2010-216903
November 2010
https://ntrs.nasa.gov/search.jsp?R=20100040422 2018-07-11T14:32:56+00:00Z

NASA STI Program . . . in Profi le
Since its founding, NASA has been dedicated to the advancement of aeronautics and space science. The NASA Scientifi c and Technical Information (STI) program plays a key part in helping NASA maintain this important role.
The NASA STI Program operates under the auspices of the Agency Chief Information Offi cer. It collects, organizes, provides for archiving, and disseminates NASA’s STI. The NASA STI program provides access to the NASA Aeronautics and Space Database and its public interface, the NASA Technical Reports Server, thus providing one of the largest collections of aeronautical and space science STI in the world. Results are published in both non-NASA channels and by NASA in the NASA STI Report Series, which includes the following report types: • TECHNICAL PUBLICATION. Reports of
completed research or a major signifi cant phase of research that present the results of NASA programs and include extensive data or theoretical analysis. Includes compilations of signifi cant scientifi c and technical data and information deemed to be of continuing reference value. NASA counterpart of peer-reviewed formal professional papers but has less stringent limitations on manuscript length and extent of graphic presentations.
• TECHNICAL MEMORANDUM. Scientifi c
and technical fi ndings that are preliminary or of specialized interest, e.g., quick release reports, working papers, and bibliographies that contain minimal annotation. Does not contain extensive analysis.
• CONTRACTOR REPORT. Scientifi c and
technical fi ndings by NASA-sponsored contractors and grantees.
• CONFERENCE PUBLICATION. Collected papers from scientifi c and technical conferences, symposia, seminars, or other meetings sponsored or cosponsored by NASA.
• SPECIAL PUBLICATION. Scientifi c,
technical, or historical information from NASA programs, projects, and missions, often concerned with subjects having substantial public interest.
• TECHNICAL TRANSLATION. English-
language translations of foreign scientifi c and technical material pertinent to NASA’s mission.
Specialized services also include creating custom thesauri, building customized databases, organizing and publishing research results.
For more information about the NASA STI program, see the following:
• Access the NASA STI program home page at http://www.sti.nasa.gov
• E-mail your question via the Internet to help@
sti.nasa.gov • Fax your question to the NASA STI Help Desk
at 443–757–5803 • Telephone the NASA STI Help Desk at 443–757–5802 • Write to:
NASA Center for AeroSpace Information (CASI) 7115 Standard Drive Hanover, MD 21076–1320

Catherine E. McCarthyHathaway Brown School, Shaker Heights, Ohio
Bruce A. BanksAlphaport, Inc., Cleveland, Ohio
Kim K. de GrohGlenn Research Center, Cleveland, Ohio
MISSE 2 PEACE Polymers Experiment AtomicOxygen Erosion Yield Error Analysis
NASA/TM—2010-216903
November 2010
National Aeronautics andSpace Administration
Glenn Research CenterCleveland, Ohio 44135

Available from
NASA Center for Aerospace Information7115 Standard DriveHanover, MD 21076–1320
National Technical Information Service5301 Shawnee Road
Alexandria, VA 22312
Available electronically at http://gltrs.grc.nasa.gov
Trade names and trademarks are used in this report for identifi cation only. Their usage does not constitute an offi cial endorsement, either expressed or implied, by the National Aeronautics and
Space Administration.
Level of Review: This material has been technically reviewed by technical management.
Acknowledgments
We would like to acknowledge and thank former students Jon Gummow of Ohio Aerospace Institute, Doug Wright of Cleveland State University, and PEACE Team students for making and characterizing fl ight and back-up samples. We gratefully acknowledge Patty Hunt of Hathaway Brown School for making it possible for the students to be a part of this project. Finally, we would like to express our sincere appreciation to the MISSE Project Offi ce at NASA Langley Research Center and Gary Pippin, formerly of Boeing, for providing the unique opportunity to be a part of the MISSE program.
NASA/TM—2010-216903 1
MISSE 2 PEACE Polymers Experiment Atomic Oxygen Erosion Yield Error Analysis
Catherine E. McCarthy
Hathaway Brown School Shaker Heights, Ohio 44122
Bruce A. Banks Alphaport, Inc.
Cleveland, Ohio 44135
Kim K. de Groh National Aeronautics and Space Administration
Glenn Research Center Cleveland, Ohio 44135
ABSTRACT
Atomic oxygen erosion of polymers in low Earth orbit (LEO) poses a serious threat to
spacecraft performance and durability. To address this, 40 different polymer samples and a sample of pyrolytic graphite, collectively called the PEACE (Polymer Erosion and Contamination Experiment) Polymers, were exposed to the LEO space environment on the exterior of the International Space Station (ISS) for nearly four years as part of the Materials International Space Station Experiment 1 & 2 (MISSE 1 & 2). The purpose of the PEACE Polymers experiment was to obtain accurate mass loss measurements in space to combine with ground measurements in order to accurately calculate the atomic oxygen erosion yields of a wide variety of polymeric materials exposed to the LEO space environment for a long period of time. Error calculations were performed in order to determine the accuracy of the mass measurements and therefore of the erosion yield values. The standard deviation, or error, of each factor was incorporated into the fractional uncertainty of the erosion yield for each of three different situations, depending on the post-flight weighing procedure. The resulting error calculations showed the erosion yield values to be very accurate, with an average error of ±3.30 percent. 1. INTRODUCTION
1.1 MISSE 2 Polymer Erosion and Contamination Experiment (PEACE) Polymers
Spacecraft in the low Earth orbit (LEO) environment (between 200 and 2000 km above the
surface of the Earth) endure extremely harsh conditions, including exposure to ultraviolet, x-ray, and charged particle radiation; micrometeoroids and debris; and atomic oxygen, diatomic oxygen photodissociated by short wavelength ultraviolet radiation from the sun. Atomic oxygen erosion of polymers in LEO poses a serious threat to spacecraft performance and durability. Therefore in order to design durable high-performance spacecraft systems, it is essential to understand the atomic oxygen erosion yield (E, the volume loss per incident oxygen atom, in cm3/atom) of polymers being considered for spacecraft applications.

NASA/TM—2010-216903 2
Figure 1. MISSE 2 PEC 2 Tray 1, containing the PEACE Polymers experiment attached to the ISS,
exposed to space from August 16, 2001 to July 30, 2005.
Forty polymer samples (including two Kapton H polyimide atomic oxygen fluence witness
samples) and pyrolytic graphite, collectively called the PEACE (Polymer Erosion and Contamination Experiment) Polymers, were exposed to the LEO space environment on the exterior of the ISS as part of the Materials International Space Station Experiment 1 & 2 (MISSE 1 & 2).1-3 The PEACE Polymers experiment was flown in MISSE Passive Experiment Container 2 (PEC 2) on the ram-facing tray (Tray 1) in sample tray E5. MISSE PEC 2 (MISSE 2) was attached to the exterior of the ISS Quest Airlock, as shown in Figure 1. The one-inch-diameter samples encountered atomic oxygen and solar and charged particle radiation during a 3.95-year exposure to the LEO environment from August 16, 2001 to July 30, 2005, when the experiment was successfully retrieved via spacewalk during Discovery’s STS-114 Return to Flight mission.
The purpose of the MISSE 2 PEACE Polymers experiment was to obtain accurate mass loss
measurements of passive samples exposed to atomic oxygen in space to combine with ground measurements in order to accurately calculate the atomic oxygen erosion yield of a wide variety of polymeric materials exposed to the LEO space environment for a long period of time.1-3 The data obtained could then help explain the dependence of erosion yield upon polymer chemistry for predictive tool development. Figures 2 and 3 show pre-flight and post-flight photos, respectively, of the MISSE 2 PEACE Polymers experiment tray containing the 41 samples.
MISSE 2

NASA/TM—2010-216903 3
Figure 2. Pre-flight photograph of the MISSE 2 PEACE Polymers experiment. Abbreviations are defined
in Table 1.
Figure 3. Post-flight photograph of the MISSE 2 PEACE Polymers experiment.
The 40 different materials (41 samples) tested included those commonly used for spacecraft
applications, such as Teflon FEP, as well as more recently developed polymers, such as high temperature polyimide PMR-15 (polymerization of monomer reactants), and pyrolytic graphite, which was included for more diverse chemistry.
The atomic oxygen fluence for the experiment tray was found to be 8.43 x 10²¹ atoms/cm2
based on the average of the two fluence witness samples.1-3 The total equivalent sun hours (ESH) for the E5 tray was estimated to be 6,300 ESH.1-4 The base-plate thermal cycling temperature range for MISSE 2 was nominally between +40°C and -30°C, with occasional short-term excursions to more extreme temperatures.*,4 Results of x-ray photoelectron spectroscopy (XPS) contamination analysis of two MISSE 2 sapphire witness samples in sample tray E6 (located next to tray E5) indicated the experiment had received very little contamination; the sapphire witness samples sustained only extremely thin silica contaminant layers, one 1.3 nm thick and one 1.4 nm thick.5
* Details of atomic oxygen fluence calculations, the specific polymers flown, flight sample fabrication, solar and
ionizing radiation environmental exposure, and pre-flight and post-flight characterization techniques are presented in Refs. 1-3. Additional details on environmental exposure are provided by Pippin in Ref. 4.

NASA/TM—2010-216903 4
In any experiment, it is critical to determine the accuracy of the data obtained. To address this, the error in each polymer’s experimental erosion yield value was calculated using equations for fractional uncertainty derived from the equation used to find erosion yield. 1.2 Erosion Yield
The equation to find the erosion yield (E) of a polymer calculates the volume lost per
incident atomic oxygen atom:
4 · ∆· · ·
where ΔM is mass loss (g), ρ is the polymer density (g/cm3), and D is the exposed diameter of the polymer (cm). F is the atomic oxygen fluence (atoms/cm2), which is how many atoms of atomic oxygen came into contact with the polymer during the period of exposure. Two Kapton H witness samples were used to calculate the fluence because Kapton H has a well-established erosion yield in LEO, 3.0 x 10⁻²⁴ cm3/atom.6 The atomic oxygen fluence for the samples can be calculated by solving Equation 1 for F and using the Kapton H mass loss value and density. The fluence was based on the frontal exposed area of each sample.†
1.3 Fractional Uncertainty
Fractional uncertainty, also called relative uncertainty or percent error, is a way of
quantifying the error of a data value. In this investigation the fractional uncertainty represents the fractional standard deviation of the values and is calculated by dividing the standard deviation of the value by the value itself. The general equation for fractional uncertainty in atomic oxygen erosion yield is
1·
i·
where E is atomic oxygen erosion yield and xi is the ith variable in the equation for erosion yield. The complete equation derivations are explained in Section 4.
2. MATERIALS
A list of the different materials exposed to atomic oxygen on the MISSE 2 PEACE polymer experiment is given in Table 1, along with the material abbreviation, trade name(s), and material thickness. † It is believed that the 45° slanted edges of the aluminum sample holders contributed to a slight increase in fluence
around the perimeters of the samples, causing some to erode through only around the edge; however, since this was the case for all of the samples, no further calculations needed to be done to correct for this anomalous effect.
(1)
(2)

NASA/TM—2010-216903 5
Table 1. Materials Included in the MISSE 2 PEACE Polymers Experiment.
Material Abbrev. Trade Name(s)Thickness
(mils)Acrylonitrile butadiene styrene ABS Cycolac 5
Allyl diglycol carbonate ADC CR-39, Homalite H-911 31
Amorphous fluoropolymer AF Teflon AF 1601 2
Cellulose acetate CA Clarifoil, Tenite Acetate, Dexel 2
Chlorotrifluoroethylene CTFE Neoflon CTFE M-300, Kel-F 5
Crystalline polyvinylfluoride with white pigment PVF-W White Tedlar TWH10BS3 1
Epoxide or epoxy EP Hysol EA 956 88-92
Ethylene-chlorotrifluoroethylene ECTFE Halar 3
Ethylene-tetrafluoroethylene copolymer ETFE Tefzel ZM 3
Fluorinated ethylene propylene FEP Teflon FEP (round robin) 2
High temperature polyimide resin PI PMR-15 12-14
Perfluoroalkoxy copolymer resin PFA Teflon PFA CLP (200 CLP) 2
Poly-(p-phenylene terephthalamide) PPD-T Kevlar 29 fabric 2.2
Poly(p-phenylene-2 6-benzobisoxazole) PBO Balanced biaxial film 1
Polyacrylonitrile PAN Barex 210 2
Polyamide 6 or Nylon 6 PA 6 Akulon K, Ultramid B 2
Polyamide 66 or Nylon 66 PA 66 Maranyl A, Zytel 2
Polybenzimidazole PBI Celazole PBI 2
Polybutylene terephthalate PBT GE Valox 357 3
Polycarbonate PC PEEREX 61 (P61) 10
Polyetheretherketone PEEK Victrex PEEK 450 3
Polyetherimide PEI Ultem 1000 10
Polyethylene PE 2
Polyethylene oxide PEO Alkox E-30 29
Polyethylene terephthalate PET Mylar A-200 2
Polyimide PI LaRC CP1 (CP1-300) 3
Polyimide (BPDA) PI Upilex-S 1
Polyimide (PMDA), sample 1 PI Kapton H 5
Polyimide (PMDA), sample 2 PI Kapton H 5
Polyimide (PMDA) PI Kapton HN 5
Polymethyl methacrylate PMMA Plexiglas, Lucite, Acrylite (Impact Mod.) 2
Polyoxymethylene; acetal; polyformaldehyde POM Delrin (natural) 10
Polyphenylene isophthalate PPPA Nomex Aramid Paper Type 410 2
Polypropylene PP Polypropylene Type C28 20
Polystyrene PS Trycite 1000, Trycite Dew 2
Polysulphone PSU Thermolux P1700-NT11, Udel P-1700 2
Polytetrafluoroethylene PTFE Chemfilm DF 100 2
Polyurethane PU Dureflex PS 8010 2
Polyvinyl fluoride PVF Tedlar TTR10SG3 1
Polyvinylidene fluoride PVDF Kynar 740 3
Pyrolytic graphite PG 80
NASA/TM—2010-216903 6
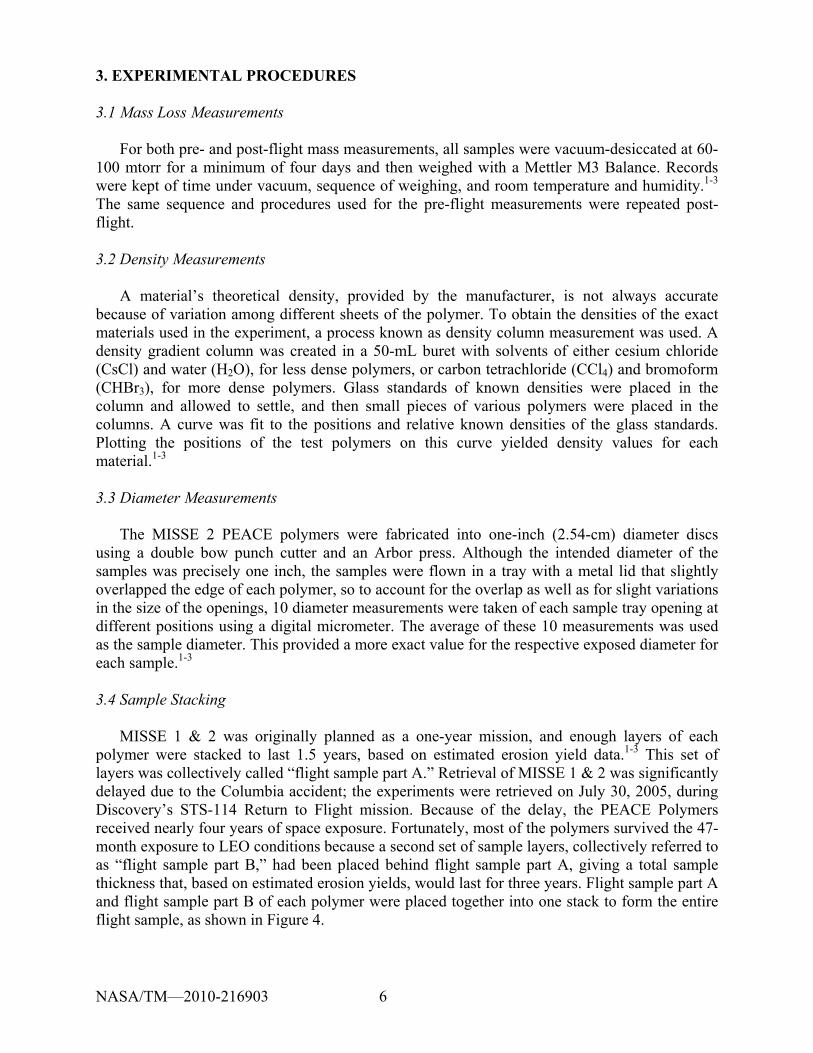
3. EXPERIMENTAL PROCEDURES
3.1 Mass Loss Measurements
For both pre- and post-flight mass measurements, all samples were vacuum-desiccated at 60-100 mtorr for a minimum of four days and then weighed with a Mettler M3 Balance. Records were kept of time under vacuum, sequence of weighing, and room temperature and humidity.1-3 The same sequence and procedures used for the pre-flight measurements were repeated post-flight.
3.2 Density Measurements
A material’s theoretical density, provided by the manufacturer, is not always accurate
because of variation among different sheets of the polymer. To obtain the densities of the exact materials used in the experiment, a process known as density column measurement was used. A density gradient column was created in a 50-mL buret with solvents of either cesium chloride (CsCl) and water (H2O), for less dense polymers, or carbon tetrachloride (CCl4) and bromoform (CHBr3), for more dense polymers. Glass standards of known densities were placed in the column and allowed to settle, and then small pieces of various polymers were placed in the columns. A curve was fit to the positions and relative known densities of the glass standards. Plotting the positions of the test polymers on this curve yielded density values for each material.1-3
3.3 Diameter Measurements
The MISSE 2 PEACE polymers were fabricated into one-inch (2.54-cm) diameter discs
using a double bow punch cutter and an Arbor press. Although the intended diameter of the samples was precisely one inch, the samples were flown in a tray with a metal lid that slightly overlapped the edge of each polymer, so to account for the overlap as well as for slight variations in the size of the openings, 10 diameter measurements were taken of each sample tray opening at different positions using a digital micrometer. The average of these 10 measurements was used as the sample diameter. This provided a more exact value for the respective exposed diameter for each sample.1-3
3.4 Sample Stacking
MISSE 1 & 2 was originally planned as a one-year mission, and enough layers of each
polymer were stacked to last 1.5 years, based on estimated erosion yield data.1-3 This set of layers was collectively called “flight sample part A.” Retrieval of MISSE 1 & 2 was significantly delayed due to the Columbia accident; the experiments were retrieved on July 30, 2005, during Discovery’s STS-114 Return to Flight mission. Because of the delay, the PEACE Polymers received nearly four years of space exposure. Fortunately, most of the polymers survived the 47-month exposure to LEO conditions because a second set of sample layers, collectively referred to as “flight sample part B,” had been placed behind flight sample part A, giving a total sample thickness that, based on estimated erosion yields, would last for three years. Flight sample part A and flight sample part B of each polymer were placed together into one stack to form the entire flight sample, as shown in Figure 4.

NASA/TM—2010-216903 7
Figure 4. Illustration of the flight sample setup.
3.5 Mass Loss Situations
As previously mentioned, each flight sample included two sets of sample layers: part A was enough material to theoretically last for 1.5 years in space, and the additional layers of part B extended the time to three years. Each flight sample also had a corresponding identical “backup” sample (including both parts A and B) that was kept on the ground as a control. Though flight sample parts A and B were not separated during flight, they were separated for pre- and post-flight weighing. Due to mission time constraints, part B of each sample was not weighed pre-flight, and so a theoretical value for the pre-flight mass of part B was calculated: the pre-flight mass of flight sample part A, MF, and the pre-flight mass of control sample part A, MC, were used to calculate the average mass per layer, MA, which was multiplied by the number n of layers in flight sample part B to get part B’s theoretical pre-flight mass, n·MA.
There were three different situations for post-flight sample weighing, so three different
equations to determine mass loss were required. Mass loss (ΔM) is a factor in calculating the erosion yield E of a polymer (see Equation 1), and so it was also necessary to develop three different equations for fractional uncertainty of the erosion yield. The different mass loss equations were simply substituted into the equation for erosion yield, and then from each of the three resulting equations an equation for fractional uncertainty was derived to calculate the percent error for that situation.
In the first situation (see Figure 5), referred to as Situation 1, either only one sample layer
was flown, or the atomic oxygen eroded through only some of the layers in flight sample part A, and all of flight sample part B was still pristine. Because flight sample part A and flight sample part B were weighed separately pre-flight, in this situation only part A needed to be weighed post-flight and compared with its pre-flight mass, so to minimize error, the terms for pre- and post-flight mass for flight sample part B were omitted from the Situation 1 mass loss equation:
∆ where MF is the pre-flight mass of flight sample part A and MF' is the post-flight mass of part A. Therefore, the Situation 1 erosion yield equation is:
4 ·· · ·
Flight Sample Part A
(enough layers to survive 1.5 years)
Flight Sample Part B
(enough additional layers to survive a total of 3 years)
(4)
(3)

NASA/TM—2010-216903 8
Figure 5. Illustration of Situation 1 sample erosion.
In Situation 2 (see Figure 6), atomic oxygen erosion occurred through all of the layers of
flight sample part A and some of flight sample part B.
Figure 6. Illustration of Situation 2 sample erosion.
In this situation, flight sample parts A and B were able to be separated to be weighed
post-flight. However, because flight sample part B was not weighed pre-flight, its theoretical pre-flight mass was used. Therefore, the Situation 2 equation for mass loss is:
∆ ·
where, again, MF and MF' are the pre- and post-flight mass values, respectively, of flight sample part A; n·MA is the theoretical pre-flight mass of flight sample part B; and ME' is the post-flight mass of part B. The erosion yield equation for Situation 2 is:
4 · ·· · ·
Flight Sample Part A
Flight Sample Part B
Pre-Flight (pristine)
Post-Flight
completely eroded through
partially eroded through
Flight Sample Part A
Flight Sample Part B
Pre-Flight (pristine)
Post-Flight
partially eroded through
pristine
(6)
(5)

NASA/TM—2010-216903 9
In Situation 3 (see Figure 7), the sample layers were stuck together and fragmented and were too fragile to separate without losing particles of the material and therefore compromising the erosion yield data.
Figure 7. Illustration of Situation 3 sample erosion.
Because of this, flight sample parts A and B were weighed together post-flight. Therefore, the Situation 3 mass loss equation is:
∆ ·
where MF is the pre-flight mass of flight sample part A, n·MA is the theoretical pre-flight mass of flight sample part B, and MS' is the post-flight mass of the entire flight sample. The Situation 3 erosion yield equation is:
4 · ·· · ·
One of the variables in the erosion yield equations is atomic oxygen fluence, F, which is itself found from an equation (the erosion yield equation (see Equation 1)) rearranged. Because this F value was also based on a series of measurements, the equation for F needed to be substituted into the erosion yield equations so that the error calculations could take into account all sources of error.
The equation for the fluence of the Kapton fluence witness samples is:
4 · ∆
· · ·
But the atomic oxygen fluence value used in the experiment was actually the average of the
two F values of the two Kapton H witness samples that were flown. This needed to be taken into account as well; the expression for the average of the two fluence values is found as follows:
12
4 · ∆
· · ·
4 · ∆
· · ·
42 · ·
·∆ ∆
Flight Sample Part A
Flight Sample Part B
Pre-Flight (pristine)
Post-Flight
Partially eroded through
(8)
(9)
(7)

NASA/TM—2010-216903 10
This expression for FAVG K is then substituted into the equation for sample erosion yield:
4 · ∆
· · ·
4 · ∆
· ··
2 · ·
4 ∆ ∆2 · ∆ · ·
· · ∆ ∆
Therefore, the erosion yield equations for the three situations are now:
2 · · ·
· · ∆ ∆
2 · · · ·
· · ∆ ∆
2 · · · ·
· · ∆ ∆
In the final equations for fractional uncertainty, ∆ ∆
is replaced by the variable R.
3.6 Atomic Oxygen Fluence Uncertainty
Table 2 shows the values for mass loss, density, erosion yield, exposed diameter, and the corresponding uncertainty values for each of these variables, for the two Kapton fluence witness samples. The erosion yield for Kapton H polyimide was assumed to be 3.0 x 10⁻²⁴ cm3/atom6 with a probable error of ±0.05 x 10⁻²⁴ cm3/atom, which is a standard deviation error of ±7.41 x 10⁻²⁶ cm3/atom (or 0.024700, a ±2.5 percent fractional uncertainty).
Table 2. Kapton H Witness Sample Measurement and Uncertainty Values.
Kapton H Sample #
ΔM K
(g)
δΔM K
(g)
ρ K
(g/cm3)
δρ K
(g/cm3)
DK
(cm)
δDK
(cm)
E K
(cm3/atom)
δE K
(cm3/atom)
δE K/E K
1 0.124785 0.0000513 2.0986 0.00582
2 0.129219 0.0000808 2.1342 0.004101.42725 0.0077 3.00E-24 7.41E-26 0.024700
(10)
(11)
(12)
(13)
NASA/TM—2010-216903 11
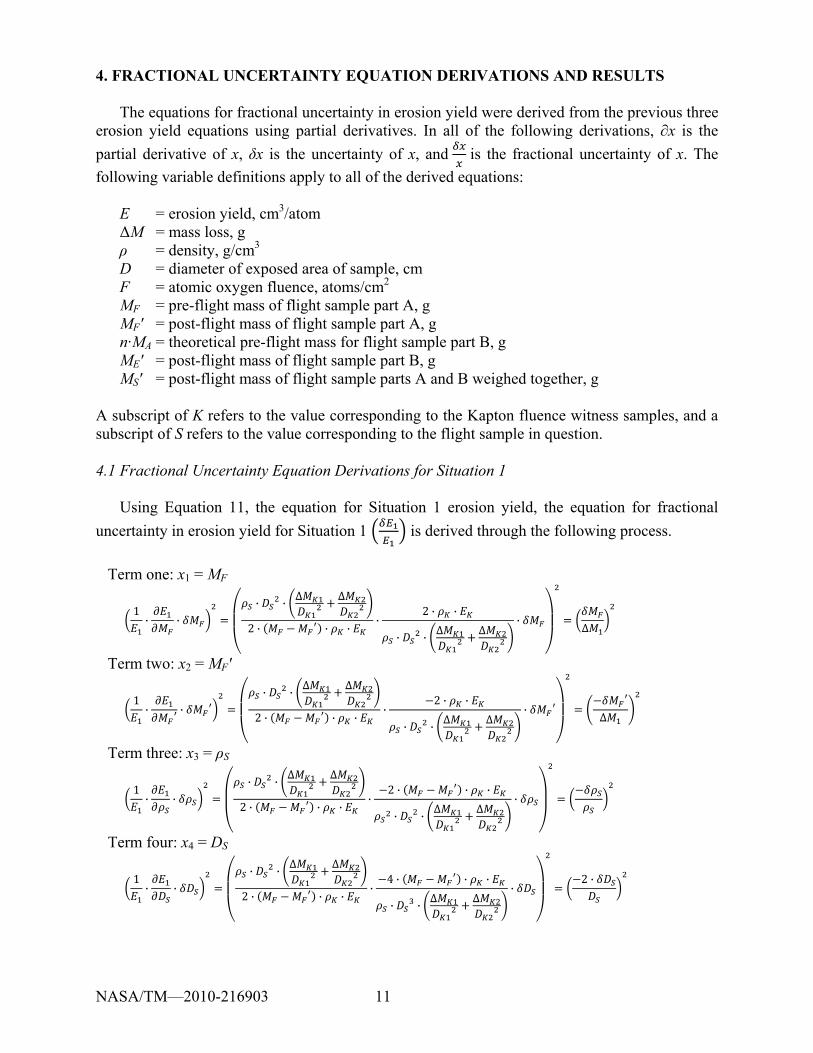
4. FRACTIONAL UNCERTAINTY EQUATION DERIVATIONS AND RESULTS The equations for fractional uncertainty in erosion yield were derived from the previous three
erosion yield equations using partial derivatives. In all of the following derivations, ∂x is the
partial derivative of x, δx is the uncertainty of x, and is the fractional uncertainty of x. The
following variable definitions apply to all of the derived equations: E = erosion yield, cm3/atom ΔM = mass loss, g ρ = density, g/cm3 D = diameter of exposed area of sample, cm F = atomic oxygen fluence, atoms/cm2
MF = pre-flight mass of flight sample part A, g MF' = post-flight mass of flight sample part A, g n·MA = theoretical pre-flight mass for flight sample part B, g ME' = post-flight mass of flight sample part B, g MS' = post-flight mass of flight sample parts A and B weighed together, g
A subscript of K refers to the value corresponding to the Kapton fluence witness samples, and a subscript of S refers to the value corresponding to the flight sample in question.
4.1 Fractional Uncertainty Equation Derivations for Situation 1
Using Equation 11, the equation for Situation 1 erosion yield, the equation for fractional
uncertainty in erosion yield for Situation 1 is derived through the following process.
Term one: x1 = MF
1· ·
· ·∆ ∆
2 · · ··
2 · ·
· ·∆ ∆
·∆
Term two: x2 = MF'
1· ·
· ·∆ ∆
2 · · ··
2 · ·
· ·∆ ∆
·∆
Term three: x3 = ρS
1· ·
· ·∆ ∆
2 · · ··
2 · · ·
· ·∆ ∆
·
Term four: x4 = DS
1· ·
· ·∆ ∆
2 · · ··
4 · · ·
· ·∆ ∆
·2 ·

NASA/TM—2010-216903 12
Term five: x5 = ρK
1· ·
· ·∆ ∆
2 · · ··
2 · ·
· ·∆ ∆
·
Term six: x6 = EK
1· ·
· ·∆ ∆
2 · · ··
2 · ·
· ·∆ ∆
·
Term seven: x7 = ΔMK1
1·∆
· ∆· ·
∆ ∆
2 · · ··
2 · · ·
· ·∆ ∆
·
· ∆∆
·
Term eight: x8 = ΔMK2
1·∆
· ∆· ·
∆ ∆
2 · · ··
2 · · ·
· ·∆ ∆
·
· ∆∆
·
Term nine: x9 = DK1
1· ·
· ·∆ ∆
2 · · ··
4 · · ∆ · ·
· ·∆ ∆
·
·2 · ∆ ·
·
Term ten: x10 = DK2
1· ·
· ·∆ ∆
2 · · ··
4 · · ∆ · ·
· ·∆ ∆
·
·2 · ∆ ·
·
Therefore the equation for fractional uncertainty in erosion yield for Situation 1 is:
∆ ∆2 · ∆
·
∆
·
2 · ∆ ·
·
2 · ∆ ·
·
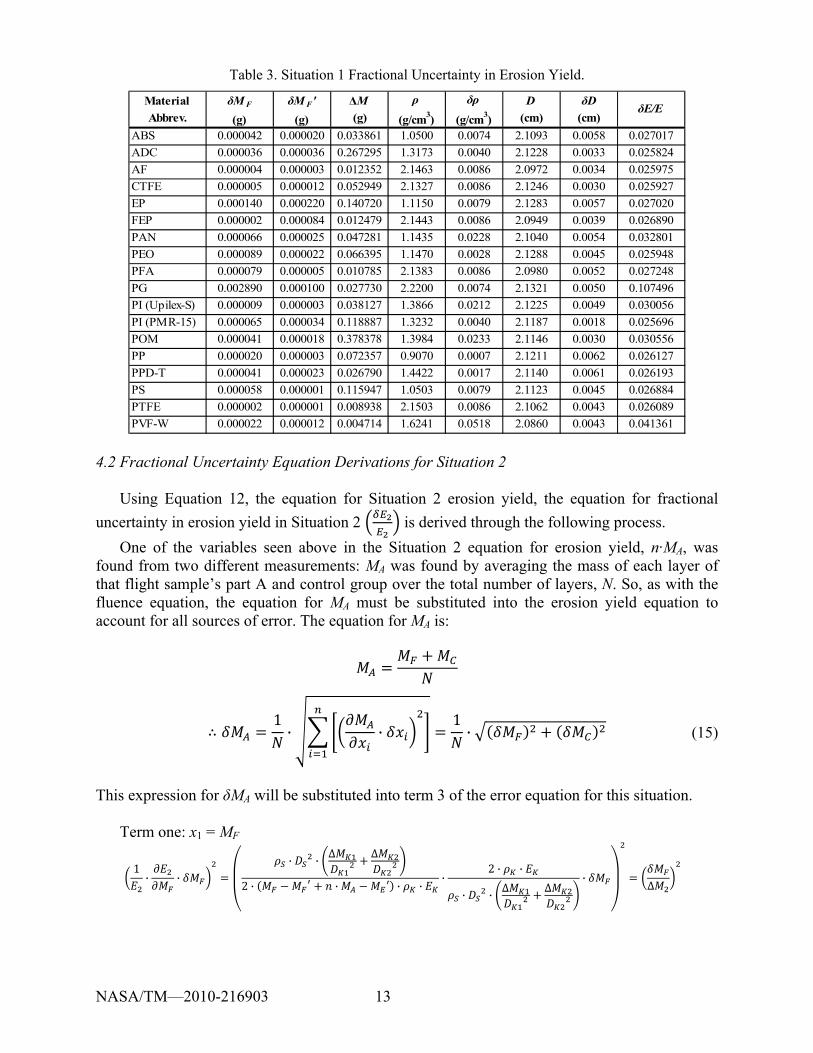
Table 3 shows the mass loss, density, exposed diameter, corresponding uncertainty values, and calculated fractional uncertainty for each polymer in Situation 1.
(14)
NASA/TM—2010-216903 13
Table 3. Situation 1 Fractional Uncertainty in Erosion Yield.
Material
Abbrev.
δM F
(g)
δM F'
(g)
ΔM
(g)
ρ
(g/cm3)
δρ
(g/cm3)
D
(cm)
δD
(cm)δE/E
ABS 0.000042 0.000020 0.033861 1.0500 0.0074 2.1093 0.0058 0.027017
ADC 0.000036 0.000036 0.267295 1.3173 0.0040 2.1228 0.0033 0.025824
AF 0.000004 0.000003 0.012352 2.1463 0.0086 2.0972 0.0034 0.025975
CTFE 0.000005 0.000012 0.052949 2.1327 0.0086 2.1246 0.0030 0.025927
EP 0.000140 0.000220 0.140720 1.1150 0.0079 2.1283 0.0057 0.027020
FEP 0.000002 0.000084 0.012479 2.1443 0.0086 2.0949 0.0039 0.026890
PAN 0.000066 0.000025 0.047281 1.1435 0.0228 2.1040 0.0054 0.032801
PEO 0.000089 0.000022 0.066395 1.1470 0.0028 2.1288 0.0045 0.025948
PFA 0.000079 0.000005 0.010785 2.1383 0.0086 2.0980 0.0052 0.027248
PG 0.002890 0.000100 0.027730 2.2200 0.0074 2.1321 0.0050 0.107496
PI (Upilex-S) 0.000009 0.000003 0.038127 1.3866 0.0212 2.1225 0.0049 0.030056
PI (PMR-15) 0.000065 0.000034 0.118887 1.3232 0.0040 2.1187 0.0018 0.025696
POM 0.000041 0.000018 0.378378 1.3984 0.0233 2.1146 0.0030 0.030556
PP 0.000020 0.000003 0.072357 0.9070 0.0007 2.1211 0.0062 0.026127
PPD-T 0.000041 0.000023 0.026790 1.4422 0.0017 2.1140 0.0061 0.026193
PS 0.000058 0.000001 0.115947 1.0503 0.0079 2.1123 0.0045 0.026884
PTFE 0.000002 0.000001 0.008938 2.1503 0.0086 2.1062 0.0043 0.026089
PVF-W 0.000022 0.000012 0.004714 1.6241 0.0518 2.0860 0.0043 0.041361 4.2 Fractional Uncertainty Equation Derivations for Situation 2
Using Equation 12, the equation for Situation 2 erosion yield, the equation for fractional
uncertainty in erosion yield in Situation 2 is derived through the following process.
One of the variables seen above in the Situation 2 equation for erosion yield, n·MA, was found from two different measurements: MA was found by averaging the mass of each layer of that flight sample’s part A and control group over the total number of layers, N. So, as with the fluence equation, the equation for MA must be substituted into the erosion yield equation to account for all sources of error. The equation for MA is:
1· ·
1·
This expression for δMA will be substituted into term 3 of the error equation for this situation.
Term one: x1 = MF
1· ·
· ·∆ ∆
2 · · · ··
2 · ·
· ·∆ ∆
·∆
(15)

NASA/TM—2010-216903 14
Term two: x2 = MF'
1· ·
· ·∆ ∆
2 · · · ··
2 · ·
· ·∆ ∆
·∆
Term three: x3 = MA
1· ·
· ·∆ ∆
2 · · · ··
2 · ·
· ·∆ ∆
··∆
Term four: x4 = ME'
1· ·
· ·∆ ∆
2 · · · ··
2 · ·
· ·∆ ∆
·∆
Term five: x5 = ρS
1· ·
· ·∆ ∆
2 · · · ··
2 · · · ·
· ·∆ ∆
·
Term six: x6 = DS
1· ·
· ·∆ ∆
2 · · · ··
4 · · · ·
· ·∆ ∆
·
2 ·
Term seven: x7 = ρK
1· ·
· ·∆ ∆
2 · · · ··2 · · ·
· ·∆ ∆
·
Term eight: x8 = EK
1· ·
· ·∆ ∆
2 · · · ··2 · · ·
· ·∆ ∆
·
Term nine: x9 = ΔMK1
1·∆
· ∆· ·
∆ ∆
2 · · · ··
2 · · · ·
· ·∆ ∆
·
· ∆
∆
·

NASA/TM—2010-216903 15
Term ten: x10 = ΔMK2
1·∆
· ∆· ·
∆ ∆
2 · · · ··
2 · · · ·
· ·∆ ∆
·
· ∆
∆
·
Term eleven: x11 = DK1
1· ·
· ·∆ ∆
2 · · · ··
4 · · · ∆ · ·
· ·∆ ∆
·
·
2 · ∆ ·
·
Term twelve: x12 = DK2
1· ·
· ·∆ ∆
2 · · · ··
4 · · · ∆ · ·
· ·∆ ∆
·
·
2 · ∆ ·
·
Therefore the equation for fractional uncertainty in erosion yield for Situation 2 is:
∆ ∆
·
∆ ∆2 ·
∆
·
∆
·
2 · ∆ ·
·
2 · ∆ ·
·
Table 4 shows the mass loss, density, exposed diameter, corresponding uncertainty values, and calculated fractional uncertainty for each polymer in Situation 2.
(16)

NASA/TM—2010-216903 16
Table 4. Situation 2 Fractional Uncertainty in Erosion Yield.
Material
Abbrev.
δM F
(g)
δM C
(g)n N
δM F'
(g)
δM E'
(g)
ΔM
(g)
ρ
(g/cm3)
δρ
(g/cm3)
D
(cm)
δD
(cm)δE /E
CA 0.000790 0.000433 6 14 0.000098 0.000069 0.191482 1.2911 0.0025 2.1059 0.0060 0.026573
ETFE 0.000003 0.000002 1 2 0.000003 0.000005 0.049108 1.7397 0.0029 2.1066 0.0022 0.025598
PA 66 0.000088 0.000034 3 8 0.000007 0.000019 0.065562 1.2252 0.1509 2.1185 0.0051 0.125851
PBI 0.000156 0.000141 2 4 0.000040 0.000029 0.082708 1.2758 0.0036 2.1038 0.0056 0.026275
PBO 0.000062 0.000000 5 13 0.000001 0.000004 0.056778 1.3976 0.0752 2.1268 0.0031 0.059587
PC 0.000020 0.000110 1 2 0.000002 0.000012 0.142287 1.1231 0.0079 2.1113 0.0028 0.026545
PE 0.000018 0.000004 2 8 0.000010 0.000013 0.102760 0.9180 0.0007 2.1257 0.0029 0.025620
PEEK 0.000117 0.000026 3 6 0.000001 0.000013 0.107764 1.2259 0.0457 2.1056 0.0054 0.045436
PEI 0.000018 0.000018 1 2 0.000003 0.000009 0.126853 1.2873 0.0036 2.1216 0.0053 0.026088
PI
(Kapton HN)0.000052 0.000035 1 4 0.000010 0.000012 0.121315 1.4345 0.0020 2.1313 0.0038 0.025748
PPPA 0.000162 0.000188 3 6 0.000060 0.000102 0.030549 0.7200 0.0074 2.1298 0.0055 0.028987
PSU 0.000035 0.000032 3 6 0.000012 0.000015 0.105948 1.2199 0.0221 2.1113 0.0054 0.031645
PVDF 0.000005 0.000007 1 2 0.000006 0.000001 0.066860 1.7623 0.0086 2.1108 0.0061 0.026549
PVF 0.000011 0.000011 6 13 0.000013 0.000010 0.132537 1.3792 0.0013 2.1331 0.0028 0.025612 4.3 Fractional Uncertainty Equation Derivations for Situation 3
Using Equation 13, the equation for Situation 3 erosion yield, the equation for fractional
uncertainty in erosion yield for Situation 3 is derived through the following process.
Equation 15 will be used to substitute for δMA in term 2 of the final equation. Term one: x1 = MF
1· ·
· ·∆ ∆
2 · · · ··
2 · ·
· ·∆ ∆
·∆
Term two: x2 = MA
1· ·
· ·∆ ∆
2 · · · ··
2 · ·
· ·∆ ∆
··∆
Term three: x3 = MS’
1· ·
· ·∆ ∆
2 · · · ··
2 · ·
· ·∆ ∆
·∆
Term four: x4 = ρS
1· ·
· ·∆ ∆
2 · · · ··
2 · · · ·
· ·∆ ∆
·

NASA/TM—2010-216903 17
Term five: x5 = DS
1· ·
· ·∆ ∆
2 · · · ··
4 · · · ·
· ·∆ ∆
·2 ·
Term six: x6 = ρK
1· ·
· ·∆ ∆
2 · · · ··2 · · ·
· ·∆ ∆
·
Term seven: x7 = EK
1· ·
· ·∆ ∆
2 · · · ··2 · · ·
· ·∆ ∆
·
Term eight: x8 = ΔMK1
1·∆
· ∆· ·
∆ ∆
2 · · · ··
2 · · · ·
· ·∆ ∆
·
· ∆∆
·
Term nine: x9 = ΔMK2
1·∆
· ∆· ·
∆ ∆
2 · · · ··
2 · · · ·
· ·∆ ∆
·
· ∆∆
·
Term ten: x10 = DK1
1· ·
· ·∆ ∆
2 · · · ··
4 · · · ∆ · ·
· ·∆ ∆
·
·
2 · ∆ ·
·
Term eleven: x11 = DK2
1· ·
· ·∆ ∆
2 · · · ··
4 · · · ∆ · ·
· ·∆ ∆
·
·
2 · ∆ ·
·
Therefore the equation for fractional uncertainty in erosion yield for Situation 3 is:
∆
·
∆ ∆2 ·
∆
·
∆
·
2 · ∆ ·
·
2 · ∆ ·
·
(17)
NASA/TM—2010-216903 18
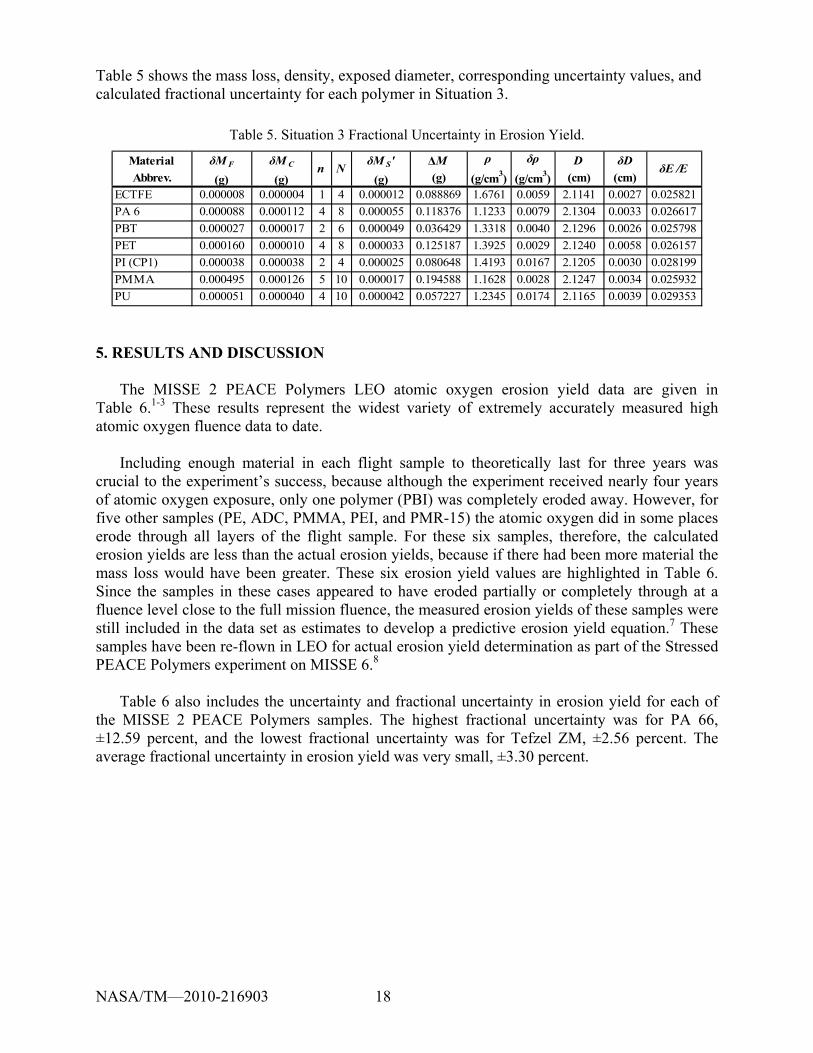
Table 5 shows the mass loss, density, exposed diameter, corresponding uncertainty values, and calculated fractional uncertainty for each polymer in Situation 3.
Table 5. Situation 3 Fractional Uncertainty in Erosion Yield.
Material
Abbrev.
δM F
(g)
δM C
(g)n N
δM S'
(g)
ΔM
(g)
ρ
(g/cm3)
δρ
(g/cm3)
D
(cm)
δD
(cm)δE /E
ECTFE 0.000008 0.000004 1 4 0.000012 0.088869 1.6761 0.0059 2.1141 0.0027 0.025821
PA 6 0.000088 0.000112 4 8 0.000055 0.118376 1.1233 0.0079 2.1304 0.0033 0.026617
PBT 0.000027 0.000017 2 6 0.000049 0.036429 1.3318 0.0040 2.1296 0.0026 0.025798
PET 0.000160 0.000010 4 8 0.000033 0.125187 1.3925 0.0029 2.1240 0.0058 0.026157
PI (CP1) 0.000038 0.000038 2 4 0.000025 0.080648 1.4193 0.0167 2.1205 0.0030 0.028199
PMMA 0.000495 0.000126 5 10 0.000017 0.194588 1.1628 0.0028 2.1247 0.0034 0.025932
PU 0.000051 0.000040 4 10 0.000042 0.057227 1.2345 0.0174 2.1165 0.0039 0.029353 5. RESULTS AND DISCUSSION
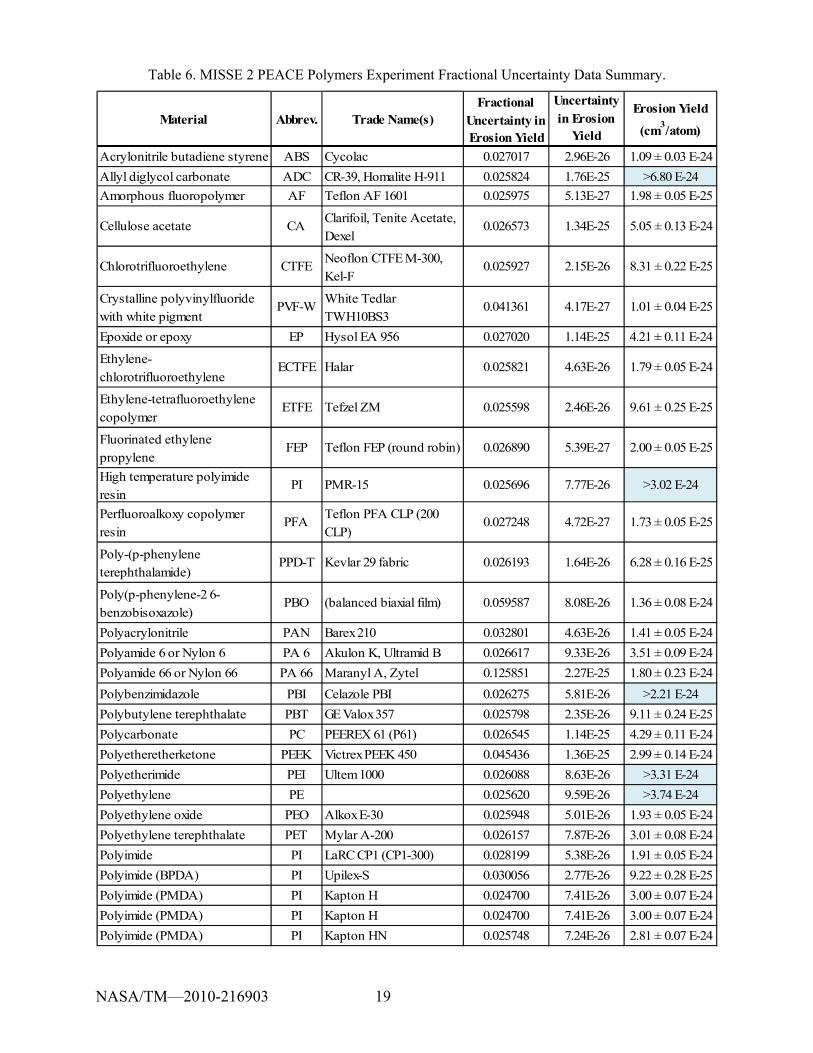
The MISSE 2 PEACE Polymers LEO atomic oxygen erosion yield data are given in Table 6.1-3 These results represent the widest variety of extremely accurately measured high atomic oxygen fluence data to date. Including enough material in each flight sample to theoretically last for three years was crucial to the experiment’s success, because although the experiment received nearly four years of atomic oxygen exposure, only one polymer (PBI) was completely eroded away. However, for five other samples (PE, ADC, PMMA, PEI, and PMR-15) the atomic oxygen did in some places erode through all layers of the flight sample. For these six samples, therefore, the calculated erosion yields are less than the actual erosion yields, because if there had been more material the mass loss would have been greater. These six erosion yield values are highlighted in Table 6. Since the samples in these cases appeared to have eroded partially or completely through at a fluence level close to the full mission fluence, the measured erosion yields of these samples were still included in the data set as estimates to develop a predictive erosion yield equation.7 These samples have been re-flown in LEO for actual erosion yield determination as part of the Stressed PEACE Polymers experiment on MISSE 6.8 Table 6 also includes the uncertainty and fractional uncertainty in erosion yield for each of the MISSE 2 PEACE Polymers samples. The highest fractional uncertainty was for PA 66, ±12.59 percent, and the lowest fractional uncertainty was for Tefzel ZM, ±2.56 percent. The average fractional uncertainty in erosion yield was very small, ±3.30 percent.
NASA/TM—2010-216903 19
Table 6. MISSE 2 PEACE Polymers Experiment Fractional Uncertainty Data Summary.
Material Abbrev. Trade Name(s)Fractional
Uncertainty in Erosion Yield
Uncertainty
in Erosion Yield
Erosion Yield
(cm3/atom)
Acrylonitrile butadiene styrene ABS Cycolac 0.027017 2.96E-26 1.09 ± 0.03 E-24
Allyl diglycol carbonate ADC CR-39, Homalite H-911 0.025824 1.76E-25 >6.80 E-24
Amorphous fluoropolymer AF Teflon AF 1601 0.025975 5.13E-27 1.98 ± 0.05 E-25
Cellulose acetate CAClarifoil, Tenite Acetate,
Dexel0.026573 1.34E-25 5.05 ± 0.13 E-24
Chlorotrifluoroethylene CTFENeoflon CTFE M-300,
Kel-F0.025927 2.15E-26 8.31 ± 0.22 E-25
Crystalline polyvinylfluoride
with white pigmentPVF-W
White Tedlar
TWH10BS3 0.041361 4.17E-27 1.01 ± 0.04 E-25
Epoxide or epoxy EP Hysol EA 956 0.027020 1.14E-25 4.21 ± 0.11 E-24
Ethylene-
chlorotrifluoroethyleneECTFE Halar 0.025821 4.63E-26 1.79 ± 0.05 E-24
Ethylene-tetrafluoroethylene
copolymerETFE Tefzel ZM 0.025598 2.46E-26 9.61 ± 0.25 E-25
Fluorinated ethylene
propylene FEP Teflon FEP (round robin) 0.026890 5.39E-27 2.00 ± 0.05 E-25
High temperature polyimide
resinPI PMR-15 0.025696 7.77E-26 >3.02 E-24
Perfluoroalkoxy copolymer
resinPFA
Teflon PFA CLP (200
CLP)0.027248 4.72E-27 1.73 ± 0.05 E-25
Poly-(p-phenylene
terephthalamide)PPD-T Kevlar 29 fabric 0.026193 1.64E-26 6.28 ± 0.16 E-25
Poly(p-phenylene-2 6-
benzobisoxazole)PBO (balanced biaxial film) 0.059587 8.08E-26 1.36 ± 0.08 E-24
Polyacrylonitrile PAN Barex 210 0.032801 4.63E-26 1.41 ± 0.05 E-24
Polyamide 6 or Nylon 6 PA 6 Akulon K, Ultramid B 0.026617 9.33E-26 3.51 ± 0.09 E-24
Polyamide 66 or Nylon 66 PA 66 Maranyl A, Zytel 0.125851 2.27E-25 1.80 ± 0.23 E-24
Polybenzimidazole PBI Celazole PBI 0.026275 5.81E-26 >2.21 E-24
Polybutylene terephthalate PBT GE Valox 357 0.025798 2.35E-26 9.11 ± 0.24 E-25
Polycarbonate PC PEEREX 61 (P61) 0.026545 1.14E-25 4.29 ± 0.11 E-24
Polyetheretherketone PEEK Victrex PEEK 450 0.045436 1.36E-25 2.99 ± 0.14 E-24
Polyetherimide PEI Ultem 1000 0.026088 8.63E-26 >3.31 E-24
Polyethylene PE 0.025620 9.59E-26 >3.74 E-24
Polyethylene oxide PEO Alkox E-30 0.025948 5.01E-26 1.93 ± 0.05 E-24
Polyethylene terephthalate PET Mylar A-200 0.026157 7.87E-26 3.01 ± 0.08 E-24
Polyimide PI LaRC CP1 (CP1-300) 0.028199 5.38E-26 1.91 ± 0.05 E-24
Polyimide (BPDA) PI Upilex-S 0.030056 2.77E-26 9.22 ± 0.28 E-25
Polyimide (PMDA) PI Kapton H 0.024700 7.41E-26 3.00 ± 0.07 E-24
Polyimide (PMDA) PI Kapton H 0.024700 7.41E-26 3.00 ± 0.07 E-24
Polyimide (PMDA) PI Kapton HN 0.025748 7.24E-26 2.81 ± 0.07 E-24

NASA/TM—2010-216903 20
Table 6. cont. MISSE 2 PEACE Polymers Experiment Fractional Uncertainty Data Summary.
Material Abbrev. Trade Name(s)Fractional
Uncertainty in Erosion Yield
Uncertainty
in Erosion Yield
Erosion Yield
(cm3/atom)
Polymethyl methacrylate PMMAPlexiglas, Lucite, Acrylite
(Impact Mod.)0.025932 1.45E-25 >5.60 E-24
Polyoxymethylene; acetal;
polyformaldehydePOM Delrin (natural) 0.030556 2.79E-25 9.14 ± 0.28 E-24
Polyphenylene isophthalate PPPANomex Aramid Paper Type 410
0.028987 4.10E-26 1.41 ± 0.04 E-24
Polypropylene PP C28 0.026127 7.00E-26 2.68 ± 0.07 E-24
Polystyrene PSTrycite 1000, Trycite Dew
0.026884 1.00E-25 3.74 ± 0.10 E-24
Polysulphone PSUThermolux P1700-NT11, Udel P-1700
0.031645 9.31E-26 2.94 ± 0.09 E-24
Polytetrafluoroethylene PTFE Chemfilm DF 100 0.026089 3.69E-27 1.42 ± 0.04 E-25
Polyurethane PU Dureflex PS 8010 0.029353 4.59E-26 1.56 ± 0.05 E-24
Polyvinyl fluoride PVF Tedlar TTR10SG3 0.025612 8.17E-26 3.19 ± 0.08 E-24
Polyvinylidene fluoride PVDF Kynar 740 0.026549 3.41E-26 1.29 ± 0.03 E-24
Pyrolytic graphite PG 0.107496 4.46E-26 4.15 ± 0.45 E-25 6. SUMMARY
The purpose of the MISSE 2 PEACE Polymers experiment was to obtain the atomic oxygen erosion yields of a wide variety of polymeric materials exposed to the LEO space environment for a long period of time.1-3 The MISSE 2 PEACE Polymers experiment is unique in that it included the widest variety of polymers exposed to identical LEO conditions and received a high fluence of atomic oxygen exposure (8.43 x 10²¹ atoms/cm2). Because of this, the experiment provides very valuable erosion yield data for spacecraft design purposes.1-3 It is therefore extremely important to know how accurate the atomic oxygen erosion yield data are. To address this, the error in each polymer’s experimental erosion yield value was calculated using equations for fractional uncertainty derived from the equation used to find erosion yield. Because three different situations were required for post-flight sample weighing, a factor in calculating the erosion yield E of a polymer, three different equations were derived for determining the fractional uncertainty of the erosion yield values. The uncertainty and fractional uncertainty in erosion yield for each of the MISSE 2 PEACE Polymers samples have been determined. The highest fractional uncertainty was for PA 66, ±12.59 percent, and the lowest fractional uncertainty was for Tefzel ZM, ±2.56 percent. The average fractional uncertainty in erosion yield was very small, ±3.30 percent. The results listed in Table 6 represent the widest variety of extremely accurately measured high atomic oxygen fluence data to date.

NASA/TM—2010-216903 21
References 1. de Groh, K. K., Banks, B. A., McCarthy, C. E., Rucker, R. N., Roberts, L. M., and Berger, L.
A., “MISSE 2 PEACE Polymers Atomic Oxygen Erosion Experiment on the International Space Station,” High Performance Polymers, Vol. 20, no. 4/5, pp. 388-409, Aug. 2008.
2. de Groh, K. K., Banks, B. A., McCarthy, C. E., Berger, L. A., and Roberts, L. M., “Analysis of the MISSE PEACE Polymers International Space Station Environmental Exposure Experiment,” Proceedings of the 10th International Symposium on Materials in a Space Environment and the 8th International Conference on Protection of Materials and Structures in a Space Environment (ISMSE-10 & ICMPSE-8), Collioure, France, June 19-23, 2006ESA SP-616, September 2006).
3. de Groh, K. K., Banks, B. A., McCarthy, C. E., Rucker, R. N., Roberts, L. M., and Berger, L. A., “MISSE PEACE Polymers Atomic Oxygen Erosion Results,” Proceedings of the 2006 National Space & Missile Materials Symposium (2006 NSMMS) in conjunction with the 2006 MISSE Post-Retrieval Conference, Orlando, Florida, June 26-30, 2006; also NASA TM-2006-214482, November 2006.
4. Pippin, G. and Normand, E., “Estimated Environmental Exposures for MISSE-1 & MISSE-2,” proceedings of the 2006 MISSE Post-Retrieval Conference, Jun. 26-30, 2006, Orlando, FL.
5. Dever, J. A., Miller, S. K., Sechkar, E. A., and Wittberg, T. N., “Preliminary Analysis of Polymer Film Thermal Control and Gossamer Materials Experiments on Materials International Space Station Experiment (MISSE 1 and MISSE 2),” Proceedings of the 2006 MISSE Post-Retrieval Conference, Jun. 26-30, 2006, Orlando, FL.
6. ASTM E 2089-00, “Standard Practices for Ground Laboratory Atomic Oxygen Interaction Evaluation of Materials for Space Applications, June 2000.
7. Banks, B. A., Backus, J. A., Manno, M. V., Waters, D. L., Cameron, K. C. and de Groh, K. K., “Atomic Oxygen Erosion Yield Prediction for Spacecraft Polymers in Low Earth Orbit,” Proceedings of the International Symposium on Materials in a Space Environment (ISMSE-11), September 15-18, 2009, Aix-en-Provence, France, 2009; also NASA TM-2009-215812, September 2009.
8. de Groh, K. K., Banks, B. A., Dever, J. A., Jaworske, D. J., Miller, S. K., Sechkar E. A. and Panko, S. R., “NASA Glenn Research Center’s Materials International Space Station Experiments (MISSE 1-7),” Proceedings of the International Symposium on “SM/MPAC&SEED Experiment,” Tsukuba, Japan, March 10-11, 2008, JAXA-SP-08-015E, March 2009, pp. 91–119; also NASA TM-2008-215482, December 2008.
REPORT DOCUMENTATION PAGE Form Approved
OMB No. 0704-0188 The public reporting burden for this collection of information is estimated to average 1 hour per response, including the time for reviewing instructions, searching existing data sources, gathering and maintaining the data needed, and completing and reviewing the collection of information. Send comments regarding this burden estimate or any other aspect of this collection of information, including suggestions for reducing this burden, to Department of Defense, Washington Headquarters Services, Directorate for Information Operations and Reports (0704-0188), 1215 Jefferson Davis Highway, Suite 1204, Arlington, VA 22202-4302. Respondents should be aware that notwithstanding any other provision of law, no person shall be subject to any penalty for failing to comply with a collection of information if it does not display a currently valid OMB control number. PLEASE DO NOT RETURN YOUR FORM TO THE ABOVE ADDRESS.
1. REPORT DATE (DD-MM-YYYY) 01-11-2010
2. REPORT TYPE Technical Memorandum
3. DATES COVERED (From - To)
4. TITLE AND SUBTITLE MISSE 2 PEACE Polymers Experiment Atomic Oxygen Erosion Yield Error Analysis
5a. CONTRACT NUMBER
5b. GRANT NUMBER
5c. PROGRAM ELEMENT NUMBER
6. AUTHOR(S) McCarthy, Catherine, E.; Banks, Bruce, A.; de Groh, Kim, K.
5d. PROJECT NUMBER
5e. TASK NUMBER
5f. WORK UNIT NUMBER WBS 825080.04.02.30.17
7. PERFORMING ORGANIZATION NAME(S) AND ADDRESS(ES) National Aeronautics and Space Administration John H. Glenn Research Center at Lewis Field Cleveland, Ohio 44135-3191
8. PERFORMING ORGANIZATION REPORT NUMBER E-17481
9. SPONSORING/MONITORING AGENCY NAME(S) AND ADDRESS(ES) National Aeronautics and Space Administration Washington, DC 20546-0001
10. SPONSORING/MONITOR'S ACRONYM(S) NASA
11. SPONSORING/MONITORING REPORT NUMBER NASA/TM-2010-216903
12. DISTRIBUTION/AVAILABILITY STATEMENT Unclassified-Unlimited Subject Category: 25 Available electronically at http://gltrs.grc.nasa.gov This publication is available from the NASA Center for AeroSpace Information, 443-757-5802
13. SUPPLEMENTARY NOTES
14. ABSTRACT Atomic oxygen erosion of polymers in low Earth orbit (LEO) poses a serious threat to spacecraft performance and durability. To address this, 40 different polymer samples and a sample of pyrolytic graphite, collectively called the PEACE (Polymer Erosion and Contamination Experiment) Polymers, were exposed to the LEO space environment on the exterior of the International Space Station (ISS) for nearly 4 years as part of the Materials International Space Station Experiment 1 & 2 (MISSE 1 & 2). The purpose of the PEACE Polymers experiment was to obtain accurate mass loss measurements in space to combine with ground measurements in order to accurately calculate the atomic oxygen erosion yields of a wide variety of polymeric materials exposed to the LEO space environment for a long period of time. Error calculations were performed in order to determine the accuracy of the mass measurements and therefore of the erosion yield values. The standard deviation, or error, of each factor was incorporated into the fractional uncertainty of the erosion yield for each of three different situations, depending on the post-flight weighing procedure. The resulting error calculations showed the erosion yield values to be very accurate, with an average error of ±3.30 percent. 15. SUBJECT TERMS Atomic oxygen; low Earth orbit (LEO); Polymers
16. SECURITY CLASSIFICATION OF: 17. LIMITATION OF ABSTRACT UU
18. NUMBER OF PAGES
27
19a. NAME OF RESPONSIBLE PERSON STI Help Desk (email:[email protected])
a. REPORT U
b. ABSTRACT U
c. THIS PAGE U
19b. TELEPHONE NUMBER (include area code) 443-757-5802
Standard Form 298 (Rev. 8-98)Prescribed by ANSI Std. Z39-18