Embed Size (px)
Citation preview
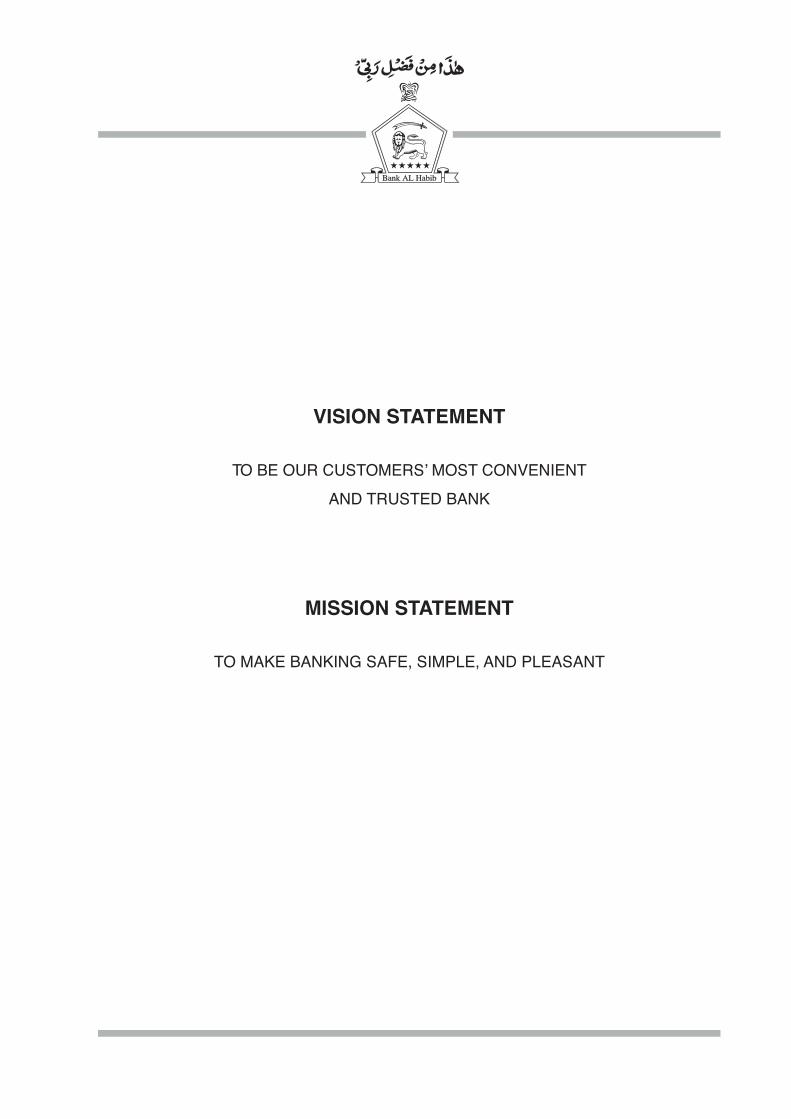
VISION STATEMENT
TO BE OUR CUSTOMERS’ MOST CONVENIENT
AND TRUSTED BANK
MISSION STATEMENT
TO MAKE BANKING SAFE, SIMPLE, AND PLEASANT
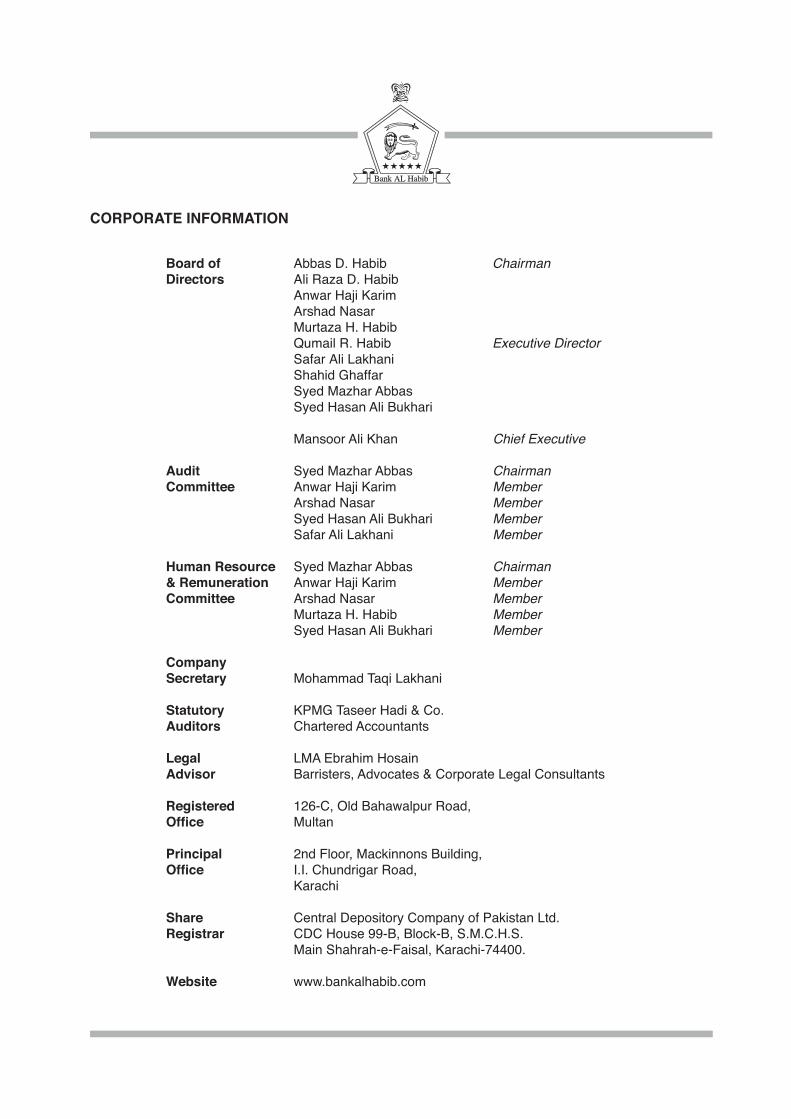
CORPORATE INFORMATION
Board of Abbas D. Habib ChairmanDirectors Ali Raza D. Habib Anwar Haji Karim Arshad Nasar Murtaza H. Habib Qumail R. Habib Executive Director Safar Ali Lakhani Shahid Ghaffar Syed Mazhar Abbas Syed Hasan Ali Bukhari
Mansoor Ali Khan Chief Executive
Audit Syed Mazhar Abbas ChairmanCommittee Anwar Haji Karim Member Arshad Nasar Member Syed Hasan Ali Bukhari Member Safar Ali Lakhani Member
Human Resource Syed Mazhar Abbas Chairman& Remuneration Anwar Haji Karim Member Committee Arshad Nasar Member Murtaza H. Habib Member Syed Hasan Ali Bukhari Member
CompanySecretary Mohammad Taqi Lakhani
Statutory KPMG Taseer Hadi & Co.Auditors Chartered Accountants
Legal LMA Ebrahim HosainAdvisor Barristers, Advocates & Corporate Legal Consultants
Registered 126-C, Old Bahawalpur Road,Office Multan
Principal 2nd Floor, Mackinnons Building,Office I.I. Chundrigar Road, Karachi
Share Central Depository Company of Pakistan Ltd.Registrar CDC House 99-B, Block-B, S.M.C.H.S. Main Shahrah-e-Faisal, Karachi-74400.
Website www.bankalhabib.com
CONTENTS
History 1
Directors' Report 4
Statement of Compliance with the Code of Corporate Governance 10
Review Report to the Members on Statement of Compliance with the Code of Corporate Governance 12
Statement on Internal Controls 13
Auditors' Report to the Members 14
Unconsolidated Statement of Financial Position 15
Unconsolidated Profit and Loss Account 16
Unconsolidated Statement of Comprehensive Income 17
Unconsolidated Cash Flow Statement 18
Unconsolidated Statement of Changes in Equity 19
Notes to the Unconsolidated Financial Statements 20
Disclosure on Complaint Handling 107
Report of Shariah Board 108
Notice of Annual General Meeting 109
Pattern of Shareholding 112
Consolidated Financial Statements 115
212
219
Branch Network 220
Form of Proxy
1
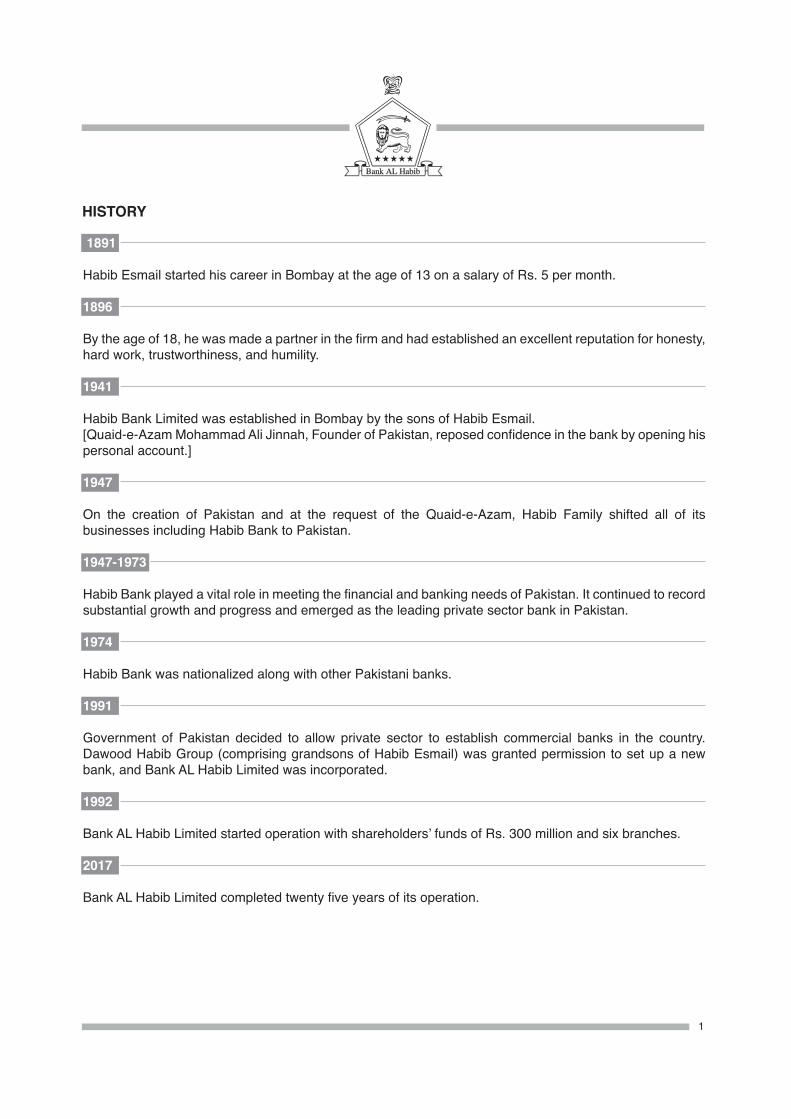
HISTORY
1891
Habib Esmail started his career in Bombay at the age of 13 on a salary of Rs. 5 per month.
1896
By the age of 18, he was made a partner in the firm and had established an excellent reputation for honesty, hard work, trustworthiness, and humility.
1941
Habib Bank Limited was established in Bombay by the sons of Habib Esmail.[Quaid-e-Azam Mohammad Ali Jinnah, Founder of Pakistan, reposed confidence in the bank by opening his personal account.]
1947
On the creation of Pakistan and at the request of the Quaid-e-Azam, Habib Family shifted all of its businesses including Habib Bank to Pakistan.
1947-1973
Habib Bank played a vital role in meeting the financial and banking needs of Pakistan. It continued to record substantial growth and progress and emerged as the leading private sector bank in Pakistan.
1974
Habib Bank was nationalized along with other Pakistani banks.
1991
Government of Pakistan decided to allow private sector to establish commercial banks in the country. Dawood Habib Group (comprising grandsons of Habib Esmail) was granted permission to set up a new bank, and Bank AL Habib Limited was incorporated.
1992
Bank AL Habib Limited started operation with shareholders’ funds of Rs. 300 million and six branches.
2017
Bank AL Habib Limited completed twenty five years of its operation.
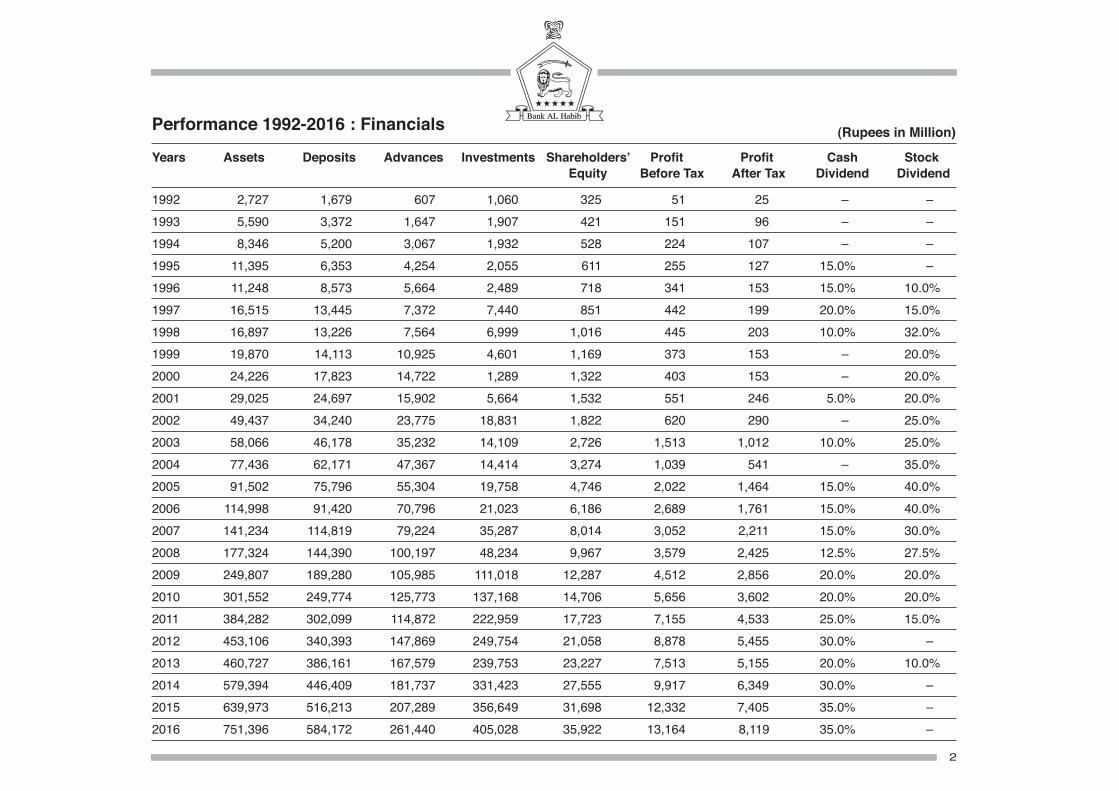
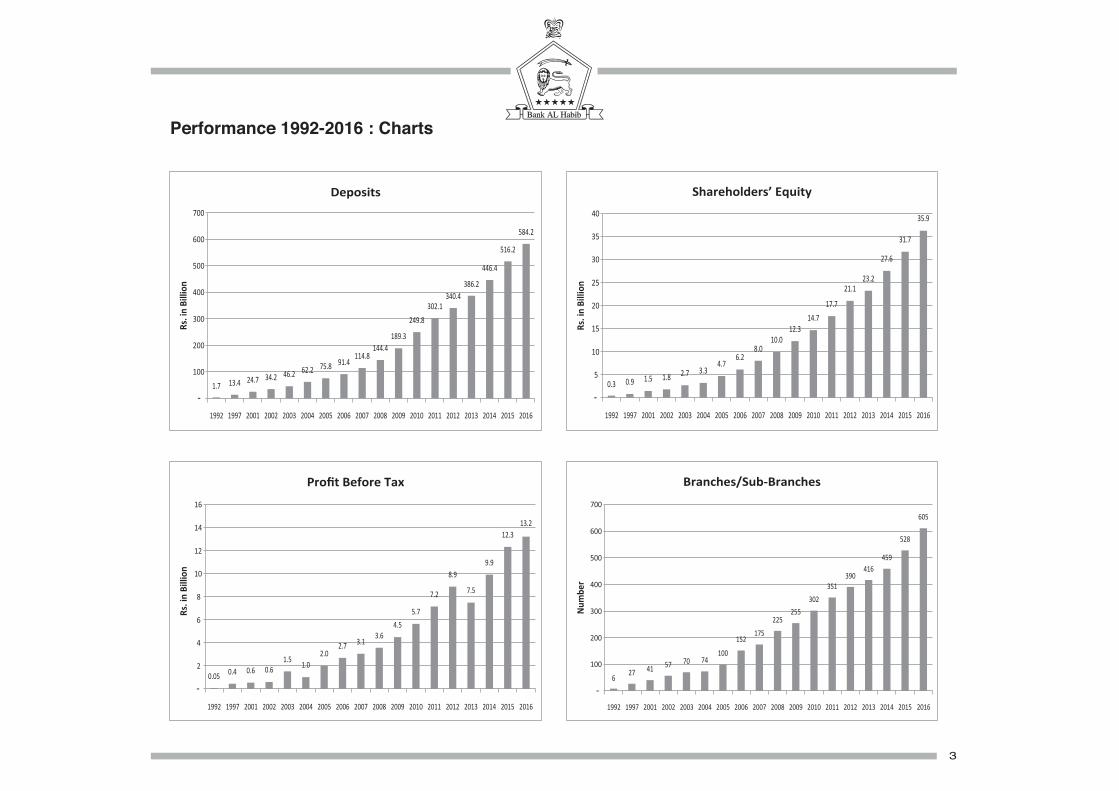
Years Assets Deposits Advances Investments Shareholders’ Profit Profit Cash Stock Equity Before Tax After Tax Dividend Dividend
1992 2,727 1,679 607 1,060 325 51 25 –0 –01993 5,590 3,372 1,647 1,907 421 151 96 –0 –01994 8,346 5,200 3,067 1,932 528 224 107 –0 –01995 11,395 6,353 4,254 2,055 611 255 127 15.0% –01996 11,248 8,573 5,664 2,489 718 341 153 15.0% 10.0%1997 16,515 13,445 7,372 7,440 851 442 199 20.0% 15.0%1998 16,897 13,226 7,564 6,999 1,016 445 203 10.0% 32.0%1999 19,870 14,113 10,925 4,601 1,169 373 153 –0 20.0%2000 24,226 17,823 14,722 1,289 1,322 403 153 –0 20.0%2001 29,025 24,697 15,902 5,664 1,532 551 246 5.0% 20.0%2002 49,437 34,240 23,775 18,831 1,822 620 290 –0 25.0%2003 58,066 46,178 35,232 14,109 2,726 1,513 1,012 10.0% 25.0%2004 77,436 62,171 47,367 14,414 3,274 1,039 541 –0 35.0%2005 91,502 75,796 55,304 19,758 4,746 2,022 1,464 15.0% 40.0%2006 114,998 91,420 70,796 21,023 6,186 2,689 1,761 15.0% 40.0%2007 141,234 114,819 79,224 35,287 8,014 3,052 2,211 15.0% 30.0%2008 177,324 144,390 100,197 48,234 9,967 3,579 2,425 12.5% 27.5%2009 249,807 189,280 105,985 111,018 12,287 4,512 2,856 20.0% 20.0%2010 301,552 249,774 125,773 137,168 14,706 5,656 3,602 20.0% 20.0%2011 384,282 302,099 114,872 222,959 17,723 7,155 4,533 25.0% 15.0%2012 453,106 340,393 147,869 249,754 21,058 8,878 5,455 30.0% –02013 460,727 386,161 167,579 239,753 23,227 7,513 5,155 20.0% 10.0%2014 579,394 446,409 181,737 331,423 27,555 9,917 6,349 30.0% –02015 639,973 516,213 207,289 356,649 31,698 12,332 7,405 35.0% –02016 751,396 584,172 261,440 405,028 35,922 13,164 8,119 35.0% –0
Performance 1992-2016 : Financials (Rupees in Million)
2
1992 1997 2001 2002 2003 2004 2005 2006 2007 2008 2009 2010 2011 2012 2013 2014 2015 2016
627 41 57 70 74
100
152175
225255
302351
390416
459
528
605700
Branches/Sub-Branches
Num
ber
1.7 13.4 24.7 34.2 46.2 62.2 75.8 91.4114.8
144.4189.3
249.8302.1
340.4386.2
446.4
516.2
584.2
1992 1997 2001 2002 2003 2004 2005 2006 2007 2008 2009 2010 2011 2012 2013 2014 2015 2016
Rs. i
n Bi
llion
Deposits700
0.3 0.9 1.5 1.8 2.7 3.34.7
6.28.0
10.012.3
14.717.7
21.123.2
27.6
31.7
35.9
1992 1997 2001 2002 2003 2004 2005 2006 2007 2008 2009 2010 2011 2012 2013 2014 2015 2016
Shareholders’ Equity
Rs. i
n Bi
llion
40
1992 1997 2001 2002 2003 2004 2005 2006 2007 2008 2009 2010 2011 2012 2013 2014 2015 2016
0.05 0.4 0.6 0.61.5 1.0
2.02.7 3.1
3.64.5
5.7
7.2
8.9
7.5
9.9
12.313.2
Profit Before Tax
Rs. i
n Bi
llion
16
Performance 1992-2016 : Charts
3
DIRECTORS' REPORT
Alhamdolillah, Bank AL Habib has completed 25 year of its operation, and the Directors are pleased to present the Twenty-sixth Annual Report together with the audited financial statements of the Bank for the year ended December 31, 2016.
The operating results and appropriations, as recommended by the Board, are given below:
(Rupees in ‘000)
Profit for the year before tax 13,163,987 Taxation (5,044,758 ) Profit for the year after tax 8,119,229 Unappropriated profit brought forward 10,253,920 Transfer from surplus on revaluation of fixed assets – net of tax 53,229 Other comprehensive income (53,736 )
10,253,413 Profit available for appropriations 18,372,642 Appropriations: Transfer to Statutory Reserve (1,623,846 ) Cash dividend – 2015 (3,889,989 ) (5,513,835 )
Unappropriated profit carried forward 12,858,807
Basic / Diluted earnings per share – after tax Rs. 7.31
For the year ended December 31, 2016, the Directors propose a cash dividend of 35%, i.e., Rs. 3.50 per share.
Performance Review
Alhamdolillah, the performance of your Bank continued to be satisfactory during the year. Deposits rose to Rs. 584,172 million against Rs. 516,213 million a year earlier, while advances increased to Rs. 261,440 million from Rs. 207,289 million. Foreign Trade Business handled by the Bank during the year was Rs. 825,826 million. Profit before tax for the year was Rs. 13,164 million as compared to Rs. 12,332 million last year, while profit after tax was Rs. 8,119 million against Rs. 7,405 million last year.
During the year, the Bank opened 77 new branches and converted 18 sub-branches into full-fledged branches, bringing our network to 608 offices, which comprises 518 branches (including 41 Islamic Banking Branches and 3 Overseas Branches, one each in Bahrain, Malaysia, and Seychelles), 87 sub-branches, and 3 Representative Offices, one each in Dubai, Istanbul, and Beijing. The Bank will continue to expand its network in Pakistan and abroad.
4
5
Top Companies Award for the Year 2015
We are pleased to advise that your Bank was selected for “Top 25 Companies Award” for the year 2015 by the Pakistan Stock Exchange. Criteria for the award include dividend payout, capital efficiency, profitability, free-float of shares, transparency & investor relation and compliance with listing and securities regulations. This is the fifth time that the Bank has received this award.
Changes in Board of Directors
During the year, the following changes took place in the Board of Directors:
• Sadly, Mr. Shameem Ahmed, Director, passed away on February 5, 2016, and subsequently Mr. Arshad Nasar was appointed as a Director of the Bank. The Board places on record its appreciation of the meritorious services rendered by Mr. Shameem Ahmed during his association with the Bank since 2006.
• Mr. Abbas D. Habib retired as Managing Director & Chief Executive of the Bank on October 31, 2016, and Mr. Mansoor A. Khan was appointed as Chief Executive with effect from November 1, 2016.
• Mr. Ali Raza D. Habib retired as Chairman of the Board on October 31, 2016, and Mr. Abbas D. Habib was elected as Chairman of the Board with effect from November 1, 2016.
The Board places on record its appreciation of the invaluable contributions made by Mr. Ali Raza D. Habib and Mr. Abbas D. Habib during their long association with the Bank since its inception, and is pleased that they will continue to serve on the Bank’s Board of Directors.
Board Meetings
During the year, seven meetings of the Board were held and the attendance of each Director was as follows:
Name of Director Meetings Held Meetings Attended
Mr. Ali Raza D. Habib 7 5
Mr. Abbas D. Habib 7 7
Mr. Anwar Haji Karim 7 6
Mr. Murtaza H. Habib 7 6 Mr. Qumail R. Habib 7 6 Mr. S. Mazhar Abbas 7 7
Mr. Arshad Nasar * 7 5 Mr. Safar Ali Lakhani 7 6
Mr. S. Hasan Ali Bukhari 7 6
Mr. Shahid Ghaffar 7 7 Mr. Mansoor Ali Khan, Chief Executive* 7 1 *Mr. Arshad Nasar and Mr. Mansoor Ali Khan attended all meetings of the Board after assuming their respective
offices.
Committee MeetingsCode of Corporate Governance requires formation of two committees of the Board, viz. Audit Committee and Human Resource & Remuneration Committee. During the year, nine meetings of the Audit Committee and five meetings of the Human Resource & Remuneration Committee (HR&RC) were held, and the attendance of members was as follows:
6
Audit Committee Human Resource & Remuneration Committee
Name of Director Meetings Meetings Name of Director Meetings Meetings Held Attended Held Attended Mr. S. Mazhar Abbas, 9 9 Mr. S. Mazhar Abbas, 5 5 Chairman Chairman
Mr. Anwar Haji Karim 9 8 Mr. Abbas D. Habib** 5 3 Mr. S.Hasan Ali Bukhari 9 8 Mr. Anwar Haji Karim 5 4 Mr. Safar Ali Lakhani 9 9 Mr. Murtaza H. Habib 5 5
Mr. Arshad Nasar* 9 6 Mr. S. Hasan Ali Bukhari 5 4
Mr. Arshad Nasar* 5 2
*Mr. Arshad Nasar attended all meetings of the Audit Committee and HR&RC after his nomination to these Committees. **Mr. Abbas D. Habib ceased to be member of HR&RC during the year. He attended all meetings of HR&RC
while he was its member.
Directors Training Programme
During the year, one more Director completed the directors’ training programme.
Credit Rating
Alhamdollilah, Pakistan Credit Rating Agency Limited (PACRA) has maintained the Bank’s long term and short term entity ratings at AA+ (Double A plus) and A1+ (A One plus), respectively. Our unsecured, subordinated TFC issue of 2016 has been assigned instrument rating of AA (Double A). These ratings denote a very low expectation of credit risk emanating from a very strong capacity for timely payment of financial commitments.
Future Outlook
Pakistan’s economy seems to be well positioned to maintain its growth momentum. GDP has been rising, energy situation and security environment have improved, inflation has been under control, exchange rate has been stable, and performance of equity market has been commendable. Investments in CPEC-related projects are expected to bring about further improvement in energy and infrastructure sectors. But there are also adverse indications relating to external current account, trade balance, inward remittances, and geopolitical environment. Moreover, continuation of low interest rates may result in further reduction in earnings of banks. We are, nevertheless, confident that the Bank will Inshallah continue to grow and progress, as in the past.
Auditors
The present auditors KPMG Taseer Hadi & Co., Chartered Accountants, retire and offer themselves for reappointment. As suggested by the Audit Committee, the Board of Directors has recommended their reappointment to the shareholders, as auditors of the Bank for the year ending December 31, 2017, at a fee to be mutually agreed.
Risk Management Framework
The Bank always had a risk management framework commensurate with the size of the Bank and the nature of its business. This framework has developed over the years and continues to be refined and improved. Its salient features are summarized below:
• Credit risk is managed through the credit policies approved by the Board; a well-defined credit approval mechanism; use of internal risk ratings; prescribed documentation requirements; post-disbursement administration, review, and monitoring of credit facilities; and continuous assessment of credit worthiness of counterparties. The Bank has also established a mechanism for independent, post-disbursement review of large credit risk exposures. Decisions regarding the credit portfolio are taken mainly by the Central Credit Committee. Credit Risk Management Committee of the Board provides overall guidance in managing the Bank’s credit risk.
• Market risk is managed through the market risk policy approved by the Board; approval of counterparty limits and dealer limits; senior management approval for investments; and regular review and monitoring of the investment portfolio by the Bank’s Asset Liability Management Committee (ALCO). In addition, the liquidity risk policy provides guidance in managing the liquidity position of the Bank, which is monitored on daily basis by the Treasury and the Middle Office. Risk Management Committee of the Board provides overall guidance in managing the Bank’s market and liquidity risks, capital adequacy, and integrated risk management (also known as enterprise risk management).
• Operational risk is managed through the audit policy and the operational risk policy approved by the Board, along with the fraud prevention policy; operational manuals and procedures issued from time to time; a system of internal controls and dual authorization for important transactions and safe-keeping; a Business Continuity Plan, including a Disaster Recovery Plan for I.T.; and regular audit of the branches. Audit Committee of the Board provides overall guidance in managing the Bank’s operational risk.
In order to comply with SBP’s guidelines on risk management, the Bank has established a separate Risk Management Division, including a Middle Office that independently monitors and analyses the risks inherent in Treasury operations. The steps taken by the Division include: sensitivity testing of Government Securities portfolio; computation of portfolio duration and modified duration; analysis of forward foreign exchange gap positions; more detailed reporting of TFCs and equities portfolios; development of improved procedures for dealing in equities and settlements; monitoring of off-market foreign exchange rates and foreign exchange earnings; and establishment of a mechanism for independent, post-disbursement review of large credit risk exposures. Assessment of enterprise-wide integrated risk profile of the Bank is carried out, using the Basel Framework, Internal Capital Adequacy Assessment Process, and Stress Testing.
Corporate Social Responsibility (CSR)
Your Bank is fully committed to the concept of Corporate Social Responsibility and fulfills this responsibility by engaging in a wide range of activities which include:
• corporate philanthropy amounting to Rs. 184.9 million by way of donations during the year for social and educational development and welfare of people;
• energy conservation, environmental protection, and occupational safety and health by restricting unnecessary lighting, implementing tobacco control law and “No Smoking Zone”, and providing a safe and healthy work environment;
• business ethics and anti-corruption measures, requiring all staff members to comply with the Bank’s “Code of Conduct”;
• consumer protection measures, requiring disclosure of the schedule of charges and terms and conditions that apply to the Bank’s products and services;
7
8
• amicable staff relations, recognition of merit and performance, and on-going opportunities for learning and growth of staff, both on-the-job and through formal training programmes;
• employment through a transparent procedure, without discrimination on the basis of religion, caste, language, etc., including employment of special persons;
• expansion of the Bank’s branch network to rural areas, which helps in rural development; • contribution to the national exchequer by the Bank by way of direct taxes of about Rs. 5.25 billion
paid to the Government of Pakistan during the year; furthermore, an additional amount of over Rs. 10 billion was deducted/collected by the Bank on account of withholding taxes, federal excise
duties and sales tax on services, and paid to the Government of Pakistan/Provincial Governments.Statement on Corporate and Financial Reporting1. The financial statements, prepared by the Bank, present fairly its state of affairs, the result of its operations,
cash flows and changes in equity.2. Proper books of account have been maintained by the Bank.3. Appropriate accounting policies have been consistently applied in preparation of the financial statements;
changes, if any, have been adequately disclosed and accounting estimates are based on reasonable and prudent judgment.
4. International Financial Reporting Standards and Islamic Financial Accounting Standards, as applicable in Pakistan, have been followed in preparation of financial statements and departure therefrom, if any, has been adequately disclosed.
5. The system of internal controls is sound in design and has been effectively implemented and monitored. The Board’s endorsement of the management’s evaluation related to Internal Control over Financial Reporting, along with endorsement of overall Internal Controls is given on page 13.
6. Going concern assumption is appropriate. There is no identifiable material uncertainty that raises doubt about the ability of the Bank to continue as a going concern.
7. Key operating and financial data for last six years are summarized below: (Rupees in million)
2016 2015 2014 2013 2012 2011
Total customer deposits 584,172 516,213 446,409 386,161 340,393 302,099 Total advances 261,440 207,289 181,737 167,579 147,869 114,872 Profit before tax 13,164 12,332 9,917 7,513 8,878 7,155 Profit after tax 8,119 7,405 6,349 5,155 5,455 4,533 Shareholders' Equity 35,922 31,698 27,555 23,227 21,058 17,723 Earnings per share * (Rs) 7.31 6.66 5.71 4.64 4.91 4.08 Cash Dividend (%) 35 35 30 20 30 25 Stock Dividend (%) – – – 10 – 15
*Earnings per share from 2011 to 2013 have been recalculated based on the existing paid-up capital.
8. Value of investments of Provident Fund and Gratuity Fund Schemes based on latest audited financial statements as at December 31, 2015 was as follows:
(Rupees in ’000) Provident Fund 3,236,974 Gratuity Fund 1,203,984
9. The pattern of shareholding and additional information regarding pattern of shareholding is given on pages 112, 113 & 114
9
10. The Board has approved a formal process for its performance evaluation. The Bank has adopted In-House Approach and Quantitative Technique with scored questionnaires for Board evaluation. Scope of Board evaluation covers evaluation of the full Board, individual Directors, Board Committees, the Chairman, and the Chief Executive. Consolidated results/findings will be discussed with the relevant parties. Any areas of improvement identified during the evaluation will be noted for appropriate action. Evaluation process for each calendar year will be completed latest by April 30 of the next year.
11. No trade in the shares of the Bank was carried out by the Directors, CEO, CFO, Head of Internal Audit, Company Secretary, and Executives and their spouses and minor children, except the following:
• One Director transferred 6,000,000 shares to his relatives;
• Son of a Director, who acts independently, purchased 75,000 shares through a CDC account in which spouse of the Director is a joint account holder with the son.
For the purpose of this disclosure, the definition of “Executive” includes Assistant General Managers and above, in addition to officials already mentioned in the Rule Book of the Pakistan Stock Exchange regulations.
General
We wish to thank our customers for their continued support and confidence, the State Bank of Pakistan for their guidance, and local and foreign correspondents for their cooperation. We also thank all our staff members for their sincere and dedicated services, which enabled the Bank to achieve these satisfactory results.
On behalf of the Board of Directors
ABBAS D. HABIBKarachi: January 26, 2017 Chairman
10
STATEMENT OF COMPLIANCE WITH THE CODE OF CORPORATE GOVERNANCEFOR THE YEAR ENDED DECEMBER 31, 2016
This statement is being presented to comply with the Code of Corporate Governance (“the Code”) contained in Rule Book of Pakistan Stock Exchange Limited (PSX) for the purpose of establishing a framework of good governance, whereby a listed company is managed in compliance with the best practices of corporate governance.
The Bank has applied the principles contained in the Code in the following manner:1. The Bank encourages representation of independent non-executive directors and directors representing
minority interest on its Board of Directors. At present the Board includes:
Category Names Independent Directors Syed Mazhar Abbas Syed Hasan Ali Bukhari Mr. Arshad Nasar Executive Director Mr. Qumail R. Habib Non-Executive Directors Mr. Abbas D. Habib Mr. Ali Raza D. Habib Mr. Anwar Haji Karim Mr. Murtaza H. Habib Mr. Safar Ali Lakhani Mr. Shahid Ghaffar
The independent directors meet the criteria of independence as per Prudential Regulations of State Bank of Pakistan.
2. The directors have confirmed that none of them is serving as a director in more than seven listed companies, including the Bank.
3. All the directors of the Bank are registered as taxpayers and none of them has defaulted in payment of any loan to a banking company, a DFI or an NBFC or, being a member of a stock exchange, has been declared as a defaulter by that stock exchange.
4. A casual vacancy occurred on the Board during the year which was filled up by the directors within stipulated time.
5. The Bank has prepared a “Code of Conduct” and has ensured that appropriate steps have been taken to disseminate it throughout the Bank along with supporting policies and procedures.
6. The Board has developed a vision/mission statement, overall corporate strategy and significant policies of the Bank. A complete record of particulars of significant policies along with the dates on which they were approved or amended has been maintained.
7. All the powers of the Board have been duly exercised and decisions on material transactions, including appointment and determination of remuneration and terms and conditions of employment of the CEO and Executive Director, together with appointment and remuneration of the Chairman, have been taken by the Board/shareholders.
8. The meetings of the Board were presided over by the Chairman and, in his absence, by a director elected by the Board for this purpose and the Board met at least once in every quarter. Written notices of Board meetings, along with agenda and working papers, were circulated at least seven days before the meetings. The minutes of the meetings were appropriately recorded and circulated.
9. The directors of the Bank are well conversant with their duties and responsibilities. One director attended training program during the year.
11
10. The Board has approved appointment of Chief Financial Officer, Company Secretary and Head of Internal Audit, including their remuneration and terms and conditions of employment.
11. The Directors’ Report for the year has been prepared in compliance with the requirements of the Code and fully describes the salient matters required to be disclosed.
12. The financial statements of the Bank were duly endorsed by CEO and CFO before approval of the Board.
13. The directors, CEO and executives do not hold any interest in the shares of the Bank other than that disclosed in the pattern of shareholding.
14. The Bank has complied with all the corporate and financial reporting requirements of the Code.15. The Board has formed an Audit Committee. It comprises five members, who are independent or
non-executive directors. Chairman of the Committee is an independent director.16. Meetings of the Audit Committee were held at least once in every quarter prior to approval of interim
and final results of the Bank and as required by the Code. The terms of reference of the Committee have been formed and advised to the Committee for compliance.
17. The Board has formed a Human Resource & Remuneration Committee. It comprises five members, of whom all are non-executive directors, including the Chairman of the Committee.
18. The Bank has an effective internal audit division that is manned by suitably qualified and experienced personnel. The audit team is conversant with the policies and procedures of the Bank.
19. The statutory auditors of the Bank have confirmed that they have been given a satisfactory rating under the quality control review programme of the Institute of Chartered Accountants of Pakistan, that they or any of the partners of the firm, their spouses and minor children do not hold shares of the Bank and that the firm and all its partners are in compliance with International Federation of Accountants (IFAC) guidelines on code of ethics as adopted by the Institute of Chartered Accountants of Pakistan.
20. The statutory auditors or the persons associated with them have not been appointed to provide other services except in accordance with the PSX regulations and the auditors have confirmed that they have observed IFAC guidelines in this regard.
21. The ‘closed period’ prior to the announcement of interim/final results, and business decisions, which may materially affect the market price of Bank’s securities, was determined and intimated to directors, employees and stock exchange.
22. Material/price sensitive information has been disseminated among all market participants at once through stock exchange.
23. The Bank has complied with the requirements relating to maintenance of register of persons having access to inside information by designated senior management officer in a timely manner and maintained proper record including basis for inclusion or exclusion of names of persons from the said list.
24. We confirm that all the other material principles contained in the Code have been complied with.
On behalf of the Board of Directors
ABBAS D. HABIBKarachi: January 26, 2017 Chairman
12
REVIEW REPORT TO THE MEMBERS ON STATEMENT OF COMPLIANCE WITH THE CODE OF CORPORATE GOVERNANCE
We have reviewed the enclosed Statement of Compliance with the best practices contained in the Code of Corporate Governance (“the Code”) prepared by the Board of Directors of Bank AL Habib Limited (“the Bank”) for the year ended 31 December 2016 to comply with the requirements of Regulations contained in the Rule Book of the Pakistan Stock Exchange where the Bank is listed.
The responsibility for compliance with the Code is that of the Board of Directors of the Bank. Our responsibility is to review, to the extent where such compliance can be objectively verified, whether the Statement of Compliance reflects the status of the Bank’s compliance with the provisions of the Code and report if it does not and to highlight any non-compliance with the requirements of the Code. A review is limited primarily to inquiries of the Bank’s personnel and review of various documents prepared by the Bank to comply with the Code.
As part of our audit of the financial statements we are required to obtain an understanding of the accounting and internal control systems sufficient to plan the audit and develop an effective audit approach. We are not required to consider whether the Board of Directors’ statement on internal control covers all risks and controls, or to form an opinion on the effectiveness of such internal controls, the Bank’s corporate governance procedures and risks.
The Code requires the Bank to place before the Audit Committee, and upon recommendation of the Audit Committee, place before the Board of Directors for their review and approval its related party transactions distinguishing between transactions carried out on terms equivalent to those that prevail in arm’s length transactions and transactions which are not executed at arm’s length price and recording proper justification for using such alternate pricing mechanism. We are only required and have ensured compliance of this requirement to the extent of the approval of the related party transactions by the Board of Directors upon recommendation of the Audit Committee. We have not carried out any procedures to determine whether the related party transactions were undertaken at arm’s length price or not.
Based on our review, nothing has come to our attention which causes us to believe that the Statement of Compliance does not appropriately reflect the Bank’s compliance, in all material respects, with the best practices contained in the Code as applicable to the Bank for the year ended 31 December 2016.
KPMG Taseer Hadi & Co.Karachi: January 26, 2017 Chartered Accountants
STATEMENT ON INTERNAL CONTROLS
The Management of the Bank is responsible for establishing the Internal Control System with the main objectives of ensuring effectiveness and efficiency of operations; reliability of financial reporting; safeguarding of assets; and compliance with applicable laws and regulations. The Internal Control System has evolved over the years, as it is an ongoing process and is included in the Bank’s policies, procedures, financial limits, etc., as detailed in various manuals, circulars and instructions issued by the Bank. This system continues to be reviewed, refined and improved from time to time and immediate corrective action is taken to minimize risks which are inherent in banking business and operations. The Internal Control System is reviewed by the Internal Auditors as well as External Auditors and their findings and recommendations are reported to the management and to the Audit Committee of the Board, and corrective action is taken to address control deficiencies and for improving procedures and systems as they are identified. The Board, acting through the Audit Committee, provides supervision and overall guidance in improving the effectiveness of the Internal Control System. While the Internal Control System is effectively implemented and monitored, there are inherent limitations in the effectiveness of any system, including the possibility of human error or system failure and circumvention or overriding of controls. Accordingly, even an effective Internal Control System can only provide reasonable but not absolute assurance that the system’s objectives will be achieved. Internal Control over Financial Reporting (ICFR) aims to provide reasonable assurance regarding the reliability of financial reporting and the preparation of financial statements for external purposes in accordance with the applicable financial reporting standards. During the year, Internal Auditors tested the Bank’s ICFR and reported their findings to the management and the Audit Committee of the Board. While no material deficiencies were detected, indicating that ICFR is effectively implemented in the Bank, it may be reiterated that any control system can provide reasonable but not absolute assurance that its objectives will be achieved.In accordance with the State Bank of Pakistan (SBP) directives, the Bank has completed all the stages of ICFR. Upon satisfactory completion of ICFR roadmap, the Bank has been granted exemption by SBP from the requirement of submission of Long Form Report by the External Auditors. The Bank has endeavored to follow the guidelines issued by SBP on internal controls. Updation and review of ICFR exercise for the year 2016 as per SBP Guidelines on Internal Controls has been successfully completed. In accordance with SBP directives, the annual assessment report for the year 2016 will be submitted by the Audit Committee of the Board to SBP within the stipulated time. Evaluation and management of significant risks is an on-going process and we will make further efforts to improve our Internal Control System during 2017.
BOARD OF DIRECTORS’ REMARKS ON THE MANAGEMENT’S EVALUATION OF INTERNAL CONTROLS
Keeping in view the feedback received by the Board of Directors from the Audit Committee and the management, the Board of Directors endorse management’s evaluation of Internal Controls, including Internal Control over Financial Reporting.
On behalf of the Board of Directors
ABBAS D. HABIBKarachi: January 26, 2017 Chairman
ARIF SAEED KHANHead of Internal Audit
ASHAR HUSAINChief Financial Officer
Karachi: January 26, 2017
13
14
AUDITORS' REPORT TO THE MEMBERSWe have audited the annexed unconsolidated statement of financial position of Bank AL Habib Limited (“the Bank”) as at 31 December 2016 and the related unconsolidated profit and loss account, unconsolidated statement of comprehensive income, unconsolidated cash flow statement and unconsolidated statement of changes in equity together with the notes forming part thereof (here-in-after referred to as the ‘financial statements’) for the year then ended, in which are incorporated the unaudited certified returns from the branches except for eighteen branches which have been audited by us and we state that we have obtained all the information and explanations which, to the best of our knowledge and belief, were necessary for the purposes of our audit.It is the responsibility of the Bank’s Board of Directors to establish and maintain a system of internal control, and prepare and present the financial statements in conformity with approved accounting standards and the requirements of the Banking Companies Ordinance, 1962 (LVII of 1962), and the Companies Ordinance, 1984 (XLVII of 1984). Our responsibility is to express an opinion on these statements based on our audit.We conducted our audit in accordance with the International Standards on Auditing as applicable in Pakistan. These standards require that we plan and perform the audit to obtain reasonable assurance about whether the financial statements are free of any material misstatement. An audit includes examining, on a test basis, evidence supporting the amounts and disclosures in the financial statements. An audit also includes assessing the accounting policies and significant estimates made by management, as well as, evaluating the overall presentation of the financial statements. We believe that our audit provides a reasonable basis for our opinion and, after due verification, which in case of loans and advances covered more than sixty percent of the total loans and advances of the Bank, we report that:a) in our opinion, proper books of account have been kept by the Bank as required by the Companies
Ordinance, 1984 (XLVII of 1984), and the returns referred to above received from the branches have been found adequate for the purposes of our audit;
b) in our opinion: i) the unconsolidated statement of financial position and the unconsolidated profit and loss
account together with the notes thereon have been drawn up in conformity with the Banking Companies Ordinance, 1962 (LVII of 1962), and the Companies Ordinance, 1984 (XLVII of 1984), and are in agreement with the books of account and are further in accordance with the accounting policies consistently applied except for the change disclosed in note 5.1.1 to the accompanying financial statements, with which we concur;
ii) the expenditure incurred during the year was for the purpose of the Bank’s business; and iii) the business conducted, investments made and the expenditure incurred during the year
were in accordance with the objects of the Bank and the transactions of the Bank which have come to our notice have been within the powers of the Bank;
c) in our opinion and to the best of our information and according to the explanations given to us, the unconsolidated statement of financial position, unconsolidated profit and loss account, unconsolidated statement of comprehensive income, unconsolidated cash flow statement and unconsolidated statement of changes in equity together with the notes forming part thereof conform with approved accounting standards as applicable in Pakistan, and, give the information required by the Banking Companies Ordinance, 1962 (LVII of 1962), and the Companies Ordinance, 1984 (XLVII of 1984), in the manner so required and give a true and fair view of the state of the Bank’s affairs as at 31 December 2016 and its true balance of profit, its cash flows and its changes in equity for the year then ended; and
d) in our opinion Zakat deductible at source, under the Zakat and Ushr Ordinance, 1980 (XVIII of 1980), was deducted by the Bank and deposited in the Central Zakat Fund established under section 7 of that Ordinance.
KPMG Taseer Hadi & Co.Karachi: January 26, 2017 Chartered Accountants Muhammad Taufiq
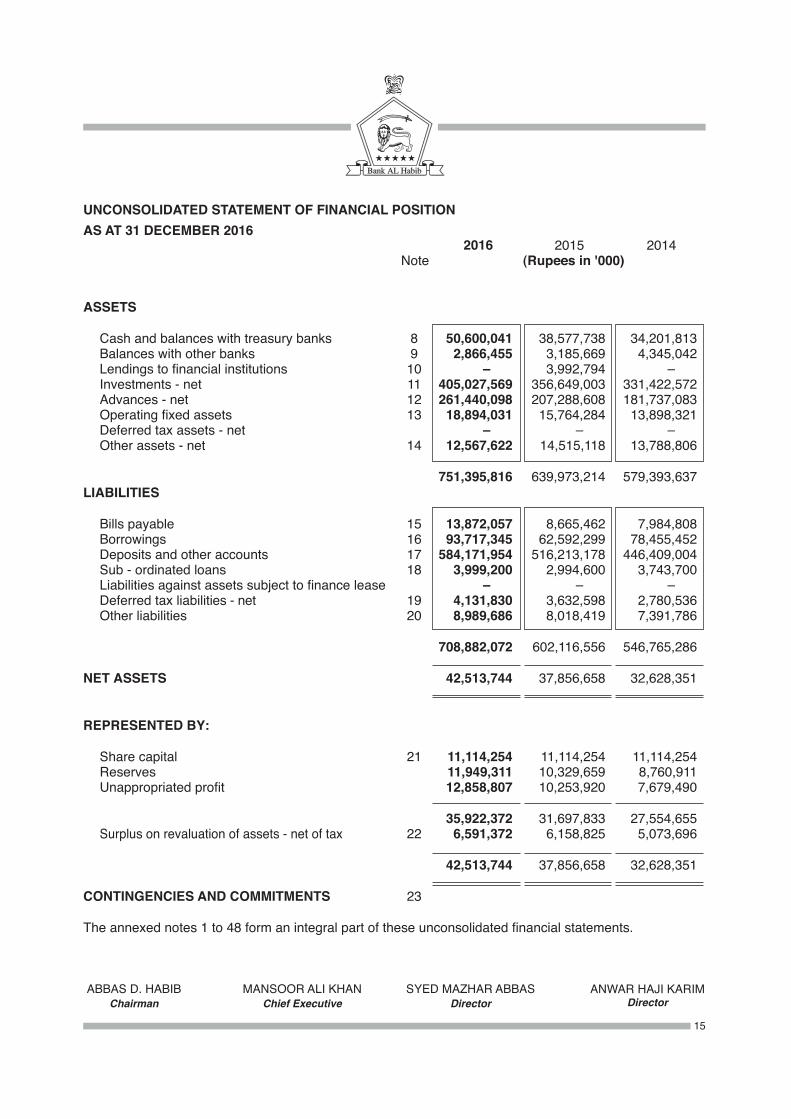
UNCONSOLIDATED STATEMENT OF FINANCIAL POSITIONAS AT 31 DECEMBER 2016 2016 2015 2014 Note (Rupees in '000)
ASSETS Cash and balances with treasury banks 8 50,600,041 38,577,738 34,201,813 Balances with other banks 9 2,866,455 3,185,669 4,345,042 Lendings to financial institutions 10 –000 3,992,794 –000 Investments - net 11 405,027,569 356,649,003 331,422,572 Advances - net 12 261,440,098 207,288,608 181,737,083 Operating fixed assets 13 18,894,031 15,764,284 13,898,321 Deferred tax assets - net –000 –000 –000 Other assets - net 14 12,567,622 14,515,118 13,788,806
751,395,816 639,973,214 579,393,637LIABILITIES
Bills payable 15 13,872,057 8,665,462 7,984,808 Borrowings 16 93,717,345 62,592,299 78,455,452 Deposits and other accounts 17 584,171,954 516,213,178 446,409,004 Sub - ordinated loans 18 3,999,200 2,994,600 3,743,700 Liabilities against assets subject to finance lease –000 –000 –000 Deferred tax liabilities - net 19 4,131,830 3,632,598 2,780,536 Other liabilities 20 8,989,686 8,018,419 7,391,786
708,882,072 602,116,556 546,765,286
NET ASSETS 42,513,744 37,856,658 32,628,351
REPRESENTED BY:
Share capital 21 11,114,254 11,114,254 11,114,254 Reserves 11,949,311 10,329,659 8,760,911 Unappropriated profit 12,858,807 10,253,920 7,679,490
35,922,372 31,697,833 27,554,655 Surplus on revaluation of assets - net of tax 22 6,591,372 6,158,825 5,073,696
42,513,744 37,856,658 32,628,351
CONTINGENCIES AND COMMITMENTS 23
The annexed notes 1 to 48 form an integral part of these unconsolidated financial statements.
15
MANSOOR ALI KHANChief Executive
ABBAS D. HABIBChairman
SYED MAZHAR ABBASDirector
ANWAR HAJI KARIMDirector
16
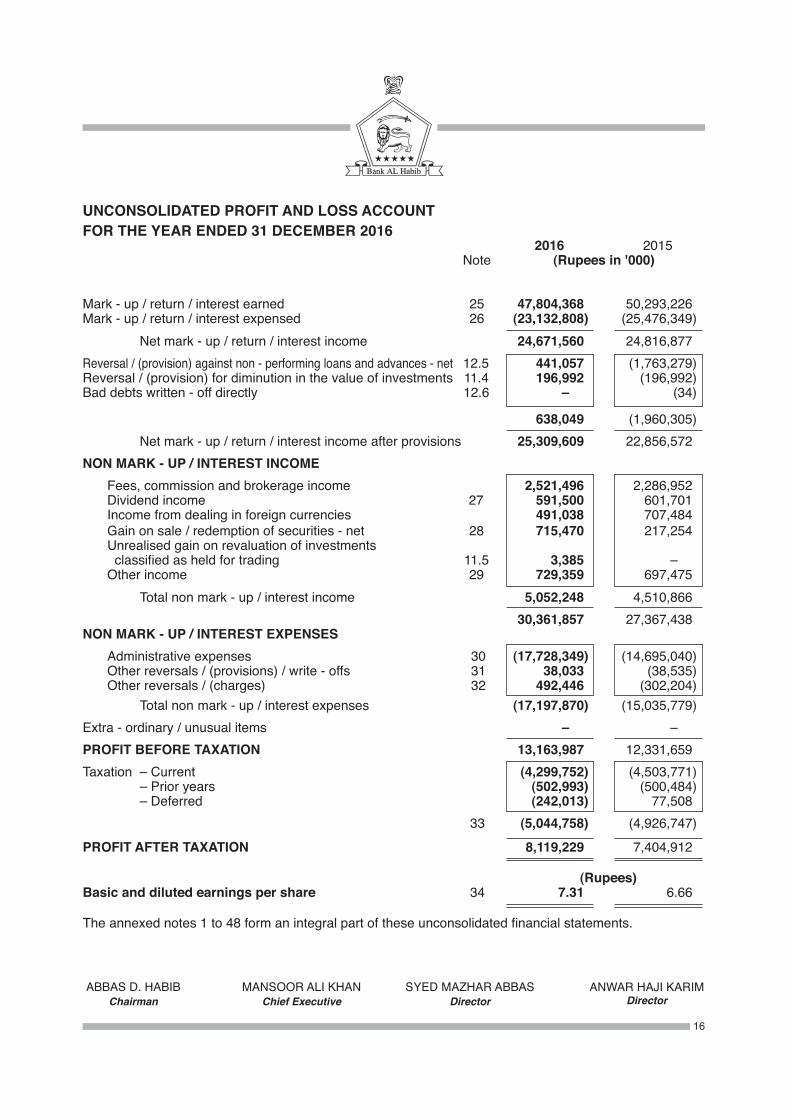
UNCONSOLIDATED PROFIT AND LOSS ACCOUNTFOR THE YEAR ENDED 31 DECEMBER 2016 2016 2015 Note (Rupees in '000) Mark - up / return / interest earned 25 47,804,368 50,293,226Mark - up / return / interest expensed 26 (23,132,808 ) (25,476,349 ) Net mark - up / return / interest income 24,671,560 24,816,877Reversal / (provision) against non - performing loans and advances - net 12.5 441,057 (1,763,279 )Reversal / (provision) for diminution in the value of investments 11.4 196,992 (196,992 )Bad debts written - off directly 12.6 –00 (34 )
638,049 (1,960,305 ) Net mark - up / return / interest income after provisions 25,309,609 22,856,572NON MARK - UP / INTEREST INCOME Fees, commission and brokerage income 2,521,496 2,286,952 Dividend income 27 591,500 601,701 Income from dealing in foreign currencies 491,038 707,484 Gain on sale / redemption of securities - net 28 715,470 217,254 Unrealised gain on revaluation of investments classified as held for trading 11.5 3,385 –00 Other income 29 729,359 697,475 Total non mark - up / interest income 5,052,248 4,510,866 30,361,857 27,367,438NON MARK - UP / INTEREST EXPENSES Administrative expenses 30 (17,728,349 ) (14,695,040 ) Other reversals / (provisions) / write - offs 31 38,033 (38,535 ) Other reversals / (charges) 32 492,446 (302,204 ) Total non mark - up / interest expenses (17,197,870 ) (15,035,779 )Extra - ordinary / unusual items –00 –00PROFIT BEFORE TAXATION 13,163,987 12,331,659Taxation – Current (4,299,752 ) (4,503,771 ) – Prior years (502,993 ) (500,484 ) – Deferred (242,013 ) 77,508 33 (5,044,758 ) (4,926,747 )
PROFIT AFTER TAXATION 8,119,229 7,404,912
(Rupees)Basic and diluted earnings per share 34 7.31 6.66
The annexed notes 1 to 48 form an integral part of these unconsolidated financial statements.
MANSOOR ALI KHANChief Executive
ABBAS D. HABIBChairman
SYED MAZHAR ABBASDirector
ANWAR HAJI KARIMDirector
17
UNCONSOLIDATED STATEMENT OF COMPREHENSIVE INCOMEFOR THE YEAR ENDED 31 DECEMBER 2016 2016 2015 Note (Rupees in '000)
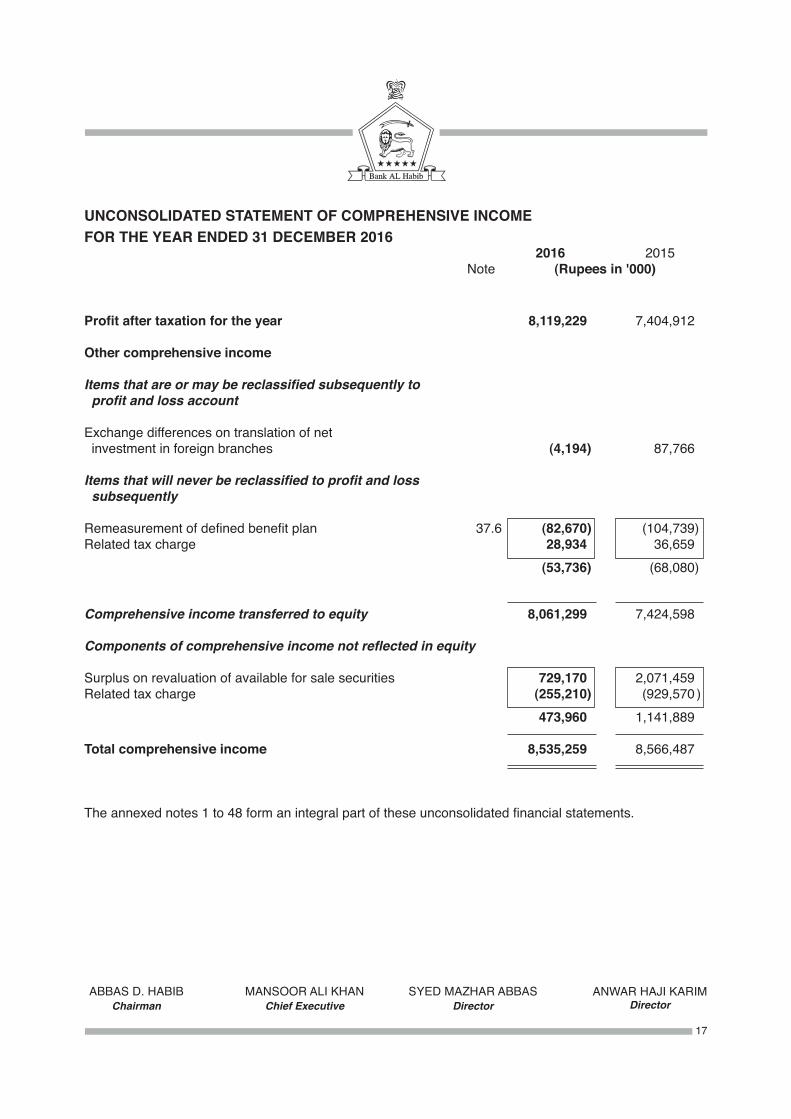
Profit after taxation for the year 8,119,229 7,404,912
Other comprehensive income
Items that are or may be reclassified subsequently to profit and loss account
Exchange differences on translation of net investment in foreign branches (4,194 ) 87,766
Items that will never be reclassified to profit and loss subsequently
Remeasurement of defined benefit plan 37.6 (82,670 ) (104,739 )Related tax charge 28,934 36,659 (53,736 ) (68,080 ) Comprehensive income transferred to equity 8,061,299 7,424,598
Components of comprehensive income not reflected in equity
Surplus on revaluation of available for sale securities 729,170 2,071,459Related tax charge (255,210 ) (929,570 ) 473,960 1,141,889
Total comprehensive income 8,535,259 8,566,487
The annexed notes 1 to 48 form an integral part of these unconsolidated financial statements.
MANSOOR ALI KHANChief Executive
ABBAS D. HABIBChairman
SYED MAZHAR ABBASDirector
ANWAR HAJI KARIMDirector
18
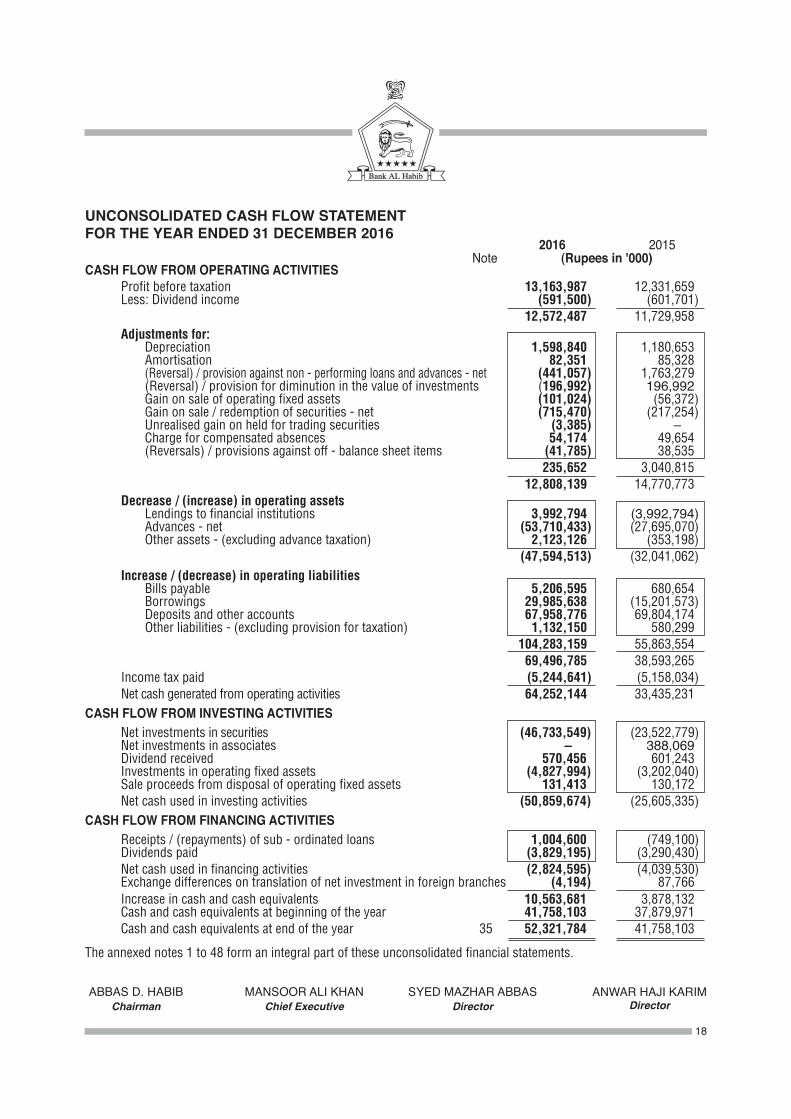
UNCONSOLIDATED CASH FLOW STATEMENTFOR THE YEAR ENDED 31 DECEMBER 2016 2016 2015 Note (Rupees in '000)CASH FLOW FROM OPERATING ACTIVITIES Profit before taxation 13,163,987 12,331,659 Less: Dividend income (591,500 ) (601,701 ) 12,572,487 11,729,958 Adjustments for: Depreciation 1,598,840 1,180,653 Amortisation 82,351 85,328 (Reversal) / provision against non - performing loans and advances - net (441,057 ) 1,763,279 (Reversal) / provision for diminution in the value of investments (196,992 ) 196,992 Gain on sale of operating fixed assets (101,024 ) (56,372 ) Gain on sale / redemption of securities - net (715,470 ) (217,254 ) Unrealised gain on held for trading securities (3,385 ) –00 Charge for compensated absences 54,174 49,654 (Reversals) / provisions against off - balance sheet items (41,785 ) 38,535 235,652 3,040,815 12,808,139 14,770,773 Decrease / (increase) in operating assets Lendings to financial institutions 3,992,794 (3,992,794 ) Advances - net (53,710,433 ) (27,695,070 ) Other assets - (excluding advance taxation) 2,123,126 (353,198 ) (47,594,513 ) (32,041,062 ) Increase / (decrease) in operating liabilities Bills payable 5,206,595 680,654 Borrowings 29,985,638 (15,201,573 ) Deposits and other accounts 67,958,776 69,804,174 Other liabilities - (excluding provision for taxation) 1,132,150 580,299 104,283,159 55,863,554 69,496,785 38,593,265 Income tax paid (5,244,641 ) (5,158,034 ) Net cash generated from operating activities 64,252,144 33,435,231CASH FLOW FROM INVESTING ACTIVITIES Net investments in securities (46,733,549 ) (23,522,779 ) Net investments in associates –00 388,069 Dividend received 570,456 601,243 Investments in operating fixed assets (4,827,994 ) (3,202,040 ) Sale proceeds from disposal of operating fixed assets 131,413 130,172 Net cash used in investing activities (50,859,674 ) (25,605,335 )CASH FLOW FROM FINANCING ACTIVITIES Receipts / (repayments) of sub - ordinated loans 1,004,600 (749,100 ) Dividends paid (3,829,195 ) (3,290,430 ) Net cash used in financing activities (2,824,595 ) (4,039,530 ) Exchange differences on translation of net investment in foreign branches (4,194 ) 87,766 Increase in cash and cash equivalents 10,563,681 3,878,132 Cash and cash equivalents at beginning of the year 41,758,103 37,879,971 Cash and cash equivalents at end of the year 35 52,321,784 41,758,103
The annexed notes 1 to 48 form an integral part of these unconsolidated financial statements.
MANSOOR ALI KHANChief Executive
ABBAS D. HABIBChairman
SYED MAZHAR ABBASDirector
ANWAR HAJI KARIMDirector
19
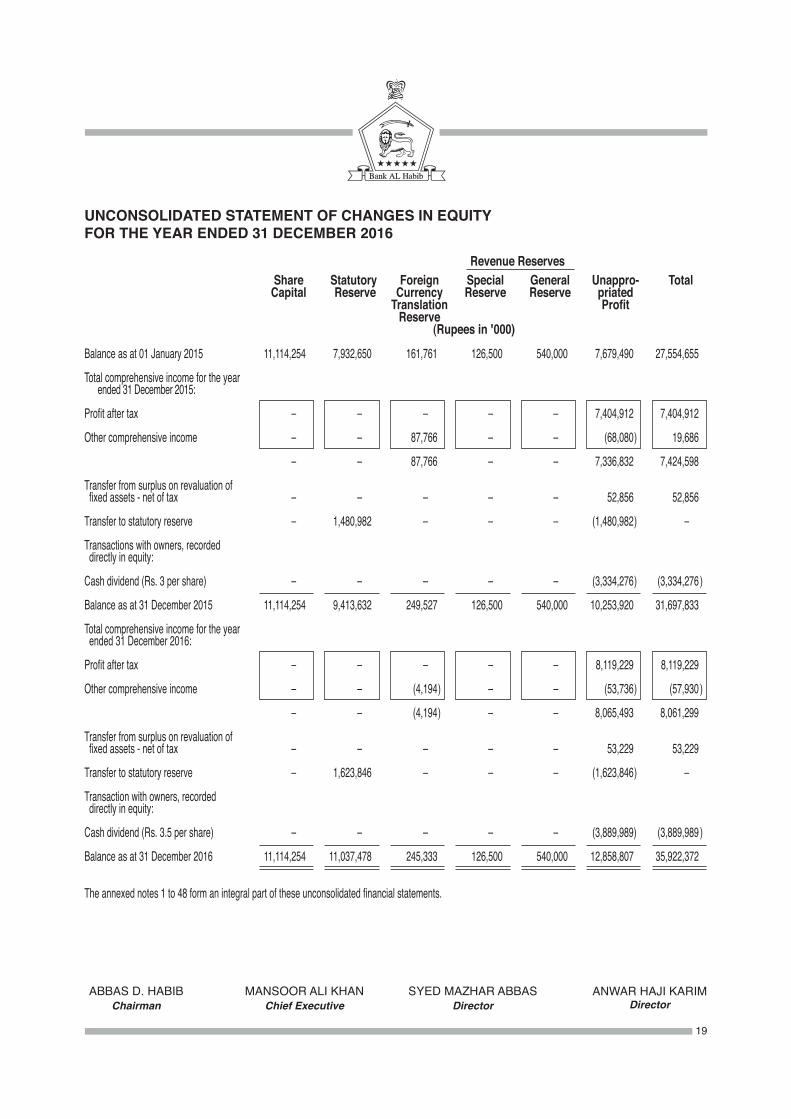
UNCONSOLIDATED STATEMENT OF CHANGES IN EQUITYFOR THE YEAR ENDED 31 DECEMBER 2016
Revenue Reserves Share Statutory Foreign Special General Unappro- Total Capital Reserve Currency Reserve Reserve priated Translation Profit Reserve (Rupees in '000)
Balance as at 01 January 2015 11,114,254 7,932,650 161,761 126,500 540,000 7,679,490 27,554,655
Total comprehensive income for the year ended 31 December 2015:
Profit after tax –00 –00 –00 –00 –00 7,404,912 7,404,912
Other comprehensive income –00 –00 87,766 –00 –00 (68,080 ) 19,686 –00 –00 87,766 –00 –00 7,336,832 7,424,598
Transfer from surplus on revaluation of fixed assets - net of tax –00 –00 –00 –00 –00 52,856 52,856
Transfer to statutory reserve –00 1,480,982 –00 –00 –00 (1,480,982 ) –00 0Transactions with owners, recorded directly in equity:
Cash dividend (Rs. 3 per share) –00 –00 –00 –00 –00 (3,334,276 ) (3,334,276 )
Balance as at 31 December 2015 11,114,254 9,413,632 249,527 126,500 540,000 10,253,920 31,697,833
Total comprehensive income for the year ended 31 December 2016:
Profit after tax –00 –00 –00 –00 –00 8,119,229 8,119,229
Other comprehensive income –00 –00 (4,194 ) –00 –00 (53,736 ) (57,930 )
–00 –00 (4,194 ) –00 –00 8,065,493 8,061,299
Transfer from surplus on revaluation of fixed assets - net of tax –00 –00 –00 –00 –00 53,229 53,229
Transfer to statutory reserve –00 1,623,846 –00 –00 –00 (1,623,846 ) –00
Transaction with owners, recorded directly in equity:
Cash dividend (Rs. 3.5 per share) –00 –00 –00 –00 –00 (3,889,989 ) (3,889,989 )
Balance as at 31 December 2016 11,114,254 11,037,478 245,333 126,500 540,000 12,858,807 35,922,372
The annexed notes 1 to 48 form an integral part of these unconsolidated financial statements.
MANSOOR ALI KHANChief Executive
ABBAS D. HABIBChairman
SYED MAZHAR ABBASDirector
ANWAR HAJI KARIMDirector
NOTES TO THE UNCONSOLIDATED FINANCIAL STATEMENTSFOR THE YEAR ENDED 31 DECEMBER 2016
1. STATUS AND NATURE OF BUSINESS Bank AL Habib Limited (the Bank) is a banking company incorporated in Pakistan on 15 October
1991 as a public limited company under the Companies Ordinance, 1984 having its registered office at 126 - C, Old Bahawalpur Road, Multan with principal place of business in Karachi. Its shares are listed on Pakistan Stock Exchange Limited. It is a scheduled bank principally engaged in the business of commercial banking with a network of 518 branches (2015: 423 branches), 87 sub-branches (2015: 105 sub - branches) and 03 representative offices (2015: 03 representative offices). The branch network of the Bank includes 03 overseas branches (2015: 03 overseas branches) and 41 Islamic Banking branches (2015: 29 Islamic Banking branches).
2. BASIS OF PRESENTATION2.1 These unconsolidated financial statements have been prepared in conformity with the format of
financial statements prescribed by the State Bank of Pakistan (SBP) vide BSD Circular No. 04, dated 17 February 2006.
2.2 In accordance with the directives of the Federal Government regarding the shifting of the banking system to Islamic modes, SBP has issued various circulars from time to time. Permissible forms of trade - related modes of financing includes purchase of goods by banks from customers and immediate resale to them at appropriate mark - up in price on deferred payment basis. The purchase and resale arising under these arrangements are not reflected in these unconsolidated financial statements as such, but are restricted to the amount of facility actually utilised and the appropriate portion of mark - up thereon. However, the Islamic Banking branches of the Bank have complied with the requirements set out under the Islamic Financial Accounting Standards (IFAS).
2.3 The financial results of the Islamic Banking branches have been consolidated in these unconsolidated financial statements for reporting purposes, after eliminating material inter-branch transactions / balances. Key financial information of the Islamic Banking branches is disclosed in note 45.
2.4 These are separate financial statements of the Bank in which investments in subsidiaries and associates are reported on the basis of direct equity interest and are not consolidated or accounted for by using equity method of accounting.
3. STATEMENT OF COMPLIANCE 3.1 These unconsolidated financial statements of the Bank have been prepared in accordance with
approved accounting standards as applicable in Pakistan. Approved accounting standards comprise International Financial Reporting Standards (IFRS) issued by the International Accounting Standards Board (IASB) and IFAS issued by the Institute of Chartered Accountants of Pakistan (ICAP) as are notified under the Companies Ordinance, 1984, the requirements of the Companies Ordinance, 1984, the Banking Companies Ordinance, 1962 and regulations / directives issued by the Securities and Exchange Commission of Pakistan (SECP) and SBP. Wherever the requirements of the Companies Ordinance, 1984, the Banking Companies Ordinance, 1962 or regulations / directives issued by SECP and SBP differ with the requirements of IFRS or IFAS, the requirements of the Companies Ordinance, 1984, the Banking Companies Ordinance, 1962 or the requirements of the said regulations / directives shall prevail.
3.2 SBP vide BSD Circular No. 10, dated 26 August 2002 has deferred the applicability of International Accounting Standard (IAS) 39, "Financial Instruments: Recognition and Measurement" and IAS 40, "Investment Property" for banking companies till further instructions. Further, according to the notification of SECP dated 28 April 2008, IFRS - 7 "Financial Instruments: Disclosures" has not been made applicable for banks. Accordingly, the requirements of these standards have not been considered in the preparation of these unconsolidated financial statements. However, investments have been classified and valued in accordance with the requirements of various circulars issued by SBP.
20
4. BASIS OF MEASUREMENT These unconsolidated financial statements have been prepared under the historical cost
convention except for non - banking assets acquired in satisfaction of claims, certain investments, land and buildings and derivative financial instruments which are revalued as referred to in notes 5.1.1, 5.4, 5.6, 5.14 and 5.15.
5. SIGNIFICANT ACCOUNTING POLICIES5.1 The accounting policies adopted in the preparation of these unconsolidated financial statements
are consistent with those of the previous financial year, except for certain standards, which became effective during the year. However, they don’t have material effect on these unconsolidated financial statements of the Bank.
5.1.1 Change in accounting policy Effective 1 January 2016, the Bank has changed its accounting policy for recording of non -
banking assets acquired in satisfaction of claims to comply with the requirements of the 'Regulations for Debt Property Swap' (the regulations) issued by SBP vide its BPRD Circular No. 1 of 2016, dated 1 January 2016. In line with the guidance provided in the Regulations, the non - banking assets acquired in satisfaction of claims are carried at revalued amounts less accumulated depreciation. These assets are revalued by professionally qualified valuers to ensure that their net carrying value does not differ materially from their fair value. A surplus arising on revaluation of property is credited to the 'surplus on revaluation of fixed assets' account and any deficit arising on revaluation is taken to profit and loss account directly. Legal fees, transfer costs and direct costs of acquiring title to property is charged to profit and loss account and not capitalised. Previously, non - banking assets acquired in satisfaction of claims were carried at cost less impairment, if any. Had the accounting policy not been changed, non - banking assets (included in Other Assets in the statement of financial position), surplus on revaluation of assets and deferred tax liability - net would have been lowered by Rs. 8.101 million, Rs. 11.443 million and Rs. 1.808 million respectively while profit after tax would have been higher by Rs. 3.721 million.
5.2 Cash and cash equivalents Cash and cash equivalents as referred to in the cash flow statement comprise cash and balances
with treasury banks and balances with other banks less overdrawn nostros accounts.5.3 Repurchase / resale agreements The Bank enters into transactions of repos and reverse repos at contracted rates for a specified
period of time. These are recorded as under: Sale under repurchase obligation Securities sold with a simultaneous commitment to repurchase at a specified future date (repos)
continue to be recognised in the statement of financial position and are measured in accordance with accounting policies for investments. Amounts received under these agreements are recorded as repurchase agreement borrowings. The difference between sale and repurchase price is amortised as expense over the term of the repo agreement.
Purchase under resale obligation Securities purchased with a corresponding commitment to resell at a specified future date (reverse
repos) are not recognised as investments in the statement of financial position. Amounts paid under these arrangements are included in repurchase agreement lendings. The difference between purchase and resale price is accrued as income over the term of the reverse repo agreement.
5.4 Investments Investments in subsidiaries and associates are stated at cost less provision for impairment, if any.
Other investments are classified as follows:
21
Held for trading These are investments acquired principally for the purpose of generating profits from short - term
fluctuations in price or dealer’s margin or are securities included in a portfolio in which a pattern of short - term trading exists.
Held to maturity These are investments with fixed or determinable payments and fixed maturities which the Bank
has the intention and ability to hold till maturity. In Bai Muajjal, the Bank sells sukuk on credit to Government of Pakistan. The credit price is agreed
at the time of sale and such proceeds are received at the end of the credit period. Available for sale These are investments which do not fall under held for trading and held to maturity categories. All purchases and sales of investments that require delivery within the time frame established by
regulations or market convention are recognised at the trade date. Trade date is the date on which the Bank commits to purchase or sell the investments.
Investments (other than held for trading) are initially measured at fair value plus transaction cost associated with the investment. Investments classified as held for trading are initially measured at fair value, and transaction costs are expensed in the profit and loss account.
After initial recognition, quoted securities, other than those classified as held to maturity, are carried at market value. Unquoted securities are valued at cost less impairment in value, if any. Held to maturity securities are carried at amortised cost.
Surplus / (deficit) arising on revaluation of quoted securities which are classified as available for sale investments is taken to a separate account which is shown in the statement of financial position below equity. The surplus / (deficit) arising on these securities is taken to the profit and loss account when actually realised upon disposal or in case of impairment of securities. The unrealised surplus / (deficit) arising on revaluation of quoted securities which are classified as held for trading is taken to the profit and loss account.
Provision for diminution in the values of securities (except for debt securities) is made after considering impairment, if any, in their value and is taken to profit and loss account. Impairment is booked when there is an objective evidence of significant or prolonged decline in the value of such securities. Provision for impairment against debt securities is made in accordance with the requirements of the Prudential Regulations of SBP. In case of unquoted equity securities, the breakup value of the security should be considered to determine impairment amount.
Premium or discount on debt securities classified as available for sale and held to maturity is amortised using effective interest method and taken to the profit and loss account.
5.5 Advances Loans and advances These are stated net of provisions for non - performing advances. Provision for non - performing
advances is determined in accordance with the requirements of the Prudential Regulations and is charged to the profit and loss account. The Bank also maintains general provision in addition to the requirements of the Prudential Regulations on the basis of the management's risk assessment. Advances are written - off when there are no realistic prospects of recovery.
Finance lease receivables Leases where the Bank transfers substantially all the risks and rewards incidental to ownership of
an asset to the lessee are classified as finance leases. A receivable is recognised at an amount equal to the present value of the lease payments including any guaranteed residual value.
22
23
Ijarah finance In accordance with the requirements of IFAS 2 'Ijarah', assets leased out under ijarah arrangements
on or after 01 January 2009 are stated at cost less depreciation and impairment, if any, and included under "Advances". Such assets are depreciated over the terms of Ijarah contracts. Ijarah arrangements executed before the above referred date are accounted for as finance lease.
Murabaha Funds disbursed under murabaha arrangements for purchase of goods are recorded as advance
for murabaha. On culmination of murabaha i.e. sale of goods to customers, murabaha receivables are recorded at the sale price net of deferred income. Goods purchased but remaining unsold at the reporting date are recorded as inventories.
Istisna In Istisna financing, the Bank places an order to purchase some specific goods / commodities from
its customers to be delivered to the Bank within an agreed time. The goods are then sold and the amount hence financed is paid back to the Bank.
Diminishing Musharaka In Diminishing Musharaka financing, the Bank enters into Musharaka based on Shirkat - ul - milk for
financing an agreed share of fixed asset (e.g. house, land, plant or machinery) with its customers and enters into periodic rental payment agreement for the utilisation of the Bank’s Musharaka share by the customer. The customer purchases the Bank’s share gradually as per his undertaking.
Musawama In Musawama financing, the Bank purchases specific goods / commodities on cash basis from its
customer for onward sale. Upon realisation of sale proceeds, the finance is adjusted.5.6 Operating fixed assets Tangible operating assets - owned Land is measured at cost at the time of initial recognition and is subsequently carried at revalued
amount. Buildings are initially measured at cost and upon revaluation, are carried at revalued amount less accumulated depreciation and impairment, if any. All other operating fixed assets are stated at cost less accumulated depreciation and impairment, if any. Depreciation is charged to profit and loss account on straight line basis so as to charge the assets over their expected useful lives at the rates specified in note 13.2. The depreciation charge is calculated after taking into account residual value, if any. The residual values, useful lives and depreciation method are reviewed annually and adjusted, if appropriate. Depreciation is charged on prorata basis, i.e., full month charge in the month of purchase and no charge in the month of disposal.
Land and buildings are revalued by independent professionally qualified valuers with sufficient regularity to ensure that the net carrying amount does not differ materially from the fair value. The surplus arising on revaluation of fixed assets is credited to the “surplus on revaluation of assets" account shown below equity. The Bank has adopted the following accounting treatment of depreciation on revalued assets, keeping in view the requirements of the Companies Ordinance, 1984 and SECP's SRO 45(1) / 2003 dated 13 January 2003:
- depreciation on assets which are revalued is determined with reference to the value assigned to such assets on revaluation and depreciation charge for the year is taken to the profit and loss account; and
- an amount equal to incremental depreciation for the year net of deferred taxation is transferred from surplus on revaluation of assets to unappropriated profit through statement of changes in equity to record realisation of surplus to the extent of the incremental depreciation charge for the year.
24
Subsequent costs are included in the asset’s carrying amount or recognised as a separate asset, as appropriate, only when it is probable that future economic benefits associated with the item will flow to the Bank and the cost of the item can be measured reliably. The carrying amount of the replaced part is derecognised. All other repairs and maintenance are charged to the income statement during the financial period in which they are incurred.
Gains and losses on disposal of fixed assets are included in income currently, except that the related surplus on revaluation of land and buildings (net of deferred tax) is transferred directly to unappropriated profit.
Tangible operating assets - leased Leases where the Bank assumes substantially all the risks and rewards of ownership are classified
as finance leases. Assets subject to finance lease are accounted for by recording the assets and related liability. These are stated at lower of fair value and the present value of minimum lease payments at the inception of lease less accumulated depreciation. Financial charges are allocated over the period of lease term so as to provide a constant periodic rate of financial charge on the outstanding liability. Depreciation is charged on the basis similar to the owned assets.
Intangible assets Intangible assets having a finite useful life are stated at cost less accumulated amortisation and
impairment, if any. Amortisation is based on straight line method by taking into consideration the estimated useful life of assets at the rates specified in note 13.3. Intangible assets are amortised on prorata basis i.e. full month amortisation in the month of purchase and no amortisation in the month of disposal.
Capital work in progress Capital work in progress is stated at cost less impairment, if any. Impairment The carrying values of fixed assets are reviewed for impairment when events or changes in
circumstances indicate that the carrying values may not be recoverable. If any such indication exists and where the carrying values exceed the estimated recoverable amounts, the fixed assets are written down to their recoverable amounts.
The resulting impairment loss is taken to profit and loss account except for impairment loss on revalued assets which is adjusted against the related revaluation surplus to the extent that the impairment loss does not exceed the surplus on revaluation of assets.
5.7 Employees' benefits Defined benefit plan The Bank operates an approved gratuity fund for all its confirmed employees, which is administered
by the Trustees. The Bank's costs and contributions are determined based on actuarial valuation carried out at each year end using Projected Unit Credit Actuarial Method. All actuarial gains and losses are recognised in 'other comprehensive income' as they occur and are not reclassified to profit or loss in subsequent periods.
Defined contribution plan The Bank operates an approved provident fund scheme for all its regular permanent employees,
administered by the Trustees. Equal monthly contributions are made both by the Bank and its employees to the fund at the rate of 10% of the basic salary in accordance with the terms of the scheme.
Compensated absences The Bank accounts for all accumulating compensated absences when employees render service
that increases their entitlement to future compensated absences. The liability is determined based on actuarial valuation carried out using the Projected Unit Credit Method.
25
5.8 Provisions against liabilities These are recognised when the Bank has a legal or constructive obligation as a result of past
events, it is probable that an outflow of resources will be required to settle the obligation and a reliable estimate of the amount can be made. Provisions are reviewed at each reporting date and are adjusted to reflect the current best estimate.
5.9 Provisions against off - balance sheet obligations The Bank, in the ordinary course of business, issues letters of credit, acceptances, guarantees, bid
bonds, performance bonds etc. The commission against such contracts is recognised in the profit and loss account under "fees, commission and brokerage income" over the period of contracts. The Bank's liability under such contracts is measured at the higher of the amount representing unearned commission income at the reporting date and the best estimate of the amount expected to settle any financial obligation arising under such contracts.
5.10 Sub - ordinated loans Sub - ordinated loans are initially recorded at the amount of proceeds received. Mark - up accrued
on sub - ordinated loans is recognised separately as part of other liabilities and is charged to the profit and loss account over the period on an accrual basis.
5.11 Revenue recognition (a) Mark - up / interest / return on advances and investments is recognised on accrual basis, except
in case of advances classified under the Prudential Regulations on which mark - up is recognised on receipt basis. Mark - up / interest / return on rescheduled / restructured loans and advances and investments is recognised as permitted by the regulations of SBP.
(b) Financing method is used in accounting for income from lease financing. Under this method, the unrealised lease income is deferred and taken to income over the term of the lease period so as to produce a constant periodic rate of return on the outstanding net investment in lease. Gain / loss on termination of lease contracts, front end fee and other lease income are recognised as income on receipt basis.
(c) The rentals from ijarah are recognised as income over the term of the contract net of depreciation expense relating to the ijarah assets.
(d) Income from murabaha is accounted for on a time proportionate basis over the period of murabaha transaction.
(e) Dividend income is recognised when the right to receive is established. (f) Gain or loss on sale of investments are recognised in profit and loss account in the year in which
they arise. (g) Fee, commission and brokerage income are recognised as services are performed.5.12 Taxation Income tax expense comprises current and deferred tax. Income tax expense is recognised in profit
and loss account except to the extent that it relates to the items recognised directly in equity or surplus on revaluation of assets, in which case it is recognised in equity or surplus on revaluation of assets.
Current Provision for current tax is based on the taxable income for the year, using tax rates enacted or
substantively enacted at the statement of financial position date and any adjustments to the tax payable in respect of previous years. Current tax assets and liabilities are measured at the amount expected to be recovered from or paid to taxation authorities.
26
Deferred Deferred tax is provided on all temporary differences at the statement of financial position date
between the tax bases of assets and liabilities and their carrying amounts for financial reporting purposes.
Deferred tax assets are recognised for all deductible temporary differences and unused tax losses, to the extent that it is probable that taxable profits will be available against which the deductible temporary differences and unused tax losses can be utilised.
Deferred tax liabilities are recognised for all taxable temporary differences, except in respect of taxable temporary differences associated with investment in foreign operations, when the timing of the reversal of the temporary differences can be controlled and it is probable that the temporary differences will not reverse in the foreseeable future.
The carrying amount of deferred income tax assets are reviewed at each statement of financial position date and reduced to the extent that it is no longer probable that sufficient taxable profit or taxable temporary differences will be available to allow all or part of the deferred income tax asset to be utilised.
Deferred tax assets and liabilities are measured at the tax rates that are expected to apply to the period when the asset is realised or the liability is settled, based on tax rates (and tax laws) that have been enacted or substantively enacted at the statement of financial position date.
5.13 Statutory reserve Every Bank incorporated in Pakistan is required to transfer 20% of their profit to a statutory reserve
until the reserve equals share capital, thereafter 10% of the profit of the Bank is to be transferred to this reserve.
5.14 Currency translation Functional and presentation currency These financial statements are presented in Pak Rupees which is the Bank's functional currency
and presentation currency. Transactions and balances in foreign currencies Foreign currency transactions are translated into Pak Rupees at the exchange rates prevailing on
the date of transaction. Monetary assets and liabilities in foreign currencies are translated into Pak Rupees at the exchange rates prevailing at the reporting date. Non - monetary items that are measured in terms of historical cost in a foreign currency are translated using the exchange rates at the dates of the initial transactions. Non - monetary items measured at fair value in a foreign currency are translated using exchange rates at the date when the fair value was determined. Exchange gains or losses are included in income currently.
Foreign operations The assets and liabilities of foreign operations are translated to Pak Rupees at exchange rates
prevailing at the reporting date. The income and expense of foreign operations are translated at rate of exchange prevailing during the year. Exchange gain or loss on such translation is taken to equity through statement of other comprehensive income under "foreign currency translation reserve".
Commitments Commitments for outstanding forward foreign exchange contracts are translated at forward rates
applicable to their respective maturities.5.15 Financial instruments Financial assets and financial liabilities are recognised at the time when the Bank becomes a party
to the contractual provision of the instrument. Financial assets are de - recognised when the contractual right to future cash flows from the asset expires or is transferred along with the risk and reward of ownership of the asset. Financial liabilities are de - recognised when obligation is discharged, cancelled or expired. Any gain or loss on de - recognition of the financial asset and liability is recognised in the profit and loss account of the current period.
27
5.16 Derivative financial instruments Derivative financial instruments are initially recognised at their fair value on the date on which the
derivative contract is entered into and are subsequently remeasured at fair value. All derivative financial instruments are carried as asset when fair value is positive and liabilities when fair value is negative. Any change in the value of derivative financial instruments is taken to the profit and loss account.
5.17 Off - setting Financial assets and financial liabilities are only off - set and the net amount is reported in the
financial statements when there is a legally enforceable right to set - off the recognised amount and the Bank intends either to settle on a net basis, or to realise the assets and to settle the liabilities simultaneously. Income and expense items of such assets and liabilities are also off - set and the net amount is reported in the financial statements.
5.18 Dividends and appropriations to reserves Dividends and appropriations to reserves are recognised in the year in which these are approved,
except appropriations required by the law which are recorded in the period to which they pertain.5.19 Segment reporting A segment is a distinguishable component of the Bank that is engaged in providing products and
services (business segment), or in providing products or services within a particular economic environment (geographical segment), which is subject to risk and rewards that are different from those of other segments. The segment reporting format has been determined and prepared in conformity with the format of financial statements and guidelines, prescribed by SBP vide BSD Circular No.04, dated, 17 February 2006. The Bank's primary format of reporting is based on business segments.
5.19.1 Business segments Retail banking It consists of retail lending, deposits and banking services to private individuals and small
businesses. The retail banking activities include provision of banking and other financial services, such as current and savings accounts, credit cards, consumer banking products etc., to individual customers, small merchants and SMEs.
Commercial banking Commercial banking represents provision of banking services including treasury and international
trade related activities to large corporate customers, multinational companies, government and semi government departments and institutions and SMEs treated as corporate under the Prudential Regulations.
5.19.2 Geographical segments The Bank operates in four geographic regions, being: - Pakistan - Middle East - Asia Pacific - Africa5.20 Earnings per share The Bank presents basic and diluted earnings per share (EPS). Basic EPS is calculated by dividing
the profit or loss attributable to ordinary shareholders of the Bank by the weighted average number of ordinary shares outstanding during the period / year. Diluted EPS is determined by adjusting the profit or loss attributable to ordinary shareholders and the weighted average number of ordinary shares outstanding for the effects of all dilutive potential ordinary shares, if any. There were no convertible dilutive potential ordinary shares in issue at 31 December 2016.
28
5.21 Clients' assets The Bank provides services that result in the holding of assets on behalf of its clients. Such assets
are not reported in the financial statements, as they are not the assets of the Bank.6. ACCOUNTING JUDGMENTS AND ESTIMATES The preparation of financial statements requires management to make judgments, estimates and
assumptions that affect the application of policies and reported amounts of assets and liabilities, income and expenses. The estimates and associated assumptions are based on historical experience and various other factors that are believed to be reasonable under the circumstances, the result of which forms the basis of making judgment about carrying values of assets and liabilities that are not readily apparent from other sources. Actual results may differ from these estimates. The estimates and underlying assumptions are reviewed on an ongoing basis. Revision to accounting estimates are recognised in the period in which the estimate is revised if the revision affects only that period, or in period of revision and future periods if the revision affects both current and future periods. The estimates and judgments that have a significant effect on the financial statements are in respect of the following:
Note Other assets - Non - banking assets acquired in satisfaction of claims 5.1.1 & 14 Classification of investments and provision for diminution in the value of investments 5.4 & 11 Provision against non - performing advances 5.5 & 12 Useful lives of assets and methods of depreciation and amortisation 5.6 & 13 Employees' benefits 5.7, 20 & 37 Provisions against off - balance sheet obligations 5.9 & 20.2 Current and deferred taxation 5.12 & 197. STANDARDS, INTERPRETATIONS AND AMENDMENTS TO APPROVED ACCOUNTING
STANDARDS THAT ARE NOT YET EFFECTIVE The following standards, amendments and interpretations of Approved Accounting Standards will
be effective for accounting periods on or after 01 January 2017: - Amendments to IAS 12 ‘Income Taxes’ are effective for annual periods beginning on or after 1
January 2017. The amendments clarify that the existence of a deductible temporary difference depends solely on a comparison of the carrying amount of an asset and its tax base at the end of the reporting period, and is not affected by possible future changes in the carrying amount or expected manner of recovery of the asset. The amendments further clarify that when calculating deferred tax asset in respect of insufficient taxable temporary differences, the future taxable profit excludes tax deductions resulting from the reversal of those deductible temporary differences. The amendments are not likely to have an impact on unconsolidated financial statements of the Bank.
- Amendments to IAS 7 ‘Statement of Cash Flows’ are part of IASB’s broader disclosure initiative and are effective for annual periods beginning on or after 1 January 2017. The amendments require disclosures that enable users of financial statements to evaluate changes in liabilities arising from financing activities, including both changes arising from cash flow and non - cash changes.
- Amendments to IFRS 2 - Share - based Payment clarify the accounting for certain types of arrangements and are effective for annual periods beginning on or after 1 January 2018. The amendments cover three accounting areas (a) measurement of cash - settled share - based payments; (b) classification of share - based payments settled net of tax withholdings; and (c) accounting for a modification of a share - based payment from cash - settled to equity - settled. The new requirements could affect the classification and / or measurement of these arrangements and potentially the timing and amount of expense recognised for new and outstanding awards. The amendments are not likely to have an impact on Bank’s unconsolidated financial statements.
29
- Transfers of Investment Property (Amendments to IAS 40 ‘Investment Property’ effective for annual periods beginning on or after 1 January 2018) clarifies that an entity shall transfer a property to, or from, investment property when, and only when there is a change in use. A change in use occurs when the property meets, or ceases to meet, the definition of investment property and there is evidence of the change in use. In isolation, a change in management's intentions for the use of a property does not provide evidence of a change in use. The amendments are not likely to have an impact on Bank’s unconsolidated financial statements.
- Annual improvements to IFRS standards 2014 - 2016 cycle. The new cycle of improvements addresses improvements to following approved accounting standards:
- Amendments to IFRS 12 ‘Disclosure of Interests in Other Entities’ (effective for annual periods beginning on or after 1 January 2017) clarify that the requirements of IFRS 12 apply to an entity’s interests that are classified as held for sale or discontinued operations in accordance with IFRS 5 – ‘Non - current Assets Held for Sale and Discontinued Operations’. The amendments are not likely to have an impact on Bank’s unconsolidated financial statements.
- Amendments to IAS 28 ‘Investments in Associates and Joint Ventures’ (effective for annual periods beginning on or after 1 January 2018) clarifies that a venture capital organisation and other similar entities may elect to measure investments in associates and joint ventures at fair value through profit or loss, for each associate or joint venture separately at the time of initial recognition of investment. Furthermore, similar election is available to non - investment entity that has an interest in an associate or joint venture that is an investment entity, when applying the equity method, to retain the fair value measurement applied by that investment entity associate or joint venture to the investment entity associate's or joint venture's interests in subsidiaries. This election is made separately for each investment entity associate or joint venture. The amendments are not likely to have an impact on Bank’s unconsolidated financial statements.
- IFRIC 22 ‘Foreign Currency Transactions and Advance Consideration’ (effective for annual periods beginning on or after 1 January 2018) clarifies which date should be used for translation when a foreign currency transaction involves payment or receipt in advance of the item it relates to. The related item is translated using the exchange rate on the date the advance foreign currency is received or paid and the prepayment or deferred income is recognised. The date of the transaction for the purpose of determining the exchange rate to use on initial recognition of the related asset, expense or income (or part of it) would remain the date on which receipt of payment from advance consideration was recognised. If there are multiple payments or receipts in advance, the entity shall determine a date of the transaction for each payment or receipt of advance consideration.
The above amendments are not likely to have an impact on Bank's unconsolidated financial statements.
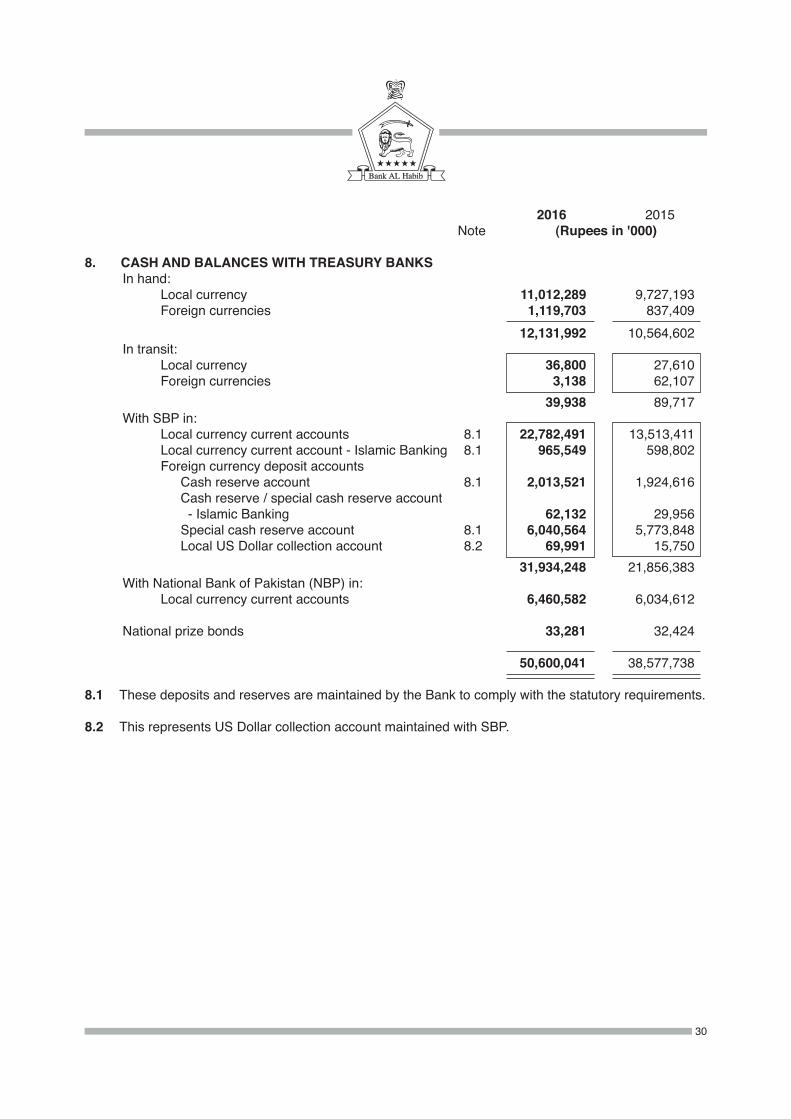
30
2016 2015 Note (Rupees in '000)
8. CASH AND BALANCES WITH TREASURY BANKS In hand: Local currency 11,012,289 9,727,193 Foreign currencies 1,119,703 837,409 12,131,992 10,564,602 In transit: Local currency 36,800 27,610 Foreign currencies 3,138 62,107 39,938 89,717 With SBP in: Local currency current accounts 8.1 22,782,491 13,513,411 Local currency current account - Islamic Banking 8.1 965,549 598,802 Foreign currency deposit accounts Cash reserve account 8.1 2,013,521 1,924,616 Cash reserve / special cash reserve account - Islamic Banking 62,132 29,956 Special cash reserve account 8.1 6,040,564 5,773,848 Local US Dollar collection account 8.2 69,991 15,750 31,934,248 21,856,383 With National Bank of Pakistan (NBP) in: Local currency current accounts 6,460,582 6,034,612
National prize bonds 33,281 32,424
50,600,041 38,577,738
8.1 These deposits and reserves are maintained by the Bank to comply with the statutory requirements. 8.2 This represents US Dollar collection account maintained with SBP.
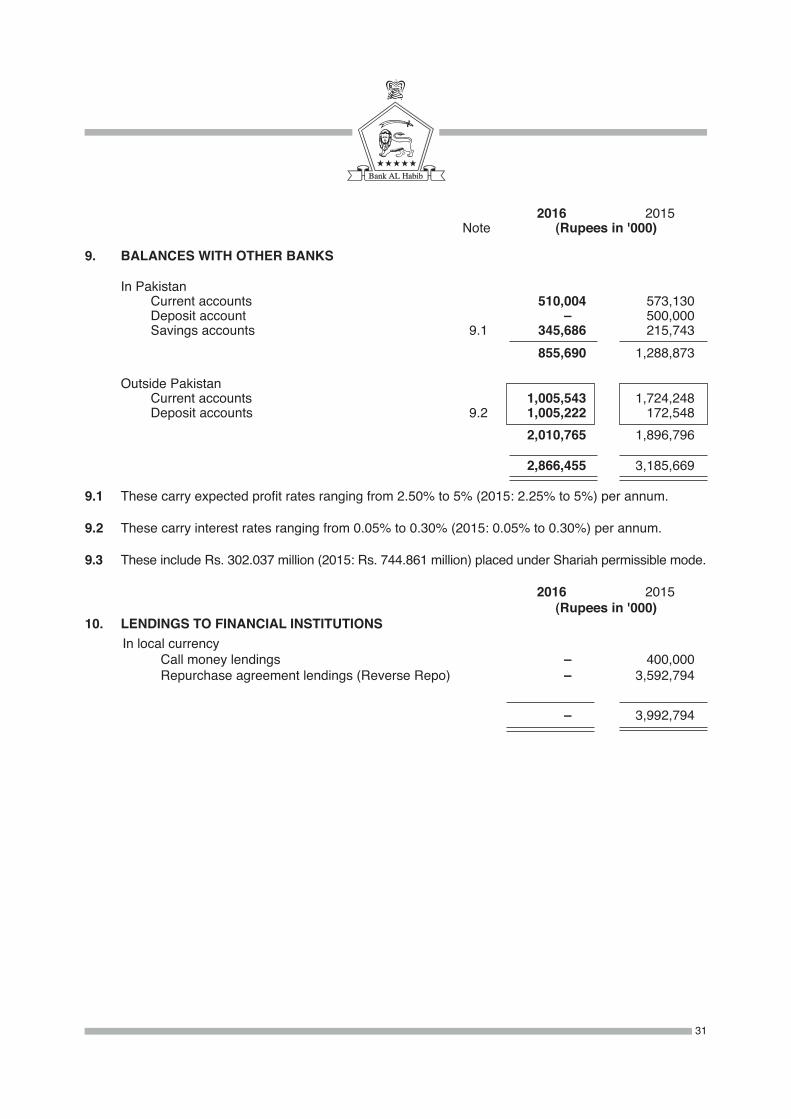
31
2016 2015 Note (Rupees in '000)
9. BALANCES WITH OTHER BANKS
In Pakistan Current accounts 510,004 573,130 Deposit account –00 500,000 Savings accounts 9.1 345,686 215,743 855,690 1,288,873
Outside Pakistan Current accounts 1,005,543 1,724,248 Deposit accounts 9.2 1,005,222 172,548 2,010,765 1,896,796
2,866,455 3,185,669
9.1 These carry expected profit rates ranging from 2.50% to 5% (2015: 2.25% to 5%) per annum.
9.2 These carry interest rates ranging from 0.05% to 0.30% (2015: 0.05% to 0.30%) per annum.
9.3 These include Rs. 302.037 million (2015: Rs. 744.861 million) placed under Shariah permissible mode.
2016 2015 (Rupees in '000)10. LENDINGS TO FINANCIAL INSTITUTIONS In local currency Call money lendings –00 400,000 Repurchase agreement lendings (Reverse Repo) –00 3,592,794
–00 3,992,794
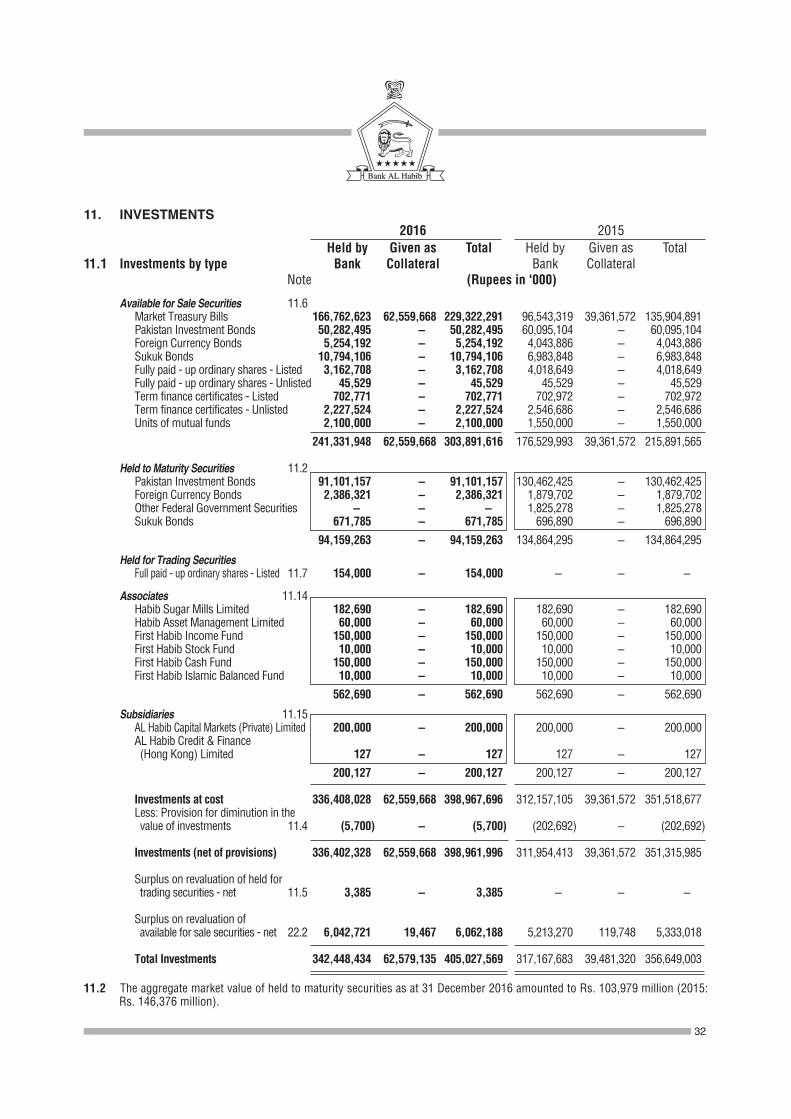
11. INVESTMENTS 2016 2015 Held by Given as Total Held by Given as Total 11.1 Investments by type Bank Collateral Bank Collateral Note (Rupees in '000)
Available for Sale Securities 11.6 Market Treasury Bills 166,762,623 62,559,668 229,322,291 96,543,319 39,361,572 135,904,891 Pakistan Investment Bonds 50,282,495 –00 50,282,495 60,095,104 –00 60,095,104 Foreign Currency Bonds 5,254,192 –00 5,254,192 4,043,886 –00 4,043,886 Sukuk Bonds 10,794,106 –00 10,794,106 6,983,848 –00 6,983,848 Fully paid - up ordinary shares - Listed 3,162,708 –00 3,162,708 4,018,649 –00 4,018,649 Fully paid - up ordinary shares - Unlisted 45,529 –00 45,529 45,529 –00 45,529 Term finance certificates - Listed 702,771 –00 702,771 702,972 –00 702,972 Term finance certificates - Unlisted 2,227,524 –00 2,227,524 2,546,686 –00 2,546,686 Units of mutual funds 2,100,000 –00 2,100,000 1,550,000 –00 1,550,000
241,331,948 62,559,668 303,891,616 176,529,993 39,361,572 215,891,565
Held to Maturity Securities 11.2 Pakistan Investment Bonds 91,101,157 –00 91,101,157 130,462,425 –00 130,462,425 Foreign Currency Bonds 2,386,321 –00 2,386,321 1,879,702 –00 1,879,702 Other Federal Government Securities –00 –00 –00 1,825,278 –00 1,825,278 Sukuk Bonds 671,785 –00 671,785 696,890 –00 696,890
94,159,263 –00 94,159,263 134,864,295 –00 134,864,295
Held for Trading Securities Full paid - up ordinary shares - Listed 11.7 154,000 –00 154,000 –00 –00 –00
Associates 11.14 Habib Sugar Mills Limited 182,690 –00 182,690 182,690 –00 182,690 Habib Asset Management Limited 60,000 –00 60,000 60,000 –00 60,000 First Habib Income Fund 150,000 –00 150,000 150,000 –00 150,000 First Habib Stock Fund 10,000 –00 10,000 10,000 –00 10,000 First Habib Cash Fund 150,000 –00 150,000 150,000 –00 150,000 First Habib Islamic Balanced Fund 10,000 –00 10,000 10,000 –00 10,000
562,690 –00 562,690 562,690 –00 562,690
Subsidiaries 11.15 AL Habib Capital Markets (Private) Limited 200,000 –00 200,000 200,000 –00 200,000 AL Habib Credit & Finance (Hong Kong) Limited 127 –00 127 127 –00 127
200,127 –00 200,127 200,127 –00 200,127
Investments at cost 336,408,028 62,559,668 398,967,696 312,157,105 39,361,572 351,518,677 Less: Provision for diminution in the value of investments 11.4 (5,700 ) –00 (5,700 ) (202,692 ) –00 (202,692 )
Investments (net of provisions) 336,402,328 62,559,668 398,961,996 311,954,413 39,361,572 351,315,985
Surplus on revaluation of held for trading securities - net 11.5 3,385 –00 3,385 –00 –00 –00
Surplus on revaluation of available for sale securities - net 22.2 6,042,721 19,467 6,062,188 5,213,270 119,748 5,333,018
Total Investments 342,448,434 62,579,135 405,027,569 317,167,683 39,481,320 356,649,003
11.2 The aggregate market value of held to maturity securities as at 31 December 2016 amounted to Rs. 103,979 million (2015: Rs. 146,376 million).
32
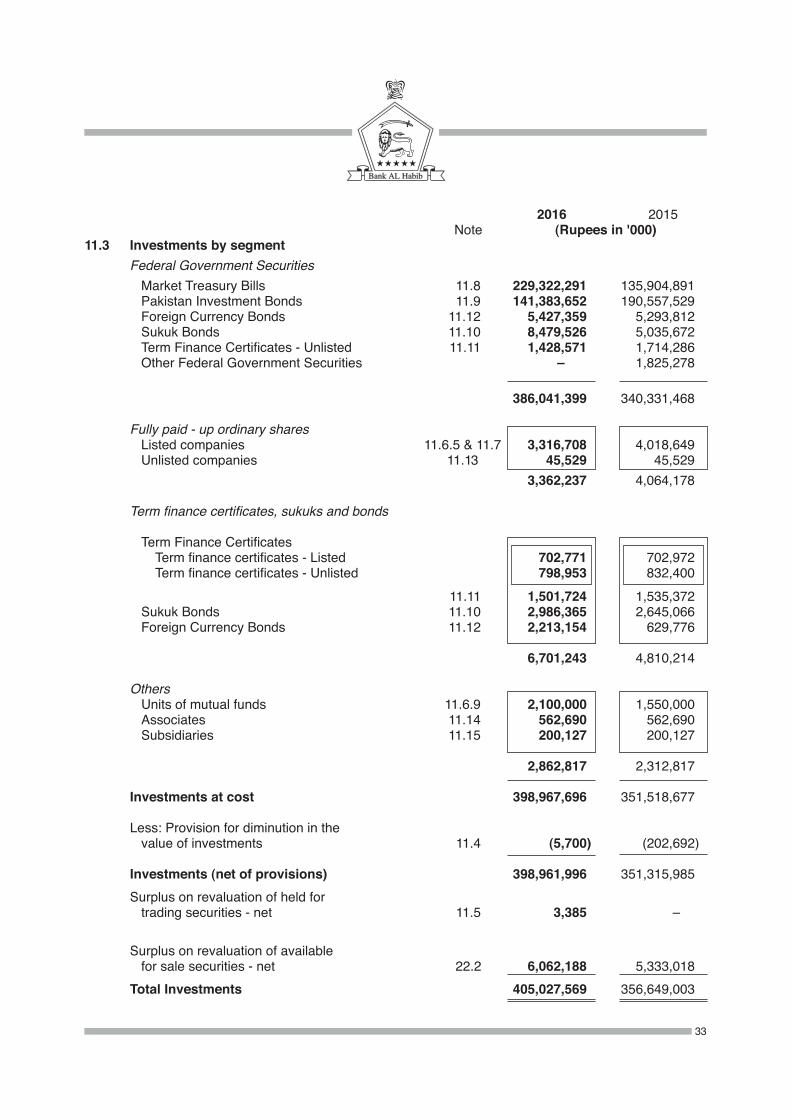
33
2016 2015 Note (Rupees in '000)11.3 Investments by segment Federal Government Securities Market Treasury Bills 11.8 229,322,291 135,904,891 Pakistan Investment Bonds 11.9 141,383,652 190,557,529 Foreign Currency Bonds 11.12 5,427,359 5,293,812 Sukuk Bonds 11.10 8,479,526 5,035,672 Term Finance Certificates - Unlisted 11.11 1,428,571 1,714,286 Other Federal Government Securities –000 1,825,278
386,041,399 340,331,468 Fully paid - up ordinary shares Listed companies 11.6.5 & 11.7 3,316,708 4,018,649 Unlisted companies 11.13 45,529 45,529 3,362,237 4,064,178 Term finance certificates, sukuks and bonds
Term Finance Certificates Term finance certificates - Listed 702,771 702,972 Term finance certificates - Unlisted 798,953 832,400 11.11 1,501,724 1,535,372 Sukuk Bonds 11.10 2,986,365 2,645,066 Foreign Currency Bonds 11.12 2,213,154 629,776 6,701,243 4,810,214
Others Units of mutual funds 11.6.9 2,100,000 1,550,000 Associates 11.14 562,690 562,690 Subsidiaries 11.15 200,127 200,127 2,862,817 2,312,817
Investments at cost 398,967,696 351,518,677
Less: Provision for diminution in the value of investments 11.4 (5,700 ) (202,692 ) Investments (net of provisions) 398,961,996 351,315,985 Surplus on revaluation of held for trading securities - net 11.5 3,385 –00
Surplus on revaluation of available for sale securities - net 22.2 6,062,188 5,333,018 Total Investments 405,027,569 356,649,003
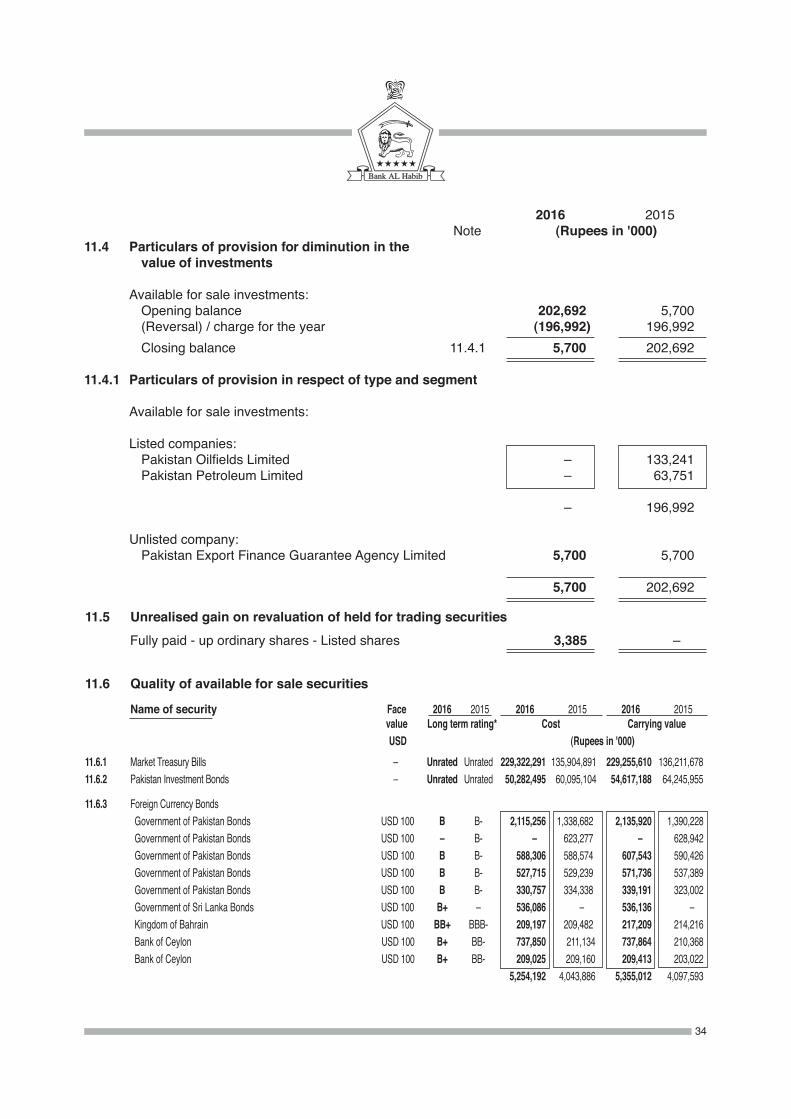
34
2016 2015 Note (Rupees in '000)11.4 Particulars of provision for diminution in the value of investments
Available for sale investments: Opening balance 202,692 5,700 (Reversal) / charge for the year (196,992 ) 196,992 Closing balance 11.4.1 5,700 202,692
11.4.1 Particulars of provision in respect of type and segment
Available for sale investments:
Listed companies: Pakistan Oilfields Limited –00 133,241 Pakistan Petroleum Limited –00 63,751
–00 196,992
Unlisted company: Pakistan Export Finance Guarantee Agency Limited 5,700 5,700
5,700 202,692
11.5 Unrealised gain on revaluation of held for trading securities Fully paid - up ordinary shares - Listed shares 3,385 –00
11.6 Quality of available for sale securities
Name of security Face 2016 2015 2016 2015 2016 2015 value Long term rating* Cost Carrying value USD (Rupees in '000) 11.6.1 Market Treasury Bills – Unrated Unrated 229,322,291 135,904,891 229,255,610 136,211,678 11.6.2 Pakistan Investment Bonds – Unrated Unrated 50,282,495 60,095,104 54,617,188 64,245,955
11.6.3 Foreign Currency Bonds Government of Pakistan Bonds USD 100 B B- 2,115,256 1,338,682 2,135,920 1,390,228 Government of Pakistan Bonds USD 100 – B- –00 623,277 –00 628,942 Government of Pakistan Bonds USD 100 B B- 588,306 588,574 607,543 590,426 Government of Pakistan Bonds USD 100 B B- 527,715 529,239 571,736 537,389 Government of Pakistan Bonds USD 100 B B- 330,757 334,338 339,191 323,002 Government of Sri Lanka Bonds USD 100 B+ – 536,086 –00 536,136 –00 Kingdom of Bahrain USD 100 BB+ BBB- 209,197 209,482 217,209 214,216 Bank of Ceylon USD 100 B+ BB- 737,850 211,134 737,864 210,368 Bank of Ceylon USD 100 B+ BB- 209,025 209,160 209,413 203,022 5,254,192 4,043,886 5,355,012 4,097,593
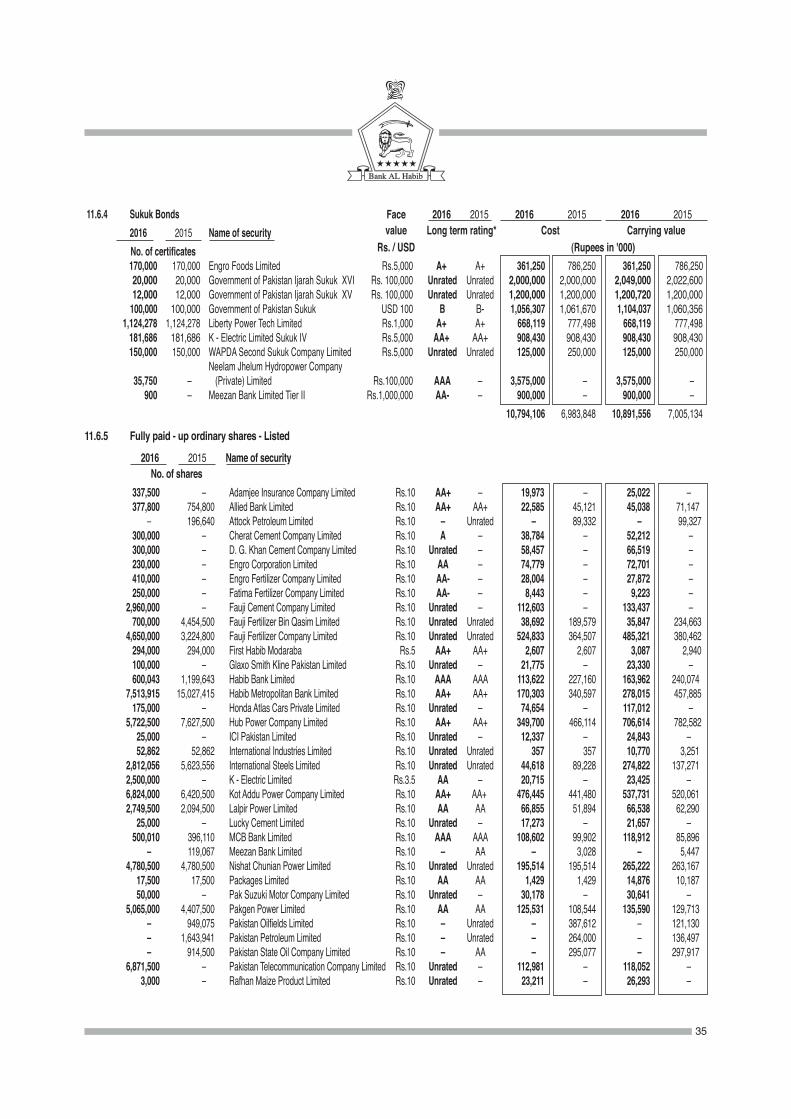
35
11.6.4 Sukuk Bonds 2016 2015 Name of security No. of certificates 170,000 170,000 Engro Foods Limited Rs.5,000 A+ A+ 361,250 786,250 361,250 786,250 20,000 20,000 Government of Pakistan Ijarah Sukuk XVI Rs. 100,000 Unrated Unrated 2,000,000 2,000,000 2,049,000 2,022,600 12,000 12,000 Government of Pakistan Ijarah Sukuk XV Rs. 100,000 Unrated Unrated 1,200,000 1,200,000 1,200,720 1,200,000 100,000 100,000 Government of Pakistan Sukuk USD 100 B B- 1,056,307 1,061,670 1,104,037 1,060,356 1,124,278 1,124,278 Liberty Power Tech Limited Rs.1,000 A+ A+ 668,119 777,498 668,119 777,498 181,686 181,686 K - Electric Limited Sukuk IV Rs.5,000 AA+ AA+ 908,430 908,430 908,430 908,430 150,000 150,000 WAPDA Second Sukuk Company Limited Rs.5,000 Unrated Unrated 125,000 250,000 125,000 250,000 Neelam Jhelum Hydropower Company 35,750 –00 (Private) Limited Rs.100,000 AAA – 3,575,000 –00 3,575,000 –00 900 –00 Meezan Bank Limited Tier II Rs.1,000,000 AA- – 900,000 –00 900,000 –00 10,794,106 6,983,848 10,891,556 7,005,134
11.6.5 Fully paid - up ordinary shares - Listed
2016 2015 Name of security No. of shares
Face 2016 2015 2016 2015 2016 2015 value Long term rating* Cost Carrying value Rs. / USD (Rupees in '000)
337,500 –00 Adamjee Insurance Company Limited Rs.10 AA+ – 19,973 –00 25,022 –00 377,800 754,800 Allied Bank Limited Rs.10 AA+ AA+ 22,585 45,121 45,038 71,147 –00 196,640 Attock Petroleum Limited Rs.10 – Unrated –00 89,332 –00 99,327 300,000 –00 Cherat Cement Company Limited Rs.10 A – 38,784 –00 52,212 –00 300,000 –00 D. G. Khan Cement Company Limited Rs.10 Unrated – 58,457 –00 66,519 –00 230,000 –00 Engro Corporation Limited Rs.10 AA – 74,779 –00 72,701 –00 410,000 –00 Engro Fertilizer Company Limited Rs.10 AA- – 28,004 –00 27,872 –00 250,000 –00 Fatima Fertilizer Company Limited Rs.10 AA- – 8,443 –00 9,223 –00 2,960,000 –00 Fauji Cement Company Limited Rs.10 Unrated – 112,603 –00 133,437 –00 700,000 4,454,500 Fauji Fertilizer Bin Qasim Limited Rs.10 Unrated Unrated 38,692 189,579 35,847 234,663 4,650,000 3,224,800 Fauji Fertilizer Company Limited Rs.10 Unrated Unrated 524,833 364,507 485,321 380,462 294,000 294,000 First Habib Modaraba Rs.5 AA+ AA+ 2,607 2,607 3,087 2,940 100,000 –00 Glaxo Smith Kline Pakistan Limited Rs.10 Unrated – 21,775 –00 23,330 –00 600,043 1,199,643 Habib Bank Limited Rs.10 AAA AAA 113,622 227,160 163,962 240,074 7,513,915 15,027,415 Habib Metropolitan Bank Limited Rs.10 AA+ AA+ 170,303 340,597 278,015 457,885 175,000 –00 Honda Atlas Cars Private Limited Rs.10 Unrated – 74,654 –00 117,012 –00 5,722,500 7,627,500 Hub Power Company Limited Rs.10 AA+ AA+ 349,700 466,114 706,614 782,582 25,000 –00 ICI Pakistan Limited Rs.10 Unrated – 12,337 –00 24,843 –00 52,862 52,862 International Industries Limited Rs.10 Unrated Unrated 357 357 10,770 3,251 2,812,056 5,623,556 International Steels Limited Rs.10 Unrated Unrated 44,618 89,228 274,822 137,271 2,500,000 –00 K - Electric Limited Rs.3.5 AA – 20,715 –00 23,425 –00 6,824,000 6,420,500 Kot Addu Power Company Limited Rs.10 AA+ AA+ 476,445 441,480 537,731 520,061 2,749,500 2,094,500 Lalpir Power Limited Rs.10 AA AA 66,855 51,894 66,538 62,290 25,000 –00 Lucky Cement Limited Rs.10 Unrated – 17,273 –00 21,657 –00 500,010 396,110 MCB Bank Limited Rs.10 AAA AAA 108,602 99,902 118,912 85,896 –00 119,067 Meezan Bank Limited Rs.10 – AA –00 3,028 –00 5,447 4,780,500 4,780,500 Nishat Chunian Power Limited Rs.10 Unrated Unrated 195,514 195,514 265,222 263,167 17,500 17,500 Packages Limited Rs.10 AA AA 1,429 1,429 14,876 10,187 50,000 –00 Pak Suzuki Motor Company Limited Rs.10 Unrated – 30,178 –00 30,641 –00 5,065,000 4,407,500 Pakgen Power Limited Rs.10 AA AA 125,531 108,544 135,590 129,713 –00 949,075 Pakistan Oilfields Limited Rs.10 – Unrated –00 387,612 –00 121,130 –00 1,643,941 Pakistan Petroleum Limited Rs.10 – Unrated –00 264,000 –00 136,497 –00 914,500 Pakistan State Oil Company Limited Rs.10 – AA –00 295,077 –00 297,917 6,871,500 –00 Pakistan Telecommunication Company Limited Rs.10 Unrated – 112,981 –00 118,052 –00 3,000 –00 Rafhan Maize Product Limited Rs.10 Unrated – 23,211 –00 26,293 –00
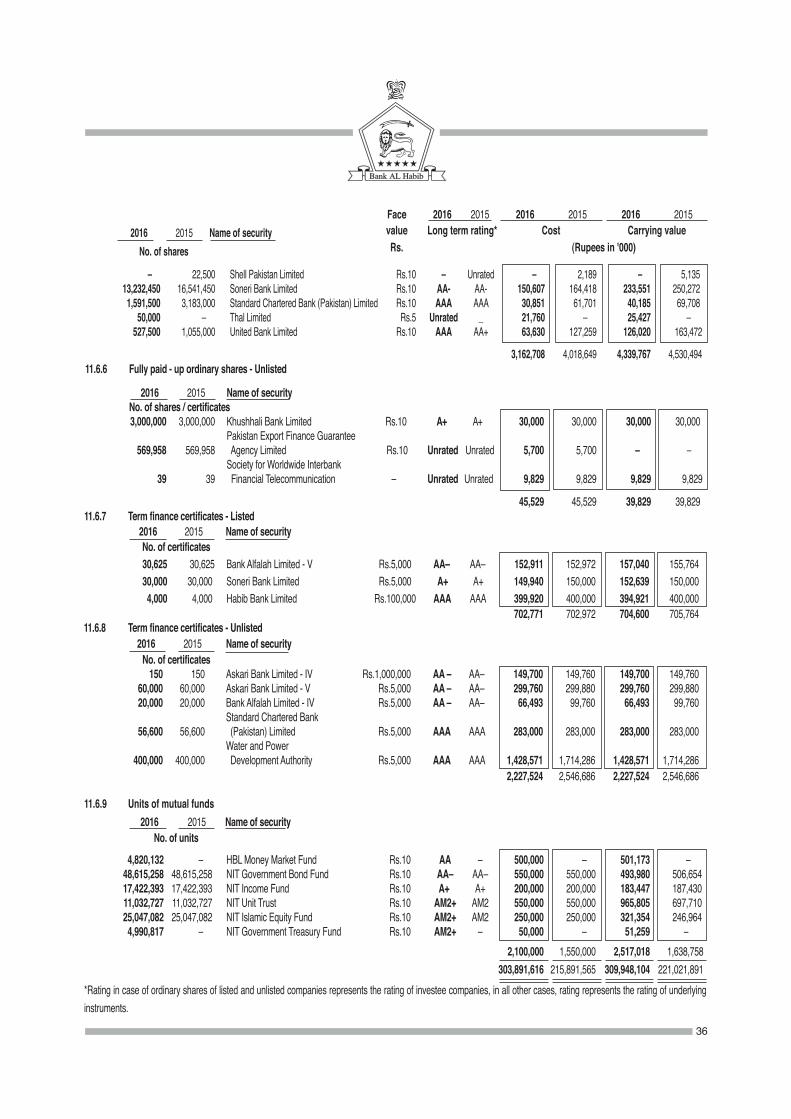
11.6.6 Fully paid - up ordinary shares - Unlisted
2016 2015 Name of security No. of shares / certificates 3,000,000 3,000,000 Khushhali Bank Limited Rs.10 A+ A+ 30,000 30,000 30,000 30,000 Pakistan Export Finance Guarantee 569,958 569,958 Agency Limited Rs.10 Unrated Unrated 5,700 5,700 –00 –0 Society for Worldwide Interbank 39 39 Financial Telecommunication – Unrated Unrated 9,829 9,829 9,829 9,829 45,529 45,529 39,829 39,829
36
2016 2015 Name of security No. of shares
Face 2016 2015 2016 2015 2016 2015 value Long term rating* Cost Carrying value Rs. (Rupees in '000)
–00 22,500 Shell Pakistan Limited Rs.10 – Unrated –00 2,189 –00 5,135 13,232,450 16,541,450 Soneri Bank Limited Rs.10 AA- AA- 150,607 164,418 233,551 250,272 1,591,500 3,183,000 Standard Chartered Bank (Pakistan) Limited Rs.10 AAA AAA 30,851 61,701 40,185 69,708 50,000 –00 Thal Limited Rs.5 Unrated _ 21,760 –00 25,427 –00 527,500 1,055,000 United Bank Limited Rs.10 AAA AA+ 63,630 127,259 126,020 163,472
3,162,708 4,018,649 4,339,767 4,530,494
11.6.7 Term finance certificates - Listed 2016 2015 Name of security No. of certificates 30,625 30,625 Bank Alfalah Limited - V Rs.5,000 AA– AA– 152,911 152,972 157,040 155,764 30,000 30,000 Soneri Bank Limited Rs.5,000 A+ A+ 149,940 150,000 152,639 150,000 4,000 4,000 Habib Bank Limited Rs.100,000 AAA AAA 399,920 400,000 394,921 400,000 702,771 702,972 704,600 705,76411.6.8 Term finance certificates - Unlisted 2016 2015 Name of security No. of certificates 150 150 Askari Bank Limited - IV Rs.1,000,000 AA – AA– 149,700 149,760 149,700 149,760 60,000 60,000 Askari Bank Limited - V Rs.5,000 AA – AA– 299,760 299,880 299,760 299,880 20,000 20,000 Bank Alfalah Limited - IV Rs.5,000 AA – AA– 66,493 99,760 66,493 99,760 Standard Chartered Bank 56,600 56,600 (Pakistan) Limited Rs.5,000 AAA AAA 283,000 283,000 283,000 283,000 Water and Power 400,000 400,000 Development Authority Rs.5,000 AAA AAA 1,428,571 1,714,286 1,428,571 1,714,286 2,227,524 2,546,686 2,227,524 2,546,686
11.6.9 Units of mutual funds 2016 2015 Name of security No. of units
4,820,132 –00 HBL Money Market Fund Rs.10 AA – 500,000 –00 501,173 –00 48,615,258 48,615,258 NIT Government Bond Fund Rs.10 AA– AA– 550,000 550,000 493,980 506,654 17,422,393 17,422,393 NIT Income Fund Rs.10 A+ A+ 200,000 200,000 183,447 187,430 11,032,727 11,032,727 NIT Unit Trust Rs.10 AM2+ AM2 550,000 550,000 965,805 697,710 25,047,082 25,047,082 NIT Islamic Equity Fund Rs.10 AM2+ AM2 250,000 250,000 321,354 246,964 4,990,817 –00 NIT Government Treasury Fund Rs.10 AM2+ – 50,000 –00 51,259 –00
2,100,000 1,550,000 2,517,018 1,638,758 303,891,616 215,891,565 309,948,104 221,021,891* Rating in case of ordinary shares of listed and unlisted companies represents the rating of investee companies, in all other cases, rating represents the rating of underlying instruments.
2016 2015 Name of security Face 2016 2015 2016 2015 2016 2015 No. of shares value Short term rating Cost Carrying value Rs. (Rupees in '000)
37
75,000 –00 Engro Corporation Limited Rs.10 A1+ – 23,786 –00 23,707 –00 125,000 –00 Engro Fertilizer Company Limited Rs.10 A1+ – 8,498 –00 8,498 –00 750,000 –00 Fauji Fertilizer Bin Qasim Limited Rs.10 Unrated – 34,807 –00 38,408 –00 300,000 –00 K - Electric Limited Rs.3.5 A1+ – 2,747 –00 2,811 –00 400,000 –00 Kot Addu Power Company Limited Rs.10 A1+ – 31,507 –00 31,520 –00 25,000 –00 Pak Electron Limited Rs.10 Unrated – 1,765 –00 1,782 –00 9,200 –00 Pak Suzuki Motor Company Limited Rs.10 Unrated – 5,666 –00 5,638 –00 41,000 –00 Pakistan Oilfields Limited Rs.10 Unrated – 22,101 –00 21,919 –00 Pakistan Telecommunication 250,000 –00 Company Limited Rs.10 Unrated – 4,318 –00 4,295 –00 150,000 –00 Saif Power Limited Rs.10 A1 – 5,025 –00 5,334 –00 300 –00 The SEARLE Company Limited Rs.10 Unrated – 191 –00 195 –00 300,000 –00 TRG Pakistan Limited Rs.10 Unrated – 13,589 –00 13,278 –00 154,000 –00 157,385 –0011.8 Market Treasury Bills
These securities have a maturity period of one year (2015: one year), with yield ranging between 5.84% to 6.24% (2015: 6.33% to 8.34%) per annum.
11.9 Pakistan Investment Bonds
These securities have a maturity period of 3, 5 and 10 years (2015: 3, 5 and 10 years) with interest rates ranging between 9.25% to 12% (2015: 9.25% to 12%) per annum. These include securities costing Rs. 5 million (2015: Rs. 5 million) pledged with the Controller of Military Accounts, Karachi as a security deposit for extending banking facilities on account of regimental funds vis-a-vis private fund accounts.
11.7 Investment in listed companies - Held for trading
38
Held to maturity 50,000 50,000 10,464 Dec-19 Government of Pakistan Sukuk 6.750% p.a. 523,219 524,002
8,479,526 5,035,672
11.10 Sukuk Bonds
Federal Government Securities Available for sale 20,000 20,000 100,000 Dec-18 Government of Pakistan Ijara Sukuk XVI Weighted average 6 months 2,000,000 2,000,000 T - Bills rate less 50 bps 12,000 12,000 100,000 Jun-17 Government of Pakistan Ijarah Sukuk XV Weighted average 6 months 1,200,000 1,200,000 T - BIlls rate less 200 bps 100,000 100,000 10,563 Dec-19 Government of Pakistan Sukuk 6.750% p.a. 1,056,307 1,061,670 150,000 150,000 833 Jul-17 WAPDA Second Sukuk Company Limited 6 months’ KIBOR less 25 bps 125,000 250,000 35,750 –00 100,000 Jun-26 Neelam Jhelum Hydropower 6 months’ KIBOR plus 113 bps 3,575,000 –00 Company (Private) Limited
7,956,307 4,511,670
Redeemable value per Maturity 2016 2015 certificate Date Name of Security Rate 2016 2015 No. of certificates (Rupees) (Rupees in '000)
Available for sale 170,000 170,000 2,125 Jan-17 Engro Foods Limited 6 months’ KIBOR plus 69 bps 361,250 786,250 1,124,278 1,124,278 594 Mar-21 Liberty Power Tech Limited 3 months’ KIBOR plus 300 bps 668,119 777,498 181,686 181,686 5,000 Sep-22 K-Electric Limited Sukuk IV 3 months’ KIBOR plus 100 bps 908,430 908,430 900 –00 1,000,000 Sep-26 Meezan Bank Limited Tier II 6 months’ KIBOR plus 50 bps 900,000 –00
2,837,799 2,472,178 Held to maturity 250,000 250,000 594 Mar-21 Liberty Power Tech Limited 3 months’ KIBOR plus 300 bps 148,566 172,888
2,986,365 2,645,066
11,465,891 7,680,738
11.10.1 These Sukuk Bonds have face value of Rs. 5,000 per certificate except for Liberty Power Tech Limited’s Sukuk Bonds which have face value of Rs. 1,000 per certificate, Government of Pakistan Sukuk Bonds which have face value of US$ 100, Government of Pakistan Ijarah Sukuk Bonds and Neelam Jhelum Hydropower Company (Private) Limited Sukuk Bonds which have face value of
Rs. 100,000 per certificate and Meeezan Bank Limited Tier II Sukuk Bonds which have a face value of Rs.1,000,000 per certificate.
Others
11.11 Term Finance Certificates
Federal Government Securities Unlisted - Available for sale 400,000 400,000 3,571 Sep-21 Water and Power Development Authority 6 months' KIBOR plus 100 bps 1,428,571 1,714,286
Redeemable value per Maturity 2016 2015 certificate Date Name of Security Rate 2016 2015 No. of certificates (Rupees) (Rupees in '000)
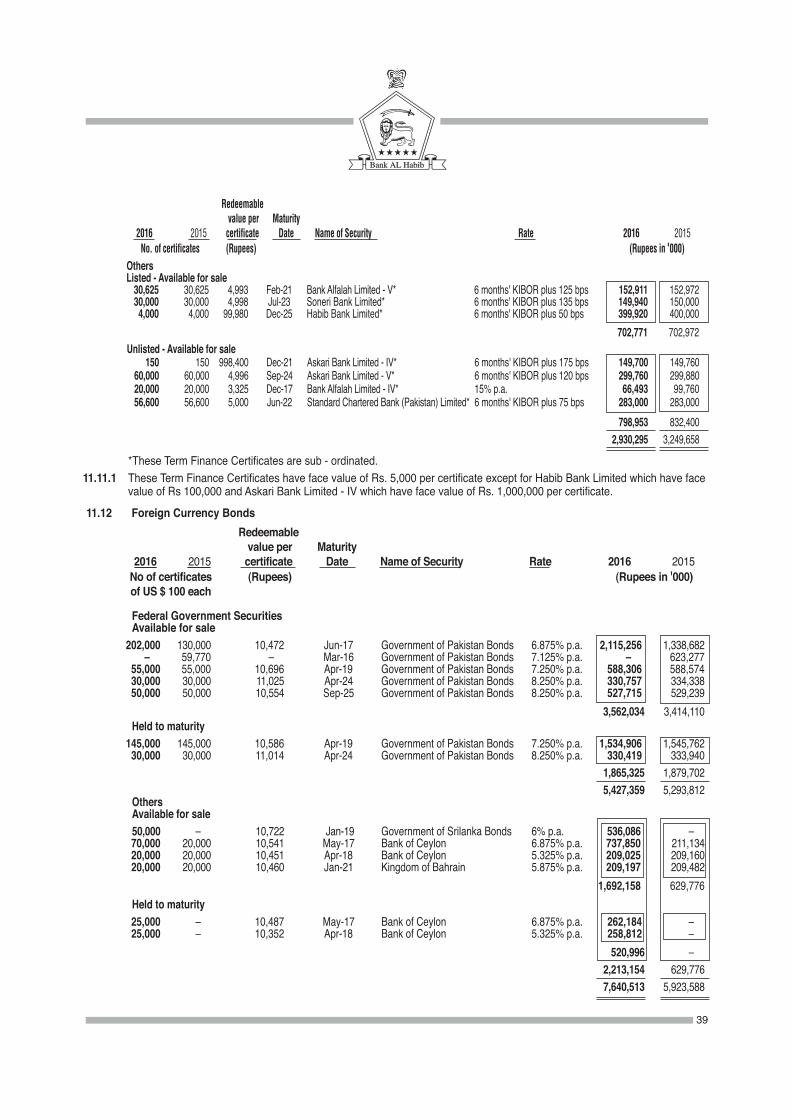
Unlisted - Available for sale 150 150 998,400 Dec-21 Askari Bank Limited - IV* 6 months' KIBOR plus 175 bps 149,700 149,760 60,000 60,000 4,996 Sep-24 Askari Bank Limited - V* 6 months' KIBOR plus 120 bps 299,760 299,880 20,000 20,000 3,325 Dec-17 Bank Alfalah Limited - IV* 15% p.a. 66,493 99,760 56,600 56,600 5,000 Jun-22 Standard Chartered Bank (Pakistan) Limited* 6 months' KIBOR plus 75 bps 283,000 283,000 798,953 832,400 2,930,295 3,249,658 *These Term Finance Certificates are sub - ordinated.11.11.1 These Term Finance Certificates have face value of Rs. 5,000 per certificate except for Habib Bank Limited which have face
value of Rs 100,000 and Askari Bank Limited - IV which have face value of Rs. 1,000,000 per certificate.
39
11.12 Foreign Currency Bonds Redeemable value per Maturity 2016 2015 certificate Date Name of Security Rate 2016 2015 No of certificates (Rupees) (Rupees in '000) of US $ 100 each
Federal Government Securities Available for sale 202,000 130,000 10,472 Jun-17 Government of Pakistan Bonds 6.875% p.a. 2,115,256 1,338,682 –00 59,770 –00 Mar-16 Government of Pakistan Bonds 7.125% p.a. –00 623,277 55,000 55,000 10,696 Apr-19 Government of Pakistan Bonds 7.250% p.a. 588,306 588,574 30,000 30,000 11,025 Apr-24 Government of Pakistan Bonds 8.250% p.a. 330,757 334,338 50,000 50,000 10,554 Sep-25 Government of Pakistan Bonds 8.250% p.a. 527,715 529,239 3,562,034 3,414,110 Held to maturity 145,000 145,000 10,586 Apr-19 Government of Pakistan Bonds 7.250% p.a. 1,534,906 1,545,762 30,000 30,000 11,014 Apr-24 Government of Pakistan Bonds 8.250% p.a. 330,419 333,940 1,865,325 1,879,702 5,427,359 5,293,812 Others Available for sale 50,000 –00 10,722 Jan-19 Government of Srilanka Bonds 6% p.a. 536,086 –00 70,000 20,000 10,541 May-17 Bank of Ceylon 6.875% p.a. 737,850 211,134 20,000 20,000 10,451 Apr-18 Bank of Ceylon 5.325% p.a. 209,025 209,160 20,000 20,000 10,460 Jan-21 Kingdom of Bahrain 5.875% p.a. 209,197 209,482 1,692,158 629,776 Held to maturity 25,000 –00 10,487 May-17 Bank of Ceylon 6.875% p.a. 262,184 –00 25,000 –00 10,352 Apr-18 Bank of Ceylon 5.325% p.a. 258,812 –00 520,996 –00 2,213,154 629,776 7,640,513 5,923,588
Others Listed - Available for sale 30,625 30,625 4,993 Feb-21 Bank Alfalah Limited - V* 6 months' KIBOR plus 125 bps 152,911 152,972 30,000 30,000 4,998 Jul-23 Soneri Bank Limited* 6 months' KIBOR plus 135 bps 149,940 150,000 4,000 4,000 99,980 Dec-25 Habib Bank Limited* 6 months' KIBOR plus 50 bps 399,920 400,000 702,771 702,972
Redeemable value per Maturity 2016 2015 certificate Date Name of Security Rate 2016 2015 No. of certificates (Rupees) (Rupees in '000)
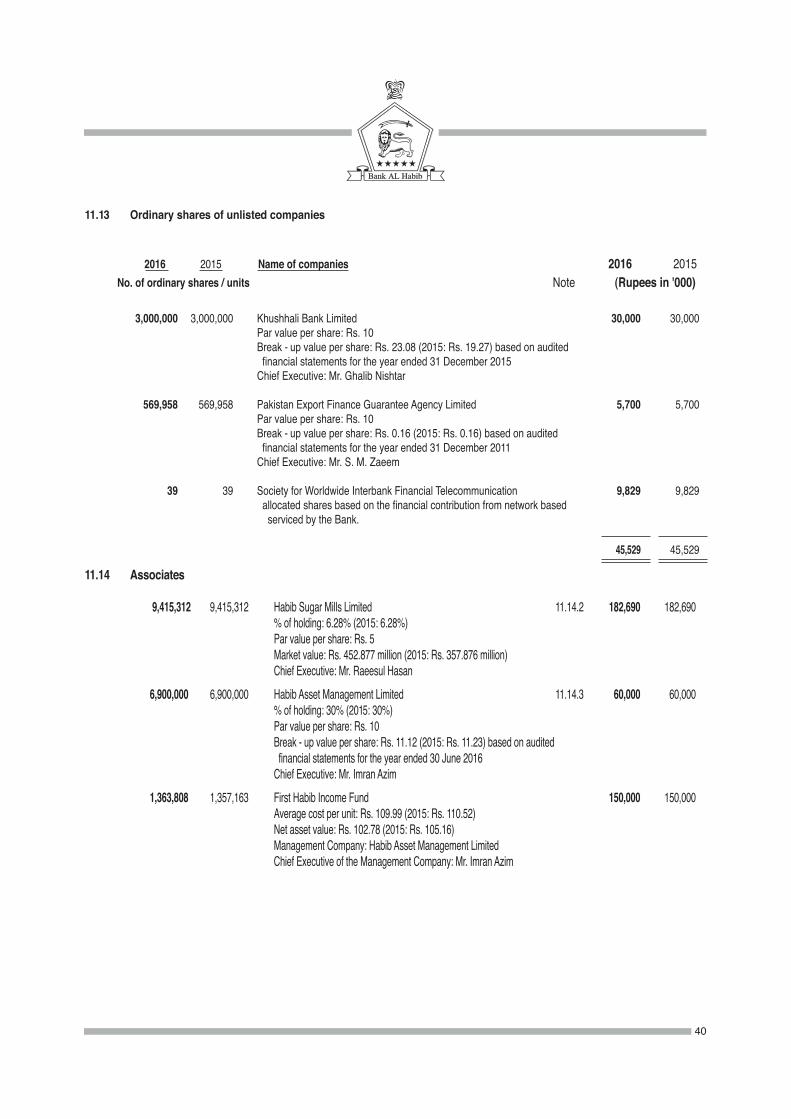
11.13 Ordinary shares of unlisted companies
3,000,000 3,000,000 Khushhali Bank Limited 30,000 30,000 Par value per share: Rs. 10 Break - up value per share: Rs. 23.08 (2015: Rs. 19.27) based on audited financial statements for the year ended 31 December 2015 Chief Executive: Mr. Ghalib Nishtar
569,958 569,958 Pakistan Export Finance Guarantee Agency Limited 5,700 5,700 Par value per share: Rs. 10 Break - up value per share: Rs. 0.16 (2015: Rs. 0.16) based on audited financial statements for the year ended 31 December 2011 Chief Executive: Mr. S. M. Zaeem
39 39 Society for Worldwide Interbank Financial Telecommunication 9,829 9,829 allocated shares based on the financial contribution from network based serviced by the Bank.
45,529 45,529
2016 2015 Name of companies 2016 2015 No. of ordinary shares / units Note (Rupees in '000)
40
9,415,312 9,415,312 Habib Sugar Mills Limited 11.14.2 182,690 182,690 % of holding: 6.28% (2015: 6.28%) Par value per share: Rs. 5 Market value: Rs. 452.877 million (2015: Rs. 357.876 million) Chief Executive: Mr. Raeesul Hasan 6,900,000 6,900,000 Habib Asset Management Limited 11.14.3 60,000 60,000 % of holding: 30% (2015: 30%) Par value per share: Rs. 10 Break - up value per share: Rs. 11.12 (2015: Rs. 11.23) based on audited financial statements for the year ended 30 June 2016 Chief Executive: Mr. Imran Azim 1,363,808 1,357,163 First Habib Income Fund 150,000 150,000 Average cost per unit: Rs. 109.99 (2015: Rs. 110.52) Net asset value: Rs. 102.78 (2015: Rs. 105.16) Management Company: Habib Asset Management Limited Chief Executive of the Management Company: Mr. Imran Azim
11.14 Associates
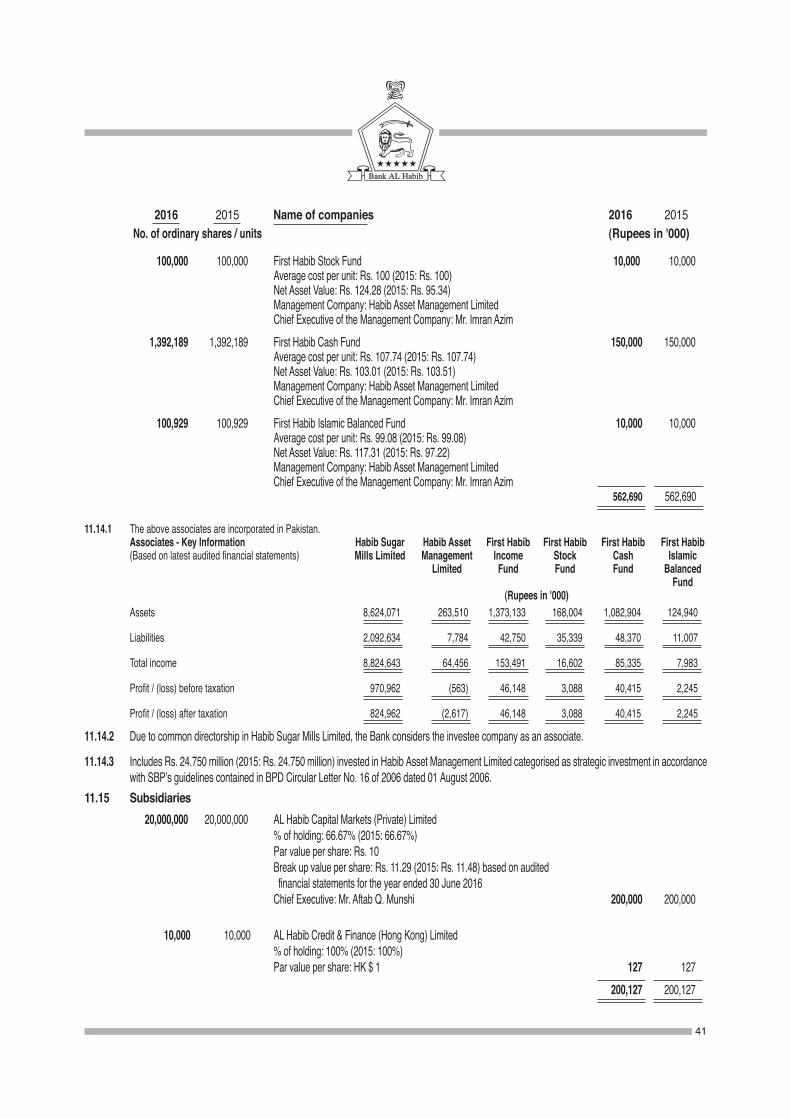
41
11.14.2 Due to common directorship in Habib Sugar Mills Limited, the Bank considers the investee company as an associate.
11.14.3 Includes Rs. 24.750 million (2015: Rs. 24.750 million) invested in Habib Asset Management Limited categorised as strategic investment in accordance with SBP’s guidelines contained in BPD Circular Letter No. 16 of 2006 dated 01 August 2006.
11.15 Subsidiaries 20,000,000 20,000,000 AL Habib Capital Markets (Private) Limited % of holding: 66.67% (2015: 66.67%) Par value per share: Rs. 10 Break up value per share: Rs. 11.29 (2015: Rs. 11.48) based on audited financial statements for the year ended 30 June 2016 Chief Executive: Mr. Aftab Q. Munshi 200,000 200,000
10,000 10,000 AL Habib Credit & Finance (Hong Kong) Limited % of holding: 100% (2015: 100%) Par value per share: HK $ 1 127 127 200,127 200,127
11.14.1 The above associates are incorporated in Pakistan. Associates - Key Information Habib Sugar Habib Asset First Habib First Habib First Habib First Habib (Based on latest audited financial statements) Mills Limited Management Income Stock Cash Islamic Limited Fund Fund Fund Balanced Fund (Rupees in '000) Assets 8,624,071 263,510 1,373,133 168,004 1,082,904 124,940
Liabilities 2,092,634 7,784 42,750 35,339 48,370 11,007
Total income 8,824,643 64,456 153,491 16,602 85,335 7,983
Profit / (loss) before taxation 970,962 (563) 46,148 3,088 40,415 2,245
Profit / (loss) after taxation 824,962 (2,617) 46,148 3,088 40,415 2,245
100,000 100,000 First Habib Stock Fund 10,000 10,000 Average cost per unit: Rs. 100 (2015: Rs. 100) Net Asset Value: Rs. 124.28 (2015: Rs. 95.34) Management Company: Habib Asset Management Limited Chief Executive of the Management Company: Mr. Imran Azim 1,392,189 1,392,189 First Habib Cash Fund 150,000 150,000 Average cost per unit: Rs. 107.74 (2015: Rs. 107.74) Net Asset Value: Rs. 103.01 (2015: Rs. 103.51) Management Company: Habib Asset Management Limited Chief Executive of the Management Company: Mr. Imran Azim 100,929 100,929 First Habib Islamic Balanced Fund 10,000 10,000 Average cost per unit: Rs. 99.08 (2015: Rs. 99.08) Net Asset Value: Rs. 117.31 (2015: Rs. 97.22) Management Company: Habib Asset Management Limited Chief Executive of the Management Company: Mr. Imran Azim 562,690 562,690
2016 2015 Name of companies 2016 2015 No. of ordinary shares / units (Rupees in '000)
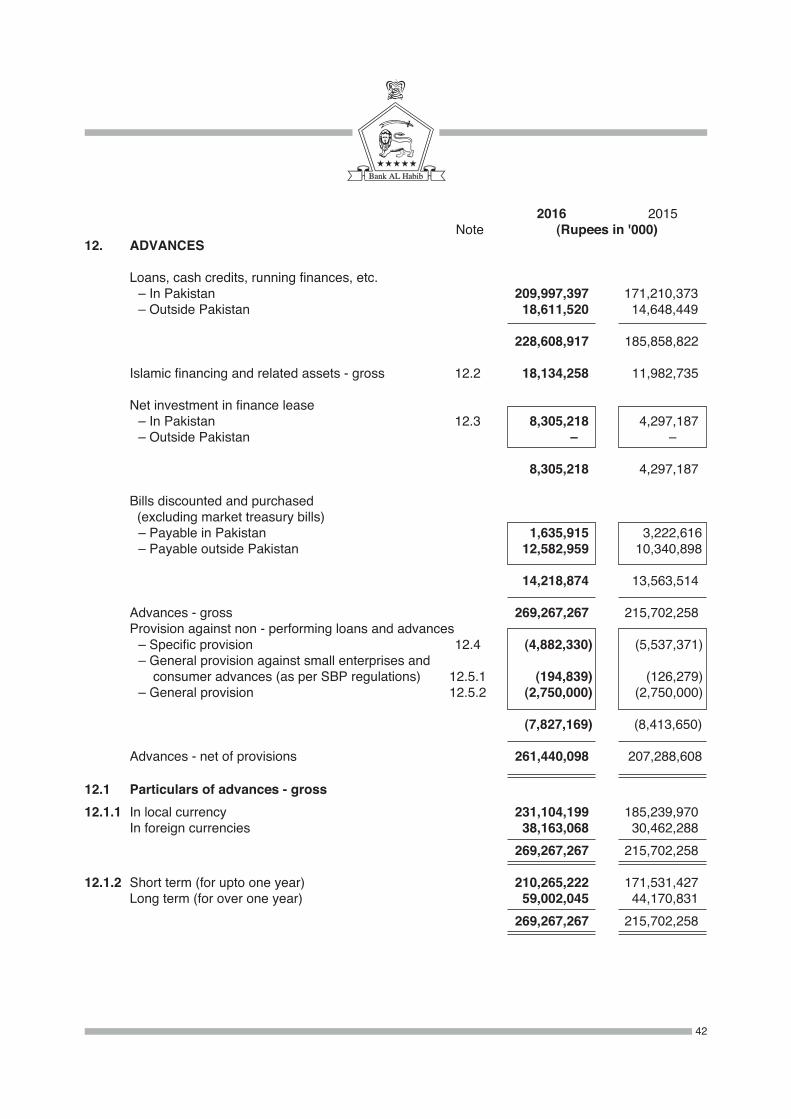
42
2016 2015 Note (Rupees in '000)12. ADVANCES Loans, cash credits, running finances, etc. – In Pakistan 209,997,397 171,210,373 – Outside Pakistan 18,611,520 14,648,449
228,608,917 185,858,822
Islamic financing and related assets - gross 12.2 18,134,258 11,982,735
Net investment in finance lease – In Pakistan 12.3 8,305,218 4,297,187 – Outside Pakistan –00 –000 8,305,218 4,297,187
Bills discounted and purchased (excluding market treasury bills) – Payable in Pakistan 1,635,915 3,222,616 – Payable outside Pakistan 12,582,959 10,340,898
14,218,874 13,563,514
Advances - gross 269,267,267 215,702,258 Provision against non - performing loans and advances – Specific provision 12.4 (4,882,330) (5,537,371 ) – General provision against small enterprises and consumer advances (as per SBP regulations) 12.5.1 (194,839) (126,279 ) – General provision 12.5.2 (2,750,000) (2,750,000 ) (7,827,169) (8,413,650) Advances - net of provisions 261,440,098 207,288,608
12.1 Particulars of advances - gross 12.1.1 In local currency 231,104,199 185,239,970 In foreign currencies 38,163,068 30,462,288 269,267,267 215,702,258
12.1.2 Short term (for upto one year) 210,265,222 171,531,427 Long term (for over one year) 59,002,045 44,170,831 269,267,267 215,702,258
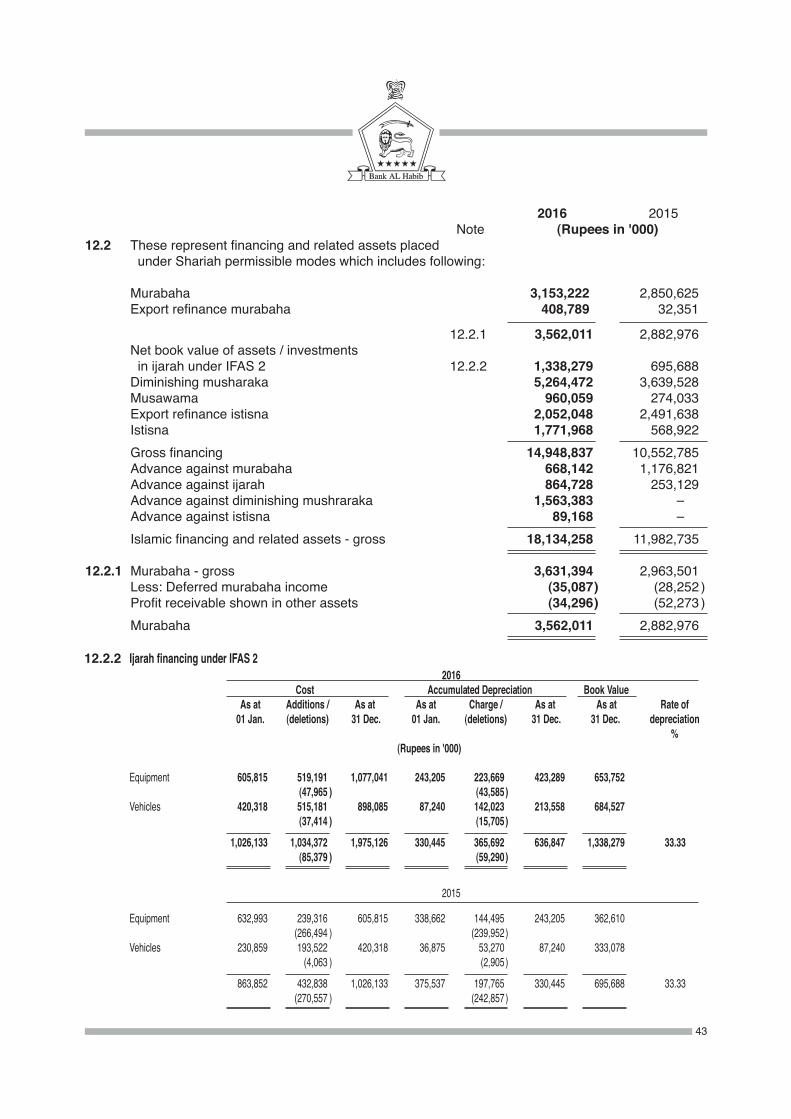
43
12.2.2 Ijarah financing under IFAS 2
2015
Equipment 632,993 239,316 605,815 338,662 144,495 243,205 362,610 (266,494 ) (239,952 ) Vehicles 230,859 193,522 420,318 36,875 53,270 87,240 333,078 (4,063 ) (2,905 ) 863,852 432,838 1,026,133 375,537 197,765 330,445 695,688 33.33 (270,557 ) (242,857 )
2016 Cost Accumulated Depreciation Book Value As at Additions / As at As at Charge / As at As at Rate of 01 Jan. (deletions) 31 Dec. 01 Jan. (deletions) 31 Dec. 31 Dec. depreciation % (Rupees in '000)
Equipment 605,815 519,191 1,077,041 243,205 223,669 423,289 653,752 (47,965 ) (43,585 ) Vehicles 420,318 515,181 898,085 87,240 142,023 213,558 684,527 (37,414 ) (15,705 ) 1,026,133 1,034,372 1,975,126 330,445 365,692 636,847 1,338,279 33.33 (85,379 ) (59,290 )
2016 2015 Note (Rupees in '000)12.2 These represent financing and related assets placed under Shariah permissible modes which includes following: Murabaha 3,153,222 2,850,625 Export refinance murabaha 408,789 32,351
12.2.1 3,562,011 2,882,976 Net book value of assets / investments in ijarah under IFAS 2 12.2.2 1,338,279 695,688 Diminishing musharaka 5,264,472 3,639,528 Musawama 960,059 274,033 Export refinance istisna 2,052,048 2,491,638 Istisna 1,771,968 568,922 Gross financing 14,948,837 10,552,785 Advance against murabaha 668,142 1,176,821 Advance against ijarah 864,728 253,129 Advance against diminishing mushraraka 1,563,383 –00 Advance against istisna 89,168 –00 Islamic financing and related assets - gross 18,134,258 11,982,735
12.2.1 Murabaha - gross 3,631,394 2,963,501 Less: Deferred murabaha income (35,087 ) (28,252 ) Profit receivable shown in other assets (34,296 ) (52,273 ) Murabaha 3,562,011 2,882,976
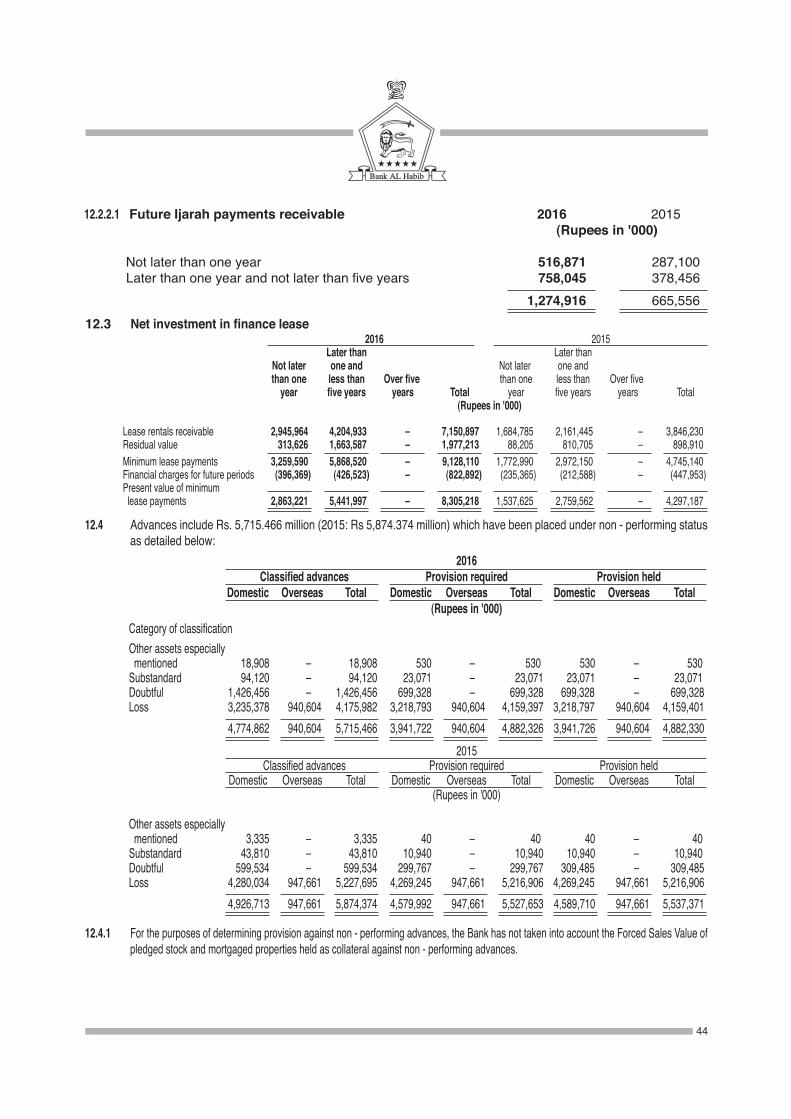
44
2016 Classified advances Provision required Provision held Domestic Overseas Total Domestic Overseas Total Domestic Overseas Total (Rupees in '000) Category of classification Other assets especially mentioned 18,908 –00 18,908 530 –00 530 530 –00 530 Substandard 94,120 –00 94,120 23,071 –00 23,071 23,071 –00 23,071 Doubtful 1,426,456 –00 1,426,456 699,328 –00 699,328 699,328 –00 699,328 Loss 3,235,378 940,604 4,175,982 3,218,793 940,604 4,159,397 3,218,797 940,604 4,159,401 4,774,862 940,604 5,715,466 3,941,722 940,604 4,882,326 3,941,726 940,604 4,882,330 2015 Classified advances Provision required Provision held Domestic Overseas Total Domestic Overseas Total Domestic Overseas Total (Rupees in '000)
Other assets especially mentioned 3,335 –00 3,335 40 –00 40 40 –00 40 Substandard 43,810 –00 43,810 10,940 –00 10,940 10,940 –00 10,940 Doubtful 599,534 –00 599,534 299,767 –00 299,767 309,485 –00 309,485 Loss 4,280,034 947,661 5,227,695 4,269,245 947,661 5,216,906 4,269,245 947,661 5,216,906 4,926,713 947,661 5,874,374 4,579,992 947,661 5,527,653 4,589,710 947,661 5,537,371
12.4 Advances include Rs. 5,715.466 million (2015: Rs 5,874.374 million) which have been placed under non - performing status as detailed below:
12.4.1 For the purposes of determining provision against non - performing advances, the Bank has not taken into account the Forced Sales Value of pledged stock and mortgaged properties held as collateral against non - performing advances.
12.2.2.1 Future Ijarah payments receivable 2016 2015 (Rupees in '000)
Not later than one year 516,871 287,100 Later than one year and not later than five years 758,045 378,456 1,274,916 665,55612.3 Net investment in finance lease 2016 2015 Later than Later than Not later one and Not later one and than one less than Over five than one less than Over five year five years years Total year five years years Total (Rupees in '000)
Lease rentals receivable 2,945,964 4,204,933 –0 7,150,897 1,684,785 2,161,445 –0 3,846,230 Residual value 313,626 1,663,587 –0 1,977,213 88,205 810,705 –0 898,910 Minimum lease payments 3,259,590 5,868,520 –0 9,128,110 1,772,990 2,972,150 –0 4,745,140 Financial charges for future periods (396,369 ) (426,523 ) –0 (822,892 ) (235,365 ) (212,588 ) –0 (447,953 ) Present value of minimum lease payments 2,863,221 5,441,997 –0 8,305,218 1,537,625 2,759,562 –0 4,297,187
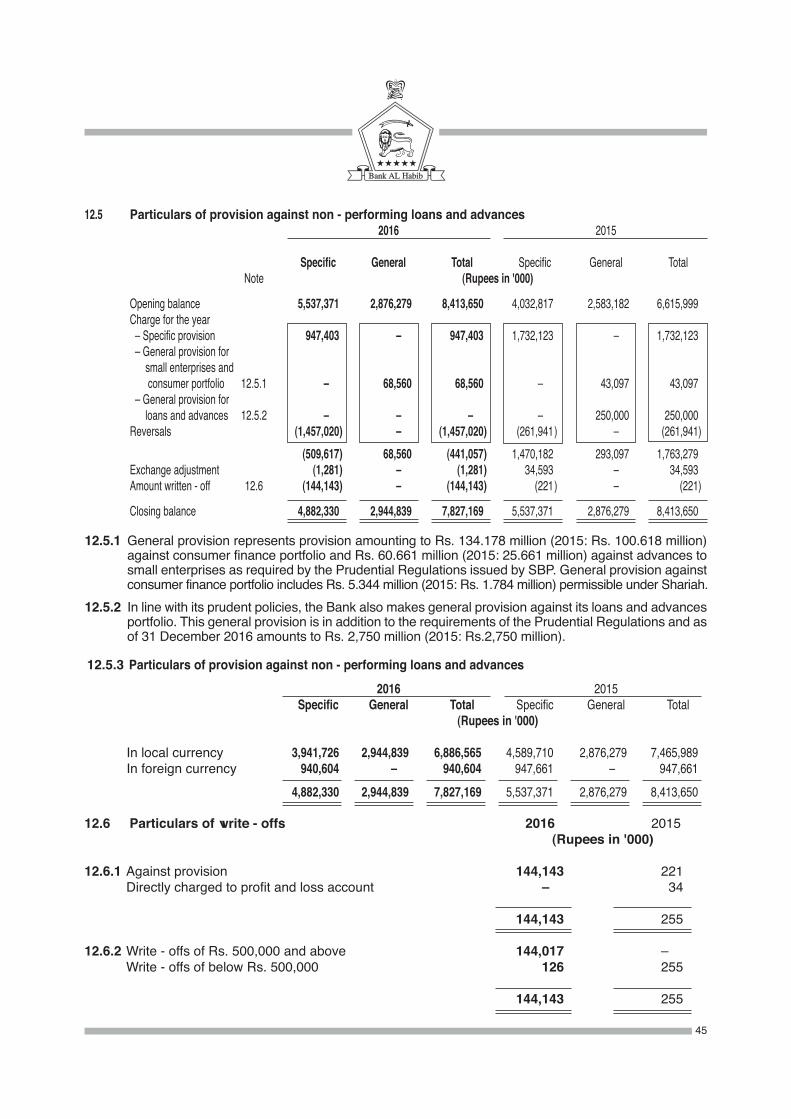
12.5 Particulars of provision against non - performing loans and advances 2016 2015
Specific General Total Specific General Total Note (Rupees in '000)
Opening balance 5,537,371 2,876,279 8,413,650 4,032,817 2,583,182 6,615,999 Charge for the year – Specific provision 947,403 –00 947,403 1,732,123 –00 1,732,123 – General provision for small enterprises and consumer portfolio 12.5.1 –00 68,560 68,560 –00 43,097 43,097 – General provision for loans and advances 12.5.2 –00 –00 –00 –00 250,000 250,000 Reversals (1,457,020 ) –00 (1,457,020 ) (261,941 ) –00 (261,941 ) (509,617 ) 68,560 (441,057 ) 1,470,182 293,097 1,763,279 Exchange adjustment (1,281 ) –00 (1,281 ) 34,593 –00 34,593 Amount written - off 12.6 (144,143 ) –00 (144,143 ) (221 ) –00 (221 )
Closing balance 4,882,330 2,944,839 7,827,169 5,537,371 2,876,279 8,413,650
45
12.5.3 Particulars of provision against non - performing loans and advances 2016 2015 Specific General Total Specific General Total (Rupees in '000)
In local currency 3,941,726 2,944,839 6,886,565 4,589,710 2,876,279 7,465,989 In foreign currency 940,604 –00 940,604 947,661 –00 947,661 4,882,330 2,944,839 7,827,169 5,537,371 2,876,279 8,413,650
12.5.1 General provision represents provision amounting to Rs. 134.178 million (2015: Rs. 100.618 million) against consumer finance portfolio and Rs. 60.661 million (2015: 25.661 million) against advances to small enterprises as required by the Prudential Regulations issued by SBP. General provision against consumer finance portfolio includes Rs. 5.344 million (2015: Rs. 1.784 million) permissible under Shariah.
12.5.2 In line with its prudent policies, the Bank also makes general provision against its loans and advances portfolio. This general provision is in addition to the requirements of the Prudential Regulations and as of 31 December 2016 amounts to Rs. 2,750 million (2015: Rs.2,750 million).
12.6 Particulars of write - offs 2016 2015 (Rupees in '000)
12.6.1 Against provision 144,143 221 Directly charged to profit and loss account –00 34
144,143 255
12.6.2 Write - offs of Rs. 500,000 and above 144,017 –00 Write - offs of below Rs. 500,000 126 255
144,143 255
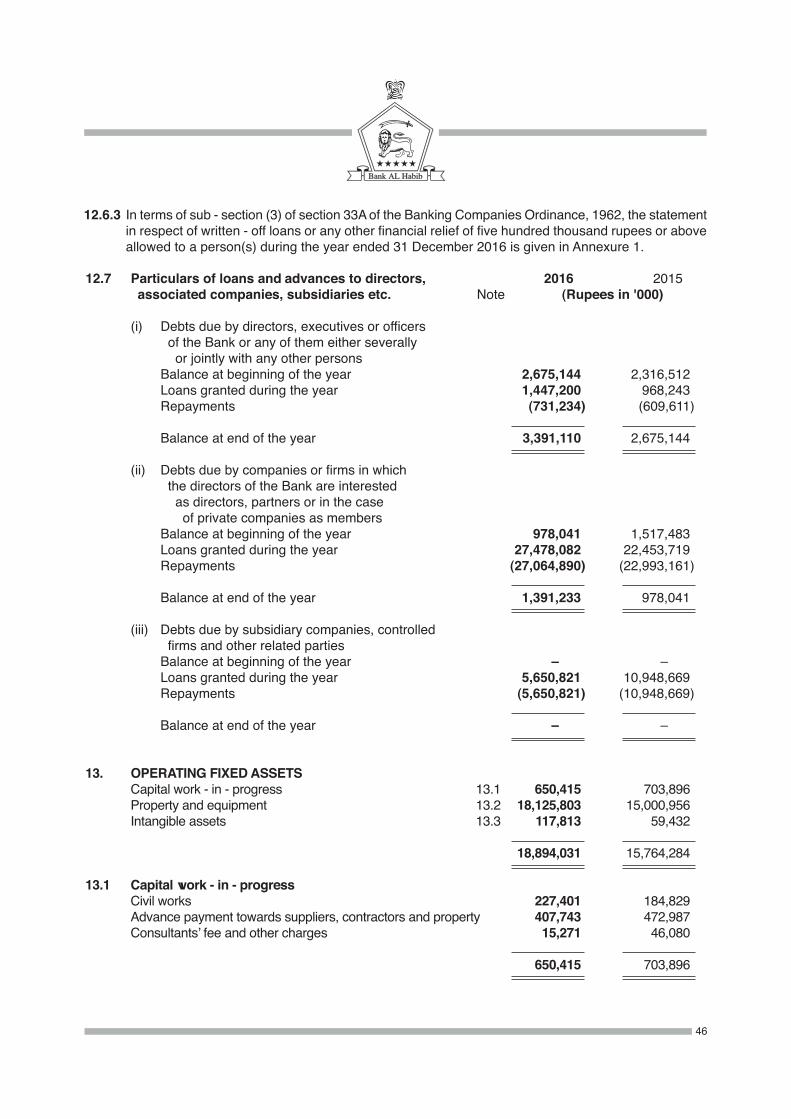
12.6.3 In terms of sub - section (3) of section 33A of the Banking Companies Ordinance, 1962, the statement in respect of written - off loans or any other financial relief of five hundred thousand rupees or above allowed to a person(s) during the year ended 31 December 2016 is given in Annexure 1.
12.7 Particulars of loans and advances to directors, 2016 2015 associated companies, subsidiaries etc. Note (Rupees in '000)
(i) Debts due by directors, executives or officers of the Bank or any of them either severally or jointly with any other persons Balance at beginning of the year 2,675,144 2,316,512 Loans granted during the year 1,447,200 968,243
Repayments (731,234 ) (609,611 )
Balance at end of the year 3,391,110 2,675,144
(ii) Debts due by companies or firms in which the directors of the Bank are interested as directors, partners or in the case of private companies as members Balance at beginning of the year 978,041 1,517,483 Loans granted during the year 27,478,082 22,453,719 Repayments (27,064,890 ) (22,993,161 )
Balance at end of the year 1,391,233 978,041
(iii) Debts due by subsidiary companies, controlled firms and other related parties Balance at beginning of the year –000 –000 Loans granted during the year 5,650,821 10,948,669 Repayments (5,650,821 ) (10,948,669 )
Balance at end of the year –000 –000
13. OPERATING FIXED ASSETS Capital work - in - progress 13.1 650,415 703,896 Property and equipment 13.2 18,125,803 15,000,956 Intangible assets 13.3 117,813 59,432
18,894,031 15,764,284
13.1 Capital work - in - progress Civil works 227,401 184,829 Advance payment towards suppliers, contractors and property 407,743 472,987 Consultants’ fee and other charges 15,271 46,080
650,415 703,896
46
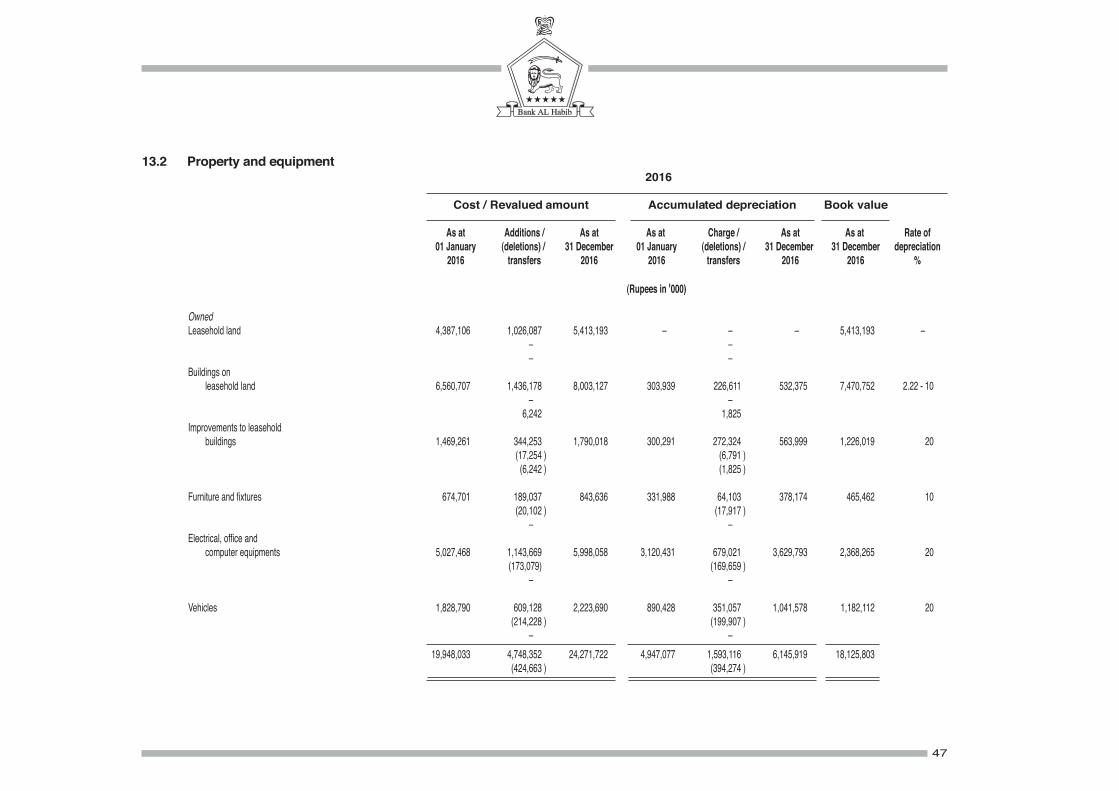
13.2 Property and equipment 2016
Cost / Revalued amount Accumulated depreciation Book value
As at Additions / As at As at Charge / As at As at Rate of 01 January (deletions) / 31 December 01 January (deletions) / 31 December 31 December depreciation 2016 transfers 2016 2016 transfers 2016 2016 %
(Rupees in '000)
Owned Leasehold land 4,387,106 1,026,087 5,413,193 –00 –00 –00 5,413,193 –00 –00 –00 –00 –00 00 Buildings on leasehold land 6,560,707 1,436,178 8,003,127 303,939 226,611 532,375 7,470,752 2.22 - 10 –00 –00 00 6,242 1,825 Improvements to leasehold buildings 1,469,261 344,253 1,790,018 300,291 272,324 563,999 1,226,019 20 (17,254 ) (6,791 ) (6,242 ) (1,825 )
Furniture and fixtures 674,701 189,037 843,636 331,988 64,103 378,174 465,462 10 (20,102 ) (17,917 ) –00 –00 Electrical, office and computer equipments 5,027,468 1,143,669 5,998,058 3,120,431 679,021 3,629,793 2,368,265 20 (173,079) (169,659 ) 0–00 –00
Vehicles 1,828,790 609,128 2,223,690 890,428 351,057 1,041,578 1,182,112 20(214,228 ) (199,907 )
–00 –00 19,948,033 4,748,352 24,271,722 4,947,077 1,593,116 6,145,919 18,125,803 (424,663 ) (394,274 )
47
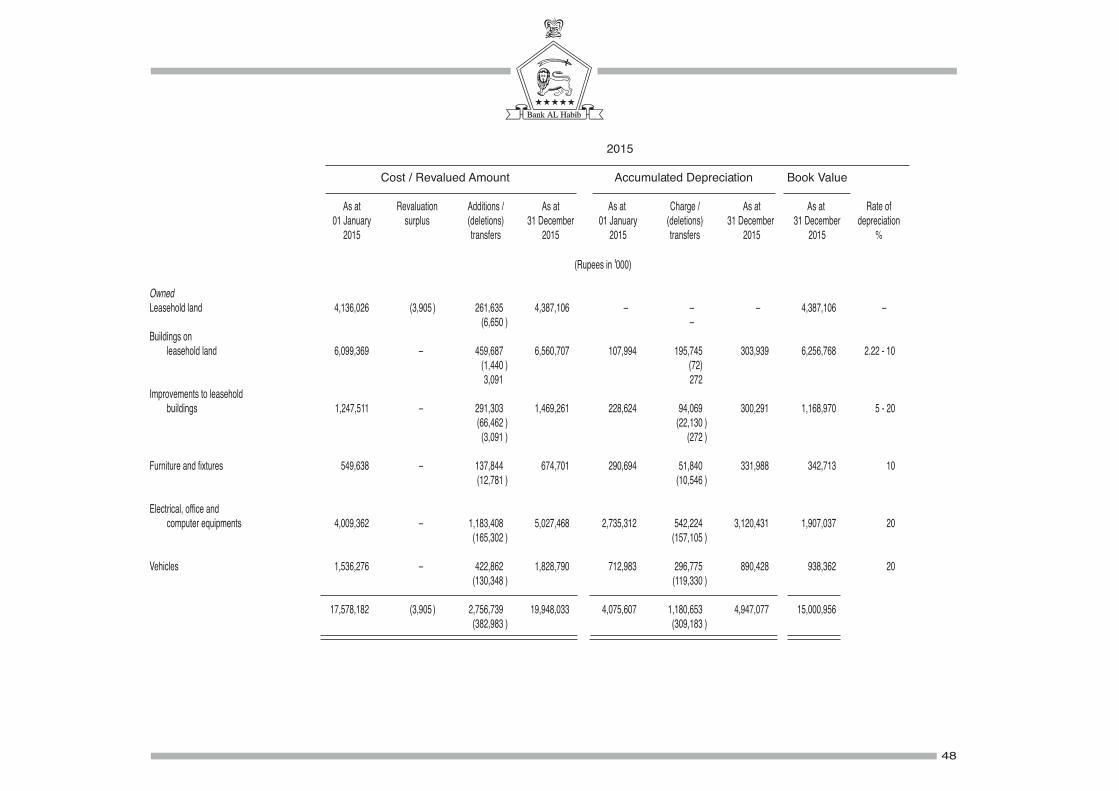
2015
Cost / Revalued Amount Accumulated Depreciation Book Value
As at Revaluation Additions / As at As at Charge / As at As at Rate of 01 January surplus (deletions) 31 December 01 January (deletions) 31 December 31 December depreciation 2015 transfers 2015 2015 transfers 2015 2015 %
(Rupees in '000)
Owned Leasehold land 4,136,026 (3,905 ) 261,635 4,387,106 –00 –00 –00 4,387,106 –00 (6,650 ) –00 00 Buildings on leasehold land 6,099,369 –00 459,687 6,560,707 107,994 195,745 303,939 6,256,768 2.22 - 10 (1,440 ) (72) 00 3,091 272 Improvements to leasehold buildings 1,247,511 –00 291,303 1,469,261 228,624 94,069 300,291 1,168,970 5 - 20 (66,462 ) (22,130 ) (3,091 ) (272 )
Furniture and fixtures 549,638 –00 137,844 674,701 290,694 51,840 331,988 342,713 10 (12,781 ) (10,546 )
Electrical, office and computer equipments 4,009,362 –00 1,183,408 5,027,468 2,735,312 542,224 3,120,431 1,907,037 20 (165,302 ) (157,105 )
Vehicles 1,536,276 –00 422,862 1,828,790 712,983 296,775 890,428 938,362 20(130,348 ) (119,330 )
17,578,182 (3,905 ) 2,756,739 19,948,033 4,075,607 1,180,653 4,947,077 15,000,956 (382,983 ) (309,183 )
48
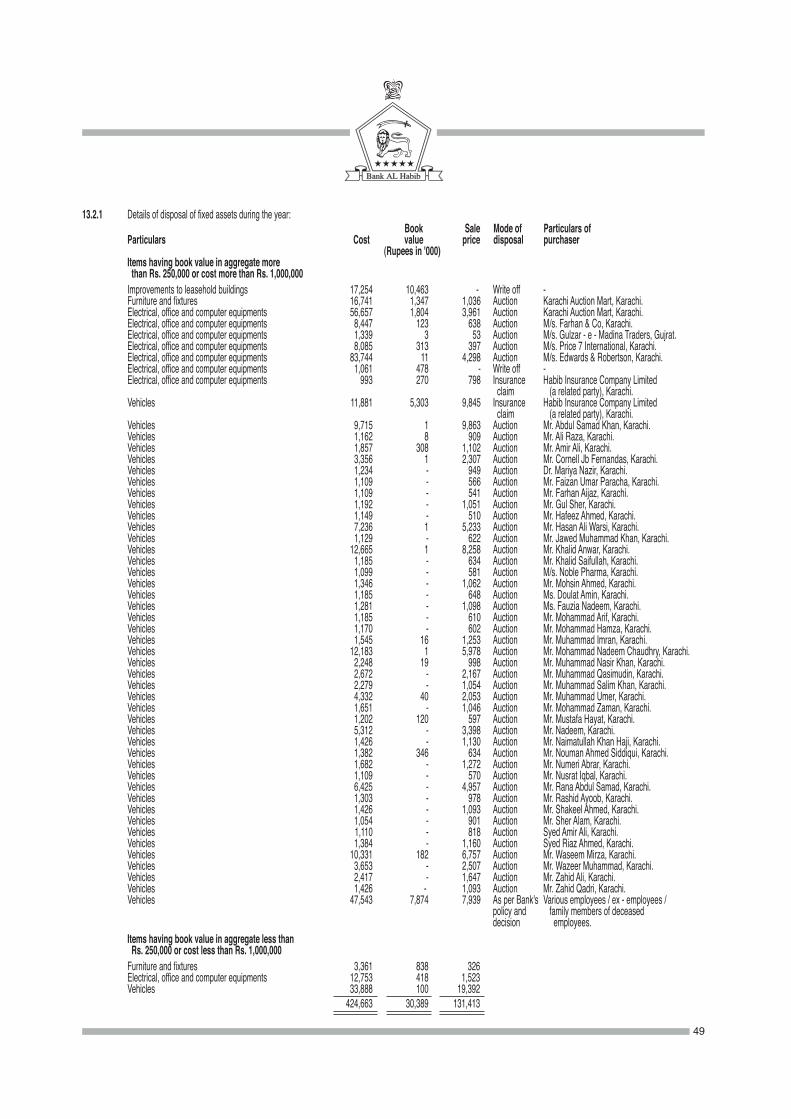
49
13.2.1 Details of disposal of fixed assets during the year: Book Sale Mode of Particulars of
Particulars Cost value price disposal purchaser (Rupees in '000) Items having book value in aggregate more than Rs. 250,000 or cost more than Rs. 1,000,000 Improvements to leasehold buildings 17,254 10,463 - Write off - Furniture and fixtures 16,741 1,347 1,036 Auction Karachi Auction Mart, Karachi. Electrical, office and computer equipments 56,657 1,804 3,961 Auction Karachi Auction Mart, Karachi. Electrical, office and computer equipments 8,447 123 638 Auction M/s. Farhan & Co, Karachi. Electrical, office and computer equipments 1,339 3 53 Auction M/s. Gulzar - e - Madina Traders, Gujrat. Electrical, office and computer equipments 8,085 313 397 Auction M/s. Price 7 International, Karachi. Electrical, office and computer equipments 83,744 11 4,298 Auction M/s. Edwards & Robertson, Karachi. Electrical, office and computer equipments 1,061 478 - Write off - Electrical, office and computer equipments 993 270 798 Insurance Habib Insurance Company Limited
claim (a related party), Karachi. Vehicles 11,881 5,303 9,845 Insurance Habib Insurance Company Limited claim (a related party), Karachi. Vehicles 9,715 1 9,863 Auction Mr. Abdul Samad Khan, Karachi. Vehicles 1,162 8 909 Auction Mr. Ali Raza, Karachi. Vehicles 1,857 308 1,102 Auction Mr. Amir Ali, Karachi. Vehicles 3,356 1 2,307 Auction Mr. Cornell Jb Fernandas, Karachi. Vehicles 1,234 - 949 Auction Dr. Mariya Nazir, Karachi. Vehicles 1,109 - 566 Auction Mr. Faizan Umar Paracha, Karachi. Vehicles 1,109 - 541 Auction Mr. Farhan Aijaz, Karachi. Vehicles 1,192 - 1,051 Auction Mr. Gul Sher, Karachi. Vehicles 1,149 - 510 Auction Mr. Hafeez Ahmed, Karachi. Vehicles 7,236 1 5,233 Auction Mr. Hasan Ali Warsi, Karachi. Vehicles 1,129 - 622 Auction Mr. Jawed Muhammad Khan, Karachi.
Vehicles 12,665 1 8,258 Auction Mr. Khalid Anwar, Karachi. Vehicles 1,185 - 634 Auction Mr. Khalid Saifullah, Karachi. Vehicles 1,099 - 581 Auction M/s. Noble Pharma, Karachi. Vehicles 1,346 - 1,062 Auction Mr. Mohsin Ahmed, Karachi. Vehicles 1,185 - 648 Auction Ms. Doulat Amin, Karachi. Vehicles 1,281 - 1,098 Auction Ms. Fauzia Nadeem, Karachi. Vehicles 1,185 - 610 Auction Mr. Mohammad Arif, Karachi. Vehicles 1,170 - 602 Auction Mr. Mohammad Hamza, Karachi. Vehicles 1,545 16 1,253 Auction Mr. Muhammad Imran, Karachi. Vehicles 12,183 1 5,978 Auction Mr. Mohammad Nadeem Chaudhry, Karachi. Vehicles 2,248 19 998 Auction Mr. Muhammad Nasir Khan, Karachi.
Vehicles 2,672 - 2,167 Auction Mr. Muhammad Qasimudin, Karachi. Vehicles 2,279 - 1,054 Auction Mr. Muhammad Salim Khan, Karachi. Vehicles 4,332 40 2,053 Auction Mr. Muhammad Umer, Karachi. Vehicles 1,651 - 1,046 Auction Mr. Mohammad Zaman, Karachi. Vehicles 1,202 120 597 Auction Mr. Mustafa Hayat, Karachi. Vehicles 5,312 - 3,398 Auction Mr. Nadeem, Karachi. Vehicles 1,426 - 1,130 Auction Mr. Naimatullah Khan Haji, Karachi. Vehicles 1,382 346 634 Auction Mr. Nouman Ahmed Siddiqui, Karachi. Vehicles 1,682 - 1,272 Auction Mr. Numeri Abrar, Karachi. Vehicles 1,109 - 570 Auction Mr. Nusrat Iqbal, Karachi. Vehicles 6,425 - 4,957 Auction Mr. Rana Abdul Samad, Karachi. Vehicles 1,303 - 978 Auction Mr. Rashid Ayoob, Karachi. Vehicles 1,426 - 1,093 Auction Mr. Shakeel Ahmed, Karachi. Vehicles 1,054 - 901 Auction Mr. Sher Alam, Karachi. Vehicles 1,110 - 818 Auction Syed Amir Ali, Karachi. Vehicles 1,384 - 1,160 Auction Syed Riaz Ahmed, Karachi. Vehicles 10,331 182 6,757 Auction Mr. Waseem Mirza, Karachi. Vehicles 3,653 - 2,507 Auction Mr. Wazeer Muhammad, Karachi. Vehicles 2,417 - 1,647 Auction Mr. Zahid Ali, Karachi. Vehicles 1,426 - 1,093 Auction Mr. Zahid Qadri, Karachi. Vehicles 47,543 7,874 7,939 As per Bank's Various employees / ex - employees / policy and family members of deceased
decision employees. Items having book value in aggregate less than Rs. 250,000 or cost less than Rs. 1,000,000 Furniture and fixtures 3,361 838 326 Electrical, office and computer equipments 12,753 418 1,523 Vehicles 33,888 100 19,392 424,663 30,389 131,413
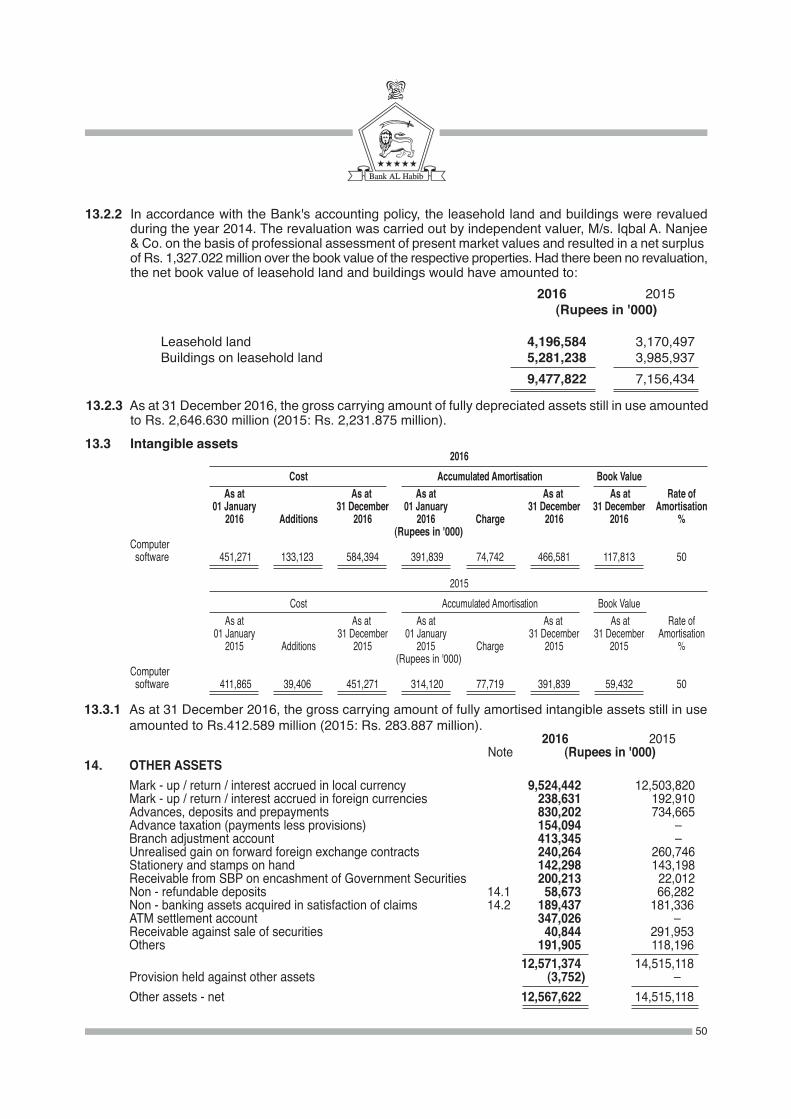
50
13.2.2 In accordance with the Bank's accounting policy, the leasehold land and buildings were revalued during the year 2014. The revaluation was carried out by independent valuer, M/s. Iqbal A. Nanjee & Co. on the basis of professional assessment of present market values and resulted in a net surplus of Rs. 1,327.022 million over the book value of the respective properties. Had there been no revaluation, the net book value of leasehold land and buildings would have amounted to: 2016 2015
(Rupees in '000)
Leasehold land 4,196,584 3,170,497 Buildings on leasehold land 5,281,238 3,985,937 9,477,822 7,156,434
13.2.3 As at 31 December 2016, the gross carrying amount of fully depreciated assets still in use amounted to Rs. 2,646.630 million (2015: Rs. 2,231.875 million).
2015 Cost Accumulated Amortisation Book Value As at As at As at As at As at Rate of 01 January 31 December 01 January 31 December 31 December Amortisation 2015 Additions 2015 2015 Charge 2015 2015 % (Rupees in '000)Computer software 411,865 39,406 451,271 314,120 77,719 391,839 59,432 50
13.3 Intangible assets 2016 Cost Accumulated Amortisation Book Value As at As at As at As at As at Rate of 01 January 31 December 01 January 31 December 31 December Amortisation 2016 Additions 2016 2016 Charge 2016 2016 % (Rupees in '000)Computer software 451,271 133,123 584,394 391,839 74,742 466,581 117,813 50
13.3.1 As at 31 December 2016, the gross carrying amount of fully amortised intangible assets still in use amounted to Rs.412.589 million (2015: Rs. 283.887 million).
2016 2015 Note (Rupees in '000)14. OTHER ASSETS Mark - up / return / interest accrued in local currency 9,524,442 12,503,820 Mark - up / return / interest accrued in foreign currencies 238,631 192,910 Advances, deposits and prepayments 830,202 734,665 Advance taxation (payments less provisions) 154,094 –00 Branch adjustment account 413,345 –00 Unrealised gain on forward foreign exchange contracts 240,264 260,746 Stationery and stamps on hand 142,298 143,198 Receivable from SBP on encashment of Government Securities 200,213 22,012 Non - refundable deposits 14.1 58,673 66,282 Non - banking assets acquired in satisfaction of claims 14.2 189,437 181,336 ATM settlement account 347,026 –00 Receivable against sale of securities 40,844 291,953 Others 191,905 118,196 12,571,374 14,515,118 Provision held against other assets (3,752 ) –00 Other assets - net 12,567,622 14,515,118
14.1 Represent deposits paid in relation to acquisition of some of the Bank's properties. These are being written - off over the periods ranging from 10 to 20 years (being estimated useful lives of related properties).
14.2 During the year, the Bank revalued its non - banking assets acquired in satisfaction of claims according to the requirements of the 'Regulations for Debt Property Swap' (the regulations) issued by SBP vide its BPRD Circular No. 1 of 2016, dated 1 January 2016. Had there been no revaluation, the net book value of non - banking assets acquired in satisfaction of claims would have amounted to: 2016 2015
Note (Rupees in '000) Leasehold land 129,836 129,836 Buildings on leasehold land 46,350 51,500 176,186 181,336
15. BILLS PAYABLE In Pakistan 13,872,057 8,665,462
16. BORROWINGS In Pakistan 92,572,633 62,586,995 Outside Pakistan 1,144,712 5,304
93,717,345 62,592,29916.1 Particulars of borrowings with respect to currencies In local currency 88,388,693 62,586,995 In foreign currencies 5,328,652 5,304
93,717,345 62,592,299
16.2 Details of borrowings Secured Borrowings from SBP Export refinance scheme 16.3 20,143,239 19,118,954 Long term financing for export oriented projects –00 4,246 Long term financing for imported and locally manufactured plant and machinery 16.4 5,632,293 3,953,374 Financing facility for storage of agricultural produce 16.5 56,875 36,861 25,832,407 23,113,435 Repurchase agreement borrowings 16.6 62,556,286 39,473,560 88,388,693 62,586,995 Unsecured Borrowings from financial institutions 16.7 4,183,940 –00 Overdrawn nostros 1,144,712 5,304 5,328,652 5,304
93,717,345 62,592,299
51
16.3 These carry mark - up rates ranging from 1% to 2% (2015: 2.50% to 3.50%) per annum, payable quarterly at the time of partial payment or upon maturity of loan, whichever is earlier.
16.4 These carry mark - up rates ranging from 2% to 8.8% (2015: 2.00% to 10.10% ) per annum having maturity periods upto ten years.
16.5 These carry mark - up rate of 3.50% (2015: 3.50% to 7.50%) per annum having maturity periods upto 2 to 3 years.
16.6 These repurchase agreement borrowings are secured against market treasury bills, which carry mark - up rates ranging from 5.85% to 5.88% (2015: 6.10% to 6.21%) per annum, having maturity periods upto one month.
16.7 This carry mark - up rate of 1.75% (2015: Nil) having maturity period upto three months.
52
2016 2015 Note (Rupees in '000)17. DEPOSITS AND OTHER ACCOUNTS Customers Fixed deposits 114,762,820 120,268,519 Savings deposits 170,130,029 150,427,540 Current accounts - Remunerative 72,737,910 57,094,573 Current accounts - Non - remunerative 210,377,190 175,902,813
568,007,949 503,693,445
Financial institutions Remunerative deposits 14,150,564 11,462,606 Non - remunerative deposits 2,013,441 1,057,127
16,164,005 12,519,733
584,171,954 516,213,178
17.1 Particulars of deposits In local currency 515,728,530 454,127,047 In foreign currencies 68,443,424 62,086,131
584,171,954 516,213,178
17.2 Deposits include Rs. 22,607.349 million (2015: Rs. 14,718.557 million) placed under permissible Shariah modes.
18. SUB - ORDINATED LOANS - unsecured
Term Finance Certificates (TFCs) - IV - (Unquoted) 18.1 –000 2,994,600 Term Finance Certificates (TFCs) - V - (Unquoted) 18.2 3,999,200 –000
3,999,200 2,994,600
18.1 During the year, the Bank exercised the Call option of Term Finance Certificates - IV in accordance with the Trust Deed and Terms and Conditions for the TFC issue, after completing the regulatory requirements. Accordingly, the said TFCs were redeemed in full on 30 June 2016.
53
18.2 Term Finance Certificates - V (Unquoted) Total issue Rupees 4,000 million Rating AA Rate Payable six monthly at six months’ KIBOR plus 0.75% without any floor and cap Redemption 6th - 108th month: 0.36%; 114th and 120th month: 49.82% each Tenor 10 years Maturity March 2026 2016 2015 Note (Rupees in '000) 19. DEFERRED TAX LIABILITIES Taxable temporary differences arising in respect of: Accelerated depreciation 1,126,519 1,029,252 Surplus on revaluation of fixed assets / non - banking assets 22.1 770,977 797,630 Surplus on revaluation of held for trading investments 1,186 –000 Surplus on revaluation of available for sale investments 22.2 2,121,766 1,866,556 4,020,448 3,693,438 Deductible temporary differences arising in respect of:
Provision against non - performing loans and advances (32,071 ) (106,412 ) Remeasurement of defined benefit plan 144,023 115,089 Provision against diminution in the value of investments (570 ) (69,517 ) 111,382 (60,840 ) 4,131,830 3,632,59819.1 Reconciliation of deferred tax Balance Recognised in Recognised Balance as at profit and in surplus on as at 01 January loss revaluation 31 December 2016 account of assets 2016 (Rupees in '000) Taxable temporary differences arising in respect of: Accelerated depreciation 1,029,252 97,267 –00 1,126,519 Surplus on revaluation of fixed assets / non - banking assets 797,630 (28,662 ) 2,009 770,977 Surplus on revaluation of held for trading investments –00 1,186 –00 1,186 Surplus on revaluation of available for sale investments 1,866,556 –00 255,210 2,121,766 3,693,438 69,791 257,219 4,020,448 Deductible temporary differences arising in respect of: Provision against non - performing loans and advances (106,412 ) 74,341 –00 (32,071 ) Remeasurement of defined benefit plan 115,089 28,934 –00 144,023 Provision against diminution in the value of investments (69,517 ) 68,947 –00 (570 ) (60,840 ) 172,222 –00 111,382 3,632,598 242,013 257,219 4,131,830
54
Balance Recognised in Recognised Balance as at profit and in surplus on as at 01 January loss revaluation 31 December 2015 account of assets 2015 (Rupees in '000) Taxable temporary differences arising in respect of: Accelerated depreciation 956,156 73,096 –00 1,029,252 Surplus on revaluation of fixed assets / non - banking assets 826,092 (28,462 ) –00 797,630 Surplus on revaluation of held for trading investments –00 –00 –00 –00 Surplus on revaluation of available for sale investments 936,986 –00 929,570 1,866,556 2,719,234 44,634 929,570 3,693,438 Deductible temporary differences arising in respect of: Provision against non - performing loans and advances (16,558 ) (89,854 ) –00 (106,412 ) Remeasurement of defined benefit plan 78,430 36,659 –00 115,089 Provision against diminution in the value of investments (570 ) (68,947 ) –00 (69,517 ) 61,302 (122,142 ) –00 (60,840 ) 2,780,536 (77,508 ) 929,570 3,632,598
2016 2015 Note (Rupees in '000) 20. OTHER LIABILITIES Mark - up / return / interest payable in local currency 1,834,073 1,784,466 Mark - up / return / interest payable in foreign currencies 148,230 131,580 Provision for compensated absences 20.1 417,084 362,923 Taxation (Provisions less payments) –00 316,737 Unclaimed dividends 290,390 229,596 Branch adjustment account –00 73,247 Special exporters’ accounts in foreign currencies 73,644 78,524 Unearned commission income 115,154 86,016 Unrealised loss on forward foreign exchange contracts 745,531 472,048 Security deposits against leases / ijarah 2,232,355 1,054,304 Other security deposits 417,763 369,690 Workers’ welfare fund 722,091 1,063,464 Accrued expenses 668,599 604,161 Payable to defined benefit plan 37.4 411,494 328,824 Provision against off - balance sheet items 20.2 102,257 144,042 Payable to SBP / NBP 81,759 320,683 Payable to supplier against murabaha 158,459 103,247 Payable against purchase of securities 22,422 18,016 Charity payable 2,738 2,690 Insurance payable 232,448 132,061 Others 313,195 342,100 8,989,686 8,018,419
20.1 Provision for compensated absences has been determined on the basis of independent actuarial valuation. The significant assumptions used for actuarial valuation were as follows:
2016 2015 (% per annum) Discount rate 9.25% 10% Expected rate of increase in salary in future years 8.25% 9%
55
20.2 Provision against off - balance sheet items Opening balance 144,042 105,507 Charge for the year 4,549 38,535 Reversal during the year (46,334 ) –00 (41,785 ) 38,535
Closing balance 102,257 144,042
21. SHARE CAPITAL 2016 2015 (Number of shares) Authorised Capital 1,500,000,000 1,500,000,000 Ordinary shares of Rs.10/- each 15,000,000 15,000,000
Issued, subscribed and paid - up capital
30,000,000 30,000,000 Issued for cash 300,000 300,000 1,081,425,416 1,081,425,416 Issued as bonus shares 10,814,254 10,814,254
1,111,425,416 1,111,425,416 11,114,254 11,114,254
21.1 As of statement of financial position date 197,857,620 (2015: 202,920,855) ordinary shares of Rs. 10/- each were held by the related parties.
2016 2015 (Rupees in '000)
22. SURPLUS ON REVALUATION OF ASSETS - NET OF TAX Fixed assets / non - banking assets 22.1 2,650,950 2,692,363 Available for sale investments 22.2 3,940,422 3,466,462 6,591,372 6,158,82522.1 Fixed assets / non - banking assets Balance at beginning of the year 3,489,993 3,575,215 Surplus / (adjustment) on revaluation of the Bank’s fixed assets / non - banking assets during the year 13,825 (3,905 ) Transfer to unappropriated profit in respect of incremental depreciation charged during the year (81,891 ) (81,317 )
3,421,927 3,489,993 Related deferred tax liability on: Balance at beginning of the year 797,630 826,092 Revaluation of Bank’s fixed assets / non - banking assets during the year 2,009 –00 Transfer to unappropriated profit in respect of incremental depreciation charged during the year (28,662 ) (28,462 ) (770,977 ) (797,630 ) 2,650,950 2,692,363
2016 2015 Note (Rupees in '000)
22.2 Available for sale investments Federal Government Securities 4,457,817 4,534,035 Fully paid - up ordinary shares 1,177,059 708,837
Term finance certificates, sukuk bonds and foreign currency bonds 10,294 1,388 Units of mutual funds 417,018 88,758 6,062,188 5,333,018 Related deferred tax liability (2,121,766 ) (1,866,556 ) 3,940,422 3,466,462
22.2.1 This includes surplus of Rs. 31.963 million (2015: Rs. 11.300 million) on revaluation of available for sale securities placed as per arrangements permissible under Shariah.
23. CONTINGENCIES AND COMMITMENTS23.1 Direct credit substitutes Financial guarantees issued favouring: - Financial institutions 930,792 462,800 - Others 4,695,734 5,086,805 5,626,526 5,549,60523.2 Transaction - related contingent liabilities Guarantees issued favouring: - Government 34,649,327 29,798,948 - Financial institutions 594,401 668,750 - Others 11,682,502 6,743,423 46,926,230 37,211,12123.3 Trade - related contingent liabilities Letters of credit 107,641,921 77,847,579 Acceptances 16,622,601 13,547,110 Bankers liability rediscount 1,898,680 –000 126,163,202 91,394,689
56
23.4 Commitments in respect of forward lending Commitments to extend credit (excluding commitments that are unilaterally cancellable) 10,967,104 10,748,236
23.5 Commitments in respect of forward exchange contracts Purchase 49,396,754 46,760,182 Sale 28,383,678 28,769,804 The maturities of above contracts are spread over the periods upto two years.23.6 Commitments for the acquisition of operating fixed assets 328,351 635,075
23.7 Claims against the Bank not acknowledged as debts 4,459,758 4,616,297
2016 2015 (Rupees in '000)
23.8 Other contingencies Income tax returns of the Bank have been submitted upto and including the Bank’s financial year
2015. The income tax assessments of the Bank are complete upto tax year 2013. For tax year 2012 and 2013, the Additional Commissioner Inland Revenue (ACIR) has passed
order u/s. 122(5A) of the Income Tax Ordinance, 2001 by disallowing certain expenses. Subsequently, amended order was received from ACIR based on a rectification application filed by the Bank resulting in net aggregate tax impact of Rs. 797.233 million. The Bank has filed an appeal before the Commissioner Inland Revenue (Appeals) against the above mentioned orders.
Commissioner Inland Revenue (Appeals) has passed appellate orders for tax years 2009 and 2011 by confirming disallowance of provision for non - performing loans, other provisions and amortisation of intangible assets having an aggregate tax impact of Rs. 15.372 million. The Bank has filed an appeal before Income Tax Appellate Tribunal against the above referred orders.
The management, based on the opinion of its tax advisor, is confident about the favourable outcome of the above matters.
24. DERIVATIVE FINANCIAL INSTRUMENTS The Bank deals in derivative financial instruments namely forward foreign exchange contracts and
foreign currency swaps with the principal view of hedging the risks arising from its trade business. As per the Bank’s policy, these contracts are reported on their fair value at the statement of financial position date. The gains and losses from revaluation of these contracts are included under “income from dealing in foreign currencies”. Unrealised gains and losses on these contracts are recorded in the statement of financial position under “other assets / other liabilities”. These products are offered to the Bank’s customers to protect from unfavourable movements in foreign currencies. The Bank hedges such exposures in the inter - bank foreign exchange market.
57
2016 2015 (Rupees in '000)25. MARK - UP / RETURN / INTEREST EARNED On loans and advances to: Customers 14,337,345 14,576,038 Financial institutions 152,828 118,886 14,490,173 14,694,924 On investments: Available for sale securities 19,422,961 20,726,153 Held to maturity securities 13,533,230 14,635,744 32,956,191 35,361,897
On deposits with financial institutions 200,852 169,542 On securities purchased under resale agreements 60,084 52,961 On Bai Muajjal 95,468 13,086 On call money lendings 1,600 816 47,804,368 50,293,226
25.1 These include Rs. 1,320.354 million (2015: Rs. 1,155.163 million) pertaining to Islamic banking out of which Rs. 82.387 million (2015: Rs. 84.825 million) represents profit from placements permissible under Shariah.
26. MARK - UP / RETURN / INTEREST EXPENSED Deposits 17,440,877 18,503,435 Sub - ordinated loans 444,277 458,513 Repurchase agreement borrowings 3,904,952 5,028,611 Borrowings from SBP 603,166 969,378 Other borrowings 739,536 516,412 23,132,808 25,476,349
58
2016 2015 (Rupees in '000)27. DIVIDEND INCOME Listed shares Adamjee Insurance Company Limited 525 150 AL - Ghazi Tractors Limited 600 –00 Allied Bank Limited 5,472 5,417 Askari Bank Limited –00 150 Attock Petroleum Limited 7,866 6,166 Attock Refinery Limited 500 –00 Cherat Cement Company Limited 506 900 D.G. Khan Cement Company Limited 1,500 1,250 Dawood Hercules Corporation Limited 519 –00 EFU General Insurance Limited 50 –00 Engro Corporation Limited 5,340 858 Engro Fertilizer Limited 2,750 699 Fatima Fertilizer Company Limited 313 –00 Fauji Cement Company Limited 2,960 750 Fauji Fertilizer Bin Qasim Limited 305 10,440 Fauji Fertilizer Company Limited 38,690 38,600 Faysal Bank Limited 100 –00 First Habib Modaraba 294 323 Habib Bank Limited 15,765 12,630 Habib Metropolitan Bank Limited 30,055 55,310 Habib Sugar Mills Limited 23,538 23,416 Hascol Petroleum Limited 175 –00 Hub Power Company Limited 95,794 72,460 ICI Pakistan Limited 450 –00 Indus Motor Company Limited 1,539 –00 International Industries Limited 238 210 International Steels Limited 7,029 –00 Kot Addu Power Company Limited 59,702 46,337 Lalpir Power Limited 4,944 4,189 Lucky Cement Limited 100 248 MCB Bank Limited 14,073 6,478 Meezan Bank Limited –00 357 Millat Tractors Limited 600 –00 Nishat Chunian Power Limited 32,268 35,183 Oil & Gas Development Company Limited –00 443 Packages Limited 263 158 Pak Electron Limited 313 125 Pakgen Power Limited 9,648 8,830 Pakistan Oilfields Limited 33,218 32,533 Pakistan Petroleum Limited 3,699 12,907 Pakistan State Oil Company Limited 11,806 9,375 Pakistan Telecommunication Company Limited 7,033 949 Pioneer Cement Limited 188 –00 Rafhan Maize Products Company Limited 384 –00 Shell Pakistan Limited 360 180 Soneri Bank Limited 20,677 11,580 Standard Chartered Bank (Pakistan) Limited 6,366 7,162 The SEARLE Company Limited 150 –00 United Bank Limited 13,715 12,247 462,380 419,010 Mutual funds First Habib Cash Fund 8,005 21,579 First Habib Income Fund 9,500 20,357 First Habib Islamic Balanced Fund 338 1,388 First Habib Stock Fund 410 4,000 National Investment (Unit) Trust 49,647 46,889 NIT Government Bond Fund 36,461 67,089 NIT Government Treasury Fund 998 –00 NIT Income Fund 13,241 21,081 NIT Islamic Equity Fund 10,520 –00 PIML Income Fund –00 308 129,120 182,691 591,500 601,701
59
2016 2015 Note (Rupees in '000)
28. GAIN ON SALE / REDEMPTION OF SECURITIES - NET Mutual funds –00 318,246 Government securities –00 26 Listed shares 715,470 (101,018 )
715,470 217,254
29. OTHER INCOME Gain on sale of operating fixed assets 101,024 56,372 Recovery of expenses from customers 29.1 209,117 178,839 Lockers rent 327 512 Rent on property 2,100 2,100 Cheque book issuance / cheque return charges 243,819 261,120 Banking charges 82,274 74,927 Others 90,698 123,605 729,359 697,475
29.1 Includes courier, SWIFT, postage and other charges recovered from customers.
30. ADMINISTRATIVE EXPENSES Salaries, allowances, etc. 7,899,631 6,729,630 Charge for defined benefit plan 37.6 217,568 171,390 Charge for defined contribution plan 319,518 263,530 Charge for employees compensated absences 54,174 49,654 Non-executive directors' fee, allowances and other expenses 9,975 8,325 Rent, taxes, insurance, electricity, etc. 2,375,023 2,055,478 Legal and professional charges 210,739 88,383 Communications 291,159 309,728 Repairs and maintenance 1,375,636 1,088,708 Security charges 814,656 711,682 Stationery and printing 443,359 385,564 Advertisement and publicity 325,968 324,693 Donations 30.1 184,900 49,100 Auditors' remuneration 30.2 5,521 3,508 Depreciation 1,598,840 1,180,653 Amortisation 82,351 85,328 Travelling and conveyance 158,582 142,703 Vehicle running expenses 360,455 342,605 Commission and brokerage 140,826 86,477 Subscriptions and publications 79,536 57,952 Clearing charges 85,699 90,032 Staff training 26,712 14,596 Entertainment and staff refreshment 288,911 160,164 Cleaning charges 109,488 81,978 Charitable expenses 51,341 40,219 CNIC verification charges 27,308 45,326 Others 190,473 127,634
17,728,349 14,695,040
60
2016 2015 Note (Rupees in '000)
30.1 The detail of donations is given below: Al-Sayyeda Benevolent Trust 1,500 1,500 Bank AL Habib Staff Benefit Trust 99,900 100 Cancer Research & Treatment Foundation –00 10,000 Childlife Foundation 5,000 –00 Developments in Literacy 500 –00 Friends of Punjab Institute of Cardiology 10,000 –00 GCU Endowment Fund Trust 1,000 1,000 Habib Education Trust 1,500 1,500 Habib Medical Trust 1,500 1,500 Habib Poor Fund 1,500 1,500 Husaini Hematology and Oncology Trust 10,000 –00 Institute of Management Sciences, Bahauddin Zakariya University –00 1,000 Jinnah Foundation (Memorial) Trust –00 2,000 Patients’ Aid Foundation 30,000 15,000 Rahmatbai Habib Food and Clothing Trust 1,500 1,500 Rahmatbai Habib Widows and Orphans Trust 1,500 1,500 Sindh Institute of Urology and Transplantation (SIUT) 15,000 7,500 The Citizens Foundation 4,000 3,500 The Health Foundation 500 –00 184,900 49,100
30.2 Auditors' remuneration Audit fee 2,375 2,145 Half yearly review 750 660 Special certifications 1,681 253 Gratuity fund 83 75 Out of pocket expenses 632 375
5,521 3,508
31. OTHER (REVERSALS) / PROVISIONS / WRITE-OFFS (Reversal) / provision against off - balance sheet items (41,785 ) 38,535
Provision against other assets 3,752 –00 (38,033 ) 38,535
32. OTHER (REVERSALS) / CHARGES Workers’ welfare fund 32.1 (504,507 ) 251,666 Penalties imposed by SBP 12,061 50,538
(492,446 ) 302,204
32.1 This includes reversal of provision for Workers' Welfare Fund amounting to Rs. 773.160 million for the period from January 2008 to December 2013, based on Supreme Court's judgement dated November 10, 2016.
61
33. TAXATION For the year Current 4,299,752 4,503,771 Prior years 502,993 500,484 Deferred 242,013 (77,508 ) 5,044,758 4,926,747
33.1 Relationship between tax expense and accounting profit Profit before taxation 13,163,987 12,331,659
Tax at the applicable rate of 35% (2015: 35%) 4,607,395 4,316,081 Tax effects of: Expenses that are not deductible in determining taxable income 3,316 110,182 Tax effect of prior year provisions 33.1.1 502,993 500,484 Others (68,946 ) –00 5,044,758 4,926,747
33.1.1 This amount includes super tax at the rate of 4% on income of Banks for the year ended 31 December 2014 (Tax Year 2015) introduced by the Federal Government vide Finance Act, 2015. This tax has been levied for financing the rehabilitation of internally displaced persons affected by the ongoing war on terror. This super tax has been extended for 31 December 2015 (Tax Year 2016).
34. BASIC AND DILUTED EARNINGS PER SHARE Profit after taxation 8,119,229 7,404,912
(Number)
Weighted average number of ordinary shares 1,111,425,416 1,111,425,416
(Rupees)
Basic and diluted earnings per share 7.31 6.66
2016 2015 Note (Rupees in '000)35. CASH AND CASH EQUIVALENTS
Cash and balances with treasury banks 8 50,600,041 38,577,738 Balances with other banks 9 2,866,455 3,185,669 Overdrawn nostros 16 (1,144,712 ) (5,304 )
52,321,784 41,758,103 (Numbers)36. STAFF STRENGTH
Permanent 8,286 7,209 Temporary / on contractual basis 305 265 Bank’s own staff at end of the year 8,591 7,474 Outsourced 2,180 1,917
Total staff strength 10,771 9,391
2016 2015 Note (Rupees in '000)
62
37. DEFINED BENEFIT PLAN
37.1 General description
The Bank operates an approved gratuity fund for all its confirmed employees, which is administered by the Trustees. The benefits under the gratuity scheme are payable on retirement at the age of 60 years or on earlier cessation of service as under:
Number of years of eligible service completed: Amount of gratuity payable: Less than 5 years Nil 5 years or more but less than 10 years 1/3rd of basic salary for each year served 10 years or more but less than 15 years 2/3rd of basic salary for each year served 15 years or more Full basic salary for each year served
37.2 Principal actuarial assumptions
The latest actuarial valuation of the scheme was carried out on 31 December 2016 and the significant assumptions used for actuarial valuation were as follows:
2016 201537.3 Significant Actuarial Assumptions Financial Assumptions Discount Rate 9.25% 10% Salary Increase Rate 8.25% 9%
Demographic Assumptions Mortality rates (for death in service) SLIC (2001-05)-1 SLIC (2001-05)-1 Rates of employee turnover Moderate Moderate
2016 2015 (Rupees in '000)37.4 Statement of Financial Position Present value of defined benefit obligation 1,938,013 1,622,662 Fair value of plan assets (1,526,519 ) (1,293,838 )
Deficit 411,494 328,824
37.5 Movement in net defined benefit liability Balance accrued as at beginning of the year 328,824 224,085 Net periodic benefit cost for the year ended 217,568 171,390 Employer’s contribution during the year (217,568 ) (171,390 ) Amount of remeasurements losses recognised in Other Comprehensive Income during the year 82,670 104,739
Balance accrued as at end of the year 411,494 328,824

63
2016 2015 (Rupees in '000)37.6 Defined Benefit Cost for the Year Cost recognised in Profit and Loss Account for the year Service cost Current service cost 186,216 159,496
Net interest cost Interest cost on defined benefit obligation 166,978 148,029 Interest income on plan assets (135,626 ) (136,135 )
Net interest cost 31,352 11,894
Cost recognised in Profit and Loss for the year 217,568 171,390
Remeasurements recognised in Other Comprehensive Income during the year
Actuarial loss on obligation 65,784 61,060 Actuarial loss on assets 16,886 43,679
Remeasurement loss recognised in Other Comprehensive Income 82,670 104,739
Total defined benefit cost recognised in Profit and Loss Account and Other Comprehensive Income 300,238 276,129
37.7 Movement in the present value of defined benefit obligation Present value of defined benefit obligation at beginning of year 1,622,662 1,327,761 Service cost 186,216 159,496 Interest cost on defined benefit obligation 166,978 148,029 Actual benefits paid during the year (103,627 ) (73,684 ) Actuarial loss on obligation 65,784 61,060
Present value of defined benefit obligation at end of year 1,938,013 1,622,662
37.8 Movement in the fair value of plan assets Fair value of plan assets at beginning of year 1,293,838 1,103,676 Interest income on plan assets 135,626 136,135 Actual contribution by employer 217,568 171,390 Actual benefits paid during the year (103,627 ) (73,684 ) Actuarial loss on plan assets (16,886 ) (43,679 )
Fair value of plan assets at end of year 1,526,519 1,293,838
37.9 Actual return on plan assets 153,787 154,698
64
2017 (Rupees in '000)37.10 Charge and contribution for the year ending 31 December 2017
Service cost Current service cost 218,742
Net interest cost
Interest cost on defined benefit obligation 184,786 Interest income on plan assets (148,369 )
Net interest cost 36,417
Cost to be recognised in Profit and loss account for the year 2017 255,159
2016 (Rupees in ‘000)37.11 Analysis of Present value of defined benefit obligation
Vested / Non - Vested
Vested Benefits 1,788,446 Non - Vested benefits 149,567 Total 1,938,013
Type of Benefits
Accumulated Benefit Obligation 868,323 Amounts attributed to future salary increases 1,069,690
Total 1,938,013
37.12 Remeasurements recognised in Other Comprehensive Income during the year Actuarial loss on obligation Gain due to change in financial assumptions (8,153 ) Loss due to change in experience adjustments 73,937
Total actuarial loss on obligation 65,784
Net return on plan assets over interest income Actuarial loss on plan assets 16,886
Remeasurements loss recognised in Other Comprehensive Income during the year 82,670

65
2016 (Rupees in '000)
37.13 Disaggregation of fair value of plan assets
Cash and Cash equivalents (after adjusting current liabilities) 10,741
Unquoted investments
Pakistan Investment Bonds 837,295 SBP - Treasury Bills 210,000 Term Deposit 468,483
1,515,778
Total fair value of plan assets 1,526,519
37.14 Maturity profile of the defined benefit obligation
Distribution of timing of benefit paymentsWithin the next 12 months (next annual reporting period) 96,706
Between 2 and 5 years 648,758 Between 5 and 10 years 1,464,806
2,210,270
37.15 Sensitivity Analysis on significant actuarial assumptions: Actuarial Liability The Weighted average duration of the PBO is 10.83 years. Discount Rate + 1% 1,744,393
Discount Rate - 1% 2,166,740
Long Term Salary Increases + 1% 2,176,725
Long Term Salary Increases - 1% 1,733,013
66
39. COMPENSATION OF DIRECTORS AND EXECUTIVES Chief Executive Directors Executives 2016 2015 2016 2015 2016 2015 (Rupees in '000)
Fee –00 –00 14,142 8,325 –00 –00 Managerial remuneration 20,467 16,000 15,227 10,400 2,250,456 1,831,666 Charge for defined benefit plan 9,655 1,333 12,611 867 324,772 271,751 Contribution to defined contribution plan 2,047 1,600 1,523 1,040 170,468 137,186 Rent and house maintenance 8,187 6,400 6,091 4,160 795,191 641,621 Utilities 3,986 3,361 1,542 1,057 198,798 160,386 Medical –00 51 100 47 68,980 55,428 Bonus 5,000 5,333 3,920 3,467 478,952 526,647 Others –00 –00 –00 –00 53,043 37,522
49,342 34,078 55,156 29,363 4,340,660 3,662,207
Number of person(s) 2* 1 10 9 2,061 1,586
Executives, including the Chief Executive and Executive Director, are entitled to Bank's maintained cars in accordance with the terms of their employment and are entitled to medical and life insurance benefits in accordance with the policy of the Bank. In addition, the Chief Executive and Executive Director are also entitled to drivers, club memberships, security arrangements and payment of travel bills in accordance with their terms of employment.
Chairman of the Board is also entitled to Bank’s maintained cars, security guard services, payment of utility bills, club and entertainment bills, travelling bills, appropriate office, staff, and administrative support.
* This includes the former Chief Executive & Managing Director who retired during the year.40. FAIR VALUE OF FINANCIAL INSTRUMENTS Fair value is the amount for which an asset could be exchanged, or a liability settled, between
knowledgeable willing parties in an arm's length transaction. Fair value of financial instruments is based on:
Federal Government Securities PKRV rates (Reuters page) Listed securities Market prices Mutual funds Net asset values Unlisted equity investments Break - up value as per latest available audited financial statements Fair value of fixed term advances of over one year, staff loans and fixed term deposits of over one
year cannot be calculated with sufficient reliability due to non - availability of relevant active market for similar assets and liabilities. The provision for impairment of debt securities and loans and advances has been calculated in accordance with the Bank's accounting policies as stated in note 5.4 and 5.5.
38. DEFINED CONTRIBUTION PLAN
The general description of the plan is included in note 5.7.
The table below analyses financial instruments measured at the end of reporting period by the level in the fair value hierarchy into which the fair value measurement is categorised: 2016 Carrying amount Fair value Available Held for Held to Loans Other Other Total Level 1 Level 2 Level 3 Total
for Trading Maturity and Financial FinancialSale Receivables Assets Liabilities
Note (Rupees in '000) On - balance sheet financial instruments Financial assets measured at fair value – Investments Federal Government Securities (TBills + PIBs + Sukuk Bonds + FC Bonds) 291,880,945 –00 –00 –00 –00 –00 291,880,945 –00 291,880,945 –00 291,880,945 Foreign Currency Bonds - Others 1,700,622 –00 –00 –00 –00 –00 1,700,622 –00 1,700,622 –00 1,700,622 Fully paid-up ordinary shares - Listed 4,339,767 157,385 –00 –00 –00 –00 4,497,152 4,497,152 –00 –00 4,497,152 Units of mutual funds 2,517,018 –00 –00 –00 –00 –00 2,517,018 2,517,018 –00 –00 2,517,018 Term Finance Certificates - Listed 704,600 –00 –00 –00 –00 –00 704,600 704,600 –00 –00 704,600 Financial assets not measured at fair value – Cash and bank balances with treasury bank –00 –00 –00 –00 50,600,041 –00 50,600,041 –00 –00 –00 –00 – Balances with other banks –00 –00 –00 –00 2,866,455 –00 2,866,455 –00 –00 –00 –00 – Lendings to financial institutions –00 –00 –00 –00 –00 –00 –00 –00 –00 –00 –00 – Investments Federal Government Securities (TBills + PIBs + Sukuk Bonds + FC Bonds + TFC + Others) 5,128,571 –00 93,489,701 –00 –00 –00 98,618,272 –00 103,305,566 –00 103,305,566 Other Federal Government Securities 40.1 –00 –00 –00 –00 –00 –00 –00 –00 –00 –00 –00 Foreign Currency Bonds - Others 40.1 –00 –00 520,996 –00 –00 –00 520,996 –00 –00 –00 –00 Sukuk Bonds - Others 40.1 2,837,799 –00 148,566 –00 –00 –00 2,986,365 –00 –00 –00 –00 Fully paid-up ordinary shares - Unlisted 40.1 39,829 –00 –00 –00 –00 –00 39,829 –00 –00 –00 –00 Term Finance Certificates - Unlisted 40.1 798,953 –00 –00 –00 –00 –00 798,953 –00 –00 –00 –00 Associates Listed shares –00 –00 –00 –00 182,690 –00 182,690 452,877 –00 –00 452,877 Mutual funds –00 –00 –00 –00 320,000 –00 320,000 306,010 –00 –00 306,010 Unlisted shares 40.1 –00 –00 –00 –00 60,000 –00 60,000 –00 –00 –00 –00 Subsidiaries - Unlisted Shares 40.1 –00 –00 –00 –00 200,127 –00 200,127 –00 –00 –00 –00 – Advances 40.1 –00 –00 –00 261,440,098 –00 –00 261,440,098 –00 –00 –00 –00 – Other assets 40.1 –00 –00 –00 –00 10,432,547 –00 10,432,547 –00 –00 –00 –00 309,948,104 157,385 94,159,263 261,440,098 64,661,860 –00 730,366,710 8,477,657 396,887,133 –00 405,364,790 Financial liabilities not measured at fair value – Bills payable 40.1 –00 –00 –00 –00 –00 (13,872,057 ) (13,872,057 ) –00 –00 –00 –00 – Borrowings 40.1 –00 –00 –00 –00 –00 (93,717,345 ) (93,717,345 ) –00 –00 –00 –00 – Deposits and other accounts 40.1 –00 –00 –00 –00 –00 (584,171,954 ) (584,171,954 ) –00 –00 –00 –00 – Sub-ordinated loans 40.1 –00 –00 –00 –00 –00 (3,999,200 ) (3,999,200 ) –00 –00 –00 –00 – Other liabilities 40.1 –00 –00 –00 –00 –00 (7,633,100 ) (7,633,100 ) –00 –00 –00 –00 –00 –00 –00 –00 –00 (703,393,656 ) (703,393,656 ) –00 –00 –00 –00 309,948,104 157,385 94,159,263 261,440,098 64,661,860 (703,393,656 ) 26,973,054 8,477,657 396,887,133 –00 405,364,790 Off-balance sheet financial instruments measured at fair value Forward purchase of foreign exchange contracts –00 –00 –00 –00 –00 49,396,754 49,396,754 –00 48,711,786 –00 48,711,786
Forward sale of foreign exchange contracts –00 –00 –00 –00 –00 (28,383,678 ) (28,383,678 ) –00 (28,563,379 ) –00 (28,563,379 ) Off-balance sheet financial instruments not measured at fair value Commitment to extend credit 40.1 –00 –00 –00 –00 –00 10,967,104 10,967,104 –00 –00 –00 –00
67
2015 Carrying amount Fair value Available Held for Held to Loans Other Other Total Level 1 Level 2 Level 3 Total
for Trading Maturity and Financial FinancialSale Receivables Assets Liabilities
Note (Rupees in '000) On - balance sheet financial instruments Financial assets measured at fair value – Investments Federal Government Securities (TBills + PIBs + Sukuk Bonds + FC Bonds) 208,210,576 –00 –00 –00 –00 –00 208,210,576 –00 208,210,576 –00 208,210,576 Foreign Currency Bonds - Others 627,606 –00 –00 –00 –00 –00 627,606 –00 627,606 –00 627,606 Fully paid-up ordinary shares - Listed 4,530,494 –00 –00 –00 –00 –00 4,530,494 4,727,486 –00 –00 4,727,486 Units of mutual funds 1,638,758 –00 –00 –00 –00 –00 1,638,758 1,638,758 –00 –00 1,638,758 Term Finance Certificates - Listed 705,764 –00 –00 –00 –00 –00 705,764 705,764 –00 –00 705,764 Financial assets not measured at fair value – Cash and bank balances with treasury bank –00 –00 –00 –00 38,577,738 –00 38,577,738 –00 –00 –00 –00 – Balances with other banks –00 –00 –00 –00 3,185,669 –00 3,185,669 –00 –00 –00 –00 – Lendings to financial institutions –00 –00 –00 –00 3,992,794 –00 3,992,794 –00 –00 –00 –00 – Investments Federal Government Securities (TBills + PIBs + Sukuk Bonds + FC Bonds + TFC + Others) 1,964,286 –00 132,866,129 –00 –00 –00 134,830,415 –00 144,377,844 –00 144,377,844 Other Federal Government Securities 40.1 –00 –00 1,825,278 –00 –00 –00 1,825,278 –00 –00 –00 –00 Foreign Currency Bonds - Others 40.1 –00 –00 –00 –00 –00 –00 –00 –00 –00 –00 –00 Sukuk Bonds - Others 40.1 2,472,178 –00 172,888 –00 –00 –00 2,645,066 –00 –00 –00 –00 Fully paid-up ordinary shares - Unlisted 40.1 39,829 –00 –00 –00 –00 –00 39,829 –00 –00 –00 –00 Term Finance Certificates - Unlisted 40.1 832,400 –00 –00 –00 –00 –00 832,400 –00 –00 –00 –00 Associates Listed shares –00 –00 –00 –00 182,690 –00 182,690 357,876 –00 –00 357,876 Mutual funds –00 –00 –00 –00 320,000 –00 320,000 306,171 –00 –00 306,171 Unlisted shares 40.1 –00 –00 –00 –00 60,000 –00 60,000 –00 –00 –00 –00 Subsidiaries - Unlisted Shares 40.1 –00 –00 –00 –00 200,127 –00 200,127 –00 –00 –00 –00 – Advances 40.1 –00 –00 –00 207,288,608 –00 –00 207,288,608 –00 –00 –00 –00 – Other assets 40.1 –00 –00 –00 –00 13,389,637 –00 13,389,637 –00 –00 –00 –00 221,021,891 –00 134,864,295 207,288,608 59,908,655 –00 623,083,449 7,736,055 353,216,026 –00 360,952,081 Financial liabilities not measured at fair value – Bills payable 40.1 –00 –00 –00 –00 –00 (8,665,462 ) (8,665,462 ) –00 –00 –00 –00 – Borrowings 40.1 –00 –00 –00 –00 –00 (62,592,299 ) (62,592,299 ) –00 –00 –00 –00 – Deposits and other accounts 40.1 –00 –00 –00 –00 –00 (516,213,178 ) (516,213,178 ) –00 –00 –00 –00 – Sub-ordinated loans 40.1 –00 –00 –00 –00 –00 (2,994,600 ) (2,994,600 ) –00 –00 –00 –00 – Other liabilities 40.1 –00 –00 –00 –00 –00 (5,971,990 ) (5,971,990 ) –00 –00 –00 –00 –00 –00 –00 –00 –00 (596,437,529 ) (596,437,529 ) –00 –00 –00 –00 221,021,891 –00 134,864,295 207,288,608 59,908,655 (596,437,529 ) 26,645,920 7,736,055 353,216,026 –00 360,952,081 Off-balance sheet financial instruments measured at fair value Forward purchase of foreign exchange contracts –00 –00 –00 –00 –00 46,760,182 46,760,182 –00 46,443,437 –00 46,443,437
Forward sale of foreign exchange contracts –00 –00 –00 –00 –00 (28,769,804 ) (28,769,804 ) –00 (28,875,247 ) –00 (28,875,247 ) Off-balance sheet financial instruments not measured at fair value Commitment to extend credit 40.1 –00 –00 –00 –00 –00 10,748,236 10,748,236 –00 –00 –00 –00 The Bank measures fair values using the following fair value hierarchy that reflects the significance of the inputs used in making the measurements: Level 1: Fair value measurements using quoted prices (unadjusted) in active markets for identical assets or liabilities. Level 2: Fair value measurements using inputs other than quoted prices included within Level 1 that are observable for the assets or liability, either directly (i.e. as prices) or indirectly (i.e. derived from prices). Level 3: Fair value measurements using input for the asset or liability that are not based on observable market data (i.e. unobservable inputs). 40.1 The Bank has not disclosed the fair values for these financial assets and liabilities, as these are for short term or reprice over short term. Therefore their carrying amounts are reasonable approximation of fair value.40.2 Fixed assets have been carried at revalued amounts determined by professional valuer (level 2 measurement) based on their assessment of the market value as disclosed in note 13.
68
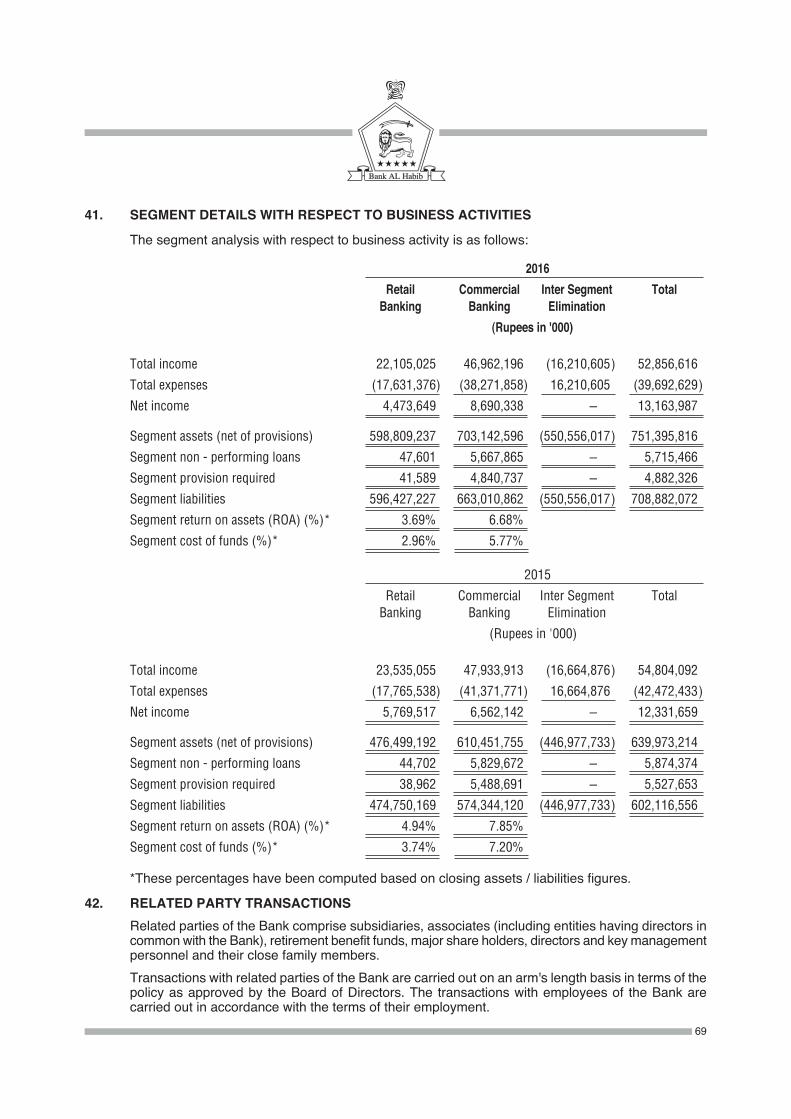
69
41. SEGMENT DETAILS WITH RESPECT TO BUSINESS ACTIVITIES
The segment analysis with respect to business activity is as follows:
2016 Retail Commercial Inter Segment Total Banking Banking Elimination (Rupees in '000)
Total income 22,105,025 46,962,196 (16,210,605 ) 52,856,616
Total expenses (17,631,376 ) (38,271,858 ) 16,210,605 (39,692,629 )
Net income 4,473,649 8,690,338 –00 13,163,987
Segment assets (net of provisions) 598,809,237 703,142,596 (550,556,017 ) 751,395,816
Segment non - performing loans 47,601 5,667,865 –00 5,715,466
Segment provision required 41,589 4,840,737 –00 4,882,326
Segment liabilities 596,427,227 663,010,862 (550,556,017 ) 708,882,072
Segment return on assets (ROA) (%)* 3.69% 6.68%
Segment cost of funds (%)* 2.96% 5.77%
2015
Retail Commercial Inter Segment Total Banking Banking Elimination
(Rupees in '000)
Total income 23,535,055 47,933,913 (16,664,876 ) 54,804,092
Total expenses (17,765,538 ) (41,371,771 ) 16,664,876 (42,472,433 )
Net income 5,769,517 6,562,142 –00 12,331,659
Segment assets (net of provisions) 476,499,192 610,451,755 (446,977,733 ) 639,973,214
Segment non - performing loans 44,702 5,829,672 –00 5,874,374
Segment provision required 38,962 5,488,691 –00 5,527,653
Segment liabilities 474,750,169 574,344,120 (446,977,733 ) 602,116,556
Segment return on assets (ROA) (%)* 4.94% 7.85%
Segment cost of funds (%)* 3.74% 7.20%
*These percentages have been computed based on closing assets / liabilities figures.
42. RELATED PARTY TRANSACTIONS Related parties of the Bank comprise subsidiaries, associates (including entities having directors in
common with the Bank), retirement benefit funds, major share holders, directors and key management personnel and their close family members.
Transactions with related parties of the Bank are carried out on an arm's length basis in terms of the policy as approved by the Board of Directors. The transactions with employees of the Bank are carried out in accordance with the terms of their employment.
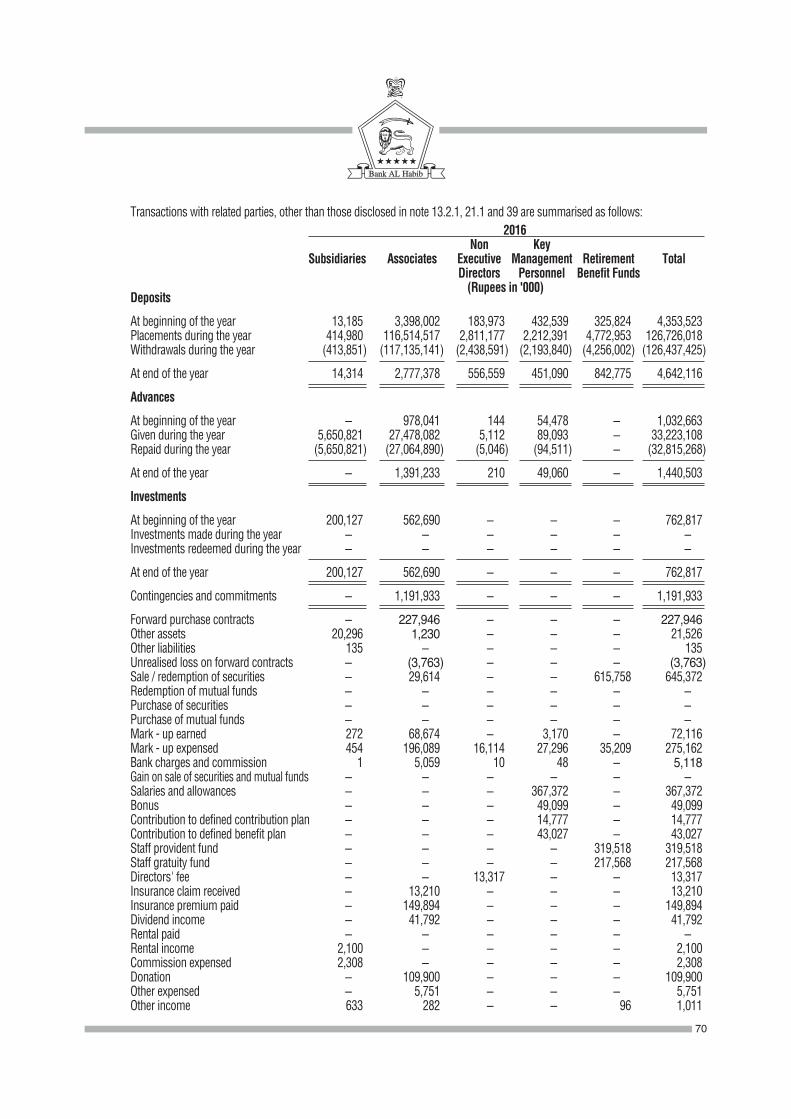
70
Transactions with related parties, other than those disclosed in note 13.2.1, 21.1 and 39 are summarised as follows: 2016 Non Key Subsidiaries Associates Executive Management Retirement Total Directors Personnel Benefit Funds (Rupees in '000) Deposits
At beginning of the year 13,185 3,398,002 183,973 432,539 325,824 4,353,523 Placements during the year 414,980 116,514,517 2,811,177 2,212,391 4,772,953 126,726,018 Withdrawals during the year (413,851 ) (117,135,141 ) (2,438,591 ) (2,193,840 ) (4,256,002 ) (126,437,425 )
At end of the year 14,314 2,777,378 556,559 451,090 842,775 4,642,116
Advances
At beginning of the year –00 978,041 144 54,478 –00 1,032,663 Given during the year 5,650,821 27,478,082 5,112 89,093 –00 33,223,108 Repaid during the year (5,650,821 ) (27,064,890 ) (5,046 ) (94,511 ) –00 (32,815,268 )
At end of the year –00 1,391,233 210 49,060 –00 1,440,503
Investments
At beginning of the year 200,127 562,690 –00 –00 –00 762,817 Investments made during the year –00 –00 –00 –00 –00 –00 Investments redeemed during the year –00 –00 –00 –00 –00 –00
At end of the year 200,127 562,690 –00 –00 –00 762,817
Contingencies and commitments –00 1,191,933 –00 –00 –00 1,191,933
Forward purchase contracts –00 227,946 –00 –00 –00 227,946 Other assets 20,296 1,230 –00 –00 –00 21,526 Other liabilities 135 –00 –00 –00 –00 135
Unrealised loss on forward contracts –00 (3,763 ) –00 –00 –00 (3,763 ) Sale / redemption of securities –00 29,614 –00 –00 615,758 645,372 Redemption of mutual funds –00 –00 –00 –00 –00 –00 Purchase of securities –00 –00 –00 –00 –00 –00 Purchase of mutual funds –00 –00 –00 –00 –00 –00 Mark - up earned 272 68,674 –00 3,170 –00 72,116 Mark - up expensed 454 196,089 16,114 27,296 35,209 275,162 Bank charges and commission 1 5,059 10 48 –00 5,118 Gain on sale of securities and mutual funds –00 –00 –00 –00 –00 –00 Salaries and allowances –00 –00 –00 367,372 –00 367,372 Bonus –00 –00 –00 49,099 –00 49,099 Contribution to defined contribution plan –00 –00 –00 14,777 –00 14,777 Contribution to defined benefit plan –00 –00 –00 43,027 –00 43,027 Staff provident fund –00 –00 –00 –00 319,518 319,518 Staff gratuity fund –00 –00 –00 –00 217,568 217,568 Directors' fee –00 –00 13,317 –00 –00 13,317 Insurance claim received –00 13,210 –00 –00 –00 13,210 Insurance premium paid –00 149,894 –00 –00 –00 149,894 Dividend income –00 41,792 –00 –00 –00 41,792 Rental paid –00 –00 –00 –00 –00 –00 Rental income 2,100 –00 –00 –00 –00 2,100 Commission expensed 2,308 –00 –00 –00 –00 2,308 Donation –00 109,900 –00 –00 –00 109,900 Other expensed –00 5,751 –00 –00 –00 5,751 Other income 633 282 –00 –00 96 1,011
71
2015 Non Key Subsidiaries Associates Executive Management Retirement Total Directors Personnel Benefit Funds (Rupees in '000) Deposits
At beginning of the year 98,058 3,037,277 185,609 401,895 49,441 3,772,280 Placements during the year 687,051 157,951,585 2,932,874 2,817,436 2,922,398 167,311,344 Withdrawals during the year (771,924 ) (157,590,860 ) (2,934,510 ) (2,786,792 ) (2,646,015 ) (166,730,101 )
At end of the year 13,185 3,398,002 183,973 432,539 325,824 4,353,523
Advances
At beginning of the year –00 1,517,483 294 52,960 –00 1,570,737 Given during the year 10,948,669 22,453,719 2,790 72,596 –00 33,477,774 Repaid during the year (10,948,669 ) (22,993,161 ) (2,940 ) (71,078 ) –00 (34,015,848 )
At end of the year –00 978,041 144 54,478 –00 1,032,663
Investments
At beginning of the year 200,127 865,977 –00 –00 –00 1,066,104 Investments made during the year –00 548,287 –00 –00 –00 548,287 Investments redeemed during the year –00 (851,574 ) –00 –00 –00 (851,574 ) At end of the year 200,127 562,690 –00 –00 –00 762,817
Contingencies and commitments –00 749,299 –00 –00 –00 749,299
Forward purchase contracts –00 –00 –00 –00 –00 –00 Other assets 13,688 –00 –00 –00 –00 13,688 Other liabilities 135 –00 –00 –00 –00 135 Unrealised loss on forward contracts –00 –00 –00 –00 –00 –00 Sale / redemption of securities –00 22,001 –00 –00 412,295 434,296 Redemption of mutual funds –00 936,356 –00 –00 –00 936,356 Purchase of securities –00 1,713 –00 –00 –00 1,713 Purchase of mutual funds –00 546,574 –00 –00 –00 546,574 Mark - up earned 676 90,421 3 3,085 –00 94,185 Mark - up expensed 804 141,868 10,947 28,449 5,304 187,372 Bank charges and commission 1 3,572 11 1,106 –00 4,690 Gain on sale of securities and mutual funds –00 84,782 –00 –00 –00 84,782 Salaries and allowances –00 –00 –00 309,093 –00 309,093 Bonus –00 –00 –00 58,961 –00 58,961 Contribution to defined contribution plan –00 –00 –00 14,094 –00 14,094 Contribution to defined benefit plan –00 –00 –00 25,155 –00 25,155 Staff provident fund –00 –00 –00 –00 263,530 263,530 Staff gratuity fund –00 –00 –00 –00 171,390 171,390 Directors' fee –00 –00 7,700 –00 –00 7,700 Insurance claim received –00 14,410 –00 –00 –00 14,410 Insurance premium paid –00 133,365 –00 –00 –00 133,365 Dividend income –00 70,740 –00 –00 –00 70,740 Rental paid –00 1,538 –00 –00 –00 1,538 Rental income 2,100 –00 –00 –00 –00 2,100 Commission expensed 1,276 –00 –00 –00 –00 1,276 Donation –00 100 –00 –00 –00 100 Other expensed 115 4,302 –00 –00 –00 4,417 Other income 537 161 –00 –00 97 795
72
43. CAPITAL ASSESSMENT AND ADEQUACY43.1 Capital adequacy As per requirements of SBP, the Bank is required to comply with the capital adequacy framework
which comprises the following capital standards: i) Minimum Capital Requirement (MCR): The MCR standard sets the paid - up capital that the Bank is required to hold at all times. As of the statement of financial position date, the Bank's paid - up capital stands at Rs.11.114
billion as against the required MCR of Rs. 10 billion. ii) Capital Adequacy Ratio: The Capital Adequacy Ratio (CAR) assesses the capital requirement based on the risks faced
by the banks. The banks are required to comply with the CAR as specified by SBP on standalone as well as consolidated basis.
During the year 2013, SBP issued revised instructions on the computation of CAR based on Basel III Capital Reform as issued by the Basel Committee on Banking Supervision. These instructions became effective from 31 December 2013 with full implementation intended by 31 December 2019. These instructions also specify the transitional arrangements from 2013 to 2019.
Accordingly, the Bank has assessed and reported its Capital Adequacy Ratio in the financial statements on the basis of Basel III requirements as prescribed by SBP.
The CAR on the basis of above framework works out to be as follows: 2016
Required CAR 10.65%
CAR on stand - alone basis 14.18%
CAR on consolidated basis 14.28%
It is the Bank's policy that the level of capital maintained by it should be such that it maximises the return to shareholders while providing sufficient buffer to absorb risks, including those from any unexpected events. Therefore, the Bank carefully monitors its capital adequacy ratio with a view to ensuring that growth in risk assets is accompanied by commensurate growth in capital, and endeavours to maintain the capital adequacy ratio at a level sufficiently higher than the minimum regulatory requirement. Stress testing of capital adequacy is carried out periodically.
Based on its experience over the years, the Bank expects to be able to raise the required capital internally through its operations as well as in the capital markets.
The Bank has a risk management framework commensurate with its size and the nature of its business. The Board of Directors has approved risk management policies covering key areas of activities, including a Risk Tolerance Statement, for the guidance of management and staff of the Bank.
The Bank calculates capital requirement as per Basel III regulatory framework, using the following approaches:
Credit Risk Standardised Approach Market Risk Standardised Approach Operational Risk Basic Indicator Approach iii) Leverage ratio: The leverage ratio compares Tier 1 capital to total exposure, which includes on balance sheet
exposures and credit equivalent of certain off balance sheet exposures adjusted by the regulatory credit conversion factors. The Bank's current leverage ratio is 3.60% which is above the current minimum requirement of 3% set by SBP.
43.2 Scope of application The Basel III Framework for capital adequacy is applicable to the Bank both at the consolidated
level (including subsidiaries) and also on standalone basis. Bank AL Habib Limited is the only bank
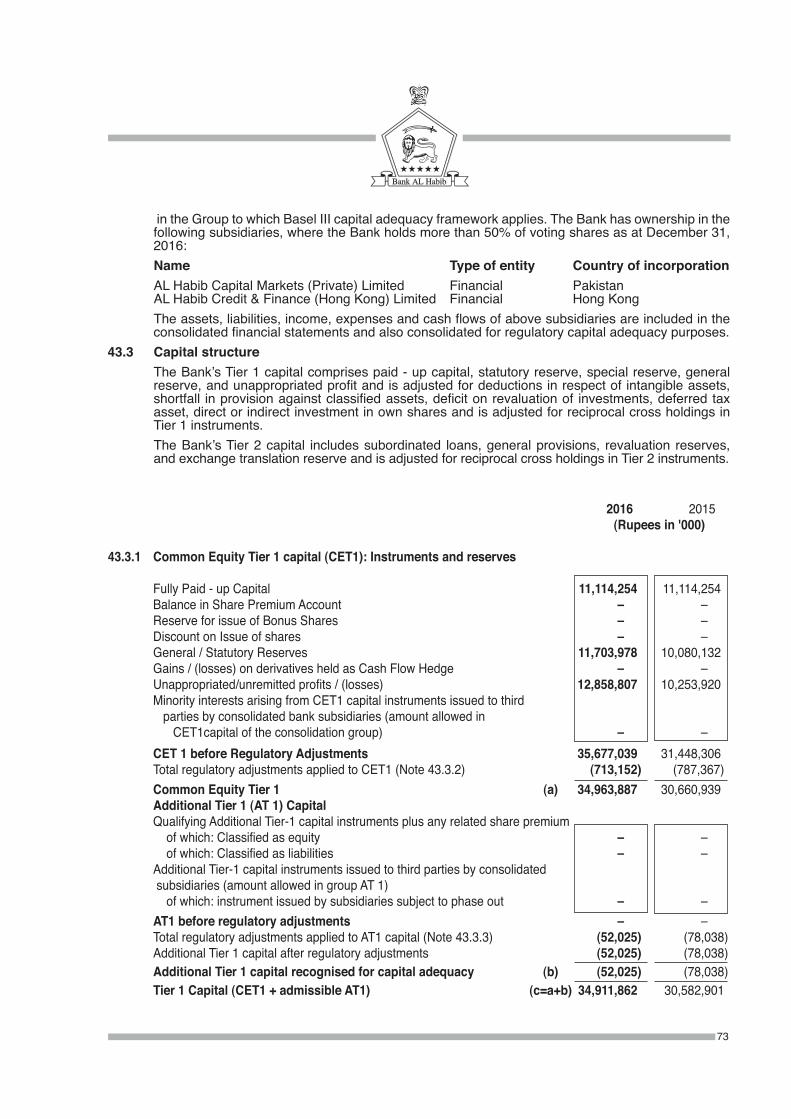
in the Group to which Basel III capital adequacy framework applies. The Bank has ownership in the following subsidiaries, where the Bank holds more than 50% of voting shares as at December 31, 2016:
Name Type of entity Country of incorporation AL Habib Capital Markets (Private) Limited Financial Pakistan AL Habib Credit & Finance (Hong Kong) Limited Financial Hong Kong The assets, liabilities, income, expenses and cash flows of above subsidiaries are included in the
consolidated financial statements and also consolidated for regulatory capital adequacy purposes.43.3 Capital structure The Bank’s Tier 1 capital comprises paid - up capital, statutory reserve, special reserve, general
reserve, and unappropriated profit and is adjusted for deductions in respect of intangible assets, shortfall in provision against classified assets, deficit on revaluation of investments, deferred tax asset, direct or indirect investment in own shares and is adjusted for reciprocal cross holdings in Tier 1 instruments.
The Bank’s Tier 2 capital includes subordinated loans, general provisions, revaluation reserves, and exchange translation reserve and is adjusted for reciprocal cross holdings in Tier 2 instruments.
73
2016 2015 (Rupees in '000)
43.3.1 Common Equity Tier 1 capital (CET1): Instruments and reserves
Fully Paid - up Capital 11,114,254 11,114,254 Balance in Share Premium Account –00 –00 Reserve for issue of Bonus Shares –00 –00 Discount on Issue of shares –00 –00 General / Statutory Reserves 11,703,978 10,080,132 Gains / (losses) on derivatives held as Cash Flow Hedge –00 –00 Unappropriated/unremitted profits / (losses) 12,858,807 10,253,920 Minority interests arising from CET1 capital instruments issued to third parties by consolidated bank subsidiaries (amount allowed in CET1capital of the consolidation group) –00 –00 CET 1 before Regulatory Adjustments 35,677,039 31,448,306 Total regulatory adjustments applied to CET1 (Note 43.3.2) (713,152 ) (787,367) Common Equity Tier 1 (a) 34,963,887 30,660,939 Additional Tier 1 (AT 1) Capital Qualifying Additional Tier-1 capital instruments plus any related share premium of which: Classified as equity –00 –00 of which: Classified as liabilities –00 –00 Additional Tier-1 capital instruments issued to third parties by consolidated subsidiaries (amount allowed in group AT 1) of which: instrument issued by subsidiaries subject to phase out –00 –00 AT1 before regulatory adjustments –00 –00 Total regulatory adjustments applied to AT1 capital (Note 43.3.3) (52,025 ) (78,038 ) Additional Tier 1 capital after regulatory adjustments (52,025 ) (78,038 ) Additional Tier 1 capital recognised for capital adequacy (b) (52,025 ) (78,038 ) Tier 1 Capital (CET1 + admissible AT1) (c=a+b) 34,911,862 30,582,901
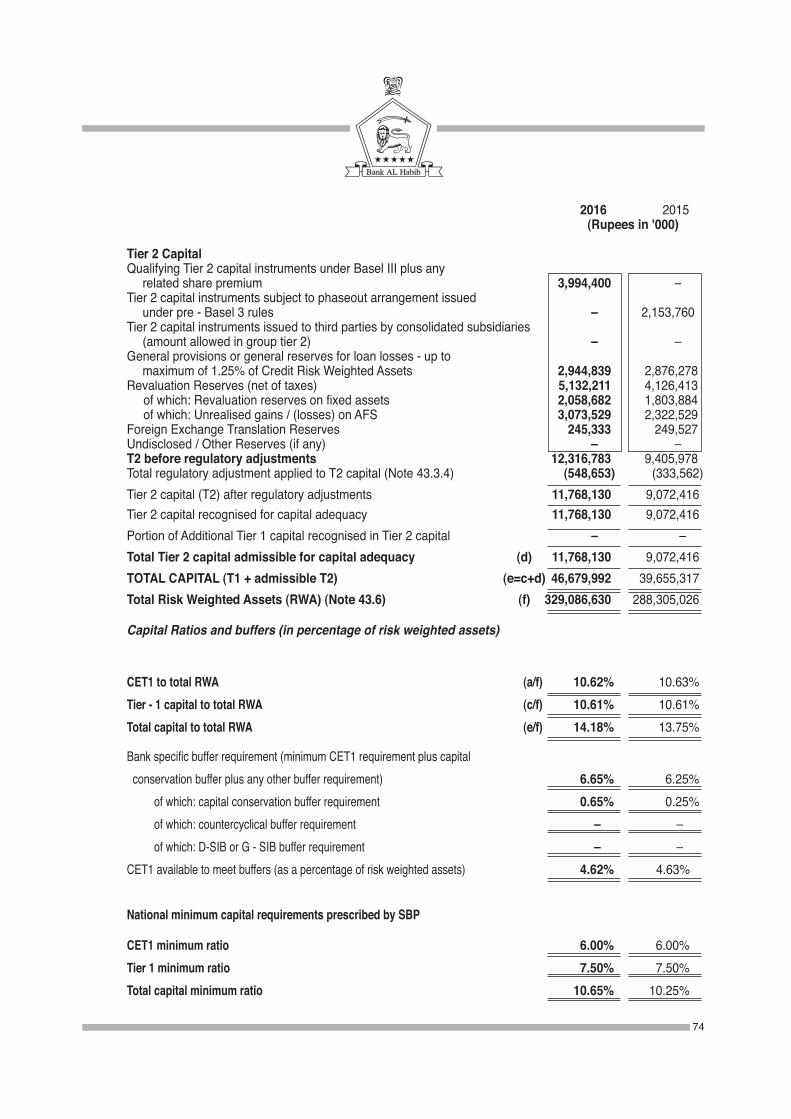
2016 2015 (Rupees in '000)
Tier 2 Capital Qualifying Tier 2 capital instruments under Basel III plus any related share premium 3,994,400 –00 Tier 2 capital instruments subject to phaseout arrangement issued under pre - Basel 3 rules –00 2,153,760 Tier 2 capital instruments issued to third parties by consolidated subsidiaries 0 (amount allowed in group tier 2) –00 –00 General provisions or general reserves for loan losses - up to maximum of 1.25% of Credit Risk Weighted Assets 2,944,839 2,876,278 Revaluation Reserves (net of taxes) 5,132,211 4,126,413 of which: Revaluation reserves on fixed assets 2,058,682 1,803,884 of which: Unrealised gains / (losses) on AFS 3,073,529 2,322,529 Foreign Exchange Translation Reserves 245,333 249,527 Undisclosed / Other Reserves (if any) –00 –00 T2 before regulatory adjustments 12,316,783 9,405,978 Total regulatory adjustment applied to T2 capital (Note 43.3.4) (548,653 ) (333,562 ) Tier 2 capital (T2) after regulatory adjustments 11,768,130 9,072,416 Tier 2 capital recognised for capital adequacy 11,768,130 9,072,416 Portion of Additional Tier 1 capital recognised in Tier 2 capital –00 –00 Total Tier 2 capital admissible for capital adequacy (d) 11,768,130 9,072,416 TOTAL CAPITAL (T1 + admissible T2) (e=c+d) 46,679,992 39,655,317 Total Risk Weighted Assets (RWA) (Note 43.6) (f) 329,086,630 288,305,026
Capital Ratios and buffers (in percentage of risk weighted assets)
CET1 to total RWA (a/f) 10.62% 10.63% Tier - 1 capital to total RWA (c/f) 10.61% 10.61% Total capital to total RWA (e/f) 14.18% 13.75%
Bank specific buffer requirement (minimum CET1 requirement plus capital conservation buffer plus any other buffer requirement) 6.65% 6.25% of which: capital conservation buffer requirement 0.65% 0.25% of which: countercyclical buffer requirement –00 –00 of which: D-SIB or G - SIB buffer requirement –00 –00 CET1 available to meet buffers (as a percentage of risk weighted assets) 4.62% 4.63%
National minimum capital requirements prescribed by SBP
CET1 minimum ratio 6.00% 6.00% Tier 1 minimum ratio 7.50% 7.50% Total capital minimum ratio 10.65% 10.25%
74
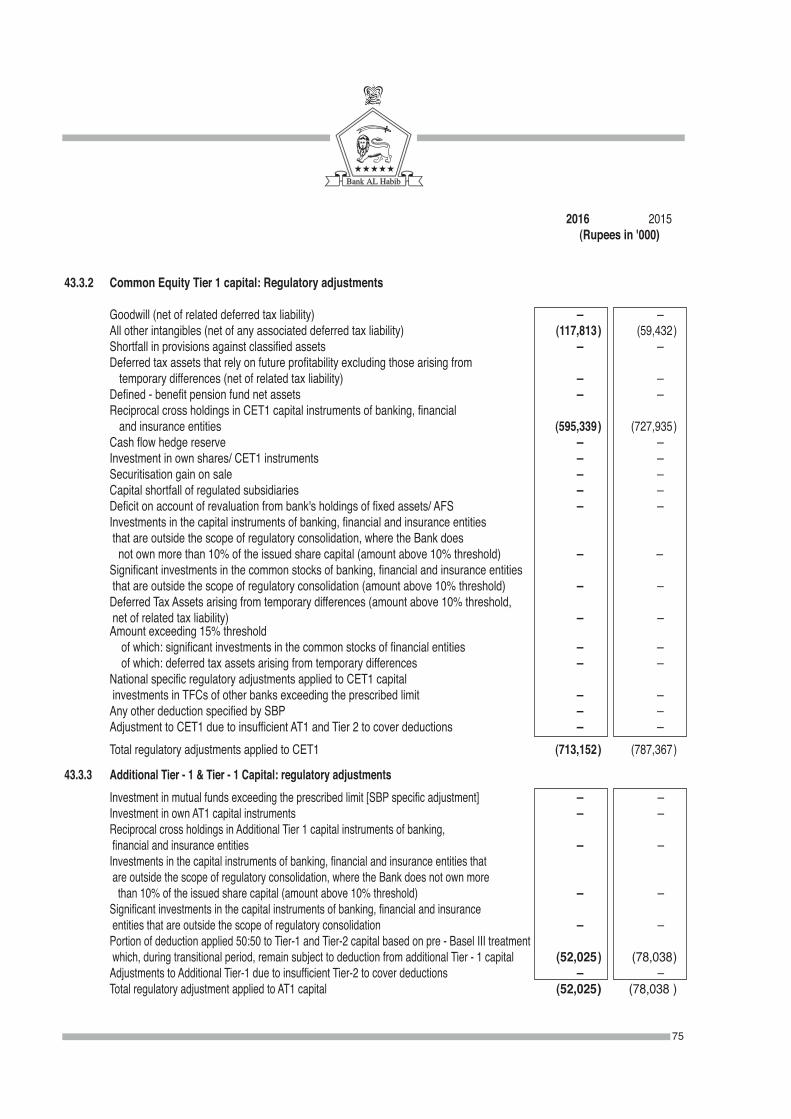
2016 2015 (Rupees in '000)
43.3.2 Common Equity Tier 1 capital: Regulatory adjustments
Goodwill (net of related deferred tax liability) –00 – All other intangibles (net of any associated deferred tax liability) (117,813 ) (59,432 ) Shortfall in provisions against classified assets –00 – Deferred tax assets that rely on future profitability excluding those arising from temporary differences (net of related tax liability) –00 – Defined - benefit pension fund net assets –00 – Reciprocal cross holdings in CET1 capital instruments of banking, financial and insurance entities (595,339 ) (727,935 ) Cash flow hedge reserve –00 – Investment in own shares/ CET1 instruments –00 – Securitisation gain on sale –00 – Capital shortfall of regulated subsidiaries –00 – Deficit on account of revaluation from bank's holdings of fixed assets/ AFS –00 – Investments in the capital instruments of banking, financial and insurance entities that are outside the scope of regulatory consolidation, where the Bank does not own more than 10% of the issued share capital (amount above 10% threshold) –00 –00 Significant investments in the common stocks of banking, financial and insurance entities that are outside the scope of regulatory consolidation (amount above 10% threshold) –00 – Deferred Tax Assets arising from temporary differences (amount above 10% threshold, net of related tax liability) –00 –00 Amount exceeding 15% threshold of which: significant investments in the common stocks of financial entities –00 – of which: deferred tax assets arising from temporary differences –00 – National specific regulatory adjustments applied to CET1 capital investments in TFCs of other banks exceeding the prescribed limit –00 – Any other deduction specified by SBP –00 – Adjustment to CET1 due to insufficient AT1 and Tier 2 to cover deductions –00 – Total regulatory adjustments applied to CET1 (713,152 ) (787,367 )
43.3.3 Additional Tier - 1 & Tier - 1 Capital: regulatory adjustments Investment in mutual funds exceeding the prescribed limit [SBP specific adjustment] –00 –0 Investment in own AT1 capital instruments –00 –0 Reciprocal cross holdings in Additional Tier 1 capital instruments of banking, financial and insurance entities –00 –0 Investments in the capital instruments of banking, financial and insurance entities that are outside the scope of regulatory consolidation, where the Bank does not own more than 10% of the issued share capital (amount above 10% threshold) –00 –0 Significant investments in the capital instruments of banking, financial and insurance entities that are outside the scope of regulatory consolidation –00 –0 Portion of deduction applied 50:50 to Tier-1 and Tier-2 capital based on pre - Basel III treatment which, during transitional period, remain subject to deduction from additional Tier - 1 capital (52,025 ) (78,038 ) Adjustments to Additional Tier-1 due to insufficient Tier-2 to cover deductions –00 –0 Total regulatory adjustment applied to AT1 capital (52,025 ) (78,038 )
75
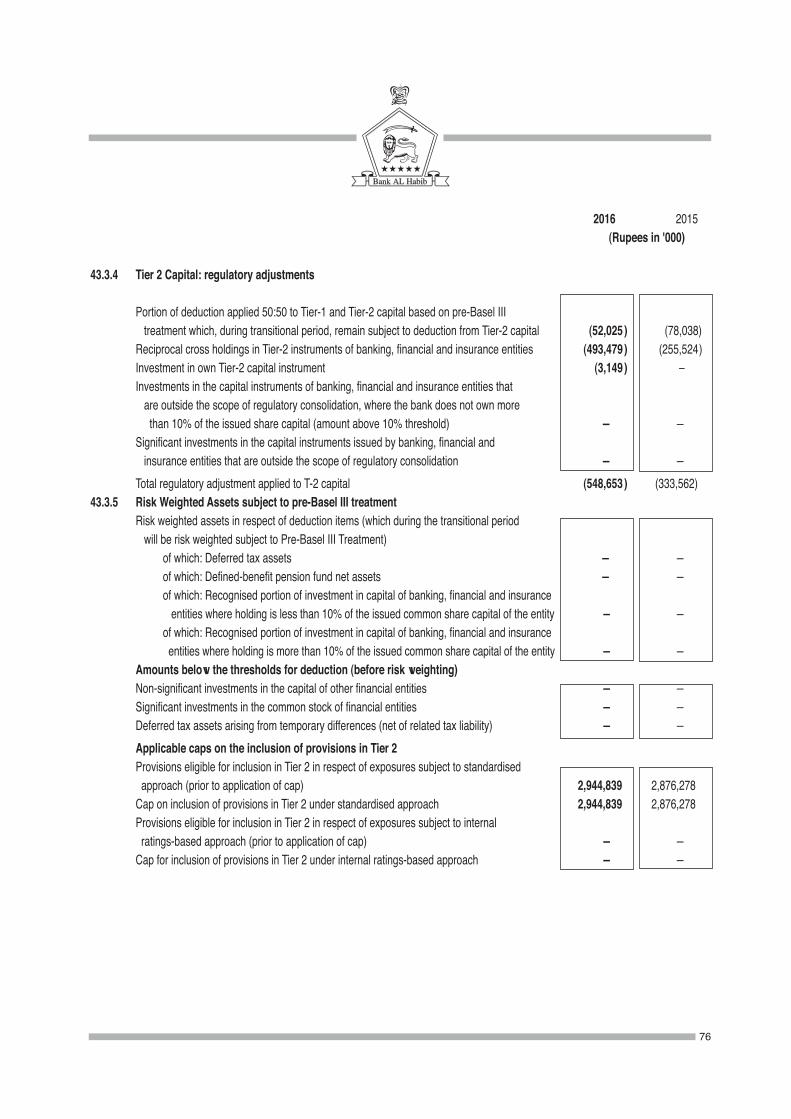
76
2016 2015 (Rupees in '000)
43.3.4 Tier 2 Capital: regulatory adjustments
Portion of deduction applied 50:50 to Tier-1 and Tier-2 capital based on pre-Basel III treatment which, during transitional period, remain subject to deduction from Tier-2 capital (52,025 ) (78,038 ) Reciprocal cross holdings in Tier-2 instruments of banking, financial and insurance entities (493,479 ) (255,524 ) Investment in own Tier-2 capital instrument (3,149 ) –00 Investments in the capital instruments of banking, financial and insurance entities that are outside the scope of regulatory consolidation, where the bank does not own more than 10% of the issued share capital (amount above 10% threshold) –00 –00 Significant investments in the capital instruments issued by banking, financial and insurance entities that are outside the scope of regulatory consolidation –00 –00 Total regulatory adjustment applied to T-2 capital (548,653 ) (333,562 )43.3.5 Risk Weighted Assets subject to pre-Basel III treatment Risk weighted assets in respect of deduction items (which during the transitional period will be risk weighted subject to Pre-Basel III Treatment) of which: Deferred tax assets –00 –00 of which: Defined-benefit pension fund net assets –00 –00 of which: Recognised portion of investment in capital of banking, financial and insurance entities where holding is less than 10% of the issued common share capital of the entity –00 –00 of which: Recognised portion of investment in capital of banking, financial and insurance entities where holding is more than 10% of the issued common share capital of the entity –00 –00 Amounts below the thresholds for deduction (before risk weighting) Non-significant investments in the capital of other financial entities –00 –00 Significant investments in the common stock of financial entities –00 –00 Deferred tax assets arising from temporary differences (net of related tax liability) –00 –00 Applicable caps on the inclusion of provisions in Tier 2 Provisions eligible for inclusion in Tier 2 in respect of exposures subject to standardised approach (prior to application of cap) 2,944,839 2,876,278 Cap on inclusion of provisions in Tier 2 under standardised approach 2,944,839 2,876,278 Provisions eligible for inclusion in Tier 2 in respect of exposures subject to internal ratings-based approach (prior to application of cap) –00 –00 Cap for inclusion of provisions in Tier 2 under internal ratings-based approach –00 –00
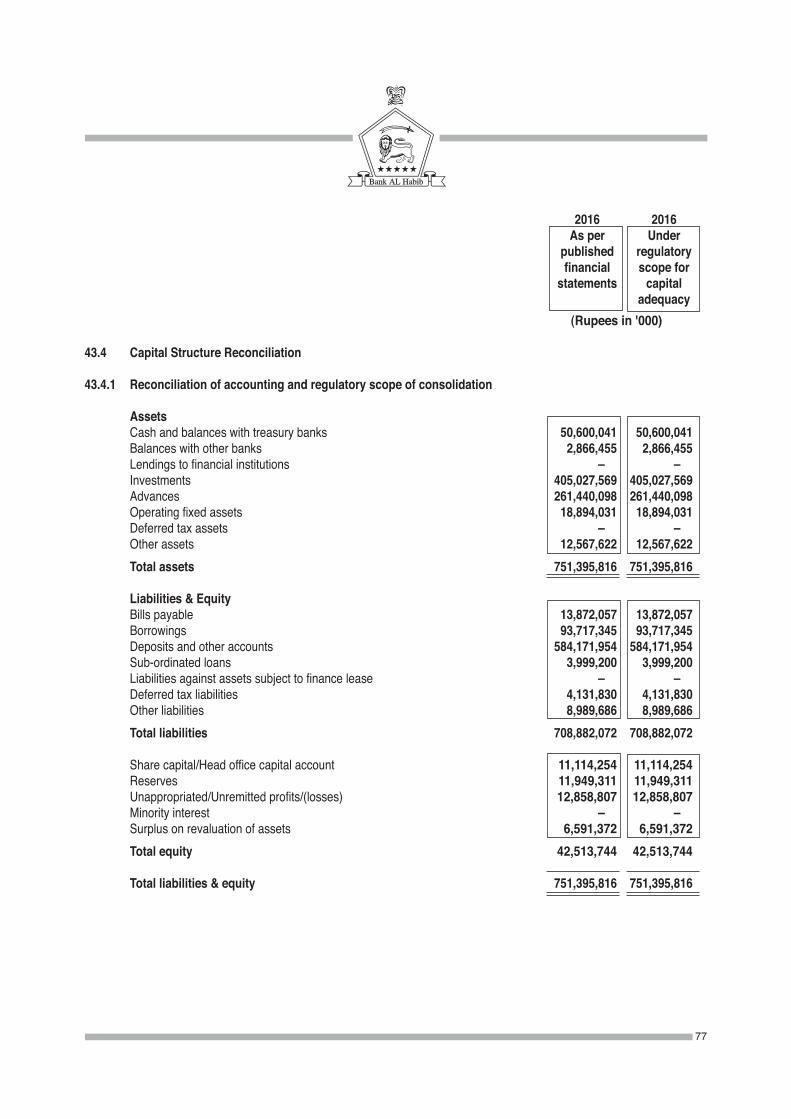
77
2016 2016 As per Under published regulatory financial scope for statements capital adequacy (Rupees in '000)
43.4 Capital Structure Reconciliation 43.4.1 Reconciliation of accounting and regulatory scope of consolidation
Assets Cash and balances with treasury banks 50,600,041 50,600,041 Balances with other banks 2,866,455 2,866,455 Lendings to financial institutions –00 –00 Investments 405,027,569 405,027,569 Advances 261,440,098 261,440,098 Operating fixed assets 18,894,031 18,894,031 Deferred tax assets –00 –00 Other assets 12,567,622 12,567,622 Total assets 751,395,816 751,395,816
Liabilities & Equity Bills payable 13,872,057 13,872,057 Borrowings 93,717,345 93,717,345 Deposits and other accounts 584,171,954 584,171,954 Sub-ordinated loans 3,999,200 3,999,200 Liabilities against assets subject to finance lease –00 –00 Deferred tax liabilities 4,131,830 4,131,830 Other liabilities 8,989,686 8,989,686 Total liabilities 708,882,072 708,882,072
Share capital/Head office capital account 11,114,254 11,114,254 Reserves 11,949,311 11,949,311 Unappropriated/Unremitted profits/(losses) 12,858,807 12,858,807 Minority interest –00 –00 Surplus on revaluation of assets 6,591,372 6,591,372 Total equity 42,513,744 42,513,744
Total liabilities & equity 751,395,816 751,395,816
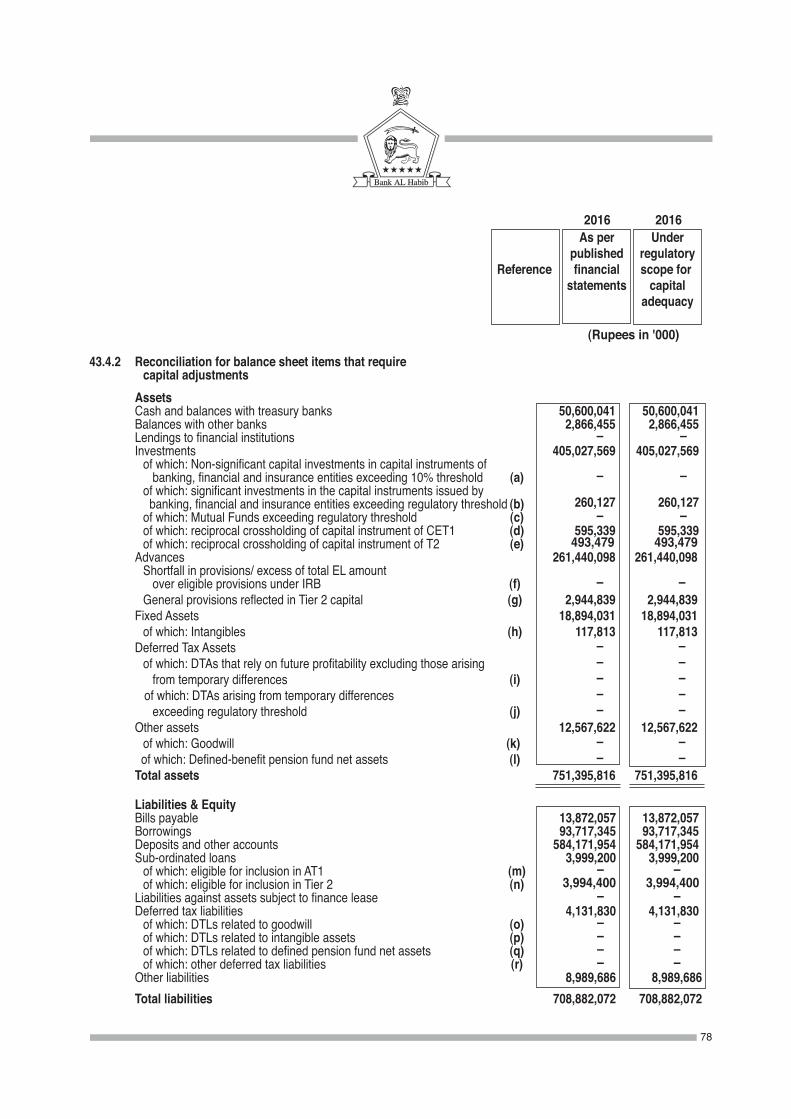
2016 2016 As per Under published regulatory Reference financial scope for statements capital adequacy (Rupees in '000) 43.4.2 Reconciliation for balance sheet items that require capital adjustments Assets Cash and balances with treasury banks 50,600,041 50,600,041 Balances with other banks 2,866,455 2,866,455 Lendings to financial institutions –00 –00 Investments 405,027,569 405,027,569 of which: Non-significant capital investments in capital instruments of banking, financial and insurance entities exceeding 10% threshold (a) –00 –00 of which: significant investments in the capital instruments issued by banking, financial and insurance entities exceeding regulatory threshold (b) 260,127 260,127 of which: Mutual Funds exceeding regulatory threshold (c) –00 –00 of which: reciprocal crossholding of capital instrument of CET1 (d) 595,339 595,339 of which: reciprocal crossholding of capital instrument of T2 (e) 493,479 493,479 Advances 261,440,098 261,440,098 Shortfall in provisions/ excess of total EL amount over eligible provisions under IRB (f) –00 –00 General provisions reflected in Tier 2 capital (g) 2,944,839 2,944,839 Fixed Assets 18,894,031 18,894,031 of which: Intangibles (h) 117,813 117,813 Deferred Tax Assets –00 –00 of which: DTAs that rely on future profitability excluding those arising –00 –00 from temporary differences (i) –00 –00 of which: DTAs arising from temporary differences –00 –00 exceeding regulatory threshold (j) –00 –00 Other assets 12,567,622 12,567,622 of which: Goodwill (k) –00 –00 of which: Defined-benefit pension fund net assets (l) –00 –00 Total assets 751,395,816 751,395,816
Liabilities & Equity Bills payable 13,872,057 13,872,057 Borrowings 93,717,345 93,717,345 Deposits and other accounts 584,171,954 584,171,954 Sub-ordinated loans 3,999,200 3,999,200 of which: eligible for inclusion in AT1 (m) –00 –00 of which: eligible for inclusion in Tier 2 (n) 3,994,400 3,994,400 Liabilities against assets subject to finance lease –00 –00 Deferred tax liabilities 4,131,830 4,131,830 of which: DTLs related to goodwill (o) –00 –00 of which: DTLs related to intangible assets (p) –00 –00 of which: DTLs related to defined pension fund net assets (q) –00 –00 of which: other deferred tax liabilities (r) –00 –00 Other liabilities 8,989,686 8,989,686 Total liabilities 708,882,072 708,882,072
78
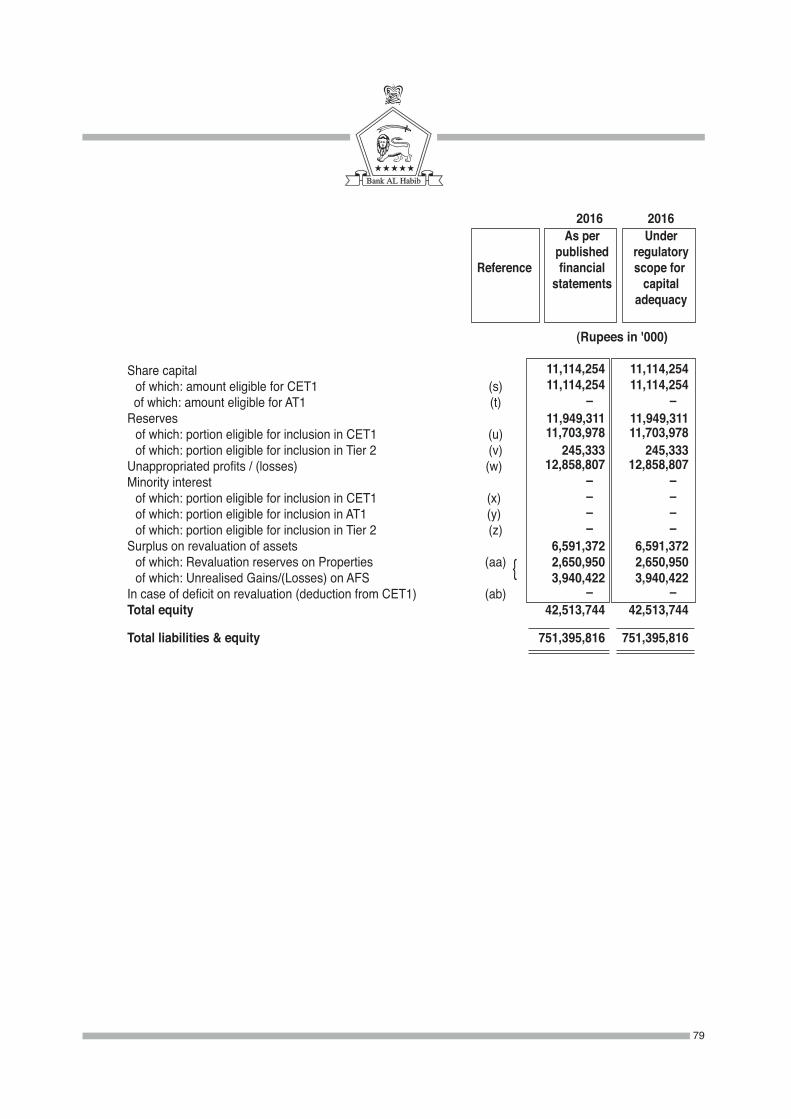
2016 2016 As per Under published regulatory Reference financial scope for statements capital adequacy (Rupees in '000)
Share capital 11,114,254 11,114,254 of which: amount eligible for CET1 (s) 11,114,254 11,114,254 of which: amount eligible for AT1 (t) –00 –00 Reserves 11,949,311 11,949,311 of which: portion eligible for inclusion in CET1 (u) 11,703,978 11,703,978 of which: portion eligible for inclusion in Tier 2 (v) 245,333 245,333 Unappropriated profits / (losses) (w) 12,858,807 12,858,807 Minority interest –00 –00 of which: portion eligible for inclusion in CET1 (x) –00 –00 of which: portion eligible for inclusion in AT1 (y) –00 –00 of which: portion eligible for inclusion in Tier 2 (z) –00 –00 Surplus on revaluation of assets 6,591,372 6,591,372 of which: Revaluation reserves on Properties (aa) 2,650,950 2,650,950 of which: Unrealised Gains/(Losses) on AFS 3,940,422 3,940,422 In case of deficit on revaluation (deduction from CET1) (ab) –00 –00 Total equity 42,513,744 42,513,744
Total liabilities & equity 751,395,816 751,395,816
79

80
43.4.3 Reconciliation of computation of capital with balance sheet of the Bank 2016 Source based on Component of reference number regulatory capital from Note 43.4.2 reported by Bank (Rupees in ‘000)Common Equity Tier 1 capital (CET1): Instruments and reserves Fully Paid-up Capital / Capital deposited with SBP 11,114,254Balance in Share Premium Account (s) –00 Reserve for issue of Bonus Shares –00 General / Statutory Reserves (u) 11,703,978Gains / (losses) on derivatives held as Cash Flow Hedge –00 Unappropriated/unremitted profits / (losses) (w) 12,858,807Minority interests arising from CET1 capital instruments issued to third party by consolidated bank subsidiaries (amount allowed in CET1 capital of the consolidation group) (x) –00 CET 1 before Regulatory Adjustments 35,677,039
Common Equity Tier 1 capital: Regulatory adjustmentsGoodwill (net of related deferred tax liability) (k)-(o) –00 All other intangibles (net of any associated deferred tax liability) (h)-(p) (117,813)Shortfall of provisions against classified assets (f) –00 Deferred tax assets that rely on future profitability excluding those –00 arising from temporary differences (net of related tax liability) (i-r) * x % –00 Defined-benefit pension fund net assets (l-q) * x % –00 Reciprocal cross holdings in CET1 capital instruments (d) (595,339 )Cash flow hedge reserve –00 Investment in own shares/ CET1 instruments –00 Securitisation gain on sale –00 Capital shortfall of regulated subsidiaries –00 Deficit on account of revaluation from bank's holdings of properties/ AFS (ab) –00 Investments in the capital instruments of banking, financial and insurance entities that are outside the scope of regulatory consolidation, where the Bank does not own more than 10% of the issued share capital (amount above 10% threshold) (a) - (ac) - (ae) –00Significant investments in the capital instruments issued by banking, financial and insurance entities that are outside the scope of regulatory consolidation (amount above 10% threshold) (b) - (ad) - (af) –00 Deferred Tax Assets arising from temporary differences (amount above 10% threshold, net of related tax liability) (i) –00 Amount exceeding 15% threshold –00 of which: significant investments in the common stocks –00 of financial entities of which: deferred tax assets arising from temporary differences –00 National specific regulatory adjustments applied to CET1 capital –00 of which: Investment in TFCs of other banks exceeding the prescribed limit –00 of which: Any other deduction specified by SBP Regulatory adjustment applied to CET1 due to insufficient AT1 and Tier 2 to cover deductions –00 Total regulatory adjustments applied to CET1 (713,152 )Common Equity Tier 1 34,963,887
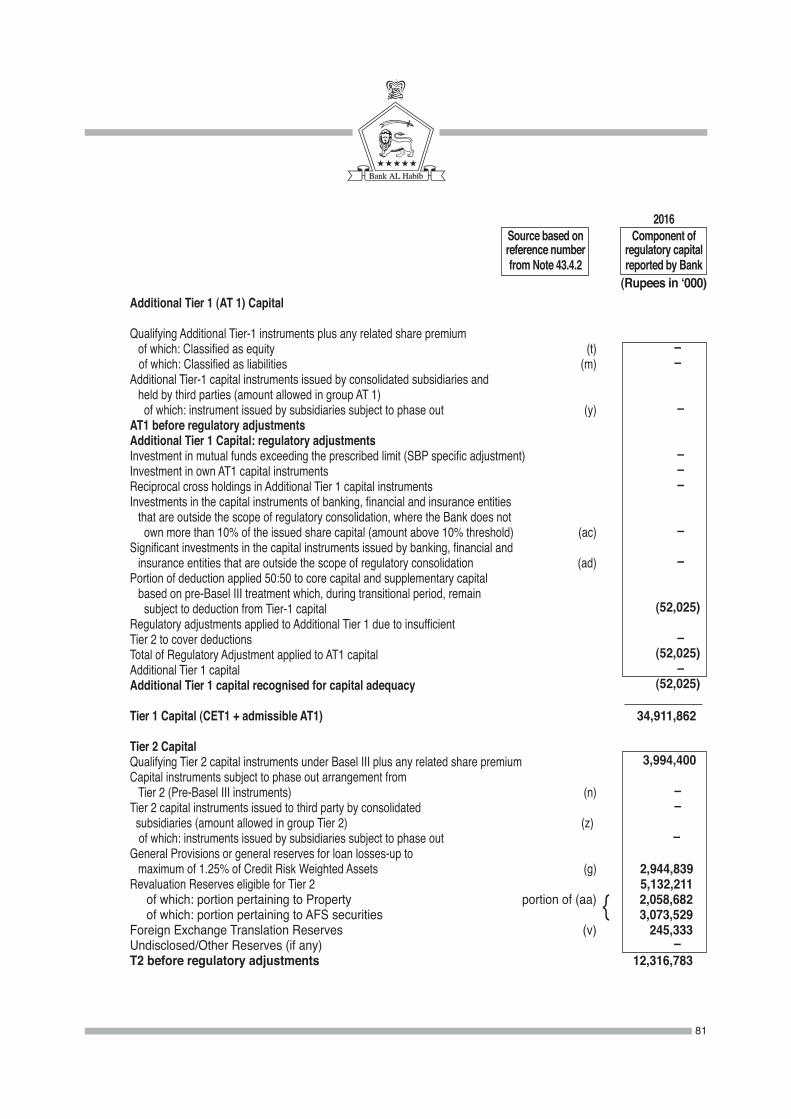
81
2016 Source based on Component of reference number regulatory capital from Note 43.4.2 reported by Bank (Rupees in ‘000) Additional Tier 1 (AT 1) Capital Qualifying Additional Tier-1 instruments plus any related share premium of which: Classified as equity (t) –00 of which: Classified as liabilities (m) –00 Additional Tier-1 capital instruments issued by consolidated subsidiaries and held by third parties (amount allowed in group AT 1) of which: instrument issued by subsidiaries subject to phase out (y) –00 AT1 before regulatory adjustments Additional Tier 1 Capital: regulatory adjustments Investment in mutual funds exceeding the prescribed limit (SBP specific adjustment) –00 Investment in own AT1 capital instruments –00 Reciprocal cross holdings in Additional Tier 1 capital instruments –00 Investments in the capital instruments of banking, financial and insurance entities that are outside the scope of regulatory consolidation, where the Bank does not own more than 10% of the issued share capital (amount above 10% threshold) (ac) –00 Significant investments in the capital instruments issued by banking, financial and insurance entities that are outside the scope of regulatory consolidation (ad) –00 Portion of deduction applied 50:50 to core capital and supplementary capital based on pre-Basel III treatment which, during transitional period, remain subject to deduction from Tier-1 capital (52,025 ) Regulatory adjustments applied to Additional Tier 1 due to insufficient Tier 2 to cover deductions –00 Total of Regulatory Adjustment applied to AT1 capital (52,025 ) Additional Tier 1 capital –00 Additional Tier 1 capital recognised for capital adequacy (52,025 )
Tier 1 Capital (CET1 + admissible AT1) 34,911,862 Tier 2 Capital Qualifying Tier 2 capital instruments under Basel III plus any related share premium 3,994,400 Capital instruments subject to phase out arrangement from Tier 2 (Pre-Basel III instruments) (n) –00 Tier 2 capital instruments issued to third party by consolidated –00 subsidiaries (amount allowed in group Tier 2) (z) of which: instruments issued by subsidiaries subject to phase out –00 General Provisions or general reserves for loan losses-up to maximum of 1.25% of Credit Risk Weighted Assets (g) 2,944,839 Revaluation Reserves eligible for Tier 2 5,132,211 of which: portion pertaining to Property portion of (aa) 2,058,682 of which: portion pertaining to AFS securities 3,073,529 Foreign Exchange Translation Reserves (v) 245,333 Undisclosed/Other Reserves (if any) –00 T2 before regulatory adjustments 12,316,783
{

82
2016 Source based on Component of reference number regulatory capital from Note 43.4.2 reported by Bank (Rupees in ‘000)
Tier 2 Capital: regulatory adjustmentsPortion of deduction applied 50:50 to core capital and supplementary capital based on pre-Basel III treatment which, during transitional period, remain subject to deduction (52,025 )Reciprocal cross holdings in Tier 2 instruments (493,479 ) Investment in own Tier 2 capital instrument (3,149 )Investments in the capital instruments of banking, financial and insurance entities that are outside the scope of regulatory consolidation, where the Bank does not own more than 10% of the issued share capital (amount above 10% threshold) (ae) –00Significant investments in the capital instruments issued by banking, financial and insurance entities that are outside the scope of regulatory consolidation (af) –00Amount of Regulatory Adjustment applied to T2 capital (548,653)Tier 2 capital (T2) 11,768,130 Tier 2 capital recognised for capital adequacy 11,768,130 Excess Additional Tier 1 capital recognised in Tier 2 capital –00 Total Tier 2 capital admissible for capital adequacy 11,768,130 TOTAL CAPITAL (T1 + admissible T2) 46,679,992
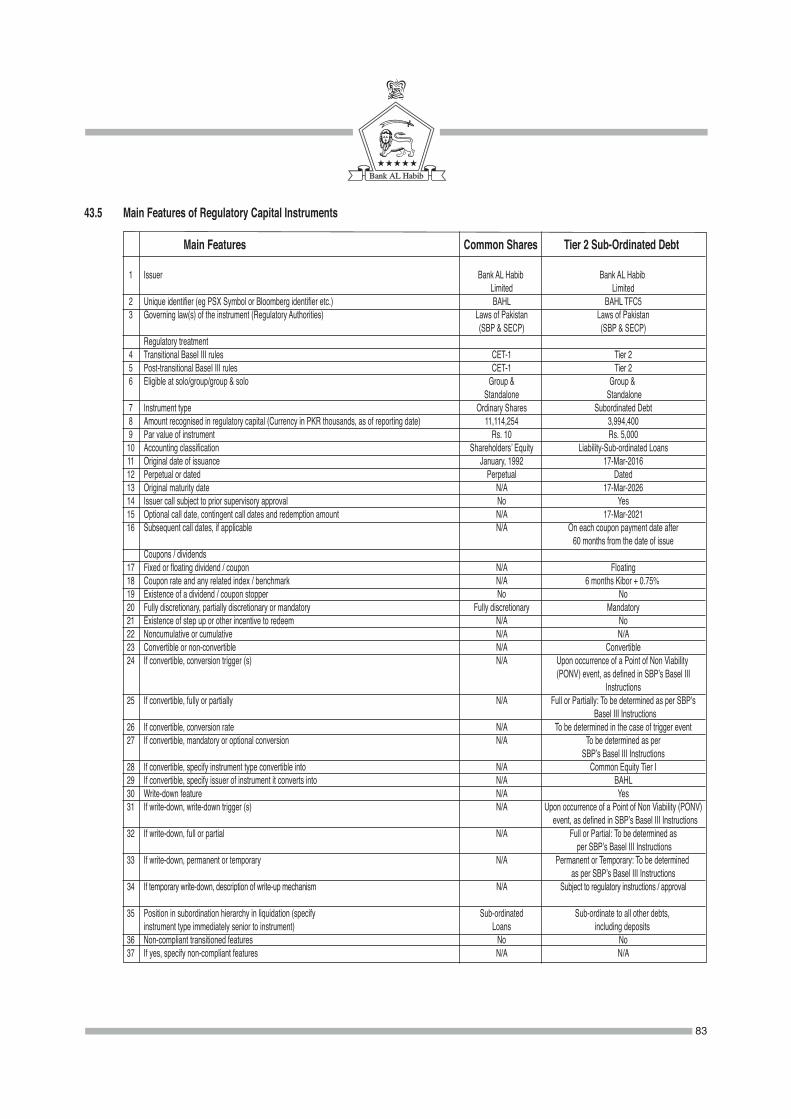
43.5 Main Features of Regulatory Capital Instruments
Main Features Common Shares Tier 2 Sub-Ordinated Debt
1 Issuer Bank AL Habib Bank AL Habib Limited Limited 2 Unique identifier (eg PSX Symbol or Bloomberg identifier etc.) BAHL BAHL TFC5 3 Governing law(s) of the instrument (Regulatory Authorities) Laws of Pakistan Laws of Pakistan (SBP & SECP) (SBP & SECP) Regulatory treatment 4 Transitional BaseI III rules CET-1 Tier 2 5 Post-transitional BaseI III rules CET-1 Tier 2 6 Eligible at solo/group/group & solo Group & Group & Standalone Standalone 7 Instrument type Ordinary Shares Subordinated Debt 8 Amount recognised in regulatory capital (Currency in PKR thousands, as of reporting date) 11,114,254 3,994,400 9 Par value of instrument Rs. 10 Rs. 5,000 10 Accounting classification Shareholders’ Equity Liability-Sub-ordinated Loans 11 Original date of issuance January, 1992 17-Mar-2016 12 Perpetual or dated Perpetual Dated 13 Original maturity date N/A 17-Mar-2026 14 Issuer call subject to prior supervisory approval No Yes 15 Optional call date, contingent call dates and redemption amount N/A 17-Mar-2021 16 Subsequent call dates, if applicable N/A On each coupon payment date after 60 months from the date of issue Coupons / dividends 17 Fixed or floating dividend / coupon N/A Floating 18 Coupon rate and any related index / benchmark N/A 6 months Kibor + 0.75% 19 Existence of a dividend / coupon stopper No No 20 Fully discretionary, partially discretionary or mandatory Fully discretionary Mandatory 21 Existence of step up or other incentive to redeem N/A No 22 Noncumulative or cumulative N/A N/A 23 Convertible or non-convertible N/A Convertible 24 If convertible, conversion trigger (s) N/A Upon occurrence of a Point of Non Viability (PONV) event, as defined in SBP’s Basel III Instructions 25 If convertible, fully or partially N/A Full or Partially: To be determined as per SBP’s Basel III Instructions 26 If convertible, conversion rate N/A To be determined in the case of trigger event 27 If convertible, mandatory or optional conversion N/A To be determined as per SBP’s Basel III Instructions 28 If convertible, specify instrument type convertible into N/A Common Equity Tier I 29 If convertible, specify issuer of instrument it converts into N/A BAHL 30 Write-down feature N/A Yes 31 If write-down, write-down trigger (s) N/A Upon occurrence of a Point of Non Viability (PONV) event, as defined in SBP’s Basel III Instructions 32 If write-down, full or partial N/A Full or Partial: To be determined as per SBP’s Basel III Instructions 33 If write-down, permanent or temporary N/A Permanent or Temporary: To be determined as per SBP’s Basel III Instructions 34 If temporary write-down, description of write-up mechanism N/A Subject to regulatory instructions / approval 35 Position in subordination hierarchy in liquidation (specify Sub-ordinated Sub-ordinate to all other debts, instrument type immediately senior to instrument) Loans including deposits 36 Non-compliant transitioned features No No 37 If yes, specify non-compliant features N/A N/A
83
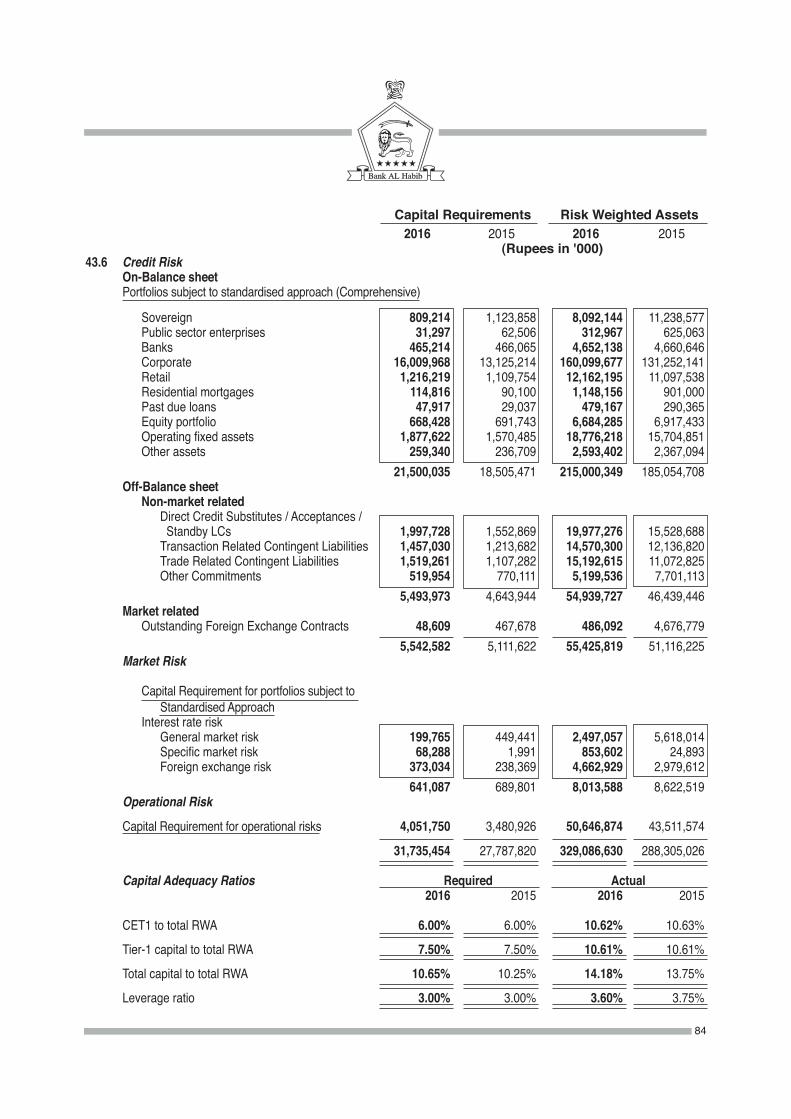
Capital Requirements Risk Weighted Assets 2016 2015 2016 2015 (Rupees in '000)
43.6 Credit Risk On-Balance sheet Portfolios subject to standardised approach (Comprehensive)
Sovereign 809,214 1,123,858 8,092,144 11,238,577 Public sector enterprises 31,297 62,506 312,967 625,063 Banks 465,214 466,065 4,652,138 4,660,646 Corporate 16,009,968 13,125,214 160,099,677 131,252,141 Retail 1,216,219 1,109,754 12,162,195 11,097,538 Residential mortgages 114,816 90,100 1,148,156 901,000 Past due loans 47,917 29,037 479,167 290,365 Equity portfolio 668,428 691,743 6,684,285 6,917,433 Operating fixed assets 1,877,622 1,570,485 18,776,218 15,704,851 Other assets 259,340 236,709 2,593,402 2,367,094 21,500,035 18,505,471 215,000,349 185,054,708 Off-Balance sheet Non-market related Direct Credit Substitutes / Acceptances / Standby LCs 1,997,728 1,552,869 19,977,276 15,528,688 Transaction Related Contingent Liabilities 1,457,030 1,213,682 14,570,300 12,136,820 Trade Related Contingent Liabilities 1,519,261 1,107,282 15,192,615 11,072,825 Other Commitments 519,954 770,111 5,199,536 7,701,113 5,493,973 4,643,944 54,939,727 46,439,446 Market related Outstanding Foreign Exchange Contracts 48,609 467,678 486,092 4,676,779 5,542,582 5,111,622 55,425,819 51,116,225 Market Risk
Capital Requirement for portfolios subject to Standardised Approach Interest rate risk General market risk 199,765 449,441 2,497,057 5,618,014 Specific market risk 68,288 1,991 853,602 24,893 Foreign exchange risk 373,034 238,369 4,662,929 2,979,612 641,087 689,801 8,013,588 8,622,519 Operational Risk
Capital Requirement for operational risks 4,051,750 3,480,926 50,646,874 43,511,574
31,735,454 27,787,820 329,086,630 288,305,026
Capital Adequacy Ratios Required Actual 2016 2015 2016 2015
CET1 to total RWA 6.00% 6.00% 10.62% 10.63%
Tier-1 capital to total RWA 7.50% 7.50% 10.61% 10.61%
Total capital to total RWA 10.65% 10.25% 14.18% 13.75%
Leverage ratio 3.00% 3.00% 3.60% 3.75%
84
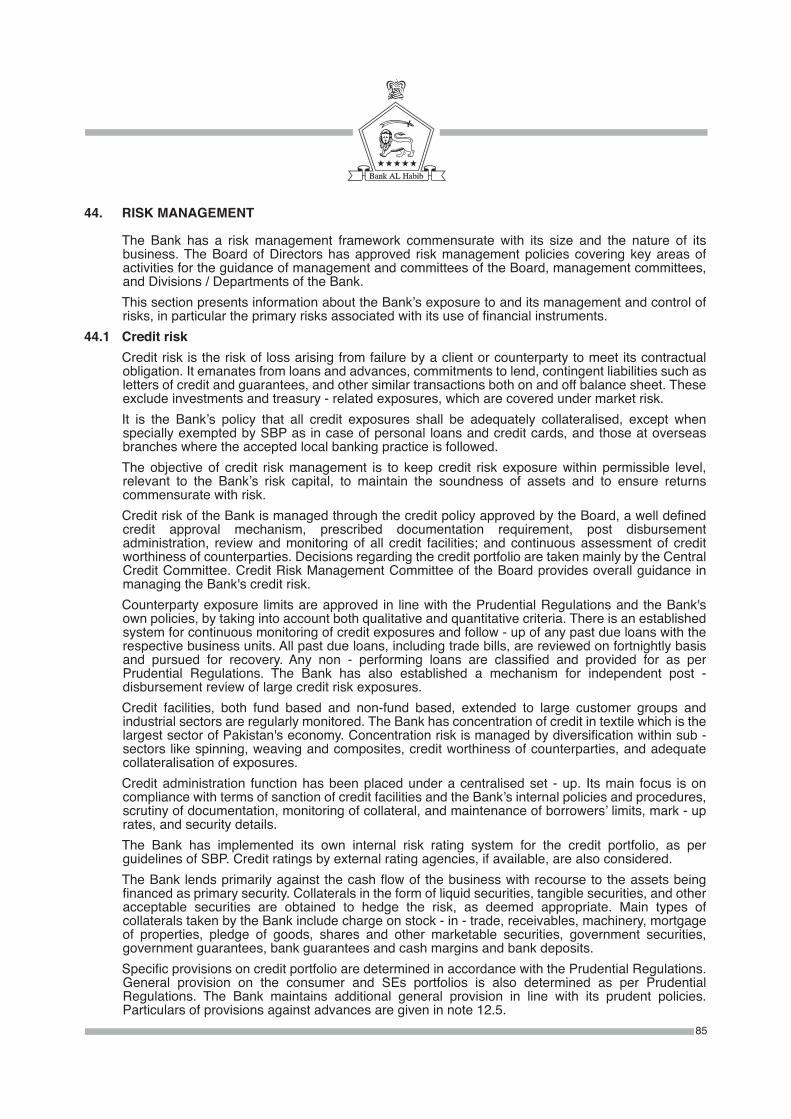
44. RISK MANAGEMENT
The Bank has a risk management framework commensurate with its size and the nature of its business. The Board of Directors has approved risk management policies covering key areas of activities for the guidance of management and committees of the Board, management committees, and Divisions / Departments of the Bank.
This section presents information about the Bank’s exposure to and its management and control of risks, in particular the primary risks associated with its use of financial instruments.
44.1 Credit risk Credit risk is the risk of loss arising from failure by a client or counterparty to meet its contractual
obligation. It emanates from loans and advances, commitments to lend, contingent liabilities such as letters of credit and guarantees, and other similar transactions both on and off balance sheet. These exclude investments and treasury - related exposures, which are covered under market risk.
It is the Bank’s policy that all credit exposures shall be adequately collateralised, except when specially exempted by SBP as in case of personal loans and credit cards, and those at overseas branches where the accepted local banking practice is followed.
The objective of credit risk management is to keep credit risk exposure within permissible level, relevant to the Bank’s risk capital, to maintain the soundness of assets and to ensure returns commensurate with risk.
Credit risk of the Bank is managed through the credit policy approved by the Board, a well defined credit approval mechanism, prescribed documentation requirement, post disbursement administration, review and monitoring of all credit facilities; and continuous assessment of credit worthiness of counterparties. Decisions regarding the credit portfolio are taken mainly by the Central Credit Committee. Credit Risk Management Committee of the Board provides overall guidance in managing the Bank's credit risk.
Counterparty exposure limits are approved in line with the Prudential Regulations and the Bank's own policies, by taking into account both qualitative and quantitative criteria. There is an established system for continuous monitoring of credit exposures and follow - up of any past due loans with the respective business units. All past due loans, including trade bills, are reviewed on fortnightly basis and pursued for recovery. Any non - performing loans are classified and provided for as per Prudential Regulations. The Bank has also established a mechanism for independent post - disbursement review of large credit risk exposures.
Credit facilities, both fund based and non-fund based, extended to large customer groups and industrial sectors are regularly monitored. The Bank has concentration of credit in textile which is the largest sector of Pakistan's economy. Concentration risk is managed by diversification within sub - sectors like spinning, weaving and composites, credit worthiness of counterparties, and adequate collateralisation of exposures.
Credit administration function has been placed under a centralised set - up. Its main focus is on compliance with terms of sanction of credit facilities and the Bank’s internal policies and procedures, scrutiny of documentation, monitoring of collateral, and maintenance of borrowers’ limits, mark - up rates, and security details.
The Bank has implemented its own internal risk rating system for the credit portfolio, as per guidelines of SBP. Credit ratings by external rating agencies, if available, are also considered.
The Bank lends primarily against the cash flow of the business with recourse to the assets being financed as primary security. Collaterals in the form of liquid securities, tangible securities, and other acceptable securities are obtained to hedge the risk, as deemed appropriate. Main types of collaterals taken by the Bank include charge on stock - in - trade, receivables, machinery, mortgage of properties, pledge of goods, shares and other marketable securities, government securities, government guarantees, bank guarantees and cash margins and bank deposits.
Specific provisions on credit portfolio are determined in accordance with the Prudential Regulations. General provision on the consumer and SEs portfolios is also determined as per Prudential Regulations. The Bank maintains additional general provision in line with its prudent policies. Particulars of provisions against advances are given in note 12.5.
85
The Bank uses the Standardised Approach to calculate capital charge for credit risk as per Basel regulatory framework, with comprehensive approach for credit risk mitigation.
Stress testing for credit risk is carried out regularly to estimate the impact of increase in non - performing loans and downward shift in these categories.
44.1.1 Credit risk: Disclosures on portfolio subject to Standardised Approach - Basel Specific The Bank uses the ratings issued by The Pakistan Credit Rating Agency Limited (PACRA) and
JCR-VIS Credit Rating Company Limited (JCR - VIS) for its local currency exposures and ratings issued by Moody’s, S&P, and Fitch for its foreign currency exposures. These External Credit Assess-ments Institutions (ECAIs) have been approved by SBP.
For foreign currency claims on sovereigns, the Bank also uses risk scores of Export Credit Agencies (ECAs).
Moody’s, JCR-VIS PACRA S&P, and Fitch ECA Score (local (local (foreign (foreign currency) currency) currency) currency) Types of exposures Corporates ✓ ✓ – – Banks ✓ ✓ ✓ – Sovereigns – – ✓ ✓ Small and Medium Enterprises – – – – Securitisations – – – – Others (public sector enterprises) ✓ ✓ – –
The Bank has not transferred public issue ratings onto comparable assets in the banking book in its calculations. ECAI ratings and ECA scores are aligned with risk buckets as determined by SBP. Credit exposures subject to Standardised Approach
Amount Credit Risk outstanding/ Mitigation credit equivalent (CRM) Risk buckets (rated and unrated) deduction Net amount (Rupees in '000) 0% 481,512,047 30,247,764 451,264,283 20% 41,495,773 8,312,117 33,183,656 35% 3,280,445 –00 3,280,445 50% 46,983,823 29,739,703 17,244,120 75% 22,494,064 3,608,062 18,886,002 100% 182,487,927 12,920,506 169,567,421 125% 58,458,082 2,667,933 55,790,149 150% 107,145 866 106,279250% 156,076 –00 156,076 836,975,382 87,496,951 749,478,431
44.1.2 Credit risk: Disclosures on CRM for Standardised Approach – Basel Specific
Eligible collaterals used by the Bank for credit risk mitigation are cash margins and cash deposits, government securities, financial guarantees, listed shares, and other listed, quoted or rated securities. The Bank requires perfection of collaterals by marking lien on cash margins and deposits, pledging of shares and other securities and verifying the authenticity of guarantees received. Shares and securities including marketable government securities are taken at market value and other government securities are taken at encashment value. Appropriate hair - cuts are applied as per Basel regulatory framework. Among the mitigants used by the Bank, there is concentration in cash margins, cash deposits, and sovereign guarantees.
86
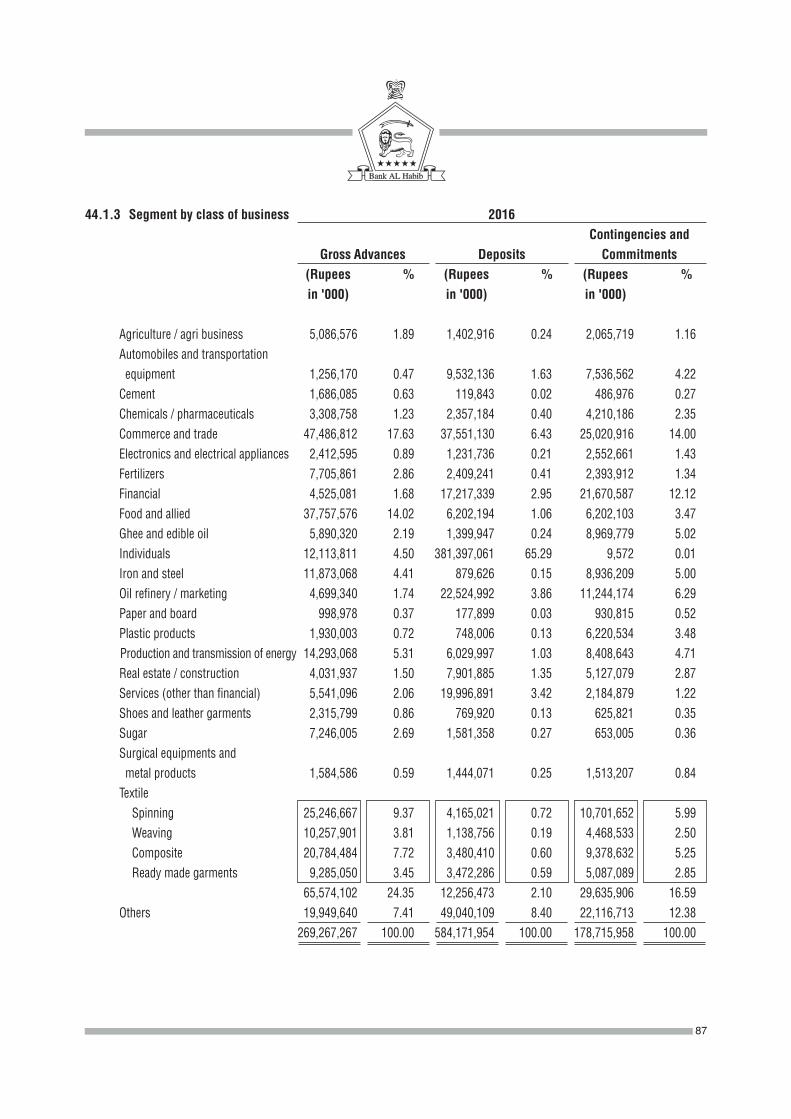
44.1.3 Segment by class of business 2016
Contingencies and
Gross Advances Deposits Commitments
(Rupees % (Rupees % (Rupees %
in '000) in '000) in '000)
Agriculture / agri business 5,086,576 1.89 1,402,916 0.24 2,065,719 1.16 Automobiles and transportation equipment 1,256,170 0.47 9,532,136 1.63 7,536,562 4.22 Cement 1,686,085 0.63 119,843 0.02 486,976 0.27 Chemicals / pharmaceuticals 3,308,758 1.23 2,357,184 0.40 4,210,186 2.35 Commerce and trade 47,486,812 17.63 37,551,130 6.43 25,020,916 14.00 Electronics and electrical appliances 2,412,595 0.89 1,231,736 0.21 2,552,661 1.43 Fertilizers 7,705,861 2.86 2,409,241 0.41 2,393,912 1.34 Financial 4,525,081 1.68 17,217,339 2.95 21,670,587 12.12 Food and allied 37,757,576 14.02 6,202,194 1.06 6,202,103 3.47
Ghee and edible oil 5,890,320 2.19 1,399,947 0.24 8,969,779 5.02 Individuals 12,113,811 4.50 381,397,061 65.29 9,572 0.01 Iron and steel 11,873,068 4.41 879,626 0.15 8,936,209 5.00 Oil refinery / marketing 4,699,340 1.74 22,524,992 3.86 11,244,174 6.29 Paper and board 998,978 0.37 177,899 0.03 930,815 0.52 Plastic products 1,930,003 0.72 748,006 0.13 6,220,534 3.48
Production and transmission of energy 14,293,068 5.31 6,029,997 1.03 8,408,643 4.71 Real estate / construction 4,031,937 1.50 7,901,885 1.35 5,127,079 2.87 Services (other than financial) 5,541,096 2.06 19,996,891 3.42 2,184,879 1.22 Shoes and leather garments 2,315,799 0.86 769,920 0.13 625,821 0.35 Sugar 7,246,005 2.69 1,581,358 0.27 653,005 0.36 Surgical equipments and metal products 1,584,586 0.59 1,444,071 0.25 1,513,207 0.84 Textile Spinning 25,246,667 9.37 4,165,021 0.72 10,701,652 5.99
Weaving 10,257,901 3.81 1,138,756 0.19 4,468,533 2.50 Composite 20,784,484 7.72 3,480,410 0.60 9,378,632 5.25 Ready made garments 9,285,050 3.45 3,472,286 0.59 5,087,089 2.85 65,574,102 24.35 12,256,473 2.10 29,635,906 16.59 Others 19,949,640 7.41 49,040,109 8.40 22,116,713 12.38 269,267,267 100.00 584,171,954 100.00 178,715,958 100.00
87
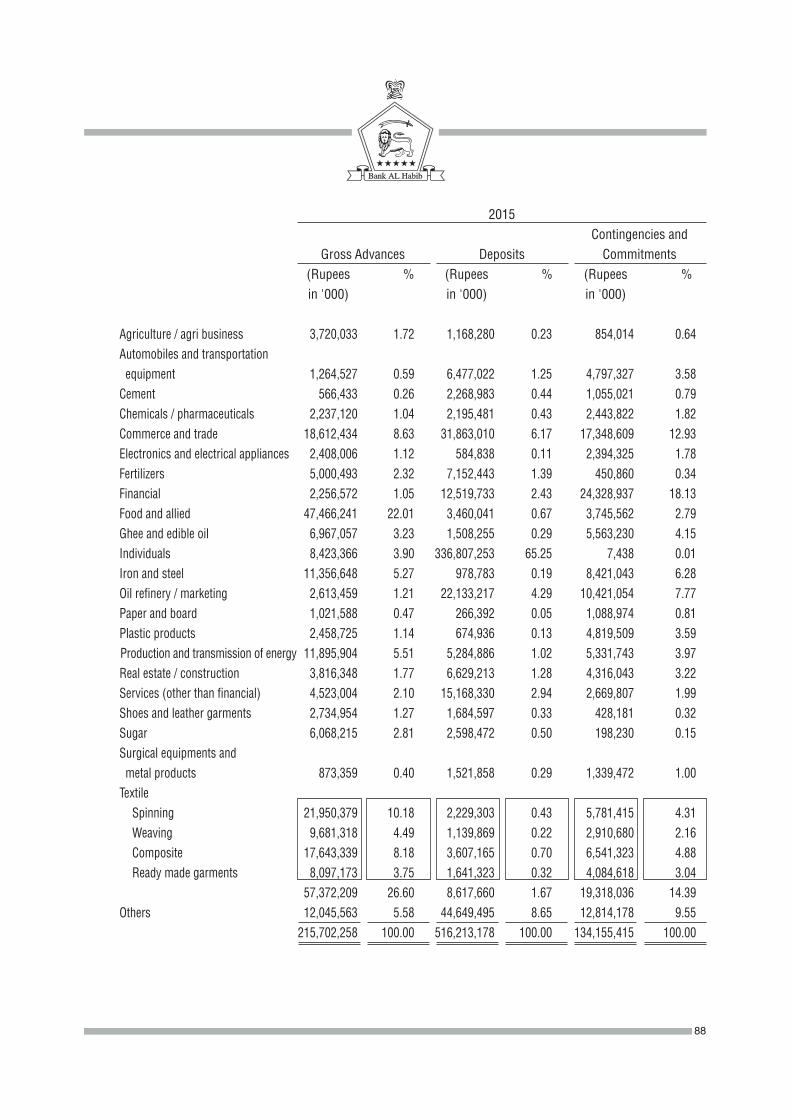
2015 Contingencies and Gross Advances Deposits Commitments
(Rupees % (Rupees % (Rupees % in '000) in '000) in '000)
Agriculture / agri business 3,720,033 1.72 1,168,280 0.23 854,014 0.64 Automobiles and transportation equipment 1,264,527 0.59 6,477,022 1.25 4,797,327 3.58 Cement 566,433 0.26 2,268,983 0.44 1,055,021 0.79 Chemicals / pharmaceuticals 2,237,120 1.04 2,195,481 0.43 2,443,822 1.82 Commerce and trade 18,612,434 8.63 31,863,010 6.17 17,348,609 12.93 Electronics and electrical appliances 2,408,006 1.12 584,838 0.11 2,394,325 1.78 Fertilizers 5,000,493 2.32 7,152,443 1.39 450,860 0.34 Financial 2,256,572 1.05 12,519,733 2.43 24,328,937 18.13 Food and allied 47,466,241 22.01 3,460,041 0.67 3,745,562 2.79
Ghee and edible oil 6,967,057 3.23 1,508,255 0.29 5,563,230 4.15 Individuals 8,423,366 3.90 336,807,253 65.25 7,438 0.01 Iron and steel 11,356,648 5.27 978,783 0.19 8,421,043 6.28 Oil refinery / marketing 2,613,459 1.21 22,133,217 4.29 10,421,054 7.77 Paper and board 1,021,588 0.47 266,392 0.05 1,088,974 0.81 Plastic products 2,458,725 1.14 674,936 0.13 4,819,509 3.59
Production and transmission of energy 11,895,904 5.51 5,284,886 1.02 5,331,743 3.97 Real estate / construction 3,816,348 1.77 6,629,213 1.28 4,316,043 3.22 Services (other than financial) 4,523,004 2.10 15,168,330 2.94 2,669,807 1.99 Shoes and leather garments 2,734,954 1.27 1,684,597 0.33 428,181 0.32 Sugar 6,068,215 2.81 2,598,472 0.50 198,230 0.15 Surgical equipments and metal products 873,359 0.40 1,521,858 0.29 1,339,472 1.00 Textile Spinning 21,950,379 10.18 2,229,303 0.43 5,781,415 4.31
Weaving 9,681,318 4.49 1,139,869 0.22 2,910,680 2.16 Composite 17,643,339 8.18 3,607,165 0.70 6,541,323 4.88 Ready made garments 8,097,173 3.75 1,641,323 0.32 4,084,618 3.04 57,372,209 26.60 8,617,660 1.67 19,318,036 14.39 Others 12,045,563 5.58 44,649,495 8.65 12,814,178 9.55 215,702,258 100.00 516,213,178 100.00 134,155,415 100.00
88
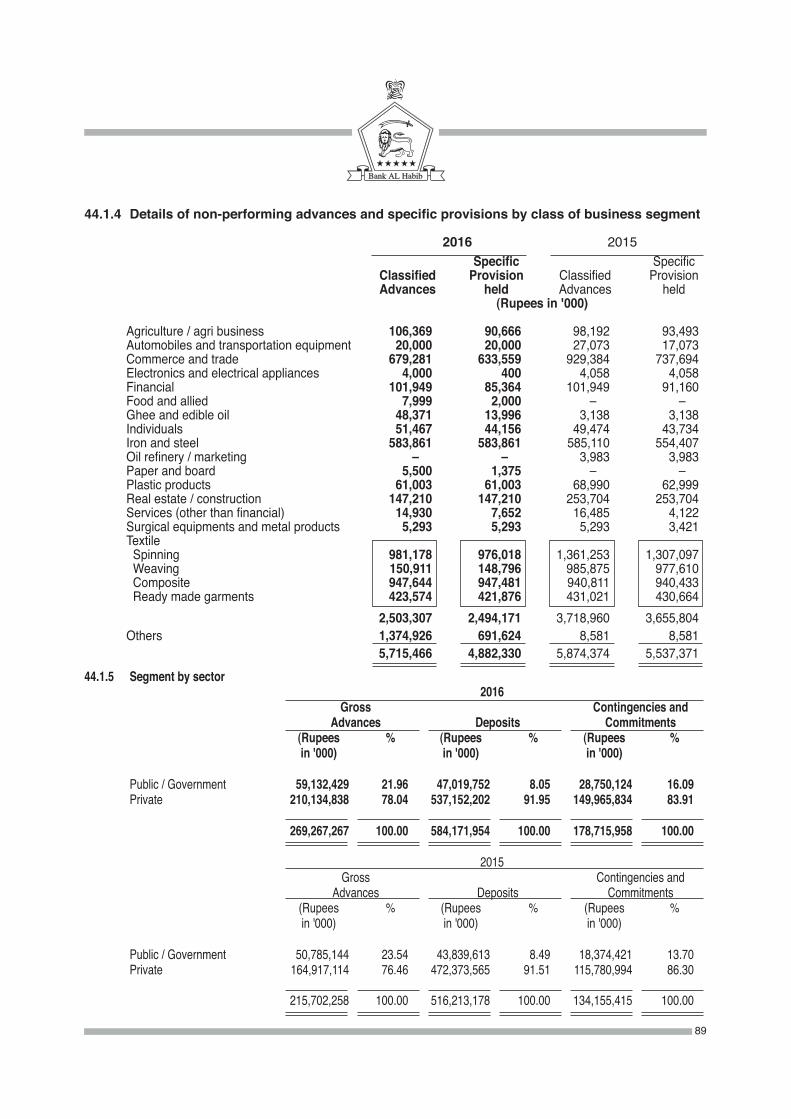
44.1.4 Details of non-performing advances and specific provisions by class of business segment
2016 2015 Specific Specific Classified Provision Classified Provision Advances held Advances held (Rupees in '000)
Agriculture / agri business 106,369 90,666 98,192 93,493 Automobiles and transportation equipment 20,000 20,000 27,073 17,073 Commerce and trade 679,281 633,559 929,384 737,694 Electronics and electrical appliances 4,000 400 4,058 4,058 Financial 101,949 85,364 101,949 91,160 Food and allied 7,999 2,000 –00 –00 Ghee and edible oil 48,371 13,996 3,138 3,138 Individuals 51,467 44,156 49,474 43,734 Iron and steel 583,861 583,861 585,110 554,407 Oil refinery / marketing –00 –00 3,983 3,983 Paper and board 5,500 1,375 –00 –00 Plastic products 61,003 61,003 68,990 62,999 Real estate / construction 147,210 147,210 253,704 253,704 Services (other than financial) 14,930 7,652 16,485 4,122 Surgical equipments and metal products 5,293 5,293 5,293 3,421 Textile Spinning 981,178 976,018 1,361,253 1,307,097 Weaving 150,911 148,796 985,875 977,610 Composite 947,644 947,481 940,811 940,433 Ready made garments 423,574 421,876 431,021 430,664 2,503,307 2,494,171 3,718,960 3,655,804 Others 1,374,926 691,624 8,581 8,581 5,715,466 4,882,330 5,874,374 5,537,37144.1.5 Segment by sector 2016 Gross Contingencies and Advances Deposits Commitments (Rupees % (Rupees % (Rupees % in '000) in '000) in '000)
Public / Government 59,132,429 21.96 47,019,752 8.05 28,750,124 16.09 Private 210,134,838 78.04 537,152,202 91.95 149,965,834 83.91
269,267,267 100.00 584,171,954 100.00 178,715,958 100.00 2015 Gross Contingencies and Advances Deposits Commitments (Rupees % (Rupees % (Rupees % in '000) in '000) in '000)
Public / Government 50,785,144 23.54 43,839,613 8.49 18,374,421 13.70 Private 164,917,114 76.46 472,373,565 91.51 115,780,994 86.30
215,702,258 100.00 516,213,178 100.00 134,155,415 100.00
89
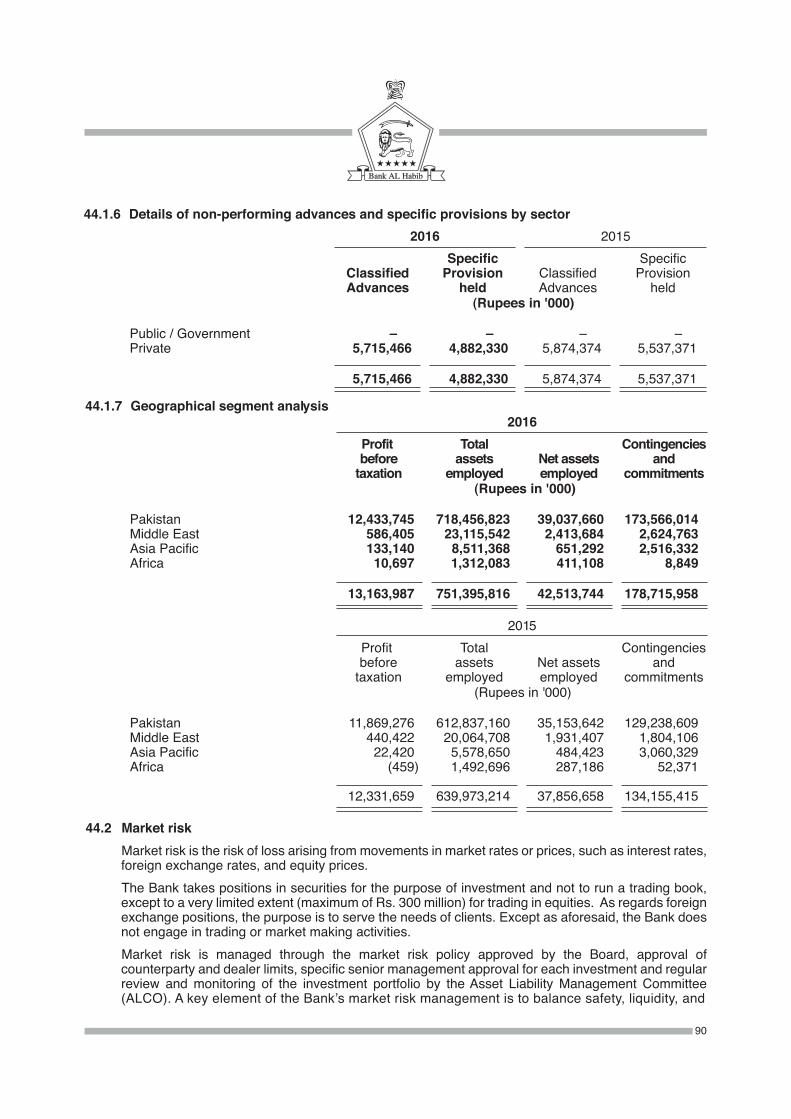
44.2 Market risk Market risk is the risk of loss arising from movements in market rates or prices, such as interest rates,
foreign exchange rates, and equity prices. The Bank takes positions in securities for the purpose of investment and not to run a trading book,
except to a very limited extent (maximum of Rs. 300 million) for trading in equities. As regards foreign exchange positions, the purpose is to serve the needs of clients. Except as aforesaid, the Bank does not engage in trading or market making activities.
Market risk is managed through the market risk policy approved by the Board, approval of counterparty and dealer limits, specific senior management approval for each investment and regular review and monitoring of the investment portfolio by the Asset Liability Management Committee (ALCO). A key element of the Bank’s market risk management is to balance safety, liquidity, and
44.1.7 Geographical segment analysis 2016 Profit Total Contingencies before assets Net assets and taxation employed employed commitments (Rupees in '000)
Pakistan 12,433,745 718,456,823 39,037,660 173,566,014 Middle East 586,405 23,115,542 2,413,684 2,624,763 Asia Pacific 133,140 8,511,368 651,292 2,516,332 Africa 10,697 1,312,083 411,108 8,849
13,163,987 751,395,816 42,513,744 178,715,958
2015 Profit Total Contingencies before assets Net assets and taxation employed employed commitments (Rupees in '000)
Pakistan 11,869,276 612,837,160 35,153,642 129,238,609 Middle East 440,422 20,064,708 1,931,407 1,804,106 Asia Pacific 22,420 5,578,650 484,423 3,060,329 Africa (459 ) 1,492,696 287,186 52,371
12,331,659 639,973,214 37,856,658 134,155,415
44.1.6 Details of non-performing advances and specific provisions by sector 2016 2015 Specific Specific Classified Provision Classified Provision Advances held Advances held (Rupees in '000)
Public / Government –00 –00 –00 –00 Private 5,715,466 4,882,330 5,874,374 5,537,371
5,715,466 4,882,330 5,874,374 5,537,371
90

income in that order of priority. Another key element is separation of functions and reporting lines for the Treasury Division which undertakes dealing activities within the limits and parameters set by ALCO, Settlements Department which confirms and settles the aforesaid deal and Middle Office which independently monitors and analyses the risks inherent in treasury operations. Risk Management Committee of the Board provides overall guidance in managing the Bank’s market risk.
Dealing activities of the Bank include investment in government securities, term finance certificates, sukuks / bonds, shares and mutual funds, money market transactions and foreign exchange transactions catering to the needs of its customers. All such activities are carried out within the prescribed limits. Any excess over limits noted by the Settlements Department and / or the Middle Office is reported to senior management and ALCO. Stress testing is performed as per guidelines of SBP as well as Bank's internal policy.
The Bank uses the Standardised Approach to calculate capital charge for market risk as per Basel regulatory framework. Details of capital charge for market risk are given in note 43.6.
44.2.1 Interest rate / yield risk
Interest rate risk is the risk of loss from adverse movements in interest rates. ALCO monitors and manages the interest rate risk with the objective of limiting the potential adverse effects on the profitability of the Bank arising from fluctuation in the market interest rates and mismatching or gaps in the amount of financial assets and financial liabilities in different maturity time bands.
The Bank's interest rate exposure is calculated by categorising its interest sensitive assets and liabilities into various time bands based on the earlier of their contractual repricing or maturity dates.
Interest rate risk exposures of the Bank are controlled through dealer limits, counter - party exposure limits and (when necessary) type - of - instrument limits. Duration and modified duration of various types of debt securities as well as their entire portfolio are also calculated, and the impact of adverse change in interest rates on the market value of the securities is estimated. Stress testing for interest rate risk is carried out regularly to estimate the impact of adverse changes in the interest rates.
Interest rate / yield risk in the banking book – Basel Specific
The Bank holds financial assets and financial liabilities with different maturities or repricing dates and linked to different benchmark rates, thus creating exposure to unexpected changes in the level of interest rates. Interest rate risk in the banking book refers to the risk associated with interest - bearing financial instruments that are not held in the trading book of the Bank.
Repricing gap analysis presents the Bank’s interest sensitive assets (ISA) and interest sensitive liabilities (ISL), categorised into various time bands based on the earlier of their contractual repricing or maturity dates (or settlement dates for off - balance sheet instruments). Deposits with no fixed maturity dates (for example, saving deposits and treasurer’s call deposits) are included in the lowest, one - month time band, but these are not expected to be payable within a one - month period. The difference between ISA and ISL for each time band signifies the gap in that time band, and provides a workable framework for determining the impact on net interest income.
The Bank reviews the repricing gap analysis periodically to monitor and manage interest rate risk in the banking book.
91
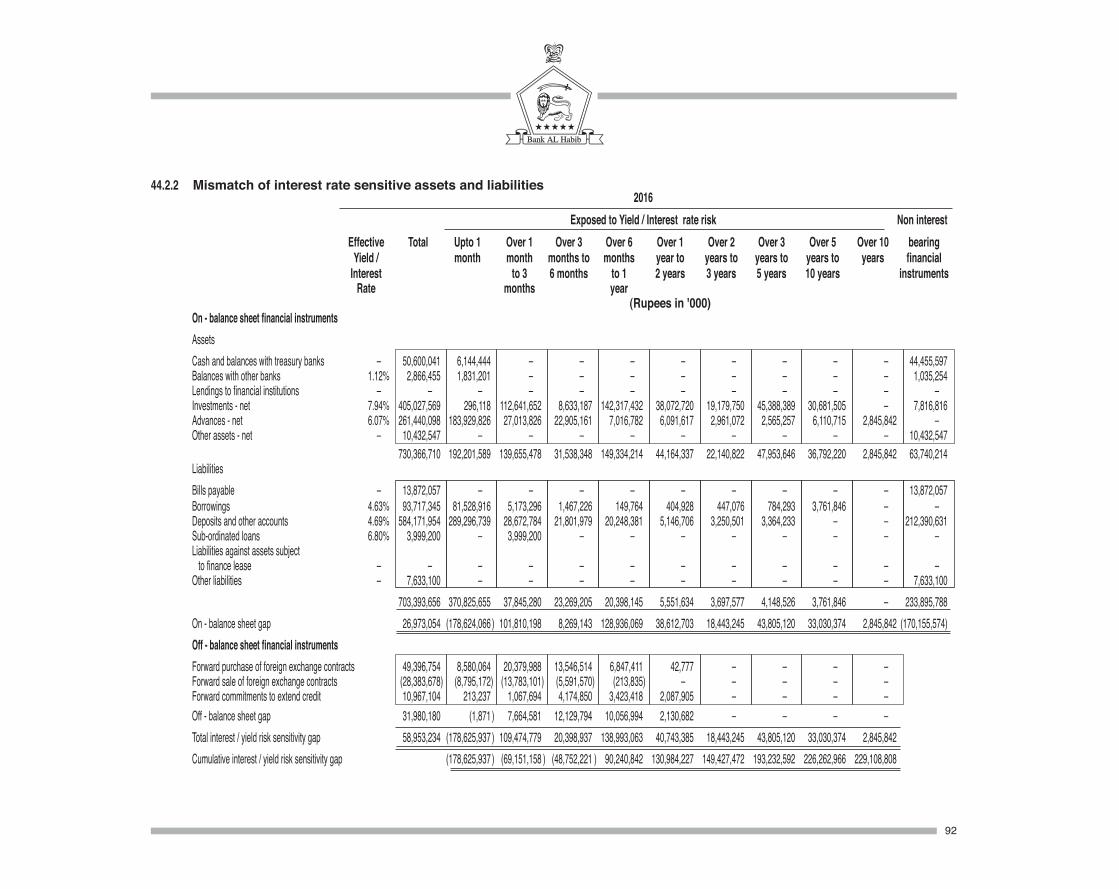
44.2.2 Mismatch of interest rate sensitive assets and liabilities 2016 Exposed to Yield / Interest rate risk Non interest Effective Total Upto 1 Over 1 Over 3 Over 6 Over 1 Over 2 Over 3 Over 5 Over 10 bearing Yield / month month months to months year to years to years to years to years financial Interest to 3 6 months to 1 2 years 3 years 5 years 10 years instruments Rate months year (Rupees in '000) On - balance sheet financial instruments Assets Cash and balances with treasury banks –00 50,600,041 6,144,444 –00 –00 –00 –00 –00 –00 –00 –00 44,455,597 Balances with other banks 1.12% 2,866,455 1,831,201 –00 –00 –00 –00 –00 –00 –00 –00 1,035,254 Lendings to financial institutions –00 –00 –00 –00 –00 –00 –00 –00 –00 –00 –00 –00 Investments - net 7.94% 405,027,569 296,118 112,641,652 8,633,187 142,317,432 38,072,720 19,179,750 45,388,389 30,681,505 –00 7,816,816 Advances - net 6.07% 261,440,098 183,929,826 27,013,826 22,905,161 7,016,782 6,091,617 2,961,072 2,565,257 6,110,715 2,845,842 –00 Other assets - net –00 10,432,547 –00 –00 –00 –00 –00 –00 –00 00–00 –00 10,432,547 730,366,710 192,201,589 139,655,478 31,538,348 149,334,214 44,164,337 22,140,822 47,953,646 36,792,220 2,845,842 63,740,214 Liabilities Bills payable –00 13,872,057 –00 –00 –00 –00 –00 –00 –00 –00 –00 13,872,057 Borrowings 4.63% 93,717,345 81,528,916 5,173,296 1,467,226 149,764 404,928 447,076 784,293 3,761,846 –00 –00 Deposits and other accounts 4.69% 584,171,954 289,296,739 28,672,784 21,801,979 20,248,381 5,146,706 3,250,501 3,364,233 –00 –00 212,390,631 Sub-ordinated loans 6.80% 3,999,200 –00 3,999,200 –00 –00 –00 –00 –00 –00 –00 –00 Liabilities against assets subject to finance lease –00 –00 –00 –00 –00 –00 –00 –00 –00 –00 –00 –00 Other liabilities –00 7,633,100 –00 –00 –00 –00 –00 –00 –00 –00 –00 7,633,100 703,393,656 370,825,655 37,845,280 23,269,205 20,398,145 5,551,634 3,697,577 4,148,526 3,761,846 –00 233,895,788 On - balance sheet gap 26,973,054 (178,624,066 ) 101,810,198 8,269,143 128,936,069 38,612,703 18,443,245 43,805,120 33,030,374 2,845,842 (170,155,574) Off - balance sheet financial instruments Forward purchase of foreign exchange contracts 49,396,754 8,580,064 20,379,988 13,546,514 6,847,411 42,777 –00 –00 –00 –00 Forward sale of foreign exchange contracts (28,383,678 ) (8,795,172 ) (13,783,101 ) (5,591,570 ) (213,835 ) –00 –00 –00 –00 –00 Forward commitments to extend credit 10,967,104 213,237 1,067,694 4,174,850 3,423,418 2,087,905 –00 –00 –00 –00 Off - balance sheet gap 31,980,180 (1,871 ) 7,664,581 12,129,794 10,056,994 2,130,682 –00 –00 –00 –00 Total interest / yield risk sensitivity gap 58,953,234 (178,625,937 ) 109,474,779 20,398,937 138,993,063 40,743,385 18,443,245 43,805,120 33,030,374 2,845,842 Cumulative interest / yield risk sensitivity gap (178,625,937 ) (69,151,158 ) (48,752,221 ) 90,240,842 130,984,227 149,427,472 193,232,592 226,262,966 229,108,808
92

2015 Exposed to Yield / Interest rate risk Non interest Effective Total Upto 1 Over 1 Over 3 Over 6 Over 1 Over 2 Over 3 Over 5 Over 10 bearing Yield / month month months to months year to years to years to years to years financial Interest to 3 6 months to 1 2 years 3 years 5 years 10 years instruments Rate months year (Rupees in '000) On - balance sheet financial instruments Assets Cash and balances with treasury banks –00 38,577,738 5,805,938 –00 –00 –00 –00 –00 –00 –00 –00 32,771,800 Balances with other banks 2.02% 3,185,669 1,828,936 –00 –00 –00 –00 –00 –00 –00 –00 1,356,733 Lendings to financial institutions 6.38% 3,992,794 3,992,794 –00 –00 –00 –00 –00 –00 –00 –00 –00 Investments - net 9.58% 356,649,003 1,314,016 41,862,859 33,835,205 141,641,535 20,152,941 37,567,377 41,846,206 31,456,967 –00 6,971,897 Advances - net 6.65% 207,288,608 148,537,026 26,822,032 15,773,726 5,315,189 2,048,926 1,469,176 1,529,761 3,728,866 2,063,906 –00 Other assets - net –00 13,389,637 –00 –00 –00 –00 –00 –00 –00 00–00 –00 13,389,637 623,083,449 161,478,710 68,684,891 49,608,931 146,956,724 22,201,867 39,036,553 43,375,967 35,185,833 2,063,906 54,490,067 Liabilities Bills payable –00 8,665,462 –00 –00 –00 –00 –00 –00 –00 –00 –00 8,665,462 Borrowings 5.05% 62,592,299 58,615,270 53,922 83,039 210,767 395,866 374,521 781,832 2,077,082 –00 –00 Deposits and other accounts 5.21% 516,213,178 254,209,581 18,409,715 26,107,275 28,328,468 5,057,975 3,659,979 3,480,245 –00 –00 176,959,940 Sub - ordinated loans 15% 2,994,600 –00 –00 2,994,600 –00 –00 –00 –00 –00 –00 –00 Liabilities against assets subject to finance lease –00 –00 –00 –00 –00 –00 –00 –00 –00 –00 –00 –00 Other liabilities –00 5,971,990 –00 –00 –00 –00 –00 –00 –00 –00 –00 5,971,990 596,437,529 312,824,851 18,463,637 29,184,914 28,539,235 5,453,841 4,034,500 4,262,077 2,077,082 –00 191,597,392 On - balance sheet gap 26,645,920 (151,346,141 ) 50,221,254 20,424,017 118,417,489 16,748,026 35,002,053 39,113,890 33,108,751 2,063,906 (137,107,325) Off - balance sheet financial instruments Forward purchase of foreign exchange contracts 46,760,182 13,172,132 20,220,719 6,826,216 6,541,115 –00 –00 –00 –00 –00 Forward sale of foreign exchange contracts (28,769,804 ) (15,323,278 ) (10,026,799 ) (3,188,863 ) (230,864 ) –00 –00 –00 –00 –00 Forward commitments to extend credit 10,748,236 260,156 1,827,220 3,042,180 4,055,680 1,563,000 –00 –00 –00 –00 Off - balance sheet gap 28,738,614 (1,890,990 ) 12,021,140 6,679,533 10,365,931 1,563,000 –00 –00 –00 –00 Total interest / yield risk sensitivity gap 55,384,534 (153,237,131 ) 62,242,394 27,103,550 128,783,420 18,311,026 35,002,053 39,113,890 33,108,751 2,063,906 Cumulative interest / yield risk sensitivity gap (153,237,131 ) (90,994,737 ) (63,891,187 ) 64,892,233 83,203,259 118,205,312 157,319,202 190,427,953 192,491,859
93
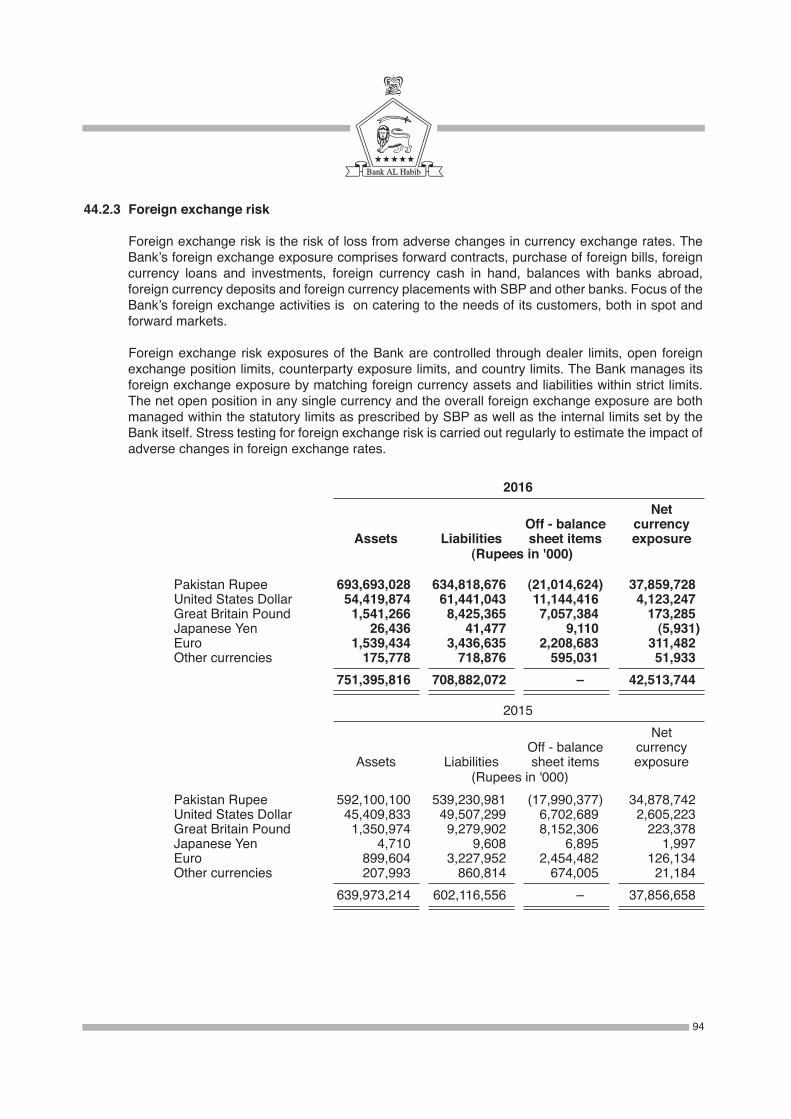
44.2.3 Foreign exchange risk
Foreign exchange risk is the risk of loss from adverse changes in currency exchange rates. The Bank’s foreign exchange exposure comprises forward contracts, purchase of foreign bills, foreign currency loans and investments, foreign currency cash in hand, balances with banks abroad, foreign currency deposits and foreign currency placements with SBP and other banks. Focus of the Bank’s foreign exchange activities is on catering to the needs of its customers, both in spot and forward markets.
Foreign exchange risk exposures of the Bank are controlled through dealer limits, open foreign exchange position limits, counterparty exposure limits, and country limits. The Bank manages its foreign exchange exposure by matching foreign currency assets and liabilities within strict limits. The net open position in any single currency and the overall foreign exchange exposure are both managed within the statutory limits as prescribed by SBP as well as the internal limits set by the Bank itself. Stress testing for foreign exchange risk is carried out regularly to estimate the impact of adverse changes in foreign exchange rates.
2016 Net Off - balance currency Assets Liabilities sheet items exposure (Rupees in '000)
Pakistan Rupee 693,693,028 634,818,676 (21,014,624 ) 37,859,728 United States Dollar 54,419,874 61,441,043 11,144,416 4,123,247 Great Britain Pound 1,541,266 8,425,365 7,057,384 173,285 Japanese Yen 26,436 41,477 9,110 (5,931 ) Euro 1,539,434 3,436,635 2,208,683 311,482 Other currencies 175,778 718,876 595,031 51,933 751,395,816 708,882,072 –00 42,513,744
2015 Net Off - balance currency Assets Liabilities sheet items exposure (Rupees in '000) Pakistan Rupee 592,100,100 539,230,981 (17,990,377 ) 34,878,742 United States Dollar 45,409,833 49,507,299 6,702,689 2,605,223 Great Britain Pound 1,350,974 9,279,902 8,152,306 223,378 Japanese Yen 4,710 9,608 6,895 1,997 Euro 899,604 3,227,952 2,454,482 126,134 Other currencies 207,993 860,814 674,005 21,184 639,973,214 602,116,556 –00 37,856,658
94
44.3 Liquidity risk
Liquidity risk is the risk of loss to a bank arising from its inability to meet obligations as they fall due or to fund growth in assets, without incurring unacceptable losses.
Liquidity risk is managed through the liquidity risk policy approved by the Board, careful monitoring of daily liquidity position by the Treasury Division and the Middle Office and regular review and monitoring of the liquidity position by ALCO. Risk Management Committee of the Board provides overall guidance in managing the Bank’s liquidity risk.
Key elements of the Bank’s liquidity risk management are as follows:
- To maintain a comfortable margin of excess liquidity in the form of cash and readily marketable assets to meet the Bank’s funding requirements at any time.
- To keep a strong focus on mobilisation of low - cost core deposits from customers. - To maintain a realistic balance between the behavioural maturity profiles of assets and
liabilities.
- To maintain excellent credit rating (as borrowing costs and ability to raise funds are directly affected by credit rating).
- To have a written contingency funding plan to address any hypothetical situations when access to normal sources of funding is constrained.
The Bank’s liquidity risk management addresses the goal of protecting solvency and the ability to withstand stressful events in the market place. Stress testing for liquidity risk is carried out regularly to estimate the impact of decline in liquidity on the ratio of liquid assets to deposits plus borrowings.
95
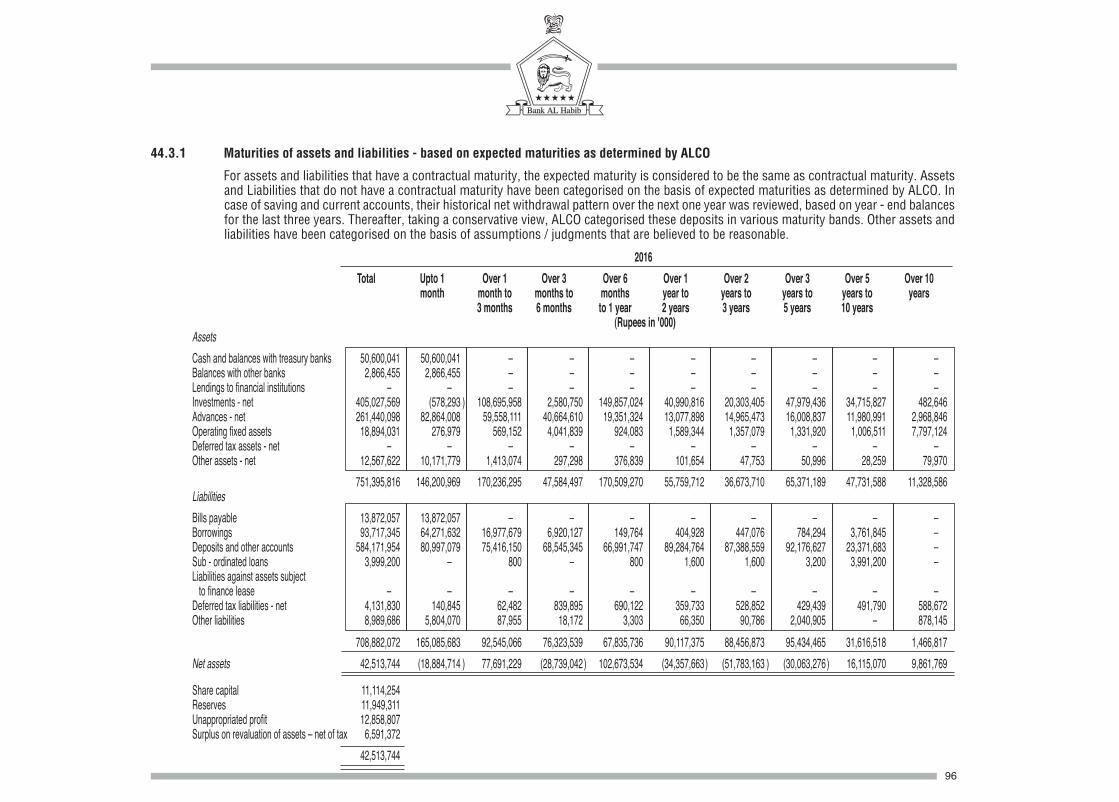
44.3.1 Maturities of assets and liabilities - based on expected maturities as determined by ALCO
For assets and liabilities that have a contractual maturity, the expected maturity is considered to be the same as contractual maturity. Assets and Liabilities that do not have a contractual maturity have been categorised on the basis of expected maturities as determined by ALCO. In case of saving and current accounts, their historical net withdrawal pattern over the next one year was reviewed, based on year - end balances for the last three years. Thereafter, taking a conservative view, ALCO categorised these deposits in various maturity bands. Other assets and liabilities have been categorised on the basis of assumptions / judgments that are believed to be reasonable.
2016 Total Upto 1 Over 1 Over 3 Over 6 Over 1 Over 2 Over 3 Over 5 Over 10 month month to months to months year to years to years to years to years 3 months 6 months to 1 year 2 years 3 years 5 years 10 years (Rupees in '000) Assets Cash and balances with treasury banks 50,600,041 50,600,041 –00 –00 –00 –00 –00 –00 –00 –00 Balances with other banks 2,866,455 2,866,455 –00 –00 –00 –00 –00 –00 –00 –00 Lendings to financial institutions –00 –00 –00 –00 –00 –00 –00 –00 –00 –00 Investments - net 405,027,569 (578,293 ) 108,695,958 2,580,750 149,857,024 40,990,816 20,303,405 47,979,436 34,715,827 482,646 Advances - net 261,440,098 82,864,008 59,558,111 40,664,610 19,351,324 13,077,898 14,965,473 16,008,837 11,980,991 2,968,846 Operating fixed assets 18,894,031 276,979 569,152 4,041,839 924,083 1,589,344 1,357,079 1,331,920 1,006,511 7,797,124 Deferred tax assets - net –00 –00 –00 –00 –00 –00 –00 –00 –00 –00 Other assets - net 12,567,622 10,171,779 1,413,074 297,298 376,839 101,654 47,753 50,996 28,259 79,970 751,395,816 146,200,969 170,236,295 47,584,497 170,509,270 55,759,712 36,673,710 65,371,189 47,731,588 11,328,586 Liabilities Bills payable 13,872,057 13,872,057 –00 –00 –00 –00 –00 –00 –00 –00 Borrowings 93,717,345 64,271,632 16,977,679 6,920,127 149,764 404,928 447,076 784,294 3,761,845 –00 Deposits and other accounts 584,171,954 80,997,079 75,416,150 68,545,345 66,991,747 89,284,764 87,388,559 92,176,627 23,371,683 –00 Sub - ordinated loans 3,999,200 –00 800 –00 800 1,600 1,600 3,200 3,991,200 –00 Liabilities against assets subject to finance lease –00 –00 –00 –00 –00 –00 –00 –00 –00 –00 Deferred tax liabilities - net 4,131,830 140,845 62,482 839,895 690,122 359,733 528,852 429,439 491,790 588,672 Other liabilities 8,989,686 5,804,070 87,955 18,172 3,303 66,350 90,786 2,040,905 –00 878,145 708,882,072 165,085,683 92,545,066 76,323,539 67,835,736 90,117,375 88,456,873 95,434,465 31,616,518 1,466,817 Net assets 42,513,744 (18,884,714 ) 77,691,229 (28,739,042 ) 102,673,534 (34,357,663 ) (51,783,163 ) (30,063,276 ) 16,115,070 9,861,769
Share capital 11,114,254 Reserves 11,949,311 Unappropriated profit 12,858,807 Surplus on revaluation of assets – net of tax 6,591,372 42,513,744
96
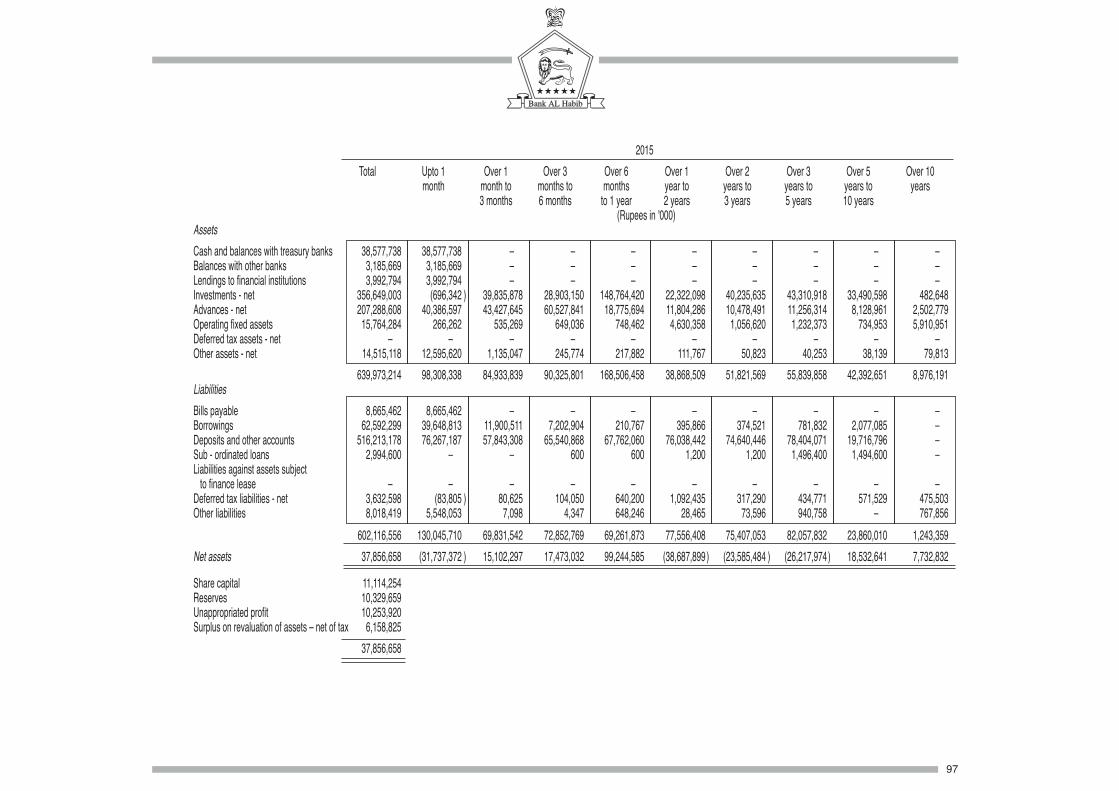
2015 Total Upto 1 Over 1 Over 3 Over 6 Over 1 Over 2 Over 3 Over 5 Over 10 month month to months to months year to years to years to years to years 3 months 6 months to 1 year 2 years 3 years 5 years 10 years (Rupees in '000) Assets Cash and balances with treasury banks 38,577,738 38,577,738 –00 –00 –00 –00 –00 –00 –00 –00 Balances with other banks 3,185,669 3,185,669 –00 –00 –00 –00 –00 –00 –00 –00 Lendings to financial institutions 3,992,794 3,992,794 –00 –00 –00 –00 –00 –00 –00 –00 Investments - net 356,649,003 (696,342 ) 39,835,878 28,903,150 148,764,420 22,322,098 40,235,635 43,310,918 33,490,598 482,648 Advances - net 207,288,608 40,386,597 43,427,645 60,527,841 18,775,694 11,804,286 10,478,491 11,256,314 8,128,961 2,502,779 Operating fixed assets 15,764,284 266,262 535,269 649,036 748,462 4,630,358 1,056,620 1,232,373 734,953 5,910,951 Deferred tax assets - net –00 –00 –00 –00 –00 –00 –00 –00 –00 –00 Other assets - net 14,515,118 12,595,620 1,135,047 245,774 217,882 111,767 50,823 40,253 38,139 79,813 639,973,214 98,308,338 84,933,839 90,325,801 168,506,458 38,868,509 51,821,569 55,839,858 42,392,651 8,976,191 Liabilities Bills payable 8,665,462 8,665,462 –00 –00 –00 –00 –00 –00 –00 –00 Borrowings 62,592,299 39,648,813 11,900,511 7,202,904 210,767 395,866 374,521 781,832 2,077,085 –00 Deposits and other accounts 516,213,178 76,267,187 57,843,308 65,540,868 67,762,060 76,038,442 74,640,446 78,404,071 19,716,796 –00 Sub - ordinated loans 2,994,600 –00 –00 600 600 1,200 1,200 1,496,400 1,494,600 –00 Liabilities against assets subject to finance lease –00 –00 –00 –00 –00 –00 –00 –00 –00 –00 Deferred tax liabilities - net 3,632,598 (83,805 ) 80,625 104,050 640,200 1,092,435 317,290 434,771 571,529 475,503 Other liabilities 8,018,419 5,548,053 7,098 4,347 648,246 28,465 73,596 940,758 –00 767,856 602,116,556 130,045,710 69,831,542 72,852,769 69,261,873 77,556,408 75,407,053 82,057,832 23,860,010 1,243,359 Net assets 37,856,658 (31,737,372 ) 15,102,297 17,473,032 99,244,585 (38,687,899 ) (23,585,484 ) (26,217,974 ) 18,532,641 7,732,832
Share capital 11,114,254 Reserves 10,329,659 Unappropriated profit 10,253,920 Surplus on revaluation of assets – net of tax 6,158,825 37,856,658
97
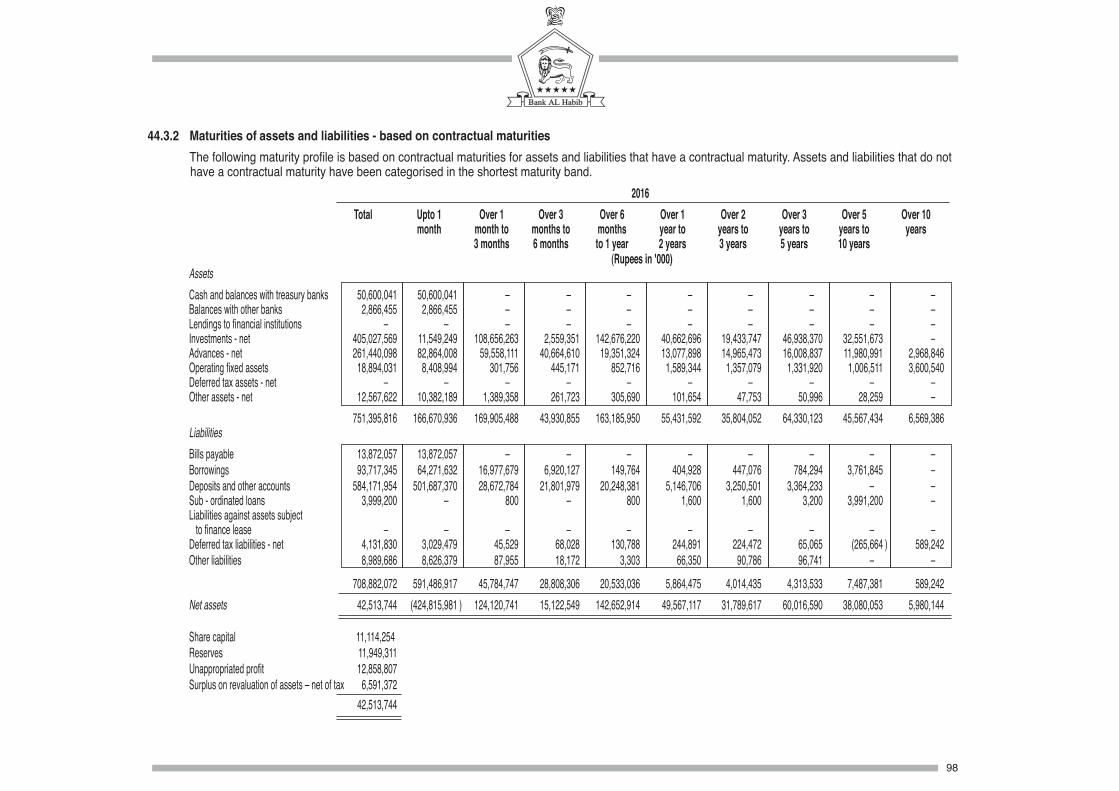
2016 Total Upto 1 Over 1 Over 3 Over 6 Over 1 Over 2 Over 3 Over 5 Over 10 month month to months to months year to years to years to years to years 3 months 6 months to 1 year 2 years 3 years 5 years 10 years (Rupees in '000) Assets Cash and balances with treasury banks 50,600,041 50,600,041 –00 –00 –00 –00 –00 –00 –00 –00 Balances with other banks 2,866,455 2,866,455 –00 –00 –00 –00 –00 –00 –00 –00 Lendings to financial institutions –00 –00 –00 –00 –00 –00 –00 –00 –00 –00 Investments - net 405,027,569 11,549,249 108,656,263 2,559,351 142,676,220 40,662,696 19,433,747 46,938,370 32,551,673 –00 Advances - net 261,440,098 82,864,008 59,558,111 40,664,610 19,351,324 13,077,898 14,965,473 16,008,837 11,980,991 2,968,846 Operating fixed assets 18,894,031 8,408,994 301,756 445,171 852,716 1,589,344 1,357,079 1,331,920 1,006,511 3,600,540 Deferred tax assets - net –00 –00 –00 –00 –00 –00 –00 –00 –00 –00 Other assets - net 12,567,622 10,382,189 1,389,358 261,723 305,690 101,654 47,753 50,996 28,259 –00 751,395,816 166,670,936 169,905,488 43,930,855 163,185,950 55,431,592 35,804,052 64,330,123 45,567,434 6,569,386 Liabilities Bills payable 13,872,057 13,872,057 –00 –00 –00 –00 –00 –00 –00 –00 Borrowings 93,717,345 64,271,632 16,977,679 6,920,127 149,764 404,928 447,076 784,294 3,761,845 –00 Deposits and other accounts 584,171,954 501,687,370 28,672,784 21,801,979 20,248,381 5,146,706 3,250,501 3,364,233 –00 –00 Sub - ordinated loans 3,999,200 –00 800 –00 800 1,600 1,600 3,200 3,991,200 –00 Liabilities against assets subject to finance lease –00 –00 –00 –00 –00 –00 –00 –00 –00 –00 Deferred tax liabilities - net 4,131,830 3,029,479 45,529 68,028 130,788 244,891 224,472 65,065 (265,664 ) 589,242 Other liabilities 8,989,686 8,626,379 87,955 18,172 3,303 66,350 90,786 96,741 –00 –00 708,882,072 591,486,917 45,784,747 28,808,306 20,533,036 5,864,475 4,014,435 4,313,533 7,487,381 589,242 Net assets 42,513,744 (424,815,981 ) 124,120,741 15,122,549 142,652,914 49,567,117 31,789,617 60,016,590 38,080,053 5,980,144 Share capital 11,114,254 Reserves 11,949,311 Unappropriated profit 12,858,807 Surplus on revaluation of assets – net of tax 6,591,372 42,513,744
44.3.2 Maturities of assets and liabilities - based on contractual maturities The following maturity profile is based on contractual maturities for assets and liabilities that have a contractual maturity. Assets and liabilities that do not
have a contractual maturity have been categorised in the shortest maturity band.
98
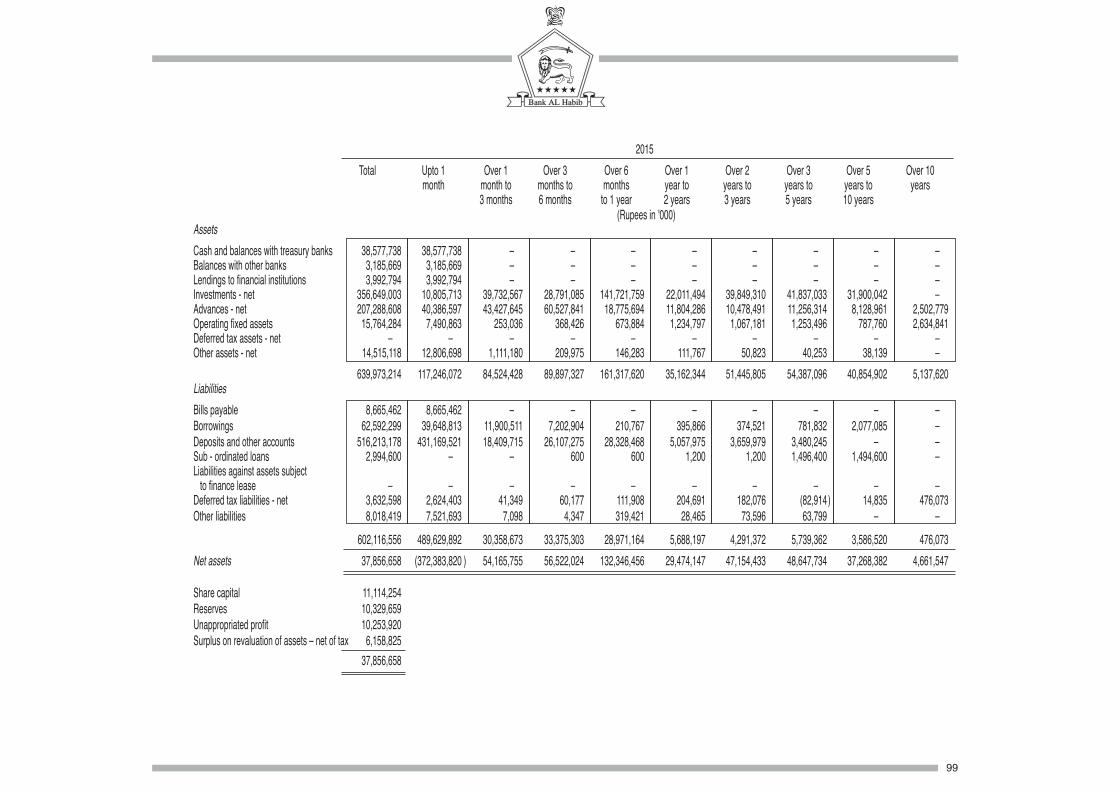
2015 Total Upto 1 Over 1 Over 3 Over 6 Over 1 Over 2 Over 3 Over 5 Over 10 month month to months to months year to years to years to years to years 3 months 6 months to 1 year 2 years 3 years 5 years 10 years (Rupees in '000) Assets Cash and balances with treasury banks 38,577,738 38,577,738 –00 –00 –00 –00 –00 –00 –00 –00 Balances with other banks 3,185,669 3,185,669 –00 –00 –00 –00 –00 –00 –00 –00 Lendings to financial institutions 3,992,794 3,992,794 –00 –00 –00 –00 –00 –00 –00 –00 Investments - net 356,649,003 10,805,713 39,732,567 28,791,085 141,721,759 22,011,494 39,849,310 41,837,033 31,900,042 –00 Advances - net 207,288,608 40,386,597 43,427,645 60,527,841 18,775,694 11,804,286 10,478,491 11,256,314 8,128,961 2,502,779 Operating fixed assets 15,764,284 7,490,863 253,036 368,426 673,884 1,234,797 1,067,181 1,253,496 787,760 2,634,841 Deferred tax assets - net –00 –00 –00 –00 –00 –00 –00 –00 –00 –00 Other assets - net 14,515,118 12,806,698 1,111,180 209,975 146,283 111,767 50,823 40,253 38,139 –00 639,973,214 117,246,072 84,524,428 89,897,327 161,317,620 35,162,344 51,445,805 54,387,096 40,854,902 5,137,620 Liabilities Bills payable 8,665,462 8,665,462 –00 –00 –00 –00 –00 –00 –00 –00 Borrowings 62,592,299 39,648,813 11,900,511 7,202,904 210,767 395,866 374,521 781,832 2,077,085 –00 Deposits and other accounts 516,213,178 431,169,521 18,409,715 26,107,275 28,328,468 5,057,975 3,659,979 3,480,245 –00 –00 Sub - ordinated loans 2,994,600 –00 –00 600 600 1,200 1,200 1,496,400 1,494,600 –00 Liabilities against assets subject to finance lease –00 –00 –00 –00 –00 –00 –00 –00 –00 –00 Deferred tax liabilities - net 3,632,598 2,624,403 41,349 60,177 111,908 204,691 182,076 (82,914 ) 14,835 476,073 Other liabilities 8,018,419 7,521,693 7,098 4,347 319,421 28,465 73,596 63,799 –00 –00 602,116,556 489,629,892 30,358,673 33,375,303 28,971,164 5,688,197 4,291,372 5,739,362 3,586,520 476,073 Net assets 37,856,658 (372,383,820 ) 54,165,755 56,522,024 132,346,456 29,474,147 47,154,433 48,647,734 37,268,382 4,661,547 Share capital 11,114,254 Reserves 10,329,659 Unappropriated profit 10,253,920 Surplus on revaluation of assets – net of tax 6,158,825 37,856,658
99
44.4 Equity position risk in the banking book – Basel Specific
Except for very limited trading position in equities as mentioned above (note 44.2), the Bank's policy is to take equity positions for investment purposes. Equity holdings include direct investment in shares and in equity - based mutual funds, both closed - end and open - end. Policies covering their valuation and accounting are disclosed in note 5.4.
Equity position risk
Equity position risk is the risk of loss from adverse movements in equity prices. The Bank’s policy is to take equity positions for investment purposes and not to run a trading book, except to a very limited extent (maximum of Rs. 300 million) for trading in equities.
Equity position risk of the Bank is controlled through equity portfolio limits, sector limits, scrip limits, and future contracts limits. Direct investment in equities and mutual funds is managed within the statutory limits as prescribed by SBP as well as the internal limits set by the Bank itself. Stress testing for equity price risk is carried out regularly to estimate the impact of decline in stock prices.
44.5 Operational risk
Operational risk is the risk of loss resulting from inadequate or failed internal processes, people, and systems or from external events. This definition includes legal risks but excludes strategic and reputational risks.
Operational risk is managed through the operational risk policy and audit policy approved by the Board, along with the policies on prevention of frauds and forgeries and compliance with “Know Your Customer” / "Customer Due Diligence" and “Anti Money Laundering / Combating Financing of Terrorism” requirements; operational manuals and procedures issued from time to time; a system of internal controls and dual authorisation for important transactions and safe - keeping; a Business Continuity Plan, including a Disaster Recovery Plan for I.T., to prevent interruption of business services in the event of a major incident or disaster; an I.T. Security Policy to ensure security and integrity of I.T. systems; and regular audit of the branches. Audit Committee of the Board provides overall guidance in managing the Bank’s operational risk.
The Bank’s operational risk management framework, as laid down in the operational risk policy, permits the overall risk management approach to evolve in the light of organisational learning and the future needs of the Bank.
The Bank places a high priority on conducting all business dealings with integrity and fairness, as laid down in the Code of Conduct, which is required to be complied with by all employees.
Internal controls are an essential feature of risk reduction in operational risk management and the Bank continues to improve its internal controls.
Operational risk disclosures – Basel Specific
The Bank uses Basic Indicator Approach to calculate capital charge for operational risk as per Basel regulatory framework. This approach is considered to be most suitable in view of the business model of the Bank which relies on an extensive network of branches to offer one - stop, full - service banking to its clients. The Bank has developed and implemented an Operational Loss Database. Operational loss and "near miss" events are reviewed and appropriate corrective actions taken on an ongoing basis, including measures to improve security and control procedures.
100
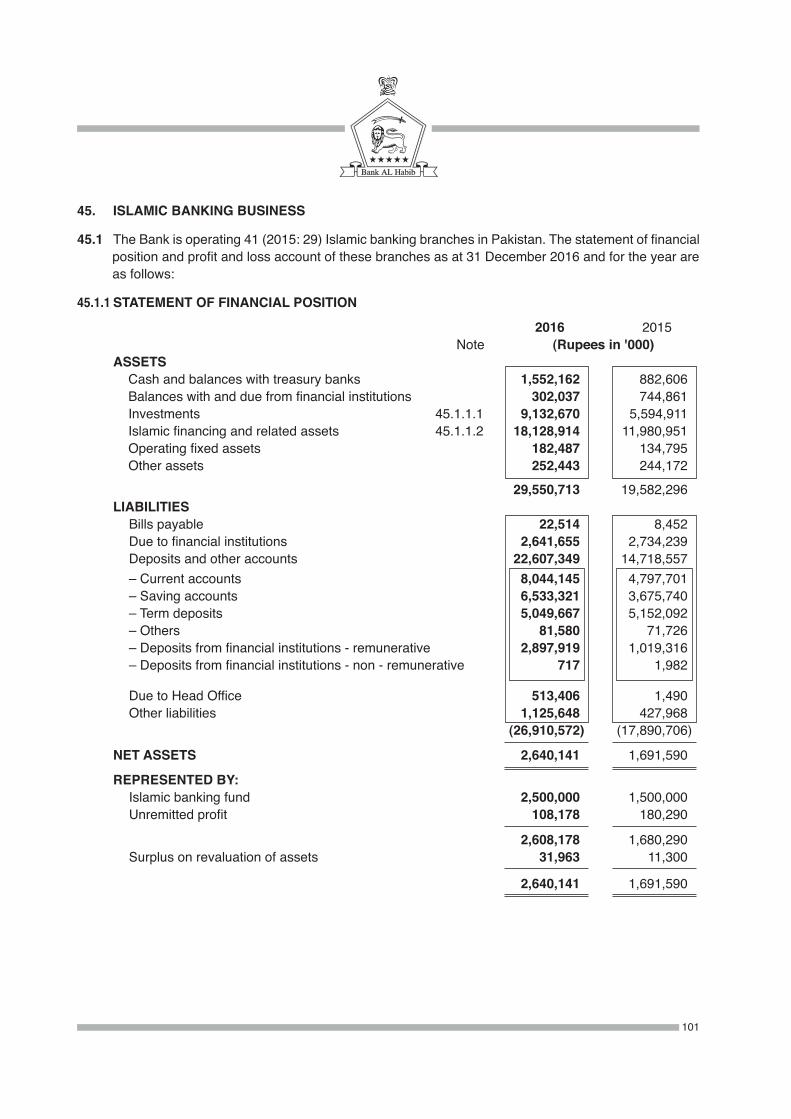
45. ISLAMIC BANKING BUSINESS
45.1 The Bank is operating 41 (2015: 29) Islamic banking branches in Pakistan. The statement of financial position and profit and loss account of these branches as at 31 December 2016 and for the year are as follows:
45.1.1 STATEMENT OF FINANCIAL POSITION
2016 2015 Note (Rupees in '000) ASSETS Cash and balances with treasury banks 1,552,162 882,606 Balances with and due from financial institutions 302,037 744,861 Investments 45.1.1.1 9,132,670 5,594,911 Islamic financing and related assets 45.1.1.2 18,128,914 11,980,951 Operating fixed assets 182,487 134,795 Other assets 252,443 244,172
29,550,713 19,582,296 LIABILITIES Bills payable 22,514 8,452 Due to financial institutions 2,641,655 2,734,239 Deposits and other accounts 22,607,349 14,718,557 – Current accounts 8,044,145 4,797,701 – Saving accounts 6,533,321 3,675,740 – Term deposits 5,049,667 5,152,092 – Others 81,580 71,726
– Deposits from financial institutions - remunerative 2,897,919 1,019,316 – Deposits from financial institutions - non - remunerative 717 1,982
Due to Head Office 513,406 1,490 Other liabilities 1,125,648 427,968 (26,910,572 ) (17,890,706 )
NET ASSETS 2,640,141 1,691,590
REPRESENTED BY: Islamic banking fund 2,500,000 1,500,000 Unremitted profit 108,178 180,290
2,608,178 1,680,290 Surplus on revaluation of assets 31,963 11,300
2,640,141 1,691,590
101
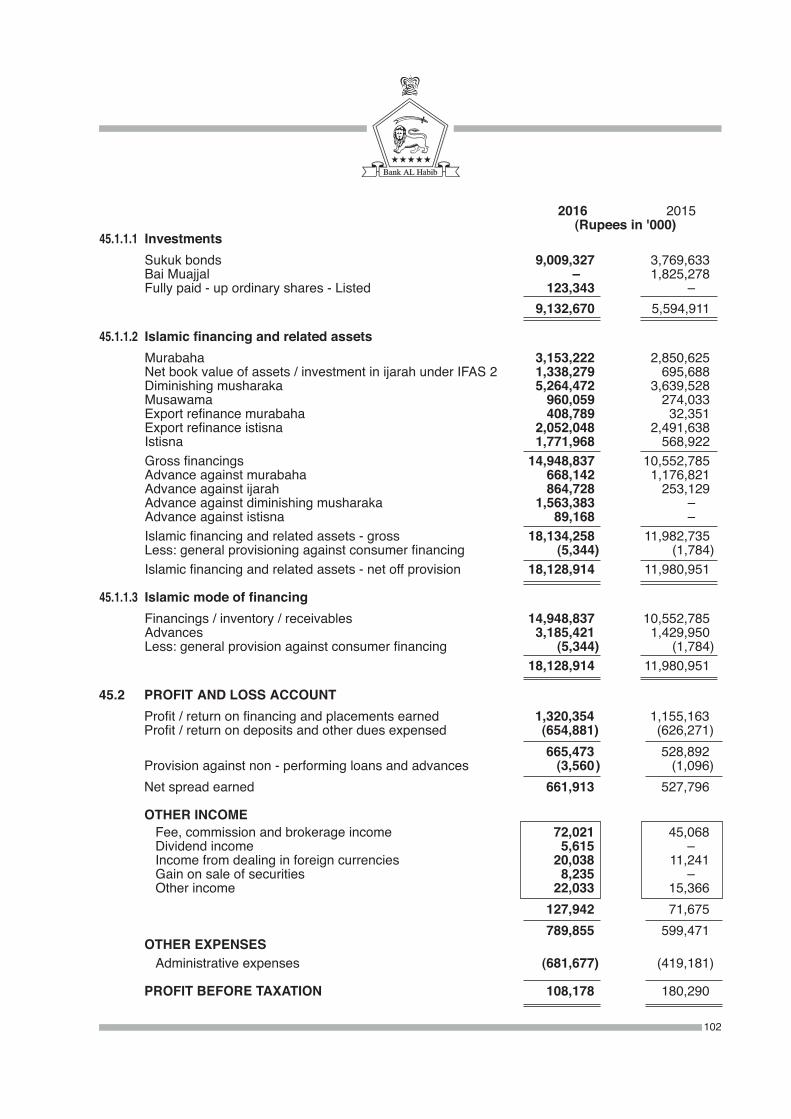
2016 2015 (Rupees in '000)45.1.1.1 Investments Sukuk bonds 9,009,327 3,769,633 Bai Muajjal –00 1,825,278 Fully paid - up ordinary shares - Listed 123,343 –00 9,132,670 5,594,911
45.1.1.2 Islamic financing and related assets Murabaha 3,153,222 2,850,625 Net book value of assets / investment in ijarah under IFAS 2 1,338,279 695,688 Diminishing musharaka 5,264,472 3,639,528 Musawama 960,059 274,033 Export refinance murabaha 408,789 32,351 Export refinance istisna 2,052,048 2,491,638 Istisna 1,771,968 568,922 Gross financings 14,948,837 10,552,785 Advance against murabaha 668,142 1,176,821 Advance against ijarah 864,728 253,129 Advance against diminishing musharaka 1,563,383 –00 Advance against istisna 89,168 –00 Islamic financing and related assets - gross 18,134,258 11,982,735 Less: general provisioning against consumer financing (5,344 ) (1,784 ) Islamic financing and related assets - net off provision 18,128,914 11,980,951
45.1.1.3 Islamic mode of financing Financings / inventory / receivables 14,948,837 10,552,785 Advances 3,185,421 1,429,950 Less: general provision against consumer financing (5,344 ) (1,784 ) 18,128,914 11,980,951
102
45.2 PROFIT AND LOSS ACCOUNT Profit / return on financing and placements earned 1,320,354 1,155,163 Profit / return on deposits and other dues expensed (654,881 ) (626,271 ) 665,473 528,892 Provision against non - performing loans and advances (3,560 ) (1,096 ) Net spread earned 661,913 527,796
OTHER INCOME Fee, commission and brokerage income 72,021 45,068 Dividend income 5,615 –00 Income from dealing in foreign currencies 20,038 11,241 Gain on sale of securities 8,235 –00 Other income 22,033 15,366 127,942 71,675 789,855 599,471 OTHER EXPENSES Administrative expenses (681,677 ) (419,181 )
PROFIT BEFORE TAXATION 108,178 180,290
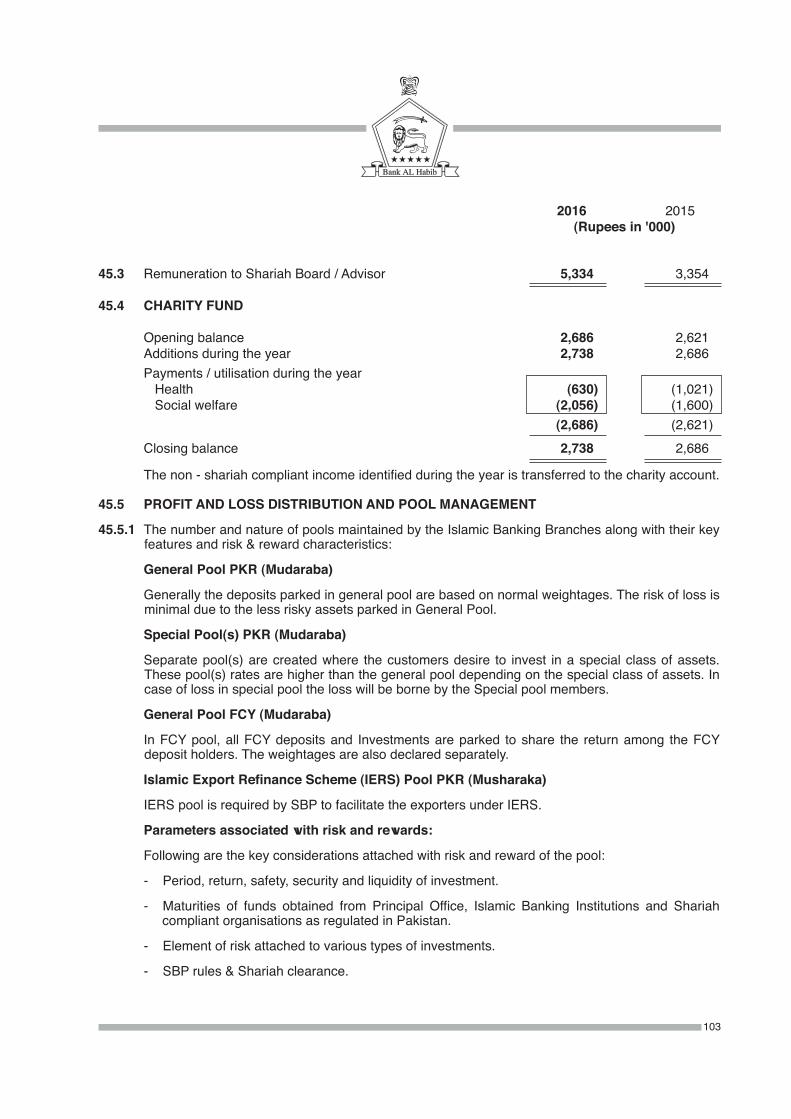
2016 2015 (Rupees in '000)
45.3 Remuneration to Shariah Board / Advisor 5,334 3,354
45.4 CHARITY FUND
Opening balance 2,686 2,621 Additions during the year 2,738 2,686 Payments / utilisation during the year Health (630 ) (1,021 ) Social welfare (2,056 ) (1,600 ) (2,686 ) (2,621 ) Closing balance 2,738 2,686
The non - shariah compliant income identified during the year is transferred to the charity account. 45.5 PROFIT AND LOSS DISTRIBUTION AND POOL MANAGEMENT
45.5.1 The number and nature of pools maintained by the Islamic Banking Branches along with their key features and risk & reward characteristics:
General Pool PKR (Mudaraba)
Generally the deposits parked in general pool are based on normal weightages. The risk of loss is minimal due to the less risky assets parked in General Pool.
Special Pool(s) PKR (Mudaraba)
Separate pool(s) are created where the customers desire to invest in a special class of assets. These pool(s) rates are higher than the general pool depending on the special class of assets. In case of loss in special pool the loss will be borne by the Special pool members.
General Pool FCY (Mudaraba)
In FCY pool, all FCY deposits and Investments are parked to share the return among the FCY deposit holders. The weightages are also declared separately.
Islamic Export Refinance Scheme (IERS) Pool PKR (Musharaka)
IERS pool is required by SBP to facilitate the exporters under IERS.
Parameters associated with risk and rewards:
Following are the key considerations attached with risk and reward of the pool:
- Period, return, safety, security and liquidity of investment.
- Maturities of funds obtained from Principal Office, Islamic Banking Institutions and Shariah compliant organisations as regulated in Pakistan.
- Element of risk attached to various types of investments.
- SBP rules & Shariah clearance.
103
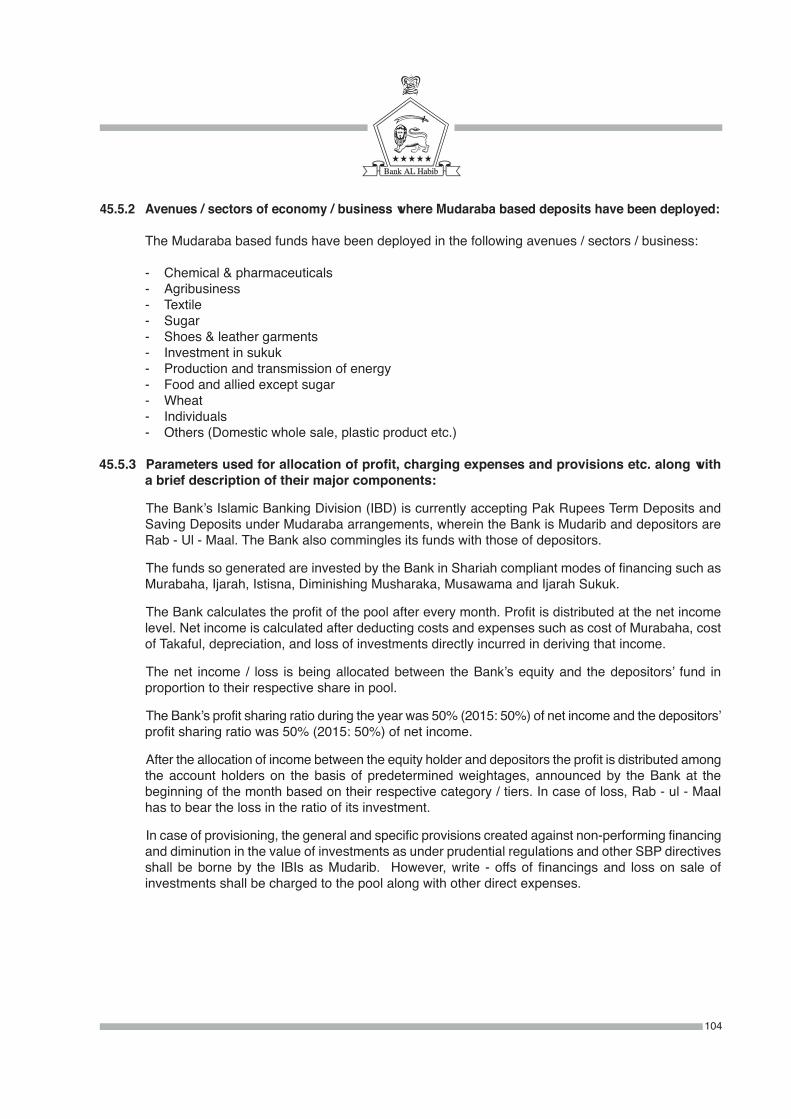
45.5.2 Avenues / sectors of economy / business where Mudaraba based deposits have been deployed:
The Mudaraba based funds have been deployed in the following avenues / sectors / business:
- Chemical & pharmaceuticals - Agribusiness - Textile - Sugar - Shoes & leather garments - Investment in sukuk - Production and transmission of energy - Food and allied except sugar - Wheat - Individuals - Others (Domestic whole sale, plastic product etc.)
45.5.3 Parameters used for allocation of profit, charging expenses and provisions etc. along with a brief description of their major components:
The Bank’s Islamic Banking Division (IBD) is currently accepting Pak Rupees Term Deposits and Saving Deposits under Mudaraba arrangements, wherein the Bank is Mudarib and depositors are Rab - Ul - Maal. The Bank also commingles its funds with those of depositors.
The funds so generated are invested by the Bank in Shariah compliant modes of financing such as Murabaha, Ijarah, Istisna, Diminishing Musharaka, Musawama and Ijarah Sukuk.
The Bank calculates the profit of the pool after every month. Profit is distributed at the net income level. Net income is calculated after deducting costs and expenses such as cost of Murabaha, cost of Takaful, depreciation, and loss of investments directly incurred in deriving that income.
The net income / loss is being allocated between the Bank’s equity and the depositors’ fund in proportion to their respective share in pool.
The Bank’s profit sharing ratio during the year was 50% (2015: 50%) of net income and the depositors’ profit sharing ratio was 50% (2015: 50%) of net income.
After the allocation of income between the equity holder and depositors the profit is distributed among the account holders on the basis of predetermined weightages, announced by the Bank at the beginning of the month based on their respective category / tiers. In case of loss, Rab - ul - Maal has to bear the loss in the ratio of its investment.
In case of provisioning, the general and specific provisions created against non-performing financing and diminution in the value of investments as under prudential regulations and other SBP directives shall be borne by the IBIs as Mudarib. However, write - offs of financings and loss on sale of investments shall be charged to the pool along with other direct expenses.
104
45.5.5 Profit rate earned vs. profit rate distributed to the depositors during the year
2016 2015 (Percentage)
Profit Rate Earned 6.03% 7.80% Profit Rate Distributed 3.36% 4.11%
46. SUBSEQUENT EVENT
Subsequent to the year end, the Board of Directors proposed a final cash dividend of Rs. 3.5 (2015: Rs. 3.5) per share.
47. GENERAL
47.1 SBP has issued BPRD Circular Letter No. 5 dated February 29, 2016 regarding the classification of Islamic financing and related assets. Accordingly, prior year numbers have been reclassified as follows:
Reclassification from Reclassification to 2015 2014 Statement of Financial Position Statement of Financial Position (Rupees in '000)
Lendings to Financial Institutions Investments - net 1,825,278 –00 Other assets - net Advances - net 1,429,950 380,266
No other major reclassifications were made during the year.
47.2 Figures have been rounded off to the nearest thousand rupees, unless otherwise stated.
48. DATE OF AUTHORISATION
These unconsolidated financial statements were authorised for issue in the Board of Directors' meeting held on January 26, 2017.
105
45.5.4 Mudarib share & HIBA distributed to depositor’s pool and specific pool 2016 Distributable Mudarib Mudarib HIBA HIBA Income Share Share Amount (Rupees in '000) (Percentage) (Rupees in '000) (Percentage)
LCY Pool 963,914 460,681 48% 82,024 18% FCY Pool 3,828 3,554 93% 192 5%
2015
LCY Pool 765,492 382,746 50% 114,730 30% FCY Pool 2,793 2,514 90% 42 2%
MANSOOR ALI KHANChief Executive
ABBAS D. HABIBChairman
SYED MAZHAR ABBASDirector
ANWAR HAJI KARIMDirector
106
1. Amin Textile Mills Mr. Mohamad Rafi Mr. Haji Mohamed Ismail 429,793 52,552 – 482,345 – 53,503 – 53,503 97-B, Gulberg II, Lahore (CNIC: 35202-3244650-5)
Mr. Tariq Rafi Mr. Muhammad Rafi (CNIC: 42301-0838522-7)
Mr. Arif Rafi Mr. Muhammad Rafi (CNIC: 35202-1504108-3)
Mr. Anjum Rafi Mr. Muhammad Rafi (CNIC: 35202-2434949-9)
Mr. Abdullah Rafi Mr. Muhammad Rafi (CNIC: 35200-1416576-7)
2. Nova Medicines (Pvt.) Ltd Mr. Khuzema Mr. Nauman Bhai – 849 – 849 – 849 – 849 406, Panorama Center, (CNIC: 42301-8563204-1) Raja Ghazanfer Ali Road, Saddar, Karachi Ms. Fatema W/o. Mr. Khuzema (CNIC: 42301-0780523-2) 3. Hassan Cotton Ginners Syed Muhammad Safeer Raza Rizvi Syed Mumtaz Hussain Rizvi – 618 172 790 – 618 172 790 Rajanpur Road, Muhamad Pur, (CNIC: 32102-3048111-9) District Rajanpur Syed John Raza Rizvi Syed Zahid Hussain Rizvi (CNIC: 32102-3037661-9)
4. Green City CNG F/S Mr. Abdul Waheed Khan Mr. Abdul Razzaq Khan 120 623 65 808 – 623 65 688 & Kit Conversion Center (CNIC: 36302-2825475-3) Near NBP Bosan Road Branch, Neel Kot Bosan Road, Multan 5. Union Exports (Pvt.) Limited Mr. Muhammad Ibrahim Mr. Abdul Sattar 834,460 – – 834,460 144,017 – – 144,017 D-248 Metroville, SITE, Karachi (CNIC: 42301-8831772-7)
Mr. Suleman Ibrahim Bhura Mr. Ibrahim Abdul Sattar (CNIC: 42301-3388707-9)
6. S. J. Industries Mr. Muhammad Javed Rafi Mr. Sheikh Abdul Haq 20,170 8,828 1,009 30,007 – 8,828 1,009 9,837 7.5-KM, Luddan Road, (CNIC: 35202-9057849-9) Burewala Ms. Shehnaz Javed W/o. Mr. Muhammad Javed Rafi (CNIC: 35202-5172769-2)
7. United Lubricants (Pvt.) Ltd Mr. Gohar Ejaz Mr. Muhammad Ayub 3,983 1,551 228 5,762 – 534 228 762 55-D, Haji Park, Bund Road, (CNIC: 35202-2255457-3) Lahore Ms. Aroona Gohar W/o. Mr. Gohar Ayub (CNIC: 35202-2183211-8)
8. Mr. Rafiq Ahmad Mr. Rafiq Ahmed Mr. Sheikh Atta Ullah 2,155 570 – 2,725 – 570 – 570 House No. 819, Street No. 45, (CNIC: 61101-1886789-7) Sector G-10/4, Islamabad
9. S. Nazim Hussain Shah Syed Nazim Hussain Shah Syed Kazim Hussain Shah 4,539 4,690 – 9,229 – 3,788 – 3,788 House No. IB/216, Muhalla (CNIC: 42000-6577545-5) Gharibabad Near Khawaja Chowk, Nawabshah
Total 1,295,220 70,281 1,474 1,366,975 144,017 69,313 1,474 214,804
Note 1: The amount of principal written off was against the specific provision held by the Bank.Note 2: Interest / mark - up written off was against suspensed mark - up.
Annexure 1
Statement showing written-off loans or any other financial reliefof five hundred thousand rupees or above provided
during the year ended 31 December 2016(Rupees in '000)
Name ofindividuals /partners /
directors (withCNIC No.)
S.No.
Name andaddress
of the borrowers
Father's /Husband's
Name
Outstanding liabilitiesat beginning of year
Principal Interest /Mark-up Others Total
Principalwritten-
off
Interest /Mark-upwritten-
off
Otherfinancial
reliefprovided
Total(9+10+11)
(3) (4) (5) (6) (7) (8) (9) (10) (11) (12)(2)(1)
107
Disclosure on Complaint Handling
Customer Services and Customer Satisfaction are key indicators of performance, and achievement of efficient customer service and high customer satisfaction assures growth and profitability of the Bank.
The Bank has developed a comprehensive Customer Grievances Handling Policy, in line with regulatory requirements, which is based on the principles of fairness, promptness, and customer's right to approach alternate remedial avenues in case of dissatisfaction. A number of channels are available and advised to customers, through which they may register their complaints to Customer Services Division / CEO’s Office. All complaints, including submissions through Website, emails, drop-boxes as well as direct submissions to Customer Services Division / CEO’s Office, are logged in the Complaint Management System and acknowledged. The logged complaints are tracked for end-to-end resolution within regulatory timelines and escalated to senior management, as required. In case a complainant is not satisfied with the resolution provided by the Bank, he may escalate his complaint to Banking Mohtasib Pakistan. This process is informed to customers through Branches and the Website.
During 2016, the Complaint Management System has been enhanced to make the process more effective for the Bank to assure compliance with regulatory guidelines, Extensive training has been arranged for Branches and all key customer centric staff to improve service levels and handling of complaints.
During 2016, the Bank received 47,921 complaints through different channels, out of which almost 99% were investigated and closed within defined standards and regulatory requirements.
108
Report of Shariah Board as at 31 December 2016In the name of Allah, the Beneficent, the Merciful
While the Board of Directors and Executive Management are solely responsible to ensure that the operations of Bank AL Habib – Islamic Banking Division (BAHL-IBD) are conducted in a manner that comply with Shariah principles and guidelines issued by the Shariah Board of the BAHL-IBD at all times. The Shariah Governance Framework issued by the State Bank of Pakistan, required the Shariah Board (SB) to submit a report on the overall Shariah compliance environment of BAHL-IBD.
To form the opinion as expressed in this report, the Shariah Compliance Department carried out Shariah Reviews on test check basis, of each class of transactions, the relevant documentation and process flows. Further, during the last year, Shariah Board have also reviewed Internal Shariah Audit Reports that were provided. Based on above, we are of the view that:
(i) BAHL-IBD has complied with Shariah rules and principles in the light of fatawa, rulings and guidelines issued by its Shariah Board.
(ii) BAHL-IBD has complied with directives, regulations, instructions and guidelines related to Shariah compliance issued by SBP in accordance with the rulings of SBP’s Shariah Board.
(iii) BAHL-IBD has developed the basic mechanism for Shariah compliance in its overall operations and should ensure that Shariah Compliance Department and Shariah Board may carry out their resonsibilities in an effective manner.
(iv) The Shariah Board feels that there is a need to further strengthen the system to make it sound enough to ensure that any impure earnings have been credited to charity account and are being properly utilized.
(v) BAHL-IBD has complied with the SBP instructions on profit and loss distribution and pool management.
(vi) Improvement is required in level of awareness of Islamic finance of the staff, management. Proper training schedule/calendar needs to be developed and organized for each level. However, trainings have been conducted for the new staff along with 3 refreshers for the old staff. The BOD appreciates the importance of Shariah compliance in the products, processes and operations of the BAHL-IBD. The Management also needs to improve their understanding on the importance of Shariah compliance in these areas.
(vii) It is required from the management to arrange adequate resources to Shariah Board enabling them to discharge their duties effectively.
Karachi: January 26, 2017
MUFTI MUHAMMAD SARFARAZ NIHALResident Shariah Board Member
MUFTI MOHIB UL HAQMember Shariah Board
MUFTI ISMATULLAH HAMDULLAHChairman Shariah Board
Notice of Annual General MeetingNotice is hereby given that the Twenty-sixth Annual General Meeting of Bank AL Habib Limited will be held at the Registered Office of the Bank located at 126-C, Old Bahawalpur Road, Multan, on Wednesday, March 1, 2017 at 10:30 a.m. to transact the following business:1. To receive and adopt the Audited Annual Accounts and Consolidated Accounts of the Bank for the
year ended December 31, 2016 together with the Reports of Directors and Auditors thereon.2. To consider and approve payment of cash dividend @ 35%, i.e., Rs. 3.50 per share of Rs. 10/-
each for the year ended December 31, 2016 as recommended by the Board of Directors.3. To appoint auditors for the year 2017 and to fix their remuneration. KPMG Taseer Hadi & Co. Chartered
Accountants, being eligible, offer themselves for re-appointment.4. To consider any other business of the Bank with the permission of the Chair. By order of the Board
MOHAMMAD TAQI LAKHANIKarachi: February 8, 2017 Company Secretary
Notes: 1. The share transfer book of the Bank will remain closed from February 18, 2017 to March 1, 2017
(both days inclusive). Transfers received in order at the office of our Share Registrar, Central Depository Company of Pakistan Ltd, located at CDC House, 99-B, Block B, S.M.C.H.S., Main Shahra-e-Faisal, Karachi – 74400, by the close of business on February 17, 2017 will be treated in time for payment of dividend (subject to approval of the members). Members are requested to promptly communicate any change in their address to our above mentioned Share Registrar.
2. A member entitled to attend and vote at this meeting is entitled to appoint a proxy to attend and vote on his/her behalf. A proxy (except for a corporation) must be a member of the Bank. Proxy form, in order to be effective, must be received at the Registered Office of the Bank located at 126-C, Old Bahawalpur Road, Multan, duly stamped and signed not less than 48 hours before the meeting.
3. The CDC account/sub account holders are requested to bring with them their Computerized National Identity Cards (CNICs)/Passport along with participant(s) ID Number and their account numbers at the time of attending the Annual General Meeting in order to facilitate identification of the respective shareholders. The proxy shall also produce his/her original CNIC or Passport at the time of the meeting. In case of a corporate entity, the Board of Directors’ Resolution/Power of Attorney with specimen signatures shall be submitted along with Proxy Form in the Bank.
4. SECP vide its SRO 831(I) / 2012 dated July 5, 2012, has directed all listed companies that dividend warrant(s) should bear CNIC Number of registered members. Members who have not yet provided attested copies of their valid CNICs/NTNs (in case of corporate entities) are requested to send the same directly to the aforesaid Share Registrar of the Bank before February 18, 2017. In case of non-receipt of CNICs, the Bank will withhold dispatch of dividend warrants of such shareholders.
5. The Government of Pakistan through Finance Act, 2016 has made certain amendments in Section 150 of the Income Tax ordinance, 2001 whereby different rates are prescribed for deduction of withholding tax on the amount of dividend paid by the companies/banks. These tax rates are as follows:
109
Principal Shareholder Joint-Shareholder(s)
Bank Folio/CDC Total Name Shareholding Name Shareholding Name Account Shares and Proportion and Proportion No. CNIC (No. of Shares) CNIC (No. of Shares)
In case the required information is not provided to our Share Registrar latest by February 17, 2017, it will be assumed that the shares are equally held by them.
In case of corporate entity, withholding tax exemption from dividend income shall only be allowed if copy of valid tax exemption certificate is made available to our Share Registrar latest by February 17, 2017.
6. Audited Financial Statements through e-mail:
SECP through its Notification SRO 787 (I)/2014 dated September 8, 2014 has allowed the circulation of Audited Financial Statements along with Notice of Annual General Meeting to the members through e-mail. Therefore, all members of the Bank who wish to receive soft copy of Annual Report are requested to send their e-mail addresses to our Share Registrar through consent form. The said consent form for electronic transmission can be downloaded from the Bank’s website: www.bankalhabib.com. Audited Financial Statements and reports are being placed on the aforesaid website.
7. Consent for video conference facility:
For this Annual General Meeting, under following conditions, Members can also avail video conference facility at Karachi.
If the Bank receives consent from members holding in aggregate 10% or more shareholding residing at a geographical location, to participate in the meeting through video conference at least 10 days prior to date of meeting, the Bank will arrange video conference facility in that city subject to availability of such facility in that city.
The Bank will intimate members regarding venue of video conference facility 5 days before the date of general meeting along with complete information necessary to enable them to access such facility.
(a) For filers of income tax returns 12.5% (b) For non-filers of income tax returns 20.0%
To enable the Bank to make tax deduction on the amount of cash dividend @ 12.5% instead of 20.0% all shareholders whose names are not entered into the Active Tax-payers List (ATL) provided on the website of Federal Board of Revenue (FBR), despite the fact that they are filers, are advised to make sure that their names are entered into ATL before the date of payment of the cash dividend, i.e., March 1, 2017; otherwise tax on their cash dividend will be deducted @20.0% instead of 12.5%.
According to FBR, withholding tax will be determined separately on ‘Filer / Non-Filer’ status of principal shareholder as well as joint-shareholder(s) based on their shareholding proportions, in case of joint accounts. Members that hold shares with joint-shareholder(s) are requested to provide shareholding proportions of principal shareholder and joint-shareholder(s) in respect of shares held by them to the Bank’s Share Registrar in writing in the following format.
110
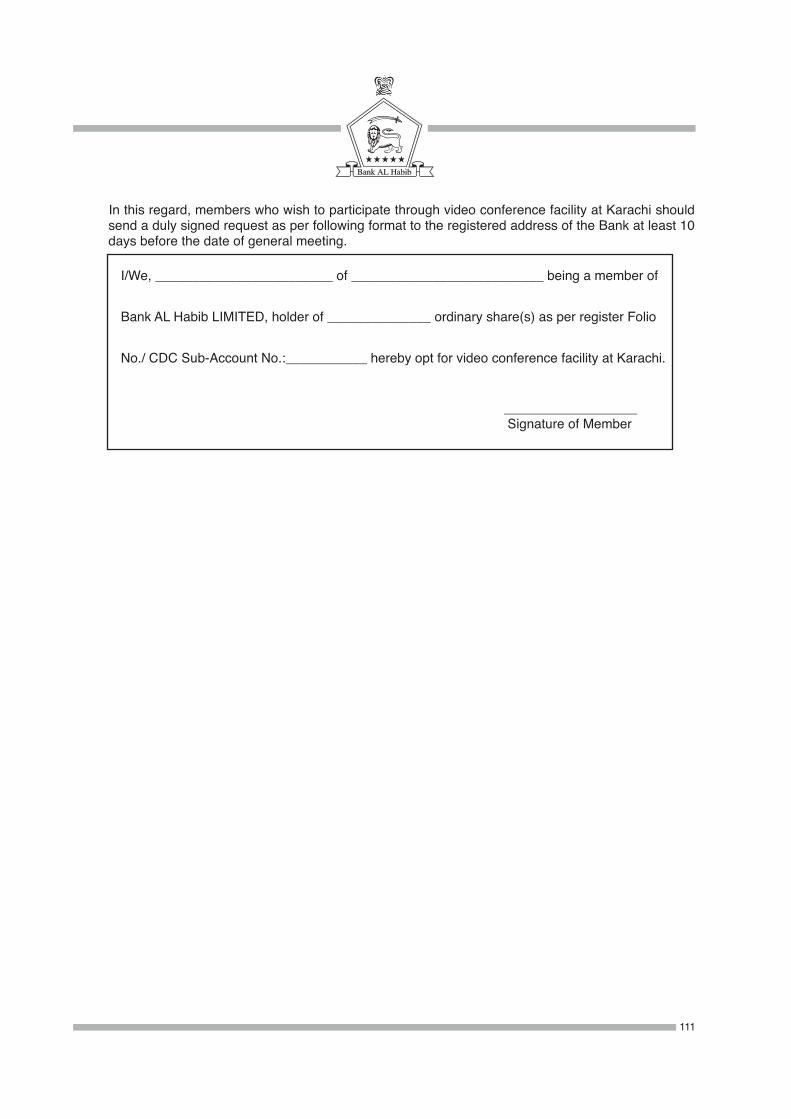
In this regard, members who wish to participate through video conference facility at Karachi should send a duly signed request as per following format to the registered address of the Bank at least 10 days before the date of general meeting.
I/We, ________________________ of __________________________ being a member of
Bank AL Habib LIMITED, holder of ______________ ordinary share(s) as per register Folio
No./ CDC Sub-Account No.:___________ hereby opt for video conference facility at Karachi.
__________________ Signature of Member
111
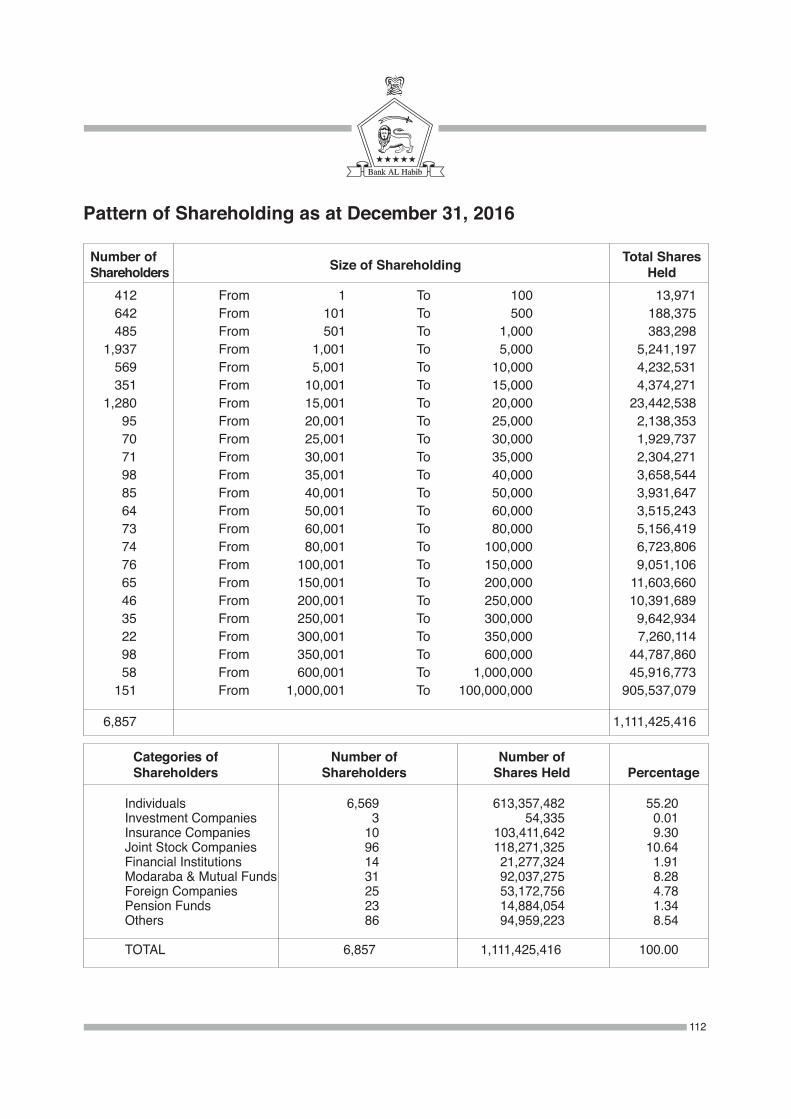
Categories of Number of Number of Shareholders Shareholders Shares Held Percentage
Individuals 6,569 613,357,482 55.20 Investment Companies 3 54,335 0.01 Insurance Companies 10 103,411,642 9.30 Joint Stock Companies 96 118,271,325 10.64 Financial Institutions 14 21,277,324 1.91 Modaraba & Mutual Funds 31 92,037,275 8.28 Foreign Companies 25 53,172,756 4.78 Pension Funds 23 14,884,054 1.34 Others 86 94,959,223 8.54 TOTAL 6,857 1,111,425,416 100.00
Number of Total Shares Shareholders Size of Shareholding Held
412 From 1 To 100 13,971 642 From 101 To 500 188,375 485 From 501 To 1,000 383,298 1,937 From 1,001 To 5,000 5,241,197 569 From 5,001 To 10,000 4,232,531 351 From 10,001 To 15,000 4,374,271 1,280 From 15,001 To 20,000 23,442,538 95 From 20,001 To 25,000 2,138,353 70 From 25,001 To 30,000 1,929,737 71 From 30,001 To 35,000 2,304,271 98 From 35,001 To 40,000 3,658,544 85 From 40,001 To 50,000 3,931,647 64 From 50,001 To 60,000 3,515,243 73 From 60,001 To 80,000 5,156,419 74 From 80,001 To 100,000 6,723,806 76 From 100,001 To 150,000 9,051,106 65 From 150,001 To 200,000 11,603,660 46 From 200,001 To 250,000 10,391,689 35 From 250,001 To 300,000 9,642,934 22 From 300,001 To 350,000 7,260,114 98 From 350,001 To 600,000 44,787,860 58 From 600,001 To 1,000,000 45,916,773 151 From 1,000,001 To 100,000,000 905,537,079
6,857 1,111,425,416
Pattern of Shareholding as at December 31, 2016
112
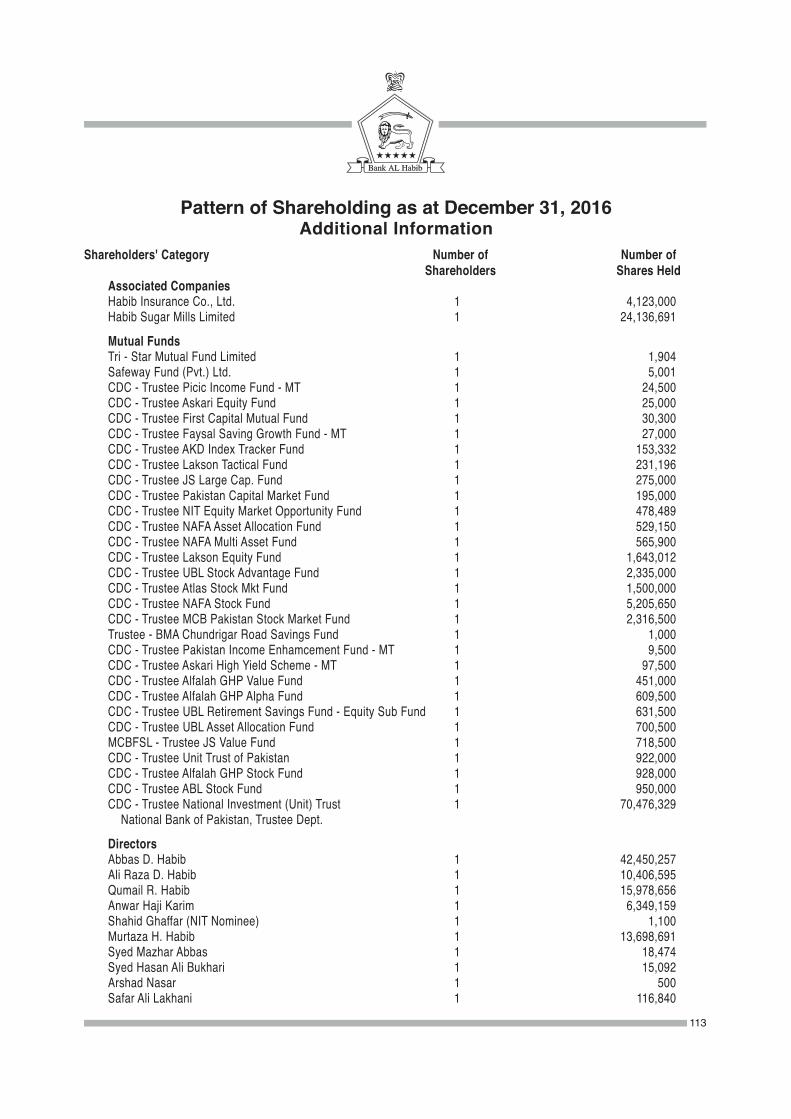
Pattern of Shareholding as at December 31, 2016Additional Information
Shareholders' Category Number of Number of Shareholders Shares Held Associated Companies Habib Insurance Co., Ltd. 1 4,123,000 Habib Sugar Mills Limited 1 24,136,691
Mutual Funds Tri - Star Mutual Fund Limited 1 1,904 Safeway Fund (Pvt.) Ltd. 1 5,001 CDC - Trustee Picic Income Fund - MT 1 24,500 CDC - Trustee Askari Equity Fund 1 25,000 CDC - Trustee First Capital Mutual Fund 1 30,300 CDC - Trustee Faysal Saving Growth Fund - MT 1 27,000 CDC - Trustee AKD Index Tracker Fund 1 153,332 CDC - Trustee Lakson Tactical Fund 1 231,196 CDC - Trustee JS Large Cap. Fund 1 275,000 CDC - Trustee Pakistan Capital Market Fund 1 195,000 CDC - Trustee NIT Equity Market Opportunity Fund 1 478,489 CDC - Trustee NAFA Asset Allocation Fund 1 529,150 CDC - Trustee NAFA Multi Asset Fund 1 565,900 CDC - Trustee Lakson Equity Fund 1 1,643,012 CDC - Trustee UBL Stock Advantage Fund 1 2,335,000 CDC - Trustee Atlas Stock Mkt Fund 1 1,500,000 CDC - Trustee NAFA Stock Fund 1 5,205,650 CDC - Trustee MCB Pakistan Stock Market Fund 1 2,316,500 Trustee - BMA Chundrigar Road Savings Fund 1 1,000 CDC - Trustee Pakistan Income Enhamcement Fund - MT 1 9,500 CDC - Trustee Askari High Yield Scheme - MT 1 97,500 CDC - Trustee Alfalah GHP Value Fund 1 451,000 CDC - Trustee Alfalah GHP Alpha Fund 1 609,500 CDC - Trustee UBL Retirement Savings Fund - Equity Sub Fund 1 631,500 CDC - Trustee UBL Asset Allocation Fund 1 700,500 MCBFSL - Trustee JS Value Fund 1 718,500 CDC - Trustee Unit Trust of Pakistan 1 922,000 CDC - Trustee Alfalah GHP Stock Fund 1 928,000 CDC - Trustee ABL Stock Fund 1 950,000 CDC - Trustee National Investment (Unit) Trust 1 70,476,329 National Bank of Pakistan, Trustee Dept.
Directors Abbas D. Habib 1 42,450,257 Ali Raza D. Habib 1 10,406,595 Qumail R. Habib 1 15,978,656 Anwar Haji Karim 1 6,349,159 Shahid Ghaffar (NIT Nominee) 1 1,100 Murtaza H. Habib 1 13,698,691 Syed Mazhar Abbas 1 18,474 Syed Hasan Ali Bukhari 1 15,092 Arshad Nasar 1 500 Safar Ali Lakhani 1 116,840
113
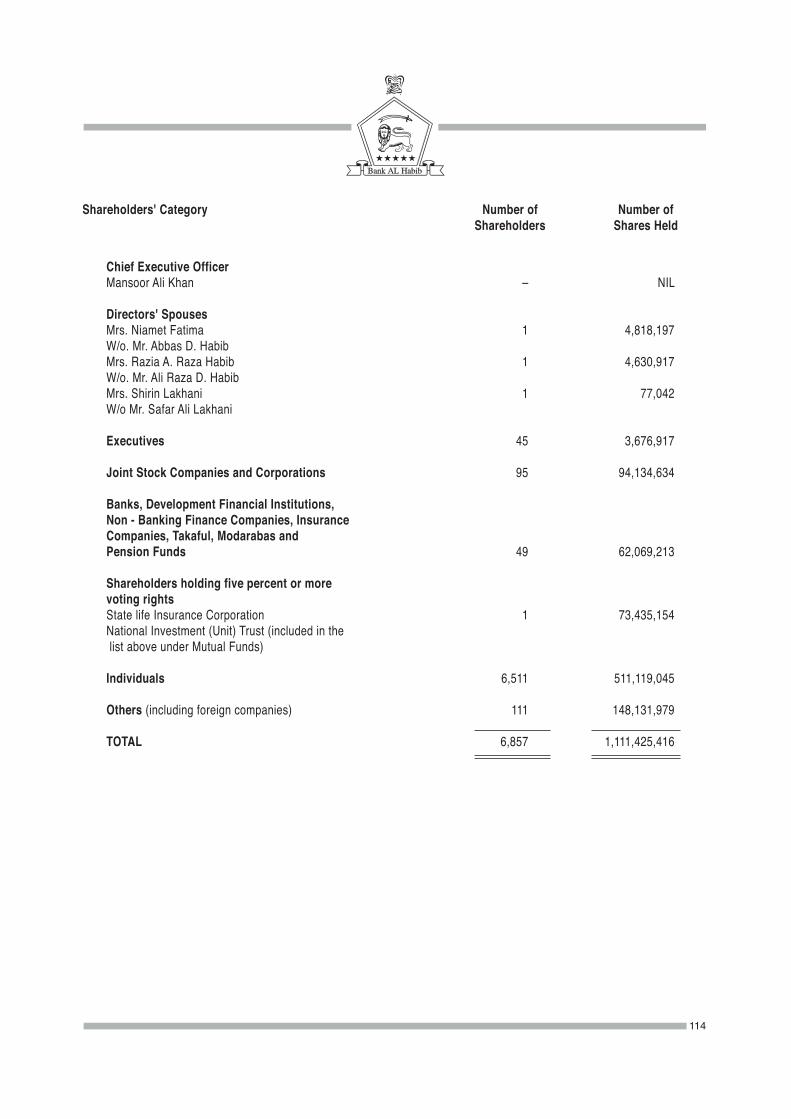
Shareholders' Category Number of Number of Shareholders Shares Held
Chief Executive Officer Mansoor Ali Khan – NIL
Directors' Spouses Mrs. Niamet Fatima 1 4,818,197 W/o. Mr. Abbas D. Habib Mrs. Razia A. Raza Habib 1 4,630,917 W/o. Mr. Ali Raza D. Habib Mrs. Shirin Lakhani 1 77,042 W/o Mr. Safar Ali Lakhani
Executives 45 3,676,917 Joint Stock Companies and Corporations 95 94,134,634
Banks, Development Financial Institutions, Non - Banking Finance Companies, Insurance Companies, Takaful, Modarabas and Pension Funds 49 62,069,213
Shareholders holding five percent or more voting rights State life Insurance Corporation 1 73,435,154 National Investment (Unit) Trust (included in the list above under Mutual Funds)
Individuals 6,511 511,119,045 Others (including foreign companies) 111 148,131,979
TOTAL 6,857 1,111,425,416
114
115
Bank AL Habib Limited
and
Subsidiary Companies
Consolidated Financial Statements
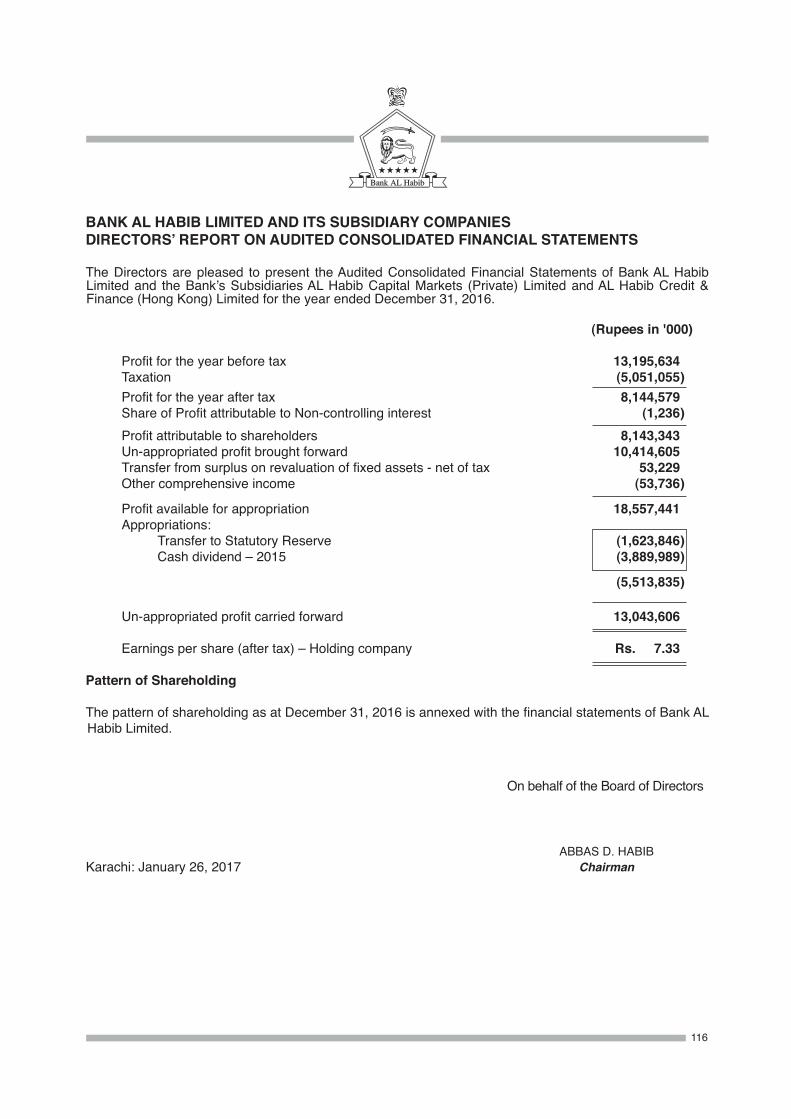
BANK AL HABIB LIMITED AND ITS SUBSIDIARY COMPANIES DIRECTORS’ REPORT ON AUDITED CONSOLIDATED FINANCIAL STATEMENTS
The Directors are pleased to present the Audited Consolidated Financial Statements of Bank AL Habib Limited and the Bank’s Subsidiaries AL Habib Capital Markets (Private) Limited and AL Habib Credit & Finance (Hong Kong) Limited for the year ended December 31, 2016.
(Rupees in '000)
Profit for the year before tax 13,195,634 Taxation (5,051,055 ) Profit for the year after tax 8,144,579 Share of Profit attributable to Non-controlling interest (1,236 ) Profit attributable to shareholders 8,143,343 Un-appropriated profit brought forward 10,414,605 Transfer from surplus on revaluation of fixed assets - net of tax 53,229 Other comprehensive income (53,736 )
Profit available for appropriation 18,557,441 Appropriations: Transfer to Statutory Reserve (1,623,846 ) Cash dividend – 2015 (3,889,989 )
(5,513,835 )
Un-appropriated profit carried forward 13,043,606 Earnings per share (after tax) – Holding company Rs. 7.33
Pattern of Shareholding
The pattern of shareholding as at December 31, 2016 is annexed with the financial statements of Bank AL Habib Limited.
On behalf of the Board of Directors
ABBAS D. HABIBKarachi: January 26, 2017 Chairman
116
AUDITORS' REPORT TO THE MEMBERS
We have audited the annexed consolidated financial statements comprising consolidated statement of financial position of Bank AL Habib Limited and its subsidiary companies as at 31 December 2016 and the related consolidated profit and loss account, consolidated statement of comprehensive income, consolidated cash flow statement and consolidated statement of changes in equity together with the notes forming part thereof, for the year then ended. We have also expressed separate opinions on the financial statements of Bank AL Habib Limited and its subsidiary company namely AL Habib Capital Markets (Private) Limited except for AL Habib Credit & Finance (Hong Kong) Limited which were audited by other firm of auditors whose report has been furnished to us and our opinion, in so far as it relates to the amounts included for such company, is based solely on the report of such other auditors. These financial statements are responsibility of the Holding Company’s management. Our responsibility is to express an opinion on these financial statements based on our audit.
Our audit was conducted in accordance with the International Standards on Auditing and accordingly included such tests of accounting records and such other auditing procedures as we considered necessary in the circumstances.
In our opinion, the consolidated financial statements present fairly the financial position of Bank AL Habib Limited and its subsidiary companies as at 31 December 2016 and the results of their operations for the year then ended.
KPMG Taseer Hadi & Co. Karachi: January 26, 2017 Chartered Accountants Muhammad Taufiq
117
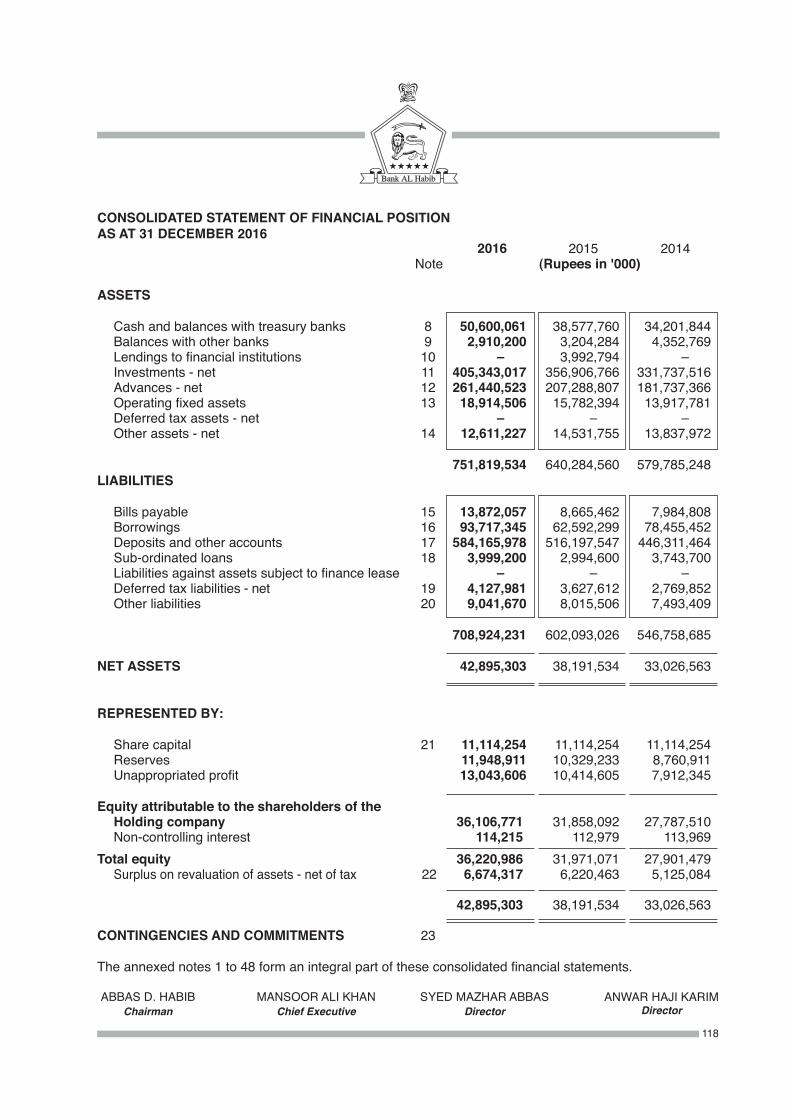
CONSOLIDATED STATEMENT OF FINANCIAL POSITIONAS AT 31 DECEMBER 2016 2016 2015 2014 Note (Rupees in '000)
ASSETS Cash and balances with treasury banks 8 50,600,061 38,577,760 34,201,844 Balances with other banks 9 2,910,200 3,204,284 4,352,769 Lendings to financial institutions 10 –000 3,992,794 –000 Investments - net 11 405,343,017 356,906,766 331,737,516 Advances - net 12 261,440,523 207,288,807 181,737,366 Operating fixed assets 13 18,914,506 15,782,394 13,917,781 Deferred tax assets - net –000 –000 –000 Other assets - net 14 12,611,227 14,531,755 13,837,972
751,819,534 640,284,560 579,785,248LIABILITIES
Bills payable 15 13,872,057 8,665,462 7,984,808 Borrowings 16 93,717,345 62,592,299 78,455,452 Deposits and other accounts 17 584,165,978 516,197,547 446,311,464 Sub-ordinated loans 18 3,999,200 2,994,600 3,743,700 Liabilities against assets subject to finance lease –000 –000 –000 Deferred tax liabilities - net 19 4,127,981 3,627,612 2,769,852 Other liabilities 20 9,041,670 8,015,506 7,493,409
708,924,231 602,093,026 546,758,685
NET ASSETS 42,895,303 38,191,534 33,026,563
REPRESENTED BY:
Share capital 21 11,114,254 11,114,254 11,114,254 Reserves 11,948,911 10,329,233 8,760,911 Unappropriated profit 13,043,606 10,414,605 7,912,345
Equity attributable to the shareholders of the Holding company 36,106,771 31,858,092 27,787,510 Non-controlling interest 114,215 112,979 113,969Total equity 36,220,986 31,971,071 27,901,479 Surplus on revaluation of assets - net of tax 22 6,674,317 6,220,463 5,125,084
42,895,303 38,191,534 33,026,563
CONTINGENCIES AND COMMITMENTS 23
The annexed notes 1 to 48 form an integral part of these consolidated financial statements.
MANSOOR ALI KHANChief Executive
ABBAS D. HABIBChairman
SYED MAZHAR ABBASDirector
ANWAR HAJI KARIMDirector
118
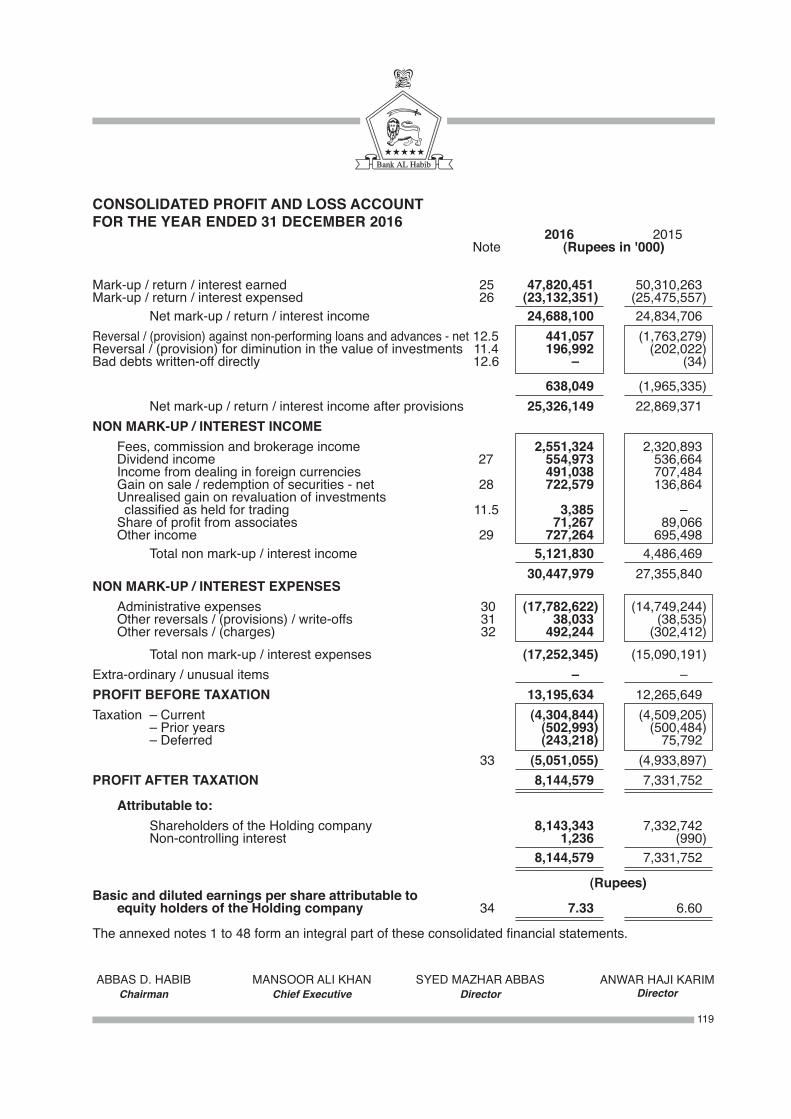
CONSOLIDATED PROFIT AND LOSS ACCOUNTFOR THE YEAR ENDED 31 DECEMBER 2016 2016 2015 Note (Rupees in '000) Mark-up / return / interest earned 25 47,820,451 50,310,263Mark-up / return / interest expensed 26 (23,132,351 ) (25,475,557 ) Net mark-up / return / interest income 24,688,100 24,834,706Reversal / (provision) against non-performing loans and advances - net 12.5 441,057 (1,763,279 )Reversal / (provision) for diminution in the value of investments 11.4 196,992 (202,022 )Bad debts written-off directly 12.6 –00 (34 )
638,049 (1,965,335 ) Net mark-up / return / interest income after provisions 25,326,149 22,869,371NON MARK-UP / INTEREST INCOME Fees, commission and brokerage income 2,551,324 2,320,893 Dividend income 27 554,973 536,664 Income from dealing in foreign currencies 491,038 707,484 Gain on sale / redemption of securities - net 28 722,579 136,864 Unrealised gain on revaluation of investments classified as held for trading 11.5 3,385 –00 Share of profit from associates 71,267 89,066 Other income 29 727,264 695,498 Total non mark-up / interest income 5,121,830 4,486,469 30,447,979 27,355,840NON MARK-UP / INTEREST EXPENSES Administrative expenses 30 (17,782,622 ) (14,749,244 ) Other reversals / (provisions) / write-offs 31 38,033 (38,535 ) Other reversals / (charges) 32 492,244 (302,412 ) Total non mark-up / interest expenses (17,252,345 ) (15,090,191 )Extra-ordinary / unusual items –00 –00PROFIT BEFORE TAXATION 13,195,634 12,265,649Taxation – Current (4,304,844 ) (4,509,205 ) – Prior years (502,993 ) (500,484 ) – Deferred (243,218 ) 75,792 33 (5,051,055 ) (4,933,897 )PROFIT AFTER TAXATION 8,144,579 7,331,752
Attributable to: Shareholders of the Holding company 8,143,343 7,332,742 Non-controlling interest 1,236 (990 ) 8,144,579 7,331,752
(Rupees)Basic and diluted earnings per share attributable to equity holders of the Holding company 34 7.33 6.60
The annexed notes 1 to 48 form an integral part of these consolidated financial statements.
MANSOOR ALI KHANChief Executive
ABBAS D. HABIBChairman
SYED MAZHAR ABBASDirector
ANWAR HAJI KARIMDirector
119
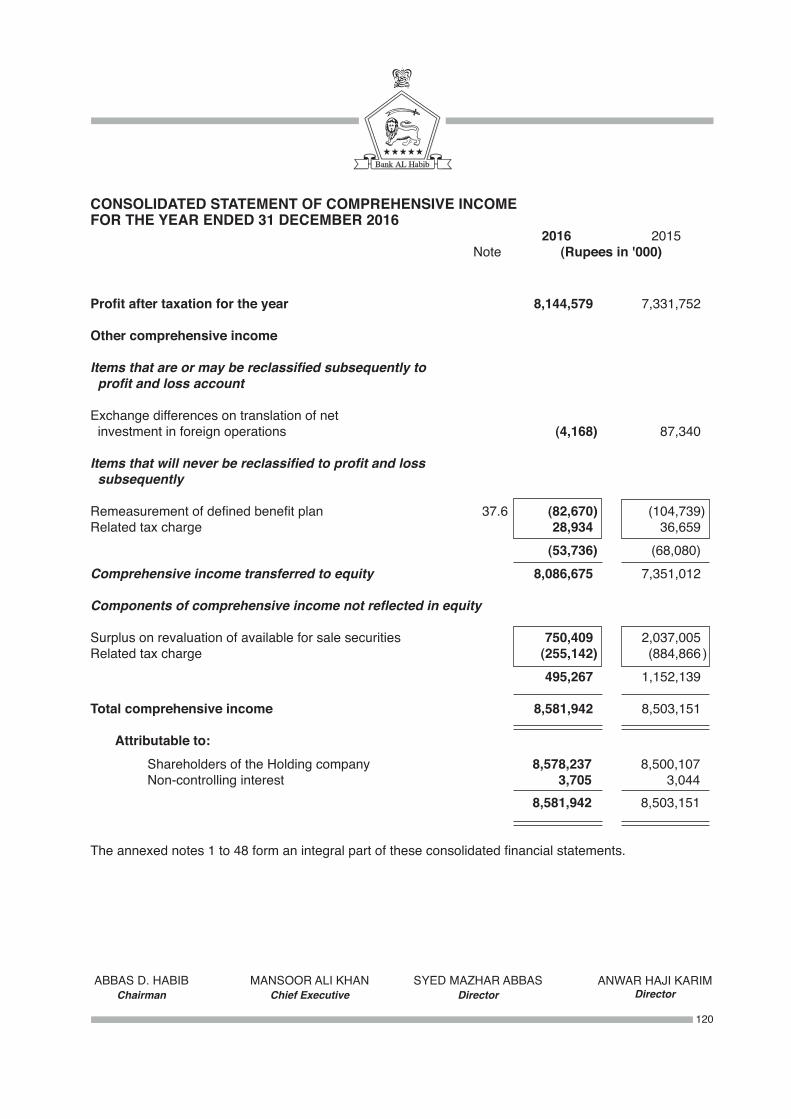
CONSOLIDATED STATEMENT OF COMPREHENSIVE INCOMEFOR THE YEAR ENDED 31 DECEMBER 2016 2016 2015 Note (Rupees in '000)
Profit after taxation for the year 8,144,579 7,331,752
Other comprehensive income
Items that are or may be reclassified subsequently to profit and loss account
Exchange differences on translation of net investment in foreign operations (4,168 ) 87,340
Items that will never be reclassified to profit and loss subsequently
Remeasurement of defined benefit plan 37.6 (82,670 ) (104,739 )Related tax charge 28,934 36,659 (53,736 ) (68,080)Comprehensive income transferred to equity 8,086,675 7,351,012
Components of comprehensive income not reflected in equity
Surplus on revaluation of available for sale securities 750,409 2,037,005Related tax charge (255,142 ) (884,866 ) 495,267 1,152,139
Total comprehensive income 8,581,942 8,503,151
Attributable to: Shareholders of the Holding company 8,578,237 8,500,107 Non-controlling interest 3,705 3,044 8,581,942 8,503,151
The annexed notes 1 to 48 form an integral part of these consolidated financial statements.
MANSOOR ALI KHANChief Executive
ABBAS D. HABIBChairman
SYED MAZHAR ABBASDirector
ANWAR HAJI KARIMDirector
120
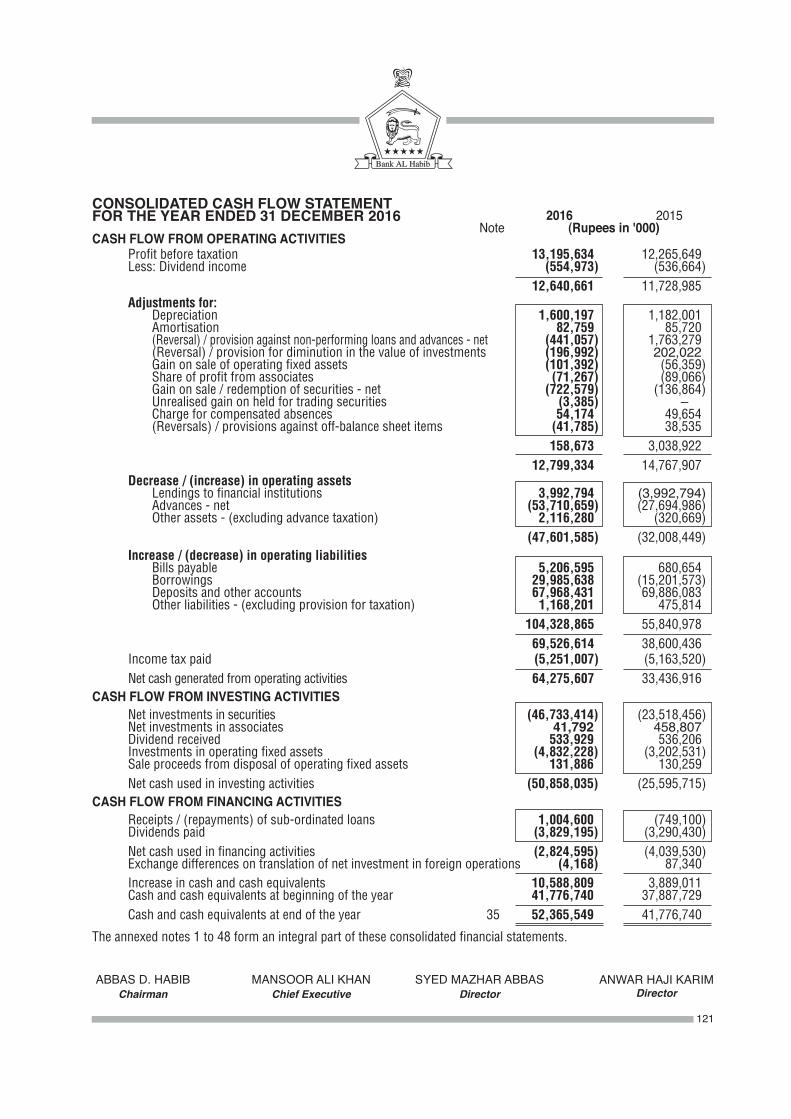
CONSOLIDATED CASH FLOW STATEMENTFOR THE YEAR ENDED 31 DECEMBER 2016 2016 2015 Note (Rupees in '000)CASH FLOW FROM OPERATING ACTIVITIES Profit before taxation 13,195,634 12,265,649 Less: Dividend income (554,973 ) (536,664 ) 12,640,661 11,728,985 Adjustments for: Depreciation 1,600,197 1,182,001 Amortisation 82,759 85,720 (Reversal) / provision against non-performing loans and advances - net (441,057 ) 1,763,279 (Reversal) / provision for diminution in the value of investments (196,992 ) 202,022 Gain on sale of operating fixed assets (101,392 ) (56,359 ) Share of profit from associates (71,267 ) (89,066 ) Gain on sale / redemption of securities - net (722,579 ) (136,864 ) Unrealised gain on held for trading securities (3,385 ) –00 Charge for compensated absences 54,174 49,654 (Reversals) / provisions against off-balance sheet items (41,785 ) 38,535 158,673 3,038,922 12,799,334 14,767,907 Decrease / (increase) in operating assets Lendings to financial institutions 3,992,794 (3,992,794 ) Advances - net (53,710,659 ) (27,694,986 ) Other assets - (excluding advance taxation) 2,116,280 (320,669 ) (47,601,585 ) (32,008,449 ) Increase / (decrease) in operating liabilities Bills payable 5,206,595 680,654 Borrowings 29,985,638 (15,201,573 ) Deposits and other accounts 67,968,431 69,886,083 Other liabilities - (excluding provision for taxation) 1,168,201 475,814 104,328,865 55,840,978 69,526,614 38,600,436 Income tax paid (5,251,007 ) (5,163,520 ) Net cash generated from operating activities 64,275,607 33,436,916CASH FLOW FROM INVESTING ACTIVITIES Net investments in securities (46,733,414 ) (23,518,456 ) Net investments in associates 41,792 458,807 Dividend received 533,929 536,206 Investments in operating fixed assets (4,832,228 ) (3,202,531 ) Sale proceeds from disposal of operating fixed assets 131,886 130,259 Net cash used in investing activities (50,858,035 ) (25,595,715 )CASH FLOW FROM FINANCING ACTIVITIES Receipts / (repayments) of sub-ordinated loans 1,004,600 (749,100 ) Dividends paid (3,829,195 ) (3,290,430 ) Net cash used in financing activities (2,824,595 ) (4,039,530 ) Exchange differences on translation of net investment in foreign operations (4,168 ) 87,340 Increase in cash and cash equivalents 10,588,809 3,889,011 Cash and cash equivalents at beginning of the year 41,776,740 37,887,729 Cash and cash equivalents at end of the year 35 52,365,549 41,776,740
The annexed notes 1 to 48 form an integral part of these consolidated financial statements.
MANSOOR ALI KHANChief Executive
ABBAS D. HABIBChairman
SYED MAZHAR ABBASDirector
ANWAR HAJI KARIMDirector
121
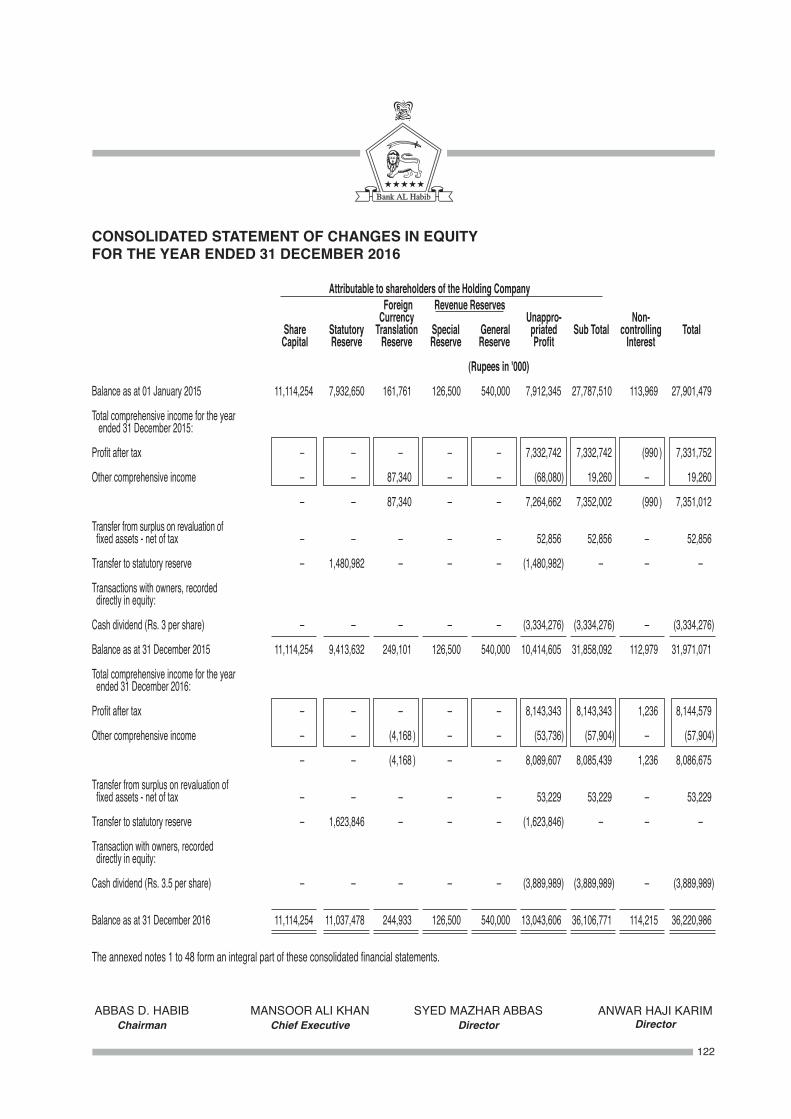
122
CONSOLIDATED STATEMENT OF CHANGES IN EQUITYFOR THE YEAR ENDED 31 DECEMBER 2016
Attributable to shareholders of the Holding Company Foreign Revenue Reserves Currency Unappro- Non- Share Statutory Translation Special General priated Sub Total controlling Total Capital Reserve Reserve Reserve Reserve Profit Interest (Rupees in '000) Balance as at 01 January 2015 11,114,254 7,932,650 161,761 126,500 540,000 7,912,345 27,787,510 113,969 27,901,479
Total comprehensive income for the year ended 31 December 2015:
Profit after tax –00 –00 –00 –00 –00 7,332,742 7,332,742 (990 ) 7,331,752
Other comprehensive income –00 –00 87,340 –00 –00 (68,080 ) 19,260 –00 19,260
–00 –00 87,340 –00 –00 7,264,662 7,352,002 (990 ) 7,351,012
Transfer from surplus on revaluation of fixed assets - net of tax –00 –00 –00 –00 –00 52,856 52,856 –00 52,856
Transfer to statutory reserve –00 1,480,982 –00 –00 –00 (1,480,982 ) –00 –00 –00
Transactions with owners, recorded directly in equity:
Cash dividend (Rs. 3 per share) –00 –00 –00 –00 –00 (3,334,276 ) (3,334,276 ) –00 (3,334,276 )
Balance as at 31 December 2015 11,114,254 9,413,632 249,101 126,500 540,000 10,414,605 31,858,092 112,979 31,971,071
Total comprehensive income for the year ended 31 December 2016:
Profit after tax –00 –00 –00 –00 –00 8,143,343 8,143,343 1,236 8,144,579
Other comprehensive income –00 –00 (4,168 ) –00 –00 (53,736 ) (57,904 ) –00 (57,904 )
–00 –00 (4,168 ) –00 –00 8,089,607 8,085,439 1,236 8,086,675
Transfer from surplus on revaluation of fixed assets - net of tax –00 –00 –00 –00 –00 53,229 53,229 –00 53,229
Transfer to statutory reserve –00 1,623,846 –00 –00 –00 (1,623,846 ) –00 –00 –00
Transaction with owners, recorded directly in equity:
Cash dividend (Rs. 3.5 per share) –00 –00 –00 –00 –00 (3,889,989 ) (3,889,989 ) –00 (3,889,989 )
Balance as at 31 December 2016 11,114,254 11,037,478 244,933 126,500 540,000 13,043,606 36,106,771 114,215 36,220,986
The annexed notes 1 to 48 form an integral part of these consolidated financial statements.
MANSOOR ALI KHANChief Executive
ABBAS D. HABIBChairman
SYED MAZHAR ABBASDirector
ANWAR HAJI KARIMDirector
NOTES TO THE CONSOLIDATED FINANCIAL STATEMENTSFOR THE YEAR ENDED 31 DECEMBER 20161. STATUS AND NATURE OF BUSINESS1.1 The Group comprises of: Holding company - Bank AL Habib Limited Subsidiaries - AL Habib Capital Markets (Private) Limited - AL Habib Credit & Finance (Hong Kong) Limited1.2 Bank AL Habib Limited (the Bank) is a banking company incorporated in Pakistan on 15 October
1991 as a public limited company under the Companies Ordinance, 1984 having its registered office at 126-C, Old Bahawalpur Road, Multan with principal place of business in Karachi. Its shares are listed on Pakistan Stock Exchange Limited. It is a scheduled bank principally engaged in the business of commercial banking with a network of 518 branches (2015: 423 branches), 87
sub- branches (2015: 105 sub - branches) and 03 representative offices (2015: 03 representative offices). The branch network of the Bank includes 03 overseas branches (2015: 03 overseas branches) and 41 Islamic Banking branches (2015: 29 Islamic Banking branches).
1.3 The Bank has invested in 66.67% shares of AL Habib Capital Markets (Private) Limited. The Company was incorporated in Pakistan on 23 August 2005 as a private limited company under the Companies Ordinance,1984. The company is a corporate member of the Pakistan Stock Exchange Limited and is engaged in equity, money market and foreign exchange brokerage services, equity research, corporate financial advisory and consultancy services.
1.4 AL Habib Credit & Finance (Hong Kong) Limited is a wholly owned subsidiary of the Bank. It is a limited liability company incorporated and domiciled in Hong Kong. The Company has not commenced operations and is in the process of obtaining a Deposit Taking Companies license from the Hong Kong Monetary Authority.
2. BASIS OF PRESENTATION2.1 These consolidated financial statements have been prepared in conformity with the format of
financial statements prescribed by the State Bank of Pakistan (SBP) vide BSD Circular No. 04, dated 17 February 2006.
2.2 In accordance with the directives of the Federal Government regarding the shifting of the banking system to Islamic modes, SBP has issued various circulars from time to time. Permissible forms of trade - related modes of financing includes purchase of goods by banks from customers and immediate resale to them at appropriate mark - up in price on deferred payment basis. The purchase and resale arising under these arrangements are not reflected in these consolidated financial statements as such, but are restricted to the amount of facility actually utilised and the appropriate portion of mark - up thereon. However, the Islamic Banking branches of the Bank have complied with the requirements set out under the Islamic Financial Accounting Standards (IFAS).
2.3 The financial results of the Islamic Banking branches have been consolidated in these consolidated financial statements for reporting purposes, after eliminating material inter - branch transactions / balances. Key financial information of the Islamic Banking branches is disclosed in note 45.
3. STATEMENT OF COMPLIANCE3.1 These consolidated financial statements of the Group have been prepared in accordance with
approved accounting standards as applicable in Pakistan. Approved accounting standards comprise International Financial Reporting Standards (IFRS) issued by the International Accounting Standards Board (IASB) and IFAS issued by the Institute of Chartered Accountants of Pakistan (ICAP) as are notified under the Companies Ordinance, 1984, the requirements of the Companies Ordinance, 1984, the Banking Companies Ordinance, 1962 and regulations / directives issued by the Securities and Exchange Commission of Pakistan (SECP) and SBP. Wherever the requirements of the Companies Ordinance, 1984, the Banking Companies Ordinance, 1962 or regulations / directives issued by SECP and SBP differ with the requirements of IFRS or IFAS, the requirements of the Companies Ordinance, 1984, the Banking Companies Ordinance, 1962 or the requirements of the said regulations / directives shall prevail.
123
3.2 SBP vide BSD Circular No. 10, dated 26 August 2002 has deferred the applicability of International Accounting Standard (IAS) 39, "Financial Instruments: Recognition and Measurement" and IAS 40, "Investment Property" for banking companies till further instructions. Further, according to the notification of SECP dated 28 April 2008, IFRS - 7 "Financial Instruments: Disclosures" has not been made applicable for banks. Accordingly, the requirements of these standards have not been considered in the preparation of these consolidated financial statements. However, investments have been classified and valued in accordance with the requirements of various circulars issued by SBP.
4. BASIS OF MEASUREMENT These consolidated financial statements have been prepared under the historical cost convention
except for non - banking assets acquired in satisfaction of claims, certain investments, land and buildings and derivative financial instruments which are revalued as referred to in notes 5.1.1, 5.5, 5.7, 5.15 and 5.16.
5. SIGNIFICANT ACCOUNTING POLICIES5.1 The accounting policies adopted in the preparation of these consolidated financial statements are
consistent with those of the previous financial year, except for certain standards, which became effective during the year. However, they did not have material effect on these consolidated financial statements of the Group.
5.1.1 Change in accounting policy Effective 1 January 2016, the Bank has changed its accounting policy for recording of non - banking
assets acquired in satisfaction of claims to comply with the requirements of the 'Regulations for Debt Property Swap' (the regulations) issued by SBP vide its BPRD Circular No. 1 of 2016, dated 1 January 2016. In line with the guidance provided in the Regulations, the non - banking assets acquired in satisfaction of claims are carried at revalued amounts less accumulated depreciation. These assets are revalued by professionally qualified valuers to ensure that their net carrying value does not differ materially from their fair value. A surplus arising on revaluation of property is credited to the 'surplus on revaluation of fixed assets' account and any deficit arising on revaluation is taken to profit and loss account directly. Legal fees, transfer costs and direct costs of acquiring title to property is charged to profit and loss account and not capitalised. Previously, non - banking assets acquired in satisfaction of claims were carried at cost less impairment, if any. Had the accounting policy not been changed, non - banking assets (included in Other Assets in the statement of financial position), surplus on revaluation of assets and deferred tax liability - net would have been lowered by Rs. 8.101 million, Rs. 11.443 million and Rs. 1.808 million respectively while profit after tax would have been higher by Rs. 3.721 million.
5.2 Basis of consolidation These consolidated financial statements include the financial statements of the Holding Company
and its subsidiaries.
The financial statements of the subsidiaries are included in the consolidated financial statements from the date the control commences until the date the control ceases. In preparing consolidated financial statements, the financial statements of the Holding company and subsidiaries are consolidated on a line by line basis by adding together like items of assets, liabilities, income and expenses. Significant inter - company transaction have been eliminated.
Non - controlling interest are part of results of operations and net assets of the subsidiary company attributable to interests which are not owned by the Group. Interest in the equity of the subsidiary not attributable to the Holding Company is reported in the consolidated statement of changes in equity as non - controlling interest. Profit or loss attributable to non - controlling interest is reported in the consolidated profit and loss account as profit or loss attributable to non - controlling interest.
124
5.3 Cash and cash equivalents Cash and cash equivalents as referred to in the consolidated cash flow statement comprise cash
and balances with treasury banks and balances with other banks less overdrawn nostros accounts.5.4 Repurchase / resale agreements The Bank enters into transactions of repos and reverse repos at contracted rates for a specified
period of time. These are recorded as under: Sale under repurchase obligation Securities sold with a simultaneous commitment to repurchase at a specified future date (repos)
continue to be recognised in the statement of financial position and are measured in accordance with accounting policies for investments. Amounts received under these agreements are recorded as repurchase agreement borrowings. The difference between sale and repurchase price is amortised as expense over the term of the repo agreement.
Purchase under resale obligation Securities purchased with a corresponding commitment to resell at a specified future date (reverse
repos) are not recognised as investments in the statement of financial position. Amounts paid under these arrangements are included in repurchase agreement lendings. The difference between purchase and resale price is accrued as income over the term of the reverse repo agreement.
5.5 Investments Investments (other than associates) are classified as follows: Held for trading These are investments acquired principally for the purpose of generating profits from short - term
fluctuations in price or dealer’s margin or are securities included in a portfolio in which a pattern of short - term trading exists.
Held to maturity These are investments with fixed or determinable payments and fixed maturities which the Group
has the intention and ability to hold till maturity. In Bai Muajjal, the Bank sells sukuk on credit to Government of Pakistan. The credit price is agreed
at the time of sale and such proceeds are received at the end of the credit period. Available for sale These are investments which do not fall under the held for trading and held to maturity categories. All purchases and sales of investments that require delivery within the time frame established by
regulations or market convention are recognised at the trade date. Trade date is the date on which the Group commits to purchase or sell the investments.
Investments (other than held for trading) are initially measured at fair value plus transaction cost associated with the investment. Investments classified as held for trading are initially measured at fair value, and transaction costs are expensed in the profit and loss account.
After initial recognition, quoted securities, other than those classified as held to maturity, are carried at market value. Unquoted securities are valued at cost less impairment in value, if any. Held to maturity securities are carried at amortised cost.
Surplus / (deficit) arising on revaluation of quoted securities which are classified as available for sale investments is taken to a separate account which is shown in the statement of financial position below equity. The surplus / (deficit) arising on these securities is taken to the profit and loss account when actually realised upon disposal or in case of impairment of securities. The unrealised surplus / (deficit) arising on revaluation of quoted securities which are classified as held for trading is taken to the profit and loss account.
125
Provision for diminution in the values of securities (except for debt securities) is made after considering impairment, if any, in their value and is taken to profit and loss account. Impairment is booked when there is an objective evidence of significant or prolonged decline in the value of such securities. Provision for impairment against debt securities is made in accordance with the requirements of the Prudential Regulations of SBP. In case of unquoted equity securities, the breakup value of the security should be considered to determine impairment amount.
Premium or discount on debt securities classified as available for sale and held to maturity is amortised using effective interest method and taken to the profit and loss account.
Investments in associates Investment in associates is accounted by using equity method of accounting.5.6 Advances Loans and advances These are stated net of provisions for non - performing advances. Provision for non - performing
advances is determined in accordance with the requirements of the Prudential Regulations and is charged to the profit and loss account. The Bank also maintains general provision in addition to the requirements of the Prudential Regulations on the basis of the management's risk assessment. Advances are written - off when there are no realistic prospects of recovery.
Finance lease receivables Leases where the Bank transfers substantially all the risks and rewards incidental to ownership of
an asset to the lessee are classified as finance leases. A receivable is recognised at an amount equal to the present value of the lease payments including any guaranteed residual value.
Ijarah finance In accordance with the requirements of IFAS 2 'Ijarah', assets leased out under ijarah arrangements
on or after 01 January 2009 are stated at cost less depreciation and impairment, if any, and included under "Advances". Such assets are depreciated over the terms of ijarah contracts. Ijarah arrangements executed before the above referred date are accounted for as finance lease.
Murabaha Funds disbursed under murabaha arrangements for purchase of goods are recorded as advance for
murabaha. On culmination of murabaha i.e. sale of goods to customers, murabaha receivables are recorded at the sale price net of deferred income. Goods purchased but remaining unsold at the reporting date are recorded as inventories.
Istisna In Istisna financing, the Bank places an order to purchase some specific goods / commodities from
its customers to be delivered to the Bank within an agreed time. The goods are then sold and the amount hence financed is paid back to the Bank.
Diminishing Musharaka In Diminishing Musharaka financing, the Bank enters into Musharaka based on Shirkat - ul - milk for
financing an agreed share of fixed asset (e.g. house, land, plant or machinery) with its customers and enters into periodic rental payment agreement for the utilisation of the Bank’s Musharaka share by the customer. The customer purchases the Bank’s share gradually as per his undertaking.
Musawama In Musawama financing, the Bank purchases specific goods / commodities on cash basis from its
customer for onward sale. Upon realisation of sale proceeds, the finance is adjusted.
126
5.7 Operating fixed assets Tangible operating assets - owned Land is measured at cost at the time of initial recognition and is subsequently carried at revalued
amount. Buildings are initially measured at cost and upon revaluation, are carried at revalued amount less accumulated depreciation and impairment, if any. All other operating fixed assets are stated at cost less accumulated depreciation and impairment, if any. Depreciation is charged to profit and loss account on straight line basis so as to charge the assets over their expected useful lives at the rates specified in note 13.2. The depreciation charge is calculated after taking into account residual value, if any. The residual values, useful lives and depreciation method are reviewed annually and adjusted, if appropriate. Depreciation is charged on prorata basis, i.e., full month charge in the month of purchase and no charge in the month of disposal.
Land and buildings are revalued by independent professionally qualified valuers with sufficient regularity to ensure that the net carrying amount does not differ materially from the fair value. The surplus arising on revaluation of fixed assets is credited to the “surplus on revaluation of assets" account shown below equity. The Group has adopted the following accounting treatment of depreciation on revalued assets, keeping in view the requirements of the Companies Ordinance, 1984 and SECP's SRO 45(1) / 2003 dated 13 January 2003:
- depreciation on assets which are revalued is determined with reference to the value assigned to such assets on revaluation and depreciation charge for the year is taken to the profit and loss account; and
- an amount equal to incremental depreciation for the year net of deferred taxation is transferred from surplus on revaluation of assets to unappropriated profit through statement of changes in equity to record realisation of surplus to the extent of the incremental depreciation charge for the year.
Subsequent costs are included in the asset’s carrying amount or recognised as a separate asset, as appropriate, only when it is probable that future economic benefits associated with the item will flow to the Group and the cost of the item can be measured reliably. The carrying amount of the replaced part is derecognised. All other repairs and maintenance are charged to the income statement during the financial period in which they are incurred.
Gains and losses on disposal of fixed assets are included in income currently, except that the related surplus on revaluation of land and buildings (net of deferred tax) is transferred directly to unappropriated profit.
Tangible operating assets - leased Leases where the Group assumes substantially all the risks and rewards of ownership are
classified as finance leases. Assets subject to finance lease are accounted for by recording the assets and related liability. These are stated at lower of fair value and the present value of minimum lease payments at the inception of lease less accumulated depreciation. Financial charges are allocated over the period of lease term so as to provide a constant periodic rate of financial charge on the outstanding liability. Depreciation is charged on the basis similar to the owned assets.
Intangible assets Intangible assets having a finite useful life are stated at cost less accumulated amortisation and
impairment, if any. Amortisation is based on straight line method by taking into consideration the estimated useful life of assets at the rates specified in note 13.3. Intangible assets are amortised on prorata basis i.e. full month amortisation in the month of purchase and no amortisation in the month of disposal. Intangible assets with indefinite useful life are not amortised instead they are systematically tested for impairment annually.
Capital work in progress Capital work in progress is stated at cost less impairment, if any.
127
Impairment The carrying values of fixed assets are reviewed for impairment when events or changes in
circumstances indicate that the carrying values may not be recoverable. If any such indication exists and where the carrying values exceed the estimated recoverable amounts, the fixed assets are written down to their recoverable amounts.
The resulting impairment loss is taken to profit and loss account except for impairment loss on revalued assets which is adjusted against the related revaluation surplus to the extent that the impairment loss does not exceed the surplus on revaluation of assets.
5.8 Employees' benefits Defined benefit plan The Bank operates an approved gratuity fund for all its confirmed employees, which is administered
by the Trustees. The Bank's costs and contributions are determined based on actuarial valuation carried out at each year end using Projected Unit Credit Actuarial Method. All actuarial gains and losses are recognised in 'other comprehensive income' as they occur and are not reclassified to profit or loss in subsequent periods.
Defined contribution plan The Bank operates an approved provident fund scheme for all its regular permanent employees,
administered by the Trustees. Equal monthly contributions are made both by the Bank and its employees to the fund at the rate of 10% of the basic salary in accordance with the terms of the scheme.
AL Habib Capital Markets (Private) Limited operates unapproved provident fund scheme for its confirmed employees. Contributions are made by the company and the employees at the rate of 10% of the basic salary with the terms of scheme.
Compensated absences The Bank accounts for all accumulating compensated absences when employees render service
that increases their entitlement to future compensated absences. The liability is determined based on actuarial valuation carried out using the Projected Unit Credit Method.
5.9 Provisions against liabilities These are recognised when the Group has a legal or constructive obligation as a result of past
events, it is probable that an outflow of resources will be required to settle the obligation and a reliable estimate of the amount can be made. Provisions are reviewed at each reporting date and are adjusted to reflect the current best estimate.
5.10 Provisions against off - balance sheet obligations The Group, in the ordinary course of business, issues letters of credit, acceptances, guarantees,
bid bonds, performance bonds etc. The commission against such contracts is recognised in the profit and loss account under "fees, commission and brokerage income" over the period of contracts. The Group's liability under such contracts is measured at the higher of the amount representing unearned commission income at the reporting date and the best estimate of the amount expected to settle any financial obligation arising under such contracts.
5.11 Sub - ordinated loans Sub - ordinated loans are initially recorded at the amount of proceeds received. Mark - up accrued
on sub - ordinated loans is recognised separately as part of other liabilities and is charged to the profit and loss account over the period on an accrual basis.
128
5.12 Revenue recognition (a) Mark - up / interest / return on advances and investments is recognised on accrual basis, except
in case of advances classified under the Prudential Regulations on which mark - up is recognised on receipt basis. Mark - up / interest / return on rescheduled / restructured loans and advances and investments is recognised as permitted by the regulations of SBP.
(b) Financing method is used in accounting for income from lease financing. Under this method, the unrealised lease income is deferred and taken to income over the term of the lease period so as to produce a constant periodic rate of return on the outstanding net investment in lease. Gain / loss on termination of lease contracts, front end fee and other lease income are recognised as income on receipt basis.
(c) The rentals from ijarah are recognised as income over the term of the contract net of depreciation expense relating to the ijarah assets.
(d) Income from murabaha is accounted for on a time proportionate basis over the period of murabaha transaction.
(e) Dividend income is recognised when the right to receive is established. (f) Gain or loss on sale of investments are recognised in profit and loss account in the year in
which they arise. (g) Fee, commission and brokerage income are recognised as services are performed.5.13 Taxation Income tax expense comprises current and deferred tax. Income tax expense is recognised in profit
and loss account except to the extent that it relates to the items recognised directly in equity or surplus on revaluation of assets, in which case it is recognised in equity or surplus on revaluation of assets.
Current Provision for current tax is based on the taxable income for the year, using tax rates enacted or
substantively enacted at the statement of financial position date and any adjustments to the tax payable in respect of previous years. Current tax assets and liabilities are measured at the amount expected to be recovered from or paid to taxation authorities.
Deferred Deferred tax is provided on all temporary differences at the statement of financial position date
between the tax bases of assets and liabilities and their carrying amounts for financial reporting purposes.
Deferred tax assets are recognised for all deductible temporary differences and unused tax losses, to the extent that it is probable that taxable profits will be available against which the deductible temporary differences and unused tax losses can be utilised.
Deferred tax liabilities are recognised for all taxable temporary differences, except in respect of taxable temporary differences associated with investment in foreign operations, when the timing of the reversal of the temporary differences can be controlled and it is probable that the temporary differences will not reverse in the foreseeable future.
The carrying amount of deferred income tax assets are reviewed at each statement of financial position date and reduced to the extent that it is no longer probable that sufficient taxable profit or taxable temporary differences will be available to allow all or part of the deferred income tax asset to be utilised.
Deferred tax assets and liabilities are measured at the tax rates that are expected to apply to the period when the asset is realised or the liability is settled, based on tax rates (and tax laws) that have been enacted or substantively enacted at the statement of financial position date.
129
5.14 Statutory reserve Every Bank incorporated in Pakistan is required to transfer 20% of their profit to a statutory reserve
until the reserve equals share capital, thereafter 10% of the profit of the Bank is to be transferred to this reserve.
5.15 Currency translation Functional and presentation currency These consolidated financial statements are presented in Pak Rupees which is the Group's
functional currency and presentation currency. Transactions and balances in foreign currencies Foreign currency transactions are translated into Pak Rupees at the exchange rates prevailing on
the date of transaction. Monetary assets and liabilities in foreign currencies are translated into Pak Rupees at the exchange rates prevailing at the reporting date. Non - monetary items that are measured in terms of historical cost in a foreign currency are translated using the exchange rates at the dates of the initial transactions. Non - monetary items measured at fair value in a foreign currency are translated using exchange rates at the date when the fair value was determined. Exchange gains or losses are included in income currently.
Foreign operations The assets and liabilities of foreign operations are translated to Pak Rupees at exchange rates
prevailing at the reporting date. The income and expense of foreign operations are translated at rate of exchange prevailing during the year. Exchange gain or loss on such translation is taken to equity through statement of other comprehensive income under "foreign currency translation reserve".
Commitments Commitments for outstanding forward foreign exchange contracts are translated at forward rates
applicable to their respective maturities.5.16 Financial instruments Financial assets and financial liabilities are recognised at the time when the Group becomes a party
to the contractual provision of the instrument. Financial assets are de - recognised when the contractual right to future cash flows from the asset expires or is transferred along with the risk and reward of ownership of the asset. Financial liabilities are de - recognised when obligation is discharged, cancelled or expired. Any gain or loss on de - recognition of the financial asset and liability is recognised in the profit and loss account of the current period.
5.17 Derivative financial instruments Derivative financial instruments are initially recognised at their fair value on the date on which the
derivative contract is entered into and are subsequently remeasured at fair value. All derivative financial instruments are carried as asset when fair value is positive and liabilities when fair value is negative. Any change in the value of derivative financial instruments is taken to the profit and loss account.
5.18 Off - setting Financial assets and financial liabilities are only off - set and the net amount is reported in the
financial statements when there is a legally enforceable right to set - off the recognised amount and the Group intends either to settle on a net basis, or to realise the assets and to settle the liabilities simultaneously. Income and expense items of such assets and liabilities are also off - set and the net amount is reported in the financial statements.
5.19 Dividends and appropriations to reserves Dividends and appropriations to reserves are recognised in the year in which these are approved,
except appropriations required by the law which are recorded in the period to which they pertain.
130
5.20 Segment reporting A segment is a distinguishable component of the Group that is engaged in providing products and
services (business segment), or in providing products or services within a particular economic environment (geographical segment), which is subject to risk and rewards that are different from those of other segments. The segment reporting format has been determined and prepared in conformity with the format of financial statements and guidelines, prescribed by SBP vide BSD Circular No.04, dated, 17 February 2006. The Group's primary format of reporting is based on business segments.
5.20.1 Business segments Retail banking It consists of retail lending, deposits and banking services to private individuals and small
businesses. The retail banking activities include provision of banking and other financial services, such as current and savings accounts, credit cards, consumer banking products etc., to individual customers, small merchants and SMEs.
Commercial banking Commercial banking represents provision of banking services including treasury and international
trade related activities to large corporate customers, multinational companies, government and semi government departments and institutions and SMEs treated as corporate under the Prudential Regulations.
Retail brokerage Retail brokerage activities include the business of equity, money market and foreign exchange
brokerage, equity research and corporate financial advisory and consultancy services.5.20.2 Geographical segments The Group operates in four geographic regions, being: - Pakistan - Middle East - Asia Pacific - Africa 5.21 Earnings per share The Group presents basic and diluted earnings per share (EPS). Basic EPS is calculated by
dividing the profit or loss attributable to ordinary shareholders of the Bank by the weighted average number of ordinary shares outstanding during the period / year. Diluted EPS is determined by adjusting the profit or loss attributable to ordinary shareholders and the weighted average number of ordinary shares outstanding for the effects of all dilutive potential ordinary shares, if any. There were no convertible dilutive potential ordinary shares in issue at 31 December 2016.
5.22 Clients' assets The Group provides services that result in the holding of assets on behalf of its clients. Such assets
are not reported in the financial statements, as they are not the assets of the Group.6. ACCOUNTING JUDGMENTS AND ESTIMATES The preparation of consolidated financial statements requires management to make judgments,
estimates and assumptions that affect the application of policies and reported amounts of assets and liabilities, income and expenses. The estimates and associated assumptions are based on historical experience and various other factors that are believed to be reasonable under the circumstances, the result of which forms the basis of making judgment about carrying values of assets and liabilities that are not readily apparent from other sources. Actual results may differ from these estimates. The estimates and underlying assumptions are reviewed on an ongoing basis. Revision to accounting estimates are recognised in the period in which the estimate is revised if the revision affects only that period, or in period of revision and future periods if the revision affects both current and future periods. The estimates and judgments that have a significant effect on the financial statements are in respect of the following:
131
Note
Other assets - Non - banking assets acquired in satisfaction of claims 5.1.1 & 14 Classification of investments and provision for diminution in the value of investments 5.5 & 11 Provision against non - performing advances 5.6 & 12 Useful lives of assets and methods of depreciation and amortisation 5.7 & 13 Employees' benefits 5.8, 20 & 37 Provisions against off - balance sheet obligations 5.10 & 20.2 Current and deferred taxation 5.13 & 19
7. STANDARDS, INTERPRETATIONS AND AMENDMENTS TO APPROVED ACCOUNTING STANDARDS THAT ARE NOT YET EFFECTIVE
The following standards, amendments and interpretations of Approved Accounting Standards will be effective for accounting periods on or after 01 January 2017:
- Amendments to IAS 12 ‘Income Taxes’ are effective for annual periods beginning on or after 1 January 2017. The amendments clarify that the existence of a deductible temporary difference depends solely on a comparison of the carrying amount of an asset and its tax base at the end of the reporting period, and is not affected by possible future changes in the carrying amount or expected manner of recovery of the asset. The amendments further clarify that when calculating deferred tax asset in respect of insufficient taxable temporary differences, the future taxable profit excludes tax deductions resulting from the reversal of those deductible temporary differences. The amendments are not likely to have an impact on consolidated financial statements of the Group.
- Amendments to IAS 7 ‘Statement of Cash Flows’ are part of IASB’s broader disclosure initiative and are effective for annual periods beginning on or after 1 January 2017. The amendments require disclosures that enable users of financial statements to evaluate changes in liabilities arising from financing activities, including both changes arising from cash flow and non - cash changes.
- Amendments to IFRS 2 - Share - based Payment clarify the accounting for certain types of arrangements and are effective for annual periods beginning on or after 1 January 2018. The amendments cover three accounting areas (a) measurement of cash - settled share - based payments; (b) classification of share - based payments settled net of tax withholdings; and (c) accounting for a modification of a share - based payment from cash - settled to equity - settled. The new requirements could affect the classification and/or measurement of these arrangements and potentially the timing and amount of expense recognised for new and outstanding awards. The amendments are not likely to have an impact on Groups’s consolidated financial statements.
- Transfers of Investment Property (Amendments to IAS 40 ‘Investment Property’ effective for annual periods beginning on or after 1 January 2018) clarifies that an entity shall transfer a property to, or from, investment property when, and only when there is a change in use. A change in use occurs when the property meets, or ceases to meet, the definition of investment property and there is evidence of the change in use. In isolation, a change in management's intentions for the use of a property does not provide evidence of a change in use. The amendments are not likely to have an impact on Group’s consolidated financial statements.
- Annual improvements to IFRS standards 2014 - 2016 cycle. The new cycle of improvements addresses improvements to following approved accounting standards:
- Amendments to IFRS 12 ‘Disclosure of Interests in Other Entities’ (effective for annual periods beginning on or after 1 January 2017) clarify that the requirements of IFRS 12 apply to an entity’s interests that are classified as held for sale or discontinued operations in accordance with IFRS 5 – ‘Non - current Assets Held for Sale and Discontinued Operations’. The amendments are not likely to have an impact on Group’s consolidated financial statements.
132
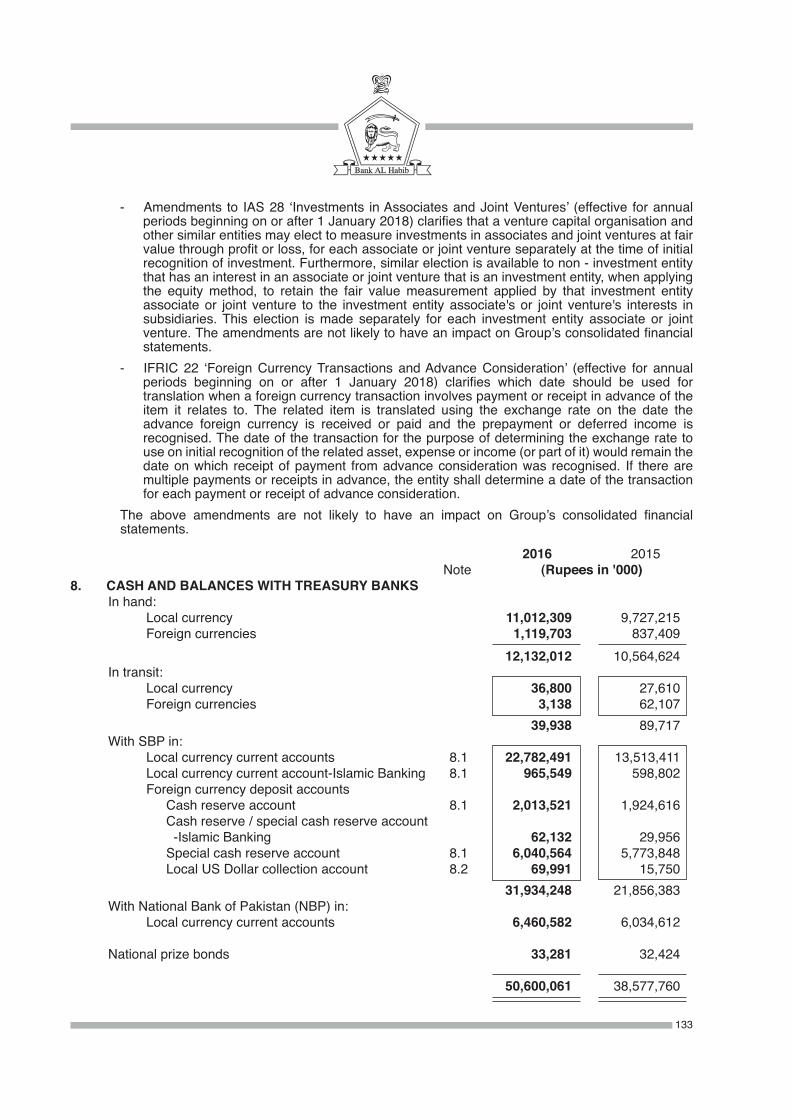
- Amendments to IAS 28 ‘Investments in Associates and Joint Ventures’ (effective for annual periods beginning on or after 1 January 2018) clarifies that a venture capital organisation and other similar entities may elect to measure investments in associates and joint ventures at fair value through profit or loss, for each associate or joint venture separately at the time of initial recognition of investment. Furthermore, similar election is available to non - investment entity that has an interest in an associate or joint venture that is an investment entity, when applying the equity method, to retain the fair value measurement applied by that investment entity associate or joint venture to the investment entity associate's or joint venture's interests in subsidiaries. This election is made separately for each investment entity associate or joint venture. The amendments are not likely to have an impact on Group’s consolidated financial statements.
- IFRIC 22 ‘Foreign Currency Transactions and Advance Consideration’ (effective for annual periods beginning on or after 1 January 2018) clarifies which date should be used for translation when a foreign currency transaction involves payment or receipt in advance of the item it relates to. The related item is translated using the exchange rate on the date the advance foreign currency is received or paid and the prepayment or deferred income is recognised. The date of the transaction for the purpose of determining the exchange rate to use on initial recognition of the related asset, expense or income (or part of it) would remain the date on which receipt of payment from advance consideration was recognised. If there are multiple payments or receipts in advance, the entity shall determine a date of the transaction for each payment or receipt of advance consideration.
The above amendments are not likely to have an impact on Group’s consolidated financial statements.
2016 2015 Note (Rupees in '000)8. CASH AND BALANCES WITH TREASURY BANKS In hand: Local currency 11,012,309 9,727,215 Foreign currencies 1,119,703 837,409 12,132,012 10,564,624 In transit: Local currency 36,800 27,610 Foreign currencies 3,138 62,107 39,938 89,717 With SBP in: Local currency current accounts 8.1 22,782,491 13,513,411 Local currency current account-Islamic Banking 8.1 965,549 598,802 Foreign currency deposit accounts Cash reserve account 8.1 2,013,521 1,924,616 Cash reserve / special cash reserve account -Islamic Banking 62,132 29,956 Special cash reserve account 8.1 6,040,564 5,773,848 Local US Dollar collection account 8.2 69,991 15,750 31,934,248 21,856,383 With National Bank of Pakistan (NBP) in: Local currency current accounts 6,460,582 6,034,612
National prize bonds 33,281 32,424
50,600,061 38,577,760
133
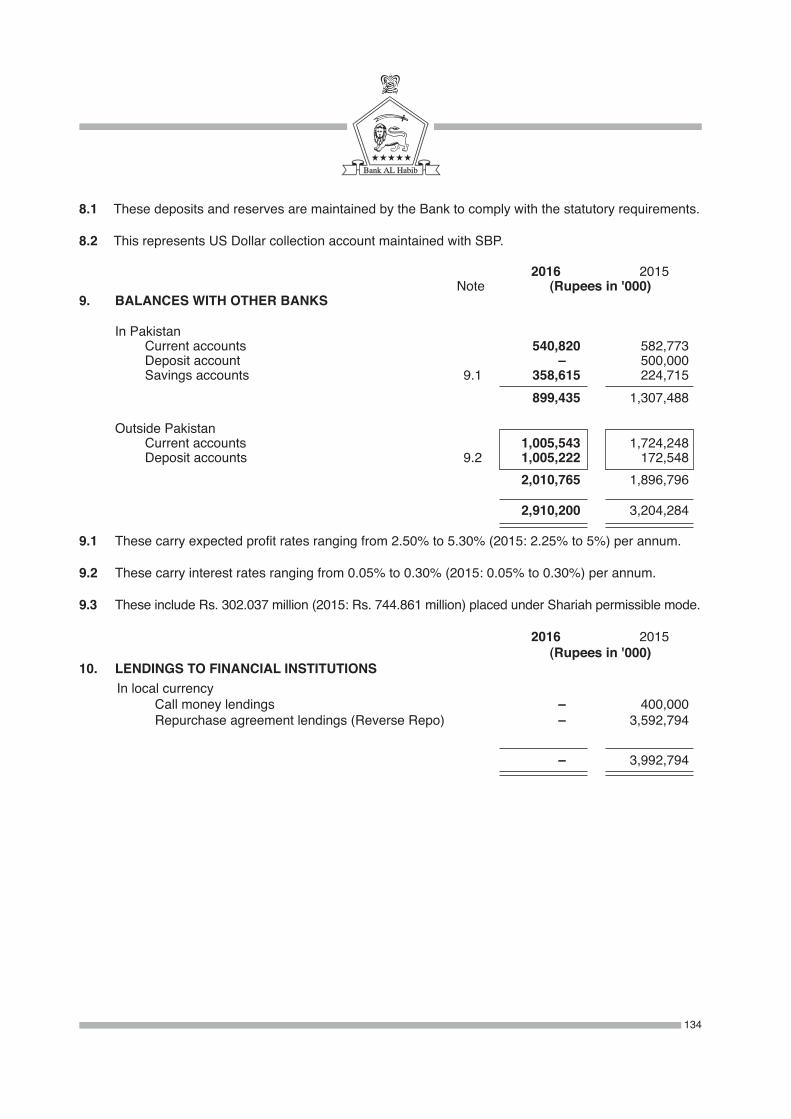
8.1 These deposits and reserves are maintained by the Bank to comply with the statutory requirements. 8.2 This represents US Dollar collection account maintained with SBP.
2016 2015 Note (Rupees in '000)9. BALANCES WITH OTHER BANKS
In Pakistan Current accounts 540,820 582,773 Deposit account –00 500,000 Savings accounts 9.1 358,615 224,715 899,435 1,307,488
Outside Pakistan Current accounts 1,005,543 1,724,248 Deposit accounts 9.2 1,005,222 172,548 2,010,765 1,896,796
2,910,200 3,204,284
9.1 These carry expected profit rates ranging from 2.50% to 5.30% (2015: 2.25% to 5%) per annum.
9.2 These carry interest rates ranging from 0.05% to 0.30% (2015: 0.05% to 0.30%) per annum.
9.3 These include Rs. 302.037 million (2015: Rs. 744.861 million) placed under Shariah permissible mode.
2016 2015 (Rupees in '000)10. LENDINGS TO FINANCIAL INSTITUTIONS In local currency Call money lendings –00 400,000 Repurchase agreement lendings (Reverse Repo) –00 3,592,794
–00 3,992,794
134
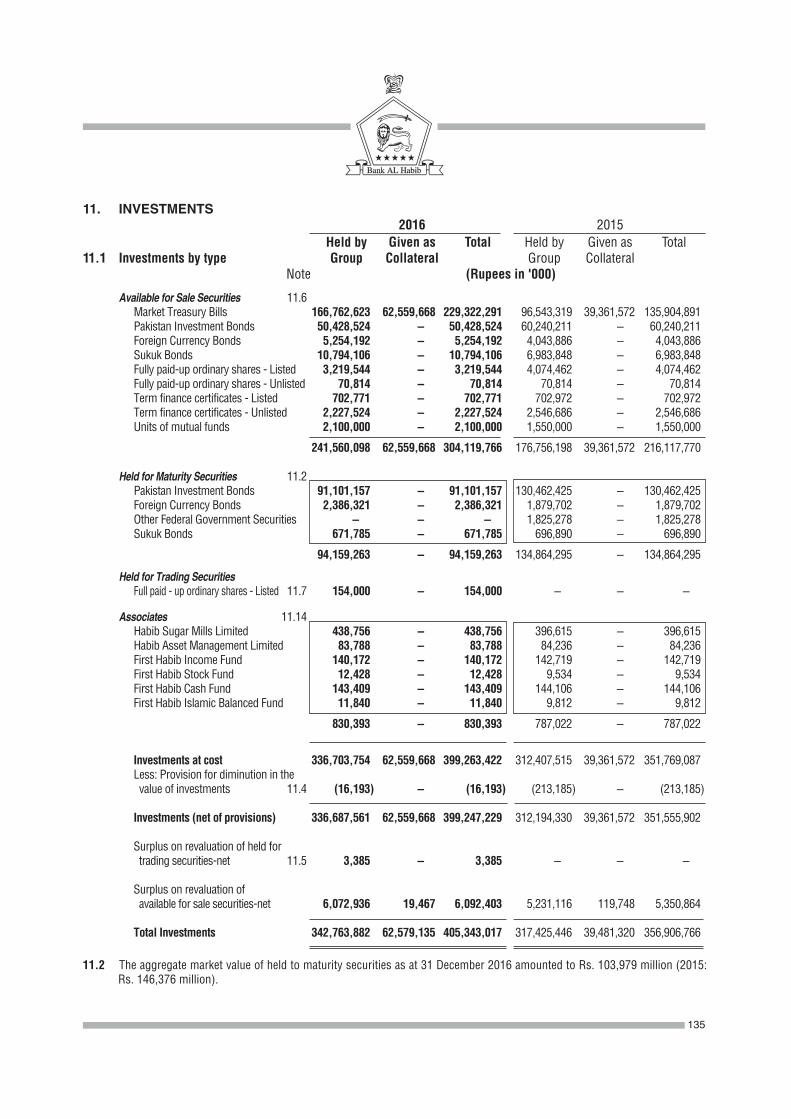
11. INVESTMENTS 2016 2015 Held by Given as Total Held by Given as Total 11.1 Investments by type Group Collateral Group Collateral Note (Rupees in '000)
Available for Sale Securities 11.6 Market Treasury Bills 166,762,623 62,559,668 229,322,291 96,543,319 39,361,572 135,904,891 Pakistan Investment Bonds 50,428,524 –00 50,428,524 60,240,211 –00 60,240,211 Foreign Currency Bonds 5,254,192 –00 5,254,192 4,043,886 –00 4,043,886 Sukuk Bonds 10,794,106 –00 10,794,106 6,983,848 –00 6,983,848 Fully paid-up ordinary shares - Listed 3,219,544 –00 3,219,544 4,074,462 –00 4,074,462 Fully paid-up ordinary shares - Unlisted 70,814 –00 70,814 70,814 –00 70,814 Term finance certificates - Listed 702,771 –00 702,771 702,972 –00 702,972 Term finance certificates - Unlisted 2,227,524 –00 2,227,524 2,546,686 –00 2,546,686 Units of mutual funds 2,100,000 –00 2,100,000 1,550,000 –00 1,550,000
241,560,098 62,559,668 304,119,766 176,756,198 39,361,572 216,117,770
Held for Maturity Securities 11.2 Pakistan Investment Bonds 91,101,157 –00 91,101,157 130,462,425 –00 130,462,425 Foreign Currency Bonds 2,386,321 –00 2,386,321 1,879,702 –00 1,879,702 Other Federal Government Securities –00 –00 –00 1,825,278 –00 1,825,278 Sukuk Bonds 671,785 –00 671,785 696,890 –00 696,890
94,159,263 –00 94,159,263 134,864,295 –00 134,864,295
Held for Trading Securities Full paid - up ordinary shares - Listed 11.7 154,000 –00 154,000 –00 –00 –00
Associates 11.14 Habib Sugar Mills Limited 438,756 –00 438,756 396,615 –00 396,615 Habib Asset Management Limited 83,788 –00 83,788 84,236 –00 84,236 First Habib Income Fund 140,172 –00 140,172 142,719 –00 142,719 First Habib Stock Fund 12,428 –00 12,428 9,534 –00 9,534 First Habib Cash Fund 143,409 –00 143,409 144,106 –00 144,106 First Habib Islamic Balanced Fund 11,840 –00 11,840 9,812 –00 9,812
830,393 –00 830,393 787,022 –00 787,022
Investments at cost 336,703,754 62,559,668 399,263,422 312,407,515 39,361,572 351,769,087 Less: Provision for diminution in the value of investments 11.4 (16,193 ) –00 (16,193 ) (213,185 ) –00 (213,185 )
Investments (net of provisions) 336,687,561 62,559,668 399,247,229 312,194,330 39,361,572 351,555,902
Surplus on revaluation of held for trading securities-net 11.5 3,385 –00 3,385 –00 –00 –00
Surplus on revaluation of available for sale securities-net 6,072,936 19,467 6,092,403 5,231,116 119,748 5,350,864
Total Investments 342,763,882 62,579,135 405,343,017 317,425,446 39,481,320 356,906,766
11.2 The aggregate market value of held to maturity securities as at 31 December 2016 amounted to Rs. 103,979 million (2015: Rs. 146,376 million).
135
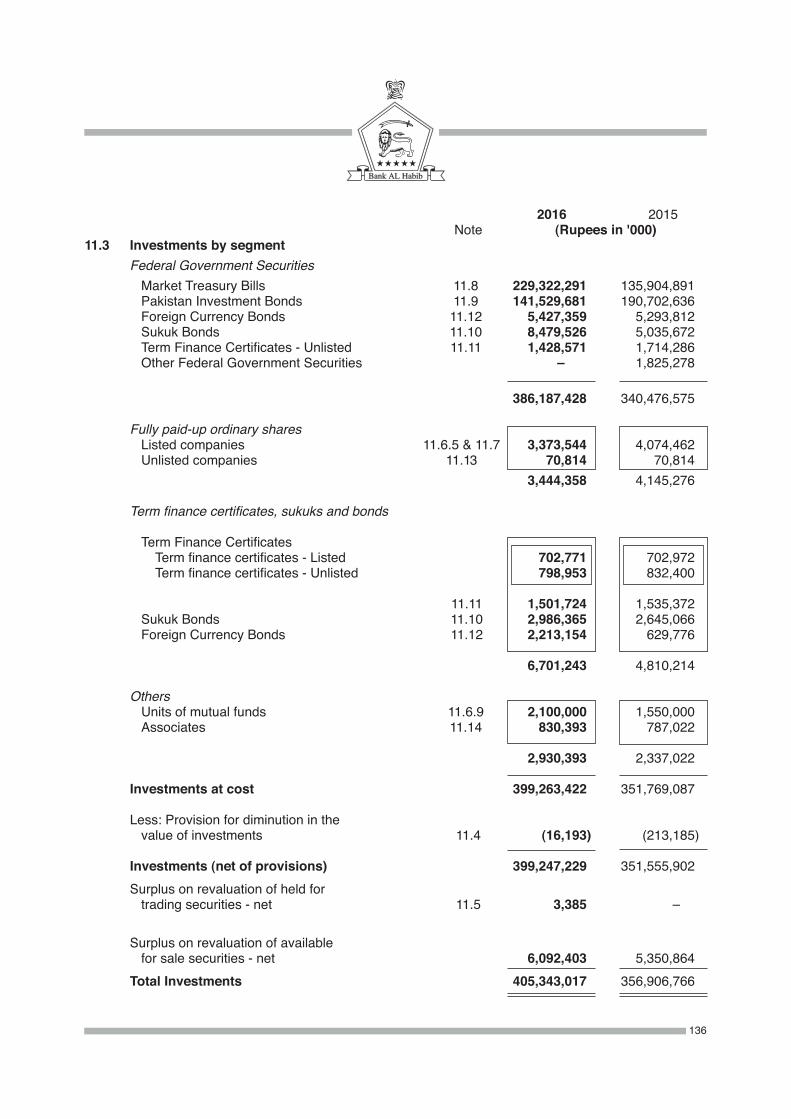
2016 2015 Note (Rupees in '000)11.3 Investments by segment Federal Government Securities Market Treasury Bills 11.8 229,322,291 135,904,891 Pakistan Investment Bonds 11.9 141,529,681 190,702,636 Foreign Currency Bonds 11.12 5,427,359 5,293,812 Sukuk Bonds 11.10 8,479,526 5,035,672 Term Finance Certificates - Unlisted 11.11 1,428,571 1,714,286 Other Federal Government Securities –000 1,825,278
386,187,428 340,476,575 Fully paid-up ordinary shares Listed companies 11.6.5 & 11.7 3,373,544 4,074,462 Unlisted companies 11.13 70,814 70,814 3,444,358 4,145,276 Term finance certificates, sukuks and bonds
Term Finance Certificates Term finance certificates - Listed 702,771 702,972 Term finance certificates - Unlisted 798,953 832,400 11.11 1,501,724 1,535,372 Sukuk Bonds 11.10 2,986,365 2,645,066 Foreign Currency Bonds 11.12 2,213,154 629,776 6,701,243 4,810,214
Others Units of mutual funds 11.6.9 2,100,000 1,550,000 Associates 11.14 830,393 787,022 2,930,393 2,337,022
Investments at cost 399,263,422 351,769,087
Less: Provision for diminution in the value of investments 11.4 (16,193 ) (213,185 ) Investments (net of provisions) 399,247,229 351,555,902 Surplus on revaluation of held for trading securities - net 11.5 3,385 –00
Surplus on revaluation of available for sale securities - net 6,092,403 5,350,864 Total Investments 405,343,017 356,906,766
136
2016 2015 Note (Rupees in '000)11.4 Particulars of provision for diminution in the value of investments
Available for sale investments: Opening balance 213,185 11,163 (Reversal) / charge for the year (196,992 ) 202,022 Closing balance 11.4.1 16,193 213,185
11.4.1 Particulars of provision in respect of type and segment
Available for sale investments:
Listed companies: Pakistan Oilfields Limited –00 133,241 Pakistan Petroleum Limited 5,030 68,781
5,030 202,022
Unlisted companies: Pakistan Stock Exchange Limited 5,463 5,463 Pakistan Export Finance Guarantee Agency Limited 5,700 5,700
11,163 11,163 16,193 213,185
11.5 Unrealised gain on revaluation of held for trading securities Fully paid - up ordinary shares - Listed shares 3,385 –00
11.6 Quality of available for sale securities
Name of security Face 2016 2015 2016 2015 2016 2015 value Long term rating* Cost Carrying value USD (Rupees in '000) 11.6.1 Market Treasury Bills – Unrated Unrated 229,322,291 135,904,891 229,255,610 136,211,678 11.6.2 Pakistan Investment Bonds – Unrated Unrated 50,428,524 60,240,211 54,766,180 64,400,771
11.6.3 Foreign Currency Bonds Government of Pakistan Bonds USD 100 B B- 2,115,256 1,338,682 2,135,920 1,390,228 Government of Pakistan Bonds USD 100 – B- –00 623,277 –00 628,942 Government of Pakistan Bonds USD 100 B B- 588,306 588,574 607,543 590,426 Government of Pakistan Bonds USD 100 B B- 527,715 529,239 571,736 537,389 Government of Pakistan Bonds USD 100 B B- 330,757 334,338 339,191 323,002 Government of Sri Lanka Bonds USD 100 B+ – 536,086 –00 536,136 –00 Kingdom of Bahrain USD 100 BB+ BBB- 209,197 209,482 217,209 214,216 Bank of Ceylon USD 100 B+ BB- 737,850 211,134 737,864 210,368 Bank of Ceylon USD 100 B+ BB- 209,025 209,160 209,413 203,022 5,254,192 4,043,886 5,355,012 4,097,593
137
11.6.4 Sukuk Bonds 2016 2015 Name of security No. of certificates 170,000 170,000 Engro Foods Limited Rs.5,000 A+ A+ 361,250 786,250 361,250 786,250 20,000 20,000 Government of Pakistan Ijarah Sukuk XVI Rs. 100,000 Unrated Unrated 2,000,000 2,000,000 2,049,000 2,022,600 12,000 12,000 Government of Pakistan Ijarah Sukuk XV Rs. 100,000 Unrated Unrated 1,200,000 1,200,000 1,200,720 1,200,000 100,000 100,000 Government of Pakistan Sukuk USD 100 B B- 1,056,307 1,061,670 1,104,037 1,060,356 1,124,278 1,124,278 Liberty Power Tech Limited Rs.1,000 A+ A+ 668,119 777,498 668,119 777,498 181,686 181,686 K-Electric Limited Sukuk IV Rs.5,000 AA+ AA+ 908,430 908,430 908,430 908,430 150,000 150,000 WAPDA Second Sukuk Company Limited Rs.5,000 Unrated Unrated 125,000 250,000 125,000 250,000 Neelam Jhelum Hydropower Company 35,750 –00 (Private) Limited Rs.100,000 AAA – 3,575,000 –00 3,575,000 –00 900 –00 Meezan Bank Limited Tier II Rs.1,000,000 AA- – 900,000 –00 900,000 –00 10,794,106 6,983,848 10,891,556 7,005,134
11.6.5 Fully paid-up ordinary shares - Listed
2016 2015 Name of security No. of shares
Face 2016 2015 2016 2015 2016 2015 value Long term rating* Cost Carrying value Rs. / USD (Rupees in '000)
337,500 –00 Adamjee Insurance Company Limited Rs.10 AA+ – 19,973 –00 25,022 –00 377,800 754,800 Allied Bank Limited Rs.10 AA+ AA+ 22,585 45,121 45,038 71,148 –00 196,640 Attock Petroleum Limited Rs.10 – Unrated –00 89,332 –00 99,327 300,000 –00 Cherat Cement Company Limited Rs.10 A – 38,784 –00 52,212 –00 300,000 –00 D. G. Khan Cement Company Limited Rs.10 Unrated – 58,457 –00 66,519 –00 230,000 –00 Engro Corporation Limited Rs.10 AA – 74,779 –00 72,701 –00 410,000 –00 Engro Fertilizer Company Limited Rs.10 AA- – 28,004 –00 27,872 –00 250,000 –00 Fatima Fertilizer Company Limited Rs.10 AA- – 8,443 –00 9,223 –00 2,960,000 –00 Fauji Cement Company Limited Rs.10 Unrated – 112,603 –00 133,437 –00 700,000 4,454,500 Fauji Fertilizer Bin Qasim Limited Rs.10 Unrated Unrated 38,692 189,579 35,847 234,663 4,650,000 3,224,800 Fauji Fertilizer Company Limited Rs.10 Unrated Unrated 524,833 364,507 485,321 380,462 294,000 294,000 First Habib Modaraba Rs.5 AA+ AA+ 2,607 2,607 3,087 2,940 100,000 –00 Glaxo Smith Kline Pakistan Limited Rs.10 Unrated – 21,775 –00 23,330 –00 687,043 1,286,643 Habib Bank Limited Rs.10 AAA AAA 129,787 241,779 187,735 257,484 7,513,915 15,027,415 Habib Metropolitan Bank Limited Rs.10 AA+ AA+ 170,303 340,597 278,015 457,885 175,000 –00 Honda Atlas Cars Private Limited Rs.10 Unrated – 74,654 –00 117,012 –00 5,975,000 7,880,000 Hub Power Company Limited Rs.10 AA+ AA+ 372,571 486,674 737,793 808,488 25,000 –00 ICI Pakistan Limited Rs.10 Unrated – 12,337 –00 24,843 –00 52,862 52,862 International Industries Limited Rs.10 Unrated Unrated 357 357 10,770 3,251 2,812,056 5,623,556 International Steels Limited Rs.10 Unrated Unrated 44,618 89,228 274,822 137,271 2,500,000 –00 K-Electric Limited Rs.3.5 AA – 20,715 –00 23,425 –00 6,824,000 6,420,500 Kot Addu Power Company Limited Rs.10 AA+ AA+ 476,445 441,480 537,731 520,061 2,749,500 2,094,500 Lalpir Power Limited Rs.10 AA AA 66,855 51,894 66,538 62,290 25,000 –00 Lucky Cement Limited Rs.10 Unrated – 17,273 –00 21,657 –00 500,010 396,110 MCB Bank Limited Rs.10 AAA AAA 108,602 99,902 118,912 85,896 –00 119,067 Meezan Bank Limited Rs.10 – AA –00 3,028 –00 5,447 4,780,500 4,780,500 Nishat Chunian Power Limited Rs.10 Unrated Unrated 195,514 195,514 265,222 263,167 17,500 17,500 Packages Limited Rs.10 AA AA 1,429 1,429 14,876 10,187 50,000 –00 Pak Suzuki Motor Company Limited Rs.10 Unrated – 30,178 –00 30,641 –00 5,065,000 4,407,500 Pakgen Power Limited Rs.10 AA AA 125,531 108,544 135,590 129,713 –00 949,075 Pakistan Oilfields Limited Rs.10 – Unrated –00 387,612 –00 121,130 128,100 1,772,041 Pakistan Petroleum Limited Rs.10 Unrated Unrated 17,800 284,634 24,106 152,100 –00 914,500 Pakistan State Oil Company Limited Rs.10 – AA –00 295,077 –00 297,917 6,871,500 –00 Pakistan Telecommunication Company Limited Rs.10 Unrated – 112,981 –00 118,052 –00 3,000 –00 Rafhan Maize Product Limited Rs.10 Unrated – 23,211 –00 26,293 –00
138
11.6.6 Fully paid-up ordinary shares - Unlisted
2016 2015 Name of security No. of shares / certificates 3,000,000 3,000,000 Khushhali Bank Limited Rs.10 A+ A+ 30,000 30,000 30,000 30,000 Pakistan Export Finance Guarantee 569,958 569,958 Agency Limited Rs.10 Unrated Unrated 5,700 5,700 –00 –0 Society for Worldwide Interbank 39 39 Financial Telecommunication – Unrated Unrated 9,829 9,829 9,829 9,829 4,007,383 4,007,383 Pakistan Stock Exchange Limited Rs.10 Unrated Unrated 25,285 25,285 19,822 19,822 70,814 70,814 59,651 59,651
2016 2015 Name of security No. of shares
Face 2016 2015 2016 2015 2016 2015 value Long term rating* Cost Carrying value Rs. (Rupees in '000)
–00 22,500 Shell Pakistan Limited Rs.10 – Unrated –00 2,189 –00 5,135 13,232,450 16,541,450 Soneri Bank Limited Rs.10 AA- AA- 150,607 164,418 233,551 250,272 1,591,500 3,183,000 Standard Chartered Bank (Pakistan) Limited Rs.10 AAA AAA 30,851 61,701 40,185 69,708 50,000 –00 Thal Limited Rs.5 Unrated _ 21,760 –00 25,427 –00 527,500 1,055,000 United Bank Limited Rs.10 AAA AA+ 63,630 127,259 126,020 163,472
3,219,544 4,074,462 4,418,825 4,589,414
11.6.7 Term finance certificates - Listed 2016 2015 Name of security No. of certificates 30,625 30,625 Bank Alfalah Limited - V Rs.5,000 AA– AA– 152,911 152,972 157,040 155,764 30,000 30,000 Soneri Bank Limited Rs.5,000 A+ A+ 149,940 150,000 152,639 150,000 4,000 4,000 Habib Bank Limited Rs.100,000 AAA AAA 399,920 400,000 394,921 400,000 702,771 702,972 704,600 705,76411.6.8 Term finance certificates - Unlisted 2016 2015 Name of security No. of certificates 150 150 Askari Bank Limited - IV Rs.1,000,000 AA – AA– 149,700 149,760 149,700 149,760 60,000 60,000 Askari Bank Limited - V Rs.5,000 AA – AA– 299,760 299,880 299,760 299,880 20,000 20,000 Bank Alfalah Limited - IV Rs.5,000 AA – AA– 66,493 99,760 66,493 99,760 Standard Chartered Bank 56,600 56,600 (Pakistan) Limited Rs.5,000 AAA AAA 283,000 283,000 283,000 283,000 400,000 400,000 Water and Power Development Authority Rs.5,000 AAA AAA 1,428,571 1,714,286 1,428,571 1,714,286 2,227,524 2,546,686 2,227,524 2,546,68611.6.9 Units of mutual funds
2016 2015 Name of security No. of units
4,820,132 –00 HBL Money Market Fund Rs.10 AA – 500,000 –00 501,173 –00 48,615,258 48,615,258 NIT Government Bond Fund Rs.10 AA– AA– 550,000 550,000 493,980 506,654 17,422,393 17,422,393 NIT Income Fund Rs.10 A+ A+ 200,000 200,000 183,447 187,430 11,032,727 11,032,727 NIT Unit Trust Rs.10 AM2+ AM2 550,000 550,000 965,805 697,710 25,047,082 25,047,082 NIT Islamic Equity Fund Rs.10 AM2+ AM2 250,000 250,000 321,354 246,964 4,990,817 –00 NIT Government Treasury Fund Rs.10 AM2+ – 50,000 –00 51,259 –00
2,100,000 1,550,000 2,517,018 1,638,758 304,119,766 216,117,770 310,195,976 221,255,449
* Rating in case of ordinary shares of listed and unlisted companies represents the rating of investee companies, in all other cases, rating represents the rating of underlyinginstruments.
139
2016 2015 Name of security Face 2016 2015 2016 2015 2016 2015 No. of shares value Short term rating Cost Carrying value Rs. (Rupees in '000) 75,000 –00 Engro Corporation Limited Rs.10 A1+ – 23,786 –00 23,707 –00 125,000 –00 Engro Fertilizer Company Limited Rs.10 A1+ – 8,498 –00 8,498 –00 750,000 –00 Fauji Fertilizer Bin Qasim Limited Rs.10 Unrated – 34,807 –00 38,408 –00 300,000 –00 K - Electric Limited Rs.3.5 A1+ – 2,747 –00 2,811 –00 400,000 –00 Kot Addu Power Company Limited Rs.10 A1+ – 31,507 –00 31,520 –00 25,000 –00 Pak Electron Limited Rs.10 Unrated – 1,765 –00 1,782 –00 9,200 –00 Pak Suzuki Motor Company Limited Rs.10 Unrated – 5,666 –00 5,638 –00 41,000 –00 Pakistan Oilfields Limited Rs.10 Unrated – 22,101 –00 21,919 –00 0 Pakistan Telecommunication 250,000 –00 Company Limited Rs.10 Unrated – 4,318 –00 4,295 –00 150,000 –00 Saif Power Limited Rs.10 A1 – 5,025 –00 5,334 –00 300 –00 The SEARLE Company Limited Rs.10 Unrated – 191 –00 195 –00 300,000 –00 TRG Pakistan Limited Rs.10 Unrated – 13,589 –00 13,278 –00 154,000 –00 157,385 –00
11.8 Market Treasury Bills
These securities have a maturity period of one year (2015: one year), with yield ranging between 5.84% to 6.24% (2015: 6.33% to 8.34%) per annum.
11.9 Pakistan Investment Bonds
These securities have a maturity period of 3, 5 and 10 years (2015: 3, 5 and 10 years) with interest rates ranging between 9.25% to 12% (2015: 9.25% to 12%) per annum. These include securities costing Rs. 5 million (2015: Rs. 5 million) pledged with the Controller of Military Accounts, Karachi as a security deposit for extending banking facilities on account of regimental funds vis-a-vis private fund accounts.
140
11.7 Investment in listed companies - Held for trading
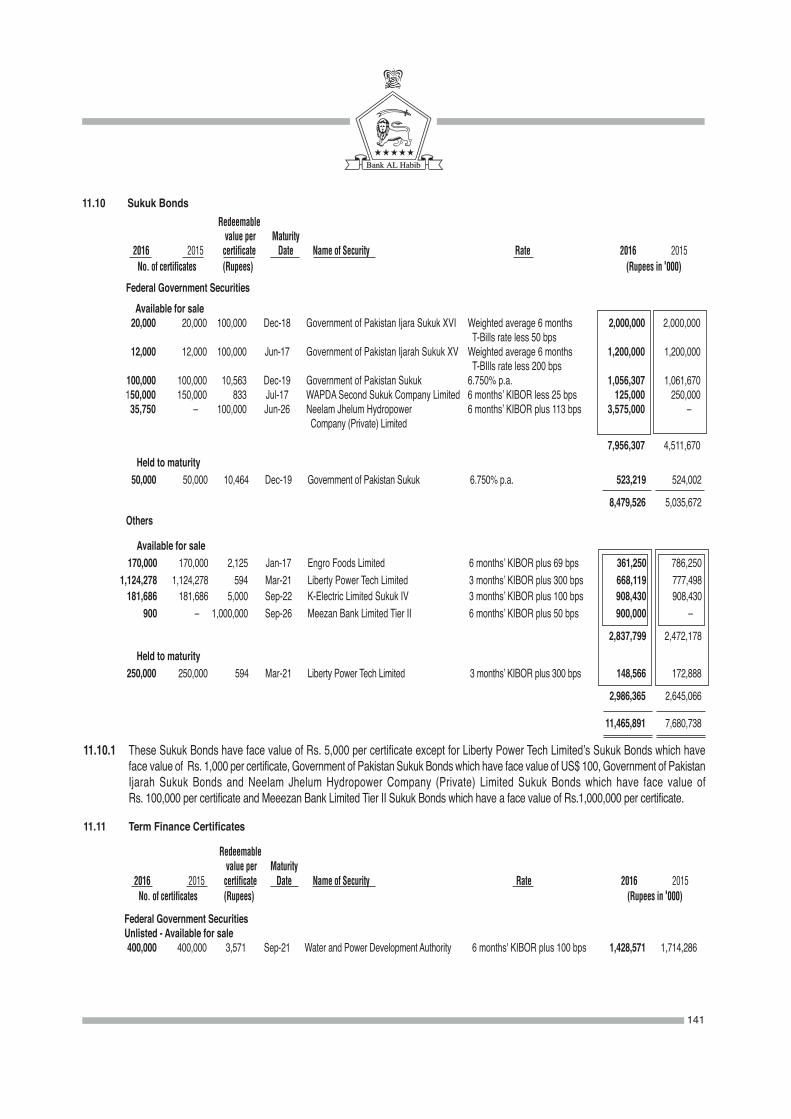
Held to maturity 50,000 50,000 10,464 Dec-19 Government of Pakistan Sukuk 6.750% p.a. 523,219 524,002
8,479,526 5,035,672
11.10 Sukuk Bonds
Federal Government Securities Available for sale 20,000 20,000 100,000 Dec-18 Government of Pakistan Ijara Sukuk XVI Weighted average 6 months 2,000,000 2,000,000 T-Bills rate less 50 bps 12,000 12,000 100,000 Jun-17 Government of Pakistan Ijarah Sukuk XV Weighted average 6 months 1,200,000 1,200,000 T-BIlls rate less 200 bps 100,000 100,000 10,563 Dec-19 Government of Pakistan Sukuk 6.750% p.a. 1,056,307 1,061,670 150,000 150,000 833 Jul-17 WAPDA Second Sukuk Company Limited 6 months’ KIBOR less 25 bps 125,000 250,000 35,750 –00 100,000 Jun-26 Neelam Jhelum Hydropower 6 months’ KIBOR plus 113 bps 3,575,000 –00 Company (Private) Limited
7,956,307 4,511,670
Redeemable value per Maturity 2016 2015 certificate Date Name of Security Rate 2016 2015 No. of certificates (Rupees) (Rupees in '000)
Available for sale 170,000 170,000 2,125 Jan-17 Engro Foods Limited 6 months’ KIBOR plus 69 bps 361,250 786,250 1,124,278 1,124,278 594 Mar-21 Liberty Power Tech Limited 3 months’ KIBOR plus 300 bps 668,119 777,498 181,686 181,686 5,000 Sep-22 K-Electric Limited Sukuk IV 3 months’ KIBOR plus 100 bps 908,430 908,430 900 –00 1,000,000 Sep-26 Meezan Bank Limited Tier II 6 months’ KIBOR plus 50 bps 900,000 –00
2,837,799 2,472,178 Held to maturity 250,000 250,000 594 Mar-21 Liberty Power Tech Limited 3 months’ KIBOR plus 300 bps 148,566 172,888
2,986,365 2,645,066
11,465,891 7,680,738
11.10.1 These Sukuk Bonds have face value of Rs. 5,000 per certificate except for Liberty Power Tech Limited’s Sukuk Bonds which have face value of Rs. 1,000 per certificate, Government of Pakistan Sukuk Bonds which have face value of US$ 100, Government of Pakistan Ijarah Sukuk Bonds and Neelam Jhelum Hydropower Company (Private) Limited Sukuk Bonds which have face value of
Rs. 100,000 per certificate and Meeezan Bank Limited Tier II Sukuk Bonds which have a face value of Rs.1,000,000 per certificate.
Others
11.11 Term Finance Certificates
Federal Government Securities Unlisted - Available for sale 400,000 400,000 3,571 Sep-21 Water and Power Development Authority 6 months' KIBOR plus 100 bps 1,428,571 1,714,286
Redeemable value per Maturity 2016 2015 certificate Date Name of Security Rate 2016 2015 No. of certificates (Rupees) (Rupees in '000)
141
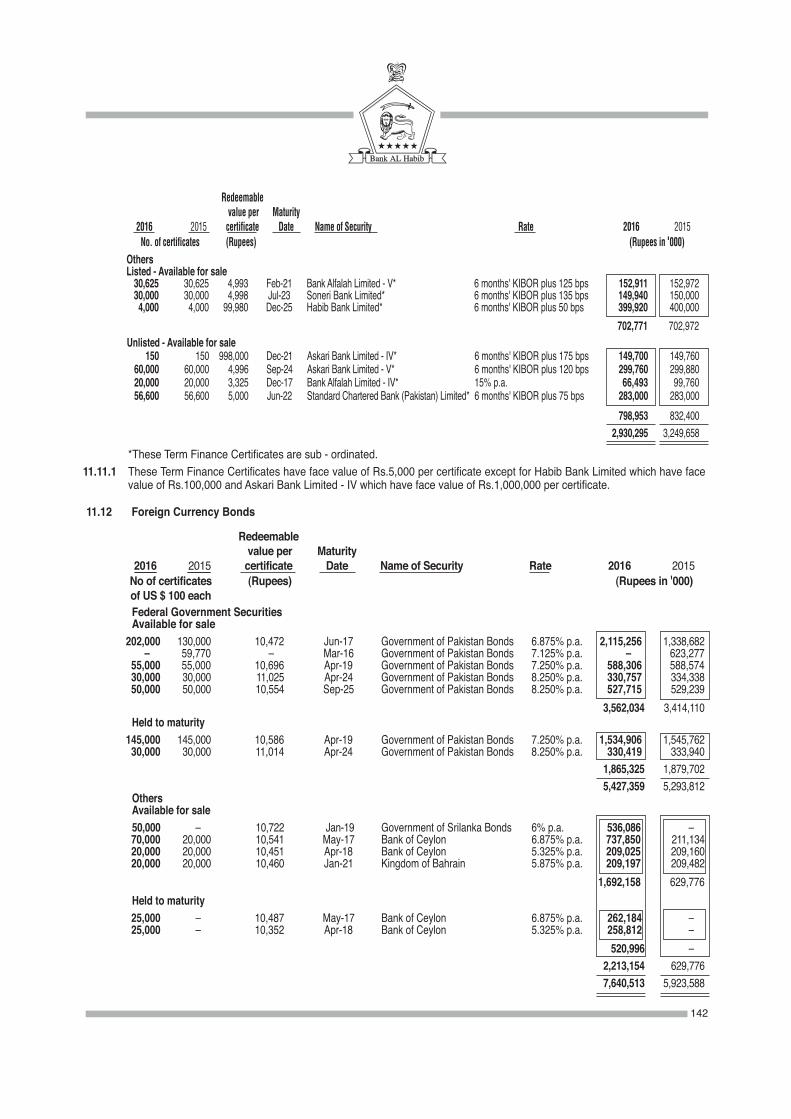
Unlisted - Available for sale 150 150 998,000 Dec-21 Askari Bank Limited - IV* 6 months' KIBOR plus 175 bps 149,700 149,760 60,000 60,000 4,996 Sep-24 Askari Bank Limited - V* 6 months' KIBOR plus 120 bps 299,760 299,880 20,000 20,000 3,325 Dec-17 Bank Alfalah Limited - IV* 15% p.a. 66,493 99,760 56,600 56,600 5,000 Jun-22 Standard Chartered Bank (Pakistan) Limited* 6 months' KIBOR plus 75 bps 283,000 283,000 798,953 832,400 2,930,295 3,249,658 *These Term Finance Certificates are sub - ordinated.11.11.1 These Term Finance Certificates have face value of Rs.5,000 per certificate except for Habib Bank Limited which have face
value of Rs.100,000 and Askari Bank Limited - IV which have face value of Rs.1,000,000 per certificate.
11.12 Foreign Currency Bonds
Redeemable value per Maturity 2016 2015 certificate Date Name of Security Rate 2016 2015 No of certificates (Rupees) (Rupees in '000) of US $ 100 each Federal Government Securities Available for sale 202,000 130,000 10,472 Jun-17 Government of Pakistan Bonds 6.875% p.a. 2,115,256 1,338,682 –00 59,770 –00 Mar-16 Government of Pakistan Bonds 7.125% p.a. –00 623,277 55,000 55,000 10,696 Apr-19 Government of Pakistan Bonds 7.250% p.a. 588,306 588,574 30,000 30,000 11,025 Apr-24 Government of Pakistan Bonds 8.250% p.a. 330,757 334,338 50,000 50,000 10,554 Sep-25 Government of Pakistan Bonds 8.250% p.a. 527,715 529,239 3,562,034 3,414,110 Held to maturity 145,000 145,000 10,586 Apr-19 Government of Pakistan Bonds 7.250% p.a. 1,534,906 1,545,762 30,000 30,000 11,014 Apr-24 Government of Pakistan Bonds 8.250% p.a. 330,419 333,940 1,865,325 1,879,702 5,427,359 5,293,812 Others Available for sale 50,000 –00 10,722 Jan-19 Government of Srilanka Bonds 6% p.a. 536,086 –00 70,000 20,000 10,541 May-17 Bank of Ceylon 6.875% p.a. 737,850 211,134 20,000 20,000 10,451 Apr-18 Bank of Ceylon 5.325% p.a. 209,025 209,160 20,000 20,000 10,460 Jan-21 Kingdom of Bahrain 5.875% p.a. 209,197 209,482 1,692,158 629,776 Held to maturity 25,000 –00 10,487 May-17 Bank of Ceylon 6.875% p.a. 262,184 –00 25,000 –00 10,352 Apr-18 Bank of Ceylon 5.325% p.a. 258,812 –00 520,996 –00 2,213,154 629,776 7,640,513 5,923,588
Others Listed - Available for sale 30,625 30,625 4,993 Feb-21 Bank Alfalah Limited - V* 6 months' KIBOR plus 125 bps 152,911 152,972 30,000 30,000 4,998 Jul-23 Soneri Bank Limited* 6 months' KIBOR plus 135 bps 149,940 150,000 4,000 4,000 99,980 Dec-25 Habib Bank Limited* 6 months' KIBOR plus 50 bps 399,920 400,000 702,771 702,972
Redeemable value per Maturity 2016 2015 certificate Date Name of Security Rate 2016 2015 No. of certificates (Rupees) (Rupees in '000)
142
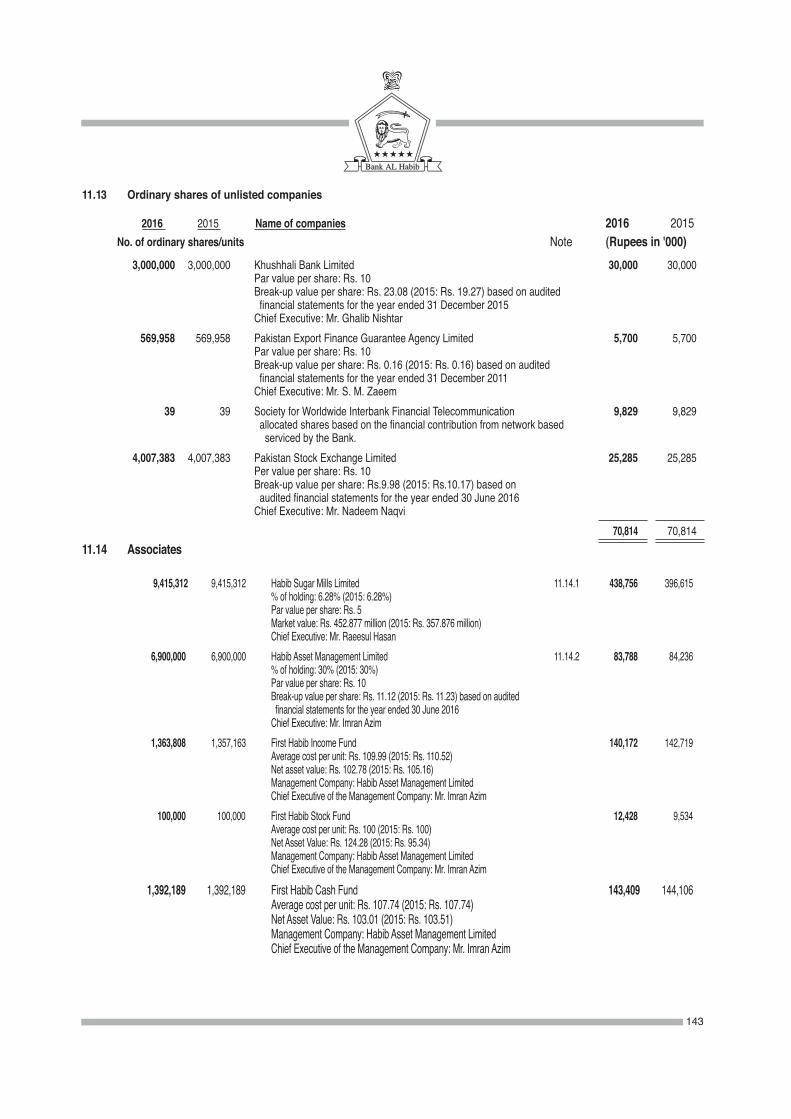
11.13 Ordinary shares of unlisted companies
3,000,000 3,000,000 Khushhali Bank Limited 30,000 30,000 Par value per share: Rs. 10 Break-up value per share: Rs. 23.08 (2015: Rs. 19.27) based on audited financial statements for the year ended 31 December 2015 Chief Executive: Mr. Ghalib Nishtar 569,958 569,958 Pakistan Export Finance Guarantee Agency Limited 5,700 5,700 Par value per share: Rs. 10 Break-up value per share: Rs. 0.16 (2015: Rs. 0.16) based on audited financial statements for the year ended 31 December 2011 Chief Executive: Mr. S. M. Zaeem 39 39 Society for Worldwide Interbank Financial Telecommunication 9,829 9,829 allocated shares based on the financial contribution from network based serviced by the Bank. 4,007,383 4,007,383 Pakistan Stock Exchange Limited 25,285 25,285 Per value per share: Rs. 10 Break-up value per share: Rs.9.98 (2015: Rs.10.17) based on audited financial statements for the year ended 30 June 2016 Chief Executive: Mr. Nadeem Naqvi 70,814 70,814
2016 2015 Name of companies 2016 2015 No. of ordinary shares/units Note (Rupees in '000)
9,415,312 9,415,312 Habib Sugar Mills Limited 11.14.1 438,756 396,615 % of holding: 6.28% (2015: 6.28%) Par value per share: Rs. 5 Market value: Rs. 452.877 million (2015: Rs. 357.876 million) Chief Executive: Mr. Raeesul Hasan 6,900,000 6,900,000 Habib Asset Management Limited 11.14.2 83,788 84,236 % of holding: 30% (2015: 30%) Par value per share: Rs. 10 Break-up value per share: Rs. 11.12 (2015: Rs. 11.23) based on audited financial statements for the year ended 30 June 2016 Chief Executive: Mr. Imran Azim 1,363,808 1,357,163 First Habib Income Fund 140,172 142,719 Average cost per unit: Rs. 109.99 (2015: Rs. 110.52) Net asset value: Rs. 102.78 (2015: Rs. 105.16) Management Company: Habib Asset Management Limited Chief Executive of the Management Company: Mr. Imran Azim 100,000 100,000 First Habib Stock Fund 12,428 9,534 Average cost per unit: Rs. 100 (2015: Rs. 100) Net Asset Value: Rs. 124.28 (2015: Rs. 95.34) Management Company: Habib Asset Management Limited Chief Executive of the Management Company: Mr. Imran Azim 1,392,189 1,392,189 First Habib Cash Fund 143,409 144,106 Average cost per unit: Rs. 107.74 (2015: Rs. 107.74) Net Asset Value: Rs. 103.01 (2015: Rs. 103.51) Management Company: Habib Asset Management Limited Chief Executive of the Management Company: Mr. Imran Azim
11.14 Associates
143
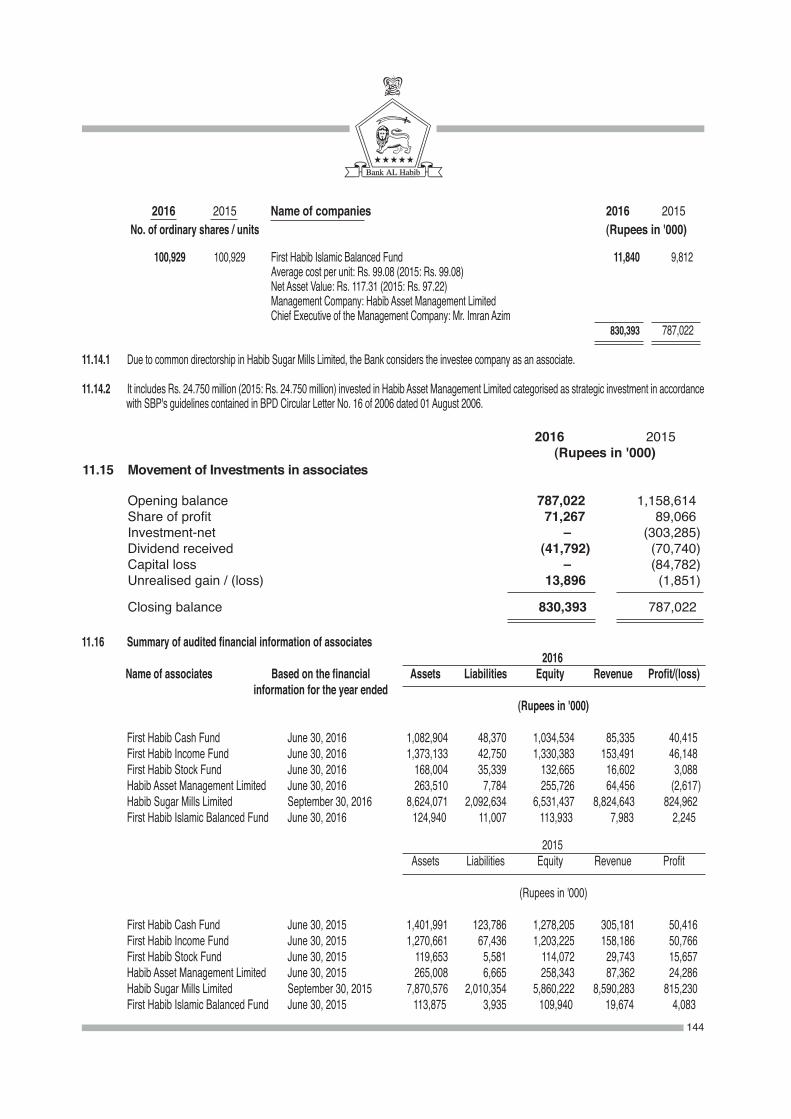
100,929 100,929 First Habib Islamic Balanced Fund 11,840 9,812 Average cost per unit: Rs. 99.08 (2015: Rs. 99.08) Net Asset Value: Rs. 117.31 (2015: Rs. 97.22) Management Company: Habib Asset Management Limited Chief Executive of the Management Company: Mr. Imran Azim 830,393 787,022
11.14.1 Due to common directorship in Habib Sugar Mills Limited, the Bank considers the investee company as an associate.
11.14.2 It includes Rs. 24.750 million (2015: Rs. 24.750 million) invested in Habib Asset Management Limited categorised as strategic investment in accordance with SBP's guidelines contained in BPD Circular Letter No. 16 of 2006 dated 01 August 2006.
2016 2015 Name of companies 2016 2015 No. of ordinary shares / units (Rupees in '000)
2016 2015 (Rupees in '000)11.15 Movement of Investments in associates Opening balance 787,022 1,158,614 Share of profit 71,267 89,066 Investment-net –00 (303,285 ) Dividend received (41,792 ) (70,740 ) Capital loss –00 (84,782 ) Unrealised gain / (loss) 13,896 (1,851 )
Closing balance 830,393 787,022
11.16 Summary of audited financial information of associates 2016 Name of associates Based on the financial Assets Liabilities Equity Revenue Profit/(loss) information for the year ended (Rupees in '000)
First Habib Cash Fund June 30, 2016 1,082,904 48,370 1,034,534 85,335 40,415 First Habib Income Fund June 30, 2016 1,373,133 42,750 1,330,383 153,491 46,148 First Habib Stock Fund June 30, 2016 168,004 35,339 132,665 16,602 3,088 Habib Asset Management Limited June 30, 2016 263,510 7,784 255,726 64,456 (2,617 ) Habib Sugar Mills Limited September 30, 2016 8,624,071 2,092,634 6,531,437 8,824,643 824,962 First Habib Islamic Balanced Fund June 30, 2016 124,940 11,007 113,933 7,983 2,245
2015 Assets Liabilities Equity Revenue Profit (Rupees in '000)
First Habib Cash Fund June 30, 2015 1,401,991 123,786 1,278,205 305,181 50,416 First Habib Income Fund June 30, 2015 1,270,661 67,436 1,203,225 158,186 50,766 First Habib Stock Fund June 30, 2015 119,653 5,581 114,072 29,743 15,657 Habib Asset Management Limited June 30, 2015 265,008 6,665 258,343 87,362 24,286 Habib Sugar Mills Limited September 30, 2015 7,870,576 2,010,354 5,860,222 8,590,283 815,230 First Habib Islamic Balanced Fund June 30, 2015 113,875 3,935 109,940 19,674 4,083
144
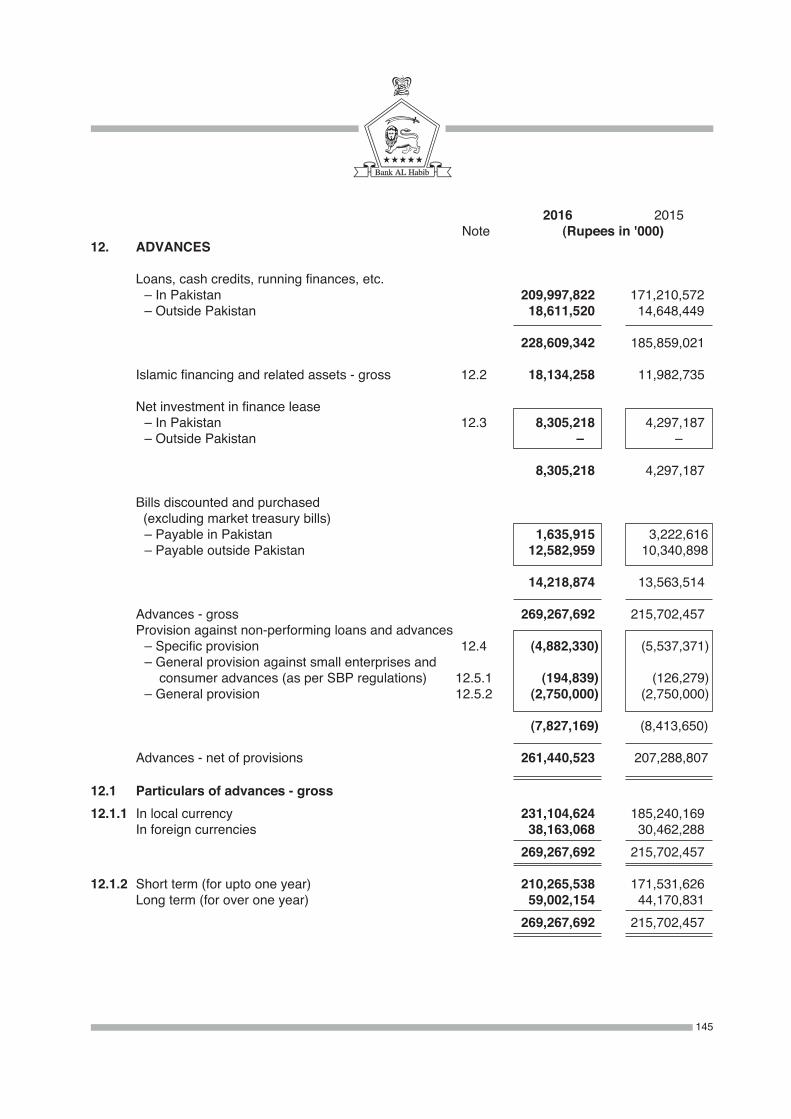
2016 2015 Note (Rupees in '000)12. ADVANCES Loans, cash credits, running finances, etc. – In Pakistan 209,997,822 171,210,572 – Outside Pakistan 18,611,520 14,648,449
228,609,342 185,859,021
Islamic financing and related assets - gross 12.2 18,134,258 11,982,735
Net investment in finance lease – In Pakistan 12.3 8,305,218 4,297,187 – Outside Pakistan –00 –000 8,305,218 4,297,187
Bills discounted and purchased (excluding market treasury bills) – Payable in Pakistan 1,635,915 3,222,616 – Payable outside Pakistan 12,582,959 10,340,898
14,218,874 13,563,514
Advances - gross 269,267,692 215,702,457 Provision against non-performing loans and advances – Specific provision 12.4 (4,882,330) (5,537,371 ) – General provision against small enterprises and consumer advances (as per SBP regulations) 12.5.1 (194,839) (126,279 ) – General provision 12.5.2 (2,750,000) (2,750,000 ) (7,827,169) (8,413,650) Advances - net of provisions 261,440,523 207,288,807
12.1 Particulars of advances - gross 12.1.1 In local currency 231,104,624 185,240,169 In foreign currencies 38,163,068 30,462,288 269,267,692 215,702,457
12.1.2 Short term (for upto one year) 210,265,538 171,531,626 Long term (for over one year) 59,002,154 44,170,831 269,267,692 215,702,457
145
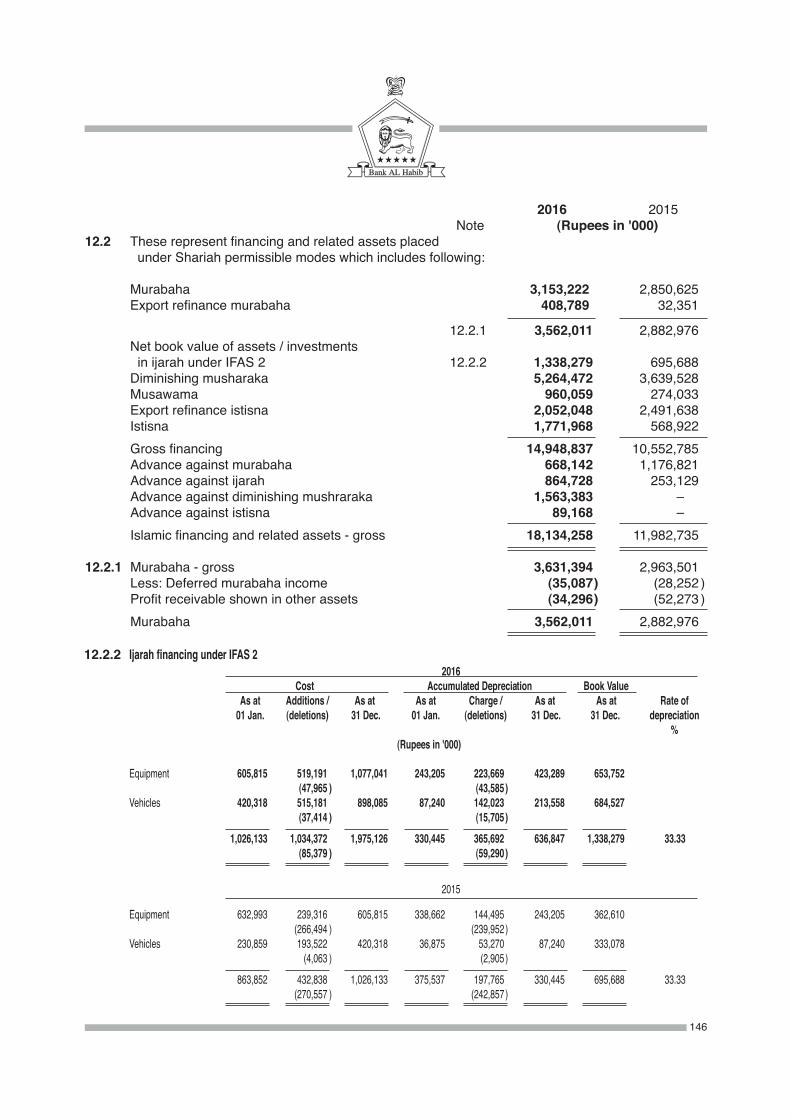
12.2.2 Ijarah financing under IFAS 2
2015
Equipment 632,993 239,316 605,815 338,662 144,495 243,205 362,610 (266,494 ) (239,952 ) Vehicles 230,859 193,522 420,318 36,875 53,270 87,240 333,078 (4,063 ) (2,905 ) 863,852 432,838 1,026,133 375,537 197,765 330,445 695,688 33.33 (270,557 ) (242,857 )
2016 Cost Accumulated Depreciation Book Value As at Additions / As at As at Charge / As at As at Rate of 01 Jan. (deletions) 31 Dec. 01 Jan. (deletions) 31 Dec. 31 Dec. depreciation % (Rupees in '000)
Equipment 605,815 519,191 1,077,041 243,205 223,669 423,289 653,752 (47,965 ) (43,585 ) Vehicles 420,318 515,181 898,085 87,240 142,023 213,558 684,527 (37,414 ) (15,705 ) 1,026,133 1,034,372 1,975,126 330,445 365,692 636,847 1,338,279 33.33 (85,379 ) (59,290 )
2016 2015 Note (Rupees in '000)12.2 These represent financing and related assets placed under Shariah permissible modes which includes following: Murabaha 3,153,222 2,850,625 Export refinance murabaha 408,789 32,351
12.2.1 3,562,011 2,882,976 Net book value of assets / investments in ijarah under IFAS 2 12.2.2 1,338,279 695,688 Diminishing musharaka 5,264,472 3,639,528 Musawama 960,059 274,033 Export refinance istisna 2,052,048 2,491,638 Istisna 1,771,968 568,922 Gross financing 14,948,837 10,552,785 Advance against murabaha 668,142 1,176,821 Advance against ijarah 864,728 253,129 Advance against diminishing mushraraka 1,563,383 –00 Advance against istisna 89,168 –00 Islamic financing and related assets - gross 18,134,258 11,982,735
12.2.1 Murabaha - gross 3,631,394 2,963,501 Less: Deferred murabaha income (35,087 ) (28,252 ) Profit receivable shown in other assets (34,296 ) (52,273 ) Murabaha 3,562,011 2,882,976
146

2016 Classified advances Provision required Provision held Domestic Overseas Total Domestic Overseas Total Domestic Overseas Total (Rupees in '000) Category of classification Other assets especially mentioned 18,908 –00 18,908 530 –00 530 530 –00 530 Substandard 94,120 –00 94,120 23,071 –00 23,071 23,071 –00 23,071 Doubtful 1,426,456 –00 1,426,456 699,328 –00 699,328 699,328 –00 699,328 Loss 3,235,378 940,604 4,175,982 3,218,793 940,604 4,159,397 3,218,797 940,604 4,159,401 4,774,862 940,604 5,715,466 3,941,722 940,604 4,882,326 3,941,726 940,604 4,882,330 2015 Classified advances Provision required Provision held Domestic Overseas Total Domestic Overseas Total Domestic Overseas Total (Rupees in '000)
Other assets especially mentioned 3,335 –00 3,335 40 –00 40 40 –00 40 Substandard 43,810 –00 43,810 10,940 –00 10,940 10,940 –00 10,940 Doubtful 599,534 –00 599,534 299,767 –00 299,767 309,485 –00 309,485 Loss 4,280,034 947,661 5,227,695 4,269,245 947,661 5,216,906 4,269,245 947,661 5,216,906 4,926,713 947,661 5,874,374 4,579,992 947,661 5,527,653 4,589,710 947,661 5,537,371
12.4 Advances include Rs. 5,715.466 million (2015: Rs 5,874.374 million) which have been placed under non-performing status as detailed below:
12.4.1 For the purposes of determining provision against non - performing advances, the Bank has not taken into account the Forced Sales Value of pledged stock and mortgaged properties held as collateral against non - performing advances.
12.2.2.1 Future Ijarah payments receivable 2016 2015 (Rupees in '000)
Not later than one year 516,871 287,100 Later than one year and not later than five years 758,045 378,456 1,274,916 665,55612.3 Net investment in finance lease 2016 2015 Later than Later than Not later one and Not later one and than one less than Over five than one less than Over five year five years years Total year five years years Total (Rupees in '000)
Lease rentals receivable 2,945,964 4,204,933 –0 7,150,897 1,684,785 2,161,445 –0 3,846,230 Residual value 313,626 1,663,587 –0 1,977,213 88,205 810,705 –0 898,910 Minimum lease payments 3,259,590 5,868,520 –0 9,128,110 1,772,990 2,972,150 –0 4,745,140 Financial charges for future periods (396,369 ) (426,523 ) –0 (822,892 ) (235,365 ) (212,588 ) –0 (447,953 ) Present value of minimum lease payments 2,863,221 5,441,997 –0 8,305,218 1,537,625 2,759,562 –0 4,297,187
147
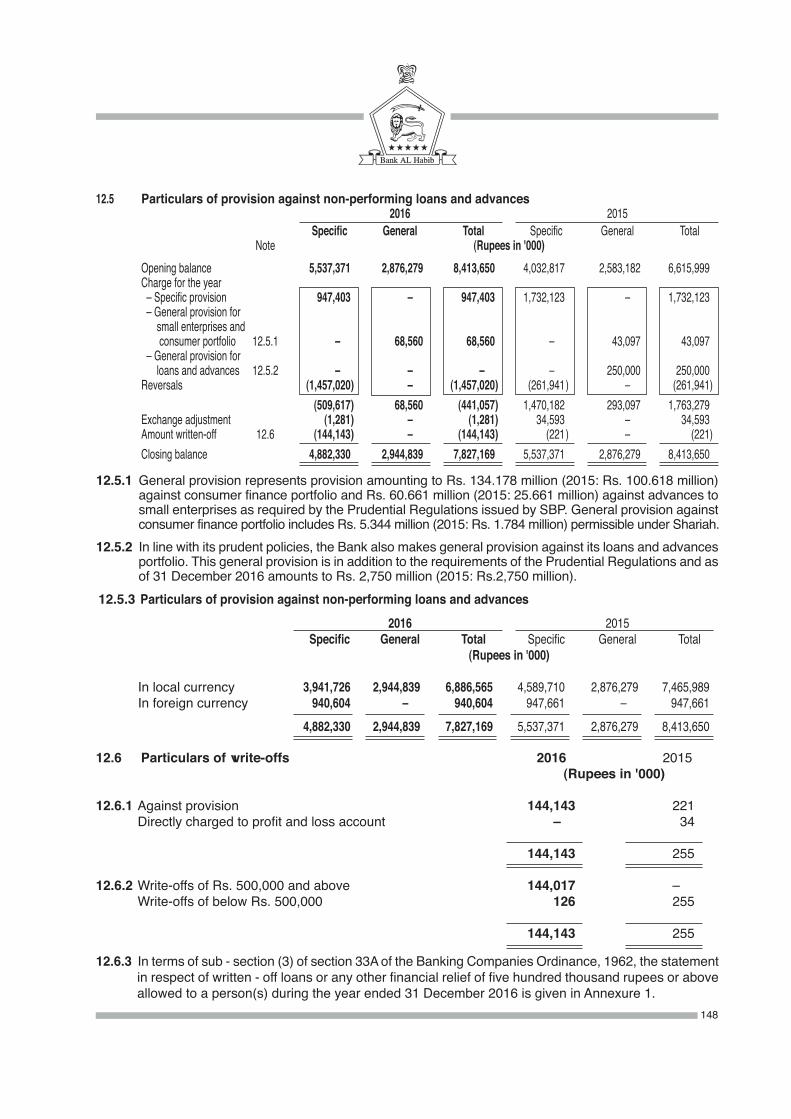
12.5 Particulars of provision against non-performing loans and advances 2016 2015 Specific General Total Specific General Total Note (Rupees in '000) Opening balance 5,537,371 2,876,279 8,413,650 4,032,817 2,583,182 6,615,999 Charge for the year – Specific provision 947,403 –00 947,403 1,732,123 –00 1,732,123 – General provision for small enterprises and consumer portfolio 12.5.1 –00 68,560 68,560 –00 43,097 43,097 – General provision for loans and advances 12.5.2 –00 –00 –00 –00 250,000 250,000 Reversals (1,457,020 ) –00 (1,457,020 ) (261,941 ) –00 (261,941 ) (509,617 ) 68,560 (441,057 ) 1,470,182 293,097 1,763,279 Exchange adjustment (1,281 ) –00 (1,281 ) 34,593 –00 34,593 Amount written-off 12.6 (144,143 ) –00 (144,143 ) (221 ) –00 (221 ) Closing balance 4,882,330 2,944,839 7,827,169 5,537,371 2,876,279 8,413,650
12.5.3 Particulars of provision against non-performing loans and advances 2016 2015 Specific General Total Specific General Total (Rupees in '000)
In local currency 3,941,726 2,944,839 6,886,565 4,589,710 2,876,279 7,465,989 In foreign currency 940,604 –00 940,604 947,661 –00 947,661 4,882,330 2,944,839 7,827,169 5,537,371 2,876,279 8,413,650
12.5.1 General provision represents provision amounting to Rs. 134.178 million (2015: Rs. 100.618 million) against consumer finance portfolio and Rs. 60.661 million (2015: 25.661 million) against advances to small enterprises as required by the Prudential Regulations issued by SBP. General provision against consumer finance portfolio includes Rs. 5.344 million (2015: Rs. 1.784 million) permissible under Shariah.
12.5.2 In line with its prudent policies, the Bank also makes general provision against its loans and advances portfolio. This general provision is in addition to the requirements of the Prudential Regulations and as of 31 December 2016 amounts to Rs. 2,750 million (2015: Rs.2,750 million).
12.6 Particulars of write-offs 2016 2015 (Rupees in '000)
12.6.1 Against provision 144,143 221 Directly charged to profit and loss account –00 34
144,143 255
12.6.2 Write-offs of Rs. 500,000 and above 144,017 –00 Write-offs of below Rs. 500,000 126 255
144,143 255
12.6.3 In terms of sub - section (3) of section 33A of the Banking Companies Ordinance, 1962, the statement in respect of written - off loans or any other financial relief of five hundred thousand rupees or above allowed to a person(s) during the year ended 31 December 2016 is given in Annexure 1.
148
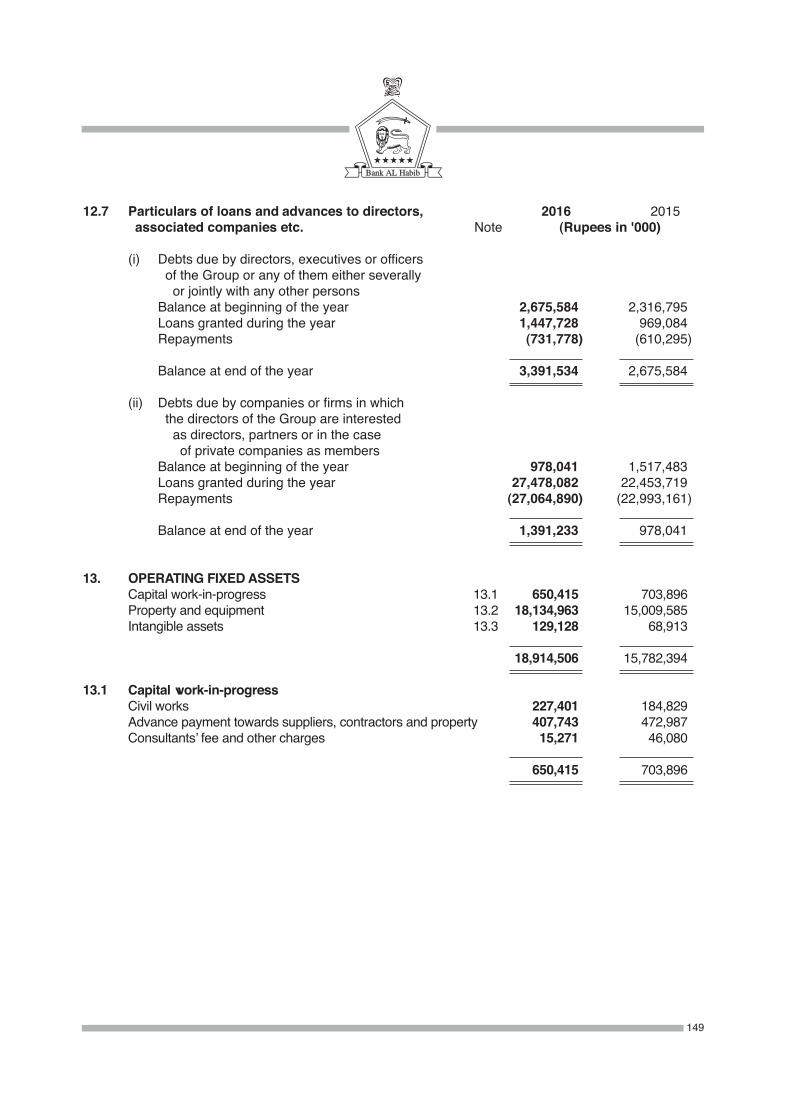
12.7 Particulars of loans and advances to directors, 2016 2015 associated companies etc. Note (Rupees in '000)
(i) Debts due by directors, executives or officers of the Group or any of them either severally or jointly with any other persons Balance at beginning of the year 2,675,584 2,316,795 Loans granted during the year 1,447,728 969,084
Repayments (731,778 ) (610,295 )
Balance at end of the year 3,391,534 2,675,584
(ii) Debts due by companies or firms in which the directors of the Group are interested as directors, partners or in the case of private companies as members Balance at beginning of the year 978,041 1,517,483 Loans granted during the year 27,478,082 22,453,719 Repayments (27,064,890 ) (22,993,161 )
Balance at end of the year 1,391,233 978,041
13. OPERATING FIXED ASSETS Capital work-in-progress 13.1 650,415 703,896 Property and equipment 13.2 18,134,963 15,009,585 Intangible assets 13.3 129,128 68,913
18,914,506 15,782,394
13.1 Capital work-in-progress Civil works 227,401 184,829 Advance payment towards suppliers, contractors and property 407,743 472,987 Consultants’ fee and other charges 15,271 46,080
650,415 703,896
149
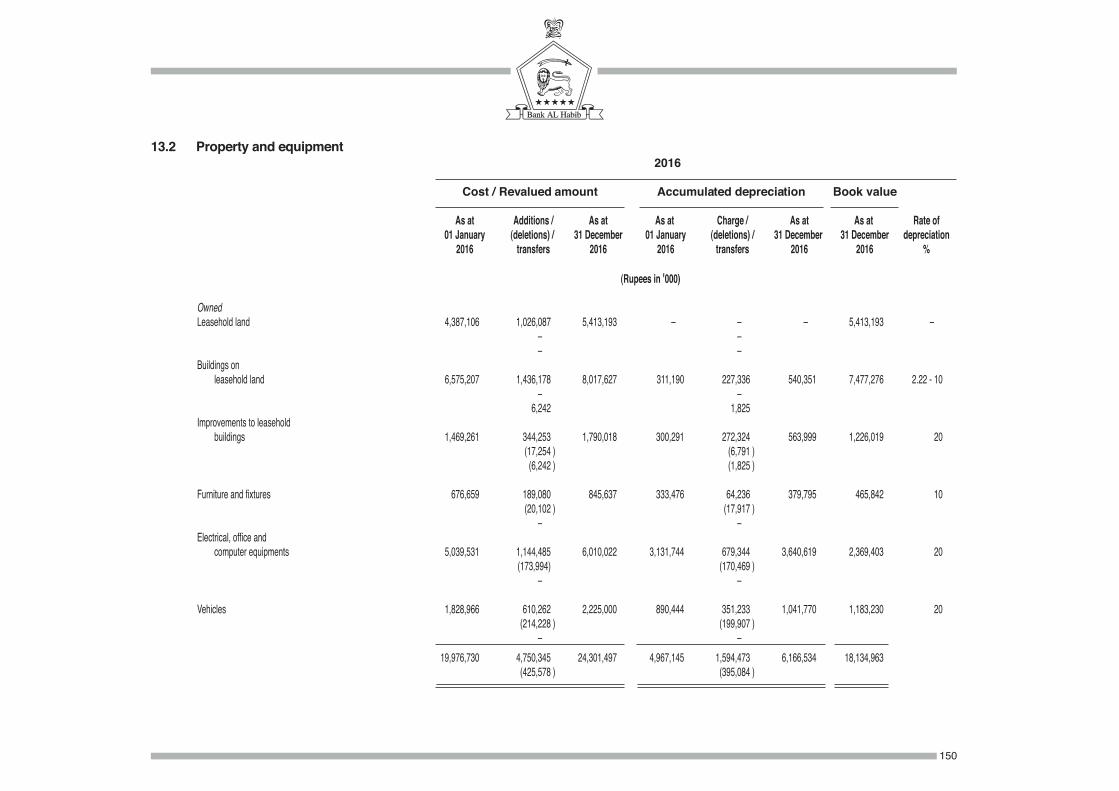
13.2 Property and equipment 2016
Cost / Revalued amount Accumulated depreciation Book value
As at Additions / As at As at Charge / As at As at Rate of 01 January (deletions) / 31 December 01 January (deletions) / 31 December 31 December depreciation 2016 transfers 2016 2016 transfers 2016 2016 %
(Rupees in '000)
Owned Leasehold land 4,387,106 1,026,087 5,413,193 –00 –00 –00 5,413,193 –00 –00 –00 –00 –00 00 Buildings on leasehold land 6,575,207 1,436,178 8,017,627 311,190 227,336 540,351 7,477,276 2.22 - 10 –00 –00 00 6,242 1,825 Improvements to leasehold buildings 1,469,261 344,253 1,790,018 300,291 272,324 563,999 1,226,019 20 (17,254 ) (6,791 ) (6,242 ) (1,825 )
Furniture and fixtures 676,659 189,080 845,637 333,476 64,236 379,795 465,842 10 (20,102 ) (17,917 ) –00 –00 Electrical, office and computer equipments 5,039,531 1,144,485 6,010,022 3,131,744 679,344 3,640,619 2,369,403 20 (173,994) (170,469 ) –00 –00
Vehicles 1,828,966 610,262 2,225,000 890,444 351,233 1,041,770 1,183,230 20(214,228 ) (199,907 )
–00 –00 19,976,730 4,750,345 24,301,497 4,967,145 1,594,473 6,166,534 18,134,963 (425,578 ) (395,084 )
150
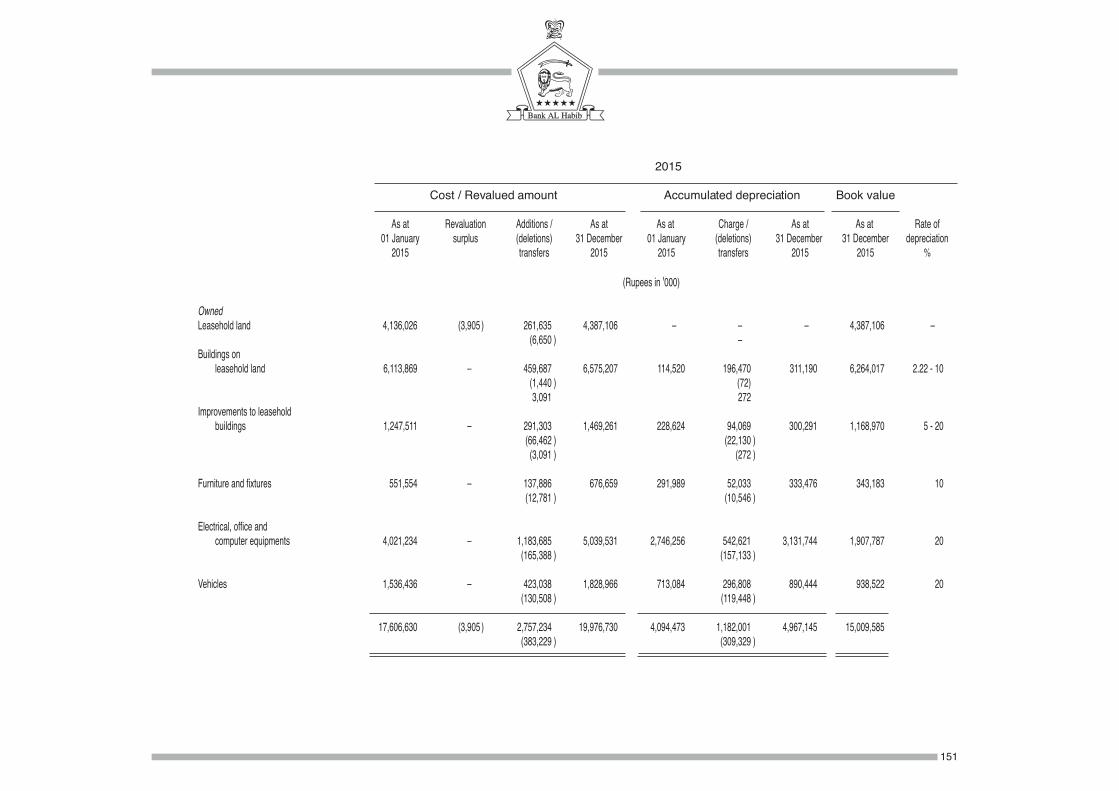
2015
Cost / Revalued amount Accumulated depreciation Book value
As at Revaluation Additions / As at As at Charge / As at As at Rate of 01 January surplus (deletions) 31 December 01 January (deletions) 31 December 31 December depreciation 2015 transfers 2015 2015 transfers 2015 2015 %
(Rupees in '000)
Owned Leasehold land 4,136,026 (3,905 ) 261,635 4,387,106 –00 –00 –00 4,387,106 –00 (6,650 ) –00 00 Buildings on leasehold land 6,113,869 –00 459,687 6,575,207 114,520 196,470 311,190 6,264,017 2.22 - 10 (1,440 ) (72) 00 3,091 272 Improvements to leasehold buildings 1,247,511 –00 291,303 1,469,261 228,624 94,069 300,291 1,168,970 5 - 20 (66,462 ) (22,130 ) (3,091 ) (272 )
Furniture and fixtures 551,554 –00 137,886 676,659 291,989 52,033 333,476 343,183 10 (12,781 ) (10,546 )
Electrical, office and computer equipments 4,021,234 –00 1,183,685 5,039,531 2,746,256 542,621 3,131,744 1,907,787 20 (165,388 ) (157,133 )
Vehicles 1,536,436 –00 423,038 1,828,966 713,084 296,808 890,444 938,522 20(130,508 ) (119,448 )
17,606,630 (3,905 ) 2,757,234 19,976,730 4,094,473 1,182,001 4,967,145 15,009,585 (383,229 ) (309,329 )
151
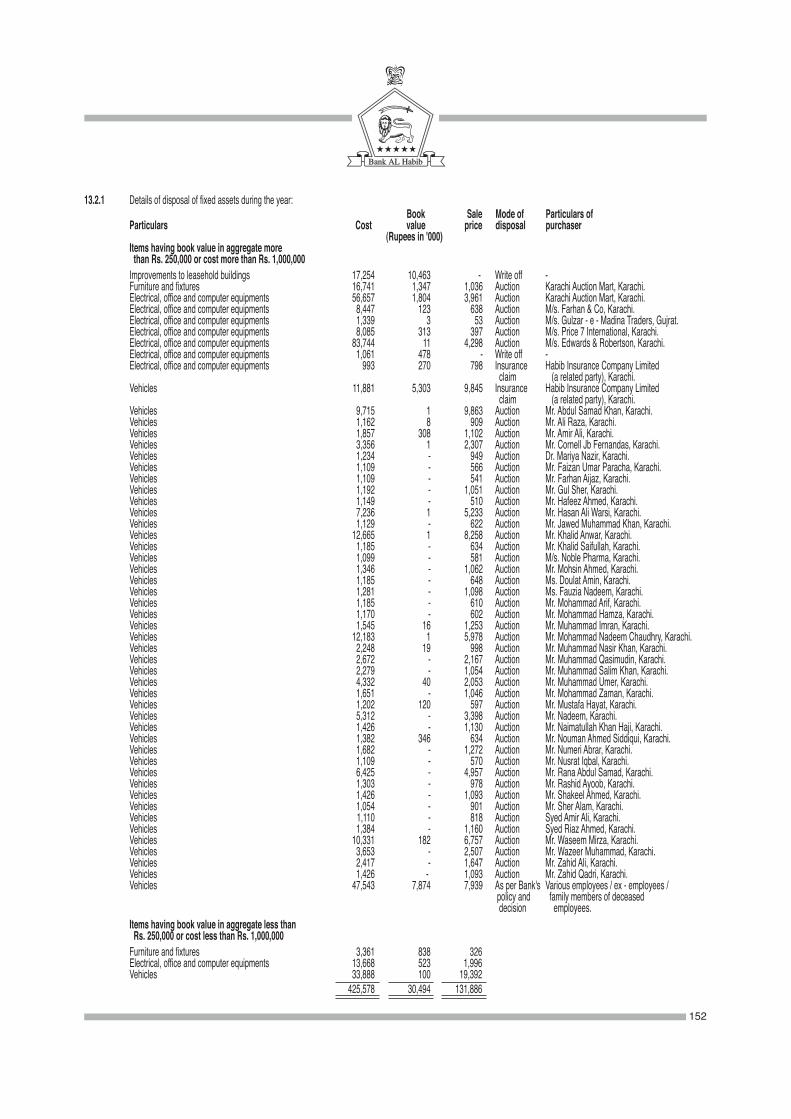
13.2.1 Details of disposal of fixed assets during the year: Book Sale Mode of Particulars of
Particulars Cost value price disposal purchaser (Rupees in '000) Items having book value in aggregate more than Rs. 250,000 or cost more than Rs. 1,000,000 Improvements to leasehold buildings 17,254 10,463 - Write off - Furniture and fixtures 16,741 1,347 1,036 Auction Karachi Auction Mart, Karachi. Electrical, office and computer equipments 56,657 1,804 3,961 Auction Karachi Auction Mart, Karachi. Electrical, office and computer equipments 8,447 123 638 Auction M/s. Farhan & Co, Karachi. Electrical, office and computer equipments 1,339 3 53 Auction M/s. Gulzar - e - Madina Traders, Gujrat. Electrical, office and computer equipments 8,085 313 397 Auction M/s. Price 7 International, Karachi. Electrical, office and computer equipments 83,744 11 4,298 Auction M/s. Edwards & Robertson, Karachi. Electrical, office and computer equipments 1,061 478 - Write off - Electrical, office and computer equipments 993 270 798 Insurance Habib Insurance Company Limited
claim (a related party), Karachi. Vehicles 11,881 5,303 9,845 Insurance Habib Insurance Company Limited claim (a related party), Karachi. Vehicles 9,715 1 9,863 Auction Mr. Abdul Samad Khan, Karachi. Vehicles 1,162 8 909 Auction Mr. Ali Raza, Karachi. Vehicles 1,857 308 1,102 Auction Mr. Amir Ali, Karachi. Vehicles 3,356 1 2,307 Auction Mr. Cornell Jb Fernandas, Karachi. Vehicles 1,234 - 949 Auction Dr. Mariya Nazir, Karachi. Vehicles 1,109 - 566 Auction Mr. Faizan Umar Paracha, Karachi. Vehicles 1,109 - 541 Auction Mr. Farhan Aijaz, Karachi. Vehicles 1,192 - 1,051 Auction Mr. Gul Sher, Karachi. Vehicles 1,149 - 510 Auction Mr. Hafeez Ahmed, Karachi. Vehicles 7,236 1 5,233 Auction Mr. Hasan Ali Warsi, Karachi. Vehicles 1,129 - 622 Auction Mr. Jawed Muhammad Khan, Karachi.
Vehicles 12,665 1 8,258 Auction Mr. Khalid Anwar, Karachi. Vehicles 1,185 - 634 Auction Mr. Khalid Saifullah, Karachi. Vehicles 1,099 - 581 Auction M/s. Noble Pharma, Karachi. Vehicles 1,346 - 1,062 Auction Mr. Mohsin Ahmed, Karachi. Vehicles 1,185 - 648 Auction Ms. Doulat Amin, Karachi. Vehicles 1,281 - 1,098 Auction Ms. Fauzia Nadeem, Karachi. Vehicles 1,185 - 610 Auction Mr. Mohammad Arif, Karachi. Vehicles 1,170 - 602 Auction Mr. Mohammad Hamza, Karachi. Vehicles 1,545 16 1,253 Auction Mr. Muhammad Imran, Karachi. Vehicles 12,183 1 5,978 Auction Mr. Mohammad Nadeem Chaudhry, Karachi. Vehicles 2,248 19 998 Auction Mr. Muhammad Nasir Khan, Karachi.
Vehicles 2,672 - 2,167 Auction Mr. Muhammad Qasimudin, Karachi. Vehicles 2,279 - 1,054 Auction Mr. Muhammad Salim Khan, Karachi. Vehicles 4,332 40 2,053 Auction Mr. Muhammad Umer, Karachi. Vehicles 1,651 - 1,046 Auction Mr. Mohammad Zaman, Karachi. Vehicles 1,202 120 597 Auction Mr. Mustafa Hayat, Karachi. Vehicles 5,312 - 3,398 Auction Mr. Nadeem, Karachi. Vehicles 1,426 - 1,130 Auction Mr. Naimatullah Khan Haji, Karachi. Vehicles 1,382 346 634 Auction Mr. Nouman Ahmed Siddiqui, Karachi. Vehicles 1,682 - 1,272 Auction Mr. Numeri Abrar, Karachi. Vehicles 1,109 - 570 Auction Mr. Nusrat Iqbal, Karachi. Vehicles 6,425 - 4,957 Auction Mr. Rana Abdul Samad, Karachi. Vehicles 1,303 - 978 Auction Mr. Rashid Ayoob, Karachi. Vehicles 1,426 - 1,093 Auction Mr. Shakeel Ahmed, Karachi. Vehicles 1,054 - 901 Auction Mr. Sher Alam, Karachi. Vehicles 1,110 - 818 Auction Syed Amir Ali, Karachi. Vehicles 1,384 - 1,160 Auction Syed Riaz Ahmed, Karachi. Vehicles 10,331 182 6,757 Auction Mr. Waseem Mirza, Karachi. Vehicles 3,653 - 2,507 Auction Mr. Wazeer Muhammad, Karachi. Vehicles 2,417 - 1,647 Auction Mr. Zahid Ali, Karachi. Vehicles 1,426 - 1,093 Auction Mr. Zahid Qadri, Karachi. Vehicles 47,543 7,874 7,939 As per Bank's Various employees / ex - employees / policy and family members of deceased
decision employees. Items having book value in aggregate less than Rs. 250,000 or cost less than Rs. 1,000,000 Furniture and fixtures 3,361 838 326 Electrical, office and computer equipments 13,668 523 1,996 Vehicles 33,888 100 19,392 425,578 30,494 131,886
152
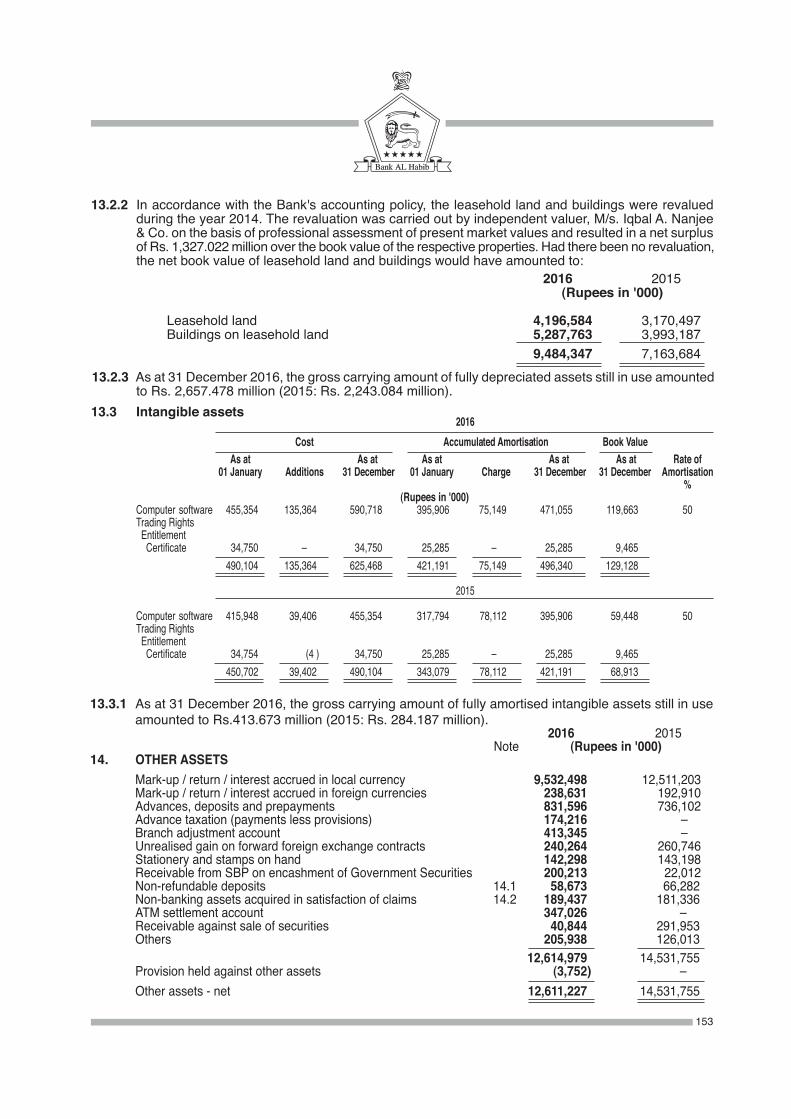
13.2.2 In accordance with the Bank's accounting policy, the leasehold land and buildings were revalued during the year 2014. The revaluation was carried out by independent valuer, M/s. Iqbal A. Nanjee & Co. on the basis of professional assessment of present market values and resulted in a net surplus of Rs. 1,327.022 million over the book value of the respective properties. Had there been no revaluation, the net book value of leasehold land and buildings would have amounted to: 2016 2015
(Rupees in '000)
Leasehold land 4,196,584 3,170,497 Buildings on leasehold land 5,287,763 3,993,187 9,484,347 7,163,68413.2.3 As at 31 December 2016, the gross carrying amount of fully depreciated assets still in use amounted
to Rs. 2,657.478 million (2015: Rs. 2,243.084 million). 13.3 Intangible assets
2016 Cost Accumulated Amortisation Book Value As at As at As at As at As at Rate of 01 January Additions 31 December 01 January Charge 31 December 31 December Amortisation % (Rupees in '000)Computer software 455,354 135,364 590,718 395,906 75,149 471,055 119,663 50Trading Rights Entitlement Certificate 34,750 –00 34,750 25,285 –00 25,285 9,465 490,104 135,364 625,468 421,191 75,149 496,340 129,128
2015
Computer software 415,948 39,406 455,354 317,794 78,112 395,906 59,448 50Trading Rights Entitlement Certificate 34,754 (4 ) 34,750 25,285 –00 25,285 9,465 450,702 39,402 490,104 343,079 78,112 421,191 68,913
13.3.1 As at 31 December 2016, the gross carrying amount of fully amortised intangible assets still in use amounted to Rs.413.673 million (2015: Rs. 284.187 million).
2016 2015 Note (Rupees in '000)14. OTHER ASSETS Mark-up / return / interest accrued in local currency 9,532,498 12,511,203 Mark-up / return / interest accrued in foreign currencies 238,631 192,910 Advances, deposits and prepayments 831,596 736,102 Advance taxation (payments less provisions) 174,216 –00 Branch adjustment account 413,345 –00 Unrealised gain on forward foreign exchange contracts 240,264 260,746 Stationery and stamps on hand 142,298 143,198 Receivable from SBP on encashment of Government Securities 200,213 22,012 Non-refundable deposits 14.1 58,673 66,282 Non-banking assets acquired in satisfaction of claims 14.2 189,437 181,336 ATM settlement account 347,026 –00 Receivable against sale of securities 40,844 291,953 Others 205,938 126,013 12,614,979 14,531,755 Provision held against other assets (3,752 ) –00 Other assets - net 12,611,227 14,531,755
153
14.1 Represent deposits paid in relation to acquisition of some of the Bank's properties. These are being written - off over the periods ranging from 10 to 20 years (being estimated useful lives of related properties).
14.2 During the year, the Bank revalued its non - banking assets acquired in satisfaction of claims according to the requirements of the 'Regulations for Debt Property Swap' (the regulations) issued by SBP vide its BPRD Circular No. 1 of 2016, dated 1 January 2016. Had there been no revaluation, the net book value of non - banking assets acquired in satisfaction of claims would have amounted to: 2016 2015
Note (Rupees in '000) Leasehold land 129,836 129,836 Buildings on leasehold land 46,350 51,500 176,186 181,336
15. BILLS PAYABLE In Pakistan 13,872,057 8,665,462
16. BORROWINGS In Pakistan 92,572,633 62,586,995 Outside Pakistan 1,144,712 5,304
93,717,345 62,592,29916.1 Particulars of borrowings with respect to currencies In local currency 88,388,693 62,586,995 In foreign currencies 5,328,652 5,304
93,717,345 62,592,299
16.2 Details of borrowings Secured Borrowings from SBP Export refinance scheme 16.3 20,143,239 19,118,954 Long term financing for export oriented projects –00 4,246 Long term financing for imported and locally manufactured plant and machinery 16.4 5,632,293 3,953,374 Financing facility for storage of agricultural produce 16.5 56,875 36,861 25,832,407 23,113,435 Repurchase agreement borrowings 16.6 62,556,286 39,473,560 88,388,693 62,586,995 Unsecured Borrowings from financial institutions 16.7 4,183,940 –00 Overdrawn nostros 1,144,712 5,304 5,328,652 5,304
93,717,345 62,592,299
154
16.3 These carry mark - up rates ranging from 1% to 2% (2015: 2.50% to 3.50%) per annum, payable quarterly at the time of partial payment or upon maturity of loan, whichever is earlier.
16.4 These carry mark - up rates ranging from 2% to 8.8% (2015: 2.00% to 10.10% ) per annum having maturity periods upto ten years.
16.5 These carry mark - up rate of 3.50% (2015: 3.50% to 7.50%) per annum having maturity periods upto 2 to 3 years.
16.6 These repurchase agreement borrowings are secured against market treasury bills, which carry mark - up rates ranging from 5.85% to 5.88% (2015: 6.10% to 6.21%) per annum, having maturity periods upto one month.
16.7 This carry mark - up rate of 1.75% (2015: Nil) having maturity period upto three months.
2016 2015 Note (Rupees in '000)17. DEPOSITS AND OTHER ACCOUNTS Customers Fixed deposits 114,762,820 120,268,519 Savings deposits 170,130,029 150,427,540 Current accounts - Remunerative 72,737,910 57,094,573 Current accounts - Non-remunerative 210,377,190 175,902,813
568,007,949 503,693,445
Financial institutions Remunerative deposits 14,144,649 11,451,951 Non-remunerative deposits 2,013,380 1,052,151
16,158,029 12,504,102
584,165,978 516,197,547
17.1 Particulars of deposits In local currency 515,722,554 454,111,416 In foreign currencies 68,443,424 62,086,131
584,165,978 516,197,547
17.2 Deposits include Rs. 22,607.349 million (2015: Rs. 14,718.557 million) placed under permissible Shariah modes.
18. SUB-ORDINATED LOANS - unsecured
Term Finance Certificates (TFCs) - IV - (Unquoted) 18.1 –000 2,994,600 Term Finance Certificates (TFCs) - V - (Unquoted) 18.2 3,999,200 –000
3,999,200 2,994,600
18.1 During the year, the Bank exercised the Call option of Term Finance Certificates - IV in accordance with the Trust Deed and Terms and Conditions for the TFC issue, after completing the regulatory requirements. Accordingly, the said TFCs were redeemed in full on 30 June 2016.
155
18.2 Term Finance Certificates - V (Unquoted) Total issue Rupees 4,000 million Rating AA Rate Payable six monthly at six months’ KIBOR plus 0.75% without any floor and cap Redemption 6th - 108th month: 0.36%; 114th and 120th month: 49.82% each Tenor 10 years Maturity March 2026 2016 2015 Note (Rupees in '000) 19. DEFERRED TAX LIABILITIES Taxable temporary differences arising in respect of: Accelerated depreciation 1,127,666 1,029,564 Surplus on revaluation of fixed assets / non - banking assets 22.1 770,977 797,630 Surplus on revaluation of held for trading investments 1,186 –000 Surplus on revaluation of available for sale investments 22.2 2,125,680 1,870,538 4,025,509 3,697,732 Deductible temporary differences arising in respect of: Provision against non-performing loans and advances (32,071 ) (106,412 ) Provision for compensated absences (252 ) (308 ) Recognised tax losses (8,446 ) (8,728 ) Intangible assets (212 ) –00 Provision against diminution in the value of investments (570 ) (69,761 ) Remeasurement of defined benefit plan 144,023 115,089 102,472 (70,120 ) 4,127,981 3,627,61219.1 Reconciliation of deferred tax Balance Recognised in Recognised Balance as at profit and in surplus on as at 01 January loss revaluation 31 December 2016 account of assets 2016 (Rupees in '000) Taxable temporary differences arising in respect of: Accelerated depreciation 1,029,564 98,102 –00 1,127,666 Surplus on revaluation of fixed assets / non-banking assets 797,630 (28,662 ) 2,009 770,977 Surplus on revaluation of held for trading investments –00 1,186 –00 1,186 Surplus on revaluation of available for sale investments 1,870,538 –00 255,142 2,125,680 3,697,732 70,626 257,151 4,025,509 Deductible temporary differences arising in respect of: Provision against non-performing loans and advances (106,412 ) 74,341 –00 (32,071 ) Provision for compensated absences (308 ) 56 –00 (252 ) Recognised tax losses (8,728 ) 282 –00 (8,446 ) Intangible assets –00 (212 ) –00 (212 ) Provision against diminution in the value of investments (69,761 ) 69,191 –00 (570 ) Remeasurement of defined benefit plan 115,089 28,934 –00 144,023 (70,120 ) 172,592 –00 102,472 3,627,612 243,218 257,151 4,127,981
156
2016 2015 Note (Rupees in '000) 20. OTHER LIABILITIES Mark-up / return / interest payable in local currency 1,834,030 1,784,449 Mark-up / return / interest payable in foreign currencies 148,230 131,580 Provision for compensated absences 20.1 417,084 362,923 Taxation (Provisions less payments) –00 297,889 Unclaimed dividends 290,390 229,596 Branch adjustment account –00 73,247 Special exporters’ accounts in foreign currencies 73,644 78,524 Unearned commission income 115,154 86,016 Security deposits against leases / ijarah 2,232,355 1,054,304 Other security deposits 417,763 369,690 Unearned loss on forward foreign exchange contracts 745,531 472,048 Workers’ welfare fund 722,198 1,063,508 Accrued expenses 673,667 607,116 Payable to defined benefit plan 37.4 411,494 328,824 Provision against off-balance sheet items 20.2 102,257 144,042 Payable to SBP / NBP 81,759 320,683 Payable to supplier against murabaha 158,459 103,247 Payable against purchase of securities 22,422 18,016 Charity payable 2,738 2,690 Insurance payable 232,448 132,061 Payable against sale of marketable securities on behalf of customers 46,379 12,630 Others 313,668 342,423 9,041,670 8,015,506
20.1 Provision for compensated absences has been determined on the basis of independent actuarial valuation. The significant assumptions used for actuarial valuation were as follows:
2016 2015 (% per annum) Discount rate 9.25% 10% Expected rate of increase in salary in future years 8.25% 9%
Balance Recognised in Recognised Balance as at profit and in surplus on as at 01 January loss revaluation 31 December 2015 account of assets 2015 (Rupees in '000) Taxable temporary differences arising in respect of: Accelerated depreciation 957,579 71,985 –00 1,029,564 Surplus on revaluation of fixed assets / non-banking assets 826,092 (28,462 ) –00 797,630 Surplus on revaluation of held for trading investments –00 –00 –00 –00 Surplus on revaluation of available for sale investments 936,986 –00 933,552 1,870,538 2,720,657 43,523 933,552 3,697,732 Deductible temporary differences arising in respect of: Provision against non-performing loans and advances (16,558 ) (89,854 ) –00 (106,412 ) Provision for compensated absences (653 ) 345 –00 (308 ) Recognised tax losses (10,861 ) 2,133 –00 (8,728 ) Intangible assets (593 ) 593 –00 –00 Provision against diminution in the value of investments (570 ) (69,191 ) –00 (69,761 ) Remeasurement of defined benefit plan 78,430 36,659 –00 115,089 49,195 (119,315 ) –00 (70,120 ) 2,769,852 (75,792 ) 933,552 3,627,612
157

20.2 Provision against off-balance sheet items Opening balance 144,042 105,507 Charge for the year 4,549 38,535 Reversal during the year (46,334 ) –00 (41,785 ) 38,525 Closing balance 102,257 144,042
21. SHARE CAPITAL 2016 2015 (Number of shares) Authorised Capital 1,500,000,000 1,500,000,000 Ordinary shares of Rs.10/- each 15,000,000 15,000,000
Issued, subscribed and paid-up capital
30,000,000 30,000,000 Issued for cash 300,000 300,000 1,081,425,416 1,081,425,416 Issued as bonus shares 10,814,254 10,814,254
1,111,425,416 1,111,425,416 11,114,254 11,114,254
21.1 As of statement of financial position date 197,857,620 (2015: 202,920,855) ordinary shares of Rs. 10/- each were held by the related parties.
2016 2015 (Rupees in '000)
22. SURPLUS ON REVALUATION OF ASSETS - NET OF TAX Fixed assets / non - banking assets 22.1 2,650,950 2,692,363 Available for sale investments 22.2 4,023,367 3,528,100 6,674,317 6,220,46322.1 Fixed assets / non - banking assets Balance at beginning of the year 3,489,993 3,575,215 Surplus / (adjustment) on revaluation of the Bank’s fixed assets / non - banking assets during the year 13,825 (3,905 ) Transfer to unappropriated profit in respect of incremental depreciation charged during the year (81,891 ) (81,317 )
3,421,927 3,489,993 Related deferred tax liability on: Balance at beginning of the year 797,630 826,092 Revaluation of Bank’s fixed assets / non - banking assets during the year 2,009 –00 Transfer to unappropriated profit in respect of incremental depreciation charged during the year (28,662 ) (28,462 ) (770,977 ) (797,630 ) 2,650,950 2,692,363
2016 2015 Note (Rupees in '000)
158
22.2 Available for sale investments Federal Government Securities 4,460,781 4,543,743 Fully paid-up ordinary shares 1,199,280 716,974
Term finance certificates, sukuk bonds and foreign currency bonds and other 71,968 49,163 Units of mutual funds 417,018 88,758 6,149,047 5,398,638 Related deferred tax liability (2,125,680 ) (1,870,538 ) 4,023,367 3,528,100
22.2.1 This includes surplus of Rs. 31.963 million (2015: Rs. 11.300 million) on revaluation of available for sale securities placed as per arrangements permissible under Shariah.
23. CONTINGENCIES AND COMMITMENTS23.1 Direct credit substitutes Financial guarantees issued favouring: - Financial institutions 930,792 462,800 - Others 4,695,734 5,086,805 5,626,526 5,549,60523.2 Transaction-related contingent liabilities Guarantees issued favouring: - Government 34,649,327 29,798,948 - Financial institutions 594,401 668,750 - Others 11,682,502 6,743,423 46,926,230 37,211,12123.3 Trade-related contingent liabilities Letters of credit 107,641,921 77,847,579 Acceptances 16,622,601 13,547,110 Bankers liability rediscount 1,898,680 –000 126,163,202 91,394,689
23.4 Commitments in respect of forward lending Commitments to extend credit (excluding commitments that are unilaterally cancellable) 10,967,104 10,748,236
23.5 Commitments in respect of forward exchange contracts Purchase 49,396,754 46,760,182 Sale 28,383,678 28,769,804 The maturities of above contracts are spread over the periods upto two years.23.6 Commitments for the acquisition of operating fixed assets 329,766 636,406
23.7 Claims against the Bank not acknowledged as debts 4,459,758 4,616,297
2016 2015 (Rupees in '000)
159
23.8 Other contingencies Income tax returns of the Bank have been submitted upto and including the Bank’s financial year
2015. The income tax assessments of the Bank are complete upto tax year 2013. For tax year 2012 and 2013, the Additional Commissioner Inland Revenue (ACIR) has passed
order u/s. 122(5A) of the Income Tax Ordinance, 2001 by disallowing certain expenses. Subsequently, amended order was received from ACIR based on a rectification application filed by the Bank resulting in net aggregate tax impact of Rs. 797.233 million. The Bank has filed an appeal before the Commissioner Inland Revenue (Appeals) against the above mentioned orders.
Commissioner Inland Revenue (Appeals) has passed appellate orders for tax years 2009 and 2011 by confirming disallowance of provision for non - performing loans, other provisions and amortisation of intangible assets having an aggregate tax impact of Rs. 15.372 million. The Bank has filed an appeal before Income Tax Appellate Tribunal against the above referred orders.
The management, based on the opinion of its tax advisor, is confident about the favourable outcome of the above matters.
24. DERIVATIVE FINANCIAL INSTRUMENTS The Group deals in derivative financial instruments namely forward foreign exchange contracts and
foreign currency swaps with the principal view of hedging the risks arising from its trade business. As per the Group’s policy, these contracts are reported on their fair value at the statement of financial position date. The gains and losses from revaluation of these contracts are included under “income from dealing in foreign currencies”. Unrealised gains and losses on these contracts are recorded in the statement of financial position under “other assets / other liabilities”. These products are offered to the Group’s customers to protect from unfavourable movements in foreign currencies. The Group hedges such exposures in the inter - bank foreign exchange market.
2016 2015 (Rupees in '000)25. MARK-UP / RETURN / INTEREST EARNED On loans and advances to: Customers 14,337,370 14,576,038 Financial institutions 152,532 118,231 14,489,902 14,694,269 On investments: Available for sale securities 19,438,987 20,743,672 Held to maturity securities 13,533,230 14,635,744 32,972,217 35,379,416
On deposits with financial institutions 201,180 169,715 On securities purchased under resale agreements 60,084 52,961 On Bai Muajjal 95,468 13,086 On call money lendings 1,600 816 47,820,451 50,310,263
25.1 These include Rs. 1,320.354 million (2015: Rs. 1,155.163 million) pertaining to Islamic banking out of which Rs. 82.387 million (2015: Rs. 84.825 million) represents profit from placements permissible under Shariah.
26. MARK-UP / RETURN / INTEREST EXPENSED Deposits 17,440,420 18,502,643 Sub-ordinated loans 444,277 458,513 Repurchase agreement borrowings 3,904,952 5,028,611 Borrowings from SBP 603,166 969,378 Other borrowings 739,536 516,412 23,132,351 25,475,557
160
2016 2015 (Rupees in '000)27. DIVIDEND INCOME Listed shares Adamjee Insurance Company Limited 525 150 AL - Ghazi Tractors Limited 600 –00 Allied Bank Limited 5,472 5,417 Askari Bank Limited –00 150 Attock Petroleum Limited 7,866 6,166 Attock Refinery Limited 500 –00 Cherat Cement Company Limited 506 900 D.G. Khan Cement Company Limited 1,500 1,250 Dawood Hercules Corporation Limited 519 –00 EFU General Insurance Limited 50 –00 Engro Corporation Limited 5,340 858 Engro Fertilizer Limited 2,750 699 Fatima Fertilizer Company Limited 313 –00 Fauji Cement Company Limited 2,960 750 Fauji Fertilizer Bin Qasim Limited 305 10,440 Fauji Fertilizer Company Limited 38,690 38,600 Faysal Bank Limited 100 –00 First Habib Modaraba 294 323 Habib Bank Limited 16,983 12,630 Habib Metropolitan Bank Limited 30,055 55,920 Hascol Petroleum Limited 175 –00 Hub Power Company Limited 98,951 74,849 ICI Pakistan Limited 450 –00 Indus Motor Company Limited 1,539 –00 International Industries Limited 238 210 International Steels Limited 7,029 –00 Kot Addu Power Company Limited 59,702 46,337 Lalpir Power Limited 4,944 4,189 Lucky Cement Limited 100 248 MCB Bank Limited 14,073 6,478 Meezan Bank Limited –00 357 Millat Tractors Limited 600 –00 Nishat Chunian Power Limited 32,268 35,183 Oil & Gas Development Company Limited –00 443 Packages Limited 263 158 Pak Electron Limited 313 125 Pakgen Power Limited 9,648 8,830 Pakistan Oilfields Limited 33,218 32,533 Pakistan Petroleum Limited 3,987 14,128 Pakistan State Oil Company Limited 11,806 9,375 Pakistan Stock Exchange Limited 601 1,483 Pakistan Telecommunication Company Limited 7,033 949 Pioneer Cement Limited 188 –00 Rafhan Maize Products Company Limited 384 –00 Shell Pakistan Limited 360 180 Soneri Bank Limited 20,677 11,580 Standard Chartered Bank (Pakistan) Limited 6,366 7,162 The SEARLE Company Limited 150 –00 United Bank Limited 13,715 12,247 444,106 401,297 Mutual funds National Investment (Unit) Trust 49,647 46,889 NIT Government Bond Fund 36,461 67,089 NIT Government Treasury Fund 998 –00 NIT Income Fund 13,241 21,081 NIT Islamic Equity Fund 10,520 –00 PIML Income Fund –00 308 110,867 135,367 554,973 536,664
161
2016 2015 Note (Rupees in '000)
28. GAIN ON SALE / REDEMPTION OF SECURITIES - NET Mutual funds –00 233,464 Government securities –00 26 Listed shares 722,579 (96,626 )
722,579 136,864
29. OTHER INCOME Gain on sale of operating fixed assets 101,392 56,359 Recovery of expenses from customers 29.1 209,117 178,839 Lockers rent 327 512 Cheque book issuance / cheque return charges 243,819 261,120 Banking charges 82,274 74,927 Others 90,335 123,741 727,264 695,498
29.1 Includes courier, SWIFT, postage and other charges recovered from customers.
30. ADMINISTRATIVE EXPENSES Salaries, allowances, etc. 7,931,020 6,761,742 Charge for defined benefit plan 37.6 217,568 171,390 Charge for defined contribution plan 319,518 263,530 Charge for employees compensated absences 54,174 49,654 Non-executive directors' fee, allowances and other expenses 9,975 8,325 Rent, taxes, insurance, electricity, etc. 2,376,725 2,057,585 Legal and professional charges 218,921 92,605 Communications 291,765 310,366 Repairs and maintenance 1,377,235 1,090,009 Security charges 815,480 712,443 Stationery and printing 443,690 386,179 Advertisement and publicity 326,010 324,846 Donations 30.1 184,900 49,100 Auditors' remuneration 30.2 6,541 4,440 Depreciation 1,600,197 1,182,001 Amortisation 82,759 85,720 Travelling and conveyance 158,737 142,898 Vehicle running expenses 361,745 343,853 Commission and brokerage 140,944 85,346 Subscriptions and publications 81,034 48,522 Clearing charges 88,170 92,812 Staff training 26,712 14,596 Entertainment and staff refreshment 289,002 160,256 Cleaning charges 109,488 81,978 Charitable expenses 51,341 40,219 CNIC verification charges 27,308 45,326 Others 191,663 143,503 17,782,622 14,749,244
162
2016 2015 Note (Rupees in '000)
30.1 The detail of donations is given below: Al-Sayyeda Benevolent Trust 1,500 1,500 Bank AL Habib Staff Benefit Trust 99,900 100 Cancer Research & Treatment Foundation –00 10,000 Childlife Foundation 5,000 –00 Developments in Literacy 500 –00 Friends of Punjab Institute of Cardiology 10,000 –00 GCU Endowment Fund Trust 1,000 1,000 Habib Education Trust 1,500 1,500 Habib Medical Trust 1,500 1,500 Habib Poor Fund 1,500 1,500 Husaini Hematology and Oncology Trust 10,000 –00 Institute of Management Sciences, Bahauddin Zakariya University –00 1,000 Jinnah Foundation (Memorial) Trust –00 2,000 Patients’ Aid Foundation 30,000 15,000 Rahmatbai Habib Food and Clothing Trust 1,500 1,500 Rahmatbai Habib Widows and Orphans Trust 1,500 1,500 Sindh Institute of Urology and Transplantation (SIUT) 15,000 7,500 The Citizens Foundation 4,000 3,500 The Health Foundation 500 –00 184,900 49,100
30.2 Auditors' remuneration Audit fee - standalone financial statements 2,770 2,532 Audit fee - consolidated financial statements 550 495 Half yearly review 825 710 Special certifications 1,681 253 Gratuity fund 83 75 Out of pocket expenses 632 375
6,541 4,440
31. OTHER (REVERSALS) / PROVISIONS / WRITE-OFFS (Reversal) / provision against off-balance sheet items (41,785 ) 38,535
Provision against other assets 3,752 –00 (38,033 ) 38,535
32. OTHER (REVERSALS) / CHARGES Workers’ welfare fund 32.1 (504,305 ) 251,874 Penalties imposed by SBP 12,061 50,538
(492,244 ) 302,412
32.1 This includes reversal of provision for Workers' Welfare Fund amounting to Rs. 773.160 million for the period from January 2008 to December 2013, based on Supreme Court's judgement dated November 10, 2016.
163
33. TAXATION For the year Current 4,304,844 4,509,205 Prior years 502,993 500,484 Deferred 243,218 (75,792 ) 5,051,055 4,933,897
33.1 Relationship between tax expense and accounting profit Profit before taxation 13,195,634 12,265,649
Tax at the applicable rate of 35% (2015: 35%) 4,618,472 4,292,977 Tax effects of: Expenses that are not deductible in determining taxable income 3,316 140,436 Tax effect of prior year provisions 33.1.1 502,993 500,484 Others (73,726 ) –00 5,051,055 4,933,89733.1.1 This amount includes super tax at the rate of 4% on income of Banks for the year ended 31 December
2014 (Tax Year 2015) introduced by the Federal Government vide Finance Act, 2015. This tax has been levied for financing the rehabilitation of internally displaced persons affected by the ongoing war on terror. This super tax has been extended for 31 December 2015 (Tax Year 2016).
34. BASIC AND DILUTED EARNINGS PER SHARE ATTRIBUTABLE TO EQUITY HOLDERS OF THE HOLDING COMPANY Profit after taxation - attributable to equity holders of the Holding company 8,143,343 7,332,742
(Number)
Weighted average number of ordinary shares 1,111,425,416 1,111,425,416
(Rupees)
Basic and diluted earnings per share 7.33 6.60
2016 2015 Note (Rupees in '000)35. CASH AND CASH EQUIVALENTS Cash and balances with treasury banks 8 50,600,061 38,577,760 Balances with other banks 9 2,910,200 3,204,284 Overdrawn nostros 16 (1,144,712 ) (5,304 )
52,365,549 41,776,740 (Numbers)36. STAFF STRENGTH Permanent 8,308 7,232 Temporary / on contractual basis 306 265 Group’s own staff at end of the year 8,614 7,497 Outsourced 2,180 1,918
Total staff strength 10,794 9,415
2016 2015 Note (Rupees in '000)
164

37. DEFINED BENEFIT PLAN
37.1 General description
The Bank operates an approved gratuity fund for all its confirmed employees, which is administered by the Trustees. The benefits under the gratuity scheme are payable on retirement at the age of 60 years or on earlier cessation of service as under:
Number of years of eligible service completed: Amount of gratuity payable: Less than 5 years Nil 5 years or more but less than 10 years 1/3rd of basic salary for each year served 10 years or more but less than 15 years 2/3rd of basic salary for each year served 15 years or more Full basic salary for each year served
37.2 Principal actuarial assumptions
The latest actuarial valuation of the scheme was carried out on 31 December 2016 and the significant assumptions used for actuarial valuation were as follows:
2016 201537.3 Significant Actuarial Assumptions Financial Assumptions Discount Rate 9.25% 10% Salary Increase Rate 8.25% 9%
Demographic Assumptions Mortality rates (for death in service) SLIC (2001-05)-1 SLIC (2001-05)-1 Rates of employee turnover Moderate Moderate
2016 2015 (Rupees in '000)37.4 Statement of Financial Position Present value of defined benefit obligation 1,938,013 1,622,662 Fair value of plan assets (1,526,519 ) (1,293,838 )
Deficit 411,494 328,824
37.5 Movement in net defined benefit liability Balance accrued as at beginning of the year 328,824 224,085 Net periodic benefit cost for the year ended 217,568 171,390 Employer’s contribution during the year (217,568 ) (171,390 ) Amount of remeasurements losses recognised in Other Comprehensive Income during the year 82,670 104,739
Balance accrued as at end of the year 411,494 328,824
165
2016 2015 (Rupees in '000)37.6 Defined Benefit Cost for the Year Cost recognised in Profit and Loss Account for the year Service cost Current service cost 186,216 159,496
Net interest cost Interest cost on defined benefit obligation 166,978 148,029 Interest income on plan assets (135,626 ) (136,135 )
Net interest cost 31,352 11,894
Cost recognised in Profit and Loss for the year 217,568 171,390
Remeasurements recognised in Other Comprehensive Income during the year
Actuarial loss on obligation 65,784 61,060 Actuarial loss on assets 16,886 43,679
Remeasurement loss recognised in Other Comprehensive Income 82,670 104,739
Total defined benefit cost recognised in Profit and Loss Account and Other Comprehensive Income 300,238 276,129
37.7 Movement in the present value of defined benefit obligation Present value of defined benefit obligation at beginning of year 1,622,662 1,327,761 Service cost 186,216 159,496 Interest cost on defined benefit obligation 166,978 148,029 Actual benefits paid during the year (103,627 ) (73,684 ) Actuarial loss on obligation 65,784 61,060
Present value of defined benefit obligation at end of year 1,938,013 1,622,662
37.8 Movement in the fair value of plan assets Fair value of plan assets at beginning of year 1,293,838 1,103,676 Interest income on plan assets 135,626 136,135 Actual contribution by employer 217,568 171,390 Actual benefits paid during the year (103,627 ) (73,684 ) Actuarial loss on plan assets (16,886 ) (43,679 )
Fair value of plan assets at end of year 1,526,519 1,293,838
37.9 Actual return on plan assets 153,787 154,698
166
2017 (Rupees in '000)37.10 Charge and contribution for the year ending 31 December 2017
Service cost Current service cost 218,742
Net interest cost
Interest cost on defined benefit obligation 184,786 Interest income on plan assets (148,369 )
Net interest cost 36,417
Cost to be recognised in Profit and loss account for the year 2017 255,159
2016 (Rupees in ‘000)37.11 Analysis of Present value of defined benefit obligation
Vested / Non-Vested
Vested Benefits 1,788,446 Non-Vested benefits 149,567 Total 1,938,013
Type of Benefits
Accumulated Benefit Obligation 868,323 Amounts attributed to future salary increases 1,069,690
Total 1,938,013
37.12 Remeasurements recognised in Other Comprehensive Income during the year Actuarial loss on obligation Gain due to change in financial assumptions (8,153 ) Loss due to change in experience adjustments 73,937
Total actuarial loss on obligation 65,784
Net return on plan assets over interest income Actuarial loss on plan assets 16,886
Remeasurements loss recognised in Other Comprehensive Income during the year 82,670
167
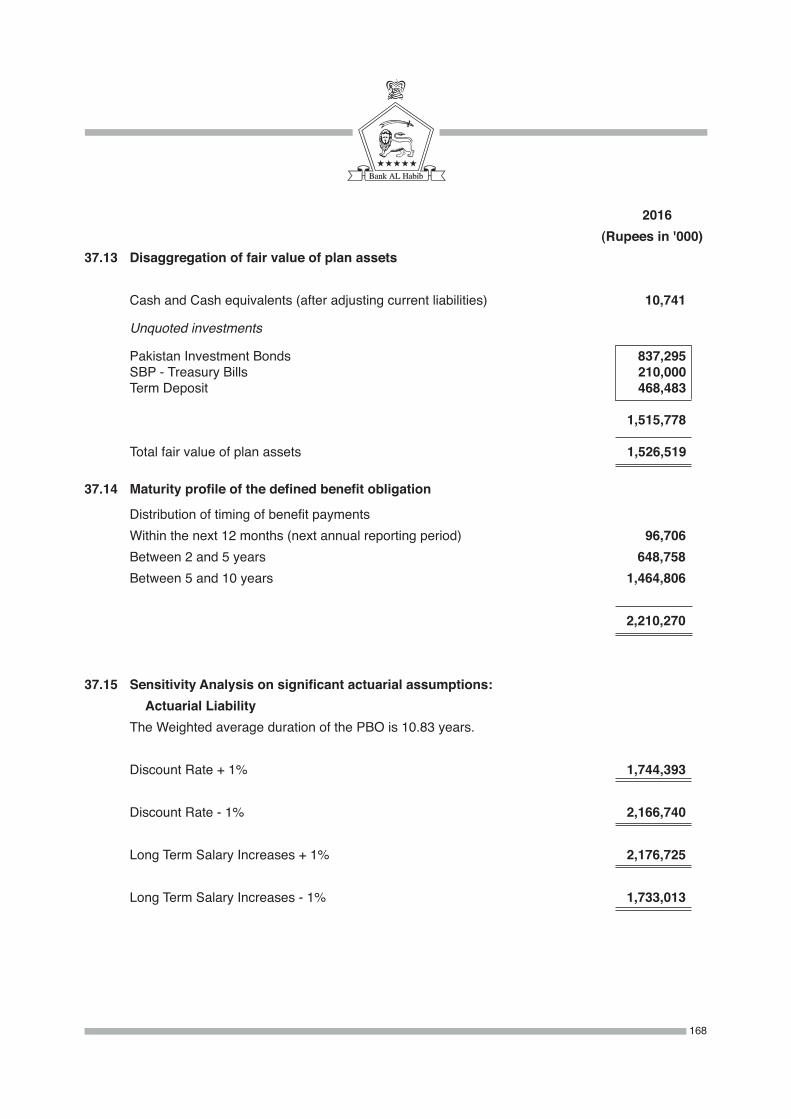
2016 (Rupees in '000)
37.13 Disaggregation of fair value of plan assets
Cash and Cash equivalents (after adjusting current liabilities) 10,741
Unquoted investments
Pakistan Investment Bonds 837,295 SBP - Treasury Bills 210,000 Term Deposit 468,483
1,515,778
Total fair value of plan assets 1,526,519
37.14 Maturity profile of the defined benefit obligation
Distribution of timing of benefit paymentsWithin the next 12 months (next annual reporting period) 96,706
Between 2 and 5 years 648,758 Between 5 and 10 years 1,464,806
2,210,270
37.15 Sensitivity Analysis on significant actuarial assumptions: Actuarial Liability The Weighted average duration of the PBO is 10.83 years. Discount Rate + 1% 1,744,393
Discount Rate - 1% 2,166,740
Long Term Salary Increases + 1% 2,176,725
Long Term Salary Increases - 1% 1,733,013
168

39. COMPENSATION OF DIRECTORS AND EXECUTIVES Chief Executive Directors Executives 2016 2015 2016 2015 2016 2015 (Rupees in '000)
Fee –00 –00 14,142 8,325 –00 –00 Managerial remuneration 20,467 16,000 15,227 10,400 2,270,838 1,844,656 Charge for defined benefit plan 9,655 1,333 12,611 867 324,772 271,751 Contribution to defined contribution plan 2,047 1,600 1,523 1,040 171,826 138,445 Rent and house maintenance 8,187 6,400 6,091 4,160 795,191 646,817 Utilities 3,986 3,361 1,542 1,057 198,798 161,685 Medical –00 51 100 47 69,105 55,552 Bonus 5,000 5,333 3,920 3,467 479,452 526,827 Others –00 –00 –00 –00 54,051 39,022
49,342 34,078 55,156 29,363 4,364,033 3,684,755
Number of person(s) 2* 1 10 9 2,066 1,592
Executives, including the Chief Executive and Executive Director, are entitled to Group's maintained cars in accordance with the terms of their employment and are entitled to medical and life insurance benefits in accordance with the policy of the Bank. In addition, the Chief Executive and Executive Director are also entitled to drivers, club memberships, security arrangements and payment of travel bills in accordance with their terms of employment.
Chairman of the Board is also entitled to Bank’s maintained cars, security guard services, payment of utility bills, club and entertainment bills, travelling bills, appropriate office, staff, and administrative support.
* This includes the former Chief Executive & Managing Director who retired during the year.40. FAIR VALUE OF FINANCIAL INSTRUMENTS Fair value is the amount for which an asset could be exchanged, or a liability settled, between
knowledgeable willing parties in an arm's length transaction. Fair value of financial instruments is based on:
Federal Government Securities PKRV rates (Reuters page) Listed securities Market prices Mutual funds Net asset values Unlisted equity investments Break - up value as per latest available audited financial statements Fair value of fixed term advances of over one year, staff loans and fixed term deposits of over one
year cannot be calculated with sufficient reliability due to non - availability of relevant active market for similar assets and liabilities. The provision for impairment of debt securities and loans and advances has been calculated in accordance with the Bank's accounting policies as stated in note 5.5 and 5.6.
38. DEFINED CONTRIBUTION PLAN
The general description of the plan is included in note 5.8.
169
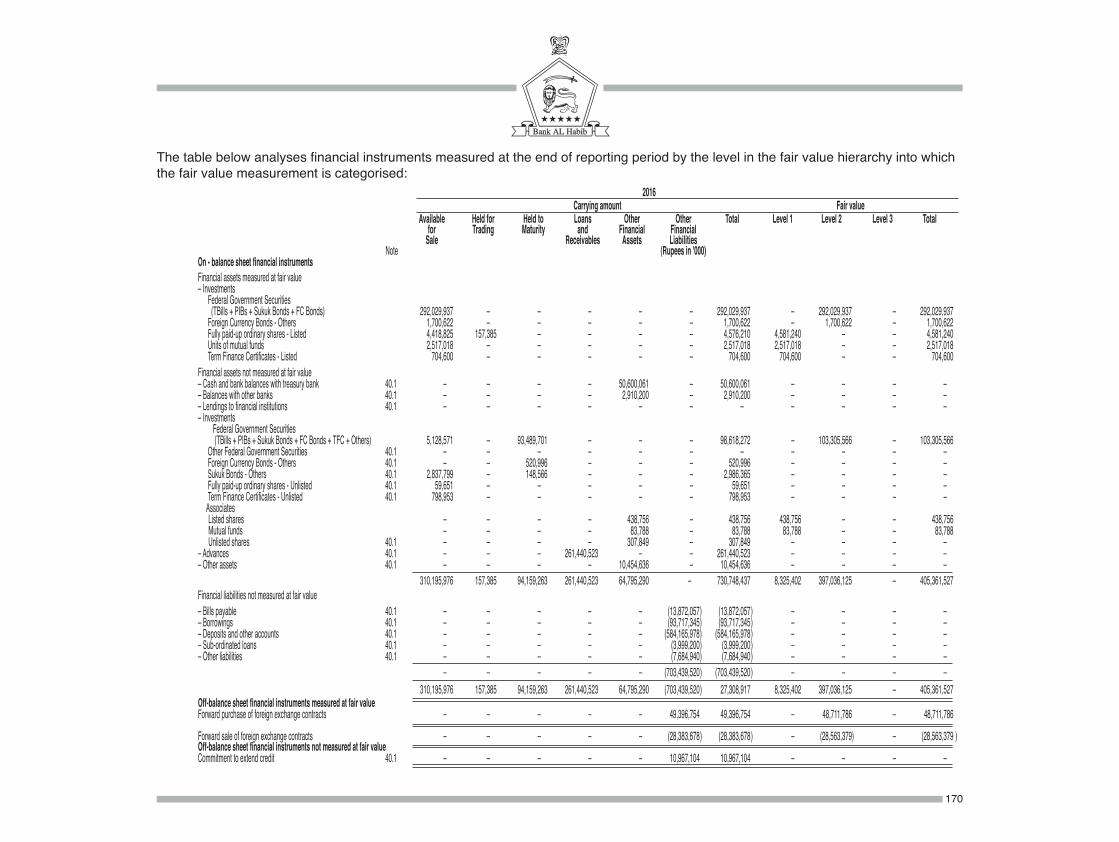
The table below analyses financial instruments measured at the end of reporting period by the level in the fair value hierarchy into which the fair value measurement is categorised: 2016 Carrying amount Fair value Available Held for Held to Loans Other Other Total Level 1 Level 2 Level 3 Total
for Trading Maturity and Financial FinancialSale Receivables Assets Liabilities
Note (Rupees in '000) On - balance sheet financial instruments Financial assets measured at fair value – Investments Federal Government Securities (TBills + PIBs + Sukuk Bonds + FC Bonds) 292,029,937 –00 –00 –00 –00 –00 292,029,937 –00 292,029,937 –00 292,029,937 Foreign Currency Bonds - Others 1,700,622 –00 –00 –00 –00 –00 1,700,622 –00 1,700,622 –00 1,700,622 Fully paid-up ordinary shares - Listed 4,418,825 157,385 –00 –00 –00 –00 4,576,210 4,581,240 –00 –00 4,581,240 Units of mutual funds 2,517,018 –00 –00 –00 –00 –00 2,517,018 2,517,018 –00 –00 2,517,018 Term Finance Certificates - Listed 704,600 –00 –00 –00 –00 –00 704,600 704,600 –00 –00 704,600 Financial assets not measured at fair value – Cash and bank balances with treasury bank 40.1 –00 –00 –00 –00 50,600,061 –00 50,600,061 –00 –00 –00 –00 – Balances with other banks 40.1 –00 –00 –00 –00 2,910,200 –00 2,910,200 –00 –00 –00 –00 – Lendings to financial institutions 40.1 –00 –00 –00 –00 –00 –00 –00 –00 –00 –00 –00 – Investments Federal Government Securities (TBills + PIBs + Sukuk Bonds + FC Bonds + TFC + Others) 5,128,571 –00 93,489,701 –00 –00 –00 98,618,272 –00 103,305,566 –00 103,305,566 Other Federal Government Securities 40.1 –00 –00 –00 –00 –00 –00 –00 –00 –00 –00 –00 Foreign Currency Bonds - Others 40.1 –00 –00 520,996 –00 –00 –00 520,996 –00 –00 –00 –00 Sukuk Bonds - Others 40.1 2,837,799 –00 148,566 –00 –00 –00 2,986,365 –00 –00 –00 –00 Fully paid-up ordinary shares - Unlisted 40.1 59,651 –00 –00 –00 –00 –00 59,651 –00 –00 –00 –00 Term Finance Certificates - Unlisted 40.1 798,953 –00 –00 –00 –00 –00 798,953 –00 –00 –00 –00 Associates Listed shares –00 –00 –00 –00 438,756 –00 438,756 438,756 –00 –00 438,756 Mutual funds –00 –00 –00 –00 83,788 –00 83,788 83,788 –00 –00 83,788 Unlisted shares 40.1 –00 –00 –00 –00 307,849 –00 307,849 –00 –00 –00 –00 – Advances 40.1 –00 –00 –00 261,440,523 –00 –00 261,440,523 –00 –00 –00 –00 – Other assets 40.1 –00 –00 –00 –00 10,454,636 –00 10,454,636 –00 –00 –00 –00 310,195,976 157,385 94,159,263 261,440,523 64,795,290 –00 730,748,437 8,325,402 397,036,125 –00 405,361,527 Financial liabilities not measured at fair value – Bills payable 40.1 –00 –00 –00 –00 –00 (13,872,057 ) (13,872,057 ) –00 –00 –00 –00 – Borrowings 40.1 –00 –00 –00 –00 –00 (93,717,345 ) (93,717,345 ) –00 –00 –00 –00 – Deposits and other accounts 40.1 –00 –00 –00 –00 –00 (584,165,978 ) (584,165,978 ) –00 –00 –00 –00 – Sub-ordinated loans 40.1 –00 –00 –00 –00 –00 (3,999,200 ) (3,999,200 ) –00 –00 –00 –00 – Other liabilities 40.1 –00 –00 –00 –00 –00 (7,684,940 ) (7,684,940 ) –00 –00 –00 –00 –00 –00 –00 –00 –00 (703,439,520 ) (703,439,520 ) –00 –00 –00 –00 310,195,976 157,385 94,159,263 261,440,523 64,795,290 (703,439,520 ) 27,308,917 8,325,402 397,036,125 –00 405,361,527 Off-balance sheet financial instruments measured at fair value Forward purchase of foreign exchange contracts –00 –00 –00 –00 –00 49,396,754 49,396,754 –00 48,711,786 –00 48,711,786
Forward sale of foreign exchange contracts –00 –00 –00 –00 –00 (28,383,678 ) (28,383,678 ) –00 (28,563,379 ) –00 (28,563,379 ) Off-balance sheet financial instruments not measured at fair value Commitment to extend credit 40.1 –00 –00 –00 –00 –00 10,967,104 10,967,104 –00 –00 –00 –00
170
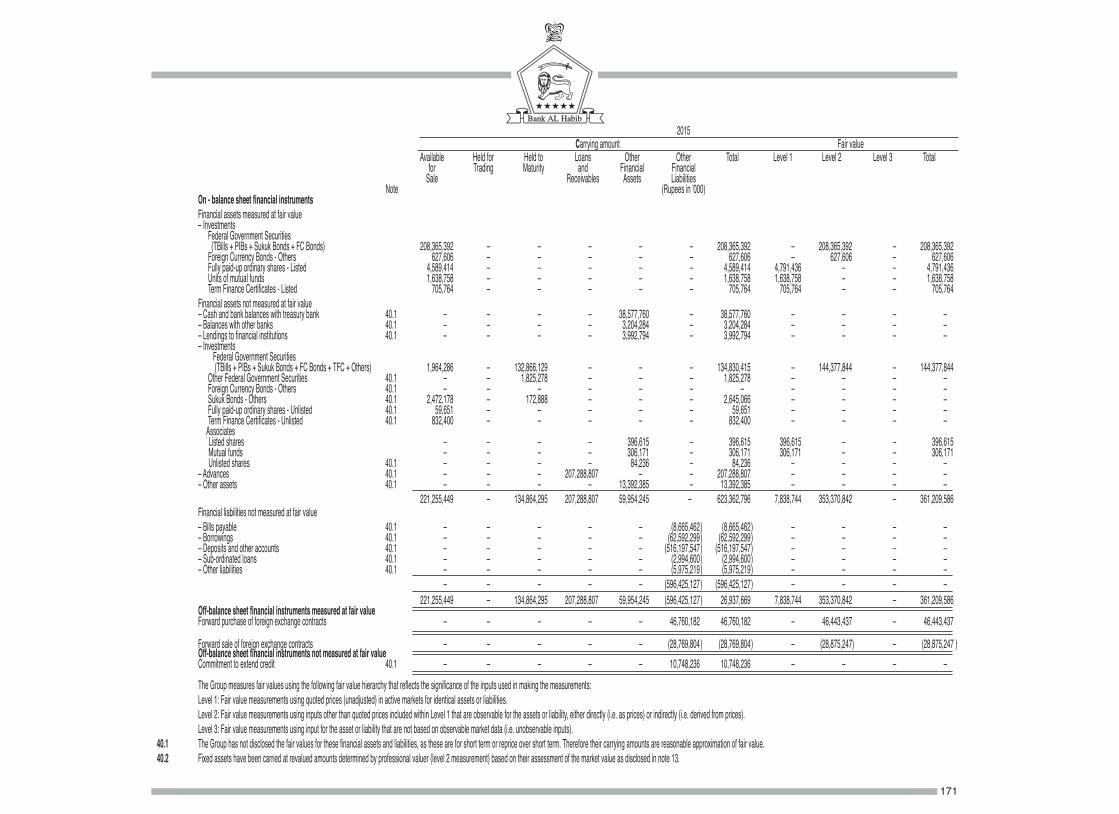
2015 Carrying amount Fair value Available Held for Held to Loans Other Other Total Level 1 Level 2 Level 3 Total
for Trading Maturity and Financial FinancialSale Receivables Assets Liabilities
Note (Rupees in '000) On - balance sheet financial instruments Financial assets measured at fair value – Investments Federal Government Securities (TBills + PIBs + Sukuk Bonds + FC Bonds) 208,365,392 –00 –00 –00 –00 –00 208,365,392 –00 208,365,392 –00 208,365,392 Foreign Currency Bonds - Others 627,606 –00 –00 –00 –00 –00 627,606 –00 627,606 –00 627,606 Fully paid-up ordinary shares - Listed 4,589,414 –00 –00 –00 –00 –00 4,589,414 4,791,436 –00 –00 4,791,436 Units of mutual funds 1,638,758 –00 –00 –00 –00 –00 1,638,758 1,638,758 –00 –00 1,638,758 Term Finance Certificates - Listed 705,764 –00 –00 –00 –00 –00 705,764 705,764 –00 –00 705,764 Financial assets not measured at fair value – Cash and bank balances with treasury bank 40.1 –00 –00 –00 –00 38,577,760 –00 38,577,760 –00 –00 –00 –00 – Balances with other banks 40.1 –00 –00 –00 –00 3,204,284 –00 3,204,284 –00 –00 –00 –00 – Lendings to financial institutions 40.1 –00 –00 –00 –00 3,992,794 –00 3,992,794 –00 –00 –00 –00 – Investments Federal Government Securities (TBills + PIBs + Sukuk Bonds + FC Bonds + TFC + Others) 1,964,286 –00 132,866,129 –00 –00 –00 134,830,415 –00 144,377,844 –00 144,377,844 Other Federal Government Securities 40.1 –00 –00 1,825,278 –00 –00 –00 1,825,278 –00 –00 –00 –00 Foreign Currency Bonds - Others 40.1 –00 –00 –00 –00 –00 –00 –00 –00 –00 –00 –00 Sukuk Bonds - Others 40.1 2,472,178 –00 172,888 –00 –00 –00 2,645,066 –00 –00 –00 –00 Fully paid-up ordinary shares - Unlisted 40.1 59,651 –00 –00 –00 –00 –00 59,651 –00 –00 –00 –00 Term Finance Certificates - Unlisted 40.1 832,400 –00 –00 –00 –00 –00 832,400 –00 –00 –00 –00 Associates Listed shares –00 –00 –00 –00 396,615 –00 396,615 396,615 –00 –00 396,615 Mutual funds –00 –00 –00 –00 306,171 –00 306,171 306,171 –00 –00 306,171 Unlisted shares 40.1 –00 –00 –00 –00 84,236 –00 84,236 –00 –00 –00 –00 – Advances 40.1 –00 –00 –00 207,288,807 –00 –00 207,288,807 –00 –00 –00 –00 – Other assets 40.1 –00 –00 –00 –00 13,392,385 –00 13,392,385 –00 –00 –00 –00 221,255,449 –00 134,864,295 207,288,807 59,954,245 –00 623,362,796 7,838,744 353,370,842 –00 361,209,586 Financial liabilities not measured at fair value – Bills payable 40.1 –00 –00 –00 –00 –00 (8,665,462 ) (8,665,462 ) –00 –00 –00 –00 – Borrowings 40.1 –00 –00 –00 –00 –00 (62,592,299 ) (62,592,299 ) –00 –00 –00 –00 – Deposits and other accounts 40.1 –00 –00 –00 –00 –00 (516,197,547 ) (516,197,547 ) –00 –00 –00 –00 – Sub-ordinated loans 40.1 –00 –00 –00 –00 –00 (2,994,600 ) (2,994,600 ) –00 –00 –00 –00 – Other liabilities 40.1 –00 –00 –00 –00 –00 (5,975,219 ) (5,975,219 ) –00 –00 –00 –00 –00 –00 –00 –00 –00 (596,425,127 ) (596,425,127 ) –00 –00 –00 –00 221,255,449 –00 134,864,295 207,288,807 59,954,245 (596,425,127 ) 26,937,669 7,838,744 353,370,842 –00 361,209,586 Off-balance sheet financial instruments measured at fair value Forward purchase of foreign exchange contracts –00 –00 –00 –00 –00 46,760,182 46,760,182 –00 46,443,437 –00 46,443,437
Forward sale of foreign exchange contracts –00 –00 –00 –00 –00 (28,769,804 ) (28,769,804 ) –00 (28,875,247 ) –00 (28,875,247 ) Off-balance sheet financial instruments not measured at fair value Commitment to extend credit 40.1 –00 –00 –00 –00 –00 10,748,236 10,748,236 –00 –00 –00 –00 The Group measures fair values using the following fair value hierarchy that reflects the significance of the inputs used in making the measurements: Level 1: Fair value measurements using quoted prices (unadjusted) in active markets for identical assets or liabilities. Level 2: Fair value measurements using inputs other than quoted prices included within Level 1 that are observable for the assets or liability, either directly (i.e. as prices) or indirectly (i.e. derived from prices). Level 3: Fair value measurements using input for the asset or liability that are not based on observable market data (i.e. unobservable inputs). 40.1 The Group has not disclosed the fair values for these financial assets and liabilities, as these are for short term or reprice over short term. Therefore their carrying amounts are reasonable approximation of fair value.40.2 Fixed assets have been carried at revalued amounts determined by professional valuer (level 2 measurement) based on their assessment of the market value as disclosed in note 13.
171
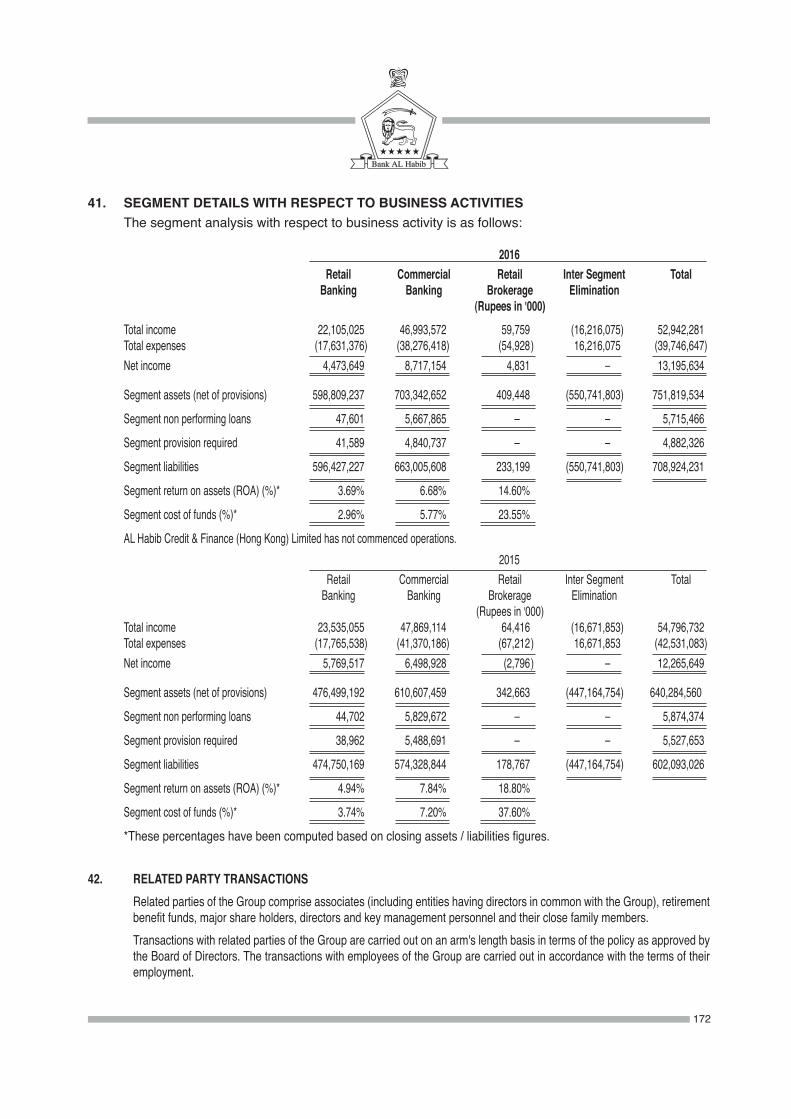
41. SEGMENT DETAILS WITH RESPECT TO BUSINESS ACTIVITIES The segment analysis with respect to business activity is as follows: 2016 Retail Commercial Retail Inter Segment Total Banking Banking Brokerage Elimination (Rupees in '000) Total income 22,105,025 46,993,572 59,759 (16,216,075 ) 52,942,281 Total expenses (17,631,376 ) (38,276,418 ) (54,928 ) 16,216,075 (39,746,647 ) Net income 4,473,649 8,717,154 4,831 –00 13,195,634
Segment assets (net of provisions) 598,809,237 703,342,652 409,448 (550,741,803 ) 751,819,534
Segment non performing loans 47,601 5,667,865 –00 –00 5,715,466
Segment provision required 41,589 4,840,737 –00 –00 4,882,326
Segment liabilities 596,427,227 663,005,608 233,199 (550,741,803 ) 708,924,231
Segment return on assets (ROA) (%)* 3.69% 6.68% 14.60%
Segment cost of funds (%)* 2.96% 5.77% 23.55%
AL Habib Credit & Finance (Hong Kong) Limited has not commenced operations. 2015 Retail Commercial Retail Inter Segment Total Banking Banking Brokerage Elimination (Rupees in '000) Total income 23,535,055 47,869,114 64,416 (16,671,853 ) 54,796,732 Total expenses (17,765,538 ) (41,370,186 ) (67,212 ) 16,671,853 (42,531,083 ) Net income 5,769,517 6,498,928 (2,796 ) –00 12,265,649
Segment assets (net of provisions) 476,499,192 610,607,459 342,663 (447,164,754 ) 640,284,560
Segment non performing loans 44,702 5,829,672 –00 –00 5,874,374
Segment provision required 38,962 5,488,691 –00 –00 5,527,653
Segment liabilities 474,750,169 574,328,844 178,767 (447,164,754 ) 602,093,026
Segment return on assets (ROA) (%)* 4.94% 7.84% 18.80%
Segment cost of funds (%)* 3.74% 7.20% 37.60%
*These percentages have been computed based on closing assets / liabilities figures.
42. RELATED PARTY TRANSACTIONS Related parties of the Group comprise associates (including entities having directors in common with the Group), retirement
benefit funds, major share holders, directors and key management personnel and their close family members. Transactions with related parties of the Group are carried out on an arm's length basis in terms of the policy as approved by
the Board of Directors. The transactions with employees of the Group are carried out in accordance with the terms of their employment.
172
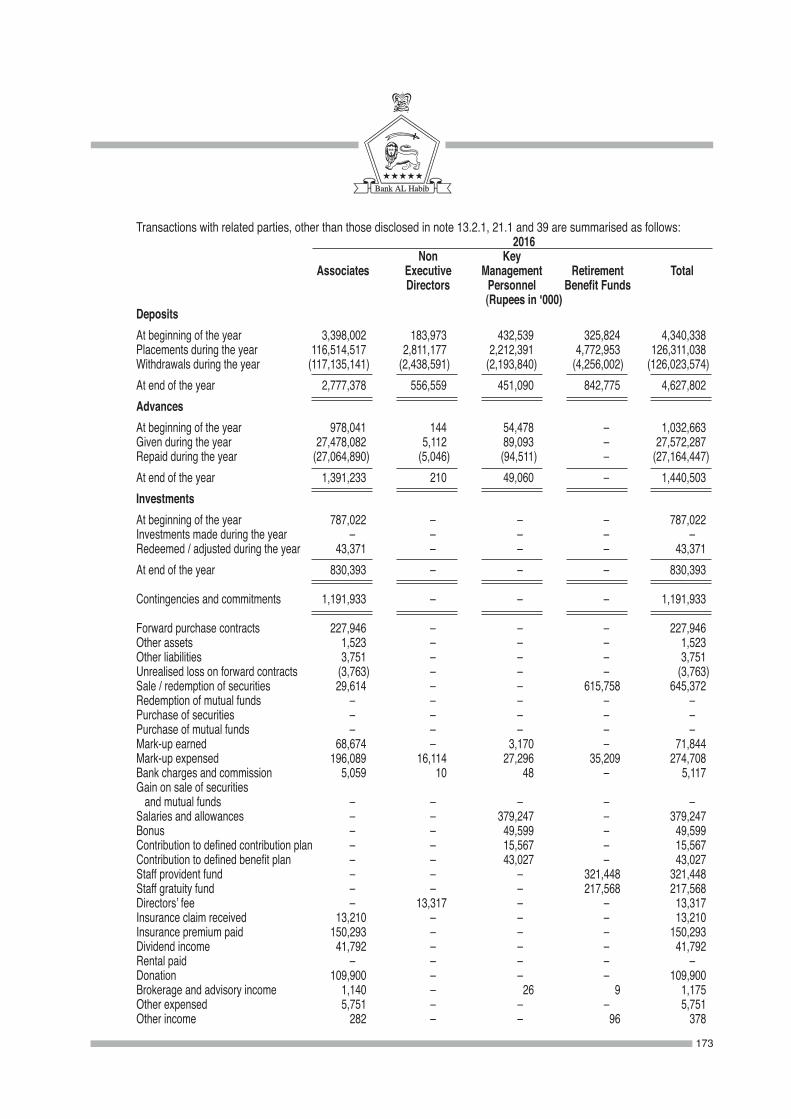
Transactions with related parties, other than those disclosed in note 13.2.1, 21.1 and 39 are summarised as follows: 2016 Non Key Associates Executive Management Retirement Total Directors Personnel Benefit Funds (Rupees in '000) Deposits At beginning of the year 3,398,002 183,973 432,539 325,824 4,340,338 Placements during the year 116,514,517 2,811,177 2,212,391 4,772,953 126,311,038 Withdrawals during the year (117,135,141 ) (2,438,591 ) (2,193,840 ) (4,256,002 ) (126,023,574 ) At end of the year 2,777,378 556,559 451,090 842,775 4,627,802 Advances At beginning of the year 978,041 144 54,478 –00 1,032,663 Given during the year 27,478,082 5,112 89,093 –00 27,572,287 Repaid during the year (27,064,890 ) (5,046 ) (94,511 ) –00 (27,164,447 ) At end of the year 1,391,233 210 49,060 –00 1,440,503 Investments At beginning of the year 787,022 –00 –00 –00 787,022 Investments made during the year –00 –00 –00 –00 –00 Redeemed / adjusted during the year 43,371 –00 –00 –00 43,371 At end of the year 830,393 –00 –00 –00 830,393
Contingencies and commitments 1,191,933 –00 –00 –00 1,191,933
Forward purchase contracts 227,946 –00 –00 –00 227,946 Other assets 1,523 –00 –00 –00 1,523 Other liabilities 3,751 –00 –00 –00 3,751 Unrealised loss on forward contracts (3,763 ) –00 –00 –00 (3,763 ) Sale / redemption of securities 29,614 –00 –00 615,758 645,372 Redemption of mutual funds –00 –00 –00 –00 –00 Purchase of securities –00 –00 –00 –00 –00 Purchase of mutual funds –00 –00 –00 –00 –00 Mark-up earned 68,674 –00 3,170 –00 71,844 Mark-up expensed 196,089 16,114 27,296 35,209 274,708 Bank charges and commission 5,059 10 48 –00 5,117 Gain on sale of securities and mutual funds –00 –00 –00 –00 –00 Salaries and allowances –00 –00 379,247 –00 379,247 Bonus –00 –00 49,599 –00 49,599 Contribution to defined contribution plan –00 –00 15,567 –00 15,567 Contribution to defined benefit plan –00 –00 43,027 –00 43,027 Staff provident fund –00 –00 –00 321,448 321,448 Staff gratuity fund –00 –00 –00 217,568 217,568 Directors’ fee –00 13,317 –00 –00 13,317 Insurance claim received 13,210 –00 –00 –00 13,210 Insurance premium paid 150,293 –00 –00 –00 150,293 Dividend income 41,792 –00 –00 –00 41,792 Rental paid –00 –00 –00 –00 –00 Donation 109,900 –00 –00 –00 109,900 Brokerage and advisory income 1,140 –00 26 9 1,175 Other expensed 5,751 –00 –00 –00 5,751 Other income 282 –00 –00 96 378
173
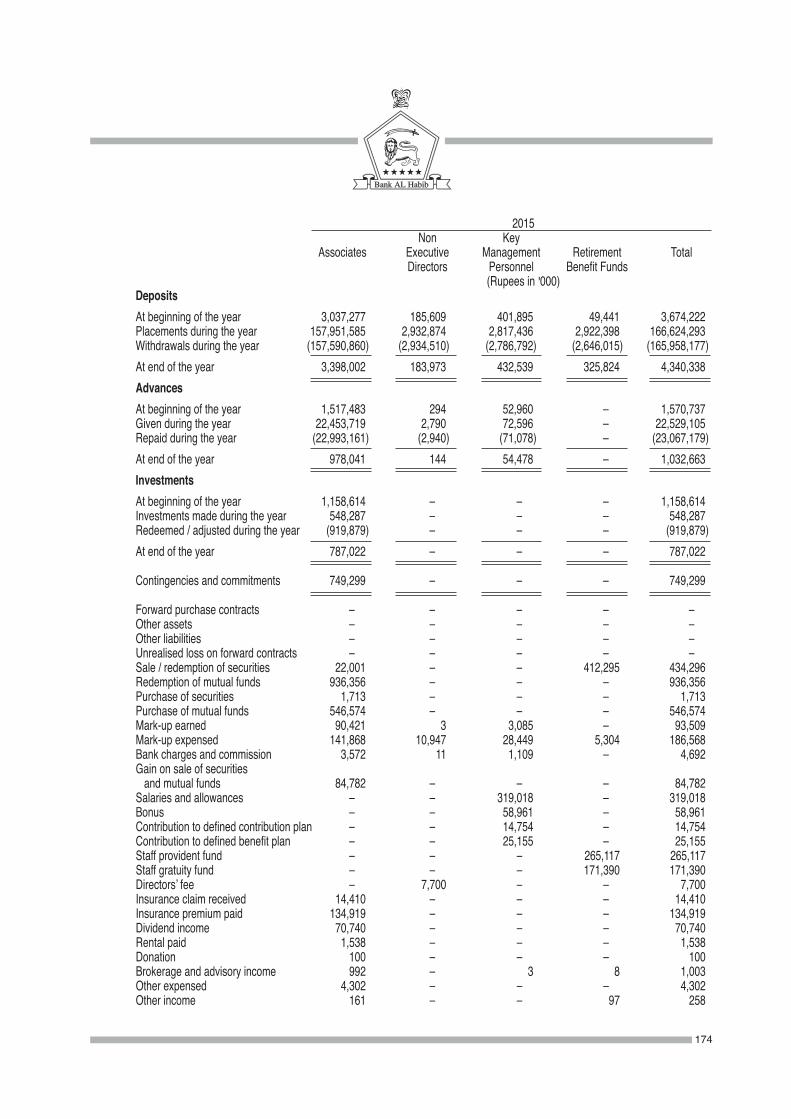
2015 Non Key Associates Executive Management Retirement Total Directors Personnel Benefit Funds (Rupees in '000) Deposits At beginning of the year 3,037,277 185,609 401,895 49,441 3,674,222 Placements during the year 157,951,585 2,932,874 2,817,436 2,922,398 166,624,293 Withdrawals during the year (157,590,860 ) (2,934,510 ) (2,786,792 ) (2,646,015 ) (165,958,177 ) At end of the year 3,398,002 183,973 432,539 325,824 4,340,338 Advances At beginning of the year 1,517,483 294 52,960 –00 1,570,737 Given during the year 22,453,719 2,790 72,596 –00 22,529,105 Repaid during the year (22,993,161 ) (2,940 ) (71,078 ) –00 (23,067,179 ) At end of the year 978,041 144 54,478 –00 1,032,663 Investments At beginning of the year 1,158,614 –00 –00 –00 1,158,614 Investments made during the year 548,287 –00 –00 –00 548,287 Redeemed / adjusted during the year (919,879 ) –00 –00 –00 (919,879 ) At end of the year 787,022 –00 –00 –00 787,022
Contingencies and commitments 749,299 –00 –00 –00 749,299
Forward purchase contracts –00 –00 –00 –00 –00 Other assets –00 –00 –00 –00 –00 Other liabilities –00 –00 –00 –00 –00 Unrealised loss on forward contracts –00 –00 –00 –00 –00 Sale / redemption of securities 22,001 –00 –00 412,295 434,296 Redemption of mutual funds 936,356 –00 –00 –00 936,356 Purchase of securities 1,713 –00 –00 –00 1,713 Purchase of mutual funds 546,574 –00 –00 –00 546,574 Mark-up earned 90,421 3 3,085 –00 93,509 Mark-up expensed 141,868 10,947 28,449 5,304 186,568 Bank charges and commission 3,572 11 1,109 –00 4,692 Gain on sale of securities and mutual funds 84,782 –00 –00 –00 84,782 Salaries and allowances –00 –00 319,018 –00 319,018 Bonus –00 –00 58,961 –00 58,961 Contribution to defined contribution plan –00 –00 14,754 –00 14,754 Contribution to defined benefit plan –00 –00 25,155 –00 25,155 Staff provident fund –00 –00 –00 265,117 265,117 Staff gratuity fund –00 –00 –00 171,390 171,390 Directors’ fee –00 7,700 –00 –00 7,700 Insurance claim received 14,410 –00 –00 –00 14,410 Insurance premium paid 134,919 –00 –00 –00 134,919 Dividend income 70,740 –00 –00 –00 70,740 Rental paid 1,538 –00 –00 –00 1,538 Donation 100 –00 –00 –00 100 Brokerage and advisory income 992 –00 3 8 1,003 Other expensed 4,302 –00 –00 –00 4,302 Other income 161 –00 –00 97 258
174
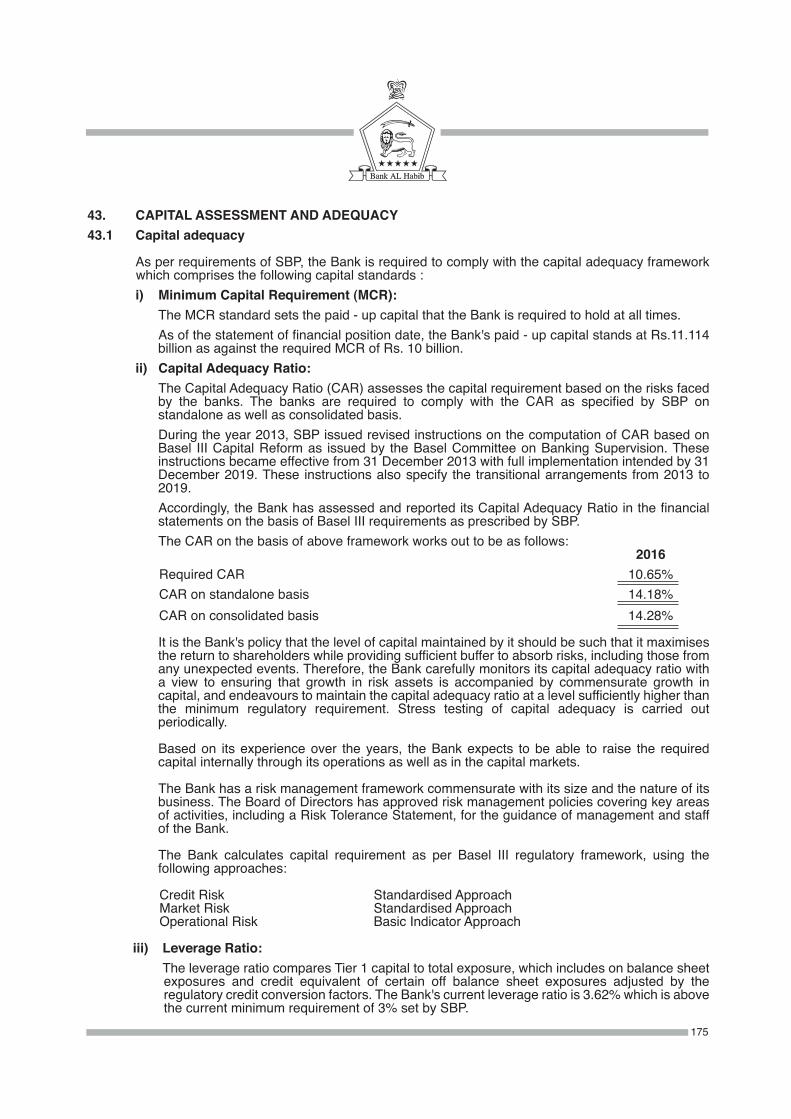
43. CAPITAL ASSESSMENT AND ADEQUACY43.1 Capital adequacy
As per requirements of SBP, the Bank is required to comply with the capital adequacy framework which comprises the following capital standards :
i) Minimum Capital Requirement (MCR): The MCR standard sets the paid - up capital that the Bank is required to hold at all times. As of the statement of financial position date, the Bank's paid - up capital stands at Rs.11.114
billion as against the required MCR of Rs. 10 billion. ii) Capital Adequacy Ratio: The Capital Adequacy Ratio (CAR) assesses the capital requirement based on the risks faced
by the banks. The banks are required to comply with the CAR as specified by SBP on standalone as well as consolidated basis.
During the year 2013, SBP issued revised instructions on the computation of CAR based on Basel III Capital Reform as issued by the Basel Committee on Banking Supervision. These instructions became effective from 31 December 2013 with full implementation intended by 31 December 2019. These instructions also specify the transitional arrangements from 2013 to 2019.
Accordingly, the Bank has assessed and reported its Capital Adequacy Ratio in the financial statements on the basis of Basel III requirements as prescribed by SBP.
The CAR on the basis of above framework works out to be as follows: 2016 Required CAR 10.65% CAR on standalone basis 14.18% CAR on consolidated basis 14.28%
It is the Bank's policy that the level of capital maintained by it should be such that it maximises the return to shareholders while providing sufficient buffer to absorb risks, including those from any unexpected events. Therefore, the Bank carefully monitors its capital adequacy ratio with a view to ensuring that growth in risk assets is accompanied by commensurate growth in capital, and endeavours to maintain the capital adequacy ratio at a level sufficiently higher than the minimum regulatory requirement. Stress testing of capital adequacy is carried out periodically.
Based on its experience over the years, the Bank expects to be able to raise the required capital internally through its operations as well as in the capital markets.
The Bank has a risk management framework commensurate with its size and the nature of its business. The Board of Directors has approved risk management policies covering key areas of activities, including a Risk Tolerance Statement, for the guidance of management and staff of the Bank.
The Bank calculates capital requirement as per Basel III regulatory framework, using the following approaches:
Credit Risk Standardised Approach Market Risk Standardised Approach Operational Risk Basic Indicator Approach
iii) Leverage Ratio: The leverage ratio compares Tier 1 capital to total exposure, which includes on balance sheet
exposures and credit equivalent of certain off balance sheet exposures adjusted by the regulatory credit conversion factors. The Bank's current leverage ratio is 3.62% which is above the current minimum requirement of 3% set by SBP.
175

2016 2015 (Rupees in '000)
43.3.1 Common Equity Tier 1 capital (CET1): Instruments and reserves
Fully Paid-up Capital 11,114,254 11,114,254 Balance in Share Premium Account –00 –00 Reserve for issue of Bonus Shares –00 –00 Discount on Issue of shares –00 –00 General / Statutory Reserves 11,703,978 10,080,132 Gains / (losses) on derivatives held as Cash Flow Hedge –00 –00 Unappropriated/unremitted profits / (losses) 13,043,606 10,414,605 Minority interests arising from CET1 capital instruments issued to third parties by consolidated bank subsidiaries (amount allowed in CET1capital of the consolidation group) 51,368 70,340 CET 1 before Regulatory Adjustments 35,913,206 31,679,331 Total regulatory adjustments applied to CET1 (Note 43.3.2) (724,467 ) (796,848) Common Equity Tier 1 (a) 35,188,739 30,882,483 Additional Tier 1 (AT 1) Capital Qualifying Additional Tier-1 capital instruments plus any related share premium of which: Classified as equity –00 –00 of which: Classified as liabilities –00 –00 Additional Tier-1 capital instruments issued to third parties by consolidated subsidiaries (amount allowed in group AT 1) of which: instrument issued by subsidiaries subject to phase out –00 –00 AT1 before regulatory adjustments –00 –00 Total regulatory adjustments applied to AT1 capital (Note 43.3.3) (16,758 ) (25,271 ) Additional Tier 1 capital after regulatory adjustments (16,758 ) (25,271 ) Additional Tier 1 capital recognised for capital adequacy (b) (16,758 ) (25,271 ) Tier 1 Capital (CET1 + admissible AT1) (c=a+b) 35,171,981 30,857,212
43.2 Scope of application The Basel III Framework for capital adequacy is applicable to the Bank both at the consolidated
level (including subsidiaries) and also on standalone basis. Bank AL Habib Limited is the only bank in the Group to which Basel III capital adequacy framework applies. The Bank has ownership in the following subsidiaries, where the Bank holds more than 50% of voting shares as at December 31, 2016:
Name Type of entity Country of incorporation AL Habib Capital Markets (Private) Limited Financial Pakistan AL Habib Credit & Finance (Hong Kong) Limited Financial Hong Kong The assets, liabilities, income, expenses and cash flows of above subsidiaries are included in the
consolidated financial statements and also consolidated for regulatory capital adequacy purposes.43.3 Capital structure The Bank’s Tier 1 capital comprises paid - up capital, statutory reserve, special reserve, general
reserve, and unappropriated profit and is adjusted for deductions in respect of intangible assets, shortfall in provision against classified assets, deficit on revaluation of investments, deferred tax asset, direct or indirect investment in own shares and is adjusted for reciprocal cross holdings in Tier 1 instruments.
The Bank’s Tier 2 capital includes subordinated loans, general provisions, revaluation reserves, and exchange translation reserve and is adjusted for reciprocal cross holdings in Tier 2 instruments.
176
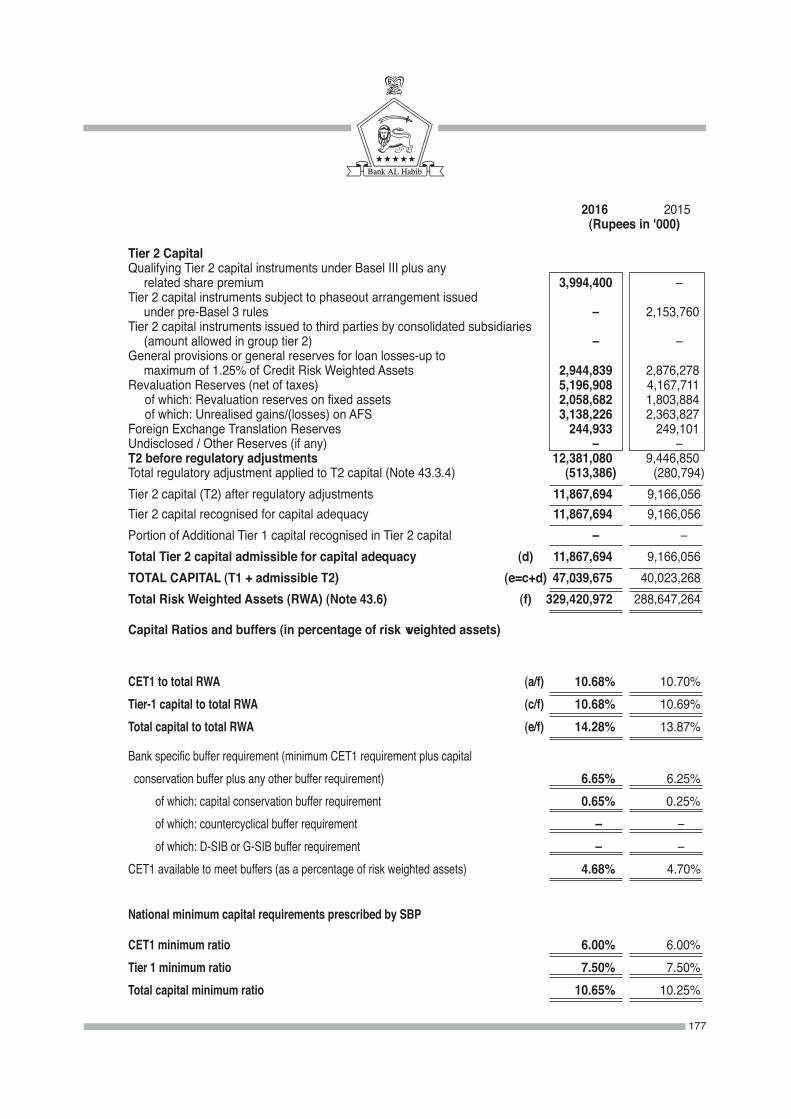
2016 2015 (Rupees in '000)
Tier 2 Capital Qualifying Tier 2 capital instruments under Basel III plus any related share premium 3,994,400 –00 Tier 2 capital instruments subject to phaseout arrangement issued under pre-Basel 3 rules –00 2,153,760 Tier 2 capital instruments issued to third parties by consolidated subsidiaries 0 (amount allowed in group tier 2) –00 –00 General provisions or general reserves for loan losses-up to maximum of 1.25% of Credit Risk Weighted Assets 2,944,839 2,876,278 Revaluation Reserves (net of taxes) 5,196,908 4,167,711 of which: Revaluation reserves on fixed assets 2,058,682 1,803,884 of which: Unrealised gains/(losses) on AFS 3,138,226 2,363,827 Foreign Exchange Translation Reserves 244,933 249,101 Undisclosed / Other Reserves (if any) –00 –00 T2 before regulatory adjustments 12,381,080 9,446,850 Total regulatory adjustment applied to T2 capital (Note 43.3.4) (513,386 ) (280,794 ) Tier 2 capital (T2) after regulatory adjustments 11,867,694 9,166,056 Tier 2 capital recognised for capital adequacy 11,867,694 9,166,056 Portion of Additional Tier 1 capital recognised in Tier 2 capital –00 –00 Total Tier 2 capital admissible for capital adequacy (d) 11,867,694 9,166,056 TOTAL CAPITAL (T1 + admissible T2) (e=c+d) 47,039,675 40,023,268 Total Risk Weighted Assets (RWA) (Note 43.6) (f) 329,420,972 288,647,264
Capital Ratios and buffers (in percentage of risk weighted assets)
CET1 to total RWA (a/f) 10.68% 10.70% Tier-1 capital to total RWA (c/f) 10.68% 10.69% Total capital to total RWA (e/f) 14.28% 13.87%
Bank specific buffer requirement (minimum CET1 requirement plus capital conservation buffer plus any other buffer requirement) 6.65% 6.25% of which: capital conservation buffer requirement 0.65% 0.25% of which: countercyclical buffer requirement –00 –00 of which: D-SIB or G-SIB buffer requirement –00 –00 CET1 available to meet buffers (as a percentage of risk weighted assets) 4.68% 4.70%
National minimum capital requirements prescribed by SBP
CET1 minimum ratio 6.00% 6.00% Tier 1 minimum ratio 7.50% 7.50% Total capital minimum ratio 10.65% 10.25%
177
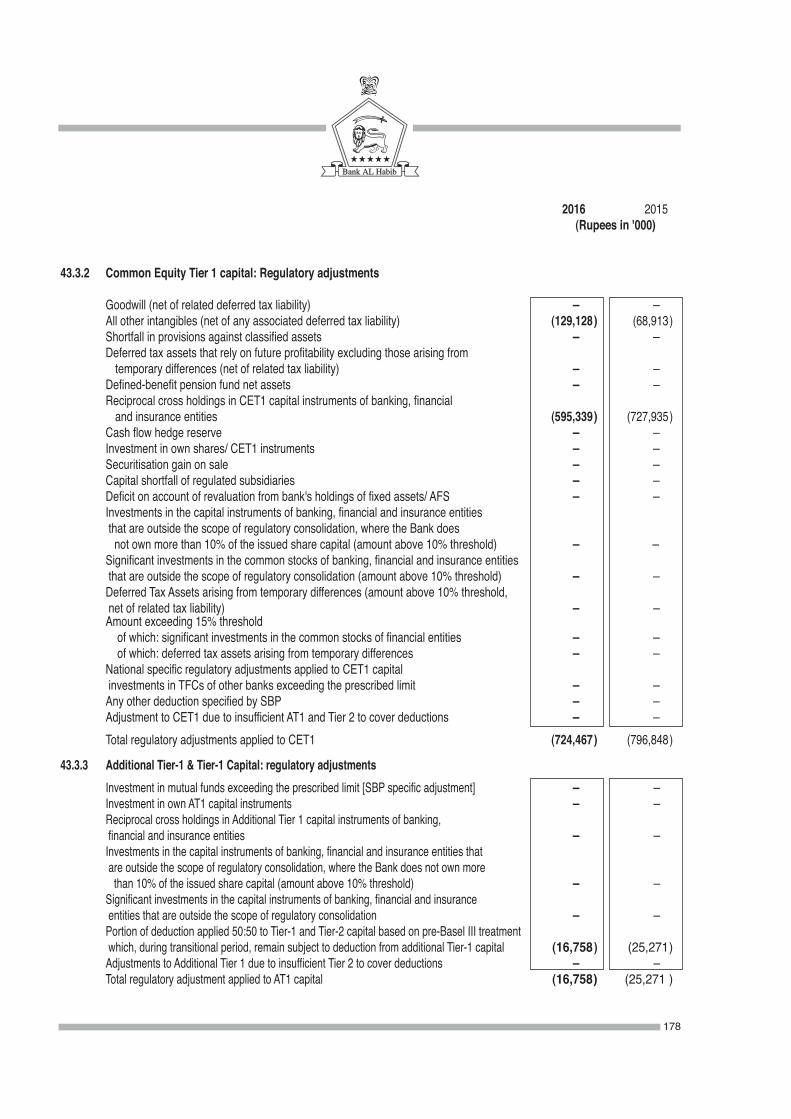
2016 2015 (Rupees in '000)
43.3.2 Common Equity Tier 1 capital: Regulatory adjustments
Goodwill (net of related deferred tax liability) –00 – All other intangibles (net of any associated deferred tax liability) (129,128 ) (68,913 ) Shortfall in provisions against classified assets –00 – Deferred tax assets that rely on future profitability excluding those arising from temporary differences (net of related tax liability) –00 – Defined-benefit pension fund net assets –00 – Reciprocal cross holdings in CET1 capital instruments of banking, financial and insurance entities (595,339 ) (727,935 ) Cash flow hedge reserve –00 – Investment in own shares/ CET1 instruments –00 – Securitisation gain on sale –00 – Capital shortfall of regulated subsidiaries –00 – Deficit on account of revaluation from bank's holdings of fixed assets/ AFS –00 – Investments in the capital instruments of banking, financial and insurance entities that are outside the scope of regulatory consolidation, where the Bank does not own more than 10% of the issued share capital (amount above 10% threshold) –00 –00 Significant investments in the common stocks of banking, financial and insurance entities that are outside the scope of regulatory consolidation (amount above 10% threshold) –00 – Deferred Tax Assets arising from temporary differences (amount above 10% threshold, net of related tax liability) –00 –00 Amount exceeding 15% threshold of which: significant investments in the common stocks of financial entities –00 – of which: deferred tax assets arising from temporary differences –00 – National specific regulatory adjustments applied to CET1 capital investments in TFCs of other banks exceeding the prescribed limit –00 – Any other deduction specified by SBP –00 – Adjustment to CET1 due to insufficient AT1 and Tier 2 to cover deductions –00 – Total regulatory adjustments applied to CET1 (724,467 ) (796,848 )
43.3.3 Additional Tier-1 & Tier-1 Capital: regulatory adjustments Investment in mutual funds exceeding the prescribed limit [SBP specific adjustment] –00 –0 Investment in own AT1 capital instruments –00 –0 Reciprocal cross holdings in Additional Tier 1 capital instruments of banking, financial and insurance entities –00 –0 Investments in the capital instruments of banking, financial and insurance entities that are outside the scope of regulatory consolidation, where the Bank does not own more than 10% of the issued share capital (amount above 10% threshold) –00 –0 Significant investments in the capital instruments of banking, financial and insurance entities that are outside the scope of regulatory consolidation –00 –0 Portion of deduction applied 50:50 to Tier-1 and Tier-2 capital based on pre-Basel III treatment which, during transitional period, remain subject to deduction from additional Tier-1 capital (16,758 ) (25,271 ) Adjustments to Additional Tier 1 due to insufficient Tier 2 to cover deductions –00 –0 Total regulatory adjustment applied to AT1 capital (16,758 ) (25,271 )
178
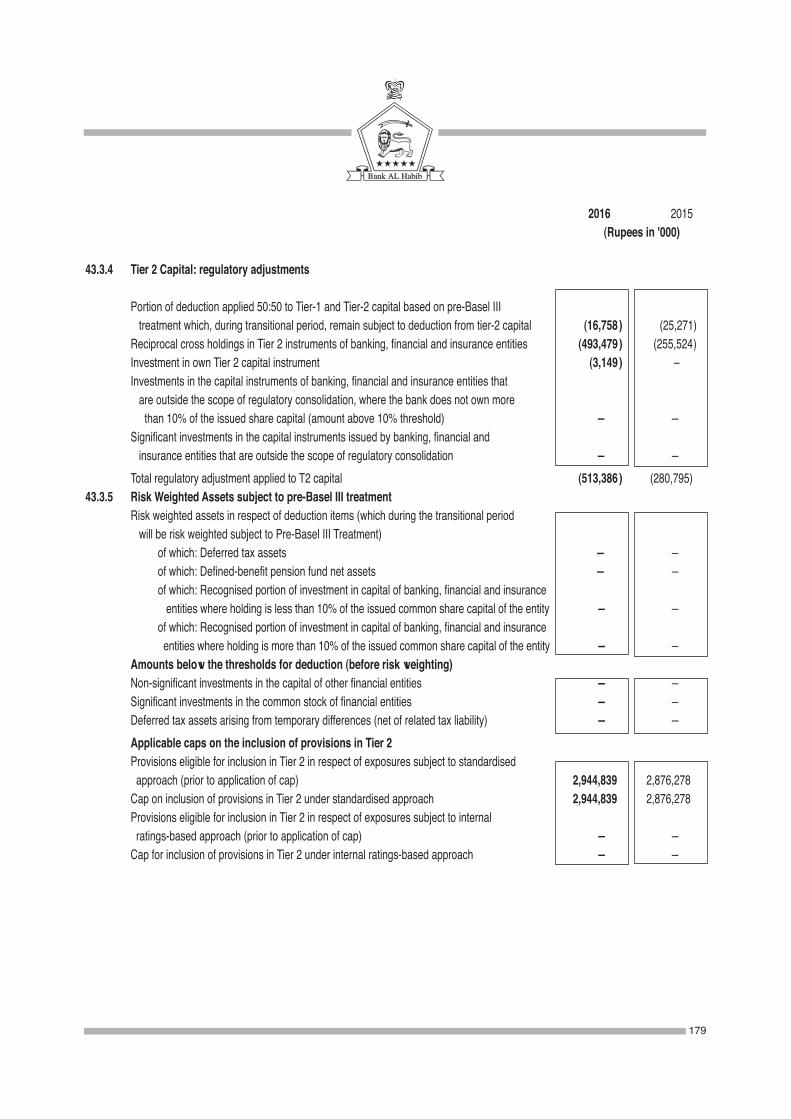
2016 2015 (Rupees in '000)
43.3.4 Tier 2 Capital: regulatory adjustments
Portion of deduction applied 50:50 to Tier-1 and Tier-2 capital based on pre-Basel III treatment which, during transitional period, remain subject to deduction from tier-2 capital (16,758 ) (25,271 ) Reciprocal cross holdings in Tier 2 instruments of banking, financial and insurance entities (493,479 ) (255,524 ) Investment in own Tier 2 capital instrument (3,149 ) –00 Investments in the capital instruments of banking, financial and insurance entities that are outside the scope of regulatory consolidation, where the bank does not own more than 10% of the issued share capital (amount above 10% threshold) –00 –00 Significant investments in the capital instruments issued by banking, financial and insurance entities that are outside the scope of regulatory consolidation –00 –00 Total regulatory adjustment applied to T2 capital (513,386 ) (280,795 )43.3.5 Risk Weighted Assets subject to pre-Basel III treatment Risk weighted assets in respect of deduction items (which during the transitional period will be risk weighted subject to Pre-Basel III Treatment) of which: Deferred tax assets –00 –00 of which: Defined-benefit pension fund net assets –00 –00 of which: Recognised portion of investment in capital of banking, financial and insurance entities where holding is less than 10% of the issued common share capital of the entity –00 –00 of which: Recognised portion of investment in capital of banking, financial and insurance entities where holding is more than 10% of the issued common share capital of the entity –00 –00 Amounts below the thresholds for deduction (before risk weighting) Non-significant investments in the capital of other financial entities –00 –00 Significant investments in the common stock of financial entities –00 –00 Deferred tax assets arising from temporary differences (net of related tax liability) –00 –00 Applicable caps on the inclusion of provisions in Tier 2 Provisions eligible for inclusion in Tier 2 in respect of exposures subject to standardised approach (prior to application of cap) 2,944,839 2,876,278 Cap on inclusion of provisions in Tier 2 under standardised approach 2,944,839 2,876,278 Provisions eligible for inclusion in Tier 2 in respect of exposures subject to internal ratings-based approach (prior to application of cap) –00 –00 Cap for inclusion of provisions in Tier 2 under internal ratings-based approach –00 –00
179
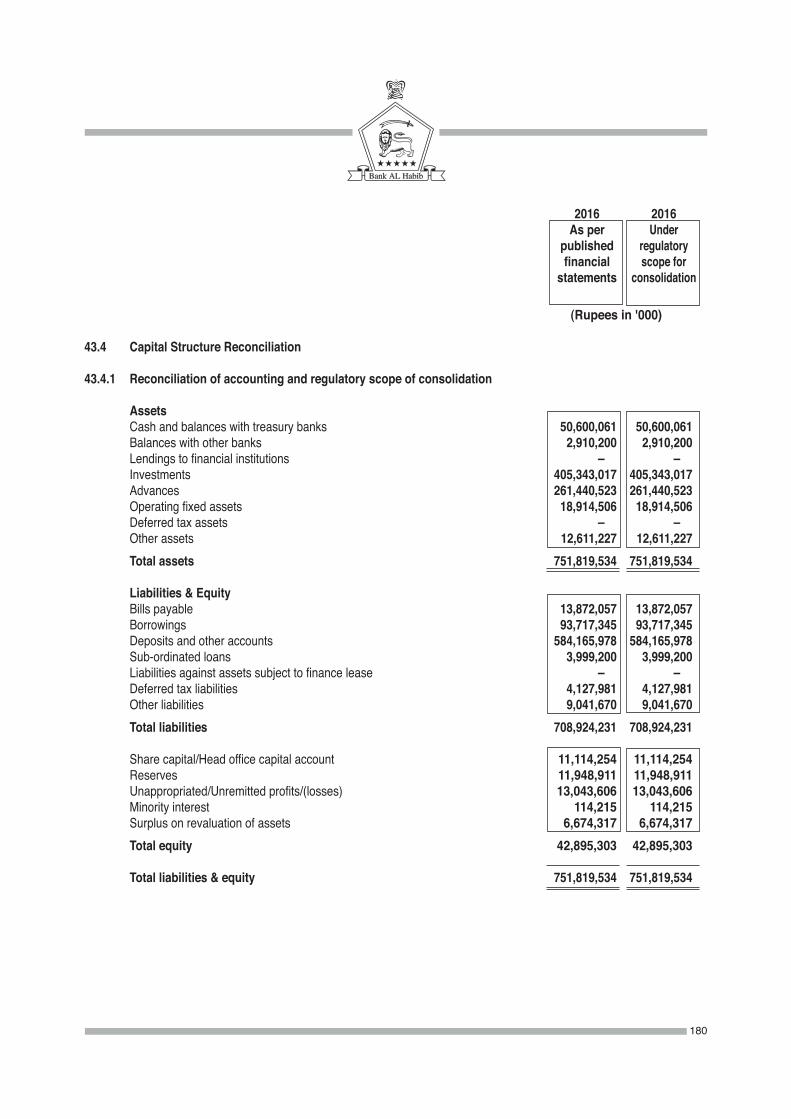
2016 2016 As per Under published regulatory financial scope for statements consolidation (Rupees in '000)
43.4 Capital Structure Reconciliation 43.4.1 Reconciliation of accounting and regulatory scope of consolidation
Assets Cash and balances with treasury banks 50,600,061 50,600,061 Balances with other banks 2,910,200 2,910,200 Lendings to financial institutions –00 –00 Investments 405,343,017 405,343,017 Advances 261,440,523 261,440,523 Operating fixed assets 18,914,506 18,914,506 Deferred tax assets –00 –00 Other assets 12,611,227 12,611,227 Total assets 751,819,534 751,819,534
Liabilities & Equity Bills payable 13,872,057 13,872,057 Borrowings 93,717,345 93,717,345 Deposits and other accounts 584,165,978 584,165,978 Sub-ordinated loans 3,999,200 3,999,200 Liabilities against assets subject to finance lease –00 –00 Deferred tax liabilities 4,127,981 4,127,981 Other liabilities 9,041,670 9,041,670 Total liabilities 708,924,231 708,924,231
Share capital/Head office capital account 11,114,254 11,114,254 Reserves 11,948,911 11,948,911 Unappropriated/Unremitted profits/(losses) 13,043,606 13,043,606 Minority interest 114,215 114,215 Surplus on revaluation of assets 6,674,317 6,674,317 Total equity 42,895,303 42,895,303
Total liabilities & equity 751,819,534 751,819,534
180
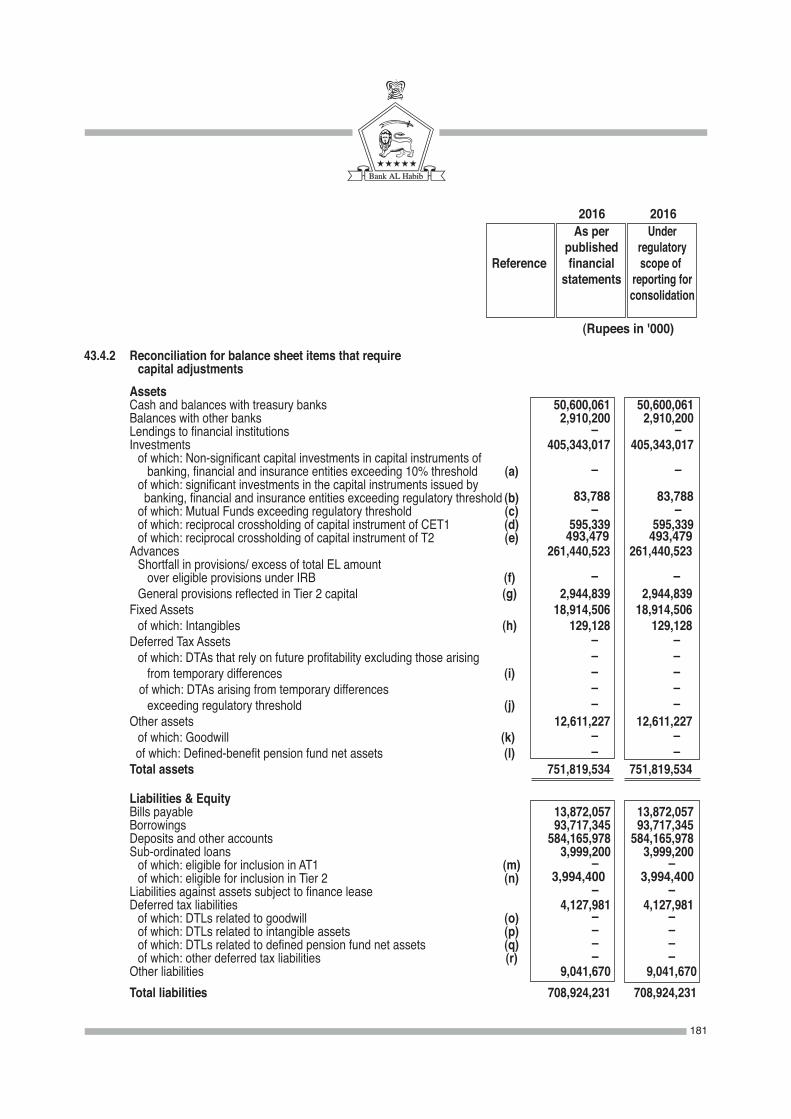
2016 2016 As per Under published regulatory Reference financial scope of statements reporting for consolidation (Rupees in '000) 43.4.2 Reconciliation for balance sheet items that require capital adjustments Assets Cash and balances with treasury banks 50,600,061 50,600,061 Balances with other banks 2,910,200 2,910,200 Lendings to financial institutions –00 –00 Investments 405,343,017 405,343,017 of which: Non-significant capital investments in capital instruments of banking, financial and insurance entities exceeding 10% threshold (a) –00 –00 of which: significant investments in the capital instruments issued by banking, financial and insurance entities exceeding regulatory threshold (b) 83,788 83,788 of which: Mutual Funds exceeding regulatory threshold (c) –00 –00 of which: reciprocal crossholding of capital instrument of CET1 (d) 595,339 595,339 of which: reciprocal crossholding of capital instrument of T2 (e) 493,479 493,479 Advances 261,440,523 261,440,523 Shortfall in provisions/ excess of total EL amount over eligible provisions under IRB (f) –00 –00 General provisions reflected in Tier 2 capital (g) 2,944,839 2,944,839 Fixed Assets 18,914,506 18,914,506 of which: Intangibles (h) 129,128 129,128 Deferred Tax Assets –00 –00 of which: DTAs that rely on future profitability excluding those arising –00 –00 from temporary differences (i) –00 –00 of which: DTAs arising from temporary differences –00 –00 exceeding regulatory threshold (j) –00 –00 Other assets 12,611,227 12,611,227 of which: Goodwill (k) –00 –00 of which: Defined-benefit pension fund net assets (l) –00 –00 Total assets 751,819,534 751,819,534
Liabilities & Equity Bills payable 13,872,057 13,872,057 Borrowings 93,717,345 93,717,345 Deposits and other accounts 584,165,978 584,165,978 Sub-ordinated loans 3,999,200 3,999,200 of which: eligible for inclusion in AT1 (m) –00 –00 of which: eligible for inclusion in Tier 2 (n) 3,994,4000 3,994,400 Liabilities against assets subject to finance lease –00 –00 Deferred tax liabilities 4,127,981 4,127,981 of which: DTLs related to goodwill (o) –00 –00 of which: DTLs related to intangible assets (p) –00 –00 of which: DTLs related to defined pension fund net assets (q) –00 –00 of which: other deferred tax liabilities (r) –00 –00 Other liabilities 9,041,670 9,041,670 Total liabilities 708,924,231 708,924,231
181
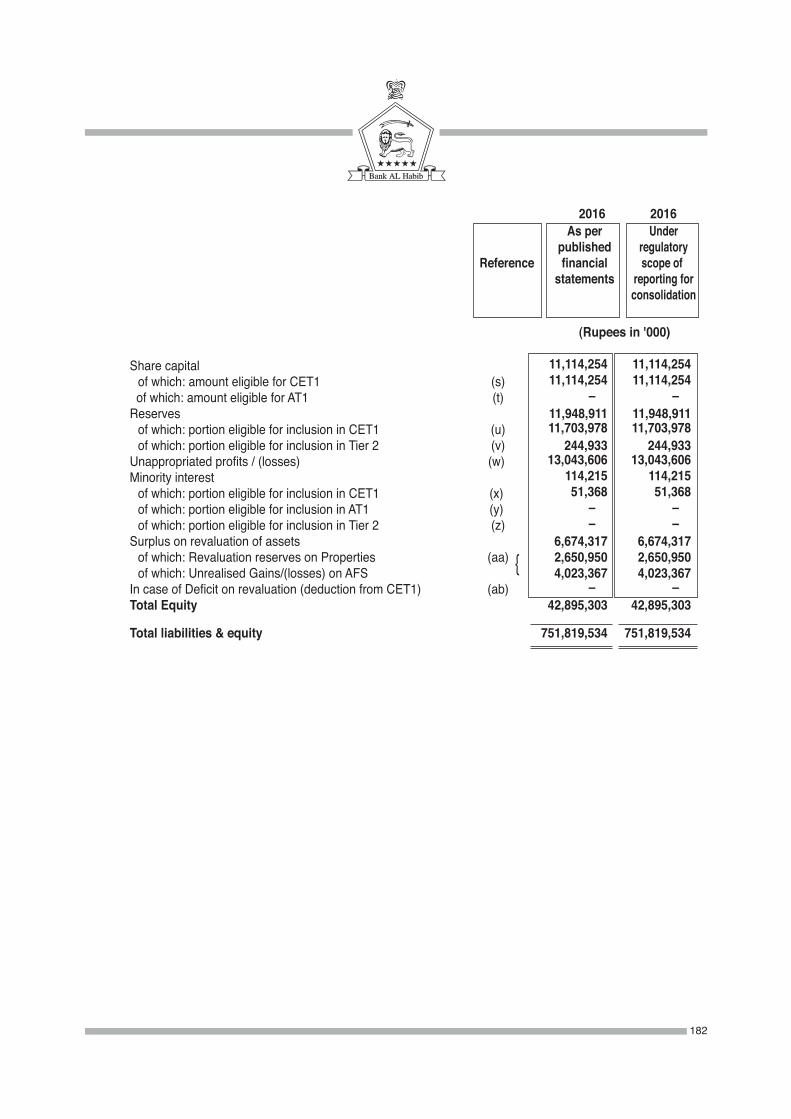
2016 2016 As per Under published regulatory Reference financial scope of statements reporting for consolidation (Rupees in '000)
Share capital 11,114,254 11,114,254 of which: amount eligible for CET1 (s) 11,114,254 11,114,254 of which: amount eligible for AT1 (t) –00 –00 Reserves 11,948,911 11,948,911 of which: portion eligible for inclusion in CET1 (u) 11,703,978 11,703,978 of which: portion eligible for inclusion in Tier 2 (v) 244,933 244,933 Unappropriated profits / (losses) (w) 13,043,606 13,043,606 Minority interest 114,215 114,215 of which: portion eligible for inclusion in CET1 (x) 51,368 51,368 of which: portion eligible for inclusion in AT1 (y) –00 –00 of which: portion eligible for inclusion in Tier 2 (z) –00 –00 Surplus on revaluation of assets 6,674,317 6,674,317 of which: Revaluation reserves on Properties (aa) 2,650,950 2,650,950 of which: Unrealised Gains/(losses) on AFS 4,023,367 4,023,367 In case of Deficit on revaluation (deduction from CET1) (ab) –00 –00 Total Equity 42,895,303 42,895,303
Total liabilities & equity 751,819,534 751,819,534
182
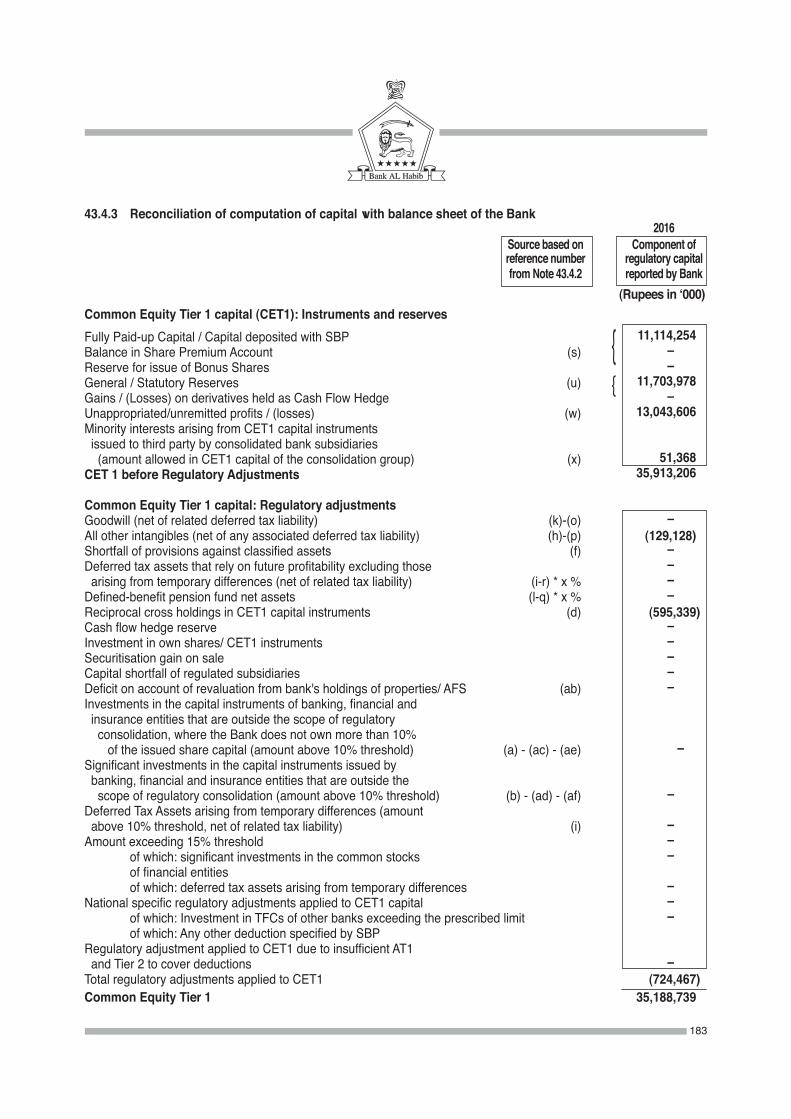
43.4.3 Reconciliation of computation of capital with balance sheet of the Bank 2016 Source based on Component of reference number regulatory capital from Note 43.4.2 reported by Bank (Rupees in ‘000)Common Equity Tier 1 capital (CET1): Instruments and reserves Fully Paid-up Capital / Capital deposited with SBP 11,114,254Balance in Share Premium Account (s) –00 Reserve for issue of Bonus Shares –00 General / Statutory Reserves (u) 11,703,978Gains / (Losses) on derivatives held as Cash Flow Hedge –00 Unappropriated/unremitted profits / (losses) (w) 13,043,606Minority interests arising from CET1 capital instruments issued to third party by consolidated bank subsidiaries (amount allowed in CET1 capital of the consolidation group) (x) 51,368CET 1 before Regulatory Adjustments 35,913,206
Common Equity Tier 1 capital: Regulatory adjustmentsGoodwill (net of related deferred tax liability) (k)-(o) –00 All other intangibles (net of any associated deferred tax liability) (h)-(p) (129,128)Shortfall of provisions against classified assets (f) –00 Deferred tax assets that rely on future profitability excluding those –00 arising from temporary differences (net of related tax liability) (i-r) * x % –00 Defined-benefit pension fund net assets (l-q) * x % –00 Reciprocal cross holdings in CET1 capital instruments (d) (595,339 )Cash flow hedge reserve –00 Investment in own shares/ CET1 instruments –00 Securitisation gain on sale –00 Capital shortfall of regulated subsidiaries –00 Deficit on account of revaluation from bank's holdings of properties/ AFS (ab) –00 Investments in the capital instruments of banking, financial and insurance entities that are outside the scope of regulatory consolidation, where the Bank does not own more than 10% of the issued share capital (amount above 10% threshold) (a) - (ac) - (ae) –00Significant investments in the capital instruments issued by banking, financial and insurance entities that are outside the scope of regulatory consolidation (amount above 10% threshold) (b) - (ad) - (af) –00 Deferred Tax Assets arising from temporary differences (amount above 10% threshold, net of related tax liability) (i) –00 Amount exceeding 15% threshold –00 of which: significant investments in the common stocks –00 of financial entities of which: deferred tax assets arising from temporary differences –00 National specific regulatory adjustments applied to CET1 capital –00 of which: Investment in TFCs of other banks exceeding the prescribed limit –00 of which: Any other deduction specified by SBP Regulatory adjustment applied to CET1 due to insufficient AT1 and Tier 2 to cover deductions –00 Total regulatory adjustments applied to CET1 (724,467 )Common Equity Tier 1 35,188,739
183

2016 Source based on Component of reference number regulatory capital from Note 43.4.2 reported by Bank (Rupees in ‘000) Additional Tier 1 (AT 1) Capital Qualifying Additional Tier-1 instruments plus any related share premium of which: Classified as equity (t) –00 of which: Classified as liabilities (m) –00 Additional Tier-1 capital instruments issued by consolidated subsidiaries and held by third parties (amount allowed in group AT 1) of which: instrument issued by subsidiaries subject to phase out (y) –00 AT1 before regulatory adjustments Additional Tier 1 Capital: regulatory adjustments Investment in mutual funds exceeding the prescribed limit (SBP specific adjustment) –00 Investment in own AT1 capital instruments –00 Reciprocal cross holdings in Additional Tier 1 capital instruments –00 Investments in the capital instruments of banking, financial and insurance entities that are outside the scope of regulatory consolidation, where the Bank does not own more than 10% of the issued share capital (amount above 10% threshold) (ac) –00 Significant investments in the capital instruments issued by banking, financial and insurance entities that are outside the scope of regulatory consolidation (ad) –00 Portion of deduction applied 50:50 to core capital and supplementary capital based on pre-Basel III treatment which, during transitional period, remain subject to deduction from tier-1 capital (16,758) Regulatory adjustments applied to Additional Tier 1 due to insufficient Tier 2 to cover deductions –00 Total of Regulatory Adjustment applied to AT1 capital (16,758 ) Additional Tier 1 capital –00 Additional Tier 1 capital recognised for capital adequacy (16,758 )
Tier 1 Capital (CET1 + admissible AT1) 35,171,981 Tier 2 Capital Qualifying Tier 2 capital instruments under Basel III plus any related share premium 3,994,400 Capital instruments subject to phase out arrangement from tier 2 (Pre-Basel III instruments) (n) –00 Tier 2 capital instruments issued to third party by consolidated –00 subsidiaries (amount allowed in group tier 2) (z) of which: instruments issued by subsidiaries subject to phase out –00 General Provisions or general reserves for loan losses-up to maximum of 1.25% of Credit Risk Weighted Assets (g) 2,944,839 Revaluation Reserves eligible for Tier 2 5,196,908 of which: portion pertaining to Property portion of (aa) 2,058,682 of which: portion pertaining to AFS securities 3,138,226 Foreign Exchange Translation Reserves (v) 244,933 Undisclosed/Other Reserves (if any) –00 T2 before regulatory adjustments 12,381,080
{
184
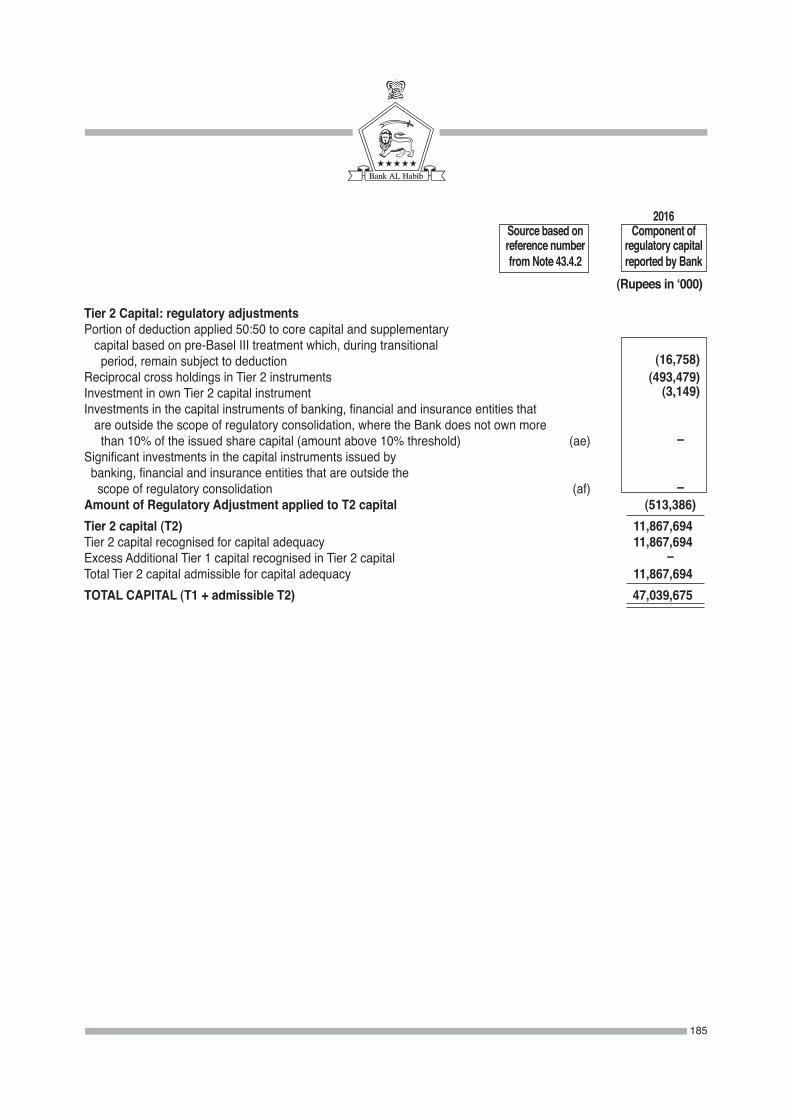
2016 Source based on Component of reference number regulatory capital from Note 43.4.2 reported by Bank (Rupees in ‘000)
Tier 2 Capital: regulatory adjustmentsPortion of deduction applied 50:50 to core capital and supplementary capital based on pre-Basel III treatment which, during transitional period, remain subject to deduction (16,758 )Reciprocal cross holdings in Tier 2 instruments (493,479 ) Investment in own Tier 2 capital instrument (3,149 )Investments in the capital instruments of banking, financial and insurance entities that are outside the scope of regulatory consolidation, where the Bank does not own more than 10% of the issued share capital (amount above 10% threshold) (ae) –00Significant investments in the capital instruments issued by banking, financial and insurance entities that are outside the scope of regulatory consolidation (af) –00Amount of Regulatory Adjustment applied to T2 capital (513,386)Tier 2 capital (T2) 11,867,694 Tier 2 capital recognised for capital adequacy 11,867,694 Excess Additional Tier 1 capital recognised in Tier 2 capital –00 Total Tier 2 capital admissible for capital adequacy 11,867,694 TOTAL CAPITAL (T1 + admissible T2) 47,039,675
185
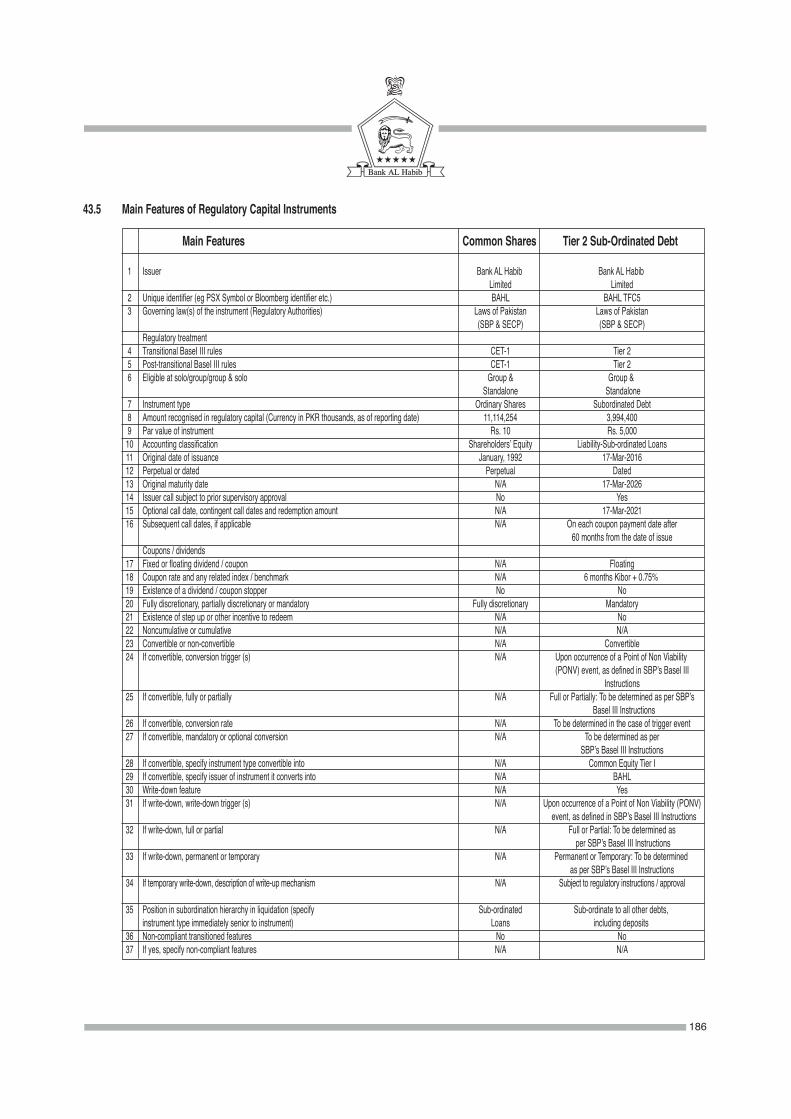
186
43.5 Main Features of Regulatory Capital Instruments
Main Features Common Shares Tier 2 Sub-Ordinated Debt
1 Issuer Bank AL Habib Bank AL Habib Limited Limited 2 Unique identifier (eg PSX Symbol or Bloomberg identifier etc.) BAHL BAHL TFC5 3 Governing law(s) of the instrument (Regulatory Authorities) Laws of Pakistan Laws of Pakistan (SBP & SECP) (SBP & SECP) Regulatory treatment 4 Transitional BaseI III rules CET-1 Tier 2 5 Post-transitional BaseI III rules CET-1 Tier 2 6 Eligible at solo/group/group & solo Group & Group & Standalone Standalone 7 Instrument type Ordinary Shares Subordinated Debt 8 Amount recognised in regulatory capital (Currency in PKR thousands, as of reporting date) 11,114,254 3,994,400 9 Par value of instrument Rs. 10 Rs. 5,000 10 Accounting classification Shareholders’ Equity Liability-Sub-ordinated Loans 11 Original date of issuance January, 1992 17-Mar-2016 12 Perpetual or dated Perpetual Dated 13 Original maturity date N/A 17-Mar-2026 14 Issuer call subject to prior supervisory approval No Yes 15 Optional call date, contingent call dates and redemption amount N/A 17-Mar-2021 16 Subsequent call dates, if applicable N/A On each coupon payment date after 60 months from the date of issue Coupons / dividends 17 Fixed or floating dividend / coupon N/A Floating 18 Coupon rate and any related index / benchmark N/A 6 months Kibor + 0.75% 19 Existence of a dividend / coupon stopper No No 20 Fully discretionary, partially discretionary or mandatory Fully discretionary Mandatory 21 Existence of step up or other incentive to redeem N/A No 22 Noncumulative or cumulative N/A N/A 23 Convertible or non-convertible N/A Convertible 24 If convertible, conversion trigger (s) N/A Upon occurrence of a Point of Non Viability (PONV) event, as defined in SBP’s Basel III Instructions 25 If convertible, fully or partially N/A Full or Partially: To be determined as per SBP’s Basel III Instructions 26 If convertible, conversion rate N/A To be determined in the case of trigger event 27 If convertible, mandatory or optional conversion N/A To be determined as per SBP’s Basel III Instructions 28 If convertible, specify instrument type convertible into N/A Common Equity Tier I 29 If convertible, specify issuer of instrument it converts into N/A BAHL 30 Write-down feature N/A Yes 31 If write-down, write-down trigger (s) N/A Upon occurrence of a Point of Non Viability (PONV) event, as defined in SBP’s Basel III Instructions 32 If write-down, full or partial N/A Full or Partial: To be determined as per SBP’s Basel III Instructions 33 If write-down, permanent or temporary N/A Permanent or Temporary: To be determined as per SBP’s Basel III Instructions 34 If temporary write-down, description of write-up mechanism N/A Subject to regulatory instructions / approval 35 Position in subordination hierarchy in liquidation (specify Sub-ordinated Sub-ordinate to all other debts, instrument type immediately senior to instrument) Loans including deposits 36 Non-compliant transitioned features No No 37 If yes, specify non-compliant features N/A N/A
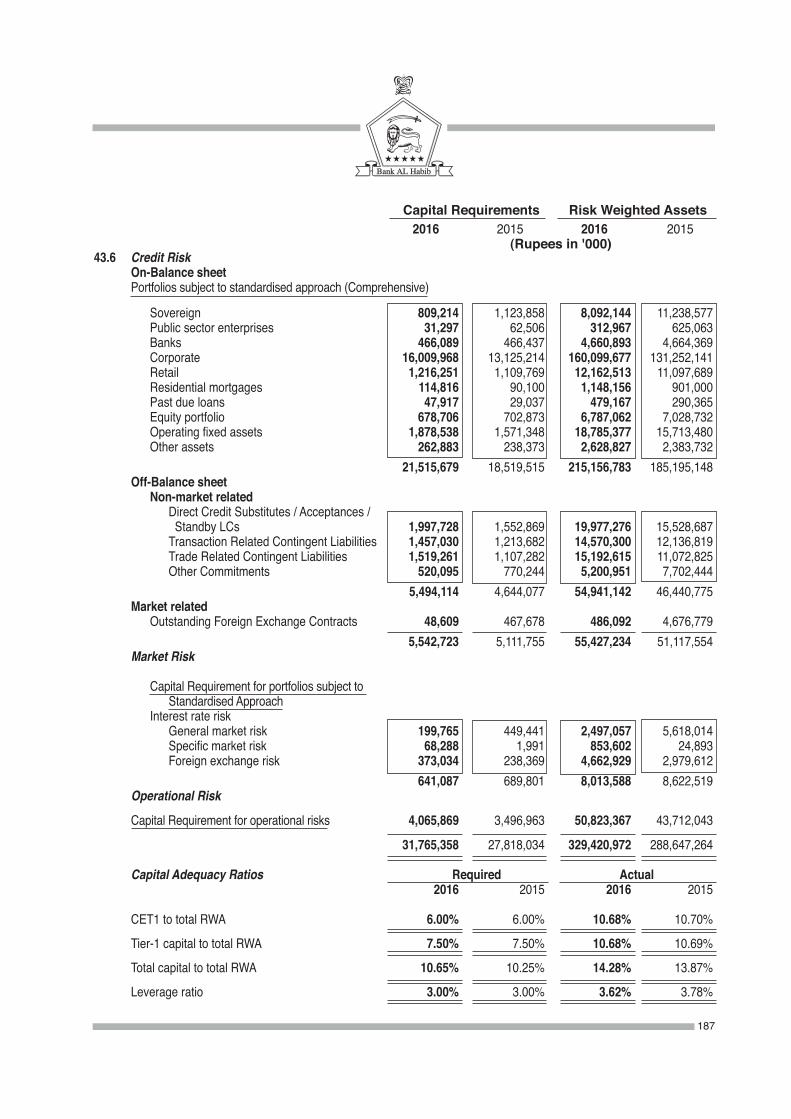
Capital Requirements Risk Weighted Assets 2016 2015 2016 2015 (Rupees in '000)
43.6 Credit Risk On-Balance sheet Portfolios subject to standardised approach (Comprehensive)
Sovereign 809,214 1,123,858 8,092,144 11,238,577 Public sector enterprises 31,297 62,506 312,967 625,063 Banks 466,089 466,437 4,660,893 4,664,369 Corporate 16,009,968 13,125,214 160,099,677 131,252,141 Retail 1,216,251 1,109,769 12,162,513 11,097,689 Residential mortgages 114,816 90,100 1,148,156 901,000 Past due loans 47,917 29,037 479,167 290,365 Equity portfolio 678,706 702,873 6,787,062 7,028,732 Operating fixed assets 1,878,538 1,571,348 18,785,377 15,713,480 Other assets 262,883 238,373 2,628,827 2,383,732 21,515,679 18,519,515 215,156,783 185,195,148 Off-Balance sheet Non-market related Direct Credit Substitutes / Acceptances / Standby LCs 1,997,728 1,552,869 19,977,276 15,528,687 Transaction Related Contingent Liabilities 1,457,030 1,213,682 14,570,300 12,136,819 Trade Related Contingent Liabilities 1,519,261 1,107,282 15,192,615 11,072,825 Other Commitments 520,095 770,244 5,200,951 7,702,444 5,494,114 4,644,077 54,941,142 46,440,775 Market related Outstanding Foreign Exchange Contracts 48,609 467,678 486,092 4,676,779 5,542,723 5,111,755 55,427,234 51,117,554 Market Risk
Capital Requirement for portfolios subject to Standardised Approach Interest rate risk General market risk 199,765 449,441 2,497,057 5,618,014 Specific market risk 68,288 1,991 853,602 24,893 Foreign exchange risk 373,034 238,369 4,662,929 2,979,612 641,087 689,801 8,013,588 8,622,519 Operational Risk
Capital Requirement for operational risks 4,065,869 3,496,963 50,823,367 43,712,043
31,765,358 27,818,034 329,420,972 288,647,264
Capital Adequacy Ratios Required Actual 2016 2015 2016 2015
CET1 to total RWA 6.00% 6.00% 10.68% 10.70%
Tier-1 capital to total RWA 7.50% 7.50% 10.68% 10.69%
Total capital to total RWA 10.65% 10.25% 14.28% 13.87%
Leverage ratio 3.00% 3.00% 3.62% 3.78%
187
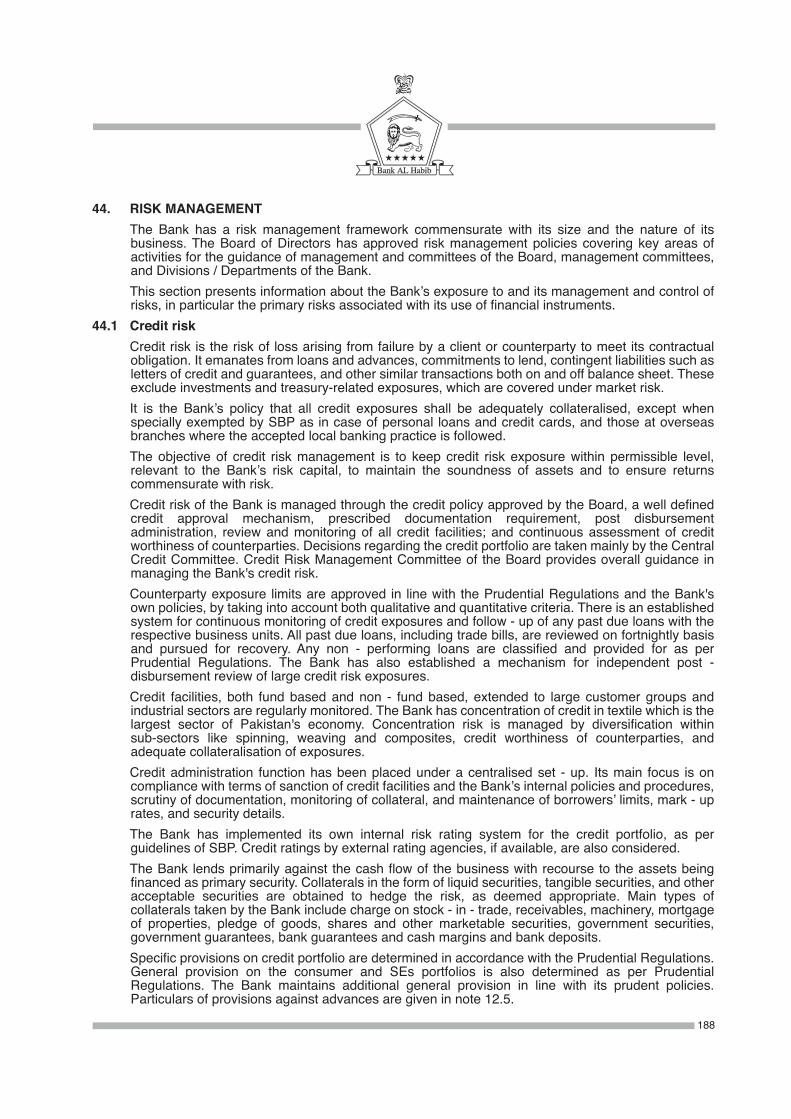
44. RISK MANAGEMENT The Bank has a risk management framework commensurate with its size and the nature of its
business. The Board of Directors has approved risk management policies covering key areas of activities for the guidance of management and committees of the Board, management committees, and Divisions / Departments of the Bank.
This section presents information about the Bank’s exposure to and its management and control of risks, in particular the primary risks associated with its use of financial instruments.
44.1 Credit risk Credit risk is the risk of loss arising from failure by a client or counterparty to meet its contractual
obligation. It emanates from loans and advances, commitments to lend, contingent liabilities such as letters of credit and guarantees, and other similar transactions both on and off balance sheet. These exclude investments and treasury-related exposures, which are covered under market risk.
It is the Bank’s policy that all credit exposures shall be adequately collateralised, except when specially exempted by SBP as in case of personal loans and credit cards, and those at overseas branches where the accepted local banking practice is followed.
The objective of credit risk management is to keep credit risk exposure within permissible level, relevant to the Bank’s risk capital, to maintain the soundness of assets and to ensure returns commensurate with risk.
Credit risk of the Bank is managed through the credit policy approved by the Board, a well defined credit approval mechanism, prescribed documentation requirement, post disbursement administration, review and monitoring of all credit facilities; and continuous assessment of credit worthiness of counterparties. Decisions regarding the credit portfolio are taken mainly by the Central Credit Committee. Credit Risk Management Committee of the Board provides overall guidance in managing the Bank's credit risk.
Counterparty exposure limits are approved in line with the Prudential Regulations and the Bank's own policies, by taking into account both qualitative and quantitative criteria. There is an established system for continuous monitoring of credit exposures and follow - up of any past due loans with the respective business units. All past due loans, including trade bills, are reviewed on fortnightly basis and pursued for recovery. Any non - performing loans are classified and provided for as per Prudential Regulations. The Bank has also established a mechanism for independent post - disbursement review of large credit risk exposures.
Credit facilities, both fund based and non - fund based, extended to large customer groups and industrial sectors are regularly monitored. The Bank has concentration of credit in textile which is the largest sector of Pakistan's economy. Concentration risk is managed by diversification within sub-sectors like spinning, weaving and composites, credit worthiness of counterparties, and adequate collateralisation of exposures.
Credit administration function has been placed under a centralised set - up. Its main focus is on compliance with terms of sanction of credit facilities and the Bank’s internal policies and procedures, scrutiny of documentation, monitoring of collateral, and maintenance of borrowers’ limits, mark - up rates, and security details.
The Bank has implemented its own internal risk rating system for the credit portfolio, as per guidelines of SBP. Credit ratings by external rating agencies, if available, are also considered.
The Bank lends primarily against the cash flow of the business with recourse to the assets being financed as primary security. Collaterals in the form of liquid securities, tangible securities, and other acceptable securities are obtained to hedge the risk, as deemed appropriate. Main types of collaterals taken by the Bank include charge on stock - in - trade, receivables, machinery, mortgage of properties, pledge of goods, shares and other marketable securities, government securities, government guarantees, bank guarantees and cash margins and bank deposits.
Specific provisions on credit portfolio are determined in accordance with the Prudential Regulations. General provision on the consumer and SEs portfolios is also determined as per Prudential Regulations. The Bank maintains additional general provision in line with its prudent policies. Particulars of provisions against advances are given in note 12.5.
188
The Bank uses the Standardised Approach to calculate capital charge for credit risk as per Basel regulatory framework, with comprehensive approach for credit risk mitigation.
Stress testing for credit risk is carried out regularly to estimate the impact of increase in non - performing loans and downward shift in these categories.
44.1.1 Credit risk: Disclosures on portfolio subject to Standardised Approach - Basel Specific The Bank uses the ratings issued by The Pakistan Credit Rating Agency Limited (PACRA) and JCR-VIS Credit
Rating Company Limited (JCR-VIS) for its local currency exposures and ratings issued by Moody’s, S&P, and Fitch for its foreign currency exposures. These External Credit Assessments Institutions (ECAIs) have been approved by SBP.
For foreign currency claims on sovereigns, the Bank also uses risk scores of Export Credit Agencies (ECAs).
Moody’s, JCR-VIS PACRA S&P, and Fitch ECA Score (local (local (foreign (foreign currency) currency) currency) currency) Types of exposures Corporates ✓ ✓ – – Banks ✓ ✓ ✓ – Sovereigns – – ✓ ✓ Small and Medium Enterprises – – – – Securitisations – – – – Others (public sector enterprises) ✓ ✓ – –
The Bank has not transferred public issue ratings onto comparable assets in the banking book in its calculations. ECAI ratings and ECA scores are aligned with risk buckets as determined by SBP. Credit exposures subject to Standardised Approach
Amount Credit Risk outstanding/ Mitigation credit equivalent (CRM) Risk buckets (rated and unrated) deduction Net amount (Rupees in '000) 0% 481,669,208 30,247,764 451,421,444 20% 41,539,548 8,312,117 33,227,431 35% 3,280,445 –00 3,280,445 50% 46,983,823 29,739,703 17,244,120 75% 22,494,488 3,608,062 18,886,426 100% 182,871,478 12,920,506 169,950,972 125% 58,458,082 2,667,933 55,790,149 150% 126,968 866 126,102250% 50,273 –00 50,273 837,474,313 87,496,951 749,977,362
44.1.2 Credit risk: Disclosures on CRM for Standardised Approach – Basel Specific Eligible collaterals used by the Bank for credit risk mitigation are cash margins and cash deposits,
government securities, financial guarantees, listed shares, and other listed, quoted or rated securities. The Bank requires perfection of collaterals by marking lien on cash margins and deposits, pledging of shares and other securities and verifying the authenticity of guarantees received. Shares and securities including marketable government securities are taken at market value and other government securities are taken at encashment value. Appropriate hair - cuts are applied as per Basel regulatory framework. Among the mitigants used by the Bank, there is concentration in cash margins, cash deposits, and sovereign guarantees.
189
44.1.3 Segment by class of business 2016
Contingencies and
Gross Advances Deposits Commitments
(Rupees % (Rupees % (Rupees %
in '000) in '000) in '000)
Agriculture / agri business 5,086,576 1.89 1,402,916 0.24 2,065,719 1.16 Automobiles and transportation equipment 1,256,170 0.47 9,532,136 1.63 7,536,562 4.22 Cement 1,686,085 0.63 119,843 0.02 486,976 0.27 Chemicals / pharmaceuticals 3,308,758 1.23 2,357,184 0.40 4,210,186 2.35 Commerce and trade 47,486,812 17.63 37,551,130 6.43 25,020,916 14.00 Electronics and electrical appliances 2,412,595 0.89 1,231,736 0.21 2,552,661 1.43 Fertilizers 7,705,861 2.86 2,409,241 0.41 2,393,912 1.34 Financial 4,525,081 1.68 17,211,363 2.95 21,670,587 12.12 Food and allied 37,757,576 14.02 6,202,194 1.06 6,202,103 3.47
Ghee and edible oil 5,890,320 2.19 1,399,947 0.24 8,969,779 5.02 Individuals 12,114,236 4.50 381,397,061 65.29 9,572 0.01 Iron and steel 11,873,068 4.41 879,626 0.15 8,936,209 5.00 Oil refinery / marketing 4,699,340 1.74 22,524,992 3.86 11,244,174 6.29 Paper and board 998,978 0.37 177,899 0.03 930,815 0.52 Plastic products 1,930,003 0.72 748,006 0.13 6,220,534 3.48
Production and transmission of energy 14,293,068 5.31 6,029,997 1.03 8,408,643 4.71 Real estate / construction 4,031,937 1.50 7,901,885 1.35 5,127,079 2.87 Services (other than financial) 5,541,096 2.06 19,996,891 3.42 2,184,879 1.22 Shoes and leather garments 2,315,799 0.86 769,920 0.13 625,821 0.35 Sugar 7,246,005 2.69 1,581,358 0.27 653,005 0.36 Surgical equipments and metal products 1,584,586 0.59 1,444,071 0.25 1,513,207 0.84 Textile Spinning 25,246,667 9.37 4,165,021 0.72 10,701,652 5.99
Weaving 10,257,901 3.81 1,138,756 0.19 4,468,533 2.50 Composite 20,784,484 7.72 3,480,410 0.60 9,378,632 5.25 Ready made garments 9,285,050 3.45 3,472,286 0.59 5,087,089 2.85 65,574,102 24.35 12,256,473 2.10 29,635,906 16.59 Others 19,949,640 7.41 49,040,109 8.40 22,116,713 12.38 269,267,692 100.00 584,165,978 100.00 178,715,958 100.00
190
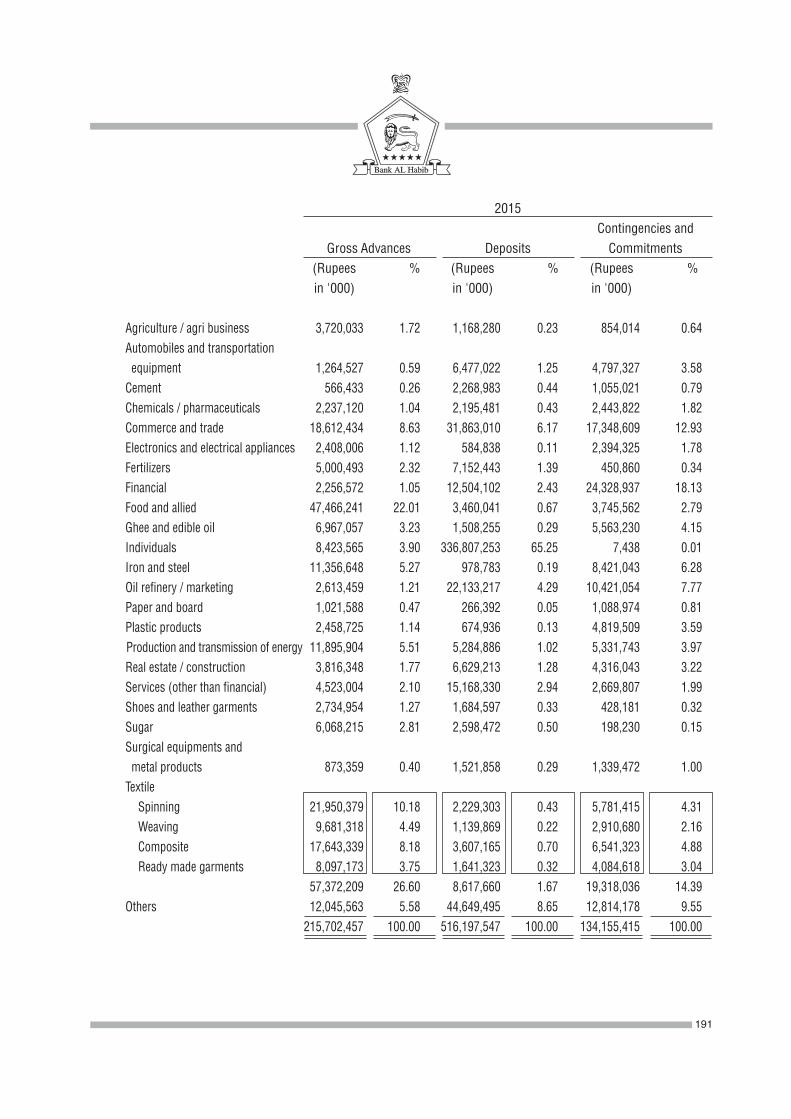
2015 Contingencies and Gross Advances Deposits Commitments
(Rupees % (Rupees % (Rupees % in '000) in '000) in '000)
Agriculture / agri business 3,720,033 1.72 1,168,280 0.23 854,014 0.64 Automobiles and transportation equipment 1,264,527 0.59 6,477,022 1.25 4,797,327 3.58 Cement 566,433 0.26 2,268,983 0.44 1,055,021 0.79 Chemicals / pharmaceuticals 2,237,120 1.04 2,195,481 0.43 2,443,822 1.82 Commerce and trade 18,612,434 8.63 31,863,010 6.17 17,348,609 12.93 Electronics and electrical appliances 2,408,006 1.12 584,838 0.11 2,394,325 1.78 Fertilizers 5,000,493 2.32 7,152,443 1.39 450,860 0.34 Financial 2,256,572 1.05 12,504,102 2.43 24,328,937 18.13 Food and allied 47,466,241 22.01 3,460,041 0.67 3,745,562 2.79
Ghee and edible oil 6,967,057 3.23 1,508,255 0.29 5,563,230 4.15 Individuals 8,423,565 3.90 336,807,253 65.25 7,438 0.01 Iron and steel 11,356,648 5.27 978,783 0.19 8,421,043 6.28 Oil refinery / marketing 2,613,459 1.21 22,133,217 4.29 10,421,054 7.77 Paper and board 1,021,588 0.47 266,392 0.05 1,088,974 0.81 Plastic products 2,458,725 1.14 674,936 0.13 4,819,509 3.59
Production and transmission of energy 11,895,904 5.51 5,284,886 1.02 5,331,743 3.97 Real estate / construction 3,816,348 1.77 6,629,213 1.28 4,316,043 3.22 Services (other than financial) 4,523,004 2.10 15,168,330 2.94 2,669,807 1.99 Shoes and leather garments 2,734,954 1.27 1,684,597 0.33 428,181 0.32 Sugar 6,068,215 2.81 2,598,472 0.50 198,230 0.15 Surgical equipments and metal products 873,359 0.40 1,521,858 0.29 1,339,472 1.00 Textile Spinning 21,950,379 10.18 2,229,303 0.43 5,781,415 4.31
Weaving 9,681,318 4.49 1,139,869 0.22 2,910,680 2.16 Composite 17,643,339 8.18 3,607,165 0.70 6,541,323 4.88 Ready made garments 8,097,173 3.75 1,641,323 0.32 4,084,618 3.04 57,372,209 26.60 8,617,660 1.67 19,318,036 14.39 Others 12,045,563 5.58 44,649,495 8.65 12,814,178 9.55 215,702,457 100.00 516,197,547 100.00 134,155,415 100.00
191
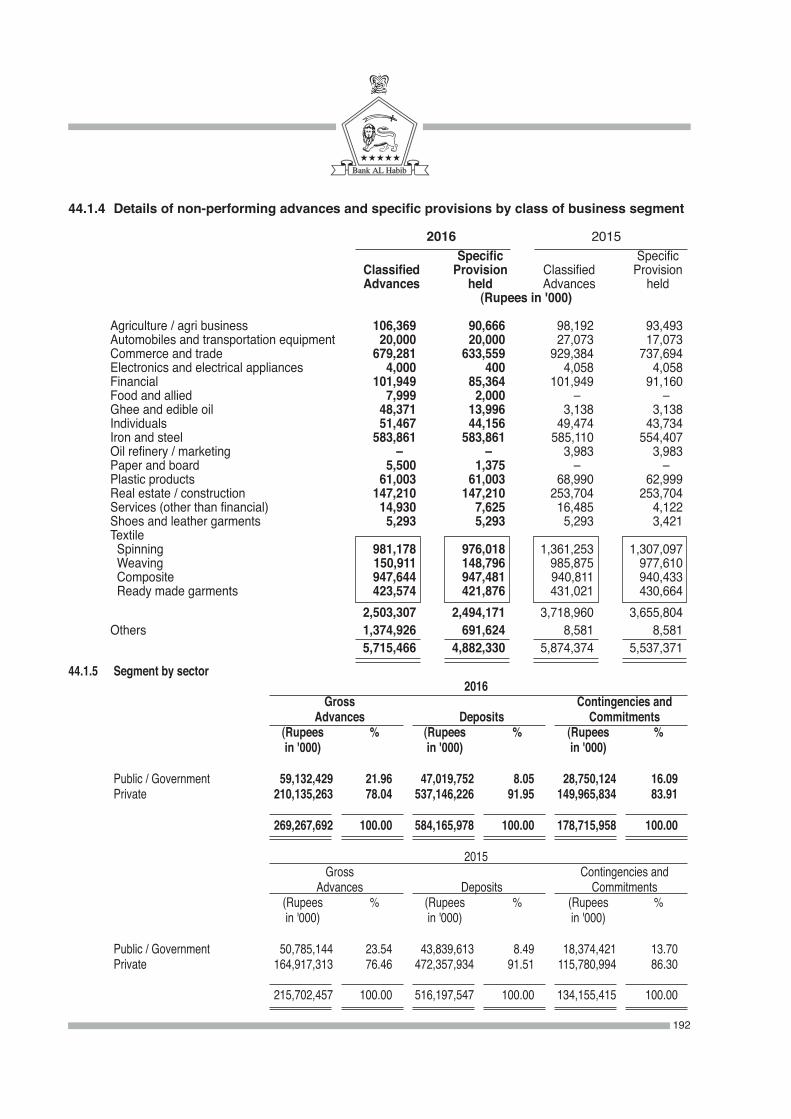
44.1.4 Details of non-performing advances and specific provisions by class of business segment
2016 2015 Specific Specific Classified Provision Classified Provision Advances held Advances held (Rupees in '000)
Agriculture / agri business 106,369 90,666 98,192 93,493 Automobiles and transportation equipment 20,000 20,000 27,073 17,073 Commerce and trade 679,281 633,559 929,384 737,694 Electronics and electrical appliances 4,000 400 4,058 4,058 Financial 101,949 85,364 101,949 91,160 Food and allied 7,999 2,000 –00 –00 Ghee and edible oil 48,371 13,996 3,138 3,138 Individuals 51,467 44,156 49,474 43,734 Iron and steel 583,861 583,861 585,110 554,407 Oil refinery / marketing –00 –00 3,983 3,983 Paper and board 5,500 1,375 –00 –00 Plastic products 61,003 61,003 68,990 62,999 Real estate / construction 147,210 147,210 253,704 253,704 Services (other than financial) 14,930 7,625 16,485 4,122 Shoes and leather garments 5,293 5,293 5,293 3,421 Textile Spinning 981,178 976,018 1,361,253 1,307,097 Weaving 150,911 148,796 985,875 977,610 Composite 947,644 947,481 940,811 940,433 Ready made garments 423,574 421,876 431,021 430,664 2,503,307 2,494,171 3,718,960 3,655,804 Others 1,374,926 691,624 8,581 8,581 5,715,466 4,882,330 5,874,374 5,537,37144.1.5 Segment by sector 2016 Gross Contingencies and Advances Deposits Commitments (Rupees % (Rupees % (Rupees % in '000) in '000) in '000)
Public / Government 59,132,429 21.96 47,019,752 8.05 28,750,124 16.09 Private 210,135,263 78.04 537,146,226 91.95 149,965,834 83.91
269,267,692 100.00 584,165,978 100.00 178,715,958 100.00 2015 Gross Contingencies and Advances Deposits Commitments (Rupees % (Rupees % (Rupees % in '000) in '000) in '000)
Public / Government 50,785,144 23.54 43,839,613 8.49 18,374,421 13.70 Private 164,917,313 76.46 472,357,934 91.51 115,780,994 86.30
215,702,457 100.00 516,197,547 100.00 134,155,415 100.00
192

44.2 Market risk Market risk is the risk of loss arising from movements in market rates or prices, such as interest rates,
foreign exchange rates, and equity prices. The Bank takes positions in securities for the purpose of investment and not to run a trading book,
except to a very limited extent (maximum of Rs. 300 million) for trading in equities. As regards foreign exchange positions, the purpose is to serve the needs of clients. Except as aforesaid, the Bank does not engage in trading or market making activities.
Market risk is managed through the market risk policy approved by the Board, approval of counterparty and dealer limits, specific senior management approval for each investment and regular review and monitoring of the investment portfolio by the Asset Liability Management Committee (ALCO). A key element of the Bank’s market risk management is to balance safety, liquidity, and
44.1.7 Geographical segment analysis 2016 Profit Total Contingencies before assets Net assets and taxation employed employed commitments (Rupees in '000)
Pakistan 12,465,392 718,880,541 39,419,219 173,566,014 Middle East 586,405 23,115,542 2,413,684 2,624,763 Asia Pacific 133,140 8,511,368 651,292 2,516,332 Africa 10,697 1,312,083 411,108 8,849
13,195,634 751,819,534 42,895,303 178,715,958
2015 Profit Total Contingencies before assets Net assets and taxation employed employed commitments (Rupees in '000)
Pakistan 11,806,999 613,148,371 35,502,638 129,238,609 Middle East 440,422 20,064,708 1,931,407 1,804,106 Asia Pacific 18,687 5,578,785 470,303 3,060,329 Africa (459 ) 1,492,696 287,186 52,371
12,265,649 640,284,560 39,191,534 134,155,415
44.1.6 Details of non-performing advances and specific provisions by sector 2016 2015 Specific Specific Classified Provision Classified Provision Advances held Advances held (Rupees in '000)
Public / Government –00 –00 –00 –00 Private 5,715,466 4,882,330 5,874,374 5,537,371
5,715,466 4,882,330 5,874,374 5,537,371
193
income in that order of priority. Another key element is separation of functions and reporting lines for the Treasury Division which undertakes dealing activities within the limits and parameters set by ALCO, Settlements Department which confirms and settles the aforesaid deal and Middle Office which independently monitors and analyses the risks inherent in treasury operations. Risk Management Committee of the Board provides overall guidance in managing the Bank’s market risk.
Dealing activities of the Bank include investment in government securities, term finance certificates, sukuks / bonds, shares and mutual funds, money market transactions and foreign exchange transactions catering to the needs of its customers. All such activities are carried out within the prescribed limits. Any excess over limits noted by the Settlements Department and / or the Middle Office is reported to senior management and ALCO. Stress testing is performed as per guidelines of SBP as well as Bank's internal policy.
The Bank uses the Standardised Approach to calculate capital charge for market risk as per Basel regulatory framework. Details of capital charge for market risk are given in note 43.6.
44.2.1 Interest rate / yield risk
Interest rate risk is the risk of loss from adverse movements in interest rates. ALCO monitors and manages the interest rate risk with the objective of limiting the potential adverse effects on the profitability of the Bank arising from fluctuation in the market interest rates and mismatching or gaps in the amount of financial assets and financial liabilities in different maturity time bands.
The Bank's interest rate exposure is calculated by categorising its interest sensitive assets and liabilities into various time bands based on the earlier of their contractual repricing or maturity dates.
Interest rate risk exposures of the Bank are controlled through dealer limits, counter-party exposure limits and (when necessary) type - of - instrument limits. Duration and modified duration of various types of debt securities as well as their entire portfolio are also calculated, and the impact of adverse change in interest rates on the market value of the securities is estimated. Stress testing for interest rate risk is carried out regularly to estimate the impact of adverse changes in the interest rates.
Interest rate / yield risk in the banking book – Basel Specific
The Bank holds financial assets and financial liabilities with different maturities or repricing dates and linked to different benchmark rates, thus creating exposure to unexpected changes in the level of interest rates. Interest rate risk in the banking book refers to the risk associated with interest-bearing financial instruments that are not held in the trading book of the Bank.
Repricing gap analysis presents the Bank’s interest sensitive assets (ISA) and interest sensitive liabilities (ISL), categorised into various time bands based on the earlier of their contractual repricing or maturity dates (or settlement dates for off-balance sheet instruments). Deposits with no fixed maturity dates (for example, saving deposits and treasurer’s call deposits) are included in the lowest, one - month time band, but these are not expected to be payable within a one - month period. The difference between ISA and ISL for each time band signifies the gap in that time band, and provides a workable framework for determining the impact on net interest income.
The Bank reviews the repricing gap analysis periodically to monitor and manage interest rate risk in the banking book.
194
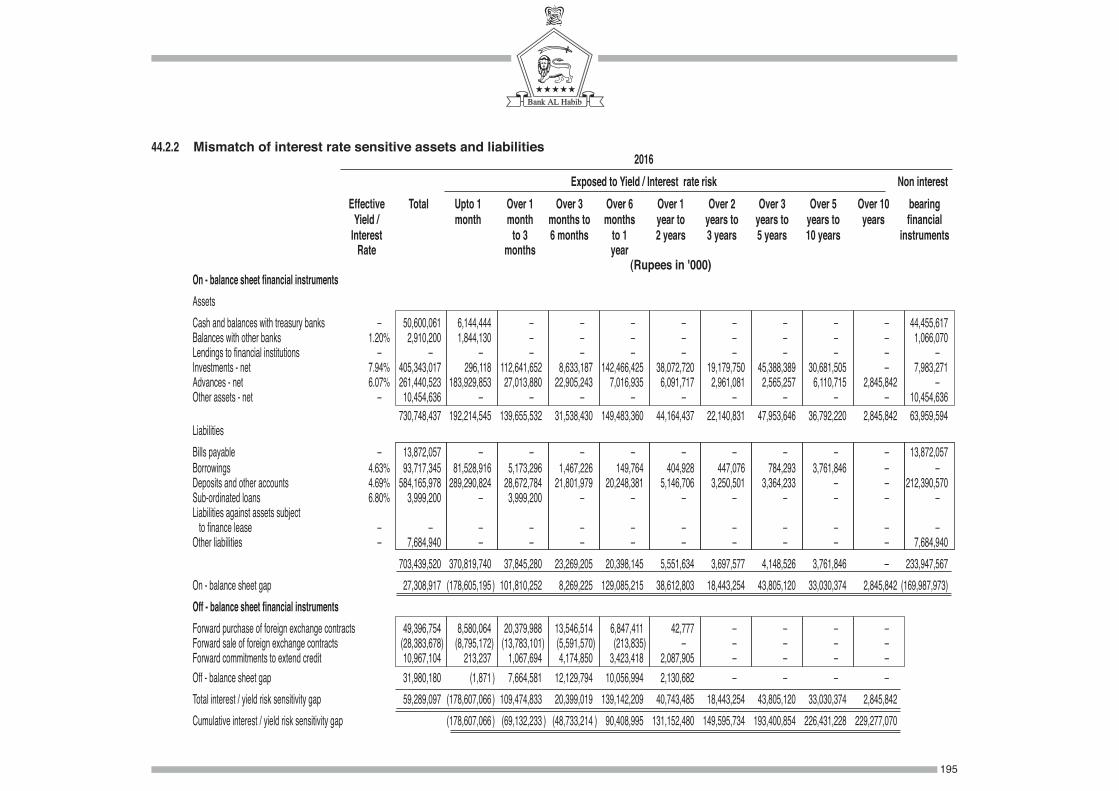
44.2.2 Mismatch of interest rate sensitive assets and liabilities 2016 Exposed to Yield / Interest rate risk Non interest Effective Total Upto 1 Over 1 Over 3 Over 6 Over 1 Over 2 Over 3 Over 5 Over 10 bearing Yield / month month months to months year to years to years to years to years financial Interest to 3 6 months to 1 2 years 3 years 5 years 10 years instruments Rate months year (Rupees in '000) On - balance sheet financial instruments Assets Cash and balances with treasury banks –00 50,600,061 6,144,444 –00 –00 –00 –00 –00 –00 –00 –00 44,455,617 Balances with other banks 1.20% 2,910,200 1,844,130 –00 –00 –00 –00 –00 –00 –00 –00 1,066,070 Lendings to financial institutions –00 –00 –00 –00 –00 –00 –00 –00 –00 –00 –00 –00 Investments - net 7.94% 405,343,017 296,118 112,641,652 8,633,187 142,466,425 38,072,720 19,179,750 45,388,389 30,681,505 –00 7,983,271 Advances - net 6.07% 261,440,523 183,929,853 27,013,880 22,905,243 7,016,935 6,091,717 2,961,081 2,565,257 6,110,715 2,845,842 –00 Other assets - net –00 10,454,636 –00 –00 –00 –00 –00 –00 –00 00–00 –00 10,454,636 730,748,437 192,214,545 139,655,532 31,538,430 149,483,360 44,164,437 22,140,831 47,953,646 36,792,220 2,845,842 63,959,594 Liabilities Bills payable –00 13,872,057 –00 –00 –00 –00 –00 –00 –00 –00 –00 13,872,057 Borrowings 4.63% 93,717,345 81,528,916 5,173,296 1,467,226 149,764 404,928 447,076 784,293 3,761,846 –00 –00 Deposits and other accounts 4.69% 584,165,978 289,290,824 28,672,784 21,801,979 20,248,381 5,146,706 3,250,501 3,364,233 –00 –00 212,390,570 Sub-ordinated loans 6.80% 3,999,200 –00 3,999,200 –00 –00 –00 –00 –00 –00 –00 –00 Liabilities against assets subject to finance lease –00 –00 –00 –00 –00 –00 –00 –00 –00 –00 –00 –00 Other liabilities –00 7,684,940 –00 –00 –00 –00 –00 –00 –00 –00 –00 7,684,940 703,439,520 370,819,740 37,845,280 23,269,205 20,398,145 5,551,634 3,697,577 4,148,526 3,761,846 –00 233,947,567 On - balance sheet gap 27,308,917 (178,605,195 ) 101,810,252 8,269,225 129,085,215 38,612,803 18,443,254 43,805,120 33,030,374 2,845,842 (169,987,973) Off - balance sheet financial instruments Forward purchase of foreign exchange contracts 49,396,754 8,580,064 20,379,988 13,546,514 6,847,411 42,777 –00 –00 –00 –00 Forward sale of foreign exchange contracts (28,383,678 ) (8,795,172 ) (13,783,101 ) (5,591,570 ) (213,835 ) –00 –00 –00 –00 –00 Forward commitments to extend credit 10,967,104 213,237 1,067,694 4,174,850 3,423,418 2,087,905 –00 –00 –00 –00 Off - balance sheet gap 31,980,180 (1,871 ) 7,664,581 12,129,794 10,056,994 2,130,682 –00 –00 –00 –00 Total interest / yield risk sensitivity gap 59,289,097 (178,607,066 ) 109,474,833 20,399,019 139,142,209 40,743,485 18,443,254 43,805,120 33,030,374 2,845,842 Cumulative interest / yield risk sensitivity gap (178,607,066 ) (69,132,233 ) (48,733,214 ) 90,408,995 131,152,480 149,595,734 193,400,854 226,431,228 229,277,070
195
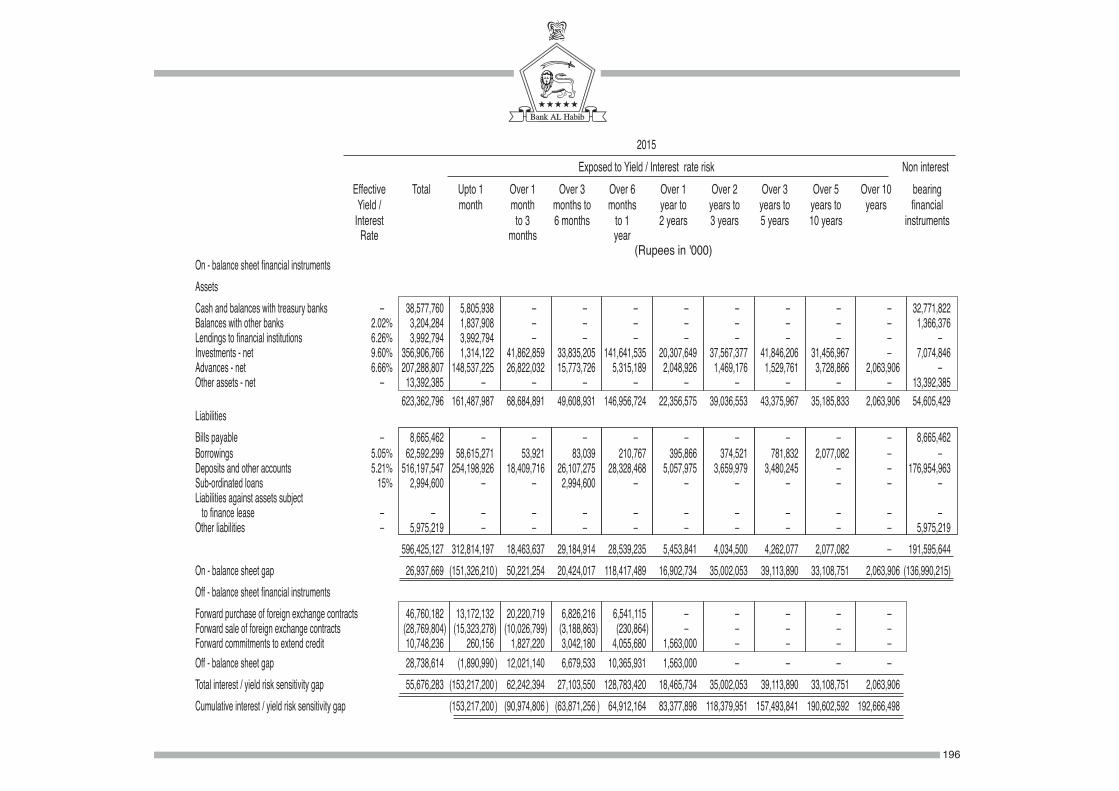
2015 Exposed to Yield / Interest rate risk Non interest Effective Total Upto 1 Over 1 Over 3 Over 6 Over 1 Over 2 Over 3 Over 5 Over 10 bearing Yield / month month months to months year to years to years to years to years financial Interest to 3 6 months to 1 2 years 3 years 5 years 10 years instruments Rate months year (Rupees in '000) On - balance sheet financial instruments Assets Cash and balances with treasury banks –00 38,577,760 5,805,938 –00 –00 –00 –00 –00 –00 –00 –00 32,771,822 Balances with other banks 2.02% 3,204,284 1,837,908 –00 –00 –00 –00 –00 –00 –00 –00 1,366,376 Lendings to financial institutions 6.26% 3,992,794 3,992,794 –00 –00 –00 –00 –00 –00 –00 –00 –00 Investments - net 9.60% 356,906,766 1,314,122 41,862,859 33,835,205 141,641,535 20,307,649 37,567,377 41,846,206 31,456,967 –00 7,074,846 Advances - net 6.66% 207,288,807 148,537,225 26,822,032 15,773,726 5,315,189 2,048,926 1,469,176 1,529,761 3,728,866 2,063,906 –00 Other assets - net –00 13,392,385 –00 –00 –00 –00 –00 –00 –00 00–00 –00 13,392,385 623,362,796 161,487,987 68,684,891 49,608,931 146,956,724 22,356,575 39,036,553 43,375,967 35,185,833 2,063,906 54,605,429 Liabilities Bills payable –00 8,665,462 –00 –00 –00 –00 –00 –00 –00 –00 –00 8,665,462 Borrowings 5.05% 62,592,299 58,615,271 53,921 83,039 210,767 395,866 374,521 781,832 2,077,082 –00 –00 Deposits and other accounts 5.21% 516,197,547 254,198,926 18,409,716 26,107,275 28,328,468 5,057,975 3,659,979 3,480,245 –00 –00 176,954,963 Sub-ordinated loans 15% 2,994,600 –00 –00 2,994,600 –00 –00 –00 –00 –00 –00 –00 Liabilities against assets subject to finance lease –00 –00 –00 –00 –00 –00 –00 –00 –00 –00 –00 –00 Other liabilities –00 5,975,219 –00 –00 –00 –00 –00 –00 –00 –00 –00 5,975,219 596,425,127 312,814,197 18,463,637 29,184,914 28,539,235 5,453,841 4,034,500 4,262,077 2,077,082 –00 191,595,644 On - balance sheet gap 26,937,669 (151,326,210 ) 50,221,254 20,424,017 118,417,489 16,902,734 35,002,053 39,113,890 33,108,751 2,063,906 (136,990,215) Off - balance sheet financial instruments Forward purchase of foreign exchange contracts 46,760,182 13,172,132 20,220,719 6,826,216 6,541,115 –00 –00 –00 –00 –00 Forward sale of foreign exchange contracts (28,769,804 ) (15,323,278 ) (10,026,799 ) (3,188,863 ) (230,864 ) –00 –00 –00 –00 –00 Forward commitments to extend credit 10,748,236 260,156 1,827,220 3,042,180 4,055,680 1,563,000 –00 –00 –00 –00 Off - balance sheet gap 28,738,614 (1,890,990 ) 12,021,140 6,679,533 10,365,931 1,563,000 –00 –00 –00 –00 Total interest / yield risk sensitivity gap 55,676,283 (153,217,200 ) 62,242,394 27,103,550 128,783,420 18,465,734 35,002,053 39,113,890 33,108,751 2,063,906 Cumulative interest / yield risk sensitivity gap (153,217,200 ) (90,974,806 ) (63,871,256 ) 64,912,164 83,377,898 118,379,951 157,493,841 190,602,592 192,666,498
196
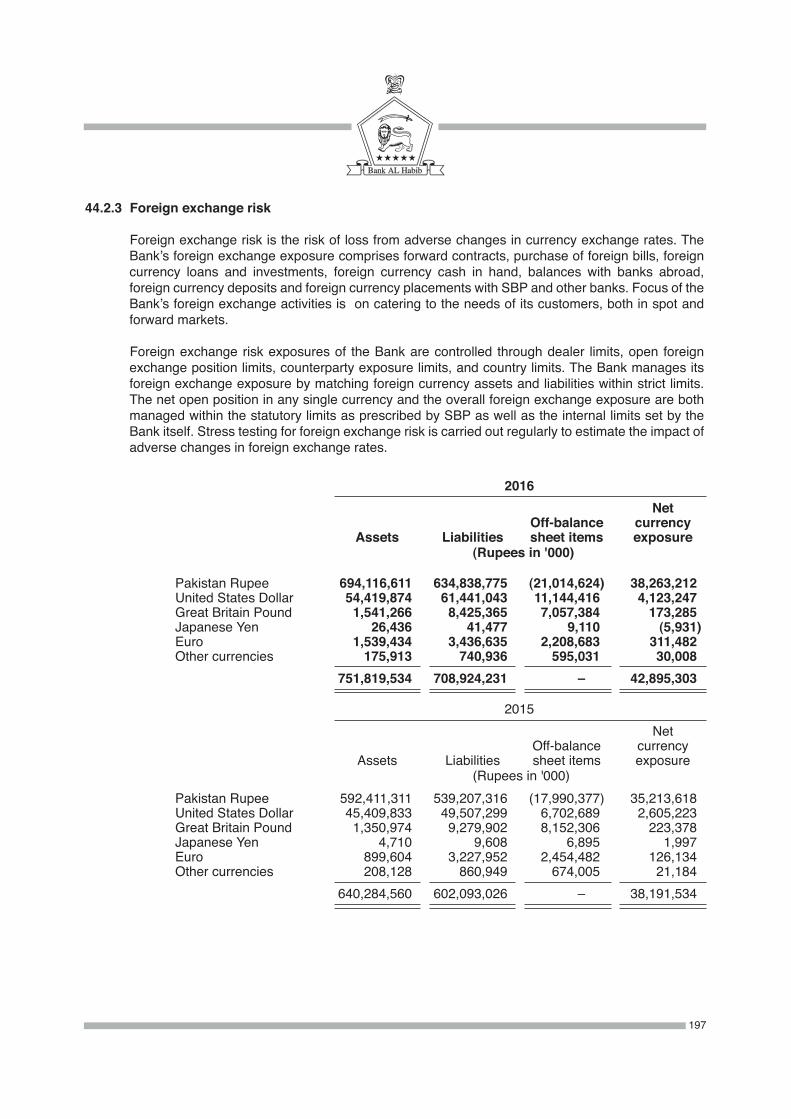
44.2.3 Foreign exchange risk
Foreign exchange risk is the risk of loss from adverse changes in currency exchange rates. The Bank’s foreign exchange exposure comprises forward contracts, purchase of foreign bills, foreign currency loans and investments, foreign currency cash in hand, balances with banks abroad, foreign currency deposits and foreign currency placements with SBP and other banks. Focus of the Bank’s foreign exchange activities is on catering to the needs of its customers, both in spot and forward markets.
Foreign exchange risk exposures of the Bank are controlled through dealer limits, open foreign exchange position limits, counterparty exposure limits, and country limits. The Bank manages its foreign exchange exposure by matching foreign currency assets and liabilities within strict limits. The net open position in any single currency and the overall foreign exchange exposure are both managed within the statutory limits as prescribed by SBP as well as the internal limits set by the Bank itself. Stress testing for foreign exchange risk is carried out regularly to estimate the impact of adverse changes in foreign exchange rates.
2016 Net Off-balance currency Assets Liabilities sheet items exposure (Rupees in '000)
Pakistan Rupee 694,116,611 634,838,775 (21,014,624 ) 38,263,212 United States Dollar 54,419,874 61,441,043 11,144,416 4,123,247 Great Britain Pound 1,541,266 8,425,365 7,057,384 173,285 Japanese Yen 26,436 41,477 9,110 (5,931 ) Euro 1,539,434 3,436,635 2,208,683 311,482 Other currencies 175,913 740,936 595,031 30,008 751,819,534 708,924,231 –00 42,895,303
2015 Net Off-balance currency Assets Liabilities sheet items exposure (Rupees in '000) Pakistan Rupee 592,411,311 539,207,316 (17,990,377 ) 35,213,618 United States Dollar 45,409,833 49,507,299 6,702,689 2,605,223 Great Britain Pound 1,350,974 9,279,902 8,152,306 223,378 Japanese Yen 4,710 9,608 6,895 1,997 Euro 899,604 3,227,952 2,454,482 126,134 Other currencies 208,128 860,949 674,005 21,184 640,284,560 602,093,026 –00 38,191,534
197
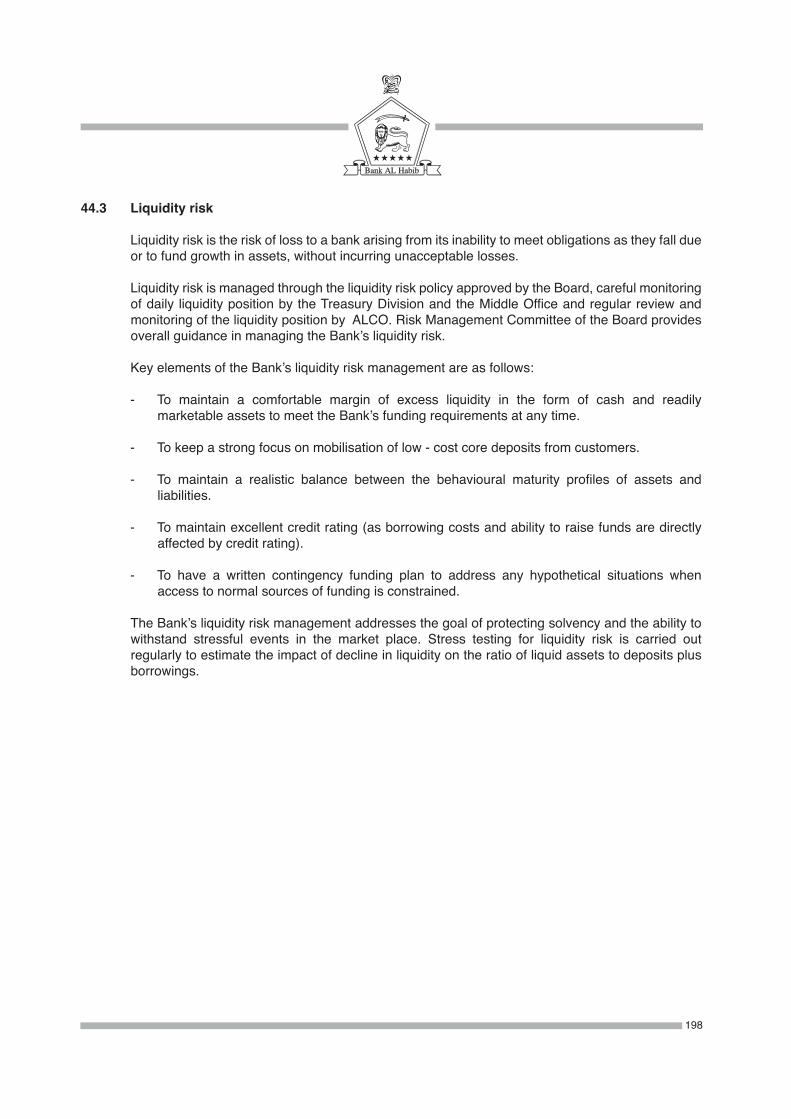
44.3 Liquidity risk
Liquidity risk is the risk of loss to a bank arising from its inability to meet obligations as they fall due or to fund growth in assets, without incurring unacceptable losses.
Liquidity risk is managed through the liquidity risk policy approved by the Board, careful monitoring of daily liquidity position by the Treasury Division and the Middle Office and regular review and monitoring of the liquidity position by ALCO. Risk Management Committee of the Board provides overall guidance in managing the Bank’s liquidity risk.
Key elements of the Bank’s liquidity risk management are as follows:
- To maintain a comfortable margin of excess liquidity in the form of cash and readily marketable assets to meet the Bank’s funding requirements at any time.
- To keep a strong focus on mobilisation of low - cost core deposits from customers.
- To maintain a realistic balance between the behavioural maturity profiles of assets and liabilities.
- To maintain excellent credit rating (as borrowing costs and ability to raise funds are directly affected by credit rating).
- To have a written contingency funding plan to address any hypothetical situations when access to normal sources of funding is constrained.
The Bank’s liquidity risk management addresses the goal of protecting solvency and the ability to withstand stressful events in the market place. Stress testing for liquidity risk is carried out regularly to estimate the impact of decline in liquidity on the ratio of liquid assets to deposits plus borrowings.
198
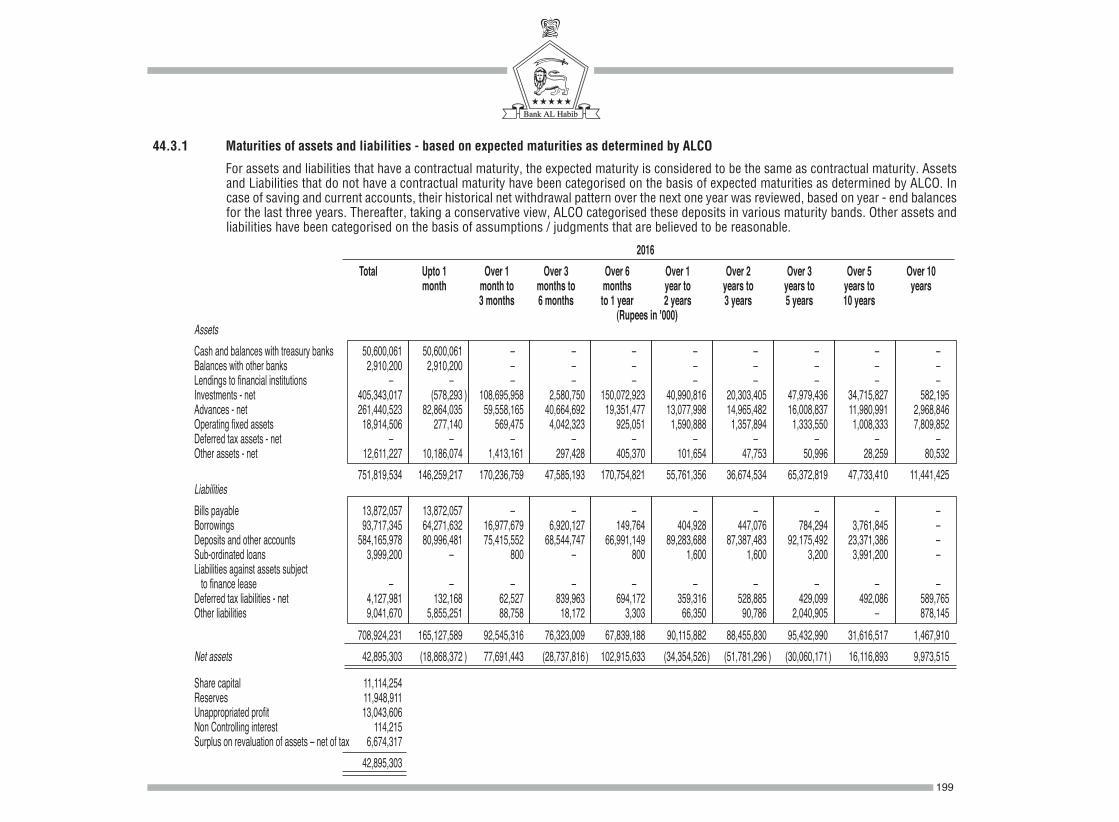
44.3.1 Maturities of assets and liabilities - based on expected maturities as determined by ALCO
For assets and liabilities that have a contractual maturity, the expected maturity is considered to be the same as contractual maturity. Assets and Liabilities that do not have a contractual maturity have been categorised on the basis of expected maturities as determined by ALCO. In case of saving and current accounts, their historical net withdrawal pattern over the next one year was reviewed, based on year - end balances for the last three years. Thereafter, taking a conservative view, ALCO categorised these deposits in various maturity bands. Other assets and liabilities have been categorised on the basis of assumptions / judgments that are believed to be reasonable.
2016 Total Upto 1 Over 1 Over 3 Over 6 Over 1 Over 2 Over 3 Over 5 Over 10 month month to months to months year to years to years to years to years 3 months 6 months to 1 year 2 years 3 years 5 years 10 years (Rupees in '000) Assets Cash and balances with treasury banks 50,600,061 50,600,061 –00 –00 –00 –00 –00 –00 –00 –00 Balances with other banks 2,910,200 2,910,200 –00 –00 –00 –00 –00 –00 –00 –00 Lendings to financial institutions –00 –00 –00 –00 –00 –00 –00 –00 –00 –00 Investments - net 405,343,017 (578,293 ) 108,695,958 2,580,750 150,072,923 40,990,816 20,303,405 47,979,436 34,715,827 582,195 Advances - net 261,440,523 82,864,035 59,558,165 40,664,692 19,351,477 13,077,998 14,965,482 16,008,837 11,980,991 2,968,846 Operating fixed assets 18,914,506 277,140 569,475 4,042,323 925,051 1,590,888 1,357,894 1,333,550 1,008,333 7,809,852 Deferred tax assets - net –00 –00 –00 –00 –00 –00 –00 –00 –00 –00 Other assets - net 12,611,227 10,186,074 1,413,161 297,428 405,370 101,654 47,753 50,996 28,259 80,532 751,819,534 146,259,217 170,236,759 47,585,193 170,754,821 55,761,356 36,674,534 65,372,819 47,733,410 11,441,425 Liabilities Bills payable 13,872,057 13,872,057 –00 –00 –00 –00 –00 –00 –00 –00 Borrowings 93,717,345 64,271,632 16,977,679 6,920,127 149,764 404,928 447,076 784,294 3,761,845 –00 Deposits and other accounts 584,165,978 80,996,481 75,415,552 68,544,747 66,991,149 89,283,688 87,387,483 92,175,492 23,371,386 –00 Sub-ordinated loans 3,999,200 –00 800 –00 800 1,600 1,600 3,200 3,991,200 –00 Liabilities against assets subject to finance lease –00 –00 –00 –00 –00 –00 –00 –00 –00 –00 Deferred tax liabilities - net 4,127,981 132,168 62,527 839,963 694,172 359,316 528,885 429,099 492,086 589,765 Other liabilities 9,041,670 5,855,251 88,758 18,172 3,303 66,350 90,786 2,040,905 –00 878,145 708,924,231 165,127,589 92,545,316 76,323,009 67,839,188 90,115,882 88,455,830 95,432,990 31,616,517 1,467,910 Net assets 42,895,303 (18,868,372 ) 77,691,443 (28,737,816 ) 102,915,633 (34,354,526 ) (51,781,296 ) (30,060,171 ) 16,116,893 9,973,515
Share capital 11,114,254 Reserves 11,948,911 Unappropriated profit 13,043,606 Non Controlling interest 114,215 Surplus on revaluation of assets – net of tax 6,674,317 42,895,303
199
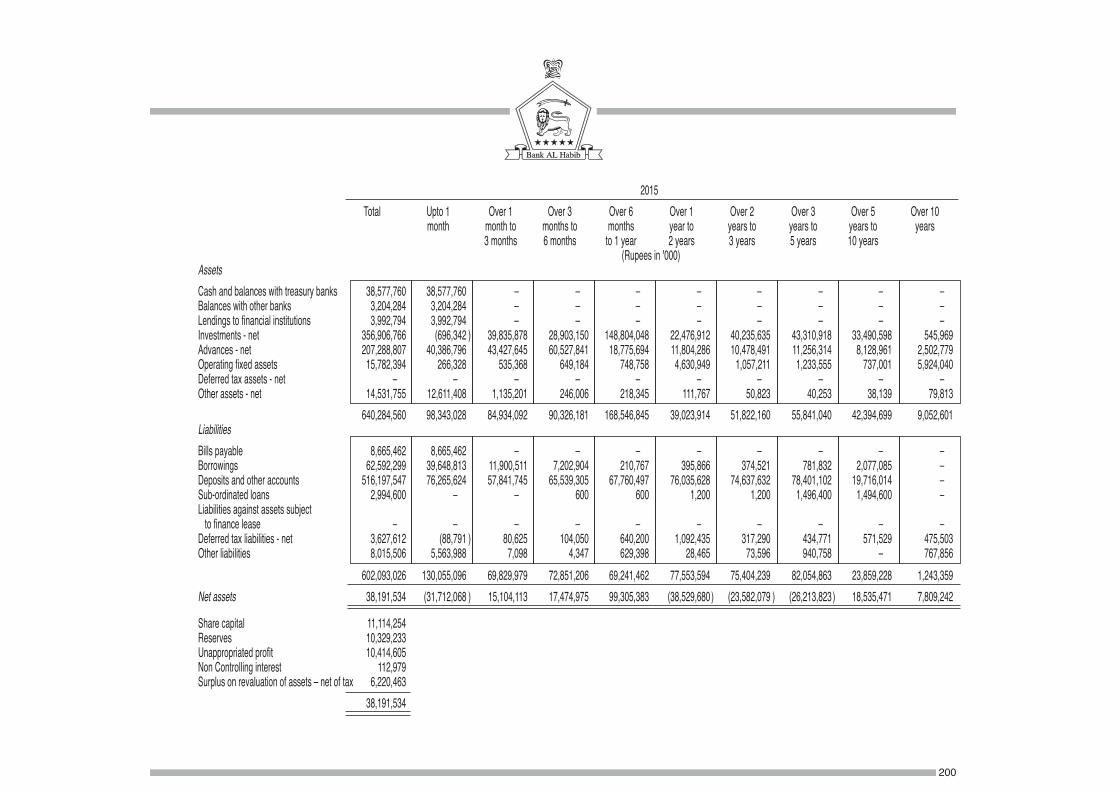
2015 Total Upto 1 Over 1 Over 3 Over 6 Over 1 Over 2 Over 3 Over 5 Over 10 month month to months to months year to years to years to years to years 3 months 6 months to 1 year 2 years 3 years 5 years 10 years (Rupees in '000) Assets Cash and balances with treasury banks 38,577,760 38,577,760 –00 –00 –00 –00 –00 –00 –00 –00 Balances with other banks 3,204,284 3,204,284 –00 –00 –00 –00 –00 –00 –00 –00 Lendings to financial institutions 3,992,794 3,992,794 –00 –00 –00 –00 –00 –00 –00 –00 Investments - net 356,906,766 (696,342 ) 39,835,878 28,903,150 148,804,048 22,476,912 40,235,635 43,310,918 33,490,598 545,969 Advances - net 207,288,807 40,386,796 43,427,645 60,527,841 18,775,694 11,804,286 10,478,491 11,256,314 8,128,961 2,502,779 Operating fixed assets 15,782,394 266,328 535,368 649,184 748,758 4,630,949 1,057,211 1,233,555 737,001 5,924,040 Deferred tax assets - net –00 –00 –00 –00 –00 –00 –00 –00 –00 –00 Other assets - net 14,531,755 12,611,408 1,135,201 246,006 218,345 111,767 50,823 40,253 38,139 79,813 640,284,560 98,343,028 84,934,092 90,326,181 168,546,845 39,023,914 51,822,160 55,841,040 42,394,699 9,052,601 Liabilities Bills payable 8,665,462 8,665,462 –00 –00 –00 –00 –00 –00 –00 –00 Borrowings 62,592,299 39,648,813 11,900,511 7,202,904 210,767 395,866 374,521 781,832 2,077,085 –00 Deposits and other accounts 516,197,547 76,265,624 57,841,745 65,539,305 67,760,497 76,035,628 74,637,632 78,401,102 19,716,014 –00 Sub-ordinated loans 2,994,600 –00 –00 600 600 1,200 1,200 1,496,400 1,494,600 –00 Liabilities against assets subject to finance lease –00 –00 –00 –00 –00 –00 –00 –00 –00 –00 Deferred tax liabilities - net 3,627,612 (88,791 ) 80,625 104,050 640,200 1,092,435 317,290 434,771 571,529 475,503 Other liabilities 8,015,506 5,563,988 7,098 4,347 629,398 28,465 73,596 940,758 –00 767,856 602,093,026 130,055,096 69,829,979 72,851,206 69,241,462 77,553,594 75,404,239 82,054,863 23,859,228 1,243,359 Net assets 38,191,534 (31,712,068 ) 15,104,113 17,474,975 99,305,383 (38,529,680 ) (23,582,079 ) (26,213,823 ) 18,535,471 7,809,242
Share capital 11,114,254 Reserves 10,329,233 Unappropriated profit 10,414,605 Non Controlling interest 112,979 Surplus on revaluation of assets – net of tax 6,220,463 38,191,534
200
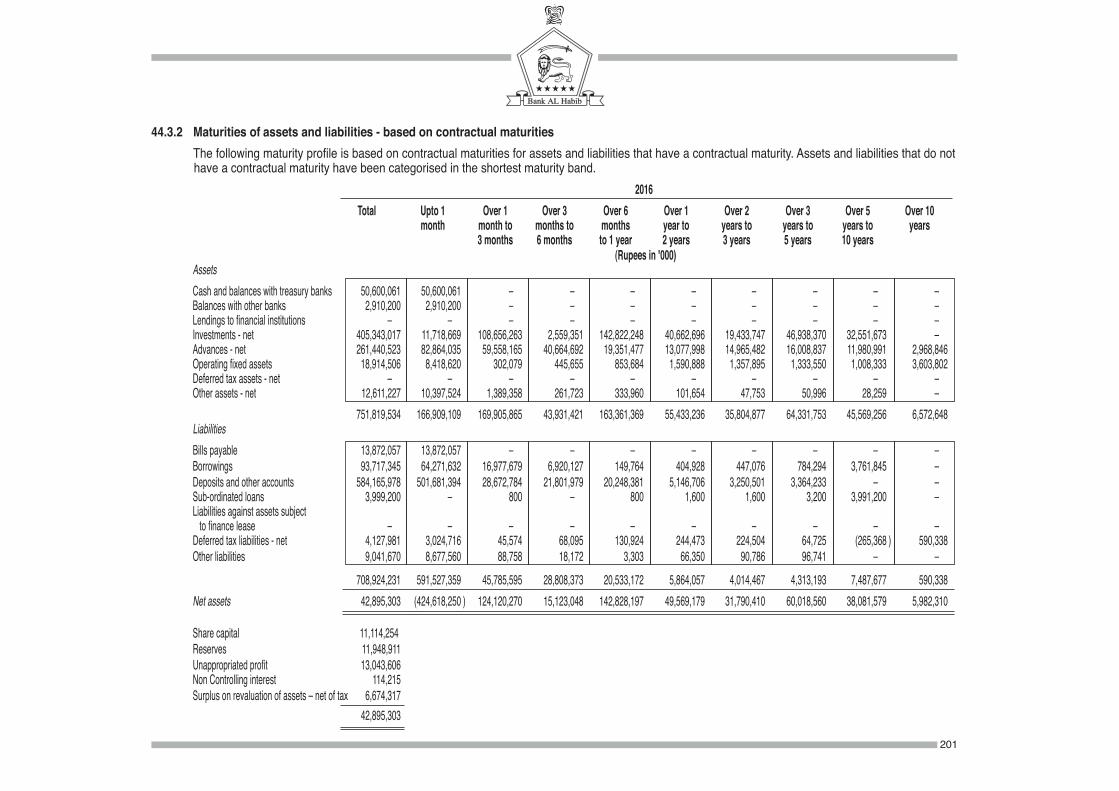
2016 Total Upto 1 Over 1 Over 3 Over 6 Over 1 Over 2 Over 3 Over 5 Over 10 month month to months to months year to years to years to years to years 3 months 6 months to 1 year 2 years 3 years 5 years 10 years (Rupees in '000) Assets Cash and balances with treasury banks 50,600,061 50,600,061 –00 –00 –00 –00 –00 –00 –00 –00 Balances with other banks 2,910,200 2,910,200 –00 –00 –00 –00 –00 –00 –00 –00 Lendings to financial institutions –00 –00 –00 –00 –00 –00 –00 –00 –00 –00 Investments - net 405,343,017 11,718,669 108,656,263 2,559,351 142,822,248 40,662,696 19,433,747 46,938,370 32,551,673 –00 Advances - net 261,440,523 82,864,035 59,558,165 40,664,692 19,351,477 13,077,998 14,965,482 16,008,837 11,980,991 2,968,846 Operating fixed assets 18,914,506 8,418,620 302,079 445,655 853,684 1,590,888 1,357,895 1,333,550 1,008,333 3,603,802 Deferred tax assets - net –00 –00 –00 –00 –00 –00 –00 –00 –00 –00 Other assets - net 12,611,227 10,397,524 1,389,358 261,723 333,960 101,654 47,753 50,996 28,259 –00 751,819,534 166,909,109 169,905,865 43,931,421 163,361,369 55,433,236 35,804,877 64,331,753 45,569,256 6,572,648 Liabilities Bills payable 13,872,057 13,872,057 –00 –00 –00 –00 –00 –00 –00 –00 Borrowings 93,717,345 64,271,632 16,977,679 6,920,127 149,764 404,928 447,076 784,294 3,761,845 –00 Deposits and other accounts 584,165,978 501,681,394 28,672,784 21,801,979 20,248,381 5,146,706 3,250,501 3,364,233 –00 –00 Sub-ordinated loans 3,999,200 –00 800 –00 800 1,600 1,600 3,200 3,991,200 –00 Liabilities against assets subject to finance lease –00 –00 –00 –00 –00 –00 –00 –00 –00 –00 Deferred tax liabilities - net 4,127,981 3,024,716 45,574 68,095 130,924 244,473 224,504 64,725 (265,368 ) 590,338 Other liabilities 9,041,670 8,677,560 88,758 18,172 3,303 66,350 90,786 96,741 –00 –00 708,924,231 591,527,359 45,785,595 28,808,373 20,533,172 5,864,057 4,014,467 4,313,193 7,487,677 590,338 Net assets 42,895,303 (424,618,250 ) 124,120,270 15,123,048 142,828,197 49,569,179 31,790,410 60,018,560 38,081,579 5,982,310 Share capital 11,114,254 Reserves 11,948,911 Unappropriated profit 13,043,606 Non Controlling interest 114,215 Surplus on revaluation of assets – net of tax 6,674,317 42,895,303
44.3.2 Maturities of assets and liabilities - based on contractual maturities The following maturity profile is based on contractual maturities for assets and liabilities that have a contractual maturity. Assets and liabilities that do not
have a contractual maturity have been categorised in the shortest maturity band.
201
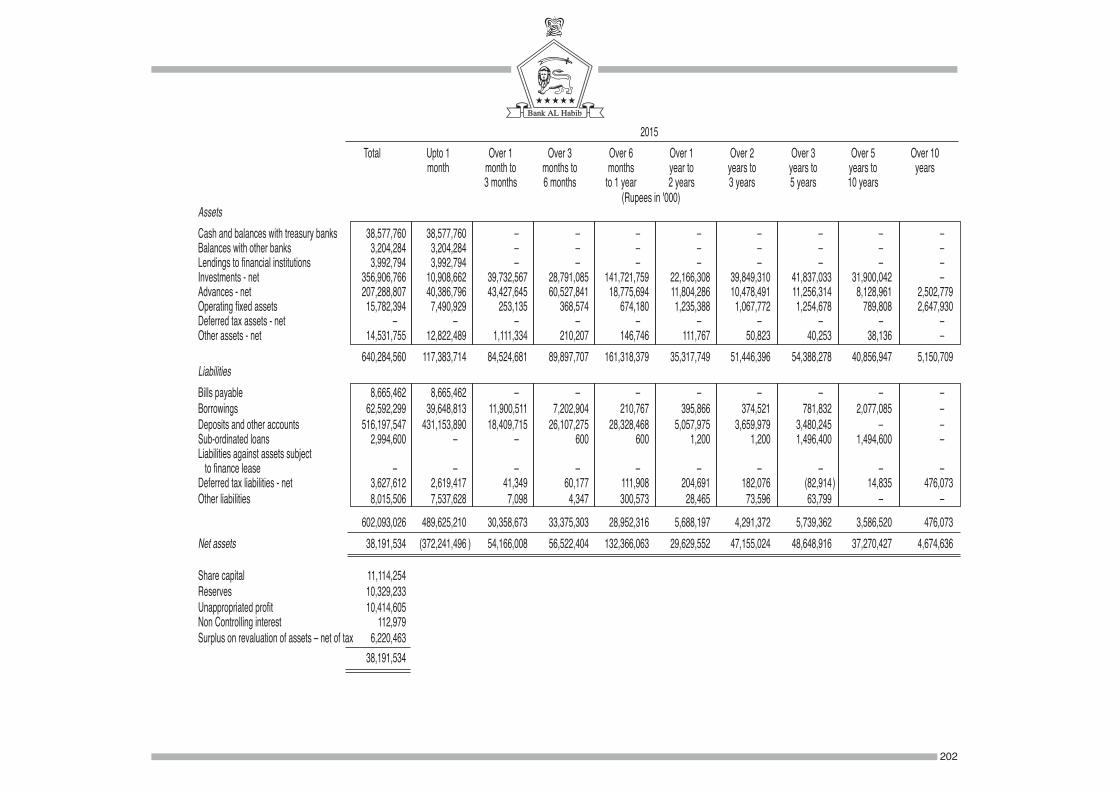
2015 Total Upto 1 Over 1 Over 3 Over 6 Over 1 Over 2 Over 3 Over 5 Over 10 month month to months to months year to years to years to years to years 3 months 6 months to 1 year 2 years 3 years 5 years 10 years (Rupees in '000) Assets Cash and balances with treasury banks 38,577,760 38,577,760 –00 –00 –00 –00 –00 –00 –00 –00 Balances with other banks 3,204,284 3,204,284 –00 –00 –00 –00 –00 –00 –00 –00 Lendings to financial institutions 3,992,794 3,992,794 –00 –00 –00 –00 –00 –00 –00 –00 Investments - net 356,906,766 10,908,662 39,732,567 28,791,085 141,721,759 22,166,308 39,849,310 41,837,033 31,900,042 –00 Advances - net 207,288,807 40,386,796 43,427,645 60,527,841 18,775,694 11,804,286 10,478,491 11,256,314 8,128,961 2,502,779 Operating fixed assets 15,782,394 7,490,929 253,135 368,574 674,180 1,235,388 1,067,772 1,254,678 789,808 2,647,930 Deferred tax assets - net –00 –00 –00 –00 –00 –00 –00 –00 –00 –00 Other assets - net 14,531,755 12,822,489 1,111,334 210,207 146,746 111,767 50,823 40,253 38,136 –00 640,284,560 117,383,714 84,524,681 89,897,707 161,318,379 35,317,749 51,446,396 54,388,278 40,856,947 5,150,709 Liabilities Bills payable 8,665,462 8,665,462 –00 –00 –00 –00 –00 –00 –00 –00 Borrowings 62,592,299 39,648,813 11,900,511 7,202,904 210,767 395,866 374,521 781,832 2,077,085 –00 Deposits and other accounts 516,197,547 431,153,890 18,409,715 26,107,275 28,328,468 5,057,975 3,659,979 3,480,245 –00 –00 Sub-ordinated loans 2,994,600 –00 –00 600 600 1,200 1,200 1,496,400 1,494,600 –00 Liabilities against assets subject to finance lease –00 –00 –00 –00 –00 –00 –00 –00 –00 –00 Deferred tax liabilities - net 3,627,612 2,619,417 41,349 60,177 111,908 204,691 182,076 (82,914 ) 14,835 476,073 Other liabilities 8,015,506 7,537,628 7,098 4,347 300,573 28,465 73,596 63,799 –00 –00 602,093,026 489,625,210 30,358,673 33,375,303 28,952,316 5,688,197 4,291,372 5,739,362 3,586,520 476,073 Net assets 38,191,534 (372,241,496 ) 54,166,008 56,522,404 132,366,063 29,629,552 47,155,024 48,648,916 37,270,427 4,674,636 Share capital 11,114,254 Reserves 10,329,233 Unappropriated profit 10,414,605 Non Controlling interest 112,979 Surplus on revaluation of assets – net of tax 6,220,463 38,191,534
202
44.4 Equity position risk in the banking book – Basel Specific
Except for very limited trading position in equities as mentioned above (note 44.2), the Bank's policy is to take equity positions for investment purposes. Equity holdings include direct investment in shares and in equity - based mutual funds, both closed - end and open - end. Policies covering their valuation and accounting are disclosed in note 5.5.
Equity position risk
Equity position risk is the risk of loss from adverse movements in equity prices. The Bank’s policy is to take equity positions for investment purposes and not to run a trading book, except to a very limited extent (maximum of Rs. 300 million) for trading in equities.
Equity position risk of the Bank is controlled through equity portfolio limits, sector limits, scrip limits, and future contracts limits. Direct investment in equities and mutual funds is managed within the statutory limits as prescribed by SBP as well as the internal limits set by the Bank itself. Stress testing for equity price risk is carried out regularly to estimate the impact of decline in stock prices.
44.5 Operational risk
Operational risk is the risk of loss resulting from inadequate or failed internal processes, people, and systems or from external events. This definition includes legal risks but excludes strategic and reputational risks.
Operational risk is managed through the operational risk policy and audit policy approved by the Board, along with the policies on prevention of frauds and forgeries and compliance with “Know Your Customer” / "Customer Due Diligence" and “Anti Money Laundering / Combating Financing of Terrorism” requirements; operational manuals and procedures issued from time to time; a system of internal controls and dual authorisation for important transactions and safe-keeping; a Business Continuity Plan, including a Disaster Recovery Plan for I.T., to prevent interruption of business services in the event of a major incident or disaster; an I.T. Security Policy to ensure security and integrity of I.T. systems; and regular audit of the branches. Audit Committee of the Board provides overall guidance in managing the Bank’s operational risk.
The Bank’s operational risk management framework, as laid down in the operational risk policy, permits the overall risk management approach to evolve in the light of organisational learning and the future needs of the Bank.
The Bank places a high priority on conducting all business dealings with integrity and fairness, as laid down in the Code of Conduct, which is required to be complied with by all employees.
Internal controls are an essential feature of risk reduction in operational risk management and the Bank continues to improve its internal controls.
Operational risk disclosures – Basel Specific
The Bank uses Basic Indicator Approach to calculate capital charge for operational risk as per Basel regulatory framework. This approach is considered to be most suitable in view of the business model of the Bank which relies on an extensive network of branches to offer one - stop, full - service banking to its clients. The Bank has developed and implemented an Operational Loss Database. Operational loss and "near miss" events are reviewed and appropriate corrective actions taken on an ongoing basis, including measures to improve security and control procedures.
203
45. ISLAMIC BANKING BUSINESS
45.1 The Bank is operating 41 (2015: 29) Islamic banking branches in Pakistan. The statement of financial position and profit and loss account of these branches as at 31 December 2016 and for the year are as follows:
45.1.1 STATEMENT OF FINANCIAL POSITION
2016 2015 Note (Rupees in '000) ASSETS Cash and balances with treasury banks 1,552,162 882,606 Balances with and due from financial institutions 302,037 744,861 Investments 45.1.1.1 9,132,670 5,594,911 Islamic financing and related assets 45.1.1.2 18,128,914 11,980,951 Operating fixed assets 182,487 134,795 Other assets 252,443 244,172
29,550,713 19,582,296 LIABILITIES Bills payable 22,514 8,452 Due to financial institutions 2,641,655 2,734,239 Deposits and other accounts 22,607,349 14,718,557 – Current accounts 8,044,145 4,797,701 – Saving accounts 6,533,321 3,675,740 – Term deposits 5,049,667 5,152,092 – Others 81,580 71,726
– Deposits from financial institutions - remunerative 2,897,919 1,019,316 – Deposits from financial institutions - non-remunerative 717 1,982
Due to Head Office 513,406 1,490 Other liabilities 1,125,648 427,968 (26,910,572 ) (17,890,706 )
NET ASSETS 2,640,141 1,691,590
REPRESENTED BY: Islamic banking fund 2,500,000 1,500,000 Unremitted profit 108,178 180,290
2,608,178 1,680,290 Surplus on revaluation of assets 31,963 11,300
2,640,141 1,691,590
204
2016 2015 (Rupees in '000)45.1.1.1 Investments Sukuk bonds 9,009,327 3,769,633 Bai Muajjal –00 1,825,278 Fully paid-up ordinary shares - Listed 123,343 –00 9,132,670 5,594,911
45.1.1.2 Islamic financing and related assets Murabaha 3,153,222 2,850,625 Net book value of assets / investment in ijarah under IFAS 2 1,338,279 695,688 Diminishing musharaka 5,264,472 3,639,528 Musawama 960,059 274,033 Export refinance murabaha 408,789 32,351 Export refinance istisna 2,052,048 2,491,638 Istisna 1,771,968 568,922 Gross financings 14,948,837 10,552,785 Advance against murabaha 668,142 1,176,821 Advance against ijarah 864,728 253,129 Advance against diminishing musharaka 1,563,383 –00 Advance against istisna 89,168 –00 Islamic financing and related assets - gross 18,134,258 11,982,735 Less: general provisioning against consumer financing (5,344 ) (1,784 ) Islamic financing and related assets - net off provision 18,128,914 11,980,951
45.1.1.3 Islamic mode of financing Financings / inventory / receivables 14,948,837 10,552,785 Advances 3,185,421 1,429,950 Less: general provision against consumer financing (5,344 ) (1,784 ) 18,128,914 11,980,951
205
45.2 PROFIT AND LOSS ACCOUNT Profit / return on financing and placements earned 1,320,354 1,155,163 Profit / return on deposits and other dues expensed (654,881 ) (626,271 ) 665,473 528,892 Provision against non-performing loans and advances (3,560 ) (1,096 ) Net spread earned 661,913 527,796
OTHER INCOME Fee, commission and brokerage income 72,021 45,068 Dividend income 5,615 –00 Income from dealing in foreign currencies 20,038 11,241 Gain on sale of securities 8,235 –00 Other income 22,033 15,366 127,942 71,675 789,855 599,471 OTHER EXPENSES Administrative expenses (681,677 ) (419,181 )
PROFIT BEFORE TAXATION 108,178 180,290

2016 2015 (Rupees in '000)
45.3 Remuneration to Shariah Board / Advisor 5,334 3,354
45.4 CHARITY FUND
Opening balance 2,686 2,621 Additions during the year 2,738 2,686 Payments / utilisation during the year Health (630 ) (1,021 ) Social welfare (2,056 ) (1,600 ) (2,686 ) (2,621 ) Closing balance 2,738 2,686
The non - shariah compliant income identified during the year is transferred to the charity account.
45.5 PROFIT AND LOSS DISTRIBUTION AND POOL MANAGEMENT
45.5.1 The number and nature of pools maintained by the Islamic Banking Branches along with their key features and risk & reward characteristics:
General Pool PKR (Mudaraba)
Generally the deposits parked in general pool are based on normal weightages. The risk of loss is minimal due to the less risky assets parked in General Pool.
Special Pool(s) PKR (Mudaraba)
Separate pool(s) are created where the customers desire to invest in a special class of assets. These pool(s) rates are higher than the general pool depending on the special class of assets. In case of loss in special pool the loss will be borne by the Special pool members.
General Pool FCY (Mudaraba)
In FCY pool, all FCY deposits and Investments are parked to share the return among the FCY deposit holders. The weightages are also declared separately.
Islamic Export Refinance Scheme (IERS) Pool PKR (Musharaka)
IERS pool is required by SBP to facilitate the exporters under IERS.
Parameters associated with risk and rewards:
Following are the key considerations attached with risk and reward of the pool:
- Period, return, safety, security and liquidity of investment.
- Maturities of funds obtained from Principal Office, Islamic Banking Institutions and Shariah compliant organisations as regulated in Pakistan.
- Element of risk attached to various types of investments.
- SBP rules & Shariah clearance.
206
45.5.2 Avenues / sectors of economy / business where Mudaraba based deposits have been deployed :
The Mudaraba based funds have been deployed in the following avenues / sectors / business: - Chemical & pharmaceuticals - Agribusiness - Textile - Sugar - Shoes & leather garments - Investment in sukuk - Production and transmission of energy - Food and allied except sugar - Wheat - Individuals - Others (Domestic whole sale, plastic product etc.)
45.5.3 Parameters used for allocation of profit, charging expenses and provisions etc. along with a brief description of their major components:
The Bank’s Islamic Banking Division (IBD) is currently accepting Pak Rupees Term Deposits and Saving Deposits under Mudaraba arrangements, wherein the Bank is Mudarib and depositors are Rab - ul - Maal. The Bank also commingles its funds with those of depositors.
The funds so generated are invested by the Bank in Shariah compliant modes of financing such as Murabaha, Ijarah, Istisna, Diminishing Musharaka, Musawama and Ijarah Sukuk.
The Bank calculates the profit of the pool after every quarter. Profit is distributed at the net income level. Net income is calculated after deducting costs and expenses such as cost of Murabaha, cost of Takaful, depreciation and loss of investments, directly incurred in deriving that income.
The net income / loss is being allocated between the Bank's equity and the depositors' fund in proportion to their respective share in pool.
The Bank’s profit sharing ratio during the year was 50% (2015: 50%) of net income and the depositors’ profit sharing ratio was 50% (2015: 50%) of net income.
After the allocation of income between the equity holder and depositors the profit is distributed among the account holders on the basis of predetermined weightages, announced by the Bank at the beginning of the quarter based on their respective category / tiers. In case of loss, Rab - ul - Maal has to bear the loss in the ratio of its investment.
In case of provisioning, the general and specific provisions created against non - performing financing and diminution in the value of investments as under prudential regulations and other SBP directives shall be borne by the IBIs as Mudarib. However, write - offs of financings and loss on sale of investments shall be charged to the pool along with other direct expenses.
207
45.5.5 Profit rate earned vs. profit rate distributed to the depositors during the year
2016 2015 (Percentage)
Profit Rate Earned 6.03% 7.80% Profit Rate Distributed 3.36% 4.11%
46. SUBSEQUENT EVENT
Subsequent to the year end, the Board of Directors proposed a final cash dividend of Rs. 3.5 (2015: Rs. 3.5) per share.
47. GENERAL
47.1 SBP has issued BPRD Circular Letter No. 5 dated February 29, 2016 regarding the classification of Islamic financing and related assets. Accordingly, prior year numbers have been reclassified as follows:
Reclassification from Reclassification to 2015 2014 Statement of Financial Position Statement of Financial Position (Rupees in '000)
Lendings to Financial Institutions Investments - net 1,825,278 –00 Other assets - net Advances - net 1,429,950 380,266
No other major reclassifications were made during the year.
47.2 Figures have been rounded off to the nearest thousand rupees, unless otherwise stated.
48. DATE OF AUTHORISATION
These consolidated financial statements were authorised for issue in the Board of Directors' meeting held on January 26, 2017.
208
MANSOOR ALI KHANChief Executive
ABBAS D. HABIBChairman
SYED MAZHAR ABBASDirector
ANWAR HAJI KARIMDirector
45.5.4 Mudarib share & HIBA distributed to depositor’s pool and specific pool 2016 Distributable Mudarib Mudarib HIBA HIBA Income Share Share Amount (Rupees in '000) (Percentage) (Rupees in '000) (Percentage)
LCY Pool 963,914 460,681 48% 82,024 18% FCY Pool 3,828 3,554 93% 192 5%
2015
LCY Pool 765,492 382,746 50% 114,730 30% FCY Pool 2,793 2,514 90% 42 2%
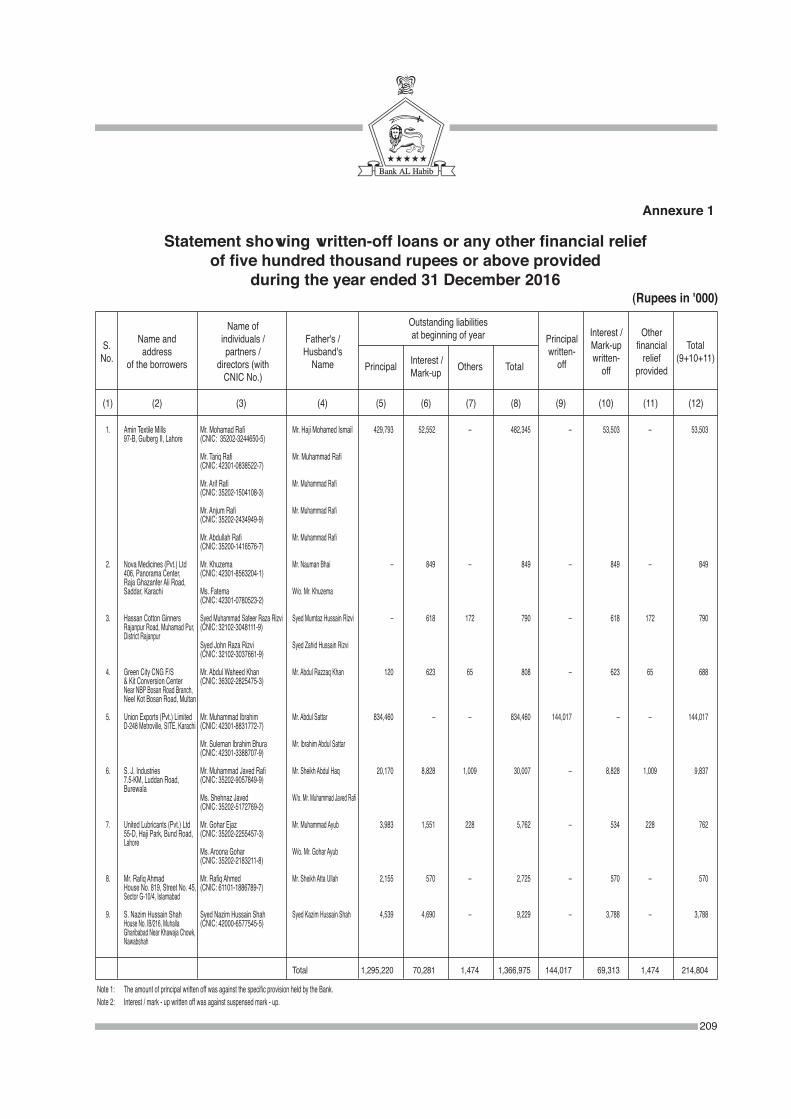
209
1. Amin Textile Mills Mr. Mohamad Rafi Mr. Haji Mohamed Ismail 429,793 52,552 – 482,345 – 53,503 – 53,503 97-B, Gulberg II, Lahore (CNIC: 35202-3244650-5)
Mr. Tariq Rafi Mr. Muhammad Rafi (CNIC: 42301-0838522-7)
Mr. Arif Rafi Mr. Muhammad Rafi (CNIC: 35202-1504108-3)
Mr. Anjum Rafi Mr. Muhammad Rafi (CNIC: 35202-2434949-9)
Mr. Abdullah Rafi Mr. Muhammad Rafi (CNIC: 35200-1416576-7)
2. Nova Medicines (Pvt.) Ltd Mr. Khuzema Mr. Nauman Bhai – 849 – 849 – 849 – 849 406, Panorama Center, (CNIC: 42301-8563204-1) Raja Ghazanfer Ali Road, Saddar, Karachi Ms. Fatema W/o. Mr. Khuzema (CNIC: 42301-0780523-2) 3. Hassan Cotton Ginners Syed Muhammad Safeer Raza Rizvi Syed Mumtaz Hussain Rizvi – 618 172 790 – 618 172 790 Rajanpur Road, Muhamad Pur, (CNIC: 32102-3048111-9) District Rajanpur Syed John Raza Rizvi Syed Zahid Hussain Rizvi (CNIC: 32102-3037661-9)
4. Green City CNG F/S Mr. Abdul Waheed Khan Mr. Abdul Razzaq Khan 120 623 65 808 – 623 65 688 & Kit Conversion Center (CNIC: 36302-2825475-3) Near NBP Bosan Road Branch, Neel Kot Bosan Road, Multan 5. Union Exports (Pvt.) Limited Mr. Muhammad Ibrahim Mr. Abdul Sattar 834,460 – – 834,460 144,017 – – 144,017 D-248 Metroville, SITE, Karachi (CNIC: 42301-8831772-7)
Mr. Suleman Ibrahim Bhura Mr. Ibrahim Abdul Sattar (CNIC: 42301-3388707-9)
6. S. J. Industries Mr. Muhammad Javed Rafi Mr. Sheikh Abdul Haq 20,170 8,828 1,009 30,007 – 8,828 1,009 9,837 7.5-KM, Luddan Road, (CNIC: 35202-9057849-9) Burewala Ms. Shehnaz Javed W/o. Mr. Muhammad Javed Rafi (CNIC: 35202-5172769-2)
7. United Lubricants (Pvt.) Ltd Mr. Gohar Ejaz Mr. Muhammad Ayub 3,983 1,551 228 5,762 – 534 228 762 55-D, Haji Park, Bund Road, (CNIC: 35202-2255457-3) Lahore Ms. Aroona Gohar W/o. Mr. Gohar Ayub (CNIC: 35202-2183211-8)
8. Mr. Rafiq Ahmad Mr. Rafiq Ahmed Mr. Sheikh Atta Ullah 2,155 570 – 2,725 – 570 – 570 House No. 819, Street No. 45, (CNIC: 61101-1886789-7) Sector G-10/4, Islamabad
9. S. Nazim Hussain Shah Syed Nazim Hussain Shah Syed Kazim Hussain Shah 4,539 4,690 – 9,229 – 3,788 – 3,788 House No. IB/216, Muhalla (CNIC: 42000-6577545-5) Gharibabad Near Khawaja Chowk, Nawabshah
Total 1,295,220 70,281 1,474 1,366,975 144,017 69,313 1,474 214,804
Note 1: The amount of principal written off was against the specific provision held by the Bank.Note 2: Interest / mark - up written off was against suspensed mark - up.
Annexure 1
Statement showing written-off loans or any other financial reliefof five hundred thousand rupees or above provided
during the year ended 31 December 2016(Rupees in '000)
Name ofindividuals /partners /
directors (withCNIC No.)
S.No.
Name andaddress
of the borrowers
Father's /Husband's
Name
Outstanding liabilitiesat beginning of year
Principal Interest /Mark-up Others Total
Principalwritten-
off
Interest /Mark-upwritten-
off
Otherfinancial
reliefprovided
Total(9+10+11)
(3) (4) (5) (6) (7) (8) (9) (10) (11) (12)(2)(1)

210
Disclosure on Complaint Handling
Customer Services and Customer Satisfaction are key indicators of performance, and achievement of efficient customer service and high customer satisfaction assures growth and profitability of the Bank.
The Bank has developed a comprehensive Customer Grievances Handling Policy, in line with regulatory requirements, which is based on the principles of fairness, promptness, and customer's right to approach alternate remedial avenues in case of dissatisfaction. A number of channels are available and advised to customers, through which they may register their complaints to Customer Services Division / CEO’s Office. All complaints, including submissions through Website, emails, drop-boxes as well as direct submissions to Customer Services Division / CEO’s Office, are logged in the Complaint Management System and acknowledged. The logged complaints are tracked for end-to-end resolution within regulatory timelines and escalated to senior management, as required. In case a complainant is not satisfied with the resolution provided by the Bank, he may escalate his complaint to Banking Mohtasib Pakistan. This process is informed to customers through Branches and the Website.
During 2016, the Complaint Management System has been enhanced to make the process more effective for the Bank to assure compliance with regulatory guidelines, Extensive training has been arranged for Branches and all key customer centric staff to improve service levels and handling of complaints.
During 2016, the Bank received 47,921 complaints through different channels, out of which almost 99% were investigated and closed within defined standards and regulatory requirements.

211
Report of Shariah Board as at 31 December 2016In the name of Allah, the Beneficent, the Merciful
While the Board of Directors and Executive Management are solely responsible to ensure that the operations of Bank AL Habib – Islamic Banking Division (BAHL-IBD) are conducted in a manner that comply with Shariah principles and guidelines issued by the Shariah Board of the BAHL-IBD at all times. The Shariah Governance Framework issued by the State Bank of Pakistan, required the Shariah Board (SB) to submit a report on the overall Shariah compliance environment of BAHL-IBD.
To form the opinion as expressed in this report, the Shariah Compliance Department carried out Shariah Reviews on test check basis, of each class of transactions, the relevant documentation and process flows. Further, during the last year, Shariah Board have also reviewed Internal Shariah Audit Reports that were provided. Based on above, we are of the view that:
(i) BAHL-IBD has complied with Shariah rules and principles in the light of fatawa, rulings and guidelines issued by its Shariah Board.
(ii) BAHL-IBD has complied with directives, regulations, instructions and guidelines related to Shariah compliance issued by SBP in accordance with the rulings of SBP’s Shariah Board.
(iii) BAHL-IBD has developed the basic mechanism for Shariah compliance in its overall operations and should ensure that Shariah Compliance Department and Shariah Board may carry out their resonsibilities in an effective manner.
(iv) The Shariah Board feels that there is a need to further strengthen the system to make it sound enough to ensure that any impure earnings have been credited to charity account and are being properly utilized.
(v) BAHL-IBD has complied with the SBP instructions on profit and loss distribution and pool management.
(vi) Improvement is required in level of awareness of Islamic finance of the staff, management. Proper training schedule/calendar needs to be developed and organized for each level. However, trainings have been conducted for the new staff along with 3 refreshers for the old staff. The BOD appreciates the importance of Shariah compliance in the products, processes and operations of the BAHL-IBD. The Management also needs to improve their understanding on the importance of Shariah compliance in these areas.
(vii) It is required from the management to arrange adequate resources to Shariah Board enabling them to discharge their duties effectively.
Karachi: January 26, 2017
MUFTI MUHAMMAD SARFARAZ NIHALResident Shariah Board Member
MUFTI MOHIB UL HAQMember Shariah Board
MUFTI ISMATULLAH HAMDULLAHChairman Shariah Board
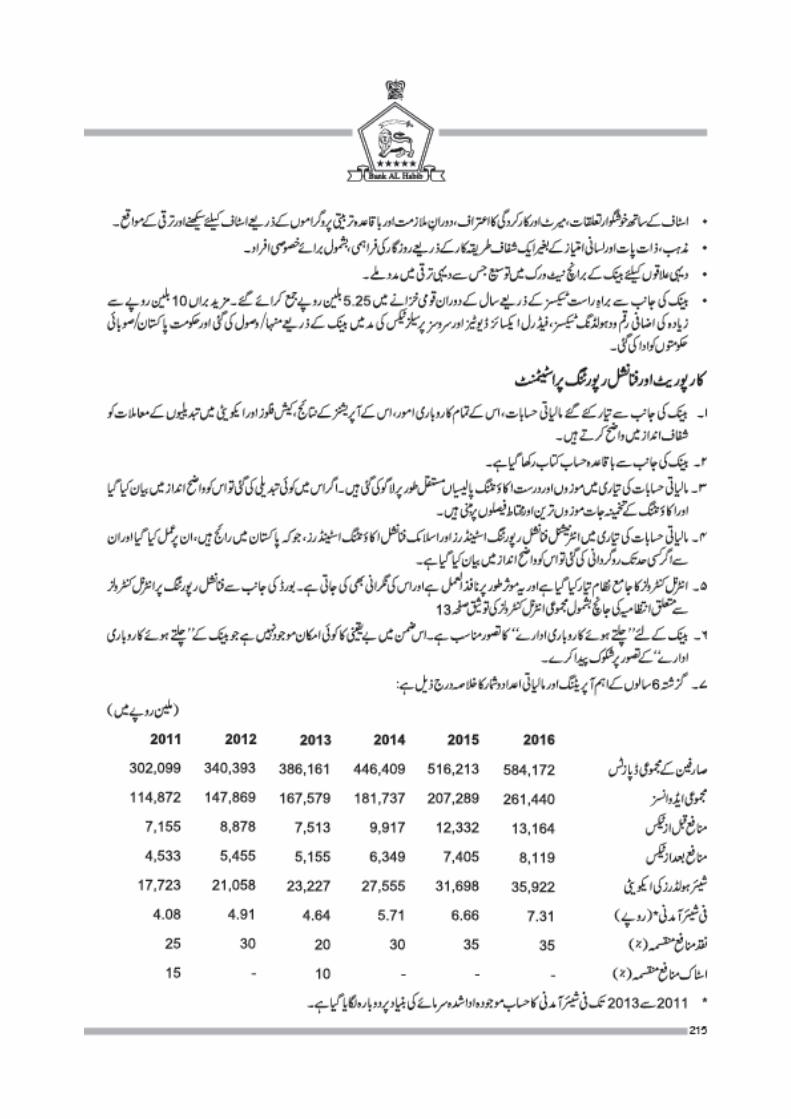
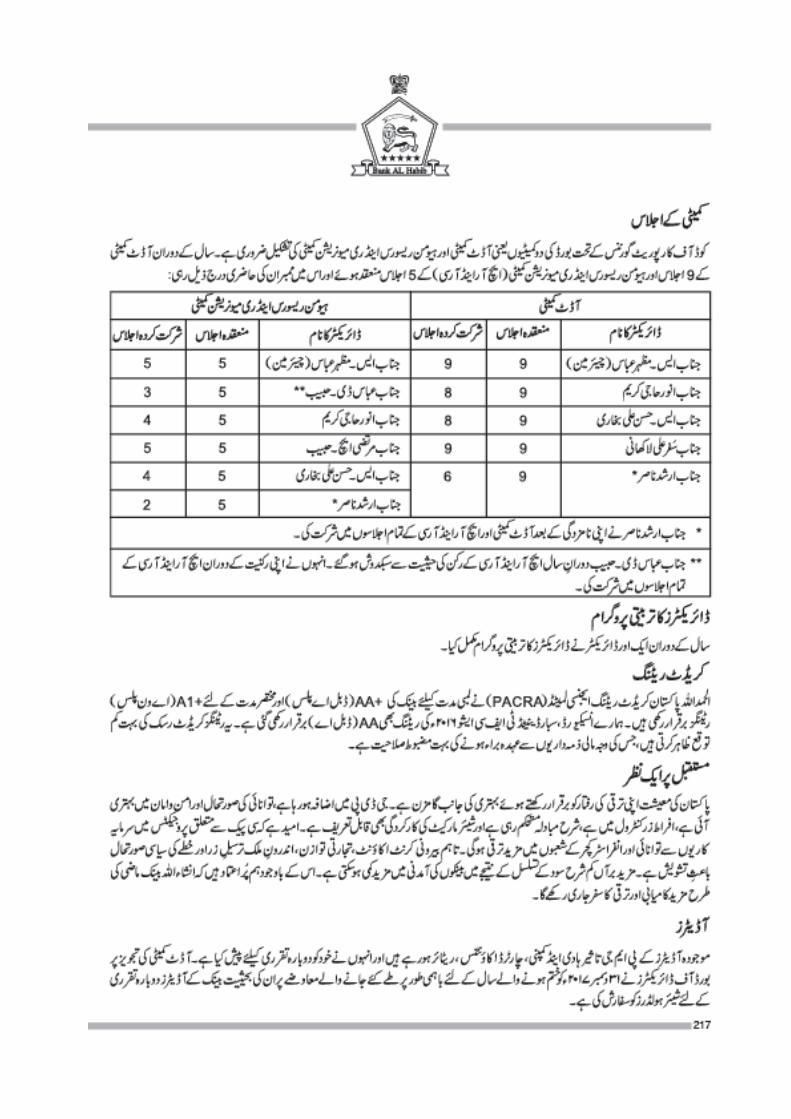
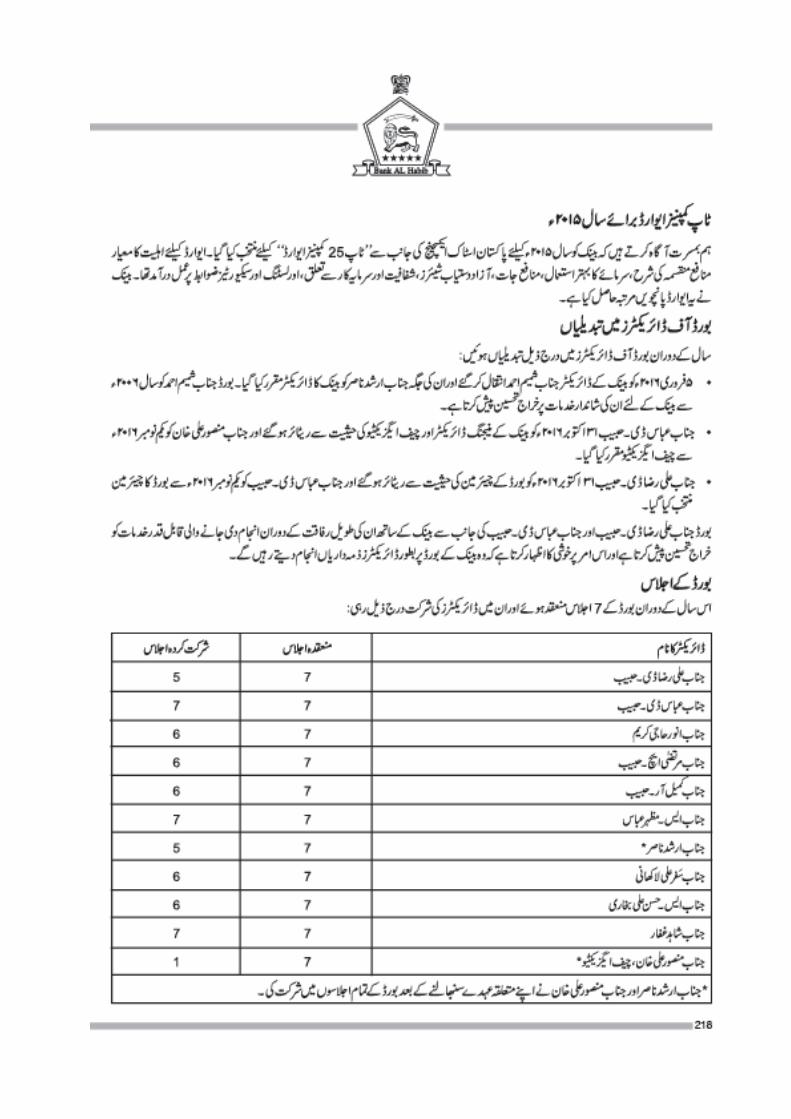
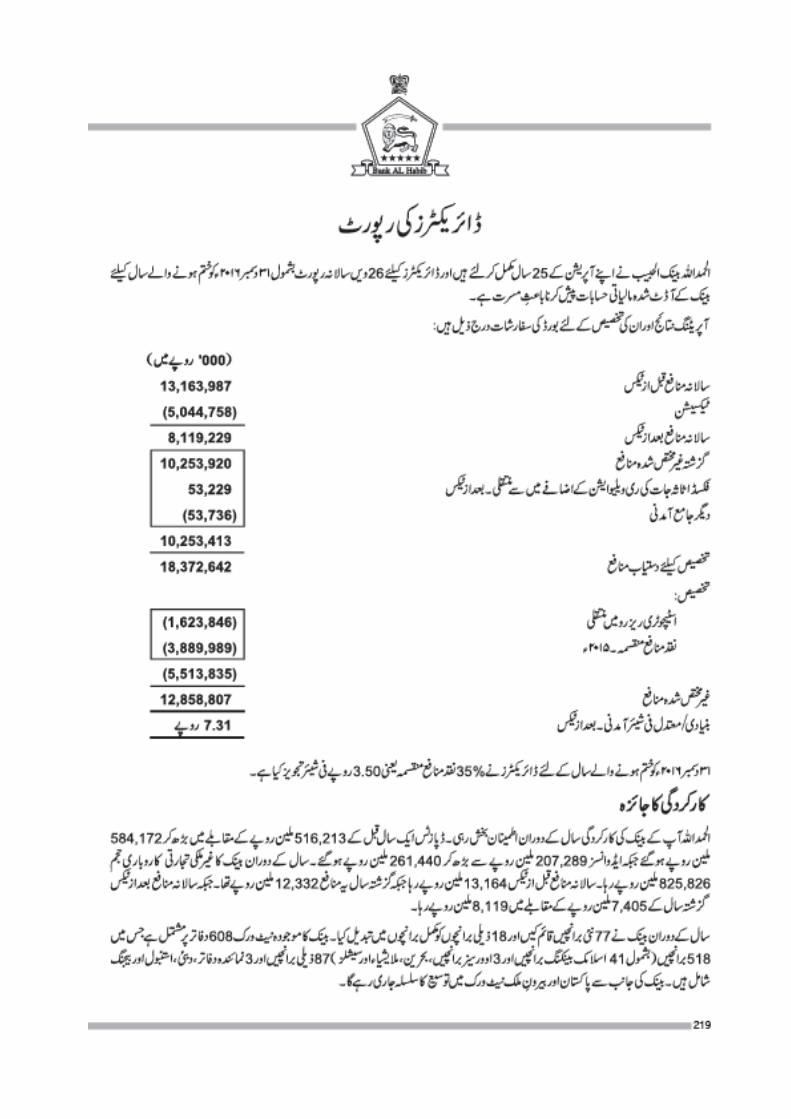
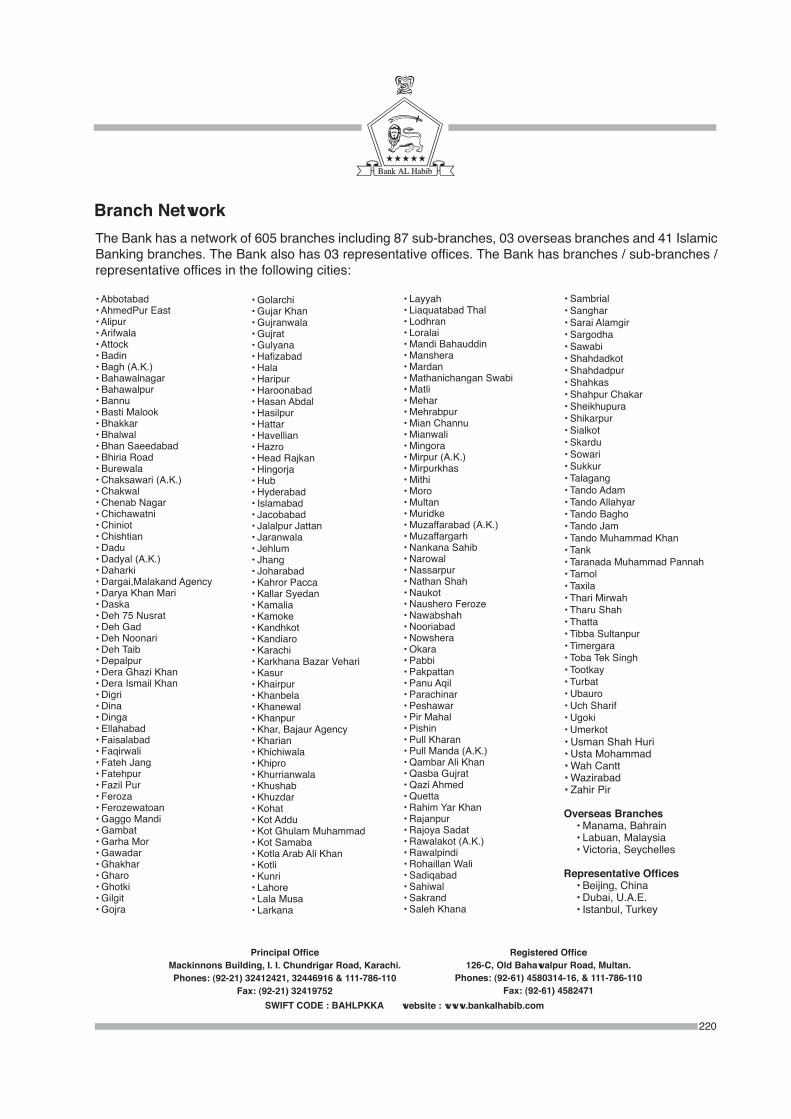
220
Branch NetworkThe Bank has a network of 605 branches including 87 sub-branches, 03 overseas branches and 41 Islamic Banking branches. The Bank also has 03 representative offices. The Bank has branches / sub-branches / representative offices in the following cities:
SWIFT CODE : BAHLPKKA website : www.bankalhabib.com
Registered Office126-C, Old Bahawalpur Road, Multan.
Phones: (92-61) 4580314-16, & 111-786-110 Fax: (92-61) 4582471
Principal OfficeMackinnons Building, I. I. Chundrigar Road, Karachi.Phones: (92-21) 32412421, 32446916 & 111-786-110
Fax: (92-21) 32419752
• Abbotabad• AhmedPur East• Alipur• Arifwala• Attock• Badin• Bagh (A.K.)• Bahawalnagar• Bahawalpur• Bannu• Basti Malook• Bhakkar• Bhalwal• Bhan Saeedabad• Bhiria Road• Burewala• Chaksawari (A.K.)• Chakwal• Chenab Nagar• Chichawatni• Chiniot• Chishtian• Dadu• Dadyal (A.K.)• Daharki• Dargai,Malakand Agency• Darya Khan Mari • Daska• Deh 75 Nusrat• Deh Gad• Deh Noonari• Deh Taib• Depalpur• Dera Ghazi Khan• Dera Ismail Khan• Digri• Dina • Dinga• Ellahabad• Faisalabad• Faqirwali• Fateh Jang• Fatehpur• Fazil Pur• Feroza• Ferozewatoan• Gaggo Mandi• Gambat• Garha Mor• Gawadar• Ghakhar• Gharo• Ghotki• Gilgit• Gojra
• Golarchi• Gujar Khan• Gujranwala• Gujrat• Gulyana• Hafizabad• Hala• Haripur• Haroonabad• Hasan Abdal• Hasilpur• Hattar• Havellian• Hazro• Head Rajkan• Hingorja• Hub• Hyderabad• Islamabad• Jacobabad• Jalalpur Jattan• Jaranwala• Jehlum• Jhang• Joharabad• Kahror Pacca• Kallar Syedan• Kamalia• Kamoke• Kandhkot• Kandiaro• Karachi• Karkhana Bazar Vehari• Kasur• Khairpur• Khanbela• Khanewal• Khanpur• Khar, Bajaur Agency• Kharian• Khichiwala• Khipro• Khurrianwala• Khushab• Khuzdar• Kohat• Kot Addu• Kot Ghulam Muhammad• Kot Samaba• Kotla Arab Ali Khan• Kotli• Kunri• Lahore• Lala Musa• Larkana
• Layyah• Liaquatabad Thal• Lodhran• Loralai• Mandi Bahauddin• Manshera• Mardan• Mathanichangan Swabi• Matli• Mehar• Mehrabpur• Mian Channu• Mianwali• Mingora• Mirpur (A.K.)• Mirpurkhas• Mithi• Moro• Multan• Muridke• Muzaffarabad (A.K.)• Muzaffargarh• Nankana Sahib• Narowal• Nassarpur• Nathan Shah• Naukot• Naushero Feroze• Nawabshah• Nooriabad• Nowshera• Okara• Pabbi• Pakpattan• Panu Aqil• Parachinar• Peshawar• Pir Mahal• Pishin• Pull Kharan • Pull Manda (A.K.)• Qambar Ali Khan• Qasba Gujrat• Qazi Ahmed• Quetta• Rahim Yar Khan• Rajanpur• Rajoya Sadat• Rawalakot (A.K.)• Rawalpindi• Rohaillan Wali• Sadiqabad• Sahiwal• Sakrand • Saleh Khana
• Sambrial• Sanghar• Sarai Alamgir• Sargodha• Sawabi• Shahdadkot• Shahdadpur• Shahkas• Shahpur Chakar• Sheikhupura• Shikarpur• Sialkot• Skardu• Sowari• Sukkur• Talagang• Tando Adam• Tando Allahyar• Tando Bagho• Tando Jam• Tando Muhammad Khan• Tank• Taranada Muhammad Pannah• Tarnol• Taxila• Thari Mirwah• Tharu Shah• Thatta• Tibba Sultanpur• Timergara• Toba Tek Singh• Tootkay• Turbat• Ubauro• Uch Sharif• Ugoki• Umerkot• Usman Shah Huri• Usta Mohammad• Wah Cantt• Wazirabad• Zahir Pir Overseas Branches • Manama, Bahrain • Labuan, Malaysia • Victoria, Seychelles Representative Offices • Beijing, China • Dubai, U.A.E. • Istanbul, Turkey

Form of ProxyThe Company SecretaryBank AL Habib Limited126-C, Old Bahawalpur Road,MULTAN.
I/We___________________________________________________of ___________________________
being a member(s) of Bank AL Habib Limited and holding ______________________________________
ordinary shares, as per Register Folio No./CDC Account and Participant's I.D. No.___________________
do hereby appoint ________________________________ Folio No./CDC Account and Participant's I.D.
No. ___________________of____________________________________________________________
or failing him/her __________________________________ Folio No./CDC Account and Participant's I.D.
No. ___________________of____________________________________________________________
another member of the Bank as my/our proxy to vote for me/us and on my/our behalf at the Twenty Sixth Annual General Meeting of the Bank to be held on Wednesday, March 1, 2017 and at any adjournment thereof.
As witness my/our hand this__________________day of_________________2017.
(The signature of the shareholder should agree with the specimen signature registered with the Bank or as per CNIC / Passport in case the share(s) is / are registered in CDC account).
A member entitled to attend the Annual General Meeting is entitled to appoint a proxy to attend and vote instead of him/her. No person shall act as proxy (except for a corporation) unless he/she is entitled to be present and vote in his/her own right. CDC account holder or sub-account holder appointing a proxy should furnish attested copies of his / her own as well as the proxy’s CNIC / Passport with the proxy form. The proxy shall also produce his / her original CNIC / Passport at the time of the meeting. In case of corporate entity, the Board of Directors resolution / power of attorney with specimen signature shall be submitted along with proxy form. The instrument appointing a proxy should be signed by the member or by his/her attorney duly authorised in writing. If the member is a corporation, its common seal (if any) should be affixed to the instrument. The proxy forms, together with the power of attorney (if any), under which it is signed or a notarially certified copy thereof, shall be deposited at the Registered Office of the Bank not less than 48 hours before the time of the meeting.
Witnesses:1. Signature _____________________ 2. Signature _____________________ Name _____________________ Name _____________________ Address _____________________ Address _____________________ CNIC/Passport No. _____________________ CNIC/Passport No._____________________
REVENUESTAMPRS. 5
SIGNATURE OF MEMBER (S)