Embed Size (px)
Citation preview

Missouri Assessment Program Technical Report 2005 Supplement CTB/McGraw-Hill
Missouri Assessment Program
Technical Report 2005 Supplement
December 19, 2005
CTB/McGraw-Hill
20 Ryan Ranch Road Monterey, CA 93940

Missouri Assessment Program Technical Report 2005 Supplement CTB/McGraw-Hill
Published by CTB/McGraw-Hill, a division of the McGraw-Hill Companies, Inc., 20 Ryan Ranch Road, Monterey, California 93940-5703. Copyright © 2005 by Missouri Department of Elementary and Secondary Education. All rights reserved. No part of this publication may be reproduced or distributed in any form or by any means, or stored in a database or retrieval system, without the prior written permission of the Missouri Department of Elementary and Secondary Education.

Missouri Assessment Program Technical Report 2005 Supplement CTB/McGraw-Hill
Table of Contents Evidence for Validity........................................................................................................................................... 1
CONSTRUCT, PURPOSE, AND INTERPRETATION-OF-SCORES ........................................................................................................1 RELIABILITY/INTERNAL TEST .......................................................................................................................................................1 Internal Consistency Reliability Coefficients for MAP Operational Tests 1997-2005 .............................................................................. 2
Math Grade 4............................................................................................................................................................................................ 2 Math Grade 8............................................................................................................................................................................................ 2 Math Grade 10.......................................................................................................................................................................................... 2 Communication Arts Grade 3 ................................................................................................................................................................ 2 Communication Arts Grade 7 ................................................................................................................................................................ 3 Communication Arts Grade 11 .............................................................................................................................................................. 3
Standard Error Curves for MAP 2005 Operational Tests ............................................................................................................................ 4 Mathematics Grade 4............................................................................................................................................................................... 4 Mathematics Grade 8............................................................................................................................................................................... 5 Mathematics Grade 10............................................................................................................................................................................. 6 Communication Arts Grade 3 ................................................................................................................................................................ 7 Communication Arts Grade 7 ................................................................................................................................................................ 8 Communication Arts Grade 11 .............................................................................................................................................................. 9
TEST CONTENT DEVELOPMENT ..................................................................................................................................................10 TEST CONTENT /DESIGN ............................................................................................................................................................10 MAP 2005 Item Maps..................................................................................................................................................................................... 11
Mathematics Grade 4............................................................................................................................................................................. 11 Mathematics Grade 8............................................................................................................................................................................. 11 Mathematics Grade 10........................................................................................................................................................................... 11 Communication Arts Grade 3 .............................................................................................................................................................. 12 Communication Arts Grade 7 .............................................................................................................................................................. 12 Communication Arts Grade 11 ............................................................................................................................................................ 12 Science Grade 3 ...................................................................................................................................................................................... 13 Science Grade 7 ...................................................................................................................................................................................... 13 Science Grade 10 .................................................................................................................................................................................... 13 Social Studies Grade 4 ........................................................................................................................................................................... 14 Social Studies Grade 8 ........................................................................................................................................................................... 14 Social Studies Grade 11 ......................................................................................................................................................................... 15
MAP 2005 Content Standard Item/Point Distributions ............................................................................................................................ 16 Mathematics Grade 4............................................................................................................................................................................. 16 Mathematics Grade 8............................................................................................................................................................................. 16 Mathematics Grade 10........................................................................................................................................................................... 16 Communication Arts Grade 3 .............................................................................................................................................................. 17 Communication Arts Grade 7 .............................................................................................................................................................. 17 Communication Arts Grade 11 ............................................................................................................................................................ 17 Science Grade 3 ...................................................................................................................................................................................... 18 Science Grade 7 ...................................................................................................................................................................................... 18 Science Grade 10 .................................................................................................................................................................................... 19 Social Studies Grade 4 ........................................................................................................................................................................... 20 Social Studies Grade 8 ........................................................................................................................................................................... 20 Social Studies Grade 11 ......................................................................................................................................................................... 21
MAP 2005 Number of Items/Points Measuring Process Standards........................................................................................................ 22 Mathematics Grade 4............................................................................................................................................................................. 22 Mathematics Grade 8............................................................................................................................................................................. 22 Mathematics Grade 10........................................................................................................................................................................... 22 Communication Arts Grade 3 .............................................................................................................................................................. 23 Communication Arts Grade 7 .............................................................................................................................................................. 23 Communication Arts Grade 11 ............................................................................................................................................................ 23 Science Grade 3 ...................................................................................................................................................................................... 24 Science Grade 7 ...................................................................................................................................................................................... 24 Science Grade 10 .................................................................................................................................................................................... 24 Social Studies Grade 4 ........................................................................................................................................................................... 25

Missouri Assessment Program Technical Report 2005 Supplement CTB/McGraw-Hill
Social Studies Grade 8 ........................................................................................................................................................................... 25 Social Studies Grade 11 ......................................................................................................................................................................... 25
Test/Item Characteristics.................................................................................................................................. 26 MAP Means, standard deviations for scale/raw scores, p-values, item-total correlation.................................................................... 27
Mathematics ........................................................................................................................................................................................... 27 Communication Arts ............................................................................................................................................................................. 28 Science ..................................................................................................................................................................................................... 29 Social Studies.......................................................................................................................................................................................... 30
MAP 2005 Test/Item Characteristics ........................................................................................................................................................... 31 Mathematics ........................................................................................................................................................................................... 31 Communication Arts ............................................................................................................................................................................. 34
ACHIEVEMENT-LEVEL-SETTING .................................................................................................................................................37 Mathematics Avg. 2005 SEM......................................................................................................................................................... 37 Communication Arts Avg. 2005 SEM ........................................................................................................................................... 37
IMPACT TEST STATISTICS SUMMARY...........................................................................................................................................38 Communication Arts ............................................................................................................................................................................. 39 Mathematics ........................................................................................................................................................................................... 40 Science ..................................................................................................................................................................................................... 41 Social Studies.......................................................................................................................................................................................... 42
Appendix............................................................................................................................................................... 43 MAP 2005 INTERRATER COMPARISON .........................................................................................................................................43
Communication Arts Grade 3 .............................................................................................................................................................. 44 Communication Arts Grade 7 .............................................................................................................................................................. 47 Communication Arts Grade 11 ............................................................................................................................................................ 50 Mathematics Grade 4............................................................................................................................................................................. 53 Mathematics Grade 8............................................................................................................................................................................. 57 Mathematics Grade 10........................................................................................................................................................................... 61

Missouri Assessment Program Technical Report 2005 Supplement CTB/McGraw-Hill
1
Evidence for Validity Construct, Purpose, and Interpretation-of-scores The purpose of the MAP scores is to demonstrate student ability in mathematics, communication arts, science, and social studies in Missouri. It is intended by the developers of MAP that MAP scores be interpreted to mean that students who score more questions correct on MAP subject area tests have acquired more of the knowledge and skills taught in Missouri classrooms in those subjects. Reliability/Internal Test The degree of reliability that is required by an interpretation of a test score must be carefully considered. When the interpretation is highly leveraged by consequences to individuals or schools, it is better to narrow the scope of the construct and limit the breadth of the interpretation of a score to an area of performance that can be standardized and managed. For MAP this implies a focus on the Proficiency score used to classify students’ and schools’ performance on the Achievement Levels for each subject area. The Standards indicate that…
…reliability evidence may be reported in terms of variances or standard deviations of measurement errors, in terms of one or more coefficients, or in terms of IRT-based test information functions. (p. 27)
The MAP internal consistency reliability coefficients reported indicate that tests with constructed-response tasks can be quite reliable. These coefficients were computed on samples of students selected by the Missouri Department of Elementary and Secondary Education (DESE) from all of the students tested in each year the MAP has been operational. They are computed on the single form administered to all students in Missouri in a given year. The sample selection was guided by the attempt to attain state representation on socio-economic, racial/ethnic, and school/district size variables. Generally these samples ranged in size from 1800-4400 students and were used for most subsequent analyses.
Missouri Assessment Program Technical Report 2005 Supplement CTB/McGraw-Hill
2
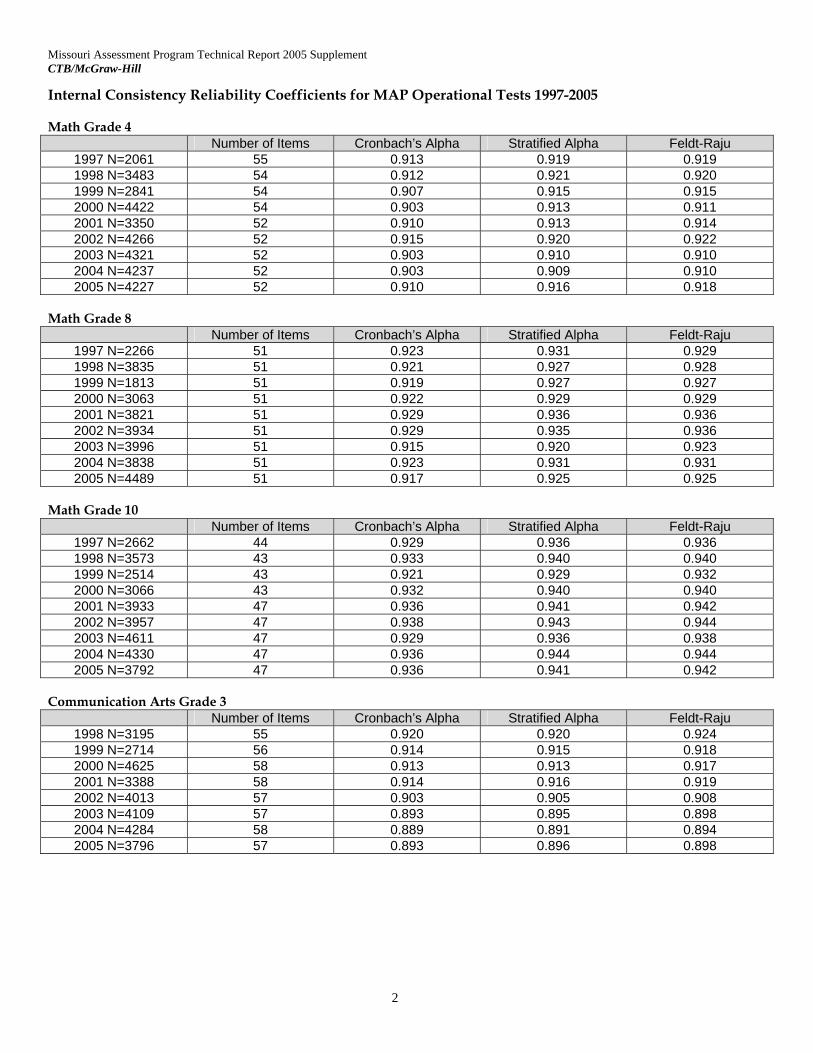
Internal Consistency Reliability Coefficients for MAP Operational Tests 1997-2005 Math Grade 4 Number of Items Cronbach’s Alpha Stratified Alpha Feldt-Raju
1997 N=2061 55 0.913 0.919 0.919 1998 N=3483 54 0.912 0.921 0.920 1999 N=2841 54 0.907 0.915 0.915 2000 N=4422 54 0.903 0.913 0.911 2001 N=3350 52 0.910 0.913 0.914 2002 N=4266 52 0.915 0.920 0.922 2003 N=4321 52 0.903 0.910 0.910 2004 N=4237 52 0.903 0.909 0.910 2005 N=4227 52 0.910 0.916 0.918
Math Grade 8 Number of Items Cronbach’s Alpha Stratified Alpha Feldt-Raju
1997 N=2266 51 0.923 0.931 0.929 1998 N=3835 51 0.921 0.927 0.928 1999 N=1813 51 0.919 0.927 0.927 2000 N=3063 51 0.922 0.929 0.929 2001 N=3821 51 0.929 0.936 0.936 2002 N=3934 51 0.929 0.935 0.936 2003 N=3996 51 0.915 0.920 0.923 2004 N=3838 51 0.923 0.931 0.931 2005 N=4489 51 0.917 0.925 0.925
Math Grade 10
Number of Items Cronbach’s Alpha Stratified Alpha Feldt-Raju 1997 N=2662 44 0.929 0.936 0.936 1998 N=3573 43 0.933 0.940 0.940 1999 N=2514 43 0.921 0.929 0.932 2000 N=3066 43 0.932 0.940 0.940 2001 N=3933 47 0.936 0.941 0.942 2002 N=3957 47 0.938 0.943 0.944 2003 N=4611 47 0.929 0.936 0.938 2004 N=4330 47 0.936 0.944 0.944 2005 N=3792 47 0.936 0.941 0.942
Communication Arts Grade 3 Number of Items Cronbach’s Alpha Stratified Alpha Feldt-Raju
1998 N=3195 55 0.920 0.920 0.924 1999 N=2714 56 0.914 0.915 0.918 2000 N=4625 58 0.913 0.913 0.917 2001 N=3388 58 0.914 0.916 0.919 2002 N=4013 57 0.903 0.905 0.908 2003 N=4109 57 0.893 0.895 0.898 2004 N=4284 58 0.889 0.891 0.894 2005 N=3796 57 0.893 0.896 0.898

Missouri Assessment Program Technical Report 2005 Supplement CTB/McGraw-Hill
3
Communication Arts Grade 7 Number of Items Cronbach’s Alpha Stratified Alpha Feldt-Raju
1998 N=4283 61 0.931 0.932 0.935 1999 N=1989 59 0.904 0.905 0.909 2000 N=2286 61 0.908 0.907 0.913 2001 N=3844 69 0.917 0.919 0.920 2002 N=4051 69 0.922 0.921 0.926 2003 N=4285 69 0.917 0.914 0.920 2004 N=4164 64 0.898 0.899 0.902 2005 N=4251 64 0.899 0.899 0.903
Communication Arts Grade 11
Number of Items Cronbach’s Alpha Stratified Alpha Feldt-Raju 1998 N=3068 63 0.934 0.939 0.939 1999 N=1860 63 0.917 0.919 0.921 2000 N=3087 63 0.919 0.917 0.924 2001 N=3338 70 0.924 0.926 0.927 2002 N=3446 71 0.929 0.931 0.933 2003 N=4134 70 0.932 0.934 0.935 2004 N=3834 64 0.922 0.923 0.924 2005 N=3296 64 0.926 0.929 0.929
The various reliability coefficients differ slightly in their assumptions. The preferred coefficient for these tests is Stratified Alpha. This coefficient is most appropriate for a mixture of binary and polytomous item types as found in MAP tests. Whereas reliability coefficients refer to a test characteristic, accuracy of measurement is a concept usually applied to individual scores. It indicates the standard deviation of observed scores to expect if an examinee were re-tested under unchanged conditions. Conditional standard deviations of observed scores can be found for each score level. The estimate of measurement error increases as the number of observation decreases. Generally there are few students with extreme scores and these score levels are not measured accurately. The estimate of measurement error also increases when there are few observations taken at the level of a student’s ability. If all the items are very difficult, or very easy for the examinees, the error of measurement will be larger than when the items’ difficulties are distributed across the levels of the students’ ability being tested. Accompanying each graph of the SEM curves for the operational tests in each subject area are values of the MAP SEM for the lowest and highest scale scores reported. Also the average SEM for the scale scores ranging from below the Progressing cut score to above the Proficient cut score is provided. This is the typical SEM most students scores would have.

Missouri Assessment Program Technical Report 2005 Supplement CTB/McGraw-Hill
4
Standard Error Curves for MAP 2005 Operational Tests Mathematics Grade 4
Mathematics Grade 4
0
20
40
60
80
100
120
422 422 505 543 564 579 592 603 613 623 633 645 657 674 701 851
0 5 10 15 20 25 30 35 40 45 50 55 60 65 70 76
Scale Score/Raw Score
Stan
dard
Err
or o
f Mea
sure
men
t
Year Average SEM Step 1 422-567
Average SEM Advanced 692-851
Average SEM 550-700 Lowest SEM
1997 22 31 11 10 1998 23 35 12 10 1999 30 40 10 9 2000 31 38 11 9 2001 32 38 11 9 2002 35 40 10 9 2003 36 35 10 8 2004 33 37 10 9 2005 32 36 10 9
Lowest Obtainable Scale Score (LOSS) is 422. Highest Obtainable Scale Score (HOSS) is 851.

Missouri Assessment Program Technical Report 2005 Supplement CTB/McGraw-Hill
5
Standard Error Curves for MAP 2005 Operational Tests (cont’d) Mathematics Grade 8
Mathematics Grade 8
0
20
40
60
80
100
120
541 541 590 626 647 663 676 687 698 708 718 730 743 760 788 915
0 5 10 15 20 25 30 35 40 45 50 55 60 65 70 75
Scale Score/Raw Score
Stan
dard
Err
or o
f Mea
sure
men
t
Year Average SEM Step 1 541-667
Average SEM Advanced 785-915
Average SEM 650-750 Lowest SEM
1997 23 29 11 10 1998 19 29 12 11 1999 20 39 9 9 2000 24 29 10 9 2001 25 34 10 9 2002 26 40 10 9 2003 28 30 10 9 2004 22 44 9 9 2005 22 37 10 9
Lowest Obtainable Scale Score (LOSS) is 541. Highest Obtainable Scale Score (HOSS) is 915.

Missouri Assessment Program Technical Report 2005 Supplement CTB/McGraw-Hill
6
Standard Error Curves for MAP 2005 Operational Tests (cont’d) Mathematics Grade 10
Mathematics Grade 10
0
20
40
60
80
100
120
140
581 581 622 657 678 695 708 720 731 742 754 767 783 804 846 979
0 5 10 15 20 25 30 35 40 45 50 55 60 65 70 73
Scale Score/Raw Score
Stan
dard
Err
or o
f Mea
sure
men
t
Year Average SEM Step 1 581-700
Average SEM Advanced 832-979
Average SEM 675-800 Lowest SEM
1997 17 32 12 12 1998 28 47 10 9 1999 30 40 11 10 2000 27 45 10 9 2001 26 42 10 9 2002 25 44 11 9 2003 27 46 10 9 2004 21 58 10 9 2005 20 50 11 9
Lowest Obtainable Scale Score (LOSS) is 581. Highest Obtainable Scale Score (HOSS) is 979.
Missouri Assessment Program Technical Report 2005 Supplement CTB/McGraw-Hill
7
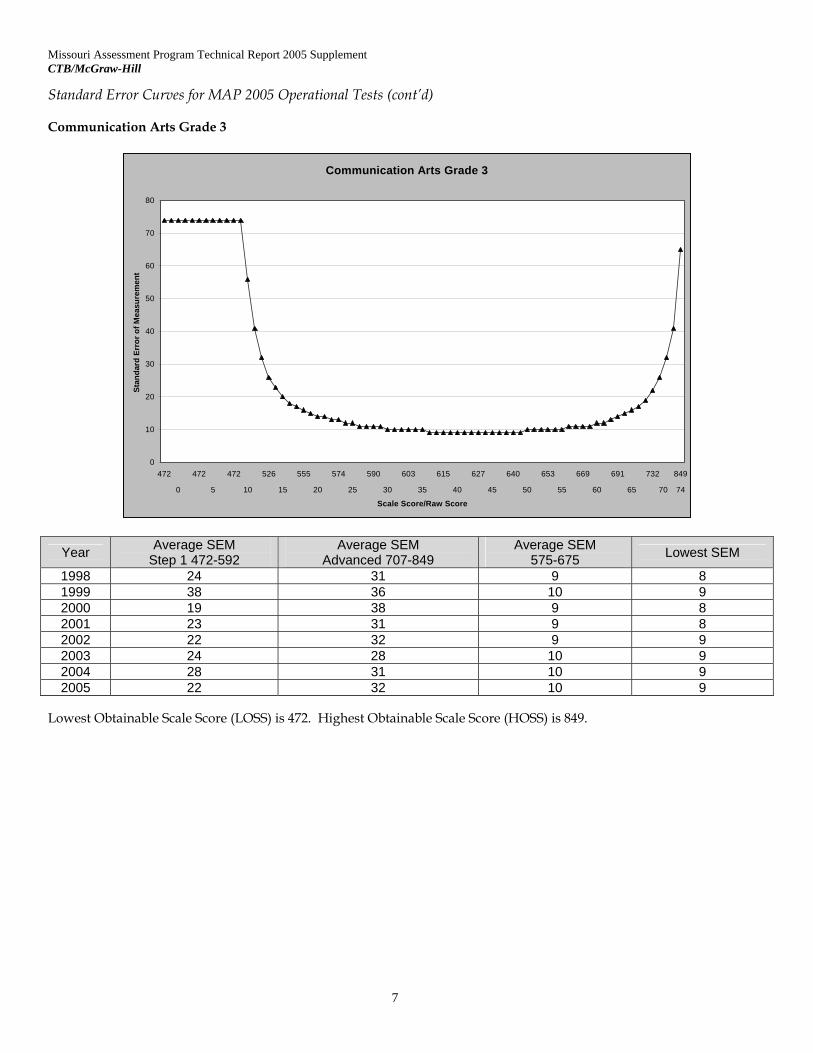
Standard Error Curves for MAP 2005 Operational Tests (cont’d) Communication Arts Grade 3
Communication Arts Grade 3
0
10
20
30
40
50
60
70
80
472 472 472 526 555 574 590 603 615 627 640 653 669 691 732 849
0 5 10 15 20 25 30 35 40 45 50 55 60 65 70 74
Scale Score/Raw Score
Stan
dard
Err
or o
f Mea
sure
men
t
Year Average SEM Step 1 472-592
Average SEM Advanced 707-849
Average SEM 575-675 Lowest SEM
1998 24 31 9 8 1999 38 36 10 9 2000 19 38 9 8 2001 23 31 9 8 2002 22 32 9 9 2003 24 28 10 9 2004 28 31 10 9 2005 22 32 10 9
Lowest Obtainable Scale Score (LOSS) is 472. Highest Obtainable Scale Score (HOSS) is 849.

Missouri Assessment Program Technical Report 2005 Supplement CTB/McGraw-Hill
8
Standard Error Curves for MAP 2005 Operational Tests (cont’d) Communication Arts Grade 7
Communication Arts Grade 7
0
10
20
30
40
50
60
70
80
90
100
528 528 528 554 590 610 625 638 650 661 672 683 695 710 727 750 900
0 5 10 15 20 25 30 35 40 45 50 55 60 65 70 75 83
Scale Score/Raw Score
Stan
dard
Err
or o
f Mea
sure
men
t
Year Average SEM Step 1 528-642
Average SEM Advanced 737-900
Average SEM 600-700 Lowest SEM
1998 20 30 10 8 1999 21 36 9 9 2000 18 22 10 8 2001 19 24 9 8 2002 17 26 9 7 2003 20 22 10 8 2004 20 27 10 9 2005 19 30 10 9
Lowest Obtainable Scale Score (LOSS) is 528. Highest Obtainable Scale Score (HOSS) is 900.

Missouri Assessment Program Technical Report 2005 Supplement CTB/McGraw-Hill
9
Standard Error Curves for MAP 2005 Operational Tests (cont’d) Communication Arts Grade 11
Communication Arts Grade 11
0
10
20
30
40
50
60
70
80
90
563 563 563 623 648 665 678 689 699 709 718 727 738 749 764 786 915
0 5 10 15 20 25 30 35 40 45 50 55 60 65 70 75 82
Scale Score/Raw Score
Stan
dard
Err
or o
f Mea
sure
men
t
Year Average SEM Step 1 563-686
Average SEM Advanced 783-915
Average SEM 650-750 Lowest SEM
1998 19 26 9 8 1999 20 27 9 9 2000 20 24 9 8 2001 18 19 8 7 2002 17 23 8 8 2003 24 22 8 7 2004 21 27 14 8 2005 20 26 8 7
Lowest Obtainable Scale Score (LOSS) is 563. Highest Obtainable Scale Score (HOSS) is 915.
The reliabilities presented in Table 1 and the standard error of measurement curves reflect repeatability and accuracy of individual scores. As the Standards point out…
Average scores of groups, when interpreted as measures of program effectiveness, involve error factors that are not identical to those that operate at the individual level. For large groups, the positive and negative measurement errors of individuals may average out almost completely in group means. However, the sampling errors associated with the random sampling of persons who are tested for purposes of program evaluation are still present. [They] can be a significant source of error in inferences about programs even if there is a high degree of precision in individual test scores. Standard errors appropriate to individual scores are not appropriate measures of the precision of group averages. A more appropriate statistic is the standard error of the observed score means. (p. 30)
Missouri Assessment Program Technical Report 2005 Supplement CTB/McGraw-Hill
10
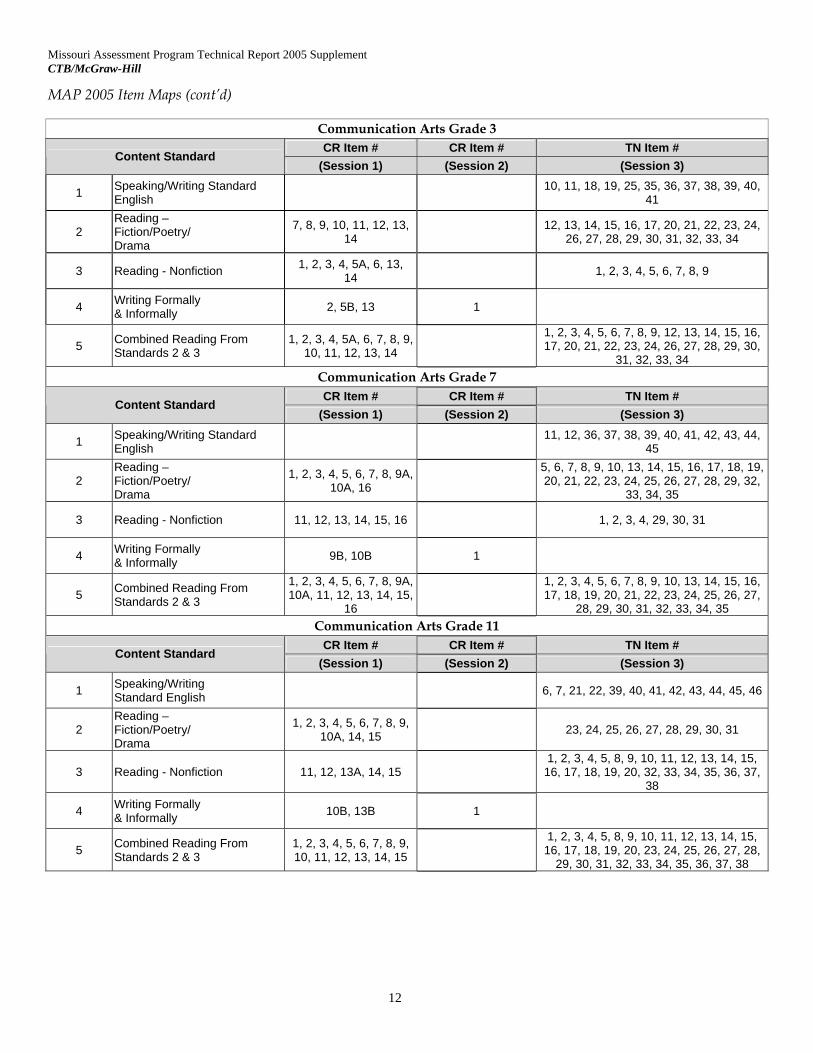
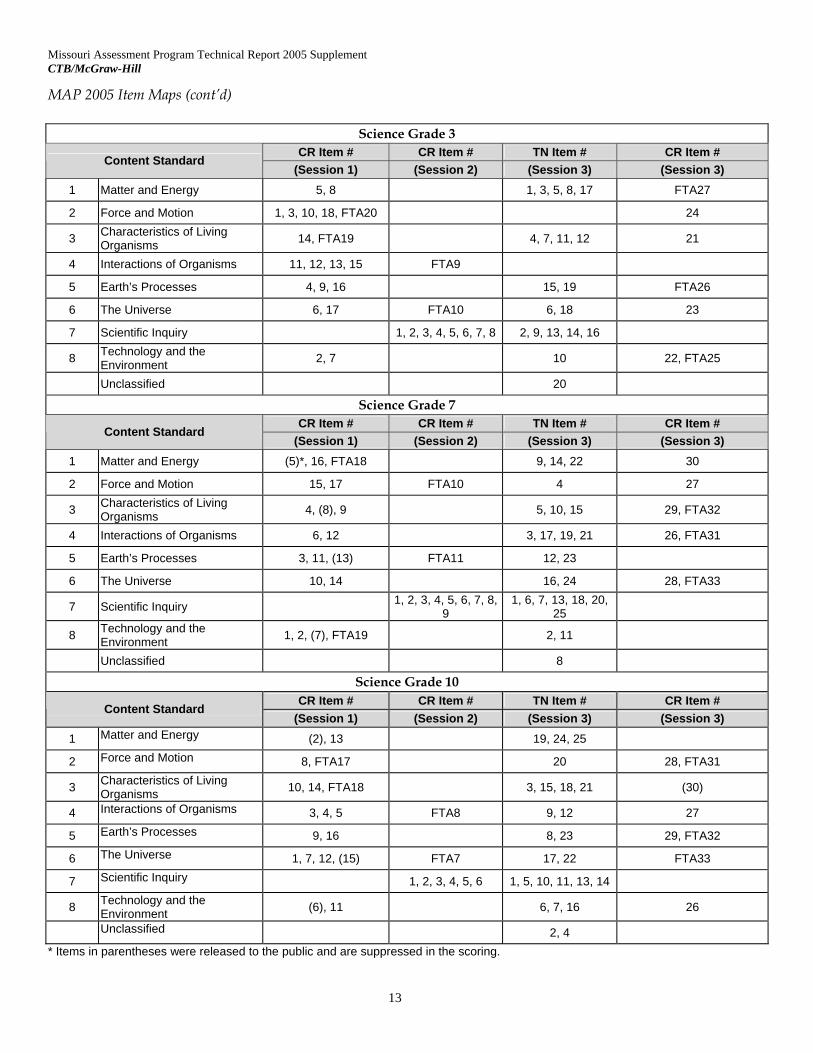
Standard errors of the School and District means for the Content Standards are reported each year on the MAP report forms. They are reported with a 95% confidence interval. This interval is used by the schools and districts when comparing themselves to the average for the whole state of Missouri. This comparison allows schools and districts to evaluate their performance diagnostically. These standard errors of the Content Standard means are not replicated in this document since they are directly available to every school and district and the state for every form on the score report documents. Test Content Development A key piece of validity evidence for a test is provided by the procedures used to develop the test’s content to the blueprint and specifications. By setting forth a description of the events that took place in a test’s development we establish credibility for the validity claims made for it. Test Content /Design Evidence of validity, based on test content, includes information about the test and item specifications. Test development involves creating a design framework from the statement of the construct to be measured. This design evolves from the tension between the constraints for the individual assessment program and the benefits sought from the examination of students. Many of the benefits sought are not scientific in nature, nor are many of the constraints—rather, they are policy considerations. The design emerges from specifications which are originally set forth and modified during the process just described above. Design elements include such things as number and types of items/tasks for each of the scores reported. Item maps for MAP show the distribution of items/tasks by Content Standards that resulted for the forms used in year 2005. Tasks are measured by constructed-response (CR) items in MAP. The item maps also show the design of test administration. The number of sessions into which the test is divided determines which items will be taken together, possibly on different test days. By providing booklet item numbers test reviewers and Technical Report readers are invited to inspect released (public) items/tasks. These item maps provide an idea of the scope of each MAP and also the degree of structural parallelness of the forms. The other key aspect of MAP tests as far as structural framework of the tests is concerned has to do with the number of points awarded for each Content and Process Standard. This design element represented a compromise between many constraints including the target weights for each Content Standard recommended by Missouri teachers, availability of items from field testing, and results of many reviews by content specialists.

Missouri Assessment Program Technical Report 2005 Supplement CTB/McGraw-Hill
11
MAP 2005 Item Maps
Mathematics Grade 4 CR Item # CR Item # TN Item #
Content Standard (Session 1) (Session 2) (Session 3)
1 Number Sense 1 1, 2, 3, 4, 5, 6, 7, 8, 9, 10, 11, 12, 17, 21, 22,
23, 25, 27
2 Geometric/Spatial Sense & Measurement 2, 5 3 16, 18, 19, 24, 26, 30,
31, 32
3 Data Analysis, Probability & Statistics 4, 10 7 13, 14, 15, 20
4 Patterns and Relationships 1, 6, 9 2, 4 28
5 Mathematical Systems, Number Theory 7, 8 6, 8 29
6 Discrete Mathematics 3 5, 9, 10
Mathematics Grade 8 CR Item # CR Item # TN Item #
Content Standard (Session 1) (Session 2) (Session 3)
1 Number Sense 1, 10 1, 2, 3, 4, 5, 6, 7, 10, 11, 15, 18, 23, 24
2 Geometric/Spatial Sense 5 4, 9 12, 13, 14, 17, 20, 25, 26, 28
3 Data Analysis, Probability 2, 7 7 8, 9, 21, 22
4 Patterns and Relationships 3, 8 2, 6 16, 19, 27, 31
5 Mathematical Systems 4, 6 5, 8 30
6 Discrete Mathematics 9 1, 3, 10 29
Mathematics Grade 10 CR Item # CR Item # TN Item #
Content Standard (Session 1) (Session 2) (Session 3)
1 Number Sense 6, 10 7 1, 2, 3, 4, 5, 10, 14, 16, 17, 19
2 Geometric/Spatial Sense 7, 11 11 11, 13, 15, 21, 22, 24, 25
3 Data Analysis, Probability 4, 8 4, 6 7, 9, 12, 18
4 Patterns and Relationships 9 1, 3, 8 6, 8
5 Mathematical Systems 2, 5 5, 9 20, 23
6 Discrete Mathematics 1, 3 2, 10
Missouri Assessment Program Technical Report 2005 Supplement CTB/McGraw-Hill
12
MAP 2005 Item Maps (cont’d)
Communication Arts Grade 3 CR Item # CR Item # TN Item #
Content Standard (Session 1) (Session 2) (Session 3)
1 Speaking/Writing Standard English 10, 11, 18, 19, 25, 35, 36, 37, 38, 39, 40,
41
2 Reading – Fiction/Poetry/ Drama
7, 8, 9, 10, 11, 12, 13, 14 12, 13, 14, 15, 16, 17, 20, 21, 22, 23, 24,
26, 27, 28, 29, 30, 31, 32, 33, 34
3 Reading - Nonfiction 1, 2, 3, 4, 5A, 6, 13, 14 1, 2, 3, 4, 5, 6, 7, 8, 9
4 Writing Formally & Informally 2, 5B, 13 1
5 Combined Reading From Standards 2 & 3
1, 2, 3, 4, 5A, 6, 7, 8, 9, 10, 11, 12, 13, 14
1, 2, 3, 4, 5, 6, 7, 8, 9, 12, 13, 14, 15, 16, 17, 20, 21, 22, 23, 24, 26, 27, 28, 29, 30,
31, 32, 33, 34 Communication Arts Grade 7 CR Item # CR Item # TN Item #
Content Standard (Session 1) (Session 2) (Session 3)
1 Speaking/Writing Standard English 11, 12, 36, 37, 38, 39, 40, 41, 42, 43, 44,
45
2 Reading – Fiction/Poetry/ Drama
1, 2, 3, 4, 5, 6, 7, 8, 9A, 10A, 16
5, 6, 7, 8, 9, 10, 13, 14, 15, 16, 17, 18, 19, 20, 21, 22, 23, 24, 25, 26, 27, 28, 29, 32,
33, 34, 35
3 Reading - Nonfiction 11, 12, 13, 14, 15, 16 1, 2, 3, 4, 29, 30, 31
4 Writing Formally & Informally 9B, 10B 1
5 Combined Reading From Standards 2 & 3
1, 2, 3, 4, 5, 6, 7, 8, 9A, 10A, 11, 12, 13, 14, 15,
16
1, 2, 3, 4, 5, 6, 7, 8, 9, 10, 13, 14, 15, 16, 17, 18, 19, 20, 21, 22, 23, 24, 25, 26, 27,
28, 29, 30, 31, 32, 33, 34, 35 Communication Arts Grade 11
CR Item # CR Item # TN Item # Content Standard
(Session 1) (Session 2) (Session 3)
1 Speaking/Writing Standard English 6, 7, 21, 22, 39, 40, 41, 42, 43, 44, 45, 46
2 Reading – Fiction/Poetry/ Drama
1, 2, 3, 4, 5, 6, 7, 8, 9, 10A, 14, 15 23, 24, 25, 26, 27, 28, 29, 30, 31
3 Reading - Nonfiction 11, 12, 13A, 14, 15 1, 2, 3, 4, 5, 8, 9, 10, 11, 12, 13, 14, 15,
16, 17, 18, 19, 20, 32, 33, 34, 35, 36, 37, 38
4 Writing Formally & Informally 10B, 13B 1
5 Combined Reading From Standards 2 & 3
1, 2, 3, 4, 5, 6, 7, 8, 9, 10, 11, 12, 13, 14, 15
1, 2, 3, 4, 5, 8, 9, 10, 11, 12, 13, 14, 15, 16, 17, 18, 19, 20, 23, 24, 25, 26, 27, 28,
29, 30, 31, 32, 33, 34, 35, 36, 37, 38
Missouri Assessment Program Technical Report 2005 Supplement CTB/McGraw-Hill
13
MAP 2005 Item Maps (cont’d)
Science Grade 3 CR Item # CR Item # TN Item # CR Item #
Content Standard (Session 1) (Session 2) (Session 3) (Session 3)
1 Matter and Energy 5, 8 1, 3, 5, 8, 17 FTA27
2 Force and Motion 1, 3, 10, 18, FTA20 24
3 Characteristics of Living Organisms 14, FTA19 4, 7, 11, 12 21
4 Interactions of Organisms 11, 12, 13, 15 FTA9
5 Earth’s Processes 4, 9, 16 15, 19 FTA26
6 The Universe 6, 17 FTA10 6, 18 23
7 Scientific Inquiry 1, 2, 3, 4, 5, 6, 7, 8 2, 9, 13, 14, 16
8 Technology and the Environment 2, 7 10 22, FTA25
Unclassified 20
Science Grade 7 CR Item # CR Item # TN Item # CR Item #
Content Standard (Session 1) (Session 2) (Session 3) (Session 3)
1 Matter and Energy (5)*, 16, FTA18 9, 14, 22 30
2 Force and Motion 15, 17 FTA10 4 27
3 Characteristics of Living Organisms 4, (8), 9 5, 10, 15 29, FTA32
4 Interactions of Organisms 6, 12 3, 17, 19, 21 26, FTA31
5 Earth’s Processes 3, 11, (13) FTA11 12, 23
6 The Universe 10, 14 16, 24 28, FTA33
7 Scientific Inquiry 1, 2, 3, 4, 5, 6, 7, 8, 9
1, 6, 7, 13, 18, 20, 25
8 Technology and the Environment 1, 2, (7), FTA19 2, 11
Unclassified 8
Science Grade 10 CR Item # CR Item # TN Item # CR Item #
Content Standard (Session 1) (Session 2) (Session 3) (Session 3)
1 Matter and Energy (2), 13 19, 24, 25
2 Force and Motion 8, FTA17 20 28, FTA31
3 Characteristics of Living Organisms 10, 14, FTA18 3, 15, 18, 21 (30)
4 Interactions of Organisms 3, 4, 5 FTA8 9, 12 27
5 Earth’s Processes 9, 16 8, 23 29, FTA32
6 The Universe 1, 7, 12, (15) FTA7 17, 22 FTA33
7 Scientific Inquiry 1, 2, 3, 4, 5, 6 1, 5, 10, 11, 13, 14
8 Technology and the Environment (6), 11 6, 7, 16 26
Unclassified 2, 4 * Items in parentheses were released to the public and are suppressed in the scoring.

Missouri Assessment Program Technical Report 2005 Supplement CTB/McGraw-Hill
14
MAP 2005 Item Maps (cont’d)
Social Studies Grade 4 CR Item # CR Item # CR Item # MC Item # MC Item # MC Item # TN Item #
Content Standard (Session 1) (Session 2) (Session 3) (Session 1) (Session 2) (Session 3) (Session 3)
1 Expression of Democratic Principles
20, 21, 27, FTA31
6, 17, 22, FTA31
FTA: 32, 33, 35
19, 23, FTA28, FTA29
5, 14, 15, 16, FTA28
FTA: 30, 31, 48
2A Continuity and Change/Missouri 7, 8 10, 11 FTA: 43, 44,
49 1, 2, 3, 5, 6, 16, 17, 18
8, 9, 18, 24, 25, 26
FTA: 26, 27, 28, 41, 42, 45, 46, 47
23, 25
2B Continuity and Change/World
3 Governance Systems 15, FTA31 FTA30 9, 10, 14, FTA28 FTA28 FTA48 9, 21
4 Economic Concepts and Principles 13 13 11, 12, 22 21, FTA29
2, 3, 4, 10, 12, 15, 16,
17
5 Geographical Study and Analysis 24, 25 19 FTA40 1, 2, 3, 4, 5 1, 2, 3, 4, 18 FTA: 38, 39
14, 15, 18, 19, 20, 22,
23
6 Relationships to Institutions and Culture
8, 24, 25, FTA32 13, 22, 23 FTA: 34, 36,
49 9, 10, FTA30 7, 20, FTA27 FTA: 37, 47 5, 6, 11
7 Tools of Social Science Inquiry FTA: 29, 36 14, 26 7, 12, 20
1, 4, 5, 6, 7, 8, 12, 13, 14,
16
Unclassified 24
Social Studies Grade 8 CR Item # CR Item # CR Item # MC Item # MC Item # MC Item # TN Item #
Content Standard (Session 1) (Session 2) (Session 3) (Session 1) (Session 2) (Session 3) (Session 3)
1 Expression of Democratic Principles FTA25 5, 17 FTA: 28, 37 4, 5, FTA22,
FTA23 FTA: 27, 34 12, 13, 14, 21
2A Continuity and Change/Missouri 10, FTA24
12, 13, 19, FTA25, FTA26
8, 9, 14, 15 11, 18,
FTA:22, 23, 24
8, 10, 19, 20, 21, 22, 23
2B Continuity and Change/World (3)*, (18) FTA: 32, 38,
45 (1), (2), (17) 1, 2, 3, 8, 9, 10
FTA: 30, 31, 42, 43, 46
3 Governance Systems 7, (18), FTA25 5, 17 FTA: 28, 29,
38, 44, 45 4, 5, 6, FTA26 4, 15, 16 FTA: 26, 27,
35, 36
4 Economic Concepts and Principles 12, 13, 20 20 FTA: 33, 40 11 6, 7 FTA: 31, 47 15, 16, 17,
24, 25
5 Geographical Study and Analysis 16, 21 14, 20, 21 FTA: 33, 40,
41 15, 19 9, 10 FTA: 39, 48 1, 2, 3, 6, 7, 9
6 Relationships to Institutions and Culture 19 FTA: 44 (17) 1, 2, 3
7 Tools of Social Science Inquiry FTA26 4, 5, 9, 11,
18, 19, 20
* Items in parentheses were released to the public and are suppressed in the scoring.

Missouri Assessment Program Technical Report 2005 Supplement CTB/McGraw-Hill
15
MAP 2005 Item Maps (cont’d)
Social Studies Grade 11 CR Item # CR Item # CR Item # MC Item # MC Item # MC Item # TN Item #
Content Standard (Session 1) (Session 2) (Session 3) (Session 1) (Session 2) (Session 3) (Session 3)
1 Expression of Democratic Principles 9, 23 9 FTA: 28 7, 8, 16, 17,
18, 22 8, FTA24 FTA: 26, 27, 38, 39, 41,
42 3
2A Continuity and Change/Missouri 14, 15 FTA: 27, 28 FTA: 36, 37 10, 21 12, FTA: 24,
25, 26 FTA: 34 6, 12, 13, 17, 18, 19, 21,
22, 23
2B Continuity and Change/World 6 (7)*, 13 5, 11
1, 2, 3, 4, (5), (6), 11,
12 FTA: 35 11, 25
3 Governance Systems 23 9, 10, 19 FTA: 28, 29, 40 12, 13 16, 17, 18 FTA: 30 14, 15, 20
4 Economic Concepts and Principles 20 (21) FTA: 47, 48 19 14, (20), 23 FTA: 43, 44,
45, 46 7, 8, 16, 22,
24
5 Geographical Study and Analysis 14, 27, 28 15 FTA: 32, 33
1, 2, 3, 4, FTA: 24, 25,
26 22, 23 FTA: 31 1, 2, 9, 10
6 Relationships to Institutions and Culture 15 15 FTA: 21 4, 5
7 Tools of Social Science Inquiry FTA: 1,2 3, 4, 22 FTA: 41, 42 2, 7, 8, 19
* Items in parentheses were released to the public and are suppressed in the scoring.

Missouri Assessment Program Technical Report 2005 Supplement CTB/McGraw-Hill
16
MAP 2005 Content Standard Item/Point Distributions
Mathematics Grade 4
Content Standard TN Items
CR/PE Items
Total Items
TN Points
CR/PE Points
Total Points
% of Total
Points 1 Number Sense 18 1 19 18 4 22 29%
2 Geometry/Spatial Sense 8 3 11 8 6 14 18%
3 Data Analysis, Probability 4 3 7 4 8 12 16%
4 Patterns & Relationships 1 5 6 1 10 11 14%
5 Mathematical System 1 4 5 1 8 9 12%
6 Discrete Mathematics 0 4 4 0 8 8 11%
Total 32 20 52 32 44 76 100%
Mathematics Grade 8
Content Standard TN Items
CR/PE Items
Total Items
TN Points
CR/PE Points
Total Points
% of Total
Points
1 Number Sense 13 2 15 13 6 19 25%
2 Geometry/Spatial Sense 8 3 11 8 6 14 19%
3 Data Analysis, Probability 4 3 7 4 6 10 13%
4 Patterns & Relationships 4 4 8 4 8 12 16%
5 Mathematical System 1 4 5 1 8 9 12%
6 Discrete Mathematics 1 4 5 1 10 11 15%
Total 31 20 51 31 44 75 100%
Mathematics Grade 10
Content Standard TN Items
CR/PE Items
Total Items
TN Points
CR/PE Points
Total Points
% of Total
Points
1 Number Sense 10 3 13 10 6 16 22%
2 Geometry/Spatial Sense 7 3 10 7 8 15 21%
3 Data Analysis, Probability 4 4 8 4 8 12 16%
4 Patterns & Relationships 2 4 6 2 10 12 16%
5 Mathematical System 2 4 6 2 8 10 14%
6 Discrete Mathematics 0 4 4 0 8 8 11%
Total 25 22 47 25 48 73 100%

Missouri Assessment Program Technical Report 2005 Supplement CTB/McGraw-Hill
17
MAP 2005 Content Standard Item/Point Distributions (cont’d) Communication Arts Grade 3
Content Standard TN Items
CR/PE Items
Total Items
TN Points
CR/PE Points
Total Points
% of Total
Points 1 Speaking/Writing Standard English 12 0 12 12 0 12 16%
2 Reading – Fiction/Poetry/Drama 20 8 28 20 16 36 49%
3 Reading Nonfiction 9 8 17 9 16 25 34%
4 Writing Formally &Informally 0 4 4 0 9 9 12%
5 Combined Reading* 29 14 43 29 28 57 77%
Total** 41 15 56 41 33 74 100%
Communication Arts Grade 7
Content Standard TN items
CR/PE Items
Total Items
TN Points
CR/PE Points
Total Points
% of Total
Points 1 Speaking/Writing Standard English 12 0 12 12 0 12 14%
2 Reading – Fiction/Poetry/Drama 27 11 38 27 22 49 59%
3 Reading Nonfiction 7 6 13 7 12 19 23%
4 Writing Formally & Informally 0 3 3 0 6 6 7%
5 Combined Reading* 33 16 49 33 32 65 78%
Total** 45 17 62 45 38 83 100%
Communication Arts Grade 11
Content Standard TN items
CR/PE Items
Total Items
TN Points
CR/PE Points
Total Points
% of Total
Points 1 Speaking/Writing Standard English 12 0 12 12 0 12 15%
2 Reading – Fiction/Poetry/Drama 9 12 21 9 24 33 40%
3 Reading Nonfiction 25 5 30 25 10 35 43%
4 Writing Formally & Informally 0 3 3 0 6 6 7%
5 Combined Reading* 34 15 49 34 30 64 78%
Total** 46 16 62 46 36 82 100% * Combined reading includes all items measuring Standard 2 and 3 and is not included in the totals. ** The total of total items reflects the actual number of items in each test as items correlating to more than one content standard are only counted once in the totals.

Missouri Assessment Program Technical Report 2005 Supplement CTB/McGraw-Hill
18
MAP 2005 Content Standard Item/Point Distributions (cont’d) Science Grade 3
Content Standard TN Items
CR/PE Items
Total Items
TN Points
CR/PE Points
Total Points
% of Total
Points 1 Matter and Energy 5 2 7 5 3 8 11%
2 Force and Motion 0 5 5 0 8 8 11%
3 Characteristics of Living Organisms 4 2 6 4 4 8 11%
4 Interactions of Organisms 0 4 4 0 7 7 9%
5 Earth’s Processes 2 3 5 2 6 8 11%
6 The Universe 2 3 5 2 5 7 9%
7 Scientific Inquiry 5 8 13 5 14 19 26%
8 Technology and the Environment 1 3 4 1 7 8 11%
Unclassified 1 0 1 1 0 1 1%
Total 20 30 50 20 54 74 100%
Science Grade 7
Content Standard TN Items
CR/PE Items
Total Items
TN Points
CR/PE Points
Total Points
% of Total
Points 1 Matter and Energy 3 2* 5 3 3 6 8%
2 Force and Motion 1 3 4 1 7 8 11%
3 Characteristics of Living Organisms 3 3* 6 3 4 7 9%
4 Interactions of Organisms 4 3 7 4 6 10 14%
5 Earth’s Processes 2 2* 4 2 4 6 8%
6 The Universe 2 3 5 2 5 7 9%
7 Scientific Inquiry 7 9 16 7 16 23 31%
8 Technology and the Environment 2 2* 4 2 4 6 8%
Unclassified 1 0 1 1 0 1 1%
Total 25 27 52 25 49 74 100% * Excludes suppressed (released) items.

Missouri Assessment Program Technical Report 2005 Supplement CTB/McGraw-Hill
19
MAP 2005 Content Standard Item/Point Distributions (cont’d) Science Grade 10
Content Standard TN Items
CR/PE Items
Total Items
TN Points
CR/PE Points
Total Points
% of Total
Points 1 Matter and Energy 3 1* 4 3 2 5 7%
2 Force and Motion 1 2 3 1 5 6 9%
3 Characteristics of Living Organisms 4 2* 6 4 4 8 11%
4 Interactions of Organisms 2 4 6 2 5 7 10%
5 Earth’s Processes 2 3 5 2 6 8 11%
6 The Universe 2 3* 5 2 6 8 11%
7 Scientific Inquiry 6 6 12 6 14 20 29%
8 Technology and the Environment 3 2* 5 3 3 6 9%
9 Unclassified 2 0 2 2 0 2 3%
Total 25 23 48 25 45 70 100% * Excludes suppressed (released) items.

Missouri Assessment Program Technical Report 2005 Supplement CTB/McGraw-Hill
20
MAP 2005 Content Standard Item/Point Distributions (cont’d) Social Studies Grade 4
Content Standard TN Items
MC Items
CR/PE Items
Total Items
TN Points
MC Points
CR/PE Points
Total Points
% of Total
Points
1 Expression of Democratic Principles 0 6 6 12 0 6 12 18 19%
2A Continuity and Change/Missouri and U.S. 2 14 4 20 2 14 8 24 25%
3 Governance Systems 2 3 1 6 2 3 2 7 7%
4 Economic Concepts & Principles 8 4 2 14 8 4 4 16 17%
5 Geographical Study and Analysis 7 10 3 20 7 10 6 23 24%
6 Relationships to Institutions and Culture 3 4 6 13 3 4 12 19 20%
7 Tools of Social Science Inquiry 10 5 0 15 10 5 0 15 16%
Unclassified 1 0 0 1 1 0 0 1 1%
Total** 25 36 17 78 25 36 34 95 100%
Social Studies Grade 8
Content Standard TN Items
MC Items
CR/PE Items
Total Items
TN Points
MC Points
CR/PE Points
Total Points
% of Total
Points
1 Expression of Democratic Principles 4 2 2 8 4 2 4 10 13%
2A Continuity and Change/Missouri 7 6 4 17 7 6 8 21 27%
2B Continuity and Change/World 0 6* 0* 6 0 6 0 6 8%
3 Governance Systems 0 6 3* 9 0 6 6 12 16%
4 Economic Concepts & Principles 5 3 4 12 5 3 8 16 21%
5 Geographical Study and Analysis 6 4 5 15 6 4 10 20 26%
6 Relationships to Institutions and Culture 0 3* 1 4 0 3 2 5 6%
7 Tools of Social Science Inquiry 7 0 0 7 7 0 0 7 9%
Total** 25 22 15 62 25 22 30 77 100% * Excludes suppressed (released) items. ** The total of total items reflects the actual number of items in each test as items correlating to more than one content standard are only counted once in the totals.

Missouri Assessment Program Technical Report 2005 Supplement CTB/McGraw-Hill
21
MAP 2005 Content Standard Item/Point Distributions (cont’d) Social Studies Grade 11
Content Standard TN Items
MC Items
CR/PE Items
Total Items
TN Points
MC Points
CR/PE Points
Total Points
% of Total
Points
1 Expression of Democratic Principles 1 7 3 11 1 7 5 13 17%
2A Continuity and Change/Missouri 0 3 2 5 0 3 4 7 9%
2B Continuity and Change/World 2 8 2* 12 2 8 4 14 19%
3 Governance Systems 3 5 4 12 3 5 7 15 20%
4 Economic Concepts & Principles 5 3 1* 9 5 3 1 9 12%
5 Geographical Study and Analysis 4 6 2 12 4 6 4 14 19%
6 Relationships to Institutions and Culture 2 1 1 4 2 1 2 5 7%
7 Tools of Social Science Inquiry 4 5 1 10 4 5 2 11 15%
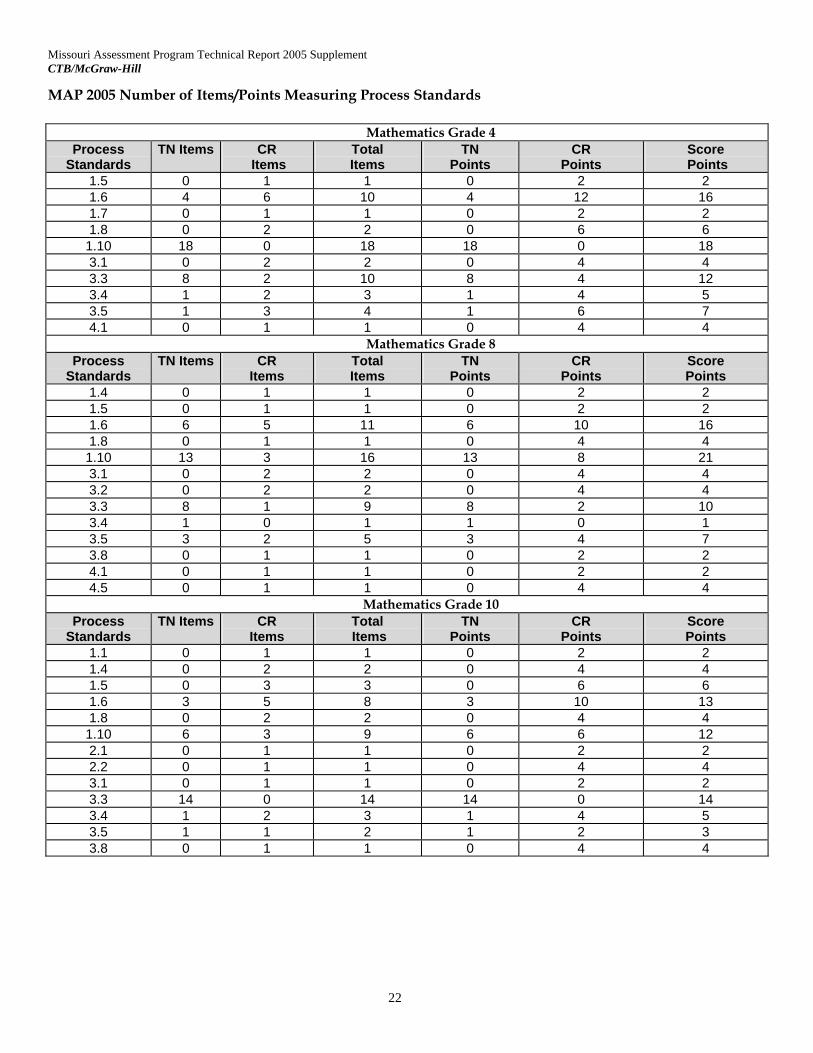
Total** 25 30 11 66 25 30 20 75 100% * Excludes suppressed (released) items. ** The total of total items reflects the actual number of items in each test as items correlating to more than one content standard are only counted once in the total. Test content evidence of validity is provided for MAP with the specification of each of the Process Standards that are influential in acquiring the skills tested in the items/tasks used in each of the MAP tests. If teachers teach by the Process Standards as intended by the developers of the Curriculum Frameworks then student performance should improve on those items that were identified as implicitly tapping these habits of mind. The following charts provide the distribution of items and points by Process Standards deemed addressable using MAP paper-and-pencil items.
Missouri Assessment Program Technical Report 2005 Supplement CTB/McGraw-Hill
22
MAP 2005 Number of Items/Points Measuring Process Standards
Mathematics Grade 4 Process
Standards TN Items CR
Items Total Items
TN Points
CR Points
Score Points
1.5 0 1 1 0 2 2 1.6 4 6 10 4 12 16 1.7 0 1 1 0 2 2 1.8 0 2 2 0 6 6 1.10 18 0 18 18 0 18 3.1 0 2 2 0 4 4 3.3 8 2 10 8 4 12 3.4 1 2 3 1 4 5 3.5 1 3 4 1 6 7 4.1 0 1 1 0 4 4
Mathematics Grade 8 Process
Standards TN Items CR
Items Total Items
TN Points
CR Points
Score Points
1.4 0 1 1 0 2 2 1.5 0 1 1 0 2 2 1.6 6 5 11 6 10 16 1.8 0 1 1 0 4 4 1.10 13 3 16 13 8 21 3.1 0 2 2 0 4 4 3.2 0 2 2 0 4 4 3.3 8 1 9 8 2 10 3.4 1 0 1 1 0 1 3.5 3 2 5 3 4 7 3.8 0 1 1 0 2 2 4.1 0 1 1 0 2 2 4.5 0 1 1 0 4 4
Mathematics Grade 10 Process
Standards TN Items CR
Items Total Items
TN Points
CR Points
Score Points
1.1 0 1 1 0 2 2 1.4 0 2 2 0 4 4 1.5 0 3 3 0 6 6 1.6 3 5 8 3 10 13 1.8 0 2 2 0 4 4 1.10 6 3 9 6 6 12 2.1 0 1 1 0 2 2 2.2 0 1 1 0 4 4 3.1 0 1 1 0 2 2 3.3 14 0 14 14 0 14 3.4 1 2 3 1 4 5 3.5 1 1 2 1 2 3 3.8 0 1 1 0 4 4

Missouri Assessment Program Technical Report 2005 Supplement CTB/McGraw-Hill
23
MAP 2005 Number of Items/Points Measuring Process Standards (cont’d)
Communication Arts Grade 3 Process
Standards TN Items CR
Items Total Items
TN Points
CR Points
Score Points
1.1 0 1 1 0 2 2 1.5 13 0 13 13 0 13 1.6 7 7 14 7 14 21 1.8 0 2 2 0 4 4 2.1 0 2 2 0 5 5 2.2 12 0 12 12 0 12 3.1 0 2 2 0 4 4 3.4 0 1 1 0 2 2 3.5 9 1 10 9 2 11 3.7 0 1 1 0 2 2 3.8 0 1 1 0 2 2
Communication Arts Grade 7 Process
Standards TN Items CR
Items Total Items
TN Points
CR Points
Score Points
1.1 0 2 2 0 4 4 1.5 6 0 6 6 0 6 1.6 11 3 14 11 6 17 1.8 0 1 1 0 1 1 2.1 0 2 2 0 5 5 2.2 12 0 12 12 0 12 2.4 3 1 4 3 2 5 3.5 13 9 22 13 18 31 3.6 0 1 1 0 2 2
Communication Arts Grade 11 Process
Standards TN Items CR
Items Total Items
TN Points
CR Points
Score Points
1.5 7 0 7 7 0 7 1.6 15 5 20 15 10 25 1.8 0 1 1 0 1 1 2.1 0 2 2 0 5 5 2.2 12 0 12 12 0 12 2.4 1 1 2 1 2 3 3.1 0 3 3 0 6 6 3.5 11 6 17 11 12 23

Missouri Assessment Program Technical Report 2005 Supplement CTB/McGraw-Hill
24
MAP 2005 Number of Items/Points Measuring Process Standards (cont’d)
Science Grade 3 Process
Standards TN Items CR
Items Total Items
TN Points
CR Points
Score Points
1.1 1 1 2 1 1 2 1.3 0 2 2 0 3 3 1.5 2 1 3 2 2 4 1.6 1 3 4 1 5 6 1.8 0 4 4 0 8 8 1.10 13 12 25 13 20 33 2.1 0 2 2 0 4 4 3.5 2 3 5 2 6 8 3.8 0 2 2 0 5 5 4.7 1 0 1 1 0 1
Science Grade 7 Process
Standards TN Items CR
Items Total Items
TN Points
CR Points
Score Points
1.1 0 1 1 0 1 1 1.3 2 4 6 2 7 9 1.5 2 3 5 2 6 8 1.6 0 3 3 0 6 6 1.8 1 1 2 1 4 5 1.9 0 1 1 0 2 2 1.10 13 10 23 13 15 28 3.1 0 1 1 0 2 2 3.2 0 1 1 0 4 4 3.5 6 2 8 6 4 10 3.6 0 1 1 0 2 2 4.7 1 0 1 1 0 1
Science Grade 10 Process
Standards TN Items CR
Items Total Items
TN Points
CR Points
Score Points
1.5 3 2 5 3 5 8 1.6 6 7 13 6 12 18 1.7 0 1 1 0 1 1 1.8 0 2 2 0 7 7 1.10 5 8 13 5 14 19 2.4 1 0 1 1 0 1 3.1 1 0 1 1 0 1 3.4 2 0 2 2 0 2 3.5 4 2 6 4 3 7 3.6 0 1 1 0 3 3 4.1 1 0 1 1 0 1 4.8 2 0 2 2 0 2

Missouri Assessment Program Technical Report 2005 Supplement CTB/McGraw-Hill
25
MAP 2005 Number of Items/Points Measuring Process Standards (cont’d)
Social Studies Grade 4 Process
Standards TN Items MC
Items CR
Items Total Items TN Points MC Points CR Points Total Points
1.5 17 14 2 33 17 14 4 35 1.6 8 5 6 19 8 5 12 25 1.9 1 0 1 2 1 0 2 3 1.10 12 27 7 46 12 27 14 53 3.1 0 2 2 4 0 2 4 6 3.5 0 1 2 3 0 1 4 5 3.6 0 1 2 3 0 1 4 5 3.7 2 0 0 2 2 0 0 2 3.8 0 0 1 1 0 0 2 2 4.1 0 1 6 7 0 1 12 13 4.2 0 1 5 6 0 1 10 11
Social Studies Grade 8 Process
Standards TN Items MC Items CR
Items Total Items TN Points MC Points CR Points Total Points
1.5 9 3 0 12 9 3 0 12 1.6 10 7 8 25 10 7 16 33 1.7 1 0 0 1 1 0 0 1 1.9 2 3 0 5 2 3 0 5 1.10 15 14 2 31 15 14 4 33 3.1 0 1 3 4 0 1 6 7 3.2 0 0 2 2 0 0 4 4 3.5 2 2 1 5 2 2 2 6 3.6 1 0 1 2 1 0 2 3 3.8 0 0 1 1 0 0 2 2 4.1 2 0 2 4 2 0 4 6 4.2 0 0 1 1 0 0 2 2
Social Studies Grade 11 Process
Standards TN Items MC Items CR Items Total Items TN Points MC Points CR
Points Total
Points 1.5 7 15 2 24 7 15 3 25 1.6 12 13 4 29 12 13 7 32 1.9 0 1 1 2 0 1 2 3 1.10 18 16 4 38 18 16 7 41 3.1 0 0 2 2 0 0 4 4 3.5 2 6 0 8 2 6 0 8 3.6 0 0 3 3 0 0 5 5 3.7 0 0 1 1 0 0 2 2 4.1 0 0 3 3 0 0 5 5 4.2 0 0 1 1 0 0 2 2

Missouri Assessment Program Technical Report 2005 Supplement CTB/McGraw-Hill
26
Test/Item Characteristics Evidence is presented for each of the forms of each of the subject area operational MAP tests on the performance of Missouri students in terms of scale scores means and standard deviations. Also, corresponding raw score means and standard deviations are presented, along with average proportion correct scores for the multiple-choice and constructed-response items/tasks. These basic statistics are often useful for those who are interested in analyzing skill acquisition. A typical pattern that emerges from this data is that multiple-choice items are easier, and less informative, than the more mentally demanding multi-step open-ended tasks. This is consistent with expectations based on experience with the two types of items. At the same time, multiple-choice items require less time to take and offer breadth of coverage of content. The item-pattern scoring procedure produces maximum-likelihood trait estimates (scale scores) based on patterns of item responses, as described by Lord (1974; 1980, pp. 179-181). The likelihood equation can have multiple maxima; a scoring algorithm was developed (Yen, Burket, and Sykes, 1988) that found the scale score at the global maximum in the likelihood function. This item-pattern scoring algorithm was used to obtain scale scores for normative distributions and is used as CTB ‘s default scoring option.

Missouri Assessment Program Technical Report 2005 Supplement CTB/McGraw-Hill
27
MAP Means, standard deviations for scale/raw scores, p-values, item-total correlation
Mathematics
Mean Scale Score (SD) Mean Raw Score (SD) Mean P-Value (SD) Mean Item-Total
Correlation (SD) 1997
Grade 4 634.7 (44.57) 51.94 (12.88) 0.69 (0.19) 0.44 (0.12) Grade 8 693.4 (45.50) 35.20 (14.67) 0.53 (0.22) 0.47 (0.09)
Grade 10 721.7 (53.65) 31.22 (15.53) 0.48 (0.19) 0.52 (0.09) 1998
Grade 4 640.4 (49.87) 53.38 (13.42) 0.72 (0.16) 0.45 (0.10) Grade 8 694.0 (48.14) 37.46 (15.27) 0.52 (0.20) 0.43 (0.09)
Grade 10 715.9 (51.81) 29.37 (15.87) 0.42 (0.18) 0.52 (0.12) 1999
Grade 4 638.2 (38.90) 54.71 (12.39) 0.73 (0.17) 0.46 (0.11) Grade 8 696.2 (37.05) 40.94 (14.77) 0.57 (0.19) 0.45 (0.11)
Grade 10 724.3 (49.59) 35.35 (15.74) 0.50 (0.18) 0.49 (0.11) 2000
Grade 4 640.2 (39.91) 53.93 (12.55) 0.74 (0.16) 0.42 (0.10) Grade 8 705.0 (42.02) 41.07 (15.23) 0.59 (0.20) 0.46 (0.11)
Grade 10 726.0 (47.79) 34.33 (16.29) 0.53 (0.20) 0.52 (0.11) 2001
Grade 4 641.6 (37.7) 54.06 (12.30) 0.74 (0.15) 0.43 (0.09) Grade 8 705.3 (43.5) 41.20 (15.55) 0.59 (0.19) 0.47 (0.11)
Grade 10 724.7 (46.7) 34.47 (15.53) 0.51 (0.19) 0.50 (0.12) 2002
Grade 4 638.9 (39.1) 50.96 (13.56) 0.70 (0.19) 0.45 (0.09) Grade 8 693.4 (43.7) 37.59 (15.98) 0.54 (0.19) 0.48 (0.11)
Grade 10 731.5 (48.2) 37.77 (16.26) 0.56 (0.19) 0.51 (0.11) 2003
Grade 4 642.3 (36.6) 53.11 (13.24) 0.73 (0.15) 0.43 (0.11) Grade 8 703.2 (39.5) 40.20 (14.13) 0.57 (0.21) 0.48 (0.11)
Grade 10 734.7 (46.1) 37.48 (15.81) 0.53 (0.22) 0.51 (0.11) 2004
Grade 4 645.2 (36.8) 53.12 (13.06) 0.73 (0.15) 0.42 (0.11) Grade 8 703.5 (39.5) 43.08 (16.01) 0.60 (0.19) 0.46 (0.12)
Grade 10 736.7 (49.5) 41.10 (16.9) 0.60 (0.19) 0.52 (0.11) 2005
Grade 4 645.7 (35.6) 53.36 (12.90) 0.74 (0.16) 0.42 (0.12) Grade 8 704.1 (40.9) 43.17 (15.44) 0.61 (0.19) 0.45 (0.12)
Grade 10 736.6 (50.8) 42.20 (16.56) 0.62 (0.17) 0.51 (0.11)

Missouri Assessment Program Technical Report 2005 Supplement CTB/McGraw-Hill
28
Means, standard deviations for scale/raw scores, p-values, item-total correlation (cont’d)
Communication Arts Mean Scale Score (SD) Mean Raw Score
(SD) Mean P-Value (SD) Mean Item-Total
Correlation (SD) 1998
Grade 3 633.7 (35.72) 41.47 (12.06) 0.63 (0.20) 0.44 (0.09) Grade 7 669.9 (41.60) 45.41 (14.95) 0.60 (0.15) 0.44 (0.12)
Grade 11 702.6 (40.74) 43.94 (15.71) 0.52 (0.17) 0.44 (0.15) 1999
638.2 (35.55) 46.03 (11.98) 0.68 (0.18) 0.43 (0.09) Grade 7 676.3 (33.55) 45.67 (11.64) 0.65 (0.16) 0.41 (0.11)
Grade 11 711.5 (36.19) 48.74 (13.96) 0.57 (0.18) 0.44 (0.11) 2000
Grade 3 638.8 (33.65) 50.54 (11.55) 0.73 (0.18) 0.42 (0.08) Grade 7 677.3 (34.73) 49.29 (12.44) 0.68 (0.17) 0.40 (0.11)
Grade 11 714.9 (32.91) 49.43 (13.71) 0.64 (0.20) 0.41 (0.13) 2001
Grade 3 638.0 (34.9) 48.63 (12.93) 0.67 (0.19) 0.42 (0.09) Grade 7 680.2 (34.1) 57.82 (13.96) 0.66 (0.18) 0.40 (0.11)
Grade 11 713.9 (30.0) 50.26 (14.84) 0.58 (0.21) 0.40 (0.12) 2002
Grade 3 639.6 (32.5) 50.09 (12.18) 0.69 (0.18) 0.40 (0.09) Grade 7 675.9 (31.9) 55.19 (15.30) 0.63 (0.18) 0.40 (0.12)
Grade 11 715.2 (32.2) 54.55 (15.84) 0.61 (0.20) 0.42 (0.12) 2003
Grade 3 641.8 (32.5) 51.69 (11.54) 0.71 (0.17) 0.39 (0.09) Grade 7 677.2 (32.3) 56.32 (14.11) 0.64 (0.19) 0.39 (0.10)
Grade 11 714.8 (31.0) 52.98 (16.29) 0.57 (0.17) 0.43 (0.10) 2004
Grade 3 641.8 (31.5) 48.49 (11.39) 0.69 (0.20) 0.38 (0.09) Grade 7 676.6 (32.6) 49.37 (12.77) 0.63 (0.22) 0.38 (0.09)
Grade 11 714.5 (31.4) 48.87 (13.80) 0.61 (0.19) 0.41 (0.09) 2005
Grade 3 642.3 (31.9) 49.99 (10.91) 0.71 (0.17) 0.37 (0.09) Grade 7 675.9 (32.8) 51.32 (12.85) 0.66 (0.18) 0.37 (0.09)
Grade 11 714.1 (31.3) 47.96 (14.16) 0.62 (0.18) 0.41 (0.09)

Missouri Assessment Program Technical Report 2005 Supplement CTB/McGraw-Hill
29
Means, standard deviations for scale/raw scores, p-values, item-total correlation (cont’d)
Science Mean Scale Score (SD) Mean Raw Score
(SD) Mean P-Value (SD) Mean Item-Total
Correlation (SD) 1998
Grade 3 629.2 (37.49) 41.66 (11.85) 0.62 (0.22) 0.44 (0.10) Grade 7 672.8 (36.39) 37.64 (13.53) 0.49 (0.23) 0.44 (0.11)
Grade 10 695.1 (45.11) 35.65 (14.70) 0.43 (0.21) 0.46 (0.15) 1999
Grade 3 628.0 (35.29) 44.09 (11.58) 0.66 (0.21) 0.43 (0.09) Grade 7 684.1 (32.49) 41.45 (12.60) 0.57 (0.22) 0.39 (0.12)
Grade 10 712.5 (35.92) 41.06 (13.75) 0.51 (0.21) 0.43 (0.11) 2000
Grade 3 635.5 (44.55) 47.63 (11.31) 0.70 (0.19) 0.42 (0.10) Grade 7 683.1 (34.96) 43.99 (13.77) 0.59 (0.20) 0.43 (0.11)
Grade 10 714.1 (34.87) 44.08 (13.65) 0.59 (0.24) 0.40 (0.13) 2001
Grade 3 634.1 (40.6) 42.16 (9.93) 0.66 (0.20) 0.40 (0.10) Grade 7 687.9 (33.3) 39.31 (11.94) 0.59 (0.21) 0.41 (0.11)
Grade 10 712.1 (37.8) 40.44 (11.69) 0.55 (0.23) 0.39 (0.12) 2002
Grade 3 635.7 (35.7) 47.47 (10.97) 0.65 (0.22) 0.38 (0.10) Grade 7 681.4 (32.8) 38.14 (13.39) 0.52 (0.23) 0.42 (0.11)
Grade 10 709.9 (36.6) 34.70 (11.03) 0.52 (0.23) 0.39 (0.11) 2003
Grade 3 639.1 (34.7) 49.94 (10.39) 0.69 (0.22) 0.35 (0.10) Grade 7 684.2 (33.4) 41.70 (11.92) 0.56 (0.25) 0.37 (0.10)
Grade 10 712.2 (35.2) 37.45 (13.54) 0.49 (0.22) 0.41 (0.11) 2004
Grade 3 642.2 (35.4) 50.80 (10.30) 0.68 (0.23) 0.36 (0.10) Grade 7 683.2 (36.1) 38.70 (11.50) 0.54 (0.25) 0.39 (0.10)
Grade 10 711.3 (37.3) 34.60 (12.90) 0.52 (0.21) 0.43 (0.11) 2005
Grade 3 643.5 (35.7) 51.11 (9.920) 0.70 (0.21) 0.35 (0.10) Grade 7 684.6 (36.5) 39.16 (11.22) 0.57 (0.25) 0.37 (0.10)
Grade 10 712.4 (37.1) 34.92 (12.49) 0.53 (0.21) 0.42 (0.11)

Missouri Assessment Program Technical Report 2005 Supplement CTB/McGraw-Hill
30
Means, standard deviations for scale/raw scores, p-values, item-total correlation (cont’d)
Social Studies Mean Scale Score (SD) Mean Raw Score
(SD) Mean P-Value (SD) Mean Item-Total
Correlation (SD) 1999
Grade 4 646.5 (24.30) 57.95 (15.06) 0.65 (0.20) 0.39 (0.10) Grade 8 687.6 (25.57) 50.42 (12.67) 0.63 (0.20) 0.39 (0.09)
Grade 11 709.9 (27.11) 48.04 (14.48) 0.54 (0.17) 0.42 (0.10) 2000
Grade 4 650.8 (24.77) 59.64 (15.32) 0.70 (0.19) 0.42 (0.10) Grade 8 691.5 (29.61) 48.27 (13.54) 0.59 (0.20) 0.43 (0.11)
Grade 11 716.1 (25.27) 45.15 (11.62) 0.59 (0.24) 0.40 (0.13) 2001
Grade 4 653.7 (26.0) 59.20 (14.81) 0.65 (0.19) 0.38 (0.09) Grade 8 692.8 (29.3) 51.17 (13.08) 0.66 (0.18) 0.39 (0.11)
Grade 11 715.2 (24.8) 45.10 (12.92) 0.59 (0.19) 0.37 (0.11) 2002
Grade 4 652.3 (24.7) 64.29 (14.58) 0.69 (0.18) 0.37 (0.10) Grade 8 685.3 (29.3) 48.17 (14.04) 0.60 (0.20) 0.40 (0.10)
Grade 11 715.2 (27.2) 50.11 (13.92) 0.62 (0.18) 0.39 (0.11) 2003
Grade 4 656.4 (27.6) 64.97 (14.41) 0.70 (0.16) 0.37 (0.09) Grade 8 690.9 (29.3) 50.75 (13.43) 0.62 (0.19) 0.39 (0.10)
Grade 11 715.1 (26.8) 50.25 (13.53) 0.60 (0.19) 0.39 (0.11) 2004
Grade 4 660.5 (28.3) 66.9 (14.10) 0.71 (0.16) 0.36 (0.08) Grade 8 691.1 (30.1) 47.3 (12.70) 0.63 (0.19) 0.38 (0.10)
Grade 11 716.0 (26.9) 46.8 (12.30) 0.62 (0.19) 0.36 (0.10) 2005
Grade 4 662.1 (27.9) 68.02 (13.61) 0.72 (0.15) 0.35 (0.09) Grade 8 691.0 (30.2) 49.35 (12.82) 0.63 (0.20) 0.38 (0.10)
Grade 11 715.4 (28.0) 48.17 (12.64) 0.62 (0.19) 0.37 (0.10)

Missouri Assessment Program Technical Report 2005 Supplement CTB/McGraw-Hill
31
MAP 2005 Test/Item Characteristics
Mathematics
Mathematics Grade 4: Multiple Choice Mathematics Grade 4: Constructed Response No. Sess. Points Loc. Info P-Val. Rit No. Sess. Points Loc. Info P-Val. Rit 1 3 1 555 0.092 0.90 0.21 1 1 2 577 1.009 0.92 0.44 2 3 1 630 0.357 0.77 0.42 2 1 2 633 1.031 0.62 0.59 3 3 1 623 0.169 0.72 0.33 3 1 2 608 0.490 0.78 0.47 4 3 1 631 0.176 0.68 0.34 4 1 2 561 0.504 0.92 0.37 5 3 1 605 0.539 0.86 0.45 5 1 2 664 0.176 0.40 0.34 6 3 1 638 0.689 0.65 0.52 6 1 2 610 0.288 0.72 0.41 7 3 1 659 0.366 0.50 0.41 7 1 2 596 0.561 0.83 0.47 8 3 1 598 0.352 0.87 0.39 8 1 2 641 0.536 0.54 0.51 9 3 1 590 0.323 0.87 0.37 9 1 2 653 0.292 0.46 0.41 10 3 1 635 0.551 0.71 0.48 10 1 4 616 0.478 0.53 0.51 11 3 1 629 0.119 0.69 0.30 1 2 4 655 0.606 0.51 0.54 12 3 1 622 0.116 0.70 0.30 2 2 2 606 0.542 0.77 0.48 13 3 1 566 0.223 0.94 0.27 3 2 2 610 0.271 0.69 0.41 14 3 1 577 0.075 0.86 0.22 4 2 2 618 0.724 0.72 0.55 15 3 1 644 0.189 0.66 0.34 5 2 2 684 0.330 0.29 0.37 16 3 1 538 0.038 0.88 0.15 6 2 2 656 0.639 0.42 0.49 17 3 1 595 0.242 0.88 0.35 7 2 2 590 0.365 0.78 0.46 18 3 1 659 0.632 0.50 0.45 8 2 2 633 0.728 0.61 0.55 19 3 1 633 0.420 0.70 0.45 9 2 2 606 0.598 0.76 0.52 20 3 1 641 0.635 0.67 0.51 10 2 2 556 0.123 0.82 0.26 21 3 1 600 0.110 0.80 0.28 22 3 1 605 0.268 0.85 0.37 23 3 1 633 0.413 0.73 0.43 24 3 1 545 0.093 0.93 0.20 25 3 1 603 0.324 0.86 0.38 26 3 1 516 0.152 0.95 0.21 27 3 1 616 0.467 0.85 0.44 28 3 1 610 0.408 0.83 0.43 29 3 1 608 0.791 0.86 0.49 30 3 1 563 0.226 0.94 0.27 31 3 1 569 0.262 0.94 0.29 32 3 1 661 0.176 0.57 0.31

Missouri Assessment Program Technical Report 2005 Supplement CTB/McGraw-Hill
32
MAP 2005 Test/Item Characteristics (cont’d) Mathematics Grade 8: Multiple Choice Mathematics Grade 8: Constructed Response
No. Sess. Points Loc. Info P-Val. Rit No. Sess. Points Loc. Info P-Val. Rit 1 3 1 658 0.128 0.81 0.30 1 1 2 661 0.267 0.74 0.43 2 3 1 698 0.158 0.78 0.36 2 1 2 672 0.464 0.71 0.50 3 3 1 677 0.212 0.76 0.38 3 1 2 695 0.681 0.58 0.61 4 3 1 607 0.244 0.96 0.25 4 1 2 703 0.681 0.51 0.62 5 3 1 750 0.101 0.42 0.28 5 1 2 696 0.371 0.56 0.51 6 3 1 735 0.445 0.47 0.40 6 1 2 741 0.261 0.35 0.51 7 3 1 674 0.153 0.79 0.34 7 1 2 732 0.480 0.32 0.51 8 3 1 664 0.078 0.78 0.29 8 1 2 738 0.649 0.29 0.53 9 3 1 748 0.181 0.37 0.33 9 1 2 721 0.277 0.40 0.45 10 3 1 662 0.250 0.83 0.40 10 1 4 713 0.870 0.52 0.66 11 3 1 655 0.085 0.70 0.29 1 2 4 702 0.678 0.50 0.62 12 3 1 653 0.143 0.84 0.34 2 2 2 745 0.403 0.29 0.50 13 3 1 681 0.151 0.73 0.38 3 2 2 635 0.149 0.80 0.32 14 3 1 710 0.165 0.60 0.36 4 2 2 693 0.489 0.59 0.55 15 3 1 650 0.599 0.91 0.42 5 2 2 699 0.742 0.55 0.62 16 3 1 654 0.081 0.81 0.29 6 2 2 718 0.246 0.43 0.44 17 3 1 659 0.109 0.83 0.31 7 2 2 718 0.631 0.41 0.57 18 3 1 709 0.336 0.63 0.46 8 2 2 673 0.468 0.70 0.53 19 3 1 711 0.544 0.59 0.53 9 2 2 706 0.486 0.49 0.56 20 3 1 694 0.061 0.54 0.26 10 2 2 713 0.499 0.45 0.55 21 3 1 646 0.269 0.89 0.36 22 3 1 644 0.169 0.87 0.33 23 3 1 697 0.228 0.71 0.41 24 3 1 689 0.091 0.81 0.28 25 3 1 755 0.269 0.38 0.28 26 3 1 699 0.600 0.69 0.53 27 3 1 745 0.215 0.45 0.34 28 3 1 705 0.482 0.61 0.52 29 3 1 753 0.175 0.40 0.32 30 3 1 736 0.362 0.43 0.42 31 3 1 742 0.759 0.35 0.41

Missouri Assessment Program Technical Report 2005 Supplement CTB/McGraw-Hill
33
MAP 2005 Test/Item Characteristics (cont’d) Mathematics Grade 10: Multiple Choice Mathematics Grade 10: Constructed Response
No. Sess. Points Loc. Info P-Val. Rit No. Sess. Points Loc. Info P-Val. Rit 1 3 1 713 0.245 0.74 0.47 1 1 2 692 0.291 0.72 0.52 2 3 1 717 0.091 0.72 0.35 2 1 2 737 0.155 0.50 0.47 3 3 1 751 0.203 0.58 0.45 3 1 2 664 0.206 0.77 0.48 4 3 1 670 0.129 0.87 0.34 4 1 2 771 0.309 0.32 0.51 5 3 1 770 0.543 0.42 0.48 5 1 2 719 0.370 0.61 0.58 6 3 1 737 0.259 0.62 0.51 6 1 2 760 0.334 0.37 0.53 7 3 1 726 0.293 0.70 0.50 7 1 2 778 0.179 0.32 0.44 8 3 1 705 0.350 0.82 0.47 8 1 2 777 0.606 0.27 0.58 9 3 1 624 0.053 0.90 0.23 9 1 2 678 0.245 0.77 0.47 10 3 1 713 0.392 0.73 0.55 10 1 2 704 0.394 0.69 0.57 11 3 1 662 0.307 0.91 0.40 11 1 4 782 0.895 0.34 0.70 12 3 1 659 0.224 0.91 0.37 1 2 4 681 0.417 0.65 0.62 13 3 1 733 0.291 0.67 0.50 2 2 2 665 0.281 0.83 0.45 14 3 1 743 0.364 0.68 0.48 3 2 2 707 0.976 0.70 0.70 15 3 1 757 0.084 0.57 0.34 4 2 2 766 0.256 0.34 0.50 16 3 1 737 0.125 0.62 0.40 5 2 2 785 0.285 0.30 0.54 17 3 1 744 0.150 0.61 0.41 6 2 2 753 0.794 0.41 0.69 18 3 1 736 0.216 0.67 0.45 7 2 2 747 0.867 0.44 0.67 19 3 1 724 0.330 0.72 0.51 8 2 2 729 0.829 0.57 0.68 20 3 1 694 0.268 0.80 0.47 9 2 2 746 0.709 0.45 0.67 21 3 1 767 0.219 0.55 0.39 10 2 2 729 0.159 0.53 0.46 22 3 1 725 0.213 0.71 0.46 11 2 2 733 0.639 0.54 0.65 23 3 1 772 0.275 0.57 0.32 24 3 1 743 0.082 0.62 0.33 25 3 1 741 0.627 0.65 0.53
Missouri Assessment Program Technical Report 2005 Supplement CTB/McGraw-Hill
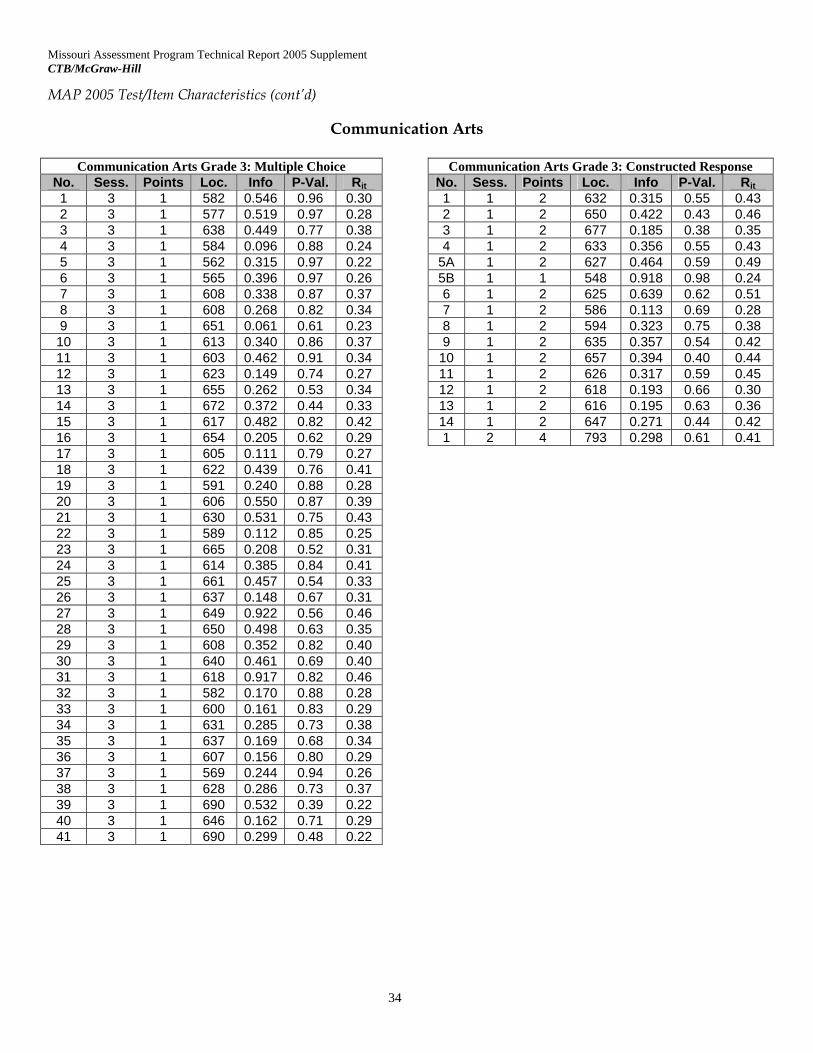
34
MAP 2005 Test/Item Characteristics (cont’d)
Communication Arts
Communication Arts Grade 3: Multiple Choice Communication Arts Grade 3: Constructed Response No. Sess. Points Loc. Info P-Val. Rit No. Sess. Points Loc. Info P-Val. Rit 1 3 1 582 0.546 0.96 0.30 1 1 2 632 0.315 0.55 0.43 2 3 1 577 0.519 0.97 0.28 2 1 2 650 0.422 0.43 0.46 3 3 1 638 0.449 0.77 0.38 3 1 2 677 0.185 0.38 0.35 4 3 1 584 0.096 0.88 0.24 4 1 2 633 0.356 0.55 0.43 5 3 1 562 0.315 0.97 0.22 5A 1 2 627 0.464 0.59 0.49 6 3 1 565 0.396 0.97 0.26 5B 1 1 548 0.918 0.98 0.24 7 3 1 608 0.338 0.87 0.37 6 1 2 625 0.639 0.62 0.51 8 3 1 608 0.268 0.82 0.34 7 1 2 586 0.113 0.69 0.28 9 3 1 651 0.061 0.61 0.23 8 1 2 594 0.323 0.75 0.38 10 3 1 613 0.340 0.86 0.37 9 1 2 635 0.357 0.54 0.42 11 3 1 603 0.462 0.91 0.34 10 1 2 657 0.394 0.40 0.44 12 3 1 623 0.149 0.74 0.27 11 1 2 626 0.317 0.59 0.45 13 3 1 655 0.262 0.53 0.34 12 1 2 618 0.193 0.66 0.30 14 3 1 672 0.372 0.44 0.33 13 1 2 616 0.195 0.63 0.36 15 3 1 617 0.482 0.82 0.42 14 1 2 647 0.271 0.44 0.42 16 3 1 654 0.205 0.62 0.29 1 2 4 793 0.298 0.61 0.41 17 3 1 605 0.111 0.79 0.27 18 3 1 622 0.439 0.76 0.41 19 3 1 591 0.240 0.88 0.28 20 3 1 606 0.550 0.87 0.39 21 3 1 630 0.531 0.75 0.43 22 3 1 589 0.112 0.85 0.25 23 3 1 665 0.208 0.52 0.31 24 3 1 614 0.385 0.84 0.41 25 3 1 661 0.457 0.54 0.33 26 3 1 637 0.148 0.67 0.31 27 3 1 649 0.922 0.56 0.46 28 3 1 650 0.498 0.63 0.35 29 3 1 608 0.352 0.82 0.40 30 3 1 640 0.461 0.69 0.40 31 3 1 618 0.917 0.82 0.46 32 3 1 582 0.170 0.88 0.28 33 3 1 600 0.161 0.83 0.29 34 3 1 631 0.285 0.73 0.38 35 3 1 637 0.169 0.68 0.34 36 3 1 607 0.156 0.80 0.29 37 3 1 569 0.244 0.94 0.26 38 3 1 628 0.286 0.73 0.37 39 3 1 690 0.532 0.39 0.22 40 3 1 646 0.162 0.71 0.29 41 3 1 690 0.299 0.48 0.22

Missouri Assessment Program Technical Report 2005 Supplement CTB/McGraw-Hill
35
MAP 2005 Test/Item Characteristics (cont’d) Communication Arts Grade 7: Multiple Choice Communication Arts Grade 7: Constructed Response
No. Sess. Points Loc. Info P-Val. Rit No. Sess. Points Loc. Info P-Val. Rit 1 3 1 604 0.295 0.95 0.27 1 1 2 715 0.105 0.37 0.26 2 3 1 682 0.166 0.66 0.31 2 1 2 674 0.133 0.51 0.31 3 3 1 635 0.405 0.87 0.37 3 1 2 666 0.427 0.58 0.48 4 3 1 658 0.408 0.76 0.42 4 1 2 659 0.318 0.60 0.44 5 3 1 562 0.024 0.86 0.12 5 1 2 688 0.072 0.47 0.23 6 3 1 629 0.349 0.89 0.35 6 1 2 666 0.147 0.55 0.31 7 3 1 700 0.122 0.54 0.27 7 1 2 661 0.233 0.58 0.39 8 3 1 620 0.196 0.89 0.28 8 1 2 659 0.324 0.61 0.42 9 3 1 603 0.172 0.92 0.25 9A 1 2 655 0.158 0.60 0.33 10 3 1 624 0.339 0.90 0.33 9B 1 1 624 0.436 0.84 0.41 11 3 1 653 0.310 0.85 0.37 10A 1 2 695 0.289 0.40 0.42 12 3 1 666 0.312 0.75 0.38 10B 1 1 484 0.102 0.97 0.17 13 3 1 648 0.434 0.83 0.41 11 1 2 679 0.358 0.49 0.46 14 3 1 674 0.102 0.65 0.27 12 1 2 649 0.348 0.64 0.47 15 3 1 667 0.530 0.73 0.45 13 1 2 695 0.312 0.39 0.41 16 3 1 649 0.342 0.79 0.39 14 1 2 676 0.323 0.50 0.47 17 3 1 622 0.094 0.84 0.25 15 1 2 719 0.843 0.19 0.43 18 3 1 654 0.148 0.75 0.31 16 1 2 702 0.275 0.39 0.45 19 3 1 653 0.437 0.79 0.43 1 2 4 603 1.244 0.69 0.52 20 3 1 688 0.440 0.59 0.38 21 3 1 671 0.420 0.70 0.41 22 3 1 706 0.536 0.42 0.34 23 3 1 661 0.285 0.73 0.39 24 3 1 657 0.316 0.76 0.41 25 3 1 624 0.105 0.84 0.27 26 3 1 697 0.382 0.54 0.35 27 3 1 664 0.465 0.72 0.45 28 3 1 708 0.212 0.46 0.28 29 3 1 655 0.446 0.77 0.44 30 3 1 661 0.388 0.76 0.40 31 3 1 674 0.489 0.67 0.43 32 3 1 679 0.594 0.63 0.44 33 3 1 660 0.797 0.77 0.49 34 3 1 684 0.242 0.59 0.36 35 3 1 699 0.564 0.48 0.38 36 3 1 634 0.168 0.85 0.31 37 3 1 723 0.221 0.32 0.27 38 3 1 700 0.152 0.60 0.27 39 3 1 725 0.110 0.44 0.22 40 3 1 731 0.495 0.36 0.18 41 3 1 699 0.162 0.63 0.28 42 3 1 665 0.173 0.75 0.33 43 3 1 685 0.305 0.68 0.36 44 3 1 724 0.245 0.40 0.24 45 3 1 728 0.426 0.34 0.22

Missouri Assessment Program Technical Report 2005 Supplement CTB/McGraw-Hill
36
MAP 2005 Test/Item Characteristics (cont’d) Communication Arts Grade 11: Multiple Choice Communication Arts Grade 11: Constructed Response
No. Sess. Points Loc. Info P-Val. Rit No. Sess. Points Loc. Info P-Val. Rit 1 3 1 754 0.640 0.43 0.27 1 1 2 693 0.436 0.64 0.47 2 3 1 648 0.366 0.95 0.28 2 1 2 703 0.572 0.60 0.51 3 3 1 729 1.093 0.51 0.50 3 1 2 725 0.762 0.42 0.54 4 3 1 736 1.026 0.48 0.42 4 1 2 697 0.630 0.64 0.52 5 3 1 722 0.514 0.66 0.41 5 1 2 735 0.416 0.39 0.47 6 3 1 710 0.243 0.76 0.34 6 1 2 696 0.428 0.62 0.47 7 3 1 746 0.464 0.45 0.30 7 1 2 705 0.362 0.55 0.47 8 3 1 659 0.178 0.79 0.29 8 1 2 699 0.438 0.59 0.50 9 3 1 714 0.191 0.65 0.32 9 1 2 719 0.476 0.47 0.51
10 3 1 672 0.398 0.86 0.37 10A 1 2 742 0.505 0.31 0.47 11 3 1 684 0.273 0.79 0.37 10B 1 1 756 0.096 0.31 0.26 12 3 1 689 0.282 0.76 0.37 11 1 2 678 0.569 0.75 0.49 13 3 1 678 0.147 0.81 0.29 12 1 2 738 0.624 0.33 0.49 14 3 1 779 0.575 0.25 0.17 13A 1 2 732 0.377 0.39 0.42 15 3 1 721 0.237 0.56 0.35 13B 1 1 659 0.407 0.85 0.39 16 3 1 693 0.696 0.81 0.46 14 1 2 749 0.267 0.36 0.45 17 3 1 687 0.222 0.80 0.34 15 1 2 743 1.069 0.26 0.53 18 3 1 696 0.476 0.77 0.44 1 2 4 636 1.122 0.65 0.52 19 3 1 729 0.210 0.59 0.33 20 3 1 796 0.308 0.20 0.14 21 3 1 740 0.181 0.63 0.26 22 3 1 713 0.366 0.69 0.40 23 3 1 676 0.468 0.88 0.39 24 3 1 772 0.241 0.40 0.20 25 3 1 703 0.444 0.74 0.42 26 3 1 718 0.337 0.61 0.39 27 3 1 727 0.429 0.60 0.38 28 3 1 682 0.629 0.87 0.42 29 3 1 658 0.497 0.93 0.33 30 3 1 686 0.227 0.75 0.36 31 3 1 707 0.798 0.69 0.51 32 3 1 713 0.387 0.62 0.41 33 3 1 752 1.466 0.31 0.30 34 3 1 735 0.241 0.56 0.31 35 3 1 712 0.664 0.69 0.46 36 3 1 709 1.009 0.71 0.49 37 3 1 711 0.473 0.63 0.43 38 3 1 716 0.501 0.64 0.41 39 3 1 731 0.248 0.57 0.33 40 3 1 722 0.078 0.59 0.23 41 3 1 723 0.597 0.66 0.40 42 3 1 701 0.438 0.81 0.41 43 3 1 721 0.437 0.65 0.40 44 3 1 736 0.436 0.53 0.35 45 3 1 754 0.429 0.36 0.29 46 3 1 732 0.362 0.54 0.36

Missouri Assessment Program Technical Report 2005 Supplement CTB/McGraw-Hill
37
Achievement-Level-Setting Achievement regions that were established by the Standard Setting process on the Missouri scale are presented below. The Missouri Achievement Levels: Regional Average SEM on the Scale All the Achievement Level Setting Workshops resulted in Achievement Levels comprised of regions on the MAP scale. These regions comprise a range of scale scores. These scale score regions are given below along with the average standard error of measurement (SEM) across the region of scale scores. Although the average SEM will vary somewhat from form to form the values given for MAP 2005 forms are fairly typical as can also be determined by inspecting the graphs of standard error curves presented earlier. Whenever the Standard Error of Measurement is needed for an individual’s scale score the precise value should be taken from tables of Standard Errors rather than using these average values. Mathematics Avg. 2005 SEM
Communication Arts Avg. 2005 SEM
Grade 4 Step 1 422—567 32Progressing 568—613 10Nearing Proficient 614—652 9Proficient 653—691 12Advanced 692—851 36 Grade 8 Step 1 541—667 22Progressing 668—707 10Nearing Proficient 708—743 9Proficient 744—784 13Advanced 785—915 37 Grade 10 Step 1 581—700 20Progressing 701—742 10Nearing Proficient 743—783 10Proficient 784—831 15Advanced 832—979 50
Grade 3 Step 1 472—592 22Progressing 593—622 10Nearing Proficient 623—654 9Proficient 655—706 12Advanced 707—849 32 Grade 7 Step 1 528—642 19Progressing 643—666 9Nearing Proficient 667—691 9Proficient 692—736 11Advanced 737—900 30 Grade 11 Step 1 563—686 20Progressing 687—705 8Nearing Proficient 706—737 7Proficient 738—782 9Advanced 783—915 26
Missouri Assessment Program Technical Report 2005 Supplement CTB/McGraw-Hill
38
Impact Test Statistics Summary Summary impact data on subgroups is presented in this section. Impact data refers to differences in item or test performance between two groups of students. It is common to examine differences in test performance for groups defined by gender and ethnicity. A difference in impact does not necessarily imply unfairness; two groups of students may have differences in test or item performance that accurately reflect differences in achievement between the groups. There is no recognized criterion to evaluate the magnitude of impact data; in this section we evaluate the magnitude of the differences between subgroups utilizing a difference of one standard deviation on the scale between the lowest performing subgroup and the majority subgroup. This roughly indicates that about 84% of the lowest performing subgroup scores below the average of the majority subgroup. The difference in subgroup performance has been noted by Missouri’s highest education officials and needed actions have been published.

Missouri Assessment Program Technical Report 2005 Supplement CTB/McGraw-Hill
39
Communication Arts
Grade Group N Mean Std Dev 1 SD below majority mean
Native American 204 646.37 28.47 Asian 982 650.64 33.94 Pacific Islander 74 642.81 29.79 Black (not Hispanic) 11481 629.10 33.64 Hispanic 2094 631.28 32.70 White (not Hispanic) 49347 645.70 30.42 Other 262 630.04 35.25
3
Ethnicity Unavailable 548 643.42 29.44
615.28
Female 31703 645.76 31.87 3 Male 33087 639.03 31.48
Native American 517 671.55 28.20 Asian 911 687.33 36.91 Pacific Islander 81 673.46 37.74 Black (not Hispanic) 13488 654.55 32.41 Hispanic 2155 665.83 34.67 White (not Hispanic) 55170 681.34 30.53 Other 698 670.31 29.84
7
Ethnicity Unavailable 744 669.09 33.29
650.81
Female 35622 680.77 31.98 7 Male 37828 671.22 32.90
Native American 313 709.03 30.01 Asian 877 723.78 34.75 Pacific Islander 124 713.66 32.08 Black (not Hispanic) 8650 693.95 31.58 Hispanic 1369 705.01 32.91 White (not Hispanic) 47871 717.80 29.72 Other 539 712.42 29.33
11
Ethnicity Unavailable 536 706.64 31.98
688.08
Female 29568 719.87 29.25 11 Male 30422 708.44 32.24

Missouri Assessment Program Technical Report 2005 Supplement CTB/McGraw-Hill
40
Mathematics
Grade Group N Mean Std Dev 1 SD below majority mean
Native American 235 639.23 35.65
Asian 1033 661.89 38.66
Pacific Islander 62 649.13 37.10
Black (not Hispanic) 12151 630.10 35.74
Hispanic 2125 637.45 33.19
White (not Hispanic) 49554 649.67 34.43
Other 287 641.06 35.95
4
Ethnicity Unavailable 608 642.41 33.94
615.24
Female 31926 644.55 34.66 4
Male 33961 646.91 36.44
Native American 402 698.92 35.30
Asian 890 727.46 42.46
Pacific Islander 103 695.81 42.89
Black (not Hispanic) 13250 675.24 40.12
Hispanic 1990 695.28 38.89
White (not Hispanic) 54928 711.12 37.85
Other 716 698.88 36.30
8
Ethnicity Unavailable 585 694.26 42.50
673.27
Female 35633 704.56 39.83 8
Male 36906 703.70 41.84
Native American 368 727.75 46.26
Asian 921 766.92 53.31
Pacific Islander 92 723.59 57.85
Black (not Hispanic) 10791 696.26 48.60
Hispanic 1661 720.17 47.16
White (not Hispanic) 52379 745.04 46.99
Other 610 724.86 48.88
10
Ethnicity Unavailable 728 729.62 52.57
698.05
Female 33301 735.90 49.01 10
Male 33901 737.44 52.50

Missouri Assessment Program Technical Report 2005 Supplement CTB/McGraw-Hill
41
Science
Grade Group N Mean Std Dev 1 SD below majority mean
Native American 155 647.66 37.80
Asian 520 651.23 38.96
Pacific Islander 36 638.47 34.44
Black (not Hispanic) 8287 630.73 36.78
Hispanic 1465 632.50 34.82
White (not Hispanic) 29023 647.66 34.29
Other 138 629.08 43.29
3
Ethnicity Unavailable 435 641.18 34.82
613.37
Female 19532 642.75 35.29 3
Male 20373 644.29 36.03
Native American 332 682.89 32.13
Asian 489 694.31 39.55
Pacific Islander 56 686.16 34.17
Black (not Hispanic) 10065 658.33 35.69
Hispanic 1484 673.20 38.12
White (not Hispanic) 33507 692.84 32.69
Other 403 678.51 35.24
7
Ethnicity Unavailable 481 678.07 37.37
660.15
Female 22675 682.87 35.05 7
Male 23946 686.21 37.85
Native American 272 712.29 31.59
Asian 528 721.27 38.27
Pacific Islander 68 706.04 35.87
Black (not Hispanic) 8164 682.08 36.82
Hispanic 1180 696.74 37.03
White (not Hispanic) 33462 719.99 33.20
Other 393 713.23 34.88
10
Ethnicity Unavailable 536 711.68 35.92
686.79
Female 22047 709.32 36.00 10
Male 22293 715.50 37.90
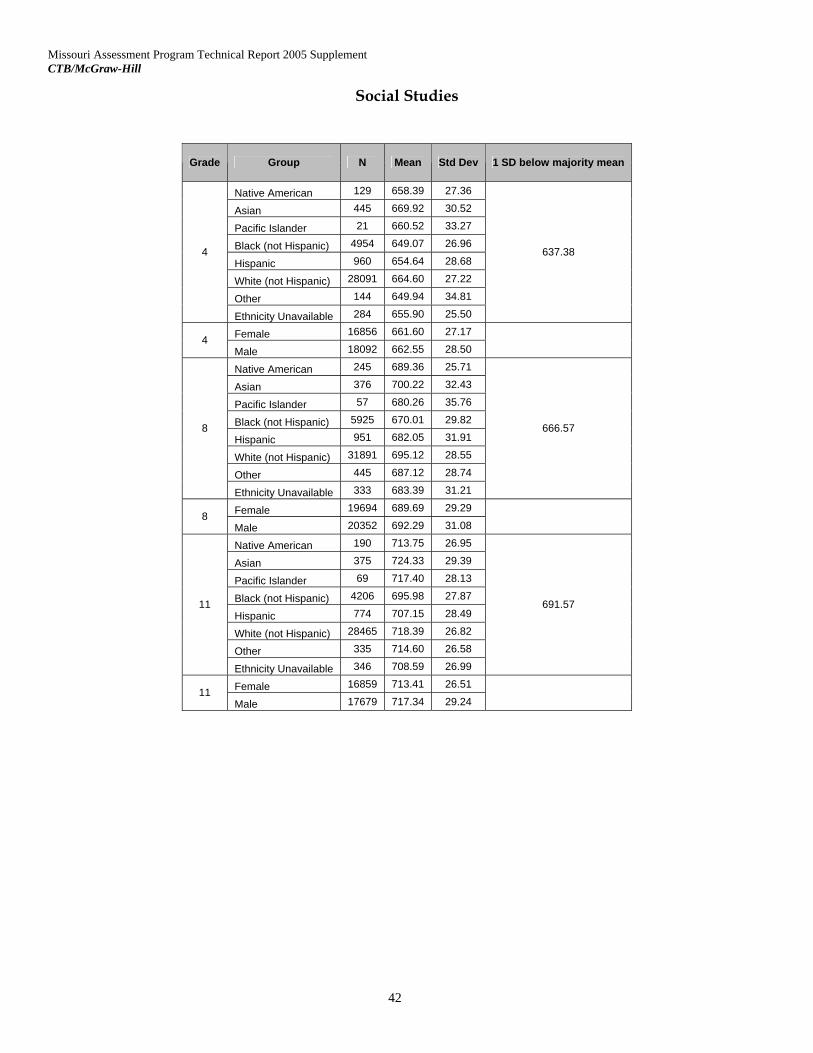
Missouri Assessment Program Technical Report 2005 Supplement CTB/McGraw-Hill
42
Social Studies
Grade Group N Mean Std Dev 1 SD below majority mean
Native American 129 658.39 27.36
Asian 445 669.92 30.52
Pacific Islander 21 660.52 33.27
Black (not Hispanic) 4954 649.07 26.96
Hispanic 960 654.64 28.68
White (not Hispanic) 28091 664.60 27.22
Other 144 649.94 34.81
4
Ethnicity Unavailable 284 655.90 25.50
637.38
Female 16856 661.60 27.17 4
Male 18092 662.55 28.50
Native American 245 689.36 25.71
Asian 376 700.22 32.43
Pacific Islander 57 680.26 35.76
Black (not Hispanic) 5925 670.01 29.82
Hispanic 951 682.05 31.91
White (not Hispanic) 31891 695.12 28.55
Other 445 687.12 28.74
8
Ethnicity Unavailable 333 683.39 31.21
666.57
Female 19694 689.69 29.29 8
Male 20352 692.29 31.08
Native American 190 713.75 26.95
Asian 375 724.33 29.39
Pacific Islander 69 717.40 28.13
Black (not Hispanic) 4206 695.98 27.87
Hispanic 774 707.15 28.49
White (not Hispanic) 28465 718.39 26.82
Other 335 714.60 26.58
11
Ethnicity Unavailable 346 708.59 26.99
691.57
Female 16859 713.41 26.51 11
Male 17679 717.34 29.24

Missouri Assessment Program Technical Report 2005 Supplement CTB/McGraw-Hill
43
Appendix
MAP 2005 Interrater Comparison
Constructed Response Items
(Numbered consecutively by sequence of appearance)
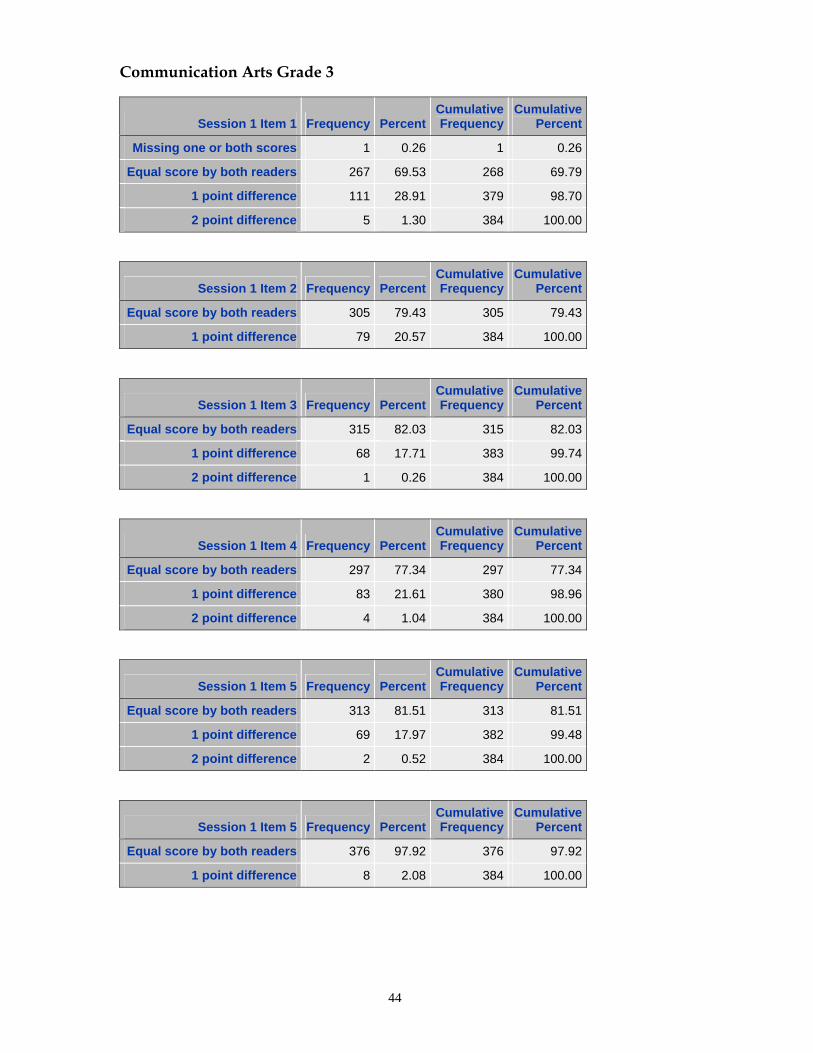
44
Communication Arts Grade 3
Session 1 Item 1 Frequency PercentCumulativeFrequency
Cumulative Percent
Missing one or both scores 1 0.26 1 0.26
Equal score by both readers 267 69.53 268 69.79
1 point difference 111 28.91 379 98.70
2 point difference 5 1.30 384 100.00
Session 1 Item 2 Frequency PercentCumulativeFrequency
Cumulative Percent
Equal score by both readers 305 79.43 305 79.43
1 point difference 79 20.57 384 100.00
Session 1 Item 3 Frequency PercentCumulativeFrequency
Cumulative Percent
Equal score by both readers 315 82.03 315 82.03
1 point difference 68 17.71 383 99.74
2 point difference 1 0.26 384 100.00
Session 1 Item 4 Frequency PercentCumulativeFrequency
Cumulative Percent
Equal score by both readers 297 77.34 297 77.34
1 point difference 83 21.61 380 98.96
2 point difference 4 1.04 384 100.00
Session 1 Item 5 Frequency PercentCumulativeFrequency
Cumulative Percent
Equal score by both readers 313 81.51 313 81.51
1 point difference 69 17.97 382 99.48
2 point difference 2 0.52 384 100.00
Session 1 Item 5 Frequency PercentCumulativeFrequency
Cumulative Percent
Equal score by both readers 376 97.92 376 97.92
1 point difference 8 2.08 384 100.00

45
Session 1 Item 6 Frequency PercentCumulativeFrequency
Cumulative Percent
Equal score by both readers 329 85.68 329 85.68
1 point difference 54 14.06 383 99.74
2 point difference 1 0.26 384 100.00
Session 1 Item 7 Frequency PercentCumulativeFrequency
Cumulative Percent
Equal score by both readers 281 73.18 281 73.18
1 point difference 100 26.04 381 99.22
2 point difference 3 0.78 384 100.00
Session 1 Item 8 Frequency PercentCumulativeFrequency
Cumulative Percent
Equal score by both readers 314 81.77 314 81.77
1 point difference 66 17.19 380 98.96
2 point difference 4 1.04 384 100.00
Session 1 Item 9 Frequency PercentCumulativeFrequency
Cumulative Percent
Equal score by both readers 306 79.69 306 79.69
1 point difference 78 20.31 384 100.00
Session 1 Item 10 Frequency PercentCumulativeFrequency
Cumulative Percent
Equal score by both readers 370 96.35 370 96.35
1 point difference 14 3.65 384 100.00
Session 1 Item 11 Frequency PercentCumulativeFrequency
Cumulative Percent
Equal score by both readers 354 92.19 354 92.19
1 point difference 30 7.81 384 100.00
Session 1 Item 12 Frequency PercentCumulativeFrequency
Cumulative Percent
Equal score by both readers 245 63.80 245 63.80
1 point difference 115 29.95 360 93.75
2 point difference 24 6.25 384 100.00

46
Session 1 Item 13 Frequency PercentCumulativeFrequency
Cumulative Percent
Equal score by both readers 282 73.44 282 73.44
1 point difference 100 26.04 382 99.48
2 point difference 2 0.52 384 100.00
Session 1 Item 14 Frequency PercentCumulativeFrequency
Cumulative Percent
Equal score by both readers 272 70.83 272 70.83
1 point difference 99 25.78 371 96.61
2 point difference 13 3.39 384 100.00
Session 2 Item 1 Frequency PercentCumulativeFrequency
Cumulative Percent
Equal score by both readers 243 63.28 243 63.28
1 point difference 141 36.72 384 100.00

47
Communication Arts Grade 7
Session 1 Item 1 Frequency PercentCumulativeFrequency
Cumulative Percent
Equal score by both readers 364 86.87 364 86.87
1 point difference 52 12.41 416 99.28
2 point difference 3 0.72 419 100.00
Session 1 Item 2 Frequency PercentCumulativeFrequency
Cumulative Percent
Equal score by both readers 346 82.58 346 82.58
1 point difference 67 15.99 413 98.57
2 point difference 6 1.43 419 100.00
Session 1 Item 3 Frequency PercentCumulativeFrequency
Cumulative Percent
Equal score by both readers 298 71.12 298 71.12
1 point difference 85 20.29 383 91.41
2 point difference 36 8.59 419 100.00
Session 1 Item 4 Frequency PercentCumulativeFrequency
Cumulative Percent
Equal score by both readers 281 67.06 281 67.06
1 point difference 123 29.36 404 96.42
2 point difference 15 3.58 419 100.00
Session 1 Item 5 Frequency PercentCumulativeFrequency
Cumulative Percent
Equal score by both readers 288 68.74 288 68.74
1 point difference 110 26.25 398 94.99
2 point difference 21 5.01 419 100.00
Session 1 Item 6 Frequency PercentCumulativeFrequency
Cumulative Percent
Equal score by both readers 359 85.68 359 85.68
1 point difference 55 13.13 414 98.81
2 point difference 5 1.19 419 100.00

48
Session 1 Item 7 Frequency PercentCumulativeFrequency
Cumulative Percent
Equal score by both readers 298 71.12 298 71.12
1 point difference 110 26.25 408 97.37
2 point difference 11 2.63 419 100.00
Session 1 Item 8 Frequency PercentCumulativeFrequency
Cumulative Percent
Equal score by both readers 306 73.03 306 73.03
1 point difference 83 19.81 389 92.84
2 point difference 30 7.16 419 100.00
Session 1 Item 9 Frequency PercentCumulativeFrequency
Cumulative Percent
Equal score by both readers 287 68.50 287 68.50
1 point difference 94 22.43 381 90.93
2 point difference 38 9.07 419 100.00
Session 1 Item 9 Frequency PercentCumulativeFrequency
Cumulative Percent
Equal score by both readers 412 98.33 412 98.33
1 point difference 7 1.67 419 100.00
Session 1 Item 10 Frequency PercentCumulativeFrequency
Cumulative Percent
Equal score by both readers 320 76.37 320 76.37
1 point difference 97 23.15 417 99.52
2 point difference 2 0.48 419 100.00
Session 1 Item 10 Frequency PercentCumulativeFrequency
Cumulative Percent
Missing one or both scores 1 0.24 1 0.24
Equal score by both readers 418 99.76 419 100.00
Session 1 Item 11 Frequency PercentCumulativeFrequency
Cumulative Percent
Equal score by both readers 326 77.80 326 77.80
1 point difference 90 21.48 416 99.28
2 point difference 3 0.72 419 100.00

49
Session 1 Item 12 Frequency PercentCumulativeFrequency
Cumulative Percent
Equal score by both readers 375 89.50 375 89.50
1 point difference 44 10.50 419 100.00
Session 1 Item 13 Frequency PercentCumulativeFrequency
Cumulative Percent
Equal score by both readers 309 73.75 309 73.75
1 point difference 107 25.54 416 99.28
2 point difference 3 0.72 419 100.00
Session 1 Item 14 Frequency PercentCumulativeFrequency
Cumulative Percent
Missing one or both scores 1 0.24 1 0.24
Equal score by both readers 361 86.16 362 86.40
1 point difference 56 13.37 418 99.76
2 point difference 1 0.24 419 100.00
Session 1 Item 15 Frequency PercentCumulativeFrequency
Cumulative Percent
Equal score by both readers 378 90.21 378 90.21
1 point difference 36 8.59 414 98.81
2 point difference 5 1.19 419 100.00
Session 1 Item 16 Frequency PercentCumulativeFrequency
Cumulative Percent
Equal score by both readers 324 77.33 324 77.33
1 point difference 94 22.43 418 99.76
2 point difference 1 0.24 419 100.00
Session 2 Item 1 Frequency PercentCumulativeFrequency
Cumulative Percent
Missing one or both scores 1 0.24 1 0.24
Equal score by both readers 312 74.46 313 74.70
1 point difference 101 24.11 414 98.81
2 point difference 3 0.72 417 99.52
3 point difference 2 0.48 419 100.00

50
Communication Arts Grade 11
Session 1 Item 1 Frequency PercentCumulativeFrequency
Cumulative Percent
Equal score by both readers 247 73.73 247 73.73
1 point difference 87 25.97 334 99.70
2 point difference 1 0.30 335 100.00
Session 1 Item 2 Frequency PercentCumulativeFrequency
Cumulative Percent
Equal score by both readers 222 66.27 222 66.27
1 point difference 106 31.64 328 97.91
2 point difference 7 2.09 335 100.00
Session 1 Item 3 Frequency PercentCumulativeFrequency
Cumulative Percent
Missing one or both scores 1 0.30 1 0.30
Equal score by both readers 199 59.40 200 59.70
1 point difference 119 35.52 319 95.22
2 point difference 16 4.78 335 100.00
Session 1 Item 4 Frequency PercentCumulativeFrequency
Cumulative Percent
Equal score by both readers 239 71.34 239 71.34
1 point difference 95 28.36 334 99.70
2 point difference 1 0.30 335 100.00
Session 1 Item 5 Frequency PercentCumulativeFrequency
Cumulative Percent
Equal score by both readers 263 78.51 263 78.51
1 point difference 70 20.90 333 99.40
2 point difference 2 0.60 335 100.00
Session 1 Item 6 Frequency PercentCumulativeFrequency
Cumulative Percent
Equal score by both readers 242 72.24 242 72.24
1 point difference 72 21.49 314 93.73
2 point difference 21 6.27 335 100.00

51
Session 1 Item 7 Frequency PercentCumulativeFrequency
Cumulative Percent
Equal score by both readers 232 69.25 232 69.25
1 point difference 93 27.76 325 97.01
2 point difference 10 2.99 335 100.00
Session 1 Item 8 Frequency PercentCumulativeFrequency
Cumulative Percent
Equal score by both readers 262 78.21 262 78.21
1 point difference 63 18.81 325 97.01
2 point difference 10 2.99 335 100.00
Session 1 Item 9 Frequency PercentCumulativeFrequency
Cumulative Percent
Equal score by both readers 259 77.31 259 77.31
1 point difference 72 21.49 331 98.81
2 point difference 4 1.19 335 100.00
Session 1 Item 10 Frequency PercentCumulativeFrequency
Cumulative Percent
Equal score by both readers 215 64.18 215 64.18
1 point difference 108 32.24 323 96.42
2 point difference 12 3.58 335 100.00
Session 1 Item 10 Frequency PercentCumulativeFrequency
Cumulative Percent
Equal score by both readers 293 87.46 293 87.46
1 point difference 42 12.54 335 100.00
Session 1 Item 11 Frequency PercentCumulativeFrequency
Cumulative Percent
Equal score by both readers 261 77.91 261 77.91
1 point difference 69 20.60 330 98.51
2 point difference 5 1.49 335 100.00

52
Session 1 Item 12 Frequency PercentCumulativeFrequency
Cumulative Percent
Equal score by both readers 240 71.64 240 71.64
1 point difference 87 25.97 327 97.61
2 point difference 8 2.39 335 100.00
Session 1 Item 13 Frequency PercentCumulativeFrequency
Cumulative Percent
Equal score by both readers 256 76.42 256 76.42
1 point difference 73 21.79 329 98.21
2 point difference 6 1.79 335 100.00
Session 1 Item 13 Frequency PercentCumulativeFrequency
Cumulative Percent
Equal score by both readers 328 97.91 328 97.91
1 point difference 7 2.09 335 100.00
Session 1 Item 14 Frequency PercentCumulativeFrequency
Cumulative Percent
Equal score by both readers 257 76.72 257 76.72
1 point difference 77 22.99 334 99.70
2 point difference 1 0.30 335 100.00
Session 1 Item 15 Frequency PercentCumulativeFrequency
Cumulative Percent
Equal score by both readers 241 71.94 241 71.94
1 point difference 89 26.57 330 98.51
2 point difference 5 1.49 335 100.00
Session 2 Item 1 Frequency PercentCumulativeFrequency
Cumulative Percent
Equal score by both readers 256 76.42 256 76.42
1 point difference 78 23.28 334 99.70
2 point difference 1 0.30 335 100.00

53
Mathematics Grade 4
Session 1 Item 1 Frequency PercentCumulativeFrequency
Cumulative Percent
Equal score by both readers 367 98.66 367 98.66
1 point difference 5 1.34 372 100.00
Session 1 Item 2 Frequency PercentCumulativeFrequency
Cumulative Percent
Missing one or both scores 3 0.81 3 0.81
Equal score by both readers 363 97.58 366 98.39
1 point difference 5 1.34 371 99.73
2 point difference 1 0.27 372 100.00
Session 1 Item 3 Frequency PercentCumulativeFrequency
Cumulative Percent
Missing one or both scores 1 0.27 1 0.27
Equal score by both readers 356 95.70 357 95.97
1 point difference 10 2.69 367 98.66
2 point difference 5 1.34 372 100.00
Session 1 Item 4 Frequency PercentCumulativeFrequency
Cumulative Percent
Equal score by both readers 343 92.20 343 92.20
1 point difference 27 7.26 370 99.46
2 point difference 2 0.54 372 100.00
Session 1 Item 5 Frequency PercentCumulativeFrequency
Cumulative Percent
Equal score by both readers 302 81.18 302 81.18
1 point difference 66 17.74 368 98.92
2 point difference 4 1.08 372 100.00
Session 1 Item 6 Frequency PercentCumulativeFrequency
Cumulative Percent
Equal score by both readers 344 92.47 344 92.47
1 point difference 28 7.53 372 100.00

54
Session 1 Item 7 Frequency PercentCumulativeFrequency
Cumulative Percent
Equal score by both readers 353 94.89 353 94.89
1 point difference 18 4.84 371 99.73
2 point difference 1 0.27 372 100.00
Session 1 Item 8 Frequency PercentCumulativeFrequency
Cumulative Percent
Equal score by both readers 322 86.56 322 86.56
1 point difference 49 13.17 371 99.73
2 point difference 1 0.27 372 100.00
Session 1 Item 9 Frequency PercentCumulativeFrequency
Cumulative Percent
Equal score by both readers 341 91.67 341 91.67
1 point difference 31 8.33 372 100.00
Session 1 Item 10 Frequency PercentCumulativeFrequency
Cumulative Percent
Equal score by both readers 277 74.46 277 74.46
1 point difference 90 24.19 367 98.66
2 point difference 5 1.34 372 100.00
Session 2 Item 1 Frequency PercentCumulativeFrequency
Cumulative Percent
Equal score by both readers 211 56.72 211 56.72
1 point difference 131 35.22 342 91.94
2 point difference 26 6.99 368 98.92
3 point difference 4 1.08 372 100.00
Session 2 Item 2 Frequency PercentCumulativeFrequency
Cumulative Percent
Missing one or both scores 2 0.54 2 0.54
Equal score by both readers 354 95.16 356 95.70
1 point difference 16 4.30 372 100.00

55
Session 2 Item 3 Frequency PercentCumulativeFrequency
Cumulative Percent
Equal score by both readers 344 92.47 344 92.47
1 point difference 28 7.53 372 100.00
Session 2 Item 4 Frequency PercentCumulativeFrequency
Cumulative Percent
Equal score by both readers 351 94.35 351 94.35
1 point difference 21 5.65 372 100.00
Session 2 Item 5 Frequency PercentCumulativeFrequency
Cumulative Percent
Equal score by both readers 352 94.62 352 94.62
1 point difference 17 4.57 369 99.19
2 point difference 3 0.81 372 100.00
Session 2 Item 6 Frequency PercentCumulativeFrequency
Cumulative Percent
Equal score by both readers 357 95.97 357 95.97
1 point difference 11 2.96 368 98.92
2 point difference 4 1.08 372 100.00
Session 2 Item 7 Frequency PercentCumulativeFrequency
Cumulative Percent
Equal score by both readers 285 76.61 285 76.61
1 point difference 84 22.58 369 99.19
2 point difference 3 0.81 372 100.00
Session 2 Item 8 Frequency PercentCumulativeFrequency
Cumulative Percent
Equal score by both readers 364 97.85 364 97.85
1 point difference 8 2.15 372 100.00
Session 2 Item 9 Frequency PercentCumulativeFrequency
Cumulative Percent
Equal score by both readers 368 98.92 368 98.92
1 point difference 4 1.08 372 100.00

56
Session 2 Item 10 Frequency PercentCumulativeFrequency
Cumulative Percent
Equal score by both readers 363 97.58 363 97.58
1 point difference 9 2.42 372 100.00

57
Mathematics Grade 8
Session 1 Item 1 Frequency PercentCumulativeFrequency
Cumulative Percent
Missing one or both scores 1 0.23 1 0.23
Equal score by both readers 409 94.46 410 94.69
1 point difference 21 4.85 431 99.54
2 point difference 2 0.46 433 100.00
Session 1 Item 2 Frequency PercentCumulativeFrequency
Cumulative Percent
Equal score by both readers 417 96.30 417 96.30
1 point difference 14 3.23 431 99.54
2 point difference 2 0.46 433 100.00
Session 1 Item 3 Frequency PercentCumulativeFrequency
Cumulative Percent
Equal score by both readers 391 90.30 391 90.30
1 point difference 42 9.70 433 100.00
Session 1 Item 4 Frequency PercentCumulativeFrequency
Cumulative Percent
Equal score by both readers 393 90.76 393 90.76
1 point difference 39 9.01 432 99.77
2 point difference 1 0.23 433 100.00
Session 1 Item 5 Frequency PercentCumulativeFrequency
Cumulative Percent
Equal score by both readers 417 96.30 417 96.30
1 point difference 16 3.70 433 100.00
Session 1 Item 6 Frequency PercentCumulativeFrequency
Cumulative Percent
Equal score by both readers 418 96.54 418 96.54
1 point difference 15 3.46 433 100.00

58
Session 1 Item 7 Frequency PercentCumulativeFrequency
Cumulative Percent
Equal score by both readers 414 95.61 414 95.61
1 point difference 18 4.16 432 99.77
2 point difference 1 0.23 433 100.00
Session 1 Item 8 Frequency PercentCumulativeFrequency
Cumulative Percent
Equal score by both readers 405 93.53 405 93.53
1 point difference 28 6.47 433 100.00
Session 1 Item 9 Frequency PercentCumulativeFrequency
Cumulative Percent
Equal score by both readers 413 95.38 413 95.38
1 point difference 8 1.85 421 97.23
2 point difference 12 2.77 433 100.00
Session 1 Item 10 Frequency PercentCumulativeFrequency
Cumulative Percent
Equal score by both readers 323 74.60 323 74.60
1 point difference 98 22.63 421 97.23
2 point difference 9 2.08 430 99.31
3 point difference 3 0.69 433 100.00
Session 2 Item 1 Frequency PercentCumulativeFrequency
Cumulative Percent
Missing one or both scores 1 0.23 1 0.23
Equal score by both readers 297 68.59 298 68.82
1 point difference 107 24.71 405 93.53
2 point difference 22 5.08 427 98.61
3 point difference 6 1.39 433 100.00
Session 2 Item 2 Frequency PercentCumulativeFrequency
Cumulative Percent
Equal score by both readers 389 89.84 389 89.84
1 point difference 44 10.16 433 100.00

59
Session 2 Item 3 Frequency PercentCumulativeFrequency
Cumulative Percent
Equal score by both readers 423 97.69 423 97.69
1 point difference 7 1.62 430 99.31
2 point difference 3 0.69 433 100.00
Session 2 Item 4 Frequency PercentCumulativeFrequency
Cumulative Percent
Equal score by both readers 395 91.22 395 91.22
1 point difference 38 8.78 433 100.00
Session 2 Item 5 Frequency PercentCumulativeFrequency
Cumulative Percent
Missing one or both scores 1 0.23 1 0.23
Equal score by both readers 396 91.45 397 91.69
1 point difference 36 8.31 433 100.00
Session 2 Item 6 Frequency PercentCumulativeFrequency
Cumulative Percent
Equal score by both readers 388 89.61 388 89.61
1 point difference 44 10.16 432 99.77
2 point difference 1 0.23 433 100.00
Session 2 Item 7 Frequency PercentCumulativeFrequency
Cumulative Percent
Missing one or both scores 1 0.23 1 0.23
Equal score by both readers 389 89.84 390 90.07
1 point difference 43 9.93 433 100.00
Session 2 Item 8 Frequency PercentCumulativeFrequency
Cumulative Percent
Equal score by both readers 416 96.07 416 96.07
1 point difference 14 3.23 430 99.31
2 point difference 3 0.69 433 100.00

60
Session 2 Item 9 Frequency PercentCumulativeFrequency
Cumulative Percent
Equal score by both readers 334 77.14 334 77.14
1 point difference 92 21.25 426 98.38
2 point difference 7 1.62 433 100.00
Session 2 Item 10 Frequency PercentCumulativeFrequency
Cumulative Percent
Equal score by both readers 371 85.68 371 85.68
1 point difference 62 14.32 433 100.00

61
Mathematics Grade 10
Session 1 Item 1 Frequency PercentCumulativeFrequency
Cumulative Percent
Equal score by both readers 345 96.64 345 96.64
1 point difference 12 3.36 357 100.00
Session 1 Item 2 Frequency PercentCumulativeFrequency
Cumulative Percent
Equal score by both readers 351 98.32 351 98.32
1 point difference 6 1.68 357 100.00
Session 1 Item 3 Frequency PercentCumulativeFrequency
Cumulative Percent
Equal score by both readers 325 91.04 325 91.04
1 point difference 31 8.68 356 99.72
2 point difference 1 0.28 357 100.00
Session 1 Item 4 Frequency PercentCumulativeFrequency
Cumulative Percent
Equal score by both readers 321 89.92 321 89.92
1 point difference 36 10.08 357 100.00
Session 1 Item 5 Frequency PercentCumulativeFrequency
Cumulative Percent
Missing one or both scores 1 0.28 1 0.28
Equal score by both readers 327 91.60 328 91.88
1 point difference 29 8.12 357 100.00
Session 1 Item 6 Frequency PercentCumulativeFrequency
Cumulative Percent
Equal score by both readers 341 95.52 341 95.52
1 point difference 15 4.20 356 99.72
2 point difference 1 0.28 357 100.00
Session 1 Item 7 Frequency PercentCumulativeFrequency
Cumulative Percent
Equal score by both readers 337 94.40 337 94.40
1 point difference 20 5.60 357 100.00

62
Session 1 Item 8 Frequency PercentCumulativeFrequency
Cumulative Percent
Missing one or both scores 1 0.28 1 0.28
Equal score by both readers 336 94.12 337 94.40
1 point difference 20 5.60 357 100.00
Session 1 Item 9 Frequency PercentCumulativeFrequency
Cumulative Percent
Equal score by both readers 327 91.60 327 91.60
1 point difference 30 8.40 357 100.00
Session 1 Item 10 Frequency PercentCumulativeFrequency
Cumulative Percent
Missing one or both scores 1 0.28 1 0.28
Equal score by both readers 335 93.84 336 94.12
1 point difference 21 5.88 357 100.00
Session 1 Item 11 Frequency PercentCumulativeFrequency
Cumulative Percent
Equal score by both readers 269 75.35 269 75.35
1 point difference 82 22.97 351 98.32
2 point difference 6 1.68 357 100.00
Session 2 Item 1 Frequency PercentCumulativeFrequency
Cumulative Percent
Equal score by both readers 250 70.03 250 70.03
1 point difference 96 26.89 346 96.92
2 point difference 11 3.08 357 100.00
Session 2 Item 2 Frequency PercentCumulativeFrequency
Cumulative Percent
Equal score by both readers 333 93.28 333 93.28
1 point difference 22 6.16 355 99.44
2 point difference 2 0.56 357 100.00
Session 2 Item 3 Frequency PercentCumulativeFrequency
Cumulative Percent
Equal score by both readers 344 96.36 344 96.36
1 point difference 13 3.64 357 100.00

63
Session 2 Item 4 Frequency PercentCumulativeFrequency
Cumulative Percent
Equal score by both readers 346 96.92 346 96.92
1 point difference 9 2.52 355 99.44
2 point difference 2 0.56 357 100.00
Session 2 Item 5 Frequency PercentCumulativeFrequency
Cumulative Percent
Equal score by both readers 351 98.32 351 98.32
1 point difference 6 1.68 357 100.00
Session 2 Item 6 Frequency PercentCumulativeFrequency
Cumulative Percent
Equal score by both readers 322 90.20 322 90.20
1 point difference 35 9.80 357 100.00
Session 2 Item 7 Frequency PercentCumulativeFrequency
Cumulative Percent
Equal score by both readers 341 95.52 341 95.52
1 point difference 16 4.48 357 100.00
Session 2 Item 8 Frequency PercentCumulativeFrequency
Cumulative Percent
Equal score by both readers 343 96.08 343 96.08
1 point difference 14 3.92 357 100.00
Session 2 Item 9 Frequency PercentCumulativeFrequency
Cumulative Percent
Equal score by both readers 329 92.16 329 92.16
1 point difference 28 7.84 357 100.00
Session 2 Item 10 Frequency PercentCumulativeFrequency
Cumulative Percent
Equal score by both readers 340 95.24 340 95.24
1 point difference 16 4.48 356 99.72
2 point difference 1 0.28 357 100.00

64
Session 2 Item 11 Frequency PercentCumulativeFrequency
Cumulative Percent
Equal score by both readers 350 98.04 350 98.04
1 point difference 7 1.96 357 100.00

65
References Lord, F. M. (1974). Estimation of latent ability and item parameters when there are omitted responses. Psychometrika, 39, 247-264. Lord, F. M. (1980). Applications of item response theory on practical testing problems. Hillsdale, NJ: Lawrence Erlbaum. Yen, W. M., Burket, G. R., & Sykes, R. C. (1988). Non-unique solutations to the likelihood equation for the three-parameter logistic model. Paper presented at the meeting of the Psychometric Society, Los Angeles.