Embed Size (px)
Citation preview
D-4870-1 1
Mistakes and Misunderstandings:
Common Formulation Errors
Prepared for theMIT System Dynamics in Education Project
Under the Supervision ofDr. Jay W. Forrester
NOTE: This exercise is designed for VensimPLE software.
byLewis Kaneshiro
May 17, 2001
Copyright © 2001 by the Massachusetts Institute of Technology.Permission granted to distribute for non-commercial educational purposes.
D-4870-1 2
ABSTRACT
Mistakes and Misunderstandings: Common Formulation Errors leads readers through
building, testing, and evaluating four different Vensim model formulations for a
“Cleanliness of a College Dorm Room” system description. All formulations are the
result of actual Guided Study Program (GSP) assignments and represent common
formulations. Formulation errors discovered through repeated parameter testing and
evaluation include using a “Gap” variable, “MIN” (Minimum) function combined with a
“Gap” variable, and an Incorrect usage of a Lookup Function. Also analyzed is model
incorporating a correct Lookup Function and is shown to be reasonable through
parameter testing and tracing causes for behavior through model. Documentation and
instructions for building each model in Vensim appear in the Appendix.
D-4870-1 3
TABLE OF CONTENTS
1. INTRODUCTION 5
2. THE GUIDED STUDY PROGRAM 5
3. THE GSP ASSIGNMENT 6
4. FIRST ATTEMPT: USING A “GAP” VARIABLE 7
5. MISTAKES AND MISUNDERSTANDINS: “GAP” VARIABLE 9
6. SECOND ATTEMPT: USING A MIN FUNCTION AND “GAP” VARIABLE 16
7. MISTAKES AND MISUNDERSTANDINGS: MIN FUNCTION AND “GAP VARIABLE 18
8. THIRD ATTEMPT: USING A LOOKUP FUNCTION INCORRECTLY 25
9. MISTAKES AND MISUNDERSTANDINGS: INCORRECT LOOKUP FUNCTIONS 28
10. FINAL ATTEMPT: USING A CORRECT LOOKUP FUNCTION 32
11. OVERCOMING OUR MISTAKES AND MISUNDERSTANDINGS 38
12. Appendix 40
12.1 Modeling the System using a “Gap” Variable 4012.2 Modeling the System using MIN and Gap Variables 42
12.3 Modeling the System using an Incorrect Lookup Function 45
12.4 Modeling the System using a Correct Lookup Function 50
D-4870-1 4
1. INTRODUCTION
This paper studies common formulation mistakes and misunderstandings and
describes how errors in formulation are discovered. First, when evaluating all models, it
is important to question each formulation structure by studying the behavior it produces.
Second, determine if the observed behavior is plausible, which can either lead to
discovering a formulation error, or give us added confidence that our formulation is
useful.
We will build and examine two models which use a “Gap” variable to produce
unrealistic behavior. We will also build two other models using Lookup Functions which
produce plausible behavior, although one uses an incorrect formulation. It is important
when working through this paper to observe the specific formulation errors presented and
to follow the line of questioning used to find such errors. It is important to make these
observations so you can discover formulation errors by running and testing future
models. Changing model parameter values, simulating the model, and tracing the causes
of resulting behavior is a simple process which can be used to test your model
formulation.
2. THE GUIDED STUDY PROGRAM
The basis for this paper, “Mistakes and Misunderstandings: Common Formulation
Errors,” are taken from actual participant assignments of the Guided Study Program
(GSP). The GSP was a year-long correspondence program designed to teach System
Dynamics to participants from both academics, ranging from K-12 educators to PhD
candidates, and industry.
The GSP was run for three consecutive years with three different groups of
participants. This paper studies formulation errors that arose from a particular GSP
assignment in which participants modeled an adaptation of the “Cleanliness of a College
Dorm Room” model.1
1 GSP Assignment 30 Builds on the “Cleanliness of a College Dorm Room” model: Kevin Agatstein,1997. Oscillating Systems II: Sustained Oscillations (D-4602). System Dynamics in Education Project,System Dynamics Group, Sloan School of Management, Massachusetts Institute of Technology. May 15,31pp.
D-4870-1 5
3. THE GSP ASSIGNMENT
Read the following description of a college dorm room and the behavior of Kevin
and his roommate. This is an excerpt from an actual assignment presented to GSP
participants. Following the description will be participant’s attempts to model the system
with a discussion of common formulation errors:
Imagine a college dorm room with one very messy roommate
named Kevin who always drops his dirty clothes on the floor. Sharing the
room is Kevin’s very neat roommate who always complains about the
untidiness of the room, especially when Kevin’s dirty clothes spill over to
his side of the room. When the clothes begin to untidy his side of the
room, he complains, and Kevin picks up some of the clothes. The
Roommate’s complaining then subsides as the room becomes tidier. As
the complaining subsides, Kevin picks up fewer and fewer articles of
clothing and continues dropping clothes on the floor because he is a slob.
As the amount of laundry on the floor begins to reaccumulate, Kevin’s
roommate begins to complain more and more. The complaints increase
Kevin’s willingness to pick up his clothes, which in turn causes Kevin to
actually clean his room, which decreases the amount of clothes on the
floor. The increase in the cleanliness of the room again reduces the
Roommate’s complaining.
Kevin’s roommate is not the only one who grows sick of seeing all
of Kevin’s laundry on the floor. Eventually Kevin realizes that he himself
is unable to find the papers that he needs for class or the pizza that he had
ordered the night before. Kevin can really only tolerate a maximum of
eight articles of clothing on the floor before his messiness seriously begins
to impede his lifestyle. When Kevin changes his clothes, he always drops
them on the floor. If he feels that his floor is too cluttered, or his
Roommate complains, he then goes through the trouble of picking up the
clothes.
The assignment required participants to create a “Cleanliness of a College Dorm
Room” model to reflect both Kevin’s reaction to excessive laundry buildup and Kevin’s
D-4870-1 6
reaction to his Roommate’s complaining. The actual system produces damped
oscillations, so the “Cleanliness of a College Dorm Room” model was expected to
produce damped oscillations also.2
To use this paper effectively requires active participation in building, testing, and
evaluating each model presented. However, instead of building the model yourself from
the description above, build the exact models presented in each section by following the
given directions located in the Appendix.
4. FIRST ATTEMPT: USING A “GAP” VARIABLE
To focus our attention on the specific “Gap” variable formulation error, we will
analyze a model that is correct except for a single formulation structure. All variables,
flows, and constants included in the incorrect formulation structure appear in bold in both
the model diagram below and in the model documentation located in the Appendix.
Build the model in Vensim using the model diagram below and the model
documentation located in the Appendix under “Modeling the System using a “Gap”
Variable.” The model will be modified in successive attempts at modeling the system as
we progress through different formulation structures. The iterative process of
formulating a model, evaluating model behavior to discover formulation errors, and
eventually changing the model formulation and beginning the process again is key to
developing robust models. The process also is key in learning more about the system we
are studying.
2 See GSP Assignment 30
D-4870-1 7
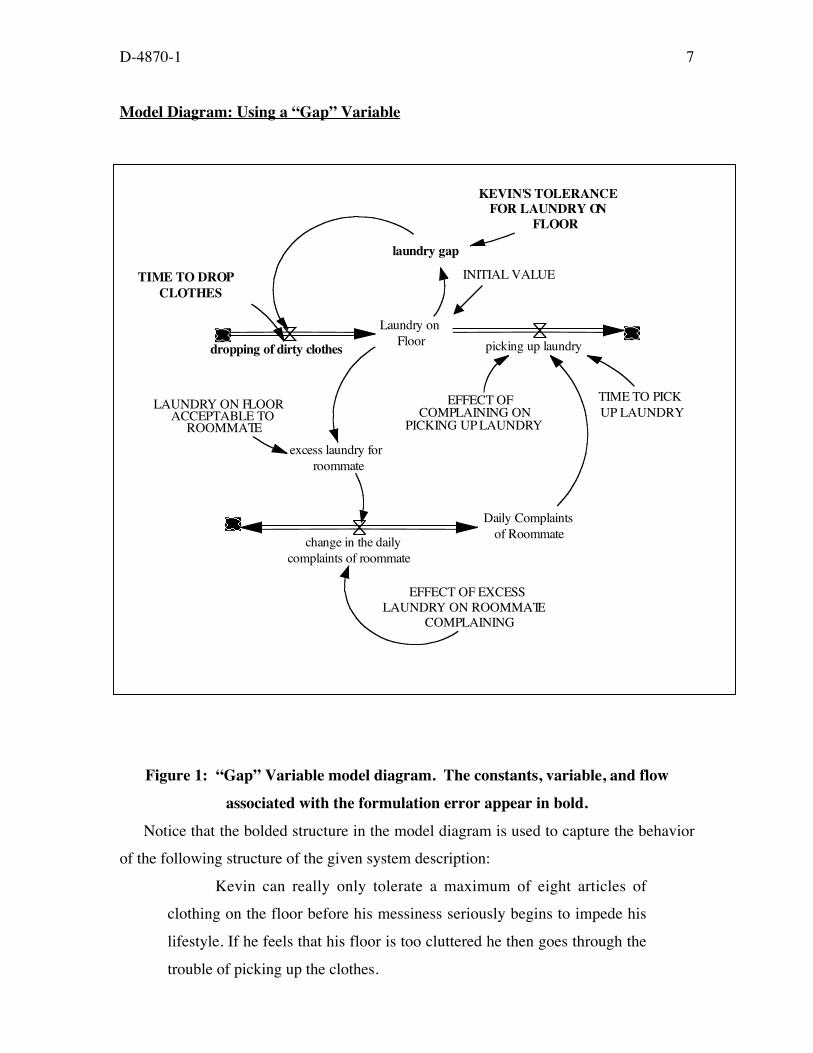
Model Diagram: Using a “Gap” Variable
Figure 1: “Gap” Variable model diagram. The constants, variable, and flow
associated with the formulation error appear in bold.
Notice that the bolded structure in the model diagram is used to capture the behavior
of the following structure of the given system description:
Kevin can really only tolerate a maximum of eight articles of
clothing on the floor before his messiness seriously begins to impede his
lifestyle. If he feels that his floor is too cluttered he then goes through the
trouble of picking up the clothes.
Laundry onFloor
dropping of dirty clothes
LAUNDRY ON FLOORACCEPTABLE TO
ROOMMATE
excess laundry forroommate
Daily Complaintsof Roommate
change in the dailycomplaints of roommate
EFFECT OF EXCESSLAUNDRY ON ROOMMATE
COMPLAINING
picking up laundry
EFFECT OFCOMPLAINING ON
PICKING UP LAUNDRY
KEVIN'S TOLERANCEFOR LAUNDRY ON
FLOOR
TIME TO PICKUP LAUNDRY
laundry gap
TIME TO DROPCLOTHES
INITIAL VALUE

D-4870-1 8
D-4870-1 9
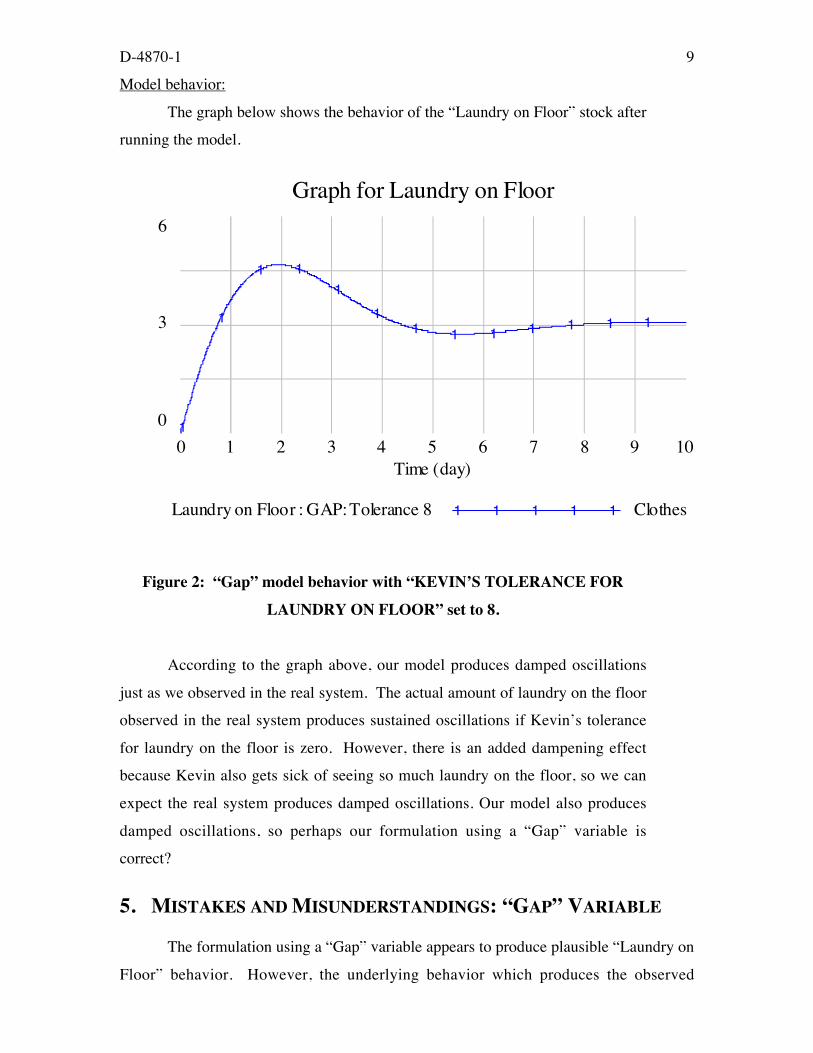
Model behavior:
The graph below shows the behavior of the “Laundry on Floor” stock after
running the model.
Figure 2: “Gap” model behavior with “KEVIN’S TOLERANCE FOR
LAUNDRY ON FLOOR” set to 8.
According to the graph above, our model produces damped oscillations
just as we observed in the real system. The actual amount of laundry on the floor
observed in the real system produces sustained oscillations if Kevin’s tolerance
for laundry on the floor is zero. However, there is an added dampening effect
because Kevin also gets sick of seeing so much laundry on the floor, so we can
expect the real system produces damped oscillations. Our model also produces
damped oscillations, so perhaps our formulation using a “Gap” variable is
correct?
5. MISTAKES AND MISUNDERSTANDINGS: “GAP” VARIABLE
The formulation using a “Gap” variable appears to produce plausible “Laundry on
Floor” behavior. However, the underlying behavior which produces the observed
Graph for Laundry on Floor
6
3
0 1
1
1 1
1
11 1 1 1 1 1 1
0 1 2 3 4 5 6 7 8 9 10Time (day)
Laundry on Floor : GAP: Tolerance 8 Clothes1 1 1 1 1
D-4870-1 10
damped oscillations needs to be further explored to validate that our formulation is
correct. Determining the causes of the observed behavior by changing parameter values
and tracing the effects through the model allows us to test the model formulation.
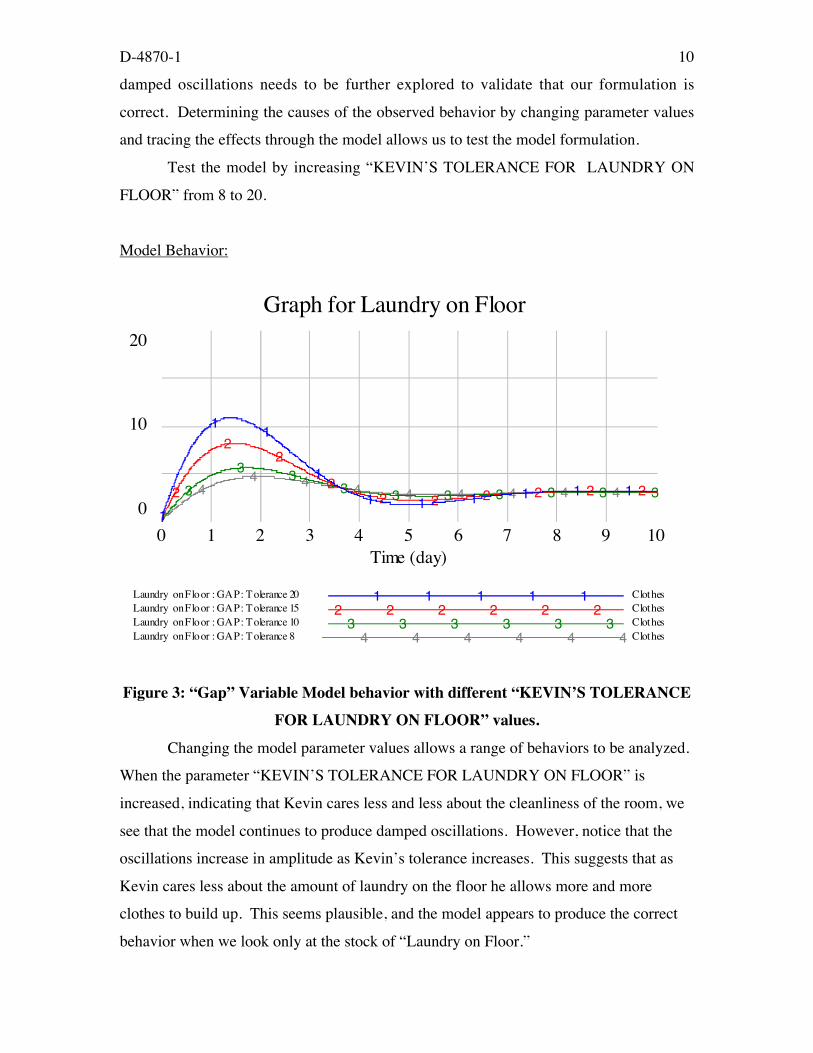
Test the model by increasing “KEVIN’S TOLERANCE FOR LAUNDRY ON
FLOOR” from 8 to 20.
Model Behavior:
Figure 3: “Gap” Variable Model behavior with different “KEVIN’S TOLERANCE
FOR LAUNDRY ON FLOOR” values.
Changing the model parameter values allows a range of behaviors to be analyzed.
When the parameter “KEVIN’S TOLERANCE FOR LAUNDRY ON FLOOR” is
increased, indicating that Kevin cares less and less about the cleanliness of the room, we
see that the model continues to produce damped oscillations. However, notice that the
oscillations increase in amplitude as Kevin’s tolerance increases. This suggests that as
Kevin cares less about the amount of laundry on the floor he allows more and more
clothes to build up. This seems plausible, and the model appears to produce the correct
behavior when we look only at the stock of “Laundry on Floor.”
Graph for Laundry on Floor
20
10
04
4 4 4 4 4 4 4 43
3 33 3 3 3 3 3 32
22
22 2 2 2 2 2
1
11
1
1 1 1 1 1 1
0 1 2 3 4 5 6 7 8 9 10Time (day)
Laundry on Floor : GAP: Tolerance 20 Clothes1 1 1 1 1Laundry on Floor : GAP: Tolerance 15 Clothes2 2 2 2 2 2Laundry on Floor : GAP: Tolerance 10 Clothes3 3 3 3 3 3Laundry on Floor : GAP: Tolerance 8 Clothes4 4 4 4 4 4
D-4870-1 11
We now need to trace the causes of the observed “Laundry on Floor” behavior in
order to validate our formulation. One structure causing the observed “Laundry on
Floor” behavior is the outflow from the stock “picking up laundry.”
D-4870-1 12
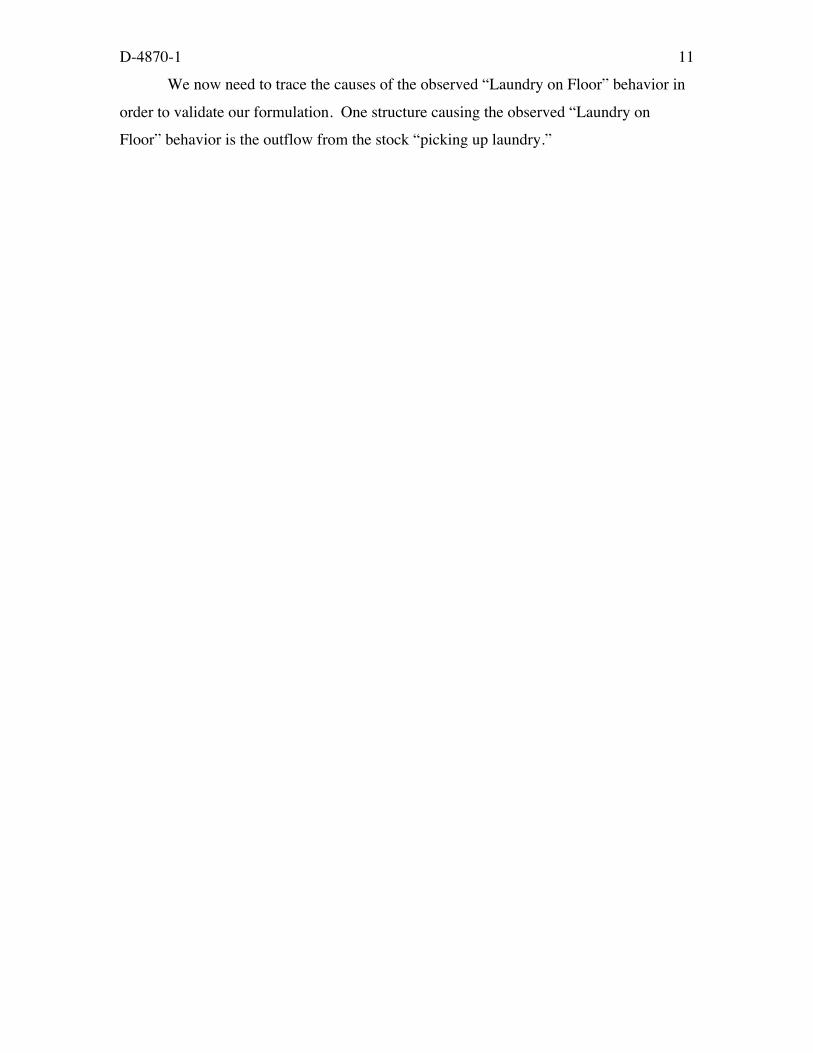
Model Behavior:
Figure 4: “Gap” Variable model run for outflow “picking up laundry” with
different tolerance levels.
Here is where the errors of the “Gap” variable formulation become
apparent. In Figure 4 we notice that as Kevin’s Tolerance level increases from 8 to
20, Kevin picks up more and more clothes. In the real system, this means that as
Kevin cares less and less about the cleanliness of his room, at an equilibrium level he
picks up more clothes. This does not seem realistic, so we continue tracing the
“Laundry on Floor” causes to discover why Kevin picks up more clothes as he cares
less about the cleanliness of the dorm room.
Graph for picking up laundry
20
10
0 44
4 4 4 4 4 4 4
33
33 3 3 3 3 3 3
2
2
2
2 22 2 2 2 2
1
1
1
1 11
1 1 1 1
0 1 2 3 4 5 6 7 8 9 10Time (day)
p icking up laundry : GAP: Tolerance 20 Clothes/day1 1 1 1 1p icking up laundry : GAP: Tolerance 15 Clothes/day2 2 2 2 2 2p icking up laundry : GAP: Tolerance 10 Clothes/day3 3 3 3 3p icking up laundry : GAP: Tolerance 8 Clothes/day4 4 4 4 4
D-4870-1 13
Model Behavior:
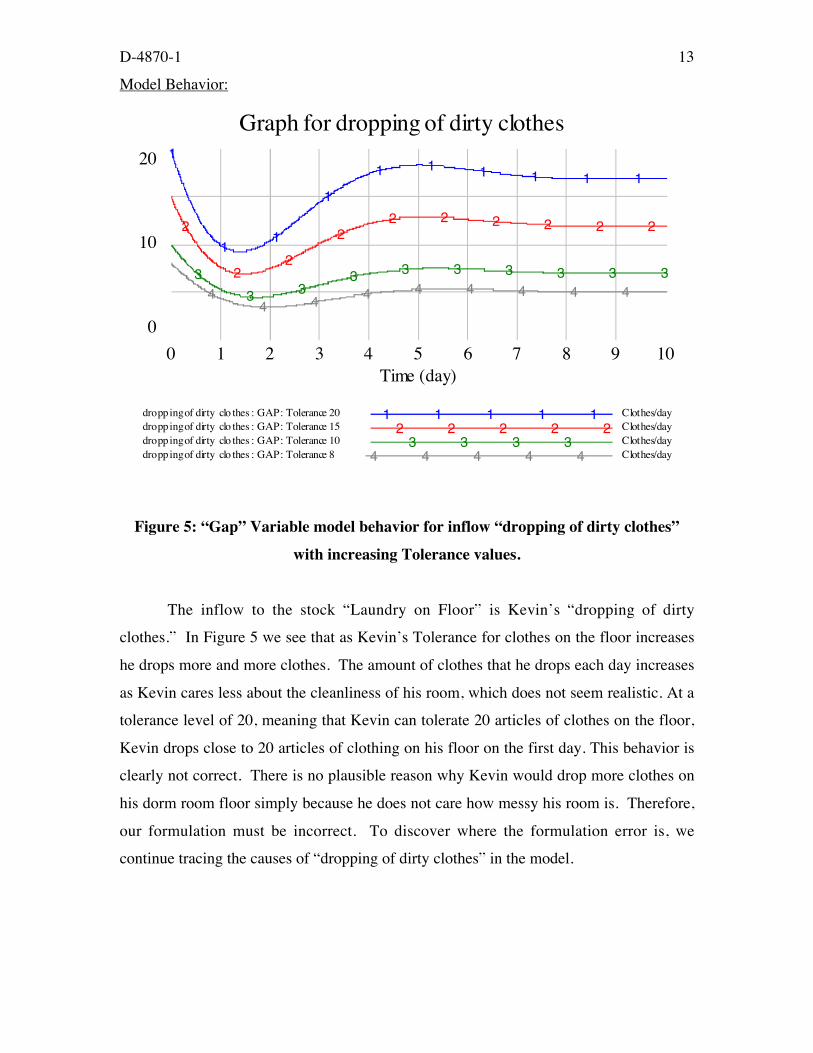
Figure 5: “Gap” Variable model behavior for inflow “dropping of dirty clothes”
with increasing Tolerance values.
The inflow to the stock “Laundry on Floor” is Kevin’s “dropping of dirty
clothes.” In Figure 5 we see that as Kevin’s Tolerance for clothes on the floor increases
he drops more and more clothes. The amount of clothes that he drops each day increases
as Kevin cares less about the cleanliness of his room, which does not seem realistic. At a
tolerance level of 20, meaning that Kevin can tolerate 20 articles of clothes on the floor,
Kevin drops close to 20 articles of clothing on his floor on the first day. This behavior is
clearly not correct. There is no plausible reason why Kevin would drop more clothes on
his dorm room floor simply because he does not care how messy his room is. Therefore,
our formulation must be incorrect. To discover where the formulation error is, we
continue tracing the causes of “dropping of dirty clothes” in the model.
Graph for dropping of dirty clothes
20
10
0
44 4 4 4 4 4 4 4
3
3 33 3 3 3 3 3 3
2
22
22 2 2 2 2 2
1
11
1
1 1 1 1 1 1
0 1 2 3 4 5 6 7 8 9 10Time (day)
dropping of dirty clo thes : GAP: Tolerance 20 Clothes/day1 1 1 1 1dropping of dirty clo thes : GAP: Tolerance 15 Clothes/day2 2 2 2 2dropping of dirty clo thes : GAP: Tolerance 10 Clothes/day3 3 3 3dropping of dirty clo thes : GAP: Tolerance 8 Clothes/day4 4 4 4 4

D-4870-1 14

D-4870-1 15
Model Behavior:
Figure 6: “Gap” Variable model behavior for “laundry gap” with increasing
Tolerance values.
The “Gap” variable is the error in our formulation. The “Gap” variable is the
difference between “KEVIN’S TOLERANCE FOR LAUNDRY ON FLOOR” and the
“Laundry on Floor,” so it varies proportionately with Kevin’s tolerance level. As
Kevin’s tolerance increases or decreases, so does the “Gap” variable, and the oscillating
effect is propagated through the system to produce the damped oscillations observed in
the “Laundry on Floor” stock. Notice how the increasing parameter values produce
erroneous behavior not immediately obvious in the stock “Laundry on Floor,” but rather
the errors become apparent in the inflow “dropping of dirty clothes.” Gap variables are
useful, but care must be taken to ensure the behavior produced is plausible. When using
Gap variables it is important to ensure that the input range is realistic and stated explicitly
in the model assumptions.
Another simple test that the “Gap” variable model fails is performed by increasing
the Initial Value of the “Laundry on Floor” stock. Set the “Laundry on Floor” Initial
value to 0 with a Tolerance of 8, then set the Initial Value to 8 with the same tolerance
Graph for laundrygap20
10
0
44 4 4 4 4 4 4 4
3
3 33 3 3 3 3 3 3
2
22
22 2 2 2 2 2
1
11
1
1 1 1 1 1 1
0 1 2 3 4 5 6 7 8 9 10Time (day)
laundry gap : GAP: Tolerance 20 Clothes1 1 1 1 1 1laundry gap : GAP: Tolerance 15 Clothes2 2 2 2 2 2laundry gap : GAP: Tolerance 10 Clothes3 3 3 3 3 3laundry gap : GAP: Tolerance 8 Clothes4 4 4 4 4 4 4
D-4870-1 16
level. Simulate the model to test the effect that different Initial Values has on model
behavior.
Model Behavior:
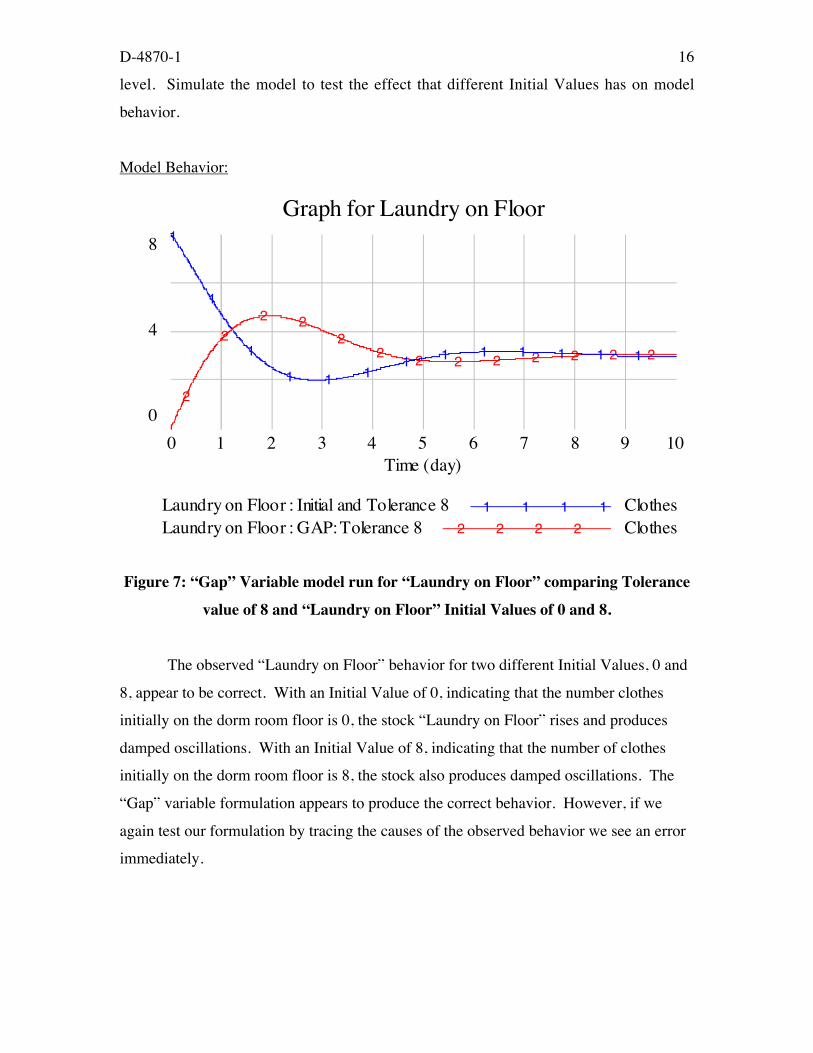
Figure 7: “Gap” Variable model run for “Laundry on Floor” comparing Tolerance
value of 8 and “Laundry on Floor” Initial Values of 0 and 8.
The observed “Laundry on Floor” behavior for two different Initial Values, 0 and
8, appear to be correct. With an Initial Value of 0, indicating that the number clothes
initially on the dorm room floor is 0, the stock “Laundry on Floor” rises and produces
damped oscillations. With an Initial Value of 8, indicating that the number of clothes
initially on the dorm room floor is 8, the stock also produces damped oscillations. The
“Gap” variable formulation appears to produce the correct behavior. However, if we
again test our formulation by tracing the causes of the observed behavior we see an error
immediately.
Graph for Laundry on Floor
8
4
02
22 2
22 2 2 2 2 2 2 2
1
1
1
1 1 11 1 1 1 1 1 1
0 1 2 3 4 5 6 7 8 9 10Time (day)
Laundry on Floor : Initial and Tolerance 8 Clothes1 1 1 1
Laundry on Floor : GAP: Tolerance 8 Clothes2 2 2 2
D-4870-1 17
Model Behavior:
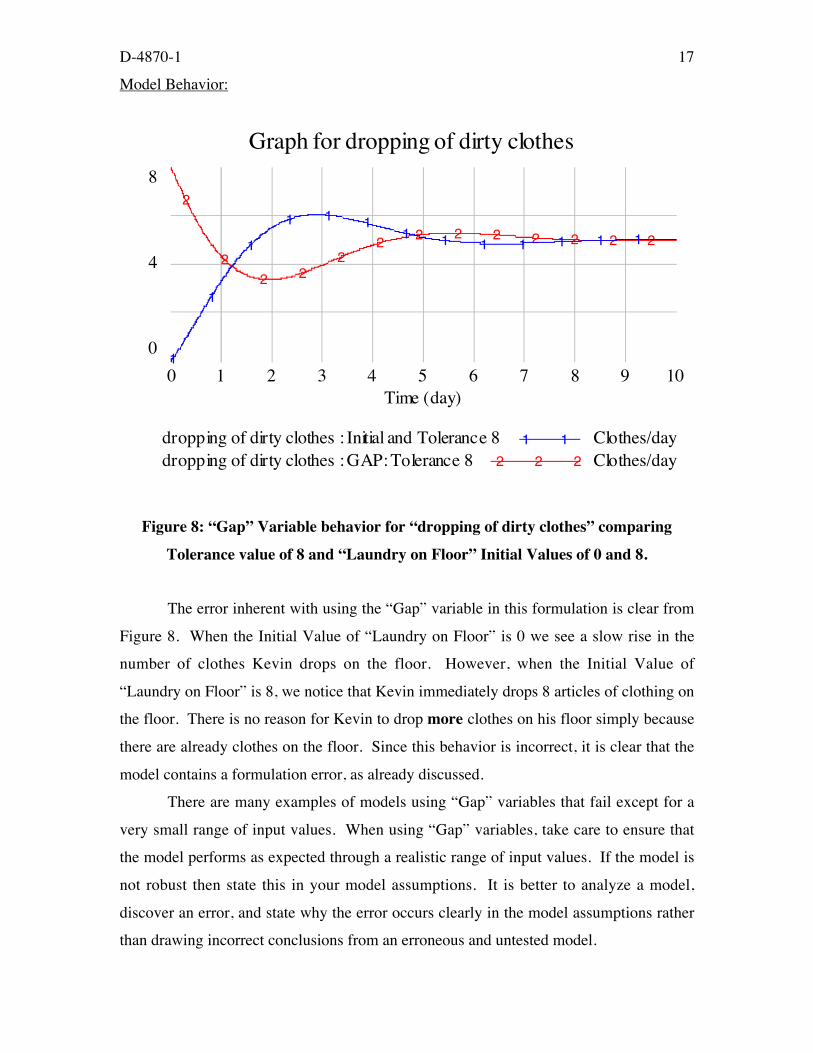
Figure 8: “Gap” Variable behavior for “dropping of dirty clothes” comparing
Tolerance value of 8 and “Laundry on Floor” Initial Values of 0 and 8.
The error inherent with using the “Gap” variable in this formulation is clear from
Figure 8. When the Initial Value of “Laundry on Floor” is 0 we see a slow rise in the
number of clothes Kevin drops on the floor. However, when the Initial Value of
“Laundry on Floor” is 8, we notice that Kevin immediately drops 8 articles of clothing on
the floor. There is no reason for Kevin to drop more clothes on his floor simply because
there are already clothes on the floor. Since this behavior is incorrect, it is clear that the
model contains a formulation error, as already discussed.
There are many examples of models using “Gap” variables that fail except for a
very small range of input values. When using “Gap” variables, take care to ensure that
the model performs as expected through a realistic range of input values. If the model is
not robust then state this in your model assumptions. It is better to analyze a model,
discover an error, and state why the error occurs clearly in the model assumptions rather
than drawing incorrect conclusions from an erroneous and untested model.
Graph for dropping of dirty clothes
8
4
0
2
22 2
22 2 2 2 2 2 2 2
1
1
1
1 1 11 1 1 1 1 1 1
0 1 2 3 4 5 6 7 8 9 10Time (day)
dropping of dirty clothes : Initial and Tolerance 8 Clothes/day1 1
dropping of dirty clothes : GAP: Tolerance 8 Clothes/day2 2 2
D-4870-1 18
6. SECOND ATTEMPT: USING A MIN FUNCTION AND “GAP”
VARIABLE
Another common formulation error uses a “Gap” variable combined with a MIN
function. MIN (Minimum) functions are frequently used incorrectly with Gap variables
because modelers discover problems while using “Gap” variables, as analyzed
previously, and try to fix the problem. As is common with formulation errors imbedded
in an otherwise correct model, we will see that the model behavior appears plausible over
a small range of parameter values. The causes for the seemingly correct behavior are
then traced to an incorrect formulation producing unrealistic behavior.
The “MIN Gap” formulation structure appears to solve the problems associated
with the “Gap” formulation. The inflow “dropping of dirty clothes” is the MIN
(Minimum) of a constant dropping value and the “Gap” variable. This appears to solves
the problems of the “Gap” variable because “dropping of dirty clothes” never goes above
the constant dropping amount. As we will see, however, the present solution replaces
one formulation error with another.
Build the “MIN Gap” model as follows: change the “Gap” model we built in the
previous section into the “MIN Gap” model by using the Model Diagram below and by
following the instructions located in the Appendix under Modeling the System Using
MIN and Gap Variables.
D-4870-1 19
Model Diagram
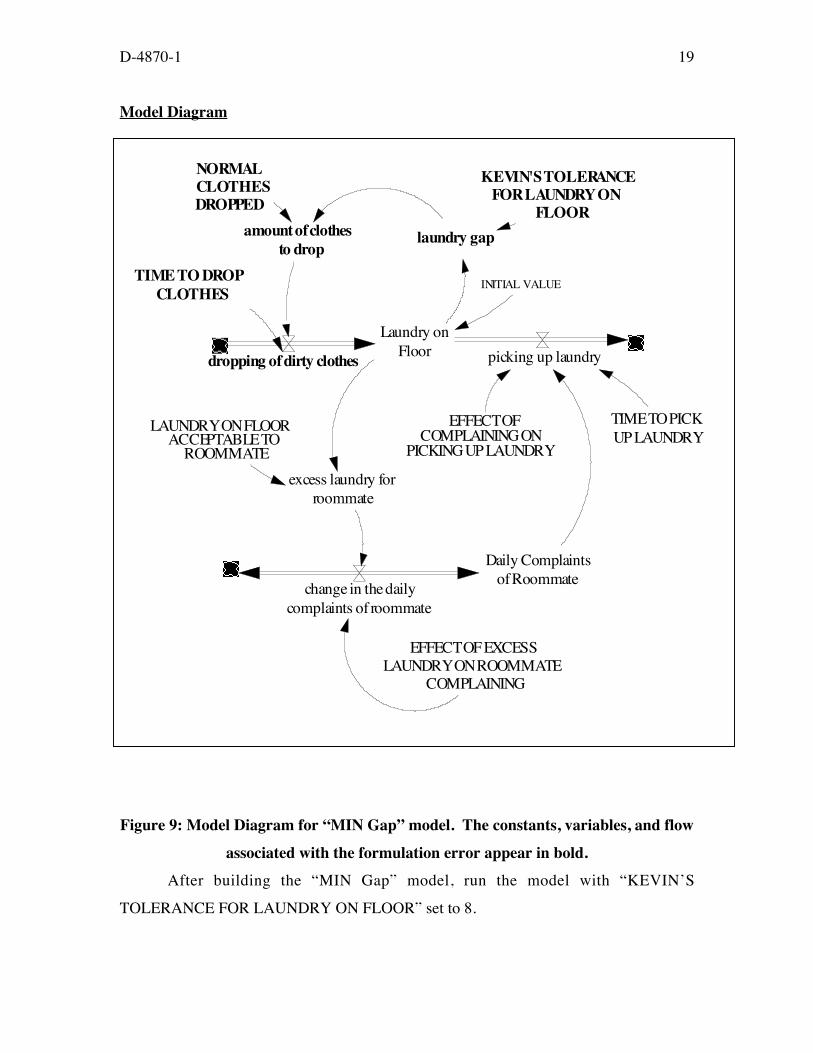
Figure 9: Model Diagram for “MIN Gap” model. The constants, variables, and flow
associated with the formulation error appear in bold.
After building the “MIN Gap” model, run the model with “KEVIN’S
TOLERANCE FOR LAUNDRY ON FLOOR” set to 8.
Laundry onFloor
dropping of dirty clothes
LAUNDRY ON FLOORACCEPTABLE TO
ROOMMATE
excess laundry forroommate
Daily Complaintsof Roommate
change in the dailycomplaints of roommate
EFFECT OF EXCESSLAUNDRY ON ROOMMATE
COMPLAINING
picking up laundry
EFFECT OFCOMPLAINING ON
PICKING UP LAUNDRY
KEVIN'S TOLERANCEFOR LAUNDRY ON
FLOOR
TIME TO PICKUP LAUNDRY
laundry gap
TIME TO DROPCLOTHES
NORMALCLOTHESDROPPED
amount of clothesto drop
INITIAL VALUE
D-4870-1 20
Model Behavior:
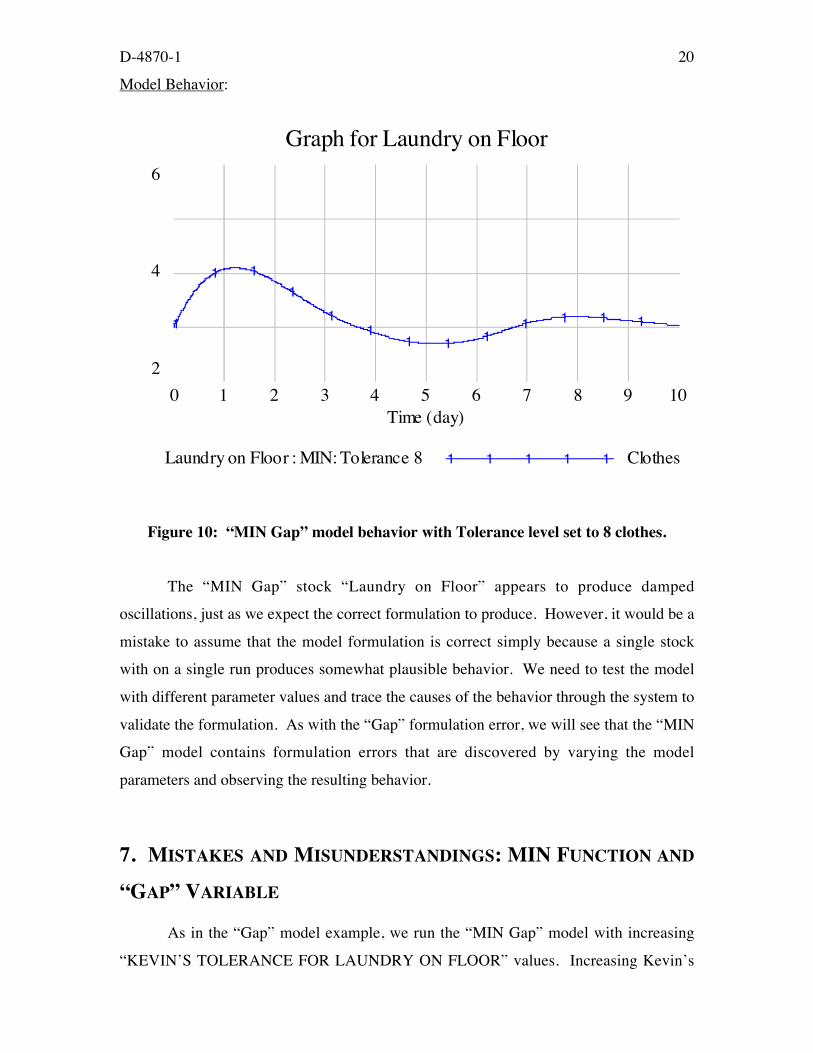
Figure 10: “MIN Gap” model behavior with Tolerance level set to 8 clothes.
The “MIN Gap” stock “Laundry on Floor” appears to produce damped
oscillations, just as we expect the correct formulation to produce. However, it would be a
mistake to assume that the model formulation is correct simply because a single stock
with on a single run produces somewhat plausible behavior. We need to test the model
with different parameter values and trace the causes of the behavior through the system to
validate the formulation. As with the “Gap” formulation error, we will see that the “MIN
Gap” model contains formulation errors that are discovered by varying the model
parameters and observing the resulting behavior.
7. MISTAKES AND MISUNDERSTANDINGS: MIN FUNCTION AND
“GAP” VARIABLE
As in the “Gap” model example, we run the “MIN Gap” model with increasing
“KEVIN’S TOLERANCE FOR LAUNDRY ON FLOOR” values. Increasing Kevin’s
Graph for Laundry on Floor
6
4
2
1
1 1
1
11
1 1 11 1 1 1
0 1 2 3 4 5 6 7 8 9 10Time (day)
Laundry on Floor : MIN: Tolerance 8 Clothes1 1 1 1 1
D-4870-1 21
Tolerance level for laundry on the floor explores situations where Kevin cares less and
less about the cleanliness of his room.
Model Behavior:
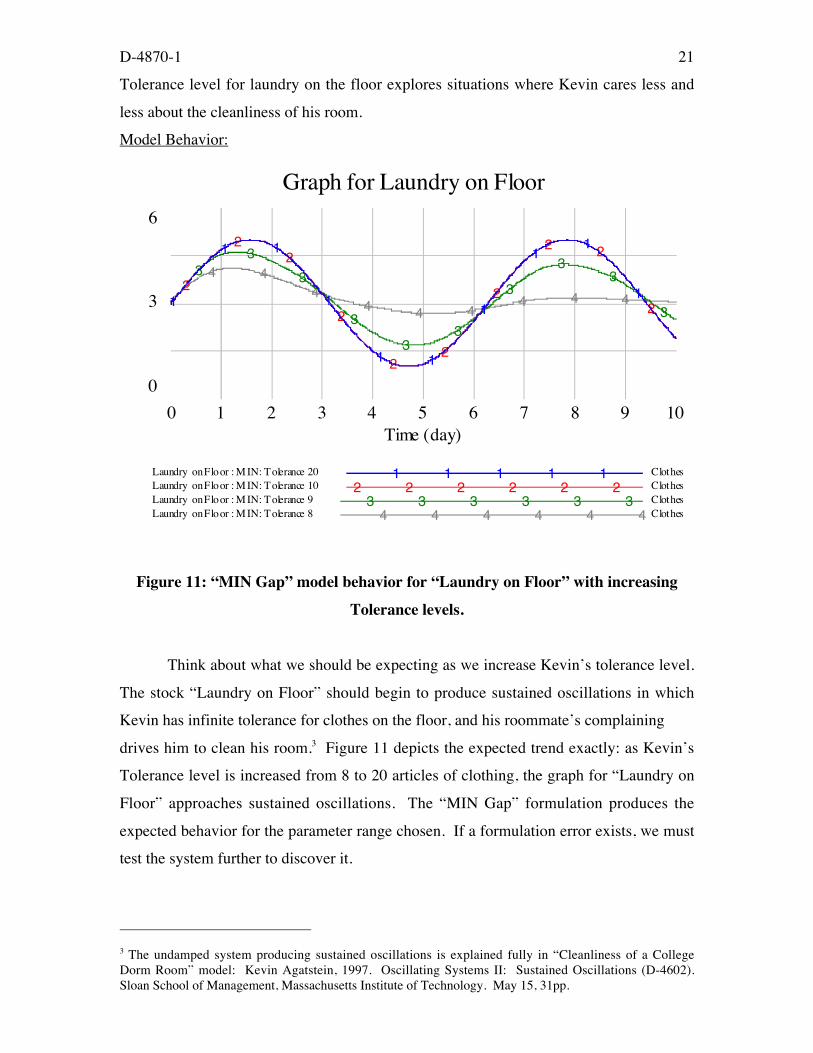
Figure 11: “MIN Gap” model behavior for “Laundry on Floor” with increasing
Tolerance levels.
Think about what we should be expecting as we increase Kevin’s tolerance level.
The stock “Laundry on Floor” should begin to produce sustained oscillations in which
Kevin has infinite tolerance for clothes on the floor, and his roommate’s complaining
drives him to clean his room.3 Figure 11 depicts the expected trend exactly: as Kevin’s
Tolerance level is increased from 8 to 20 articles of clothing, the graph for “Laundry on
Floor” approaches sustained oscillations. The “MIN Gap” formulation produces the
expected behavior for the parameter range chosen. If a formulation error exists, we must
test the system further to discover it.
3 The undamped system producing sustained oscillations is explained fully in “Cleanliness of a CollegeDorm Room” model: Kevin Agatstein, 1997. Oscillating Systems II: Sustained Oscillations (D-4602).Sloan School of Management, Massachusetts Institute of Technology. May 15, 31pp.
Graph for Laundry on Floor
6
3
0
4 44
4 4 44 4 4
33
3
3
33
3
33
3
2
22
2
22
2
2 2
21
1 1
1
1 1
1
11
1
0 1 2 3 4 5 6 7 8 9 10Time (day)
Laundry on Floor : M IN: Tolerance 20 Clothes1 1 1 1 1Laundry on Floor : M IN: Tolerance 10 Clothes2 2 2 2 2 2Laundry on Floor : M IN: Tolerance 9 Clothes3 3 3 3 3 3Laundry on Floor : M IN: Tolerance 8 Clothes4 4 4 4 4 4

D-4870-1 22
D-4870-1 23
Model Behavior:
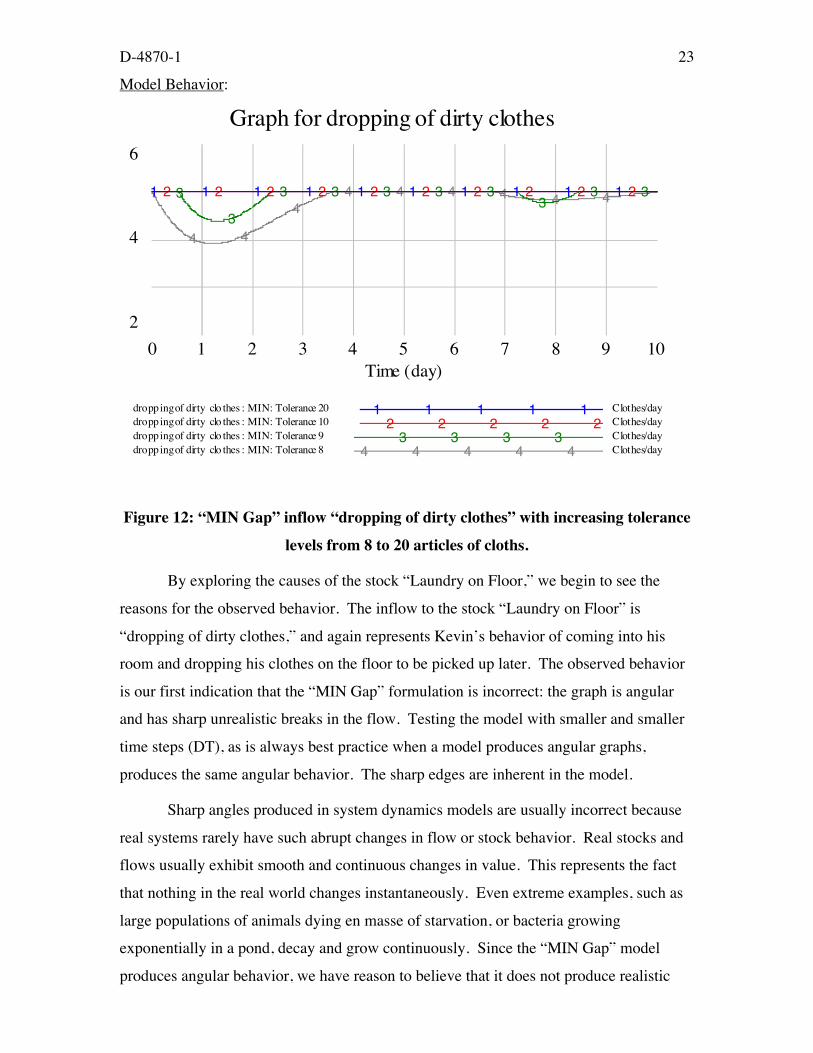
Figure 12: “MIN Gap” inflow “dropping of dirty clothes” with increasing tolerance
levels from 8 to 20 articles of cloths.
By exploring the causes of the stock “Laundry on Floor,” we begin to see the
reasons for the observed behavior. The inflow to the stock “Laundry on Floor” is
“dropping of dirty clothes,” and again represents Kevin’s behavior of coming into his
room and dropping his clothes on the floor to be picked up later. The observed behavior
is our first indication that the “MIN Gap” formulation is incorrect: the graph is angular
and has sharp unrealistic breaks in the flow. Testing the model with smaller and smaller
time steps (DT), as is always best practice when a model produces angular graphs,
produces the same angular behavior. The sharp edges are inherent in the model.
Sharp angles produced in system dynamics models are usually incorrect because
real systems rarely have such abrupt changes in flow or stock behavior. Real stocks and
flows usually exhibit smooth and continuous changes in value. This represents the fact
that nothing in the real world changes instantaneously. Even extreme examples, such as
large populations of animals dying en masse of starvation, or bacteria growing
exponentially in a pond, decay and grow continuously. Since the “MIN Gap” model
produces angular behavior, we have reason to believe that it does not produce realistic
Graph for dropping of dirty clothes
6
4
2
4 4
44 4 4 4 4 43
3
3 3 3 3 33
3 32 2 2 2 2 2 2 2 2 21 1 1 1 1 1 1 1 1 1
0 1 2 3 4 5 6 7 8 9 10Time (day)
dropping of dirty clo thes : MIN: Tolerance 20 Clothes/day1 1 1 1 1dropping of dirty clo thes : MIN: Tolerance 10 Clothes/day2 2 2 2 2dropping of dirty clo thes : MIN: Tolerance 9 Clothes/day3 3 3 3dropping of dirty clo thes : MIN: Tolerance 8 Clothes/day4 4 4 4 4
D-4870-1 24
behavior and contains a formulation error. However, this error is subtle, as many
modelers continue to argue that angular behavior is realistic. To prove that the “MIN
Gap” formulation is erroneous as used in this system, we test the model using a
decreasing parameter values.
Model Behavior:
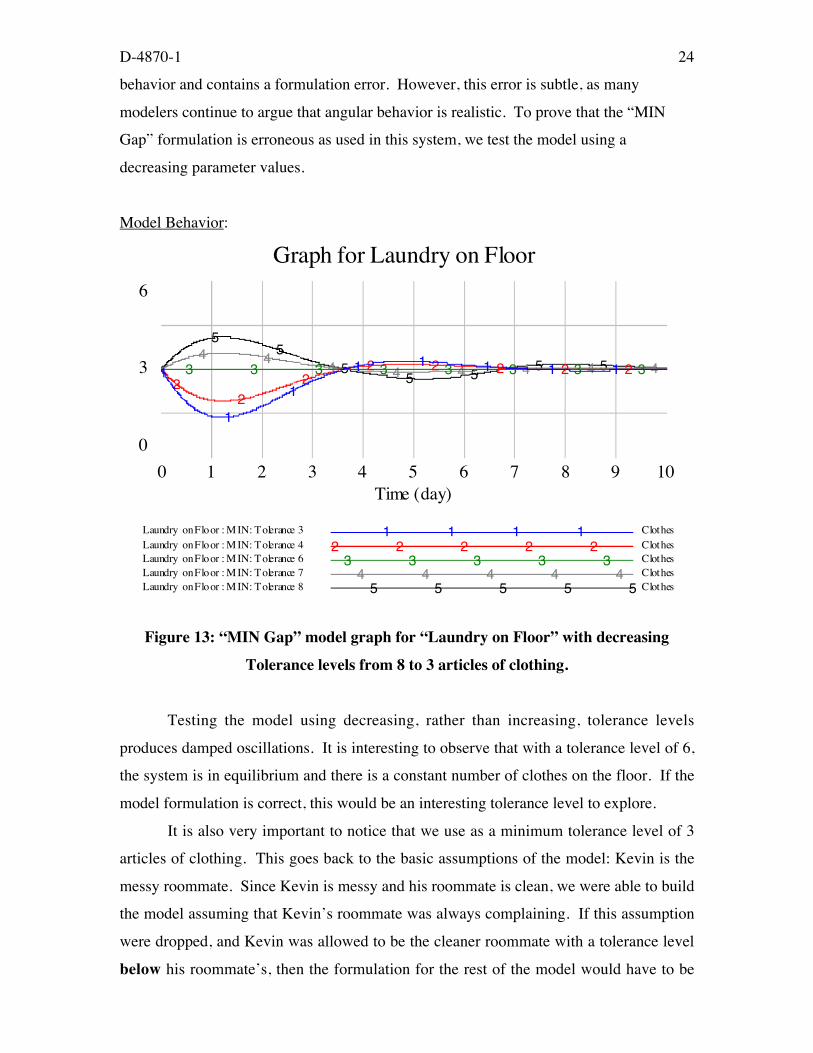
Figure 13: “MIN Gap” model graph for “Laundry on Floor” with decreasing
Tolerance levels from 8 to 3 articles of clothing.
Testing the model using decreasing, rather than increasing, tolerance levels
produces damped oscillations. It is interesting to observe that with a tolerance level of 6,
the system is in equilibrium and there is a constant number of clothes on the floor. If the
model formulation is correct, this would be an interesting tolerance level to explore.
It is also very important to notice that we use as a minimum tolerance level of 3
articles of clothing. This goes back to the basic assumptions of the model: Kevin is the
messy roommate. Since Kevin is messy and his roommate is clean, we were able to build
the model assuming that Kevin’s roommate was always complaining. If this assumption
were dropped, and Kevin was allowed to be the cleaner roommate with a tolerance level
below his roommate’s, then the formulation for the rest of the model would have to be
Graph for Laundry on Floor
6
3
0
55
55 5
5 54 4
4 4 4 4 4 43 3 3 3 3 3 3 32
22
2 2 2 2 21
1
1
1 1 1 1 1
0 1 2 3 4 5 6 7 8 9 10Time (day)
Laundry on Floor : M IN: Tolerance 3 Clothes1 1 1 1Laundry on Floor : M IN: Tolerance 4 Clothes2 2 2 2 2Laundry on Floor : M IN: Tolerance 6 Clothes3 3 3 3 3Laundry on Floor : M IN: Tolerance 7 Clothes4 4 4 4 4Laundry on Floor : M IN: Tolerance 8 Clothes5 5 5 5 5
D-4870-1 25
modified. Since the system description led us to assume that Kevin was the messy
roommate, we are forced to state the assumption clearly and test the model only within
the bounds of our assumption. Hence, the Kevin’s minimum tolerance level must be
greater than or equal to his roommate’s tolerance level of 3 clothes on the floor.
Besides the angular inflow of “dropping of dirty clothes,” the “MIN Gap”
formulation appears to be correct. Real evidence of the formulation error appears as we
look at the inflow again with decreasing tolerance levels.
Model Behavior:
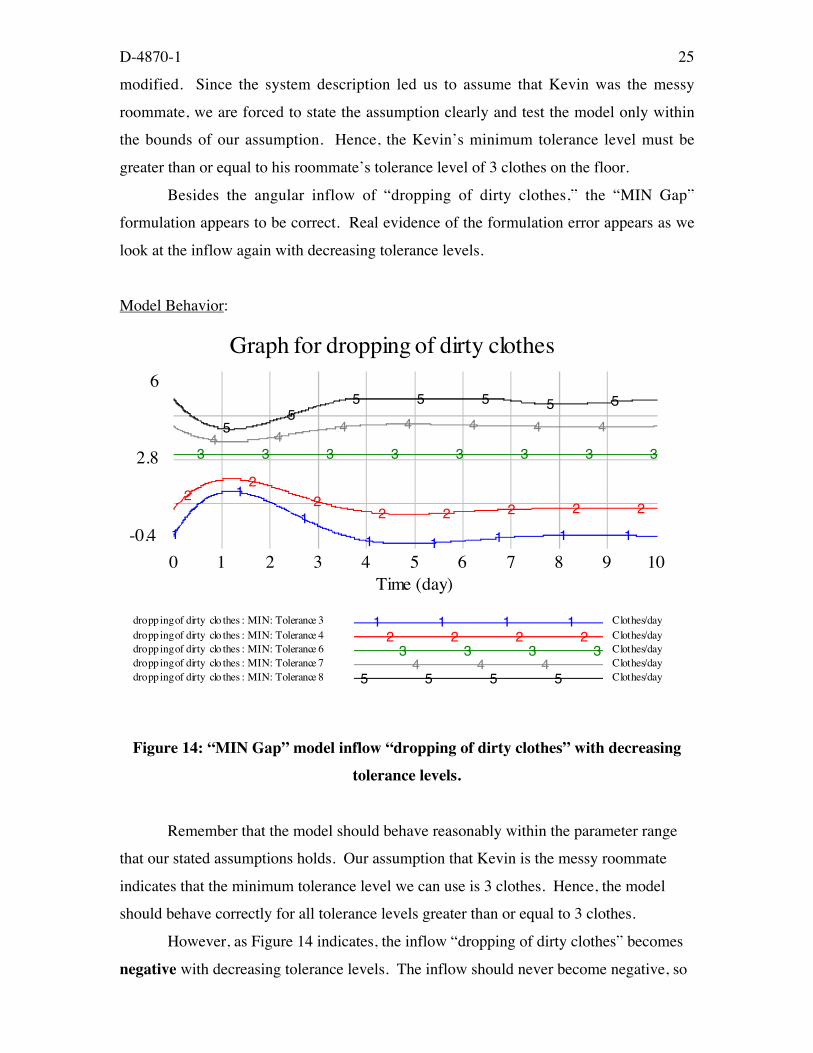
Figure 14: “MIN Gap” model inflow “dropping of dirty clothes” with decreasing
tolerance levels.
Remember that the model should behave reasonably within the parameter range
that our stated assumptions holds. Our assumption that Kevin is the messy roommate
indicates that the minimum tolerance level we can use is 3 clothes. Hence, the model
should behave correctly for all tolerance levels greater than or equal to 3 clothes.
However, as Figure 14 indicates, the inflow “dropping of dirty clothes” becomes
negative with decreasing tolerance levels. The inflow should never become negative, so
Graph for dropping of dirty clothes
6
2.8
-0.4
55
5 5 5 5 5
4 44 4 4 4 4
3 3 3 3 3 3 3 3
22
22 2 2 2 2
1
1
1
1 1 1 1 1
0 1 2 3 4 5 6 7 8 9 10Time (day)
dropping of dirty clo thes : MIN: Tolerance 3 Clothes/day1 1 1 1dropping of dirty clo thes : MIN: Tolerance 4 Clothes/day2 2 2 2dropping of dirty clo thes : MIN: Tolerance 6 Clothes/day3 3 3 3dropping of dirty clo thes : MIN: Tolerance 7 Clothes/day4 4 4dropping of dirty clo thes : MIN: Tolerance 8 Clothes/day5 5 5 5
D-4870-1 26
we know there is a formulation error. Exploring different initial “Laundry on Floor”
values with decreasing tolerance levels produces the strongest evidence that the
formulation is incorrect. Remember that we are testing the model only within the bounds
of the assumption, and there are no restrictions on the initial value of the model (except,
of course, we cannot have a negative number of clothes initially on the floor).
D-4870-1 27
Model Behavior:
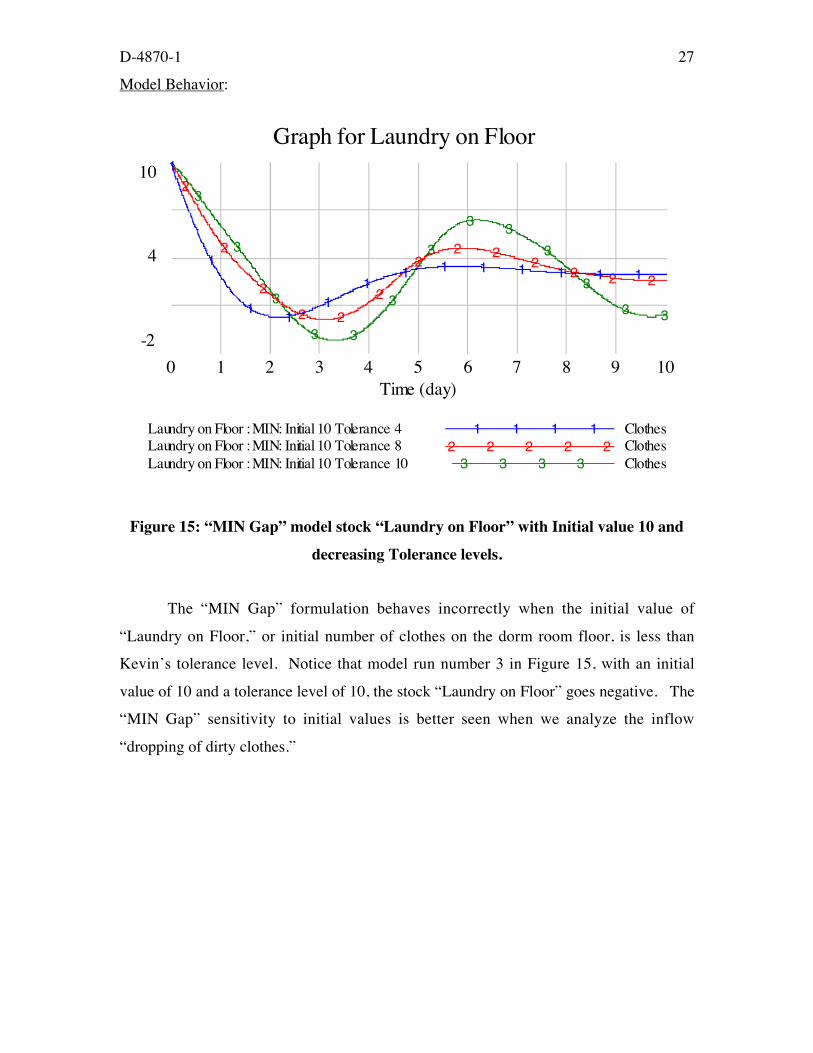
Figure 15: “MIN Gap” model stock “Laundry on Floor” with Initial value 10 and
decreasing Tolerance levels.
The “MIN Gap” formulation behaves incorrectly when the initial value of
“Laundry on Floor,” or initial number of clothes on the dorm room floor, is less than
Kevin’s tolerance level. Notice that model run number 3 in Figure 15, with an initial
value of 10 and a tolerance level of 10, the stock “Laundry on Floor” goes negative. The
“MIN Gap” sensitivity to initial values is better seen when we analyze the inflow
“dropping of dirty clothes.”
Graph for Laundry on Floor
10
4
-2
3
3
3
3 3
3
3
3 3
3
3
3 3
2
2
2
2 2
2
22 2
22 2 2
1
1
11
11
1 1 1 1 1 1 1
0 1 2 3 4 5 6 7 8 9 10Time (day)
Laundry on Floor : MIN: Initial 10 Tolerance 4 Clothes1 1 1 1Laundry on Floor : MIN: Initial 10 Tolerance 8 Clothes2 2 2 2 2Laundry on Floor : MIN: Initial 10 Tolerance 10 Clothes3 3 3 3
D-4870-1 28
Model Behavior:
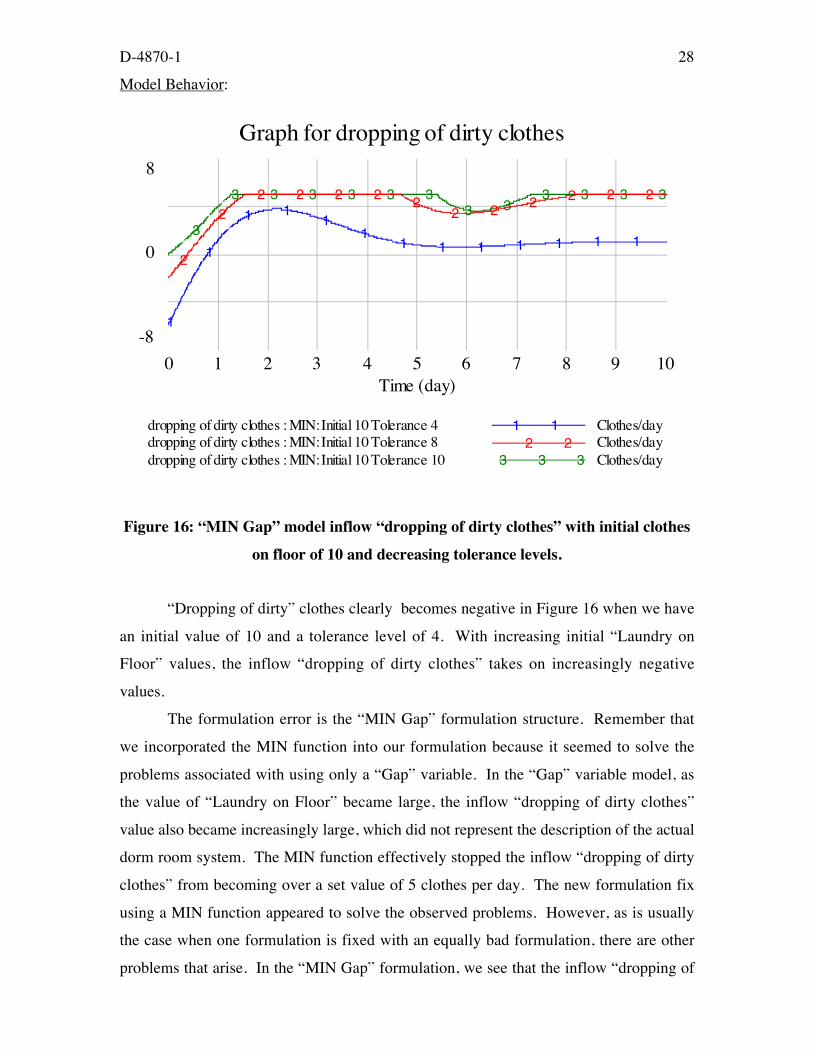
Figure 16: “MIN Gap” model inflow “dropping of dirty clothes” with initial clothes
on floor of 10 and decreasing tolerance levels.
“Dropping of dirty” clothes clearly becomes negative in Figure 16 when we have
an initial value of 10 and a tolerance level of 4. With increasing initial “Laundry on
Floor” values, the inflow “dropping of dirty clothes” takes on increasingly negative
values.
The formulation error is the “MIN Gap” formulation structure. Remember that
we incorporated the MIN function into our formulation because it seemed to solve the
problems associated with using only a “Gap” variable. In the “Gap” variable model, as
the value of “Laundry on Floor” became large, the inflow “dropping of dirty clothes”
value also became increasingly large, which did not represent the description of the actual
dorm room system. The MIN function effectively stopped the inflow “dropping of dirty
clothes” from becoming over a set value of 5 clothes per day. The new formulation fix
using a MIN function appeared to solve the observed problems. However, as is usually
the case when one formulation is fixed with an equally bad formulation, there are other
problems that arise. In the “MIN Gap” formulation, we see that the inflow “dropping of
Graph for dropping of dirty clothes
8
0
-8
3
3 3 3 3 3 33 3
3 3 3 3
2
22 2 2 2 2
2 2 2 2 2 2
1
1
1 11
11 1 1 1 1 1 1
0 1 2 3 4 5 6 7 8 9 10Time (day)
dropping of dirty clothes : MIN: Initial 10 Tolerance 4 Clothes/day1 1dropping of dirty clothes : MIN: Initial 10 Tolerance 8 Clothes/day2 2dropping of dirty clothes : MIN: Initial 10 Tolerance 10 Clothes/day3 3 3

D-4870-1 29
dirty clothes” becomes negative when the difference between the initial clothes on floor
and Kevin’s tolerance level is large. Hence, the formulation is incorrect and we are
forced to explore different formulations to model the “Cleanliness of a college dorm
room system.”
8. THIRD ATTEMPT: USING A LOOKUP FUNCTION INCORRECTLY
Formulations using “Gap” variables often produce incorrect behavior over certain
ranges of inputs. Formulations using “Gap” variables can sometimes be useful if the
input range is specified through model assumptions, and those assumptions are
reasonable. However, usually formulations with “Gap” variables are fixed with
combinations of MIN and MAX functions, just as we previously explored. These
functions seem to hide the problems associated with “Gap” variables, although the
resulting behavior is usually angular and difficult to explain because real systems do not
change instantaneously.
The best formulation for the system we are modeling uses a lookup function.
Lookup functions can be used when values must be linked to other values. For example,
the outflow from the stock “Laundry on Floor” is “picking up laundry.” The system
description indicates that as Kevin sees too much laundry on the floor he gets irritated
and goes through the trouble of picking up his clothes. The rate at which Kevin picks up
the laundry on the floor is related to the amount of clothes already on the floor and his
tolerance level for clothes on the floor. Notice that this relationship was previously
captured with a “Gap” variable, which produced unrealistic behavior. Now we will see
this relationship captured by a lookup function. As is also the case, formulating a system
using a lookup function can be done incorrectly.
Build the “Incorrect Lookup Model” by changing the “MIN Gap” model as
described in the Appendix under “Modeling the System using an Incorrect Lookup
Function.” Also use the model diagram below.

D-4870-1 30
D-4870-1 31
Model Diagram
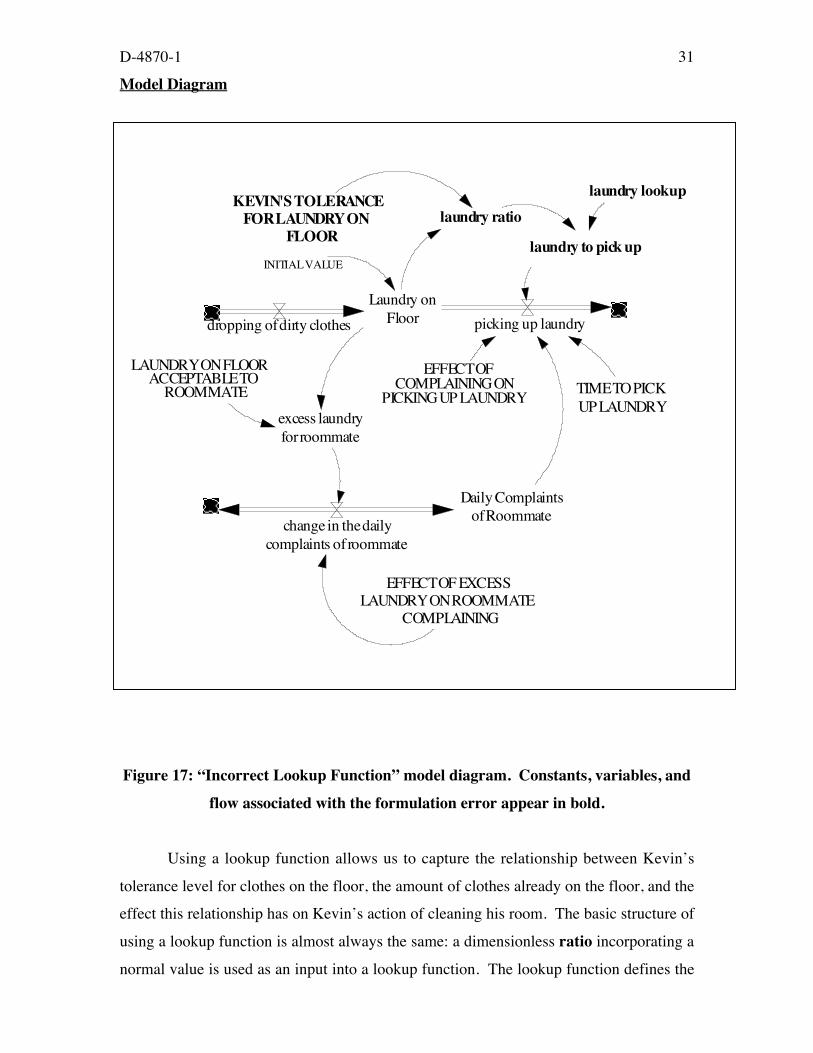
Figure 17: “Incorrect Lookup Function” model diagram. Constants, variables, and
flow associated with the formulation error appear in bold.
Using a lookup function allows us to capture the relationship between Kevin’s
tolerance level for clothes on the floor, the amount of clothes already on the floor, and the
effect this relationship has on Kevin’s action of cleaning his room. The basic structure of
using a lookup function is almost always the same: a dimensionless ratio incorporating a
normal value is used as an input into a lookup function. The lookup function defines the
Laundry onFloordropping of dirty clothes
LAUNDRY ON FLOORACCEPTABLE TO
ROOMMATE
excess laundryfor roommate
Daily Complaintsof Roommate
change in the dailycomplaints of roommate
EFFECT OF EXCESSLAUNDRY ON ROOMMATE
COMPLAINING
picking up laundry
EFFECT OFCOMPLAINING ON
PICKING UP LAUNDRY
KEVIN'S TOLERANCEFOR LAUNDRY ON
FLOORlaundry to pick up
laundry ratio
laundry lookup
TIME TO PICKUP LAUNDRY
INITIAL VALUE
D-4870-1 32
relationship between this ratio and an output effect (by “looking up” the relationship on a
table). Since the input to a lookup function is dimensionless, the output effect also must
be dimensionless. The effect is called a “multiplier effect” because it is used to multiply
a second normal value. The lookup function structure allows the modeler to define a
relationship of different multiples of normal values to each other. Using lookup function
incorrectly usually happens when modelers fail to use normal values, or use normal
values incorrectly, in their formulation.
Normal values are effective because different multiples of benchmark, or
“normal,” values can be related. An example of how normal values are used in everyday
life is when we discuss different ratings of movies or hotels. A movie getting “four stars”
or a “five star” hotel simply rates movies and hotels using multiples of some base star
value. If the price one was willing to pay for a “five star” hotel stay was related to the
number of stars it received, the price could also be discussed using a multiple effect.
Continuing the example, say a one star hotel costs $20 a night. We would expect a five
star hotel to cost some multiple of this “normal value” of $20 a night for a one star hotel.
The effect is not always linear, so the five star hotel doesn’t always cost (5 stars )*($20
per star) = $100. Instead, there is some non-linear relationship between the star system
and the normal value. This non-linear relationship is captured in our “lookup function”
and relates multiples of normal values (here the single “star” and price for a one-star
hotel).
There are often problems with formulating lookup functions, as this example
explores. Lookup functions are powerful tools that effectively capture complicated non-
linear relationships between structures in system dynamics models. Real world situations
can be modeled much more effectively if one takes the time to practice and become
efficient at modeling using lookup functions and defining relationships between normal
values.
9. MISTAKES AND MISUNDERSTANDINGS: INCORRECT LOOKUP
FUNCTIONS
After building the lookup function exactly as described in the documentation, run the
model. We will explore the model behavior, discuss the validity of the results as related
D-4870-1 33
to the real world dorm room system, and then discuss why the model is slightly incorrect
even though the behavior produced is plausible.
D-4870-1 34
Model Behavior:
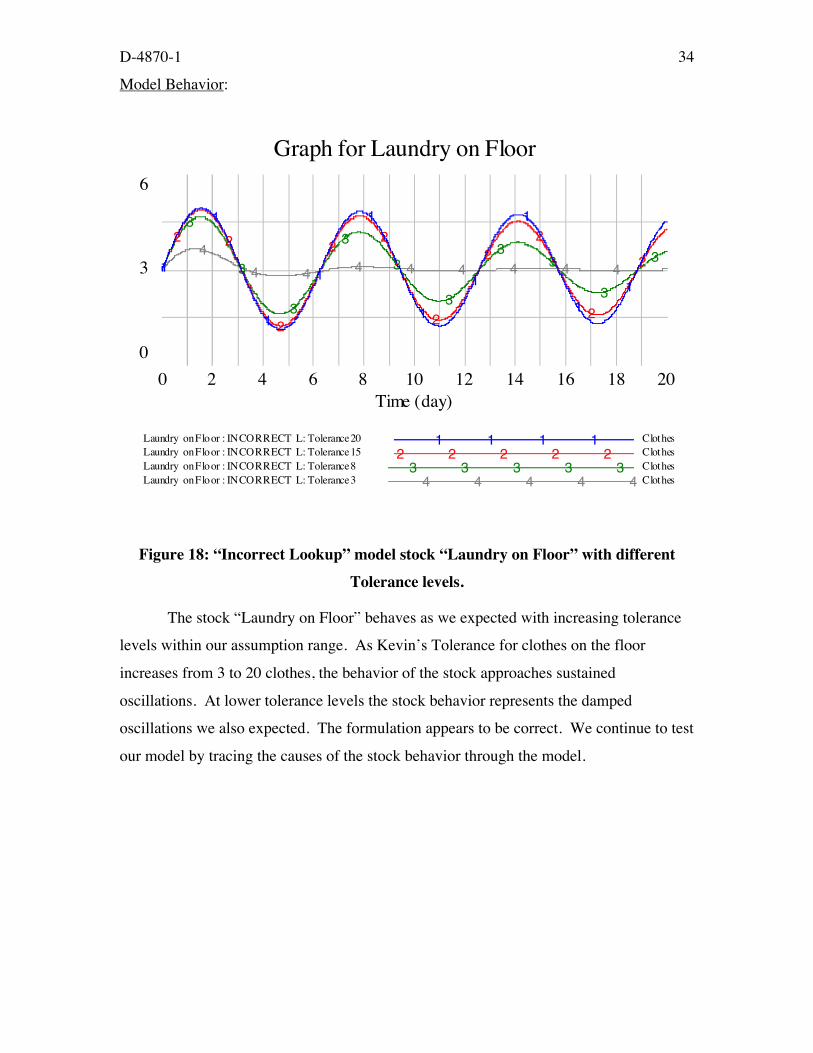
Figure 18: “Incorrect Lookup” model stock “Laundry on Floor” with different
Tolerance levels.
The stock “Laundry on Floor” behaves as we expected with increasing tolerance
levels within our assumption range. As Kevin’s Tolerance for clothes on the floor
increases from 3 to 20 clothes, the behavior of the stock approaches sustained
oscillations. At lower tolerance levels the stock behavior represents the damped
oscillations we also expected. The formulation appears to be correct. We continue to test
our model by tracing the causes of the stock behavior through the model.
Graph for Laundry on Floor
6
3
0
4
4 4 4 4 4 4 4 4
3
3
3
3
3
3
33
3
32 2
2
22
2
22
2
21
1
1
1
1
1
1
1
11
0 2 4 6 8 10 12 14 16 18 20Time (day)
Laundry on Floor : INCORRECT L: Tolerance 20 Clothes1 1 1 1Laundry on Floor : INCORRECT L: Tolerance 15 Clothes2 2 2 2 2Laundry on Floor : INCORRECT L: Tolerance 8 Clothes3 3 3 3 3Laundry on Floor : INCORRECT L: Tolerance 3 Clothes4 4 4 4 4
D-4870-1 35
Model Behavior:
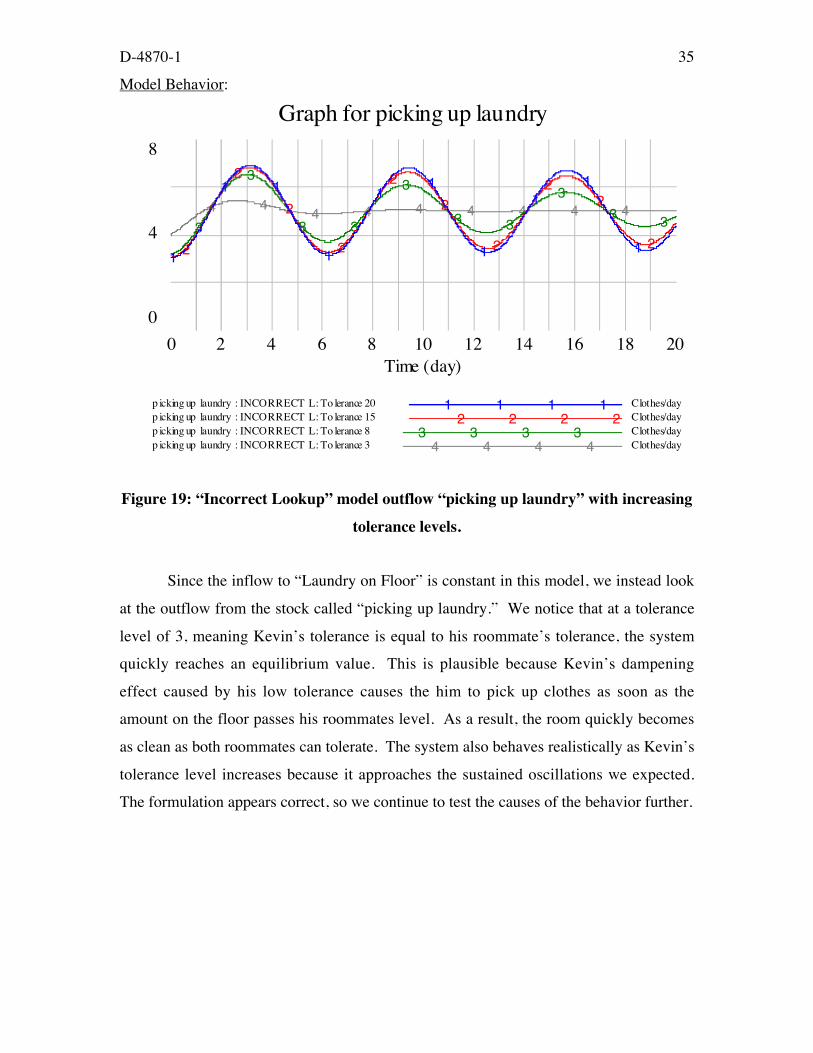
Figure 19: “Incorrect Lookup” model outflow “picking up laundry” with increasing
tolerance levels.
Since the inflow to “Laundry on Floor” is constant in this model, we instead look
at the outflow from the stock called “picking up laundry.” We notice that at a tolerance
level of 3, meaning Kevin’s tolerance is equal to his roommate’s tolerance, the system
quickly reaches an equilibrium value. This is plausible because Kevin’s dampening
effect caused by his low tolerance causes the him to pick up clothes as soon as the
amount on the floor passes his roommates level. As a result, the room quickly becomes
as clean as both roommates can tolerate. The system also behaves realistically as Kevin’s
tolerance level increases because it approaches the sustained oscillations we expected.
The formulation appears correct, so we continue to test the causes of the behavior further.
Graph for picking up laundry
8
4
0
4 44 4 4 4 4 4 4
3
3
3 3
3
3 3
3
3 3
2
2
2
2
2
2
2
22
21
1 1
1
11
1
11
1
0 2 4 6 8 10 12 14 16 18 20Time (day)
p icking up laundry : INCORRECT L: To lerance 20 Clothes/day1 1 1 1p icking up laundry : INCORRECT L: To lerance 15 Clothes/day2 2 2 2p icking up laundry : INCORRECT L: To lerance 8 Clothes/day3 3 3 3p icking up laundry : INCORRECT L: To lerance 3 Clothes/day4 4 4 4
D-4870-1 36
Model Behavior:
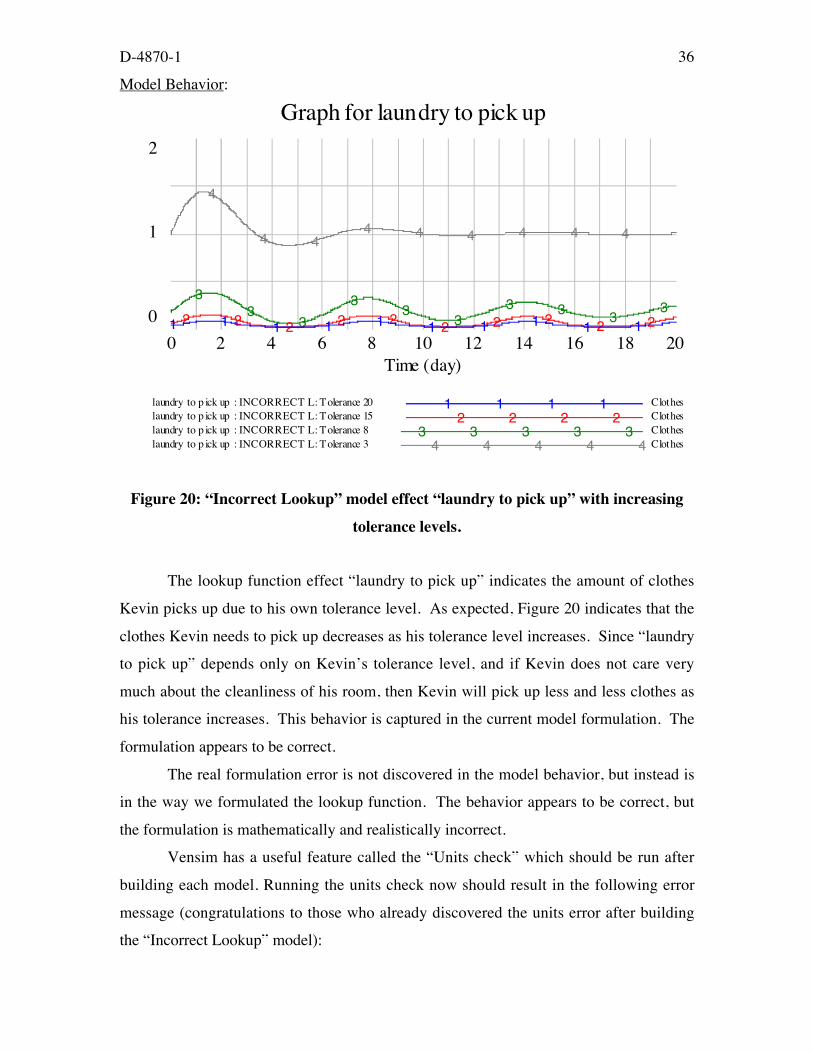
Figure 20: “Incorrect Lookup” model effect “laundry to pick up” with increasing
tolerance levels.
The lookup function effect “laundry to pick up” indicates the amount of clothes
Kevin picks up due to his own tolerance level. As expected, Figure 20 indicates that the
clothes Kevin needs to pick up decreases as his tolerance level increases. Since “laundry
to pick up” depends only on Kevin’s tolerance level, and if Kevin does not care very
much about the cleanliness of his room, then Kevin will pick up less and less clothes as
his tolerance increases. This behavior is captured in the current model formulation. The
formulation appears to be correct.
The real formulation error is not discovered in the model behavior, but instead is
in the way we formulated the lookup function. The behavior appears to be correct, but
the formulation is mathematically and realistically incorrect.
Vensim has a useful feature called the “Units check” which should be run after
building each model. Running the units check now should result in the following error
message (congratulations to those who already discovered the units error after building
the “Incorrect Lookup” model):
Graph for laundry to pick up
2
1
0
4
4 44 4 4 4 4 4
33
3
33
33 3 3
32 2 2 2 2 2 2 2 2 21 1 1 1 1 1 1 1 1 1
0 2 4 6 8 10 12 14 16 18 20Time (day)
laundry to p ick up : INCORRECT L: Tolerance 20 Clothes1 1 1 1laundry to p ick up : INCORRECT L: Tolerance 15 Clothes2 2 2 2laundry to p ick up : INCORRECT L: Tolerance 8 Clothes3 3 3 3 3laundry to p ick up : INCORRECT L: Tolerance 3 Clothes4 4 4 4 4

D-4870-1 37
D-4870-1 38
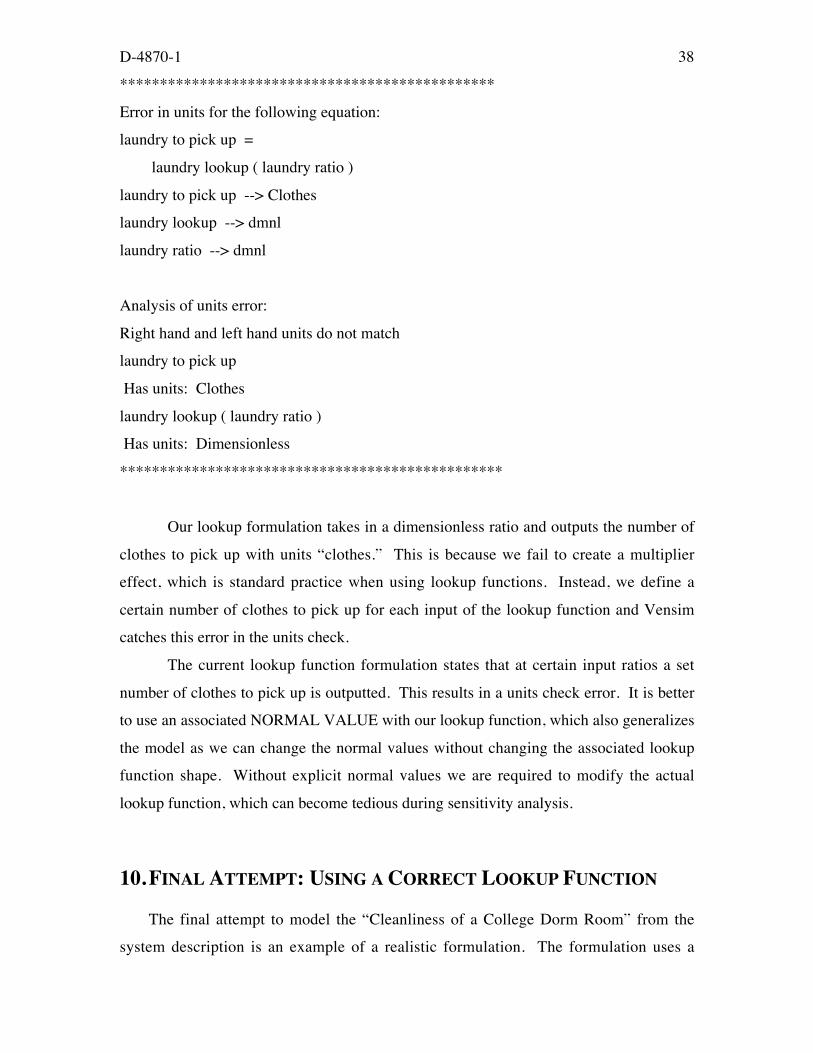
***********************************************
Error in units for the following equation:
laundry to pick up =
laundry lookup ( laundry ratio )
laundry to pick up --> Clothes
laundry lookup --> dmnl
laundry ratio --> dmnl
Analysis of units error:
Right hand and left hand units do not match
laundry to pick up
Has units: Clothes
laundry lookup ( laundry ratio )
Has units: Dimensionless
************************************************
Our lookup formulation takes in a dimensionless ratio and outputs the number of
clothes to pick up with units “clothes.” This is because we fail to create a multiplier
effect, which is standard practice when using lookup functions. Instead, we define a
certain number of clothes to pick up for each input of the lookup function and Vensim
catches this error in the units check.
The current lookup function formulation states that at certain input ratios a set
number of clothes to pick up is outputted. This results in a units check error. It is better
to use an associated NORMAL VALUE with our lookup function, which also generalizes
the model as we can change the normal values without changing the associated lookup
function shape. Without explicit normal values we are required to modify the actual
lookup function, which can become tedious during sensitivity analysis.
10. FINAL ATTEMPT: USING A CORRECT LOOKUP FUNCTION
The final attempt to model the “Cleanliness of a College Dorm Room” from the
system description is an example of a realistic formulation. The formulation uses a
D-4870-1 39
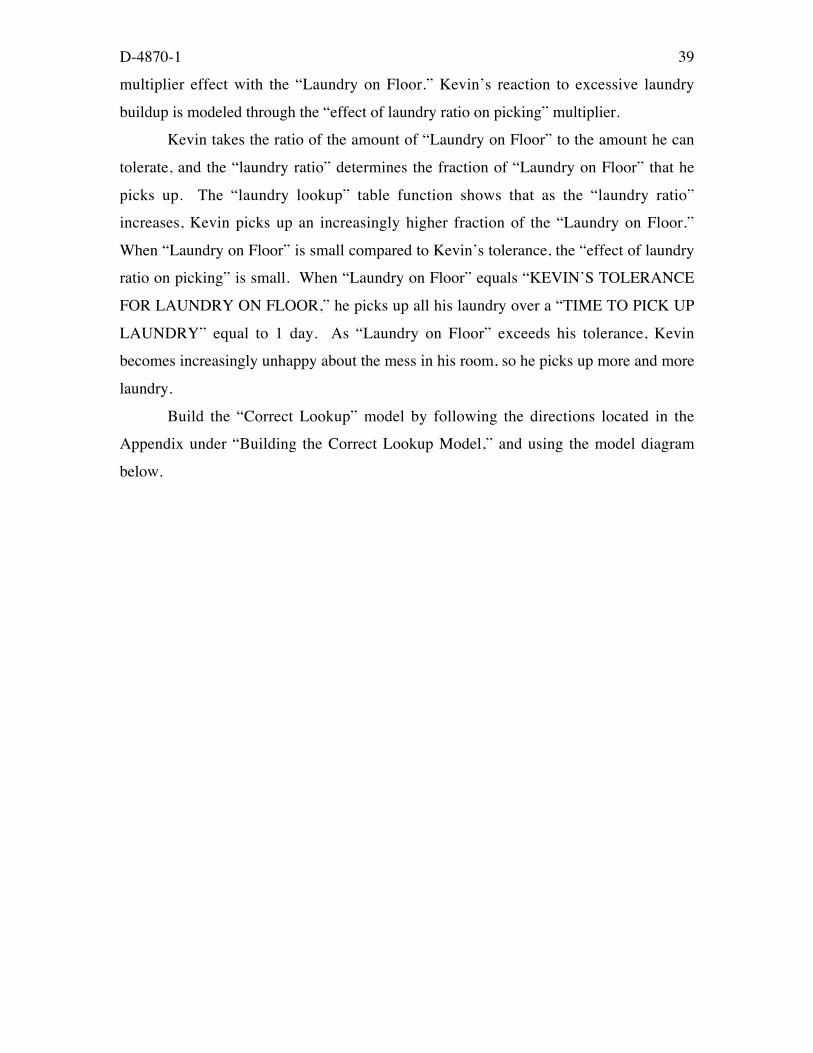
multiplier effect with the “Laundry on Floor.” Kevin’s reaction to excessive laundry
buildup is modeled through the “effect of laundry ratio on picking” multiplier.
Kevin takes the ratio of the amount of “Laundry on Floor” to the amount he can
tolerate, and the “laundry ratio” determines the fraction of “Laundry on Floor” that he
picks up. The “laundry lookup” table function shows that as the “laundry ratio”
increases, Kevin picks up an increasingly higher fraction of the “Laundry on Floor.”
When “Laundry on Floor” is small compared to Kevin’s tolerance, the “effect of laundry
ratio on picking” is small. When “Laundry on Floor” equals “KEVIN’S TOLERANCE
FOR LAUNDRY ON FLOOR,” he picks up all his laundry over a “TIME TO PICK UP
LAUNDRY” equal to 1 day. As “Laundry on Floor” exceeds his tolerance, Kevin
becomes increasingly unhappy about the mess in his room, so he picks up more and more
laundry.
Build the “Correct Lookup” model by following the directions located in the
Appendix under “Building the Correct Lookup Model,” and using the model diagram
below.
D-4870-1 40
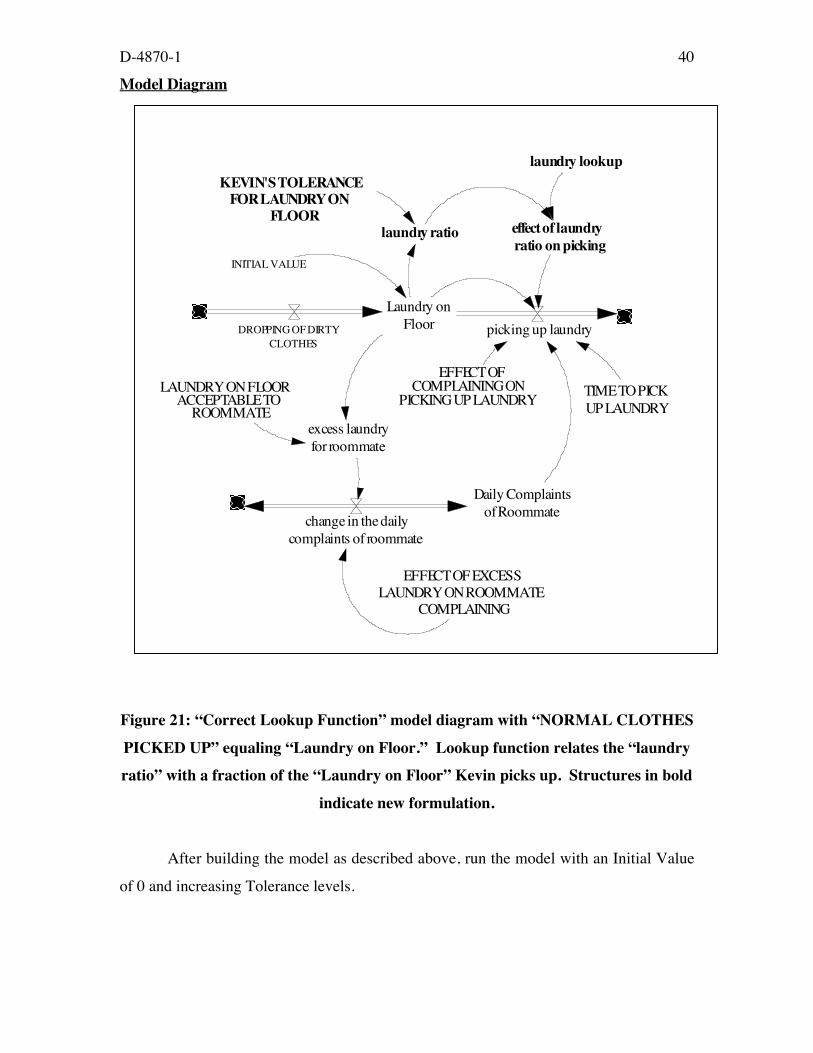
Model Diagram
Figure 21: “Correct Lookup Function” model diagram with “NORMAL CLOTHES
PICKED UP” equaling “Laundry on Floor.” Lookup function relates the “laundry
ratio” with a fraction of the “Laundry on Floor” Kevin picks up. Structures in bold
indicate new formulation.
After building the model as described above, run the model with an Initial Value
of 0 and increasing Tolerance levels.
Laundry onFloor
LAUNDRY ON FLOORACCEPTABLE TO
ROOMMATEexcess laundryfor roommate
Daily Complaintsof Roommate
change in the dailycomplaints of roommate
EFFECT OF EXCESSLAUNDRY ON ROOMMATE
COMPLAINING
picking up laundry
EFFECT OFCOMPLAINING ON
PICKING UP LAUNDRY
KEVIN'S TOLERANCEFOR LAUNDRY ON
FLOOReffect of laundryratio on picking
laundry ratio
laundry lookup
TIME TO PICKUP LAUNDRY
DROPPING OF DIRTYCLOTHES
INITIAL VALUE
D-4870-1 41
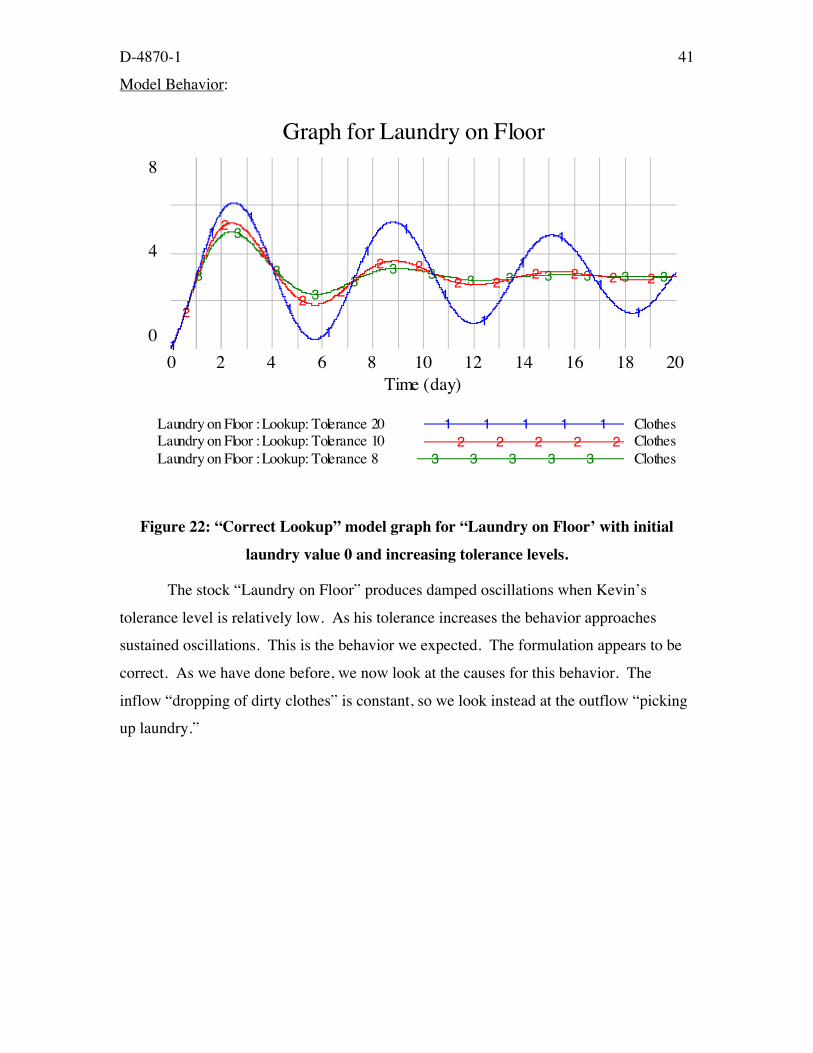
Model Behavior:
Figure 22: “Correct Lookup” model graph for “Laundry on Floor’ with initial
laundry value 0 and increasing tolerance levels.
The stock “Laundry on Floor” produces damped oscillations when Kevin’s
tolerance level is relatively low. As his tolerance increases the behavior approaches
sustained oscillations. This is the behavior we expected. The formulation appears to be
correct. As we have done before, we now look at the causes for this behavior. The
inflow “dropping of dirty clothes” is constant, so we look instead at the outflow “picking
up laundry.”
Graph for Laundry on Floor
8
4
0
3
3
3
33
3 3 3 3 3 3 3 3
2
2
2
22
2 22 2
2 2 2 2
1
11
1
1
1
1
1
1
1
1
1
1
0 2 4 6 8 10 12 14 16 18 20Time (day)
Laundry on Floor : Lookup: Tolerance 20 Clothes1 1 1 1 1Laundry on Floor : Lookup: Tolerance 10 Clothes2 2 2 2 2Laundry on Floor : Lookup: Tolerance 8 Clothes3 3 3 3 3

D-4870-1 42
D-4870-1 43
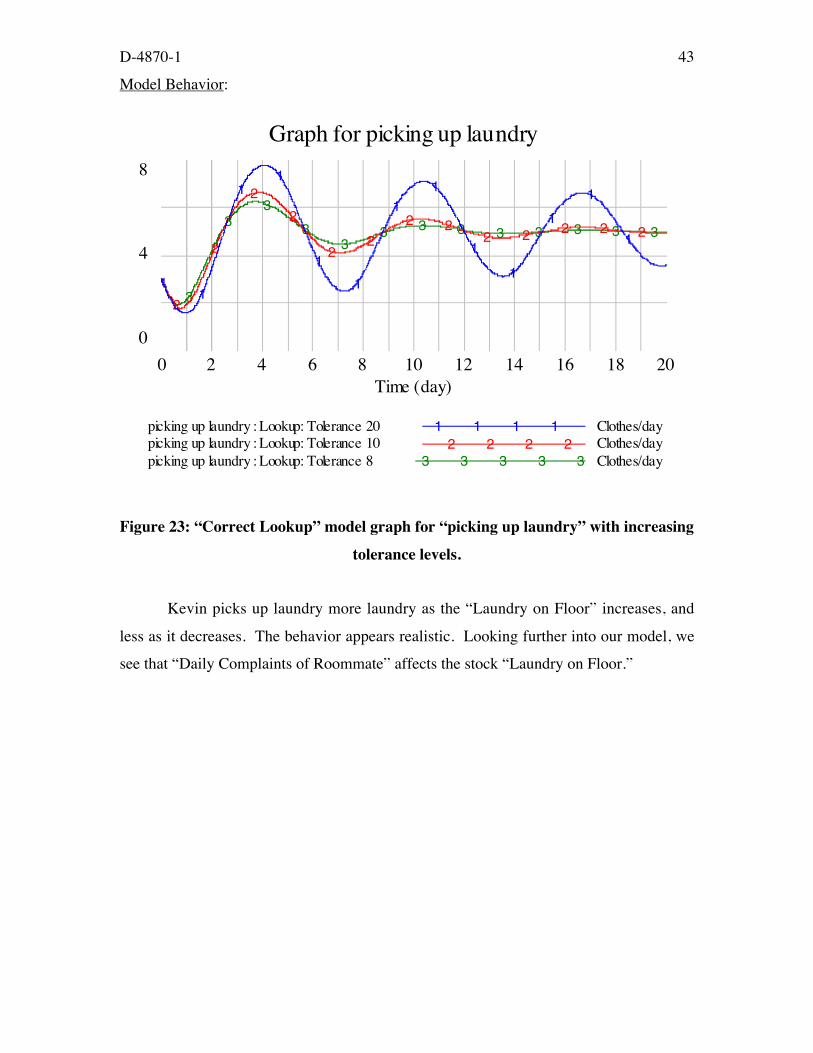
Model Behavior:
Figure 23: “Correct Lookup” model graph for “picking up laundry” with increasing
tolerance levels.
Kevin picks up laundry more laundry as the “Laundry on Floor” increases, and
less as it decreases. The behavior appears realistic. Looking further into our model, we
see that “Daily Complaints of Roommate” affects the stock “Laundry on Floor.”
Graph for picking up laundry
8
4
0
3
33
33
3 3 3 3 3 3 3 3
2
2
2
2
22
2 22 2 2 2 2
11
11
1
1
11
1
1
1
1
1
0 2 4 6 8 10 12 14 16 18 20Time (day)
picking up laundry : Lookup: Tolerance 20 Clothes/day1 1 1 1picking up laundry : Lookup: Tolerance 10 Clothes/day2 2 2 2picking up laundry : Lookup: Tolerance 8 Clothes/day3 3 3 3 3
D-4870-1 44
Model Behavior:
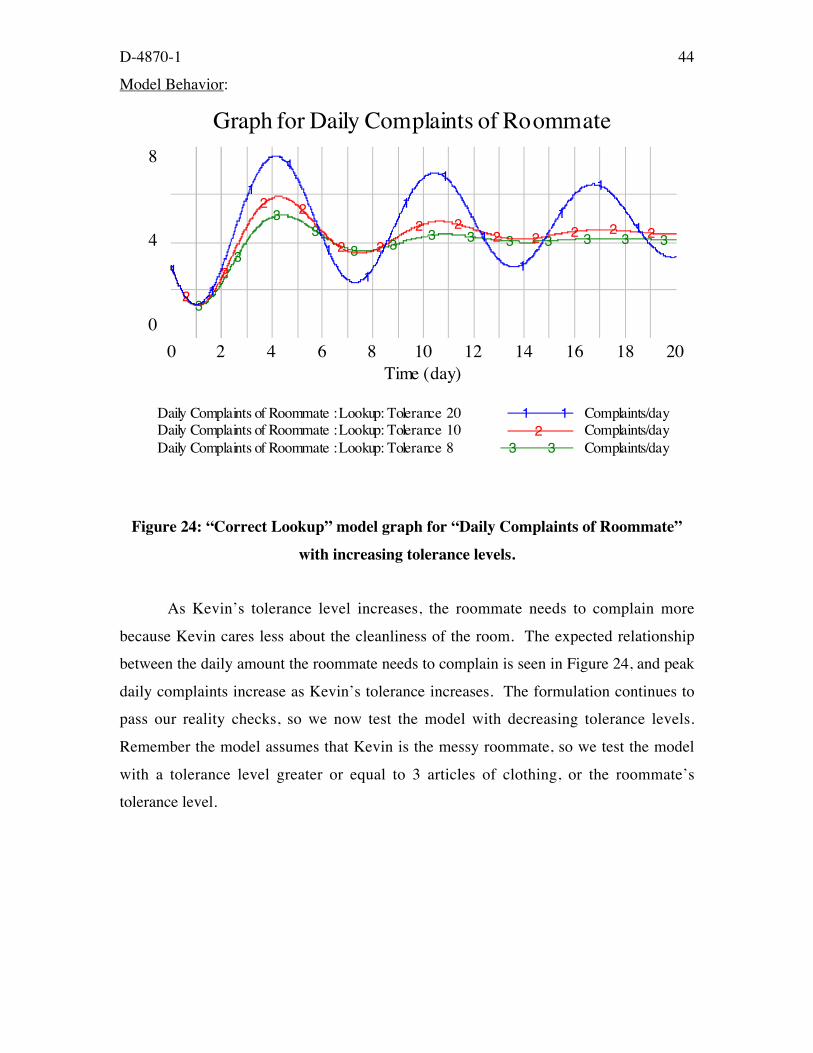
Figure 24: “Correct Lookup” model graph for “Daily Complaints of Roommate”
with increasing tolerance levels.
As Kevin’s tolerance level increases, the roommate needs to complain more
because Kevin cares less about the cleanliness of the room. The expected relationship
between the daily amount the roommate needs to complain is seen in Figure 24, and peak
daily complaints increase as Kevin’s tolerance increases. The formulation continues to
pass our reality checks, so we now test the model with decreasing tolerance levels.
Remember the model assumes that Kevin is the messy roommate, so we test the model
with a tolerance level greater or equal to 3 articles of clothing, or the roommate’s
tolerance level.
Graph for Daily Complaints of Roommate
8
4
03
3
33
3 33 3 3 3 3 3 3
2
2
2 2
2 2
2 22 2 2 2 2
1
1
1
1
1
1
1
1
1
1
1
1
1
0 2 4 6 8 10 12 14 16 18 20Time (day)
Daily Complaints of Roommate : Lookup: Tolerance 20 Complaints/day1 1Daily Complaints of Roommate : Lookup: Tolerance 10 Complaints/day2Daily Complaints of Roommate : Lookup: Tolerance 8 Complaints/day3 3
D-4870-1 45
Model Behavior:
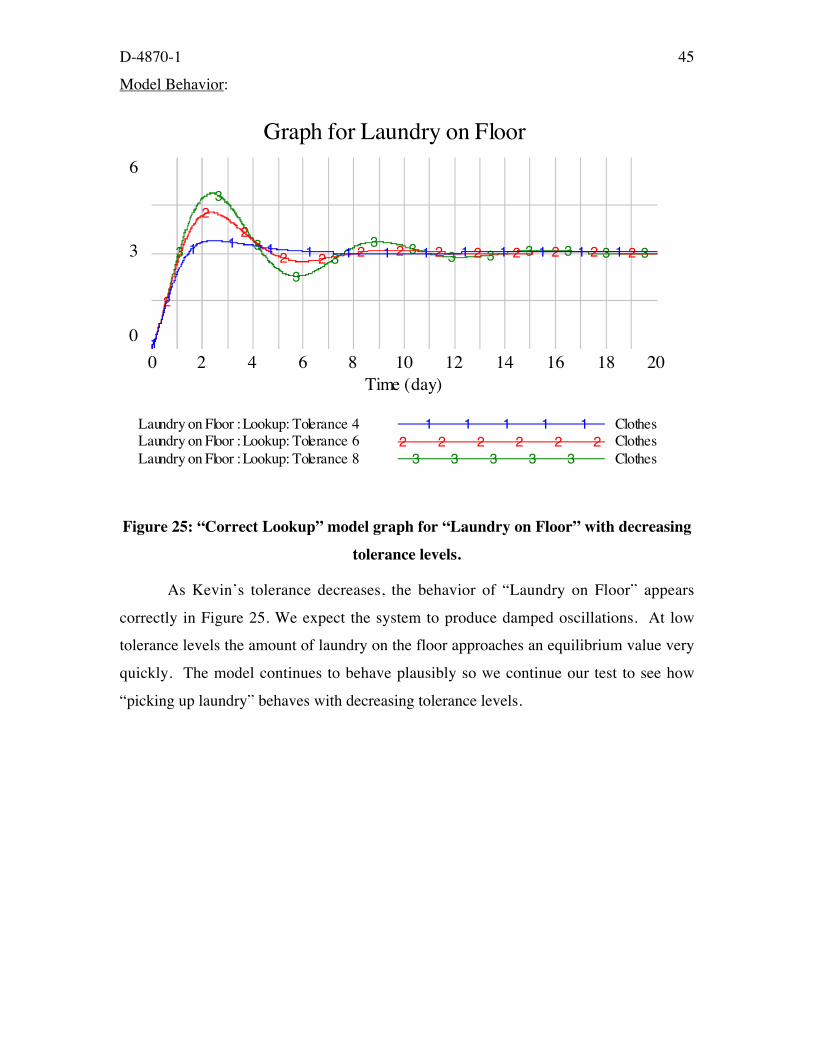
Figure 25: “Correct Lookup” model graph for “Laundry on Floor” with decreasing
tolerance levels.
As Kevin’s tolerance decreases, the behavior of “Laundry on Floor” appears
correctly in Figure 25. We expect the system to produce damped oscillations. At low
tolerance levels the amount of laundry on the floor approaches an equilibrium value very
quickly. The model continues to behave plausibly so we continue our test to see how
“picking up laundry” behaves with decreasing tolerance levels.
Graph for Laundry on Floor
6
3
0
3
3
3
33
3 3 3 3 3 3 3 3
2
22
2 2 2 2 2 2 2 2 2 2
1
1 1 1 1 1 1 1 1 1 1 1 1
0 2 4 6 8 10 12 14 16 18 20Time (day)
Laundry on Floor : Lookup: Tolerance 4 Clothes1 1 1 1 1Laundry on Floor : Lookup: Tolerance 6 Clothes2 2 2 2 2 2Laundry on Floor : Lookup: Tolerance 8 Clothes3 3 3 3 3

D-4870-1 46
D-4870-1 47
Model Behavior:
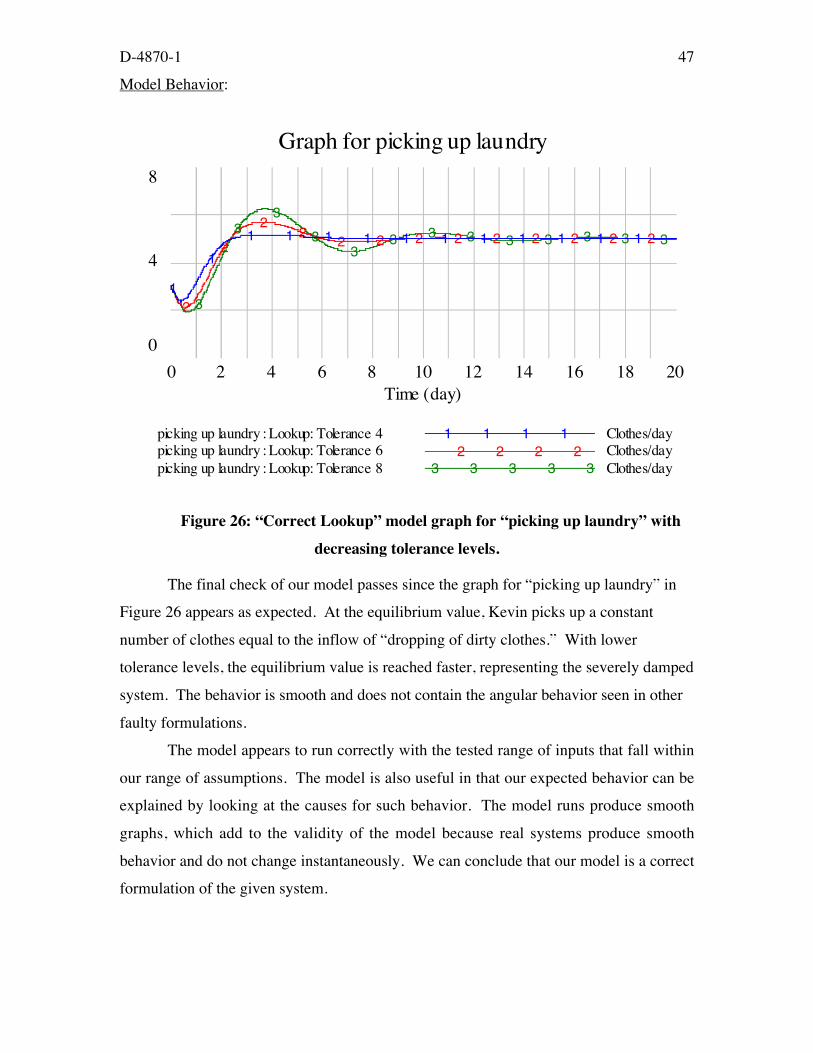
Figure 26: “Correct Lookup” model graph for “picking up laundry” with
decreasing tolerance levels.
The final check of our model passes since the graph for “picking up laundry” in
Figure 26 appears as expected. At the equilibrium value, Kevin picks up a constant
number of clothes equal to the inflow of “dropping of dirty clothes.” With lower
tolerance levels, the equilibrium value is reached faster, representing the severely damped
system. The behavior is smooth and does not contain the angular behavior seen in other
faulty formulations.
The model appears to run correctly with the tested range of inputs that fall within
our range of assumptions. The model is also useful in that our expected behavior can be
explained by looking at the causes for such behavior. The model runs produce smooth
graphs, which add to the validity of the model because real systems produce smooth
behavior and do not change instantaneously. We can conclude that our model is a correct
formulation of the given system.
Graph for picking up laundry
8
4
0
3
33
33
3 3 3 3 3 3 3 3
2
2
22
2 2 2 2 2 2 2 2 2
1
1
1 1 1 1 1 1 1 1 1 1 1
0 2 4 6 8 10 12 14 16 18 20Time (day)
picking up laundry : Lookup: Tolerance 4 Clothes/day1 1 1 1picking up laundry : Lookup: Tolerance 6 Clothes/day2 2 2 2picking up laundry : Lookup: Tolerance 8 Clothes/day3 3 3 3 3
D-4870-1 48
11. OVERCOMING OUR MISTAKES AND MISUNDERSTANDINGS
Formulation errors are sometimes difficult to catch and correct. It is important to
always state the assumptions used in the model, and to test that the model behaves
plausibly within the stated assumptions. The model behavior should reflect what is
observed in the actual system. The formulation should also try to realistically model
what is actually taking place. In the paper we examined formulations (namely the “Gap”
and “MIN Gap” models) which appeared to produce the correct behavior, but for
unrealistic reasons. These formulations also failed over certain ranges of inputs.
However, it is difficult to create a completely robust model for even simple
systems such as this one. As mentioned earlier, there is an important restriction on the
model: Kevin’s tolerance for clothes on the floor must be above his roommate’s because
he is the messy roommate. The model fails if we do not adhere to this rule (see this by
running the model with “KEVIN’S TOLERANCE FOR LAUNDRY ON FLOOR” less
than 3). The model can me made to be robust, however, and as a challenge the reader
should attempt to discover and fix the formulation error present somewhere else in the
model (HINT: What was our first formulation error, and does the same structure appear
elsewhere in the model? How should we fix the error?) The reason why we could use
the given formulation for our model was because the model fails in parameter ranges that
we did not discuss. Fixing the second formulation error in the same way that we fixed
our original error will result in a more robust model.
System dynamics models should be useful in answering specific questions.
Choosing a formulation that produces reasonable and instructive behavior over the range
of desired input parameters requires testing the model and tracing the cause of the
observed behavior. Testing the model not only validates the chosen formulation, but it
adds insight into the model and the real world system we are studying. The relationships
between various structures within the model give us a deeper understanding of the actual
system, which should help us answering our specific questions. The process of model
formulation testing can sometimes teach us more about the real world system than
initially building the model.
D-4870-1 49
12. APPENDIX
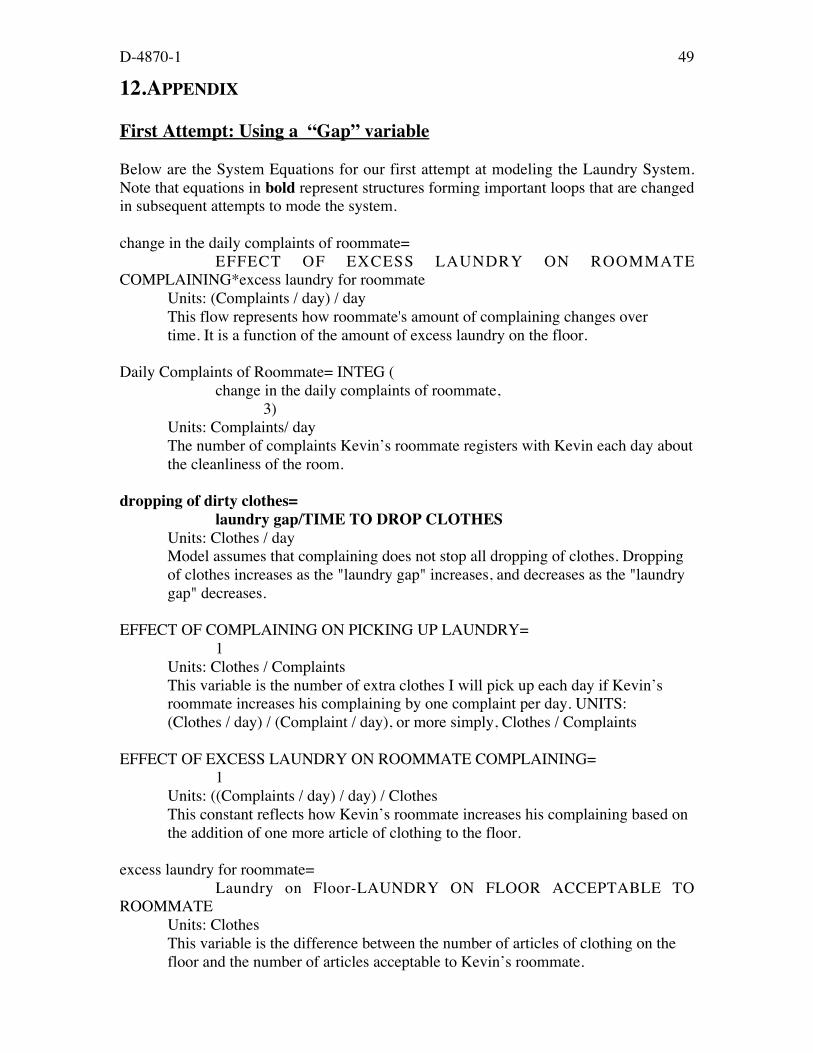
First Attempt: Using a “Gap” variable
Below are the System Equations for our first attempt at modeling the Laundry System.Note that equations in bold represent structures forming important loops that are changedin subsequent attempts to mode the system.
change in the daily complaints of roommate=EFFECT OF EXCESS LAUNDRY ON ROOMMATE
COMPLAINING*excess laundry for roommateUnits: (Complaints / day) / dayThis flow represents how roommate's amount of complaining changes overtime. It is a function of the amount of excess laundry on the floor.
Daily Complaints of Roommate= INTEG (change in the daily complaints of roommate,
3)Units: Complaints/ dayThe number of complaints Kevin’s roommate registers with Kevin each day aboutthe cleanliness of the room.
dropping of dirty clothes=laundry gap/TIME TO DROP CLOTHES
Units: Clothes / dayModel assumes that complaining does not stop all dropping of clothes. Dropping
of clothes increases as the "laundry gap" increases, and decreases as the "laundry gap" decreases.
EFFECT OF COMPLAINING ON PICKING UP LAUNDRY=1
Units: Clothes / ComplaintsThis variable is the number of extra clothes I will pick up each day if Kevin’s
roommate increases his complaining by one complaint per day. UNITS:(Clothes / day) / (Complaint / day), or more simply, Clothes / Complaints
EFFECT OF EXCESS LAUNDRY ON ROOMMATE COMPLAINING=1
Units: ((Complaints / day) / day) / ClothesThis constant reflects how Kevin’s roommate increases his complaining based on
the addition of one more article of clothing to the floor.
excess laundry for roommate=Laundry on Floor-LAUNDRY ON FLOOR ACCEPTABLE TO
ROOMMATEUnits: ClothesThis variable is the difference between the number of articles of clothing on the
floor and the number of articles acceptable to Kevin’s roommate.
D-4870-1 50
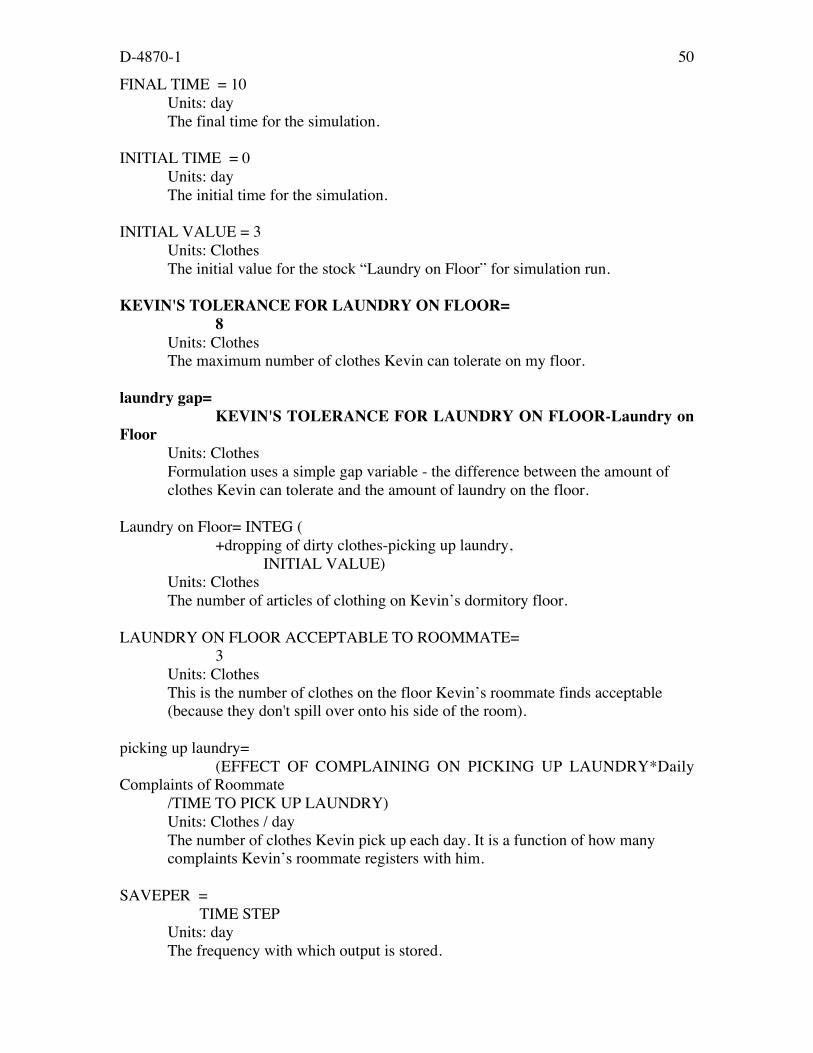
FINAL TIME = 10Units: dayThe final time for the simulation.
INITIAL TIME = 0Units: dayThe initial time for the simulation.
INITIAL VALUE = 3Units: ClothesThe initial value for the stock “Laundry on Floor” for simulation run.
KEVIN'S TOLERANCE FOR LAUNDRY ON FLOOR=8
Units: ClothesThe maximum number of clothes Kevin can tolerate on my floor.
laundry gap=KEVIN'S TOLERANCE FOR LAUNDRY ON FLOOR-Laundry on
FloorUnits: ClothesFormulation uses a simple gap variable - the difference between the amount ofclothes Kevin can tolerate and the amount of laundry on the floor.
Laundry on Floor= INTEG (+dropping of dirty clothes-picking up laundry,
INITIAL VALUE)Units: ClothesThe number of articles of clothing on Kevin’s dormitory floor.
LAUNDRY ON FLOOR ACCEPTABLE TO ROOMMATE=3
Units: ClothesThis is the number of clothes on the floor Kevin’s roommate finds acceptable
(because they don't spill over onto his side of the room).
picking up laundry=(EFFECT OF COMPLAINING ON PICKING UP LAUNDRY*Daily
Complaints of Roommate/TIME TO PICK UP LAUNDRY)Units: Clothes / dayThe number of clothes Kevin pick up each day. It is a function of how manycomplaints Kevin’s roommate registers with him.
SAVEPER = TIME STEPUnits: dayThe frequency with which output is stored.

D-4870-1 51
TIME STEP = 0.0078125Units: dayThe time step for the simulation.
D-4870-1 52
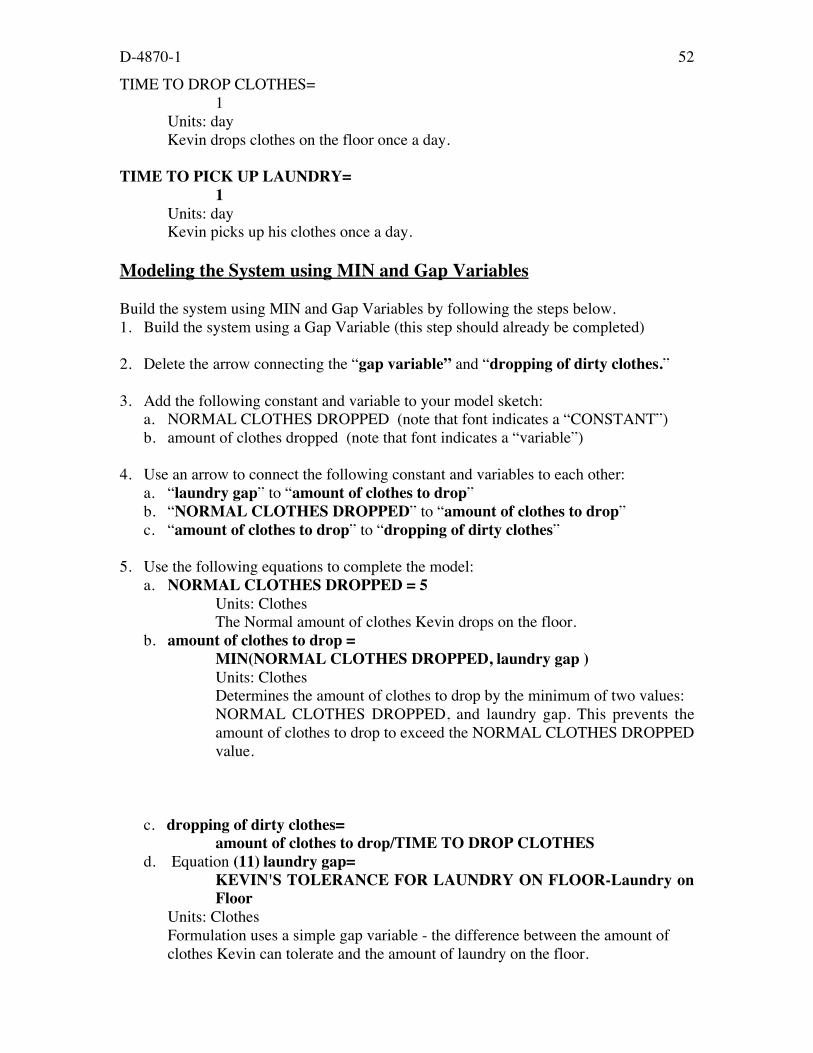
TIME TO DROP CLOTHES=1
Units: dayKevin drops clothes on the floor once a day.
TIME TO PICK UP LAUNDRY=1
Units: dayKevin picks up his clothes once a day.
Modeling the System using MIN and Gap Variables
Build the system using MIN and Gap Variables by following the steps below.1. Build the system using a Gap Variable (this step should already be completed)
2. Delete the arrow connecting the “gap variable” and “dropping of dirty clothes.”
3. Add the following constant and variable to your model sketch:a. NORMAL CLOTHES DROPPED (note that font indicates a “CONSTANT”)b. amount of clothes dropped (note that font indicates a “variable”)
4. Use an arrow to connect the following constant and variables to each other:a. “laundry gap” to “amount of clothes to drop”b. “NORMAL CLOTHES DROPPED” to “amount of clothes to drop”c. “amount of clothes to drop” to “dropping of dirty clothes”
5. Use the following equations to complete the model:a. NORMAL CLOTHES DROPPED = 5
Units: ClothesThe Normal amount of clothes Kevin drops on the floor.
b. amount of clothes to drop =MIN(NORMAL CLOTHES DROPPED, laundry gap )Units: ClothesDetermines the amount of clothes to drop by the minimum of two values:NORMAL CLOTHES DROPPED, and laundry gap. This prevents theamount of clothes to drop to exceed the NORMAL CLOTHES DROPPEDvalue.
c. dropping of dirty clothes=amount of clothes to drop/TIME TO DROP CLOTHES
d. Equation (11) laundry gap=KEVIN'S TOLERANCE FOR LAUNDRY ON FLOOR-Laundry onFloor
Units: ClothesFormulation uses a simple gap variable - the difference between the amount of
clothes Kevin can tolerate and the amount of laundry on the floor.

D-4870-1 53
5. Done! Documentation for the MIN Gap variable model follows below.
D-4870-1 54
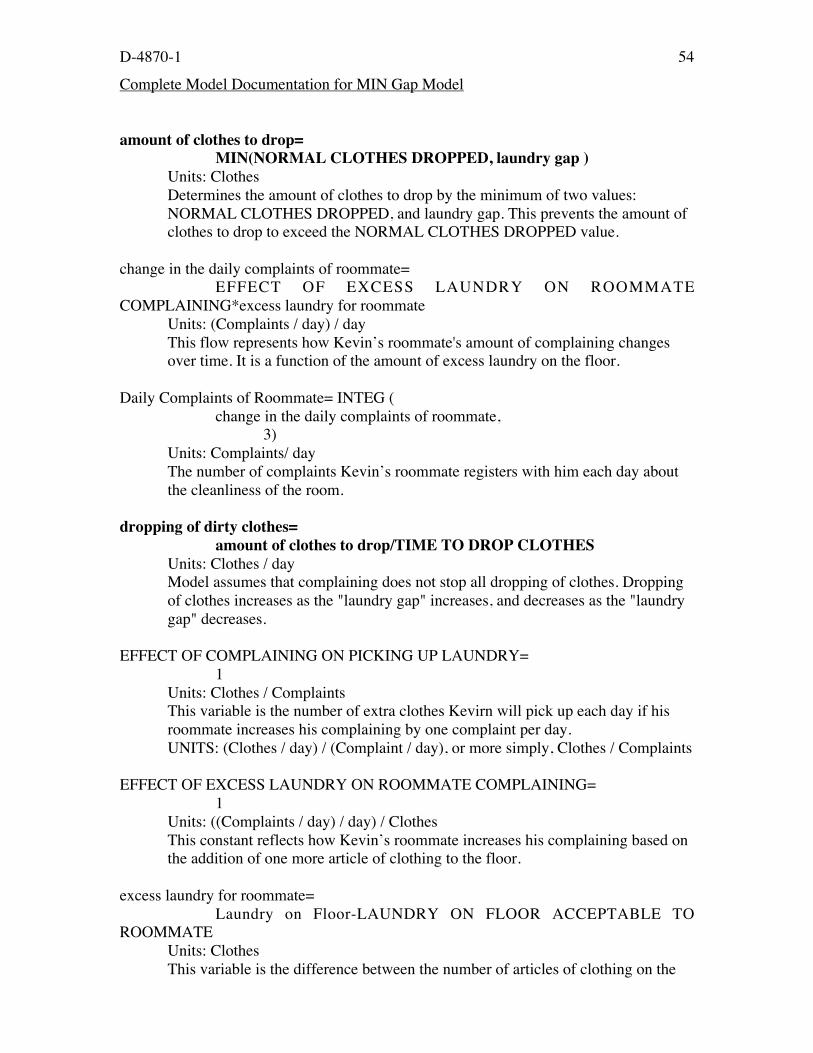
Complete Model Documentation for MIN Gap Model
amount of clothes to drop=MIN(NORMAL CLOTHES DROPPED, laundry gap )
Units: ClothesDetermines the amount of clothes to drop by the minimum of two values:
NORMAL CLOTHES DROPPED, and laundry gap. This prevents the amount of clothes to drop to exceed the NORMAL CLOTHES DROPPED value.
change in the daily complaints of roommate=EFFECT OF EXCESS LAUNDRY ON ROOMMATE
COMPLAINING*excess laundry for roommateUnits: (Complaints / day) / dayThis flow represents how Kevin’s roommate's amount of complaining changes
over time. It is a function of the amount of excess laundry on the floor.
Daily Complaints of Roommate= INTEG (change in the daily complaints of roommate,
3)Units: Complaints/ dayThe number of complaints Kevin’s roommate registers with him each day about
the cleanliness of the room.
dropping of dirty clothes=amount of clothes to drop/TIME TO DROP CLOTHES
Units: Clothes / dayModel assumes that complaining does not stop all dropping of clothes. Dropping
of clothes increases as the "laundry gap" increases, and decreases as the "laundry gap" decreases.
EFFECT OF COMPLAINING ON PICKING UP LAUNDRY=1
Units: Clothes / ComplaintsThis variable is the number of extra clothes Kevirn will pick up each day if his
roommate increases his complaining by one complaint per day.UNITS: (Clothes / day) / (Complaint / day), or more simply, Clothes / Complaints
EFFECT OF EXCESS LAUNDRY ON ROOMMATE COMPLAINING=1
Units: ((Complaints / day) / day) / ClothesThis constant reflects how Kevin’s roommate increases his complaining based on
the addition of one more article of clothing to the floor.
excess laundry for roommate=Laundry on Floor-LAUNDRY ON FLOOR ACCEPTABLE TO
ROOMMATEUnits: ClothesThis variable is the difference between the number of articles of clothing on the

D-4870-1 55
floor and the number of articles acceptable to Kevin’s roommate.
D-4870-1 56
FINAL TIME = 10Units: dayThe final time for the simulation.
INITIAL TIME = 0Units: dayThe initial time for the simulation.
INITIAL VALUE=3Units: ClothesThe initial value of “Laundry on Floor” for simulation runs.
KEVIN'S TOLERANCE FOR LAUNDRY ON FLOOR=8
Units: ClothesThe maximum number of clothes Kevin can tolerate on my floor.
laundry gap=KEVIN'S TOLERANCE FOR LAUNDRY ON FLOOR-Laundry on
FloorUnits: ClothesFormulation uses a simple gap variable - the difference between the amount of
clothes Kevin can tolerate andthe amount of laundry on the floor.
Laundry on Floor= INTEG (+dropping of dirty clothes-picking up laundry,
INITIAL VALUE)Units: ClothesThe number of articles of clothing on Kevin’s dormitory floor.
LAUNDRY ON FLOOR ACCEPTABLE TO ROOMMATE=3
Units: ClothesThis is the number of clothes on the floor Kevin’s roommate finds acceptable
(because they don't spill over onto his side of the room).
NORMAL CLOTHES DROPPED=5
Units: ClothesThe Normal amount of clothes Kevin drops on the floor.
picking up laundry=(EFFECT OF COMPLAINING ON PICKING UP LAUNDRY*Daily
Complaints of Roommate/TIME TO PICK UP LAUNDRY)Units: Clothes / dayThe number of clothes Kevin will pick up each day. It is a function of how many
complaints Kevin’s roommate registers with him.
D-4870-1 57
SAVEPER = TIME STEPUnits: dayThe frequency with which output is stored.
TIME STEP = 0.0078125Units: dayThe time step for the simulation.
TIME TO DROP CLOTHES=1
Units: dayKevin drops clothes on the floor once a day.
TIME TO PICK UP LAUNDRY=1
Units: dayKevin picks up his clothes once a day.
Modeling the System Using an Incorrect Lookup Function
Build the model using an Incorrect Lookup Function by following the steps below:1. Build the model using a MIN and Gap variable structure (this step should already be
completed)
2. Delete the following constant, variables, and all remaining unconnected arrows:a. laundry gapb. amount of clothes to dropc. NORMAL CLOTHES DROPPEDd. TIME TO DROP CLOTHES
3. Add the following constant, variables, and lookup function:a. laundry ratiob. effect of laundry ratio on pickingc. laundry lookup
4. Using arrows, connect the following constant, variables, and lookup function:a. Laundry on Floor (stock) and laundry ratiob. KEVIN’S TOLERANCE FOR LAUNDRY ON FLOOR and laundry ratioc. laundry ratio and effect of laundry ratio on pickingd. laundry lookup and effect of laundry ratio on pickinge. effect of laundry ratio on picking and picking up laundry (flow)
5. The equations we need to change along with their definitions are listed below:a. Equation (03) “dropping of dirty clothes” will now be modeled as a constant, so
dropping of dirty clothes = 5, and we have to change theUnits to Clothes/day to indicate that there are 5 articles of cloting to bedropped each day.
D-4870-1 58
b. Equation (14) laundry ratio=Laundry on Floor/KEVIN'S TOLERANCE FOR LAUNDRY ONFLOOR
Units: dmnlThe ratio of the laundry on the floor to the amount of laundry that Kevin cantolerate. Remember that correct usage of a lookup function uses a dimensionlessinput to produce a multiplier value, which is then used to have a multiplier effecton a NORMAL VALUE. Always remember to use dimensionless (dmnl) inputsin models using Lookup Funtions. Ratios are especially effective.
c. Equation (06) effect of laundry ratio on picking=laundry lookup(laundry ratio)
Units: dmnlThe number of clothes picked up as a function of the laundry ratio. Rememberthat correct usage of a lookup function uses a dimensionless input to produce amultiplier value, which is then used to have a multiplier effect on a NORMALVALUE. Here, “laundry lookup” takes a dimensionless ratio as an input,“laundry ratio,” and outputs a dimensionless (dmnl) value, “effect of laundry ratioon picking,” which will be used as a multiplier.
d. Equation (16) picking up laundry=(EFFECT OF COMPLAINING ON PICKING UP LAUNDRY*DailyComplaints of Roommate) + (effect of laundry ratio on picking /TIMETO PICK UP LAUNDRY)
Units: Clothes / dayThe number of clothes Kevin picks up each day. It is a function of how many
complaints his roommate registers with him. It is also a function of the ratio of the number of clothes that lie on the floor to the number of clothes he can tolerate.
Notice that “effect of laundry ratio on picking” is used without a multiplyingconstant.
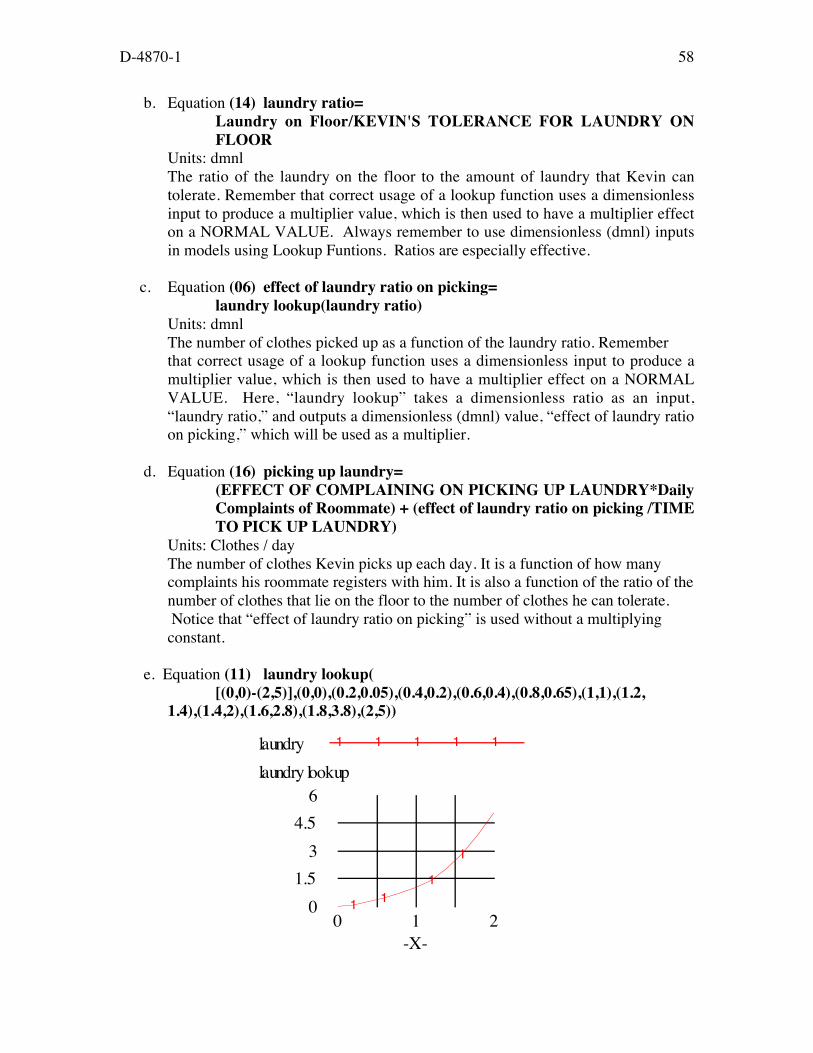
e. Equation (11) laundry lookup([(0,0)-(2,5)],(0,0),(0.2,0.05),(0.4,0.2),(0.6,0.4),(0.8,0.65),(1,1),(1.2,
1.4),(1.4,2),(1.6,2.8),(1.8,3.8),(2,5))
laundry 1 1 1 1 1
laundry lookup6
4.5
3
1.5
0 1 11
1
0 1 2-X-
D-4870-1 59
Units: dmnlHere the lookup value correctly takes in a ratio as input, but outputs a value used
directly in the formulation without a multiplying normal value. At low ratios, a smallnumber of clothes are picked up. As the ratio increases, meaning the Laundry on Floor ismuch larger than KEVIN’S TOLERANCE FOR LAUNDRY ON FLOOR, we see anincreased amount of clothes picked up.
D-4870-1 60
Complete Documentation for Incorrect Lookup Function Model
change in the daily complaints of roommate=EFFECT OF EXCESS LAUNDRY ON ROOMMATE
COMPLAINING*excess laundry for roommateUnits: (Complaints / day) / dayThis flow represents how my roommate's amount of complaining
changes over time. It is a function of the amount of excesslaundry on the floor.
Daily Complaints of Roommate= INTEG (change in the daily complaints of roommate,
3)Units: Complaints/ dayThe number of complaints my roommate registers with me each day
about the cleanliness of the room.
dropping of dirty clothes=5
Units: Clothes / dayThe number of dirty clothes I drop on my floor every day. The
model assumes that my roommate's complaining or my owntolerance
for laundry do not stop me from dropping all my clothes on thefloor, they only change how many I pick up.
EFFECT OF COMPLAINING ON PICKING UP LAUNDRY=1
Units: Clothes / ComplaintsThis variable is the number of extra clothes I will pick up each
day if my roommate increases his complaining by one complaintper day. UNITS: (Clothes / day) / (Complaint / day), or moresimply, Clothes / Complaints
EFFECT OF EXCESS LAUNDRY ON ROOMMATE COMPLAINING=1
Units: ((Complaints / day) / day) / ClothesThis constant reflects how my roommate increases his complaining
based on the addition of one more article of clothing to thefloor.
excess laundry for roommate=Laundry on Floor-LAUNDRY ON FLOOR ACCEPTABLE TO
ROOMMATEUnits: ClothesThis variable is the difference between the number of articles
of clothing on my floor and the number of articles acceptable tomy roommate.
FINAL TIME = 20

D-4870-1 61
Units: dayThe final time for the simulation.
D-4870-1 62
INITIAL TIME = 0Units: dayThe initial time for the simulation.
INITIAL VALUE=3Units: ClothesThe initial value of “Laundry on Floor” for simulation
KEVIN'S TOLERANCE FOR LAUNDRY ON FLOOR=8
Units: ClothesThe maximum number of clothes I can tolerate on my floor.
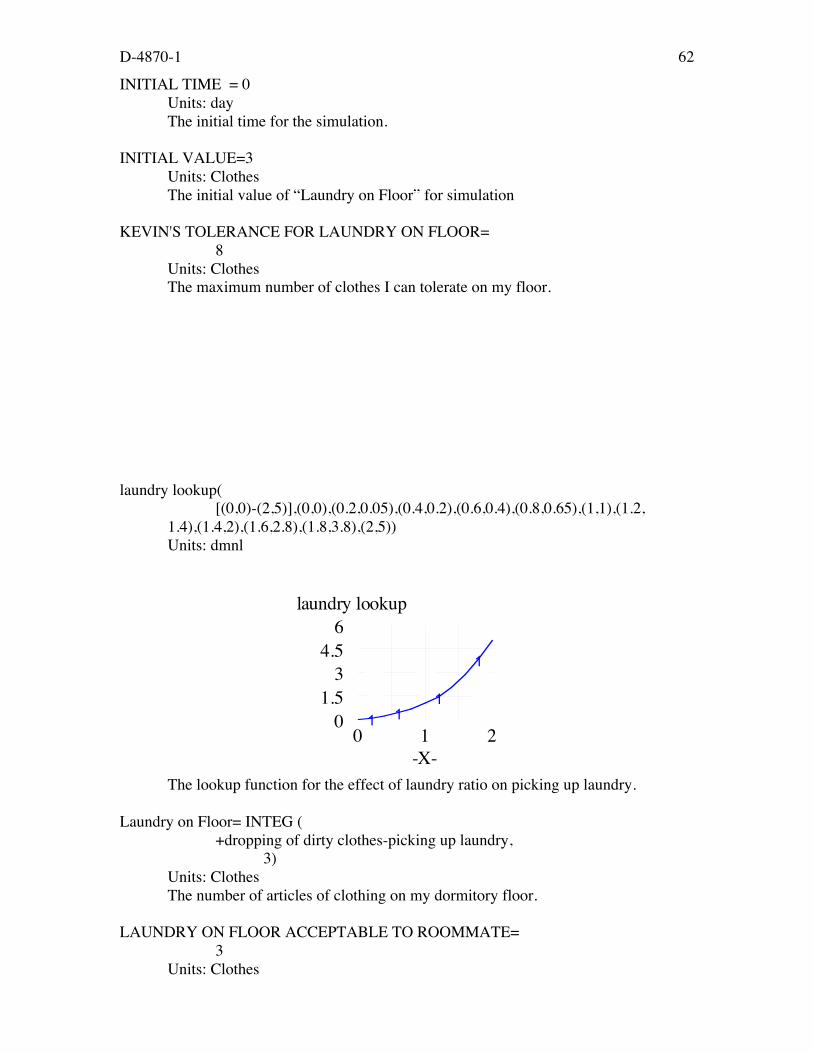
laundry lookup([(0,0)-(2,5)],(0,0),(0.2,0.05),(0.4,0.2),(0.6,0.4),(0.8,0.65),(1,1),(1.2,
1.4),(1.4,2),(1.6,2.8),(1.8,3.8),(2,5))Units: dmnl
The lookup function for the effect of laundry ratio on picking up laundry.
Laundry on Floor= INTEG (+dropping of dirty clothes-picking up laundry,
3)Units: ClothesThe number of articles of clothing on my dormitory floor.
LAUNDRY ON FLOOR ACCEPTABLE TO ROOMMATE=3
Units: Clothes
laundry lookup6
4.53
1.50 1 1
1
1
0 1 2-X-
D-4870-1 63
This is the number of clothes on the floor my roommate findsacceptable (because they don't spill over onto his side of theroom).
laundry ratio=Laundry on Floor/KEVIN'S TOLERANCE FOR LAUNDRY ON FLOOR
Units: dmnlThe ratio of the laundry on the floor to the amount of laundry
that Kevin can tolerate.
laundry to pick up=laundry lookup(laundry ratio)
Units: ClothesThe number of clothes picked up as a function of the laundry
ratio.
picking up laundry=(EFFECT OF COMPLAINING ON PICKING UP LAUNDRY*Daily
Complaints of Roommate) + (laundry to pick up/TIME TO PICK UP LAUNDRY)Units: Clothes / dayThe number of clothes I pick up each day. It is a function of
how many complaints my roommate registers with me. It is also afunction of the ratio of the number of clothes that lie on thefloor to the number of clothes I can tolerate.
SAVEPER = TIME STEPUnits: dayThe frequency with which output is stored.
TIME STEP = 0.0078125Units: dayThe time step for the simulation.
TIME TO PICK UP LAUNDRY=1
Units: dayKevin picks up his clothes once a day.
Modeling the System Using a Lookup Function
Build the model using a Correct Lookup Function by following the steps below:1. Take the model built using an Incorrect Lookup Function.2. Add an arrow from stock “Laundry on Floor” to flow “picking up laundry.3. Change equation for “picking up laundry” to following equation:
picking up laundry=(EFFECT OF COMPLAINING ON PICKING UP LAUNDRY*Daily
Complaints of Roommate
D-4870-1 64
) + (effect of laundry ratio on picking*Laundry on Floor/TIME TO PICK UPLAUNDRY)
Units: Clothes / dayThe number of clothes Kevin picks up each day. It is a function of how many
complaints his roommate registers with him. It is also a function of the ratio of the number of clothes that lie on the floor to the number of clothes he can tolerate. Note how the output of our lookup function, or “effect of laundry ratio on picking,” is used as a multiplier to “NORMAL CLOTHES PICKED UP.”
4. Done
Complete Documentation for Correct Lookup Function model
change in the daily complaints of roommate=EFFECT OF EXCESS LAUNDRY ON ROOMMATE
COMPLAINING*excess laundry for roommateUnits: (Complaints / day) / dayThis flow represents how Kevin’s roommate's amount of complaining changesover time. It is a function of the amount of excess laundry on the floor.
Daily Complaints of Roommate= INTEG (change in the daily complaints of roommate,3)
Units: Complaints/ dayThe number of complaints Kevin’s roommate registers with him each day about
the cleanliness of the room.
dropping of dirty clothes=5
Units: Clothes / dayThe number of dirty clothes Kevin drop on the floor every day. The modelassumes that both Kevin’s roommate's complaining and his own tolerance forlaundry do not stop him from dropping all his clothes on the floor. Instead, thesefactors only change how many clothes he picks up.
EFFECT OF COMPLAINING ON PICKING UP LAUNDRY=1
Units: Clothes / ComplaintsThis variable is the number of extra clothes Kevin will pick up each day if hisroommate increases his complaining by one complaint per day.UNITS: (Clothes / day) / (Complaint / day), or more simply, Clothes / Complaints
EFFECT OF EXCESS LAUNDRY ON ROOMMATE COMPLAINING=1
Units: ((Complaints / day) / day) / ClothesThis constant reflects how Kevin’s roommate increases his complaining based on
the addition of one more article of clothing to the floor.
effect of laundry ratio on picking=
D-4870-1 65
laundry lookup(laundry ratio)Units: dmnlThe number of clothes picked up as a function of the laundry ratio. Rememberthat correct usage of a lookup function uses a dimensionless input to produce amultiplier value, which is then used to have a multiplier effect on a NORMALVALUE. Here, “laundry lookup” takes a dimensionless ratio as an input,“laundry ratio,” and outputs a dimensionless (dmnl) value, “effect of laundry ratioon picking,” which will be used as a multiplier.
D-4870-1 66
excess laundry for roommate=Laundry on Floor-LAUNDRY ON FLOOR ACCEPTABLE TO
ROOMMATEUnits: ClothesThis variable is the difference between the number of articles of clothing on thefloor and the number of articles acceptable to Kevin’s roommate.
FINAL TIME = 20Units: dayThe final time for the simulation.
INITIAL TIME = 0Units: dayThe initial time for the simulation.
KEVIN'S TOLERANCE FOR LAUNDRY ON FLOOR=8
Units: ClothesThe maximum number of clothes Kevin can tolerate on the floor.
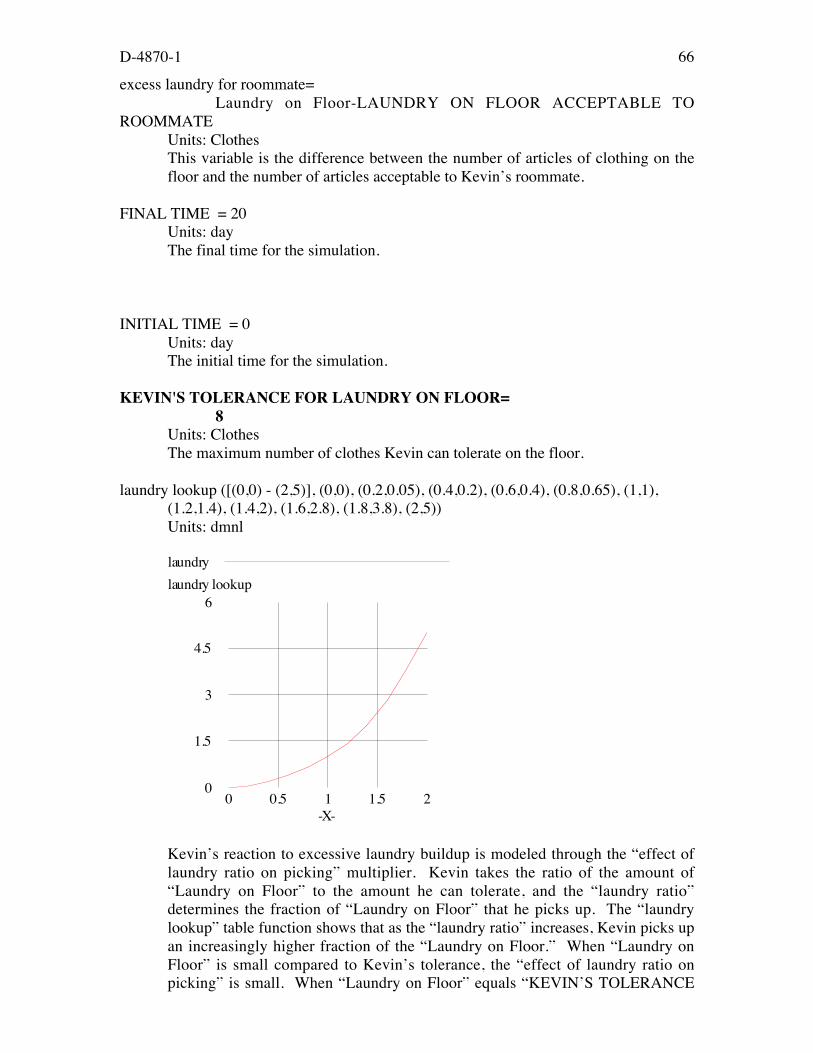
laundry lookup ([(0,0) - (2,5)], (0,0), (0.2,0.05), (0.4,0.2), (0.6,0.4), (0.8,0.65), (1,1),(1.2,1.4), (1.4,2), (1.6,2.8), (1.8,3.8), (2,5))Units: dmnl
laundry
laundry lookup6
4.5
3
1.5
00 0.5 1 1.5 2
-X-
Kevin’s reaction to excessive laundry buildup is modeled through the “effect oflaundry ratio on picking” multiplier. Kevin takes the ratio of the amount of“Laundry on Floor” to the amount he can tolerate, and the “laundry ratio”determines the fraction of “Laundry on Floor” that he picks up. The “laundrylookup” table function shows that as the “laundry ratio” increases, Kevin picks upan increasingly higher fraction of the “Laundry on Floor.” When “Laundry onFloor” is small compared to Kevin’s tolerance, the “effect of laundry ratio onpicking” is small. When “Laundry on Floor” equals “KEVIN’S TOLERANCE
D-4870-1 67
FOR LAUNDRY ON FLOOR,” he picks up all his laundry over a “TIME TOPICK UP LAUNDRY” equal to 1 day. As “Laundry on Floor” exceeds histolerance, Kevin becomes increasingly unhappy about the mess in his room, so hepicks up more and more laundry.
Laundry on Floor= INTEG (+dropping of dirty clothes-picking up laundry,
3)Units: ClothesThe number of articles of clothing on Kevin’s dormitory floor.
LAUNDRY ON FLOOR ACCEPTABLE TO ROOMMATE=3
Units: ClothesThis is the number of clothes on the floor Kevin’s roommate finds acceptable
(because they don't spill over onto his side of the room).
laundry ratio=Laundry on Floor/KEVIN'S TOLERANCE FOR LAUNDRY ON
FLOORUnits: dmnlThe ratio of the laundry on the floor to the amount of laundry that Kevin cantolerate. Remember that correct usage of a lookup function uses a dimensionlessinput to produce a multiplier value, which is then used to have a multiplier effecton a NORMAL VALUE. Always remember to use dimensionless (dmnl) inputsin models using Lookup Funtions. Ratios are especially effective.
picking up laundry=(EFFECT OF COMPLAINING ON PICKING UP LAUNDRY*Daily
Complaints of Roommate) + (effect of laundry ratio on picking*Laundry on Floor/TIME TO PICK UP
LAUNDRY)Units: Clothes / dayThe number of clothes Kevin picks up each day. It is a function of how many
complaints his roommate registers with him. It is also a function of the ratio of the number of clothes that lie on the floor to the number of clothes he can tolerate. Note how the output of our lookup function, or “effect of laundry ratio on picking,” is used as a multiplier to “NORMAL CLOTHES PICKED UP.”
SAVEPER = TIME STEPUnits: dayThe frequency with which output is stored.
TIME STEP = 0.0078125Units: dayThe time step for the simulation.
D-4870-1 68
TIME TO PICK UP LAUNDRY=1
Units: dayKevin picks up his clothes once a day.