Embed Size (px)
Citation preview
2001 Global Development and Environment Institute, Tufts University
GLOBAL DEVELOPMENT AND ENVIRONMENT INSTITUTE WORKING PAPER 01-02
Mixed Signals: Market Incentives, Recycling and the Price Spike of
1995
Frank Ackerman and Kevin Gallagher
January 2001
Tufts University
Medford MA 02155, USA http://ase.tufts.edu/gdae
G-DAE Working Paper No. 01-02: “Mixed Signals”
1
Mixed Signals: Market Incentives, Recycling and the Price Spike of 1995
Frank Ackerman and Kevin Gallagher1 [email protected], [email protected]
Abstract
Environmental economics assumes that reliance on price signals, adjusted for externalities, normally leads to efficient solutions to environmental problems. We explore a limiting case, when market volatility created “mixed signals”: waste paper and other recycled materials were briefly worth an immense amount in 1994-95, then plummeted back to traditional low levels in 1996. These rapid reversals resulted in substantial economic and political costs. A review of academic and business literature suggests six possible explanations for abrupt price spikes. An econometric analysis of the prices of wood pulp and waste paper shows that factors that explained price changes in 1983-93 contribute very little to understanding the subsequent price spike. From the econometric analysis and from other sources, we conclude that speculation, rather than “rational” economic factors, must have played a major role in the price spike. If speculatively driven price spikes can disrupt an environmentally important industry such as recycling, then the surprising implication for public policy is that measures to control or stabilize prices, far from interfering with the market, may actually help to make it more efficient.
1 Thanks to Sumreen Mirza for skillful assistance in data analysis. Helpful comments on an earlier draft were provided by Maarten DeKadt, Laurie Johnson, Thomas Kinnaman, Paul Ligon, Chaz Miller, Dick Parrott, and Irene Peters.
G-DAE Working Paper No. 01-02: “Mixed Signals”
2
Introduction Does reliance on price signals, adjusted for externalities or missing markets, lead to efficient, cost-minimizing solutions to environmental problems? An affirmative answer to this question is taken for granted in most current discussion of environmental economics. Indeed, the desirability of market-based policy instruments has become the new conventional wisdom of the field. (For influential sources that make the general case for market-based policies, see Baumol and Oates 1988 and Stavins et al. 1988, 1991.) There are important environmental issues for which market-based policies provide an adequate response. But there are equally important limitations to the uses of the market -- and there is a far greater danger, at present, that the limitations will be overlooked. To advance the understanding of the economics of the environment, it is helpful to analyze the limiting cases where the arguments for primary reliance on the market seem to break down. (For a broader discussion of this point see Ackerman and Gallagher 2000). In this paper we explore the problems created by volatility in recycled material prices. What happens when the market sends mixed signals? Our empirical example is a little-studied episode which is important in its own right: the 1995 price spike in the markets for recycled materials. Our goal is to understand that episode, not only for its own sake but also to draw out its implications for theory. Recycling should provide an ideal opportunity to test the effectiveness of market incentives. There are well-established markets in the scrap materials that are recovered by recycling programs. Public sector intervention often boosts the demand for these materials, for example through public procurement policies or recycled content legislation. Such initiatives raise the prices for recovered materials, thereby making recycling more profitable. This implicitly expresses the belief that there are positive environmental externalities associated with recycling of waste materials, which should be internalized through government policy. (For an explicit argument along these lines see Hanley and Slark 1994.) Price movements in scrap markets, whether caused by private market forces or by public intervention, should guide private investment into collection and processing of materials. To a large extent, this is exactly what happens. Yet something went disturbingly wrong with the process in 1995. In examining the events of that year we will focus on the market for recycled paper -- the largest component of municipal recycling both by tonnage and by value, and the commodity for which prices rose fastest and farthest. It may be helpful to provide a brief description of the use of recycled paper in the production process. Paper is made from pulp, an intermediate product which is a soggy mass of fiber; pulp is most often made from wood, which is crushed and mixed with water in a pulp mill. Recycled paper is valuable primarily because it is an alternative source of pulp. Production of recycled pulp involves little more than churning recovered paper and water together in a giant blender, followed by removal of any contaminants that were collected with the paper (and for some grades of paper, removal of as much ink as possible). Some new mills have the capacity to make both virgin and recycled pulp, but many facilities are designed for either
G-DAE Working Paper No. 01-02: “Mixed Signals”
3
one or the other. Pulp and paper production are often vertically integrated, although there are also a significant number of firms which engage in only one stage or the other - enough so that there is a market price for pulp, which figures prominently in our empirical work in Section 3. We will seek to understand the price of waste paper in the context of the economics of the paper industry, and particularly in relation to the price of pulp. We begin in Section 1 with a short discussion of the significance of the events of 1995, followed in Section 2 by a sketch of six theories about price spikes in commodity markets. In Section 3 we then turn to a simple econometric analysis of the trends in prices for pulp and for waste paper, supporting the conclusion that the price dynamics of 1994-96 were qualitatively different from other periods. Based in part on that analysis, we review the evidence for the six theories in Section 4, and conclude in Section 5 with the implications of our findings for recycling markets and for the theory of market incentives. 1. What happened in 1995? There was a time, in 1995, when common recycled materials were immensely valuable. Old newspapers, which had been worth next to nothing as recently as the end of 1993, were briefly selling for $200 per ton; prices of other materials soared as well (see Figure 1, at end of text). Municipalities passed ordinances prohibiting theft of the precious recyclables from curbside collection boxes. For recycling advocates and enterprises it was an exhilarating moment -- and a fleeting one. By 1996, in some cases even by late 1995, the sky-high prices had fallen back to earth. Those who responded to the market signals of 1995 saw their fortunes falling as well. More than $1 billion was invested in planned recycled paper mills in 1994-95, most of which had closed by 1997 (Schifrin 1997). Prins Recycling, the leading processor of recycled materials collected in Boston, Pittsburgh, and several other cities, had 500 employees and $77 million revenues in 1995; it made long-term commitments to continue paying high 1995 prices for the materials it received, and went bankrupt by mid-1996. With somewhat less agony and drama, but still with significant losses, the leading waste management companies cut back sharply on their recycling divisions, which they had only recently expanded. It is difficult to interpret these events as efficient responses to market signals, although we will consider that possibility in the next section. At the least a subtler, more guarded interpretation of price signals is needed when dealing with cyclical or volatile prices. It cannot be efficient to make large, long-term investments on the basis of fast-changing prices. Unfortunately, there is no simple way to determine which price changes should be dismissed as noise, and which should be treated as the true signal. It is not always the case that rapid price changes are rapidly reversed. A remarkably complete understanding of the dynamics of world commodity markets would have been required to correctly anticipate the abrupt reversal of the 1994-95 surge in scrap prices.
G-DAE Working Paper No. 01-02: “Mixed Signals”
4
That is, there are substantial information processing requirements for an efficient response to price signals in a volatile market, since short and medium-term volatility must be correctly filtered out. Many, perhaps most, industry participants seemed to lacked that capability and were unpleasantly surprised by the effects of the price spike of the mid-1990s. (Although the market for scrap paper has existed for decades, it expanded rapidly in the late 1980s and 1990s, implying that many participants may have been new and inexperienced at the time of the price spike.) It was not only businesses who overreacted to the price spike. Recycling advocates in the early 1990s presented their cause as an environmental crusade; those who spoke the language of economic theory would have asserted that their efforts were justified by large unpriced externalities associated with the production and disposal of materials. However, as prices rose in 1994-95, many abandoned this argument in favor of the simpler, stronger claim that recycling was an immediately profitable, or cost-reducing, activity for municipalities to engage in. It was an easy case to make, during the brief period in which it was obviously true. The critics were not kind to the claims of profitability as prices, all too soon, began to fall. (The most notorious critic was Tierney 1996; for interpretation of the debate see Ackerman 1997). 2. Six theories of price spikes The 1995 spike was neither the first nor the last sudden increase in scrap prices. A previous peak occurred in the late 1980s; a more recent upsurge occurred in 1999 and early 2000. (The 1995 spike was bigger and, as we will see, harder to explain than the ones before and after it.) Why does this keep happening? Could the same thing happen to other environmentally significant prices, with similarly chaotic impacts? Abrupt price spikes are surprisingly common in bulk commodity markets, and a number of theories have been proposed to explain them. In this section we present six theories that are potentially relevant to the events of 1995. The first five - two derived from academic economics, and three suggested by the business press - offer detailed mechanisms that can cause price spikes. Several of these theories are compatible with models of rational behavior, in the sense that economists have traditionally understood the term. The sixth theory is that price spikes represent speculative bubbles with little or no rational foundation. A. In some market structures, inventory fluctuations may cause price spikes. The recent pattern of recycled material prices is far from unique in the history of commodity markets. Many bulk commodity prices display qualitatively similar patterns: long periods of relatively small fluctuations are punctuated at irregular intervals by sharp upward spikes; similar downward spikes are quite rare by comparison. Could this pattern be the natural result of a particular market structure?
G-DAE Working Paper No. 01-02: “Mixed Signals”
5
An article by Deaton and Laroque (1992) demonstrates that episodic price spikes for agricultural commodities can be produced by a competitive market with storage. Assume that there is inelastic demand, and large, unpredictable annual variation in the supply of a commodity, perhaps caused by the effects of weather on harvests. Traders will buy and store excess supply in years of good harvests in order to sell it in bad years, thereby dampening the tendency toward price increases from a single bad harvest. Occasionally, however, random variation will lead to consecutive bad harvests, exhausting the traders’ inventories. At that point the price will shoot up abruptly, returning to a lower level at the time of the next good harvest. Generalization of this model to non-agricultural commodities has proved difficult, as the same authors candidly report (Deaton and Laroque 1996). An analysis of daily fluctuations in metals prices (Brunetti and Gilbert 1995) develops a related model, in which the available stock of metals usually dampens price fluctuations; the model accurately predicts that day-to-day price volatility is higher when stocks are low relative to consumption. Like the agricultural model, the metals model is analyzing price fluctuations over an interval much shorter than the time required to increase production -- which, in both cases, is the underlying reason why lack of inventory leads to price spikes. An exactly analogous model for paper could only explain price spikes of very short duration, shorter than the time it takes to expand paper production. Inventory fluctuations still could have been one of several factors contributing to the 1994-95 price spike in recycled paper, even if they are not the sole cause. B. Macroeconomic trends may cause coordinated movement of commodity prices. Development economists analyzing the problems of very poor, commodity-exporting nations have identified the phenomenon of “comovement” of commodity prices: world prices for unrelated commodities often move up and down in a synchronized fashion. The development literature has debated whether or not there are common macroeconomic causes for commodity price comovement. In an examination of prices for nine unrelated bulk commodities, Pindyck and Rotemberg (1990) found that there was “excess comovement” well beyond anything that they could explain by the common effects of past, current, or expected future values of macroeconomic variables. They guessed that excess comovement is due to the herdlike behavior of commodity traders, who influence each other’s optimism or pessimism about the direction of the markets. In contrast, Deb et al. (1996) performed a similar analysis using different statistical tests, and found only weak evidence of excess comovement; for them, macroeconomic trends explained most or all of the observed coordination in commodity price movements. U.S. recycled materials prices could also be described as exhibiting a high degree of co-movement in the mid-1990s, as seen in Figure 1. The same question could be posed about these prices: If there were common macroeconomic causes for these price movements, the mystery would be solved. On the other hand, if there were excess
G-DAE Working Paper No. 01-02: “Mixed Signals”
6
comovement that could not be explained by macroeconomic trends, one might suspect that speculative or other socially coordinated influences were at work. C. Lags in capacity adjustment may lead to high prices in periods of rapid growth. Fluctuations in prices, output and capacity are the subjects of continual commentary in business periodicals. In the paper industry, trade publications such as Pulp & Paper suggest that major firms are always scrambling, often somewhat belatedly, to respond to the latest phase of the business cycle. Starting from the bottom of the cycle, the producers wait too long to expand. As a result demand rises while capacity is still limited, driving prices up sharply. Then when producers do build new capacity, it is too much and/or too late, glutting the market late in the cycle and forcing prices down. A slump ensues, and the cycle begins again. Thus one theory derived from the trade press is that the 1995 price hikes reflected a normal cyclical imbalance. The previous cyclical peak in the late 1980s led to very high paper prices, which induced over-expansion of capacity. From 1989 to 1993 prices plummeted and little new capacity was added. Then as demand revived in 1994, the industry was again unprepared and slow to expand; prices soared until capacity caught up with production. This is a far cry from recent fashions in microeconomic theory, which assume that market participants have substantial forecasting capabilities and use them to form “rational expectations.” The twists and turns of the paper industry as seen in the trade press are closer to the simple, long-discarded cobweb model, with its repeatedly irrational expectations that current market conditions will persist. If lagged cyclical overreaction is the norm, then price spikes can be expected once per cycle, at the point of (eternally unexpected) rapid growth in demand. D. Government policies to promote recycling raised the price of recycled paper in 1994-95. In contrast to the previous story about businesses continually scrambling to catch up, imagine the situation of a paper company that tried to look ahead from the early 1990s. The popularity of recycling was spreading rapidly across the U.S.; a number of states had recently adopted recycled content laws mandating the use of newsprint with recycled content. The Clinton administration announced in late 1993 that by 1998 all paper purchased by the federal government would have to have 30 percent recycled content. A paper company could easily have concluded that the time was right to make a big investment in recycled paper production. The public sector was also involved in a more important but less obvious way, according to an article in Forbes (Schifrin 1997). The 1993 executive order on recycled paper announced that bonds used to pay for investment in recycled paper mills would be exempt from federal taxes. Several leading brokerage firms were looking for new tax-exempt bonds to sell, and promoted the recycled paper mill bonds heavily, selling $1 billion of them in 1994 and 1995. At one point, planned new facilities amounted to three
G-DAE Working Paper No. 01-02: “Mixed Signals”
7
times existing paper recycling capacity. When the first new mills opened, their purchases increased the demand for recycled paper. But it soon became clear that the industry was, or was about to be, overbuilt. By 1997 at least seven major new facilities, representing an investment of more than $500 million, had been closed, most of them defaulting on their bonds. The Forbes article, entitled “Sue the White House?”, is full of partisan hostility toward recycling, environmental protection, and the Clinton administration. Nonetheless, its hypothesis deserves dispassionate consideration. E. Changes in export demand are a major influence on U.S. scrap paper prices. A final source in the business press offers yet another interpretation, based on changes in export markets. The U.S. is a net exporter of scrap paper, supplying large amounts of recovered paper to Mexico, Korea, Japan and other countries with limited forest resources. Throughout the early 1990s, consumption of paper was growing particularly rapidly in Korea and other Asian countries (excluding Japan), helping to drive up the price of both virgin pulp and scrap paper. Normally, scrap paper sells for so little that recycled pulp is cheaper than virgin. However, according to the Economist (1997), the unusually high 1995 prices made it profitable for foreign (virgin) pulp mills to increase production and compete for markets formerly supplied by American waste paper. As pulp from other countries became more widely available, demand for U.S. scrap exports dropped and prices returned to a normal, low level. Generalizing this hypothesis somewhat, it could be the case that U.S. prices are driven by fluctuations in export markets, as well as by domestic economic conditions. F. Speculation is a major cause of the 1995 price spike. Speculative bubbles are a familiar fact of economic life, with well-known examples stretching back over several centuries. There is strong evidence for speculative or crowd-following behavior even in large, long-established U.S. financial markets where “rational” investors might seem most likely to predominate (Schiller 1989 - written before the stock market boom of the 1990s). The literature on the subject is far too extensive for comprehensive summary; one strand of theoretical analysis is captured in a review article on “informational cascades” (Bikhchandani et al 1998). If market participants have limited sources of information, they may find that the current market behavior of others provides at least as much information as they can obtain in any other way. Under this assumption, crowd-following is rational for the individual, and the behavior of a few innovators can start a massive cascade of imitation. Speculation is an obvious candidate to explain the 1995 price spike. It can easily account for the comovement of many different prices: once one or two materials experienced
G-DAE Working Paper No. 01-02: “Mixed Signals”
8
price increases, all recycled material prices might have been subject to speculative pressures. In the econometric analysis, to which we now turn, we will attempt to explain price changes on grounds other than speculation. Failure to explain the price spike (which is our essential result) strengthens the presumption that speculation is involved. Following the econometric results, we return to an evaluation of each of the six theories, including anecdotal direct evidence of the role of speculation. 3. The simple econometrics of pulp and waste paper prices Since recycled paper is used to make pulp, we would expect the price of waste paper to be closely related to the price of pulp. In this section we develop simple econometric models of both prices, as functions of each other and of a number of other explanatory variables. Producer price indices for both pulp and waste paper are published by the Bureau of Labor Statistics. Monthly data are available on a continuous basis beginning in July 1983 (see appendix for description of data). Figures 2 and 3 show the logarithms of real prices of pulp and waste paper over this period, with vertical lines at the beginning of 1994. Our strategy is to develop models for these price series based on the data before 1994 -- to the left of the vertical lines -- and then project those models forward to see how closely they fit the data for the price spike and beyond. The explanatory variables we tested are listed in Table 1. Several of the variables - wages, capacity utilization, and inventory-to-shipment ratio - are readily available only for the paper industry as a whole (i.e. for the 2-digit industry, which includes pulp as well as paper production). However, these variables may still provide useful indications of conditions in pulp and waste paper markets. Table 1: Explanatory variables for pulp and waste paper price models Input prices: hourly wages for paper industry production workers price of pulpwood price of crude oil price of electricity to industrial customers Macroeconomic variables: real GDP U.S./Canadian exchange rate Industry operating statistics: capacity utilization in the paper industry ratio of paper industry inventories to shipments
G-DAE Working Paper No. 01-02: “Mixed Signals”
9
More detail on the data series is provided in the appendix. To deal with the problem of serial autocorrelation in the price series, we modeled first differences, i.e. month-to-month changes in log real prices. Supply and demand: Pulp The price of pulp could be affected by both supply and demand factors. On the supply side, input prices such as wages, energy prices, and the price of pulpwood logs (for virgin pulp) and waste paper (for recycled pulp) could all influence the price of pulp. Increases in any of these input prices would be expected to cause increases in the price of pulp. On the demand side, growth of income (GDP) should increase the demand for paper, and hence drive up the price of pulp. Turning to the effects of trade, Canada is the only significant source of pulp and paper imports in the U.S., and the leading competitor for export markets. Therefore a decline in the value of the Canadian dollar should make Canadian products cheaper in U.S. dollars, holding down U.S. prices throughout the paper industry. Two industry operating statistics, capacity utilization and the ratio of inventory to shipments, are in effect measures of monthly variation in demand. Both a higher capacity utilization and a lower ratio of inventory to shipments are signs that demand is approaching supply constraints, so both should be associated with increasing pulp and paper prices. Supply and demand: Waste paper For waste paper, it is difficult to model the supply. Large quantities of both commercial and residential waste paper are routinely recycled. The total supply rests on the behavior of millions of households and businesses, as expressed through thousands of recycling programs and enterprises. For households, at least, it seems unlikely that there is any significant response to the price of scrap paper; attitudes toward and participation in recycling are not primarily market-driven (Ackerman 1997). Rather, there has been a steady expansion of recycling programs around the country since the late 1980s. The supply of waste paper from businesses includes large quantities of production wastes (trimmings, misprints, overstock, etc.) from paper and printing companies, as well as the used office paper, cardboard boxes, and other items which are collected from end users in the waste management process. Production wastes are the cleanest and most valuable; their supply is roughly proportional to total paper production, and is largely insensitive to price (see the analogous argument for metal scrap in Tilton 1999). Commercial and institutional paper recycling may be somewhat more sensitive to market conditions, but waste management is a very small factor in the costs of most enterprises. Only a portion of the paper recycling in the commercial sector comes from enterprises that respond to scrap price incentives in the expected manner. Changing employee attitudes toward recycling, combined with the gradual spread of workplace recycling programs, may be more important than price signals for many firms where waste
G-DAE Working Paper No. 01-02: “Mixed Signals”
10
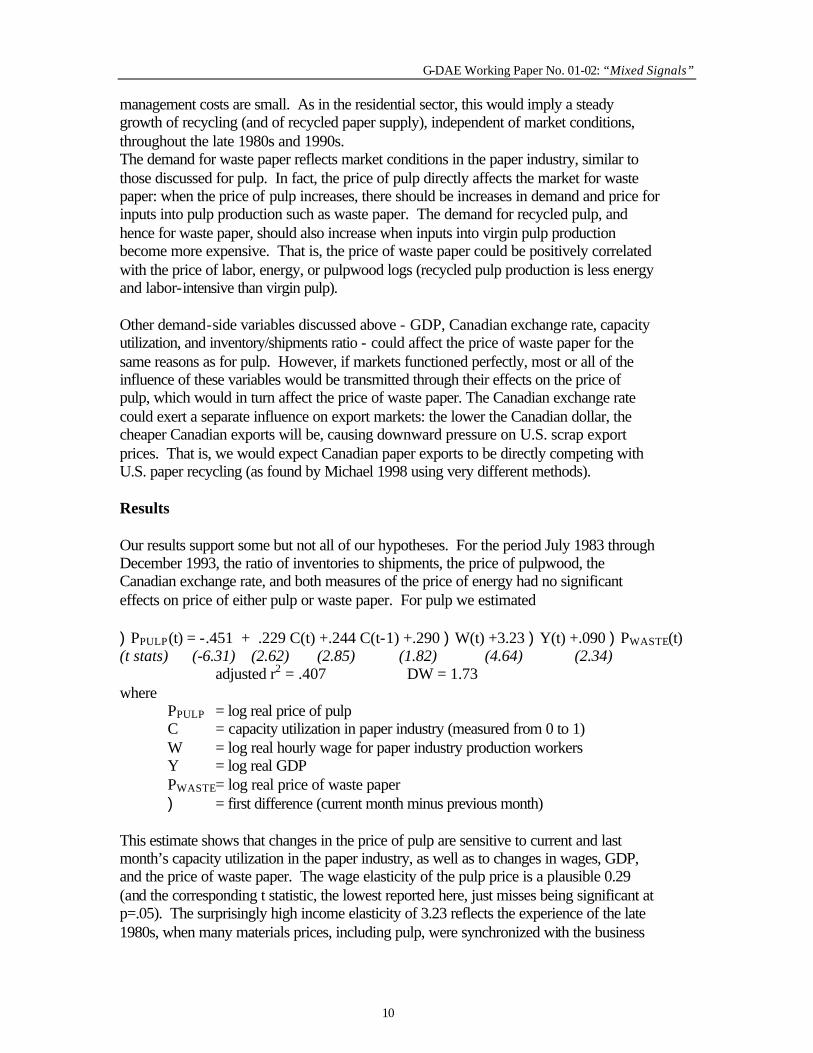
management costs are small. As in the residential sector, this would imply a steady growth of recycling (and of recycled paper supply), independent of market conditions, throughout the late 1980s and 1990s. The demand for waste paper reflects market conditions in the paper industry, similar to those discussed for pulp. In fact, the price of pulp directly affects the market for waste paper: when the price of pulp increases, there should be increases in demand and price for inputs into pulp production such as waste paper. The demand for recycled pulp, and hence for waste paper, should also increase when inputs into virgin pulp production become more expensive. That is, the price of waste paper could be positively correlated with the price of labor, energy, or pulpwood logs (recycled pulp production is less energy and labor-intensive than virgin pulp). Other demand-side variables discussed above - GDP, Canadian exchange rate, capacity utilization, and inventory/shipments ratio - could affect the price of waste paper for the same reasons as for pulp. However, if markets functioned perfectly, most or all of the influence of these variables would be transmitted through their effects on the price of pulp, which would in turn affect the price of waste paper. The Canadian exchange rate could exert a separate influence on export markets: the lower the Canadian dollar, the cheaper Canadian exports will be, causing downward pressure on U.S. scrap export prices. That is, we would expect Canadian paper exports to be directly competing with U.S. paper recycling (as found by Michael 1998 using very different methods). Results Our results support some but not all of our hypotheses. For the period July 1983 through December 1993, the ratio of inventories to shipments, the price of pulpwood, the Canadian exchange rate, and both measures of the price of energy had no significant effects on price of either pulp or waste paper. For pulp we estimated )PPULP(t) = -.451 + .229 C(t) +.244 C(t-1) +.290 )W(t) +3.23 )Y(t) +.090 )PWASTE(t) (t stats) (-6.31) (2.62) (2.85) (1.82) (4.64) (2.34) adjusted r2 = .407 DW = 1.73 where PPULP = log real price of pulp C = capacity utilization in paper industry (measured from 0 to 1) W = log real hourly wage for paper industry production workers Y = log real GDP PWASTE= log real price of waste paper ) = first difference (current month minus previous month) This estimate shows that changes in the price of pulp are sensitive to current and last month’s capacity utilization in the paper industry, as well as to changes in wages, GDP, and the price of waste paper. The wage elasticity of the pulp price is a plausible 0.29 (and the corresponding t statistic, the lowest reported here, just misses being significant at p=.05). The surprisingly high income elasticity of 3.23 reflects the experience of the late 1980s, when many materials prices, including pulp, were synchronized with the business
G-DAE Working Paper No. 01-02: “Mixed Signals”
11
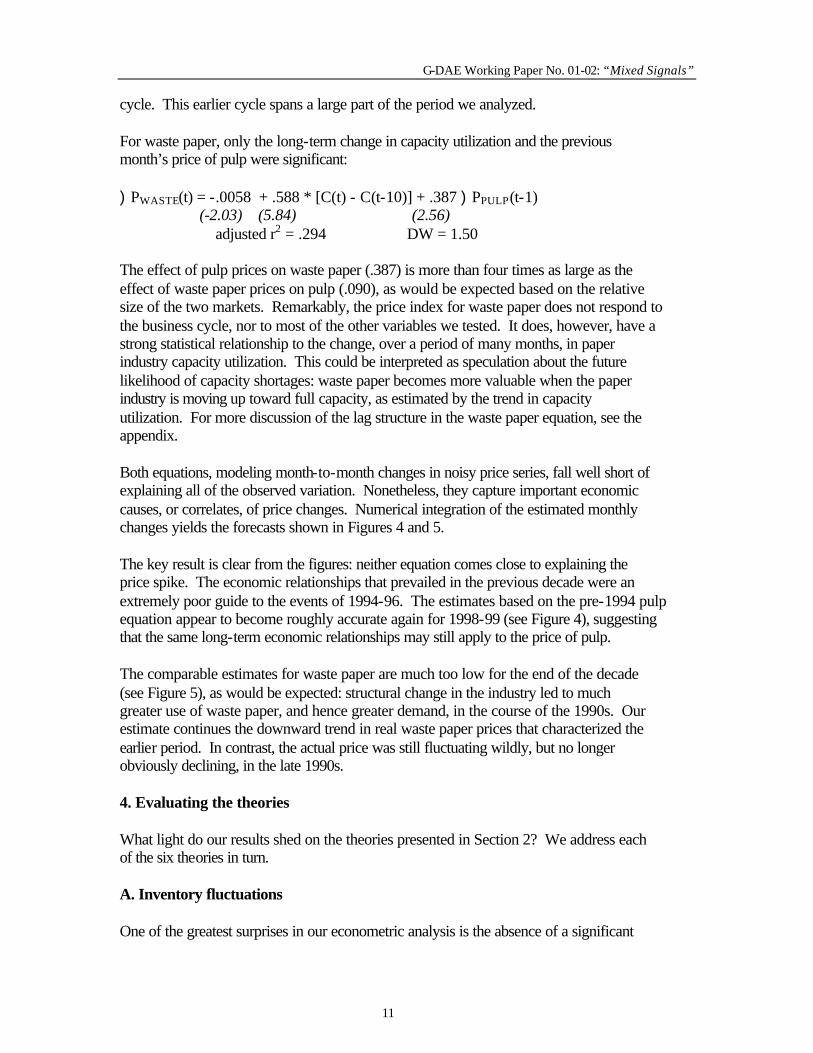
cycle. This earlier cycle spans a large part of the period we analyzed. For waste paper, only the long-term change in capacity utilization and the previous month’s price of pulp were significant: )PWASTE(t) = -.0058 + .588 * [C(t) - C(t-10)] + .387 )PPULP(t-1) (-2.03) (5.84) (2.56) adjusted r2 = .294 DW = 1.50 The effect of pulp prices on waste paper (.387) is more than four times as large as the effect of waste paper prices on pulp (.090), as would be expected based on the relative size of the two markets. Remarkably, the price index for waste paper does not respond to the business cycle, nor to most of the other variables we tested. It does, however, have a strong statistical relationship to the change, over a period of many months, in paper industry capacity utilization. This could be interpreted as speculation about the future likelihood of capacity shortages: waste paper becomes more valuable when the paper industry is moving up toward full capacity, as estimated by the trend in capacity utilization. For more discussion of the lag structure in the waste paper equation, see the appendix. Both equations, modeling month-to-month changes in noisy price series, fall well short of explaining all of the observed variation. Nonetheless, they capture important economic causes, or correlates, of price changes. Numerical integration of the estimated monthly changes yields the forecasts shown in Figures 4 and 5. The key result is clear from the figures: neither equation comes close to explaining the price spike. The economic relationships that prevailed in the previous decade were an extremely poor guide to the events of 1994-96. The estimates based on the pre-1994 pulp equation appear to become roughly accurate again for 1998-99 (see Figure 4), suggesting that the same long-term economic relationships may still apply to the price of pulp. The comparable estimates for waste paper are much too low for the end of the decade (see Figure 5), as would be expected: structural change in the industry led to much greater use of waste paper, and hence greater demand, in the course of the 1990s. Our estimate continues the downward trend in real waste paper prices that characterized the earlier period. In contrast, the actual price was still fluctuating wildly, but no longer obviously declining, in the late 1990s. 4. Evaluating the theories What light do our results shed on the theories presented in Section 2? We address each of the six theories in turn. A. Inventory fluctuations One of the greatest surprises in our econometric analysis is the absence of a significant
G-DAE Working Paper No. 01-02: “Mixed Signals”
12
relationship between price changes and the ratio of inventories to shipments. If an inventory model were appropriate for the mid-1990s price spike, it seems likely that the inventory variable would be more strongly related to prices in the preceding years. The relationship between inventories and prices is stronger during 1994-96 than it was in the preceding decade. However, the movement in the inventory/shipment ratio was modest: averaging 1.23 in 1983-93, and 1.26 in 1993 alone, it dropped only to a minimum of 1.05 in June 1995 before rebounding. Moreover, the timing is wrong for a model in which inventory declines cause price hikes. The prices of both pulp and waste paper reached lows in November 1993 and then began rising steadily; the inventory/shipment ratio did not fall noticeably below its 1993 level until June 1994, seven months into the price surge. This is the pattern that would be expected if unexpected price increases caused panic buying in an attempt to beat future price rises, as discussed below. Then price increases cause unexpected increases in purchases, eventually decreasing inventories. B. Macroeconomic trends This hypothesis would provide a satisfying answer if there were any common macroeconomic factors driving up commodity prices in 1995. If, for example, the year had been a business cycle peak, with demand approaching or surpassing full capacity in numerous industries, then recycled materials might have been suddenly more in demand. However, this did not occur. The business cycles of leading industrial countries were less synchronized in the early 1990s than in the 1980s; in fact, business cycle troughs occurred in 1991 in the U.S., in 1993 in several European countries, and in 1995 in Japan (IMF 1996). As subsequent events revealed, 1995 was not a business cycle peak in the U.S., nor in most other economies. Common macroeconomic trends provide a better explanation for the previous, late 1980s peak in scrap prices, and for the subsequent peak in early 2000. At those times, international business cycles were more closely synchronized, and many industries were expanding rapidly. If recycled materials are viewed by industry as a less desirable substitute for virgin materials, then it is easy to imagine that they are suddenly more in demand when virgin material production reaches its limits. This theory is a plausible explanation for the late 1980s and for 2000, but does not fit the facts for 1995. Our econometric results are relevant here: if it were true that macroeconomic trends caused the coordinated increases in many prices in 1994-95, then it should be possible to estimate an equation that fits the data both before and during the price spike. Our failure to do so does not, of course, prove that it is impossible; there is plenty of room to improve on our estimates, particularly for waste paper. However, our results do show that no simple function of GDP, capacity utilization, inventories, wages, energy prices, and exchange rates will do the trick. Accordingly, we doubt that there is a common macroeconomic cause of the 1995 spike in materials prices.
G-DAE Working Paper No. 01-02: “Mixed Signals”
13
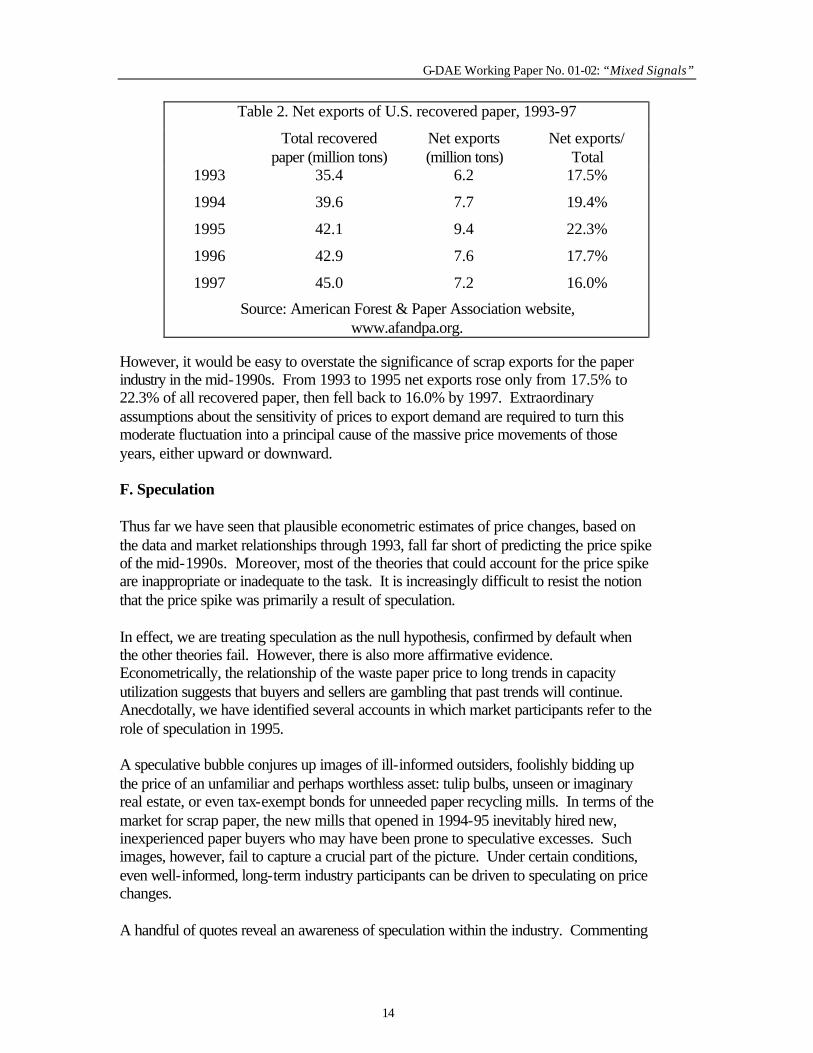
C. Capacity adjustment lags On any theory, capacity adjustments are crucial to pulp and paper prices, reflecting the industry’s high fixed costs. The high degree of uncertainty about the appropriate level of capacity is illustrated by the fact that 38 percent of major capacity expansions in the paper industry announced between 1978 and 1991 were never completed (Christensen and Caves 1997). However, this does not mean that the industry is always out of step with demand. If industry’s lagged overreaction to cyclical fluctuations were to blame, then there should be a negative relationship between current capacity utilization and past price changes. As prices go up, industry overinvests in new capacity, so capacity utilization eventually goes down. As prices go down, industry stops investing, capacity stops growing, and capacity utilization eventually goes up. In separate explorations of our database, we have failed to find any evidence of this relationship. Thus we doubt the importance of persistent lagged overreactions. D. Government intervention Changes in public policy undoubtedly played a part in increasing the prices of recycled paper in 1994-95. In contrast to the other theories, government intervention should have shifted demand from virgin to recycled production. If this was a major factor in paper markets, the price for competing virgin materials should have gone down as a result. On this theory one would expect that the price of waste paper would rise above the forecast based on pre-1994 conditions, while the price of pulp would fall below the corresponding forecast. Yet Figure 4 makes it clear that the price of pulp, like waste paper, rose sharply above the forecast during the price spike. The effect of government intervention evidently was swamped by other factors. E. Export demand At first glance this theory is broadly consistent with the facts; exports of U.S. scrap paper did rise and then fall sharply, as shown in Table 2. The increase in the quantity of exports coincided with the increase in price, confirming that there was a shift in demand. Likewise, the decrease in exports coincided with the decrease in price, again providing evidence of a demand shift. In contrast, the overall supply of recovered paper grew almost steadily, driven by the spread of local recycling programs rather than by the market.
G-DAE Working Paper No. 01-02: “Mixed Signals”
14
However, it would be easy to overstate the significance of scrap exports for the paper industry in the mid-1990s. From 1993 to 1995 net exports rose only from 17.5% to 22.3% of all recovered paper, then fell back to 16.0% by 1997. Extraordinary assumptions about the sensitivity of prices to export demand are required to turn this moderate fluctuation into a principal cause of the massive price movements of those years, either upward or downward. F. Speculation Thus far we have seen that plausible econometric estimates of price changes, based on the data and market relationships through 1993, fall far short of predicting the price spike of the mid-1990s. Moreover, most of the theories that could account for the price spike are inappropriate or inadequate to the task. It is increasingly difficult to resist the notion that the price spike was primarily a result of speculation. In effect, we are treating speculation as the null hypothesis, confirmed by default when the other theories fail. However, there is also more affirmative evidence. Econometrically, the relationship of the waste paper price to long trends in capacity utilization suggests that buyers and sellers are gambling that past trends will continue. Anecdotally, we have identified several accounts in which market participants refer to the role of speculation in 1995. A speculative bubble conjures up images of ill-informed outsiders, foolishly bidding up the price of an unfamiliar and perhaps worthless asset: tulip bulbs, unseen or imaginary real estate, or even tax-exempt bonds for unneeded paper recycling mills. In terms of the market for scrap paper, the new mills that opened in 1994-95 inevitably hired new, inexperienced paper buyers who may have been prone to speculative excesses. Such images, however, fail to capture a crucial part of the picture. Under certain conditions, even well-informed, long-term industry participants can be driven to speculating on price changes. A handful of quotes reveal an awareness of speculation within the industry. Commenting
Table 2. Net exports of U.S. recovered paper, 1993-97
Total recovered paper (million tons)
Net exports (million tons)
Net exports/ Total
1993 35.4 6.2 17.5%
1994 39.6 7.7 19.4%
1995 42.1 9.4 22.3%
1996 42.9 7.6 17.7%
1997 45.0 7.2 16.0%
Source: American Forest & Paper Association website, www.afandpa.org.
G-DAE Working Paper No. 01-02: “Mixed Signals”
15
on the 1995 price spike, a Midwestern paper broker told a journalist, “When buyers sense a future rise in prices, they buy as soon as possible and contribute to demand, which in turn pushes the price up further... when buyers sense that prices are going to fall, they back off to see if prices will go lower. When buyers back off, demand goes down, which in turn causes prices to fall further.” (NRC 1996) A columnist in Pulp & Paper elaborated on the same theme: “The reality is that each member of the chain, from the forest to the merchant, can and does amplify, even distort, the impact of the business cycle. Forest owners can hold back wood sales in anticipation of higher prices tomorrow... The paper maker -- seeing apparent orders mounting, seeking pulp price hedging, and nervous about the fixed capacity of the pulp pipeline -- moves fast to secure pulp stocks... Merchants -- also believing the [supply] chain to be inflexible -- exaggerate order levels into waves, each merchant seeking apparent supply security and price hedging, but in actuality stretching the chain to its limits... Each member of the chain behaves logically in terms of the perceived constraints and nature of their businesses, in the face of competitive demands.” (Wilson 1997) A final quote, from a market research report by the U.S. Commerce Department, describes the dynamics of paper prices in Europe in 1995: “The high demand for finished paper products at the beginning of 1995 created a temporary pulp shortage during the second quarter, resulting in an increase of prices from $700 to $925/ton. This price rise caused pulp buyers to increase their orders in anticipation of further price hikes, creating a ‘false’ demand for pulp until the fall of 1995 and filling inventories to capacity.” (Bellelis 1997) On this model, the cause of price increases is the fact that prices are increasing. Rational buyers scramble to buy more before the price increases even farther. Once anything creates an awareness of greater than expected price increases -- perhaps a small surge in export demand, perhaps a small push from government policy -- then everyone, even those who ultimately know better, will be driven to behave in ways that make prices rise even faster. These are the conditions that create an “informational cascade,” as discussed in Section 2. 5. Conclusions In the end, what does the 1995 price spike for recycled materials mean for the theory of markets and market incentives? The market briefly sent a powerful, misleading signal about the merits of a category of environmentally significant investments, probably based largely or entirely on speculation. The market then abruptly reversed itself, sending a very different signal. Responding to these mixed signals, investors lost substantial sums of money, businesses dedicated to recycling were driven out of business, and advocates and policy makers were left confused and disorganized. The outcome, in short, was the antithesis of efficiency. Purchasers trapped in a speculative price spiral behave, on a limited scale, like everyone does during episodes of hyperinflation: when prices are rising rapidly, it is better to buy
G-DAE Working Paper No. 01-02: “Mixed Signals”
16
now before your money loses more of its purchasing power. The importance of preventing hyperinflation is widely understood and accepted; efficient and sensible economic activity is impossible when prices are soaring rapidly upward. Indeed, any threat of even a modest level of inflation now inspires active countermeasures from the Federal Reserve, the one area in which there is currently a broad political consensus supporting public intervention in the market economy. If price stability is so important for the economy as a whole, can it be unimportant for particular industries? Since there are substantial sunk costs of industry-specific physical and human capital, there is a limit to the velocity at which resources can efficiently flow in response to changing price signals. Attempts to exceed that speed limit can result in losses like those seen in recycling in the mid-1990s. Most markets are stable most of the time; speculative price spirals are the exception, not the rule. Thus one important question concerns the sources of price volatility. An analysis of metals markets in the 1980s identified the growing reliance on commodity exchanges and the decreasing concentration of the industry as sources of increasing volatility (Slade 1991). That is, competitive market structures, as evidenced by auction-type exchanges and low concentration ratios, may actually promote price instability. The stock market, another auction-type market with numerous participants, is a case in point. The accounts of speculation in the paper industry, quoted in Section 4, could be seen as reflecting the lack of vertical integration: the paper product life cycle involves several sequential transactions, each of which is vulnerable to speculative pressures. The fact that “perfect competition” is essentially unknown in reality, and price stickiness remains pervasive throughout the U.S. economy (Blinder et al. 1998) may be a source of strength, not weakness. Oligopolies with explicit and implicit contracts, taking months rather than days to respond to market signals, are far less prone to speculative price spirals than, say, day traders and commodity brokers. From this perspective, the instability of recycling prices in 1995 could reflect the relative novelty and recent supply expansion of recycled materials. The surge in recycling efforts, starting in the late 1980s, had led to large increases in the quantity of recovered materials; these materials were not yet firmly integrated into industrial production processes by the mid-1990s. As the new supply of materials is eventually incorporated into long-term contracts, the opportunities for price volatility will diminish. The next price spike, in 2000, was somewhat smaller; in that year the peak real price of waste paper was “only” three times its previous trough, compared to five times the previous trough in 1995. However, with prices only tripling now and then, one cannot say that price stability has been achieved in scrap paper markets. The implication for public policy is that efforts to stabilize recycling prices, far from interfering with the market, can make it more efficient. Working to create new markets for recycled materials, a popular strategy for state recycling agencies, may lead toward reduced volatility, and thus to fewer unpleasant surprises and speculative losses of the sort seen in the mid-1990s. Looking beyond the range of current strategies, would price
G-DAE Working Paper No. 01-02: “Mixed Signals”
17
ceilings or limits on the rate of price increases have helped to puncture the bubble in recycled paper markets, and ultimately reduced the losses that were incurred? It might seem mistaken to look for large lessons in such a small problem as the recycling price spike of 1995. Recycled materials are a small part of the economy, and almost all markets are stable almost all of the time. On the other hand, the price spike was a large and painful experience for those who were involved, and the same speculative market pathology could easily break out again, in the same or other markets. Ironically, it may be features that economic theorists disparage as market imperfections which account for price stability in most markets. In cases where stability is lacking, government intervention in price-setting, far from interfering with the market, may be just what is needed to make the market operate efficiently. Appendix: Data sources and modeling approach The data used in this paper were downloaded from the websites of the Bureau of Labor Statistics, the Federal Reserve Board, and the Commerce Department. Details are available from the authors on request. Price series are producer price indexes; they are deflated by the producer price index for finished goods (as is the hourly wage series). In view of the slow and steady pace of inflation for most of the period being analyzed, the choice of deflator appears to be of secondary importance. There is a lengthy break in the waste paper price index in 1982-83, since budget-cutting efforts at the start of the Reagan administration included a temporary suspension of the collection of many price series. Price data are available without interruption starting in July 1983. Several data series - capacity utilization, inventory/shipment ratio, and production worker wages - were readily available only for the pulp and paper industry as a whole, not for pulp mills alone. (There is even less hope of distinguishing recycled from virgin pulp production in government statistics.) Thus we often used paper industry totals. Most of the data series used here are reported on a monthly basis. For real GDP we used linear interpolation between the quarterly figures released by the Commerce Department (assigning the quarterly figure to the middle month of the quarter). For the Canadian exchange rate we used monthly averages of daily spot rates from the Federal Reserve Board. The monthly real prices of pulp and waste paper are nonstationary time series. Regressions using prices (or log prices) as the dependent variables suffer from extreme autocorrelation. We addressed this problem by using first differences of the price series and most other data. The only exceptions are capacity utilization and the inventory to shipments ratio. In these cases, economic theory suggests that a high level of capacity utilization, or a low ratio of inventory to shipments, should be associated with an increase in price. That is, the levels of these two independent variables should be correlated with changes in the price variables.
G-DAE Working Paper No. 01-02: “Mixed Signals”
18
Most of the economic relationships that we tested in our regressions are relatively short-term ones, implying that current values or very short lags are appropriate for the independent variables. A notable exception is the influence of capacity utilization. Since it may take up to two years to expand capacity, it seems reasonable to explore long lags in the effects of capacity utilization on prices. For the pulp price equation, long lag structures are in practice unnecessary: the combination of the current and previous months’ capacity utilization fits the data as well as any longer or more complicated lag structure. For the waste paper price equation, however, we initially found a positive effect of current capacity utilization, and a slightly (not significantly) larger negative effect of capacity utilization lagged many months. The most coherent economic explanation of these estimates seemed to be that the price responds to the change in capacity utilization over many months. Thus we constrained the equation to have exactly that form, resulting in the estimate shown in the text. Frank Ackerman is Director of the Research and Policy Program of the Global Development And Environment Institute and Research Associate Professor at Tufts University’s Urban and Environmental Policy Program. Kevin Gallagher is a Research Associate on G-DAE's "Sustainable Hemispheric Integration Project." He is a doctoral candidate in International Political Economy at Tufts University, and holds a Masters Degree in International Environmental Policy from Tufts. REFERENCES Ackerman, F., and Gallagher, K., 2000. Getting the Prices Wrong: The Limits of Market-Based Environmental Policy. Tufts University: Global Development and Environment Institute Working Paper 00-05 (available at http://ase.tufts.edu/gdae/publications.html). Ackerman, F., 1997. Why Do We Recycle? Markets, Values, and Public Policy (Washington DC: Island Press). Baumol, W. J., and Oates, W. E., 1988. The Theory of Environmental Policy (New York: Cambridge University Press). Bellelis, V., 1997. Paper Industry - France, U.S. Department of Commerce, International Trade Administration Market Research Report ISA970301. Bikhchandani, S., Hirshleifer, D., and Welch, I, 1998. Learning From the Behavior of Others: Conformity, Fads, and Informational Cascades, Journal of Economic Perspectives Vol. 12, 151-170. Blinder, A.S., Canetti, E.R, Lebow, D.E., and Rudd, J.B., 1998. Asking About Prices: A
G-DAE Working Paper No. 01-02: “Mixed Signals”
19
New Approach to Understanding Price Stickiness (New York: Russell Sage Foundation). Brunetti, C., and Gilbert, C.L., 1995. Metals Price Volatility, 1972-95, Resources Policy Vol. 21, no.4, 237-254. Christensen, L.R. and Caves, R.E., 1997. Cheap Talk and Investment Rivalry in the Pulp and Paper Industry, Journal of Industrial Economics Vol. 45, 47-73. Deaton, A., and Laroque, G., 1992. On the Behavior of Commodity Prices, Review of Economic Studies, Vol. 59, 1-23. Deaton, A., and Laroque, G., 1996. Competitive Storage and Commodity Price Dynamics, Journal of Political Economy Vol. 104, 896-923. Deb P., P.K. Trivedi, and P. Varangis, 1996. The Excess Co-movement of Commodity Prices Reconsidered, Journal of Applied Econometrics vol. 11 no.3, 275-291. Economist, 1997. America’s Recyclers: A Funny Sort of Market, unsigned article, October 18. Hanley, N. and Slark, R., 1994. Cost-Benefit Analysis of Paper Recycling: A Case Study and Some General Principles, Journal of Environmental Planning and Management Vol. 37, 189-197. IMF, 1996. World Economic Outlook (Washington: International Monetary Fund). Michael, J.A., 1998. Recycling, International Trade, and the Distribution of Pollution: The Effect of Increased U.S. Paper Recycling on U.S. Import Demand for Canadian Paper, Journal of Agricultural and Applied Economics Vol. 30 (July), 217-223. National Recycling Coalition, 1996. Understanding Price Fluctuations, Market Development Newslink, Vol. 3 no. 1 (Spring), 1-3. Pindyck, R.S., and Rotemberg, J.J., 1990. The Excess Co-movement of Commodity Prices, Economic Journal v100, n403 (December): 1173-89 Schifrin, M. with Johnson, S.S., 1997. Sue the White House? Forbes, September 8. Schiller, R.J., 1989. Market Volatility (Cambridge MA: MIT Press). Slade, M.E., 1991. Marketing Structure, Marketing Method, and Price Instability, Quarterly Journal of Economics Vol. 106 no. 4, 1309-1340. Stavins, R., et al., 1988. Project 88: Harnessing Market Forces to Protect Our Environment: Initiatives for the New President (Washington DC, 1988).
G-DAE Working Paper No. 01-02: “Mixed Signals”
20
Stavins, R., et al., 1991. Project 88 – Round II: Incentives for Action: Designing Market-Based Environmental Strategies (Washington DC, 1991). Tierney, J., 1996. Recycling is Garbage, New York Times Magazine, June 30, 24ff. Tilton, J.E., 1999. The Future of Recycling, Resources Policy, Vol. 25 (September), 197-204. Wilson, R., 1997. Where Were You When the Cycle Died?, Pulp & Paper, Vol. 71 no. 2 (February), 132.
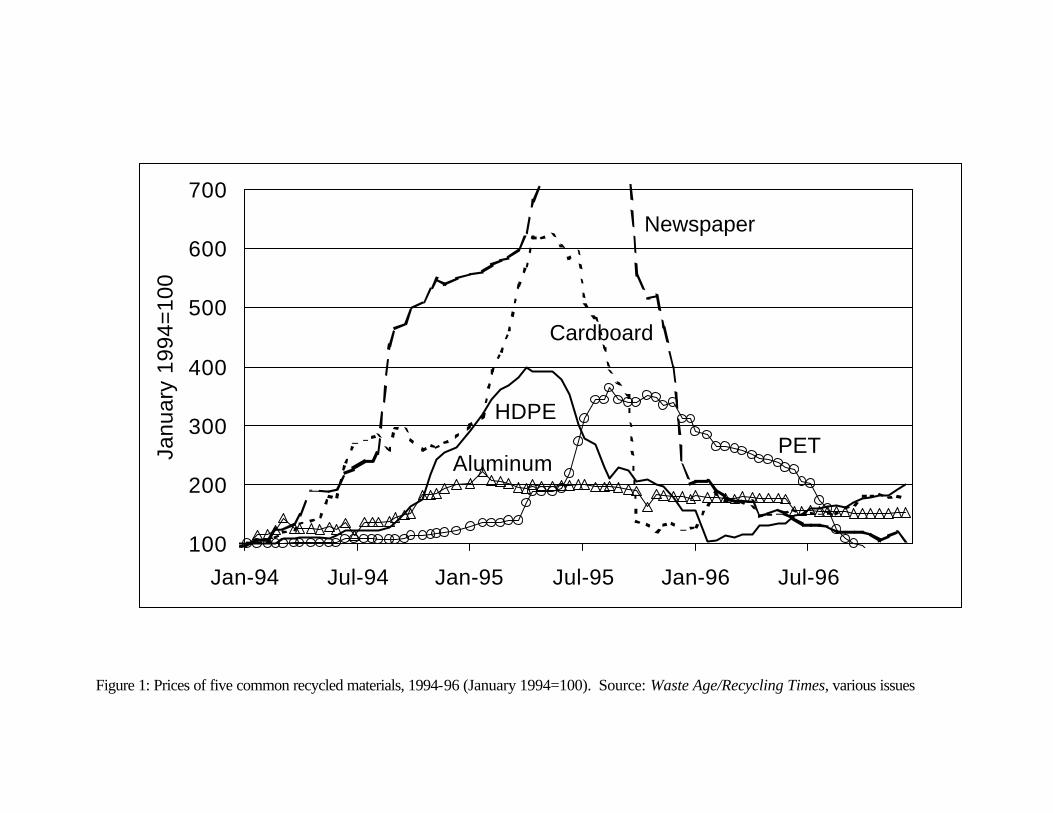
Figure 1: Prices of five common recycled materials, 1994-96 (January 1994=100). Source: Waste Age/Recycling Times, various issues
100
200
300
400
500
600
700
Jan-94 Jul-94 Jan-95 Jul-95 Jan-96 Jul-96
Janu
ary
1994
=10
0
Aluminum
Newspaper
Cardboard
PET
HDPE
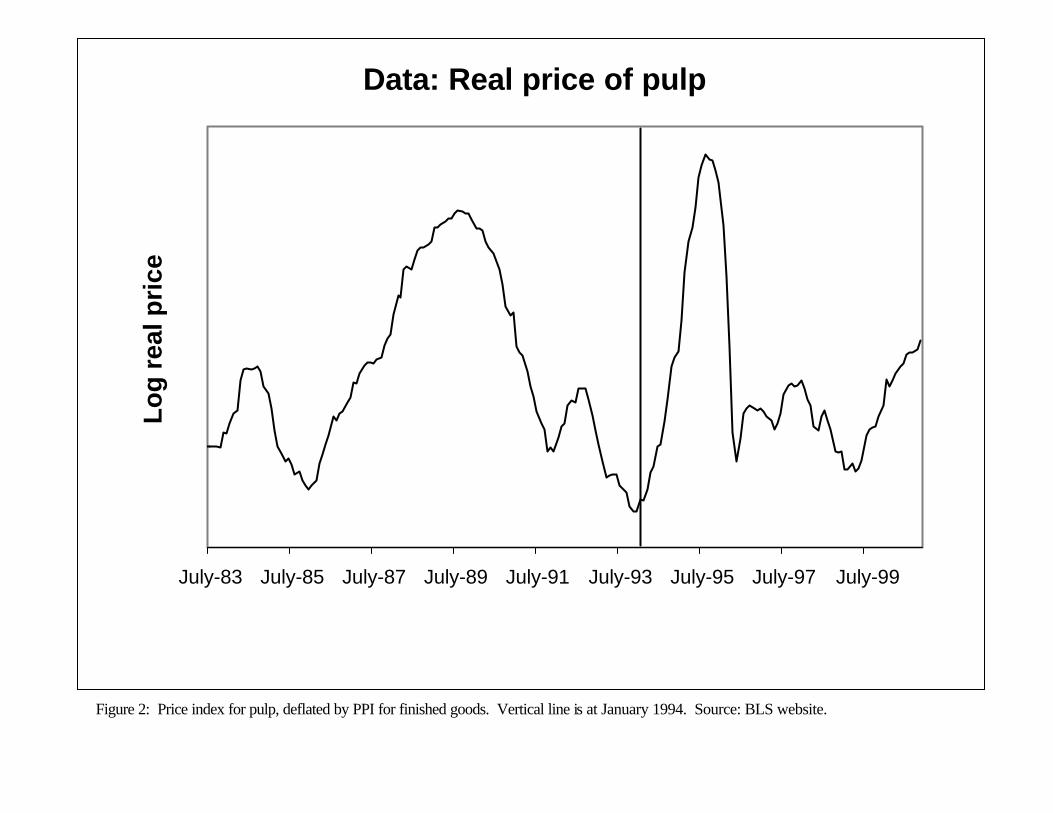
Figure 2: Price index for pulp, deflated by PPI for finished goods. Vertical line is at January 1994. Source: BLS website.
Data: Real price of pulp
July-83 July-85 July-87 July-89 July-91 July-93 July-95 July-97 July-99
Lo
g r
eal p
rice
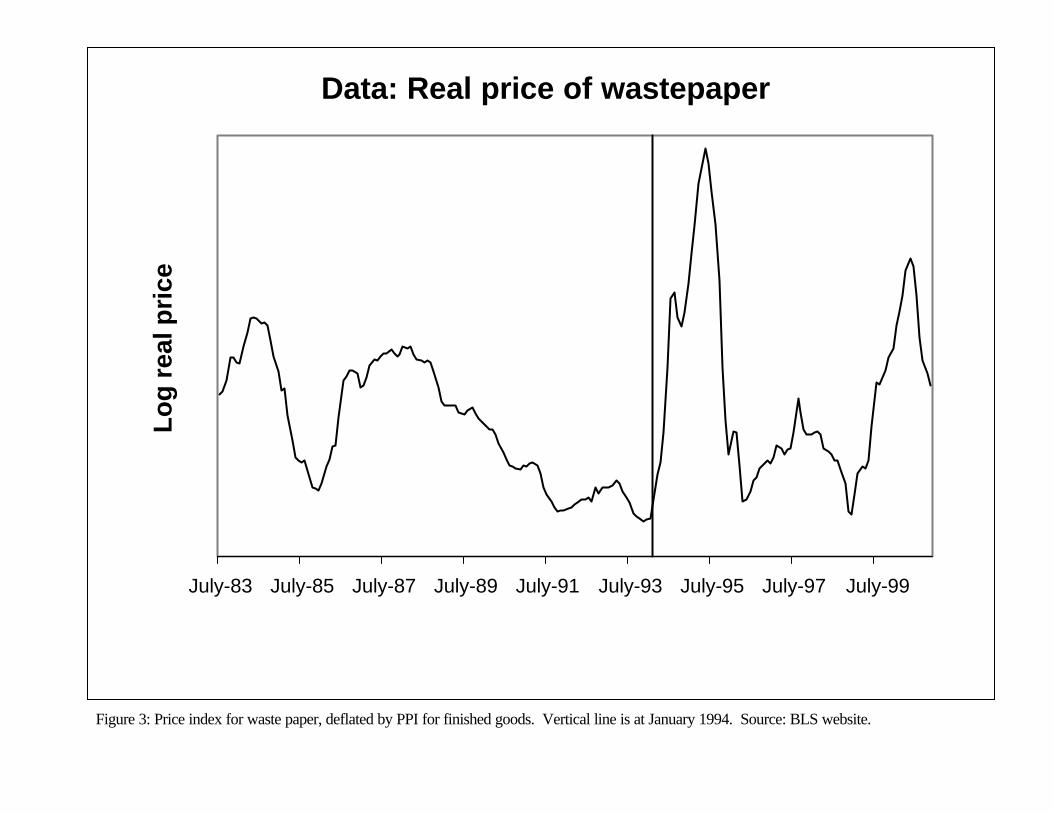
Figure 3: Price index for waste paper, deflated by PPI for finished goods. Vertical line is at January 1994. Source: BLS website.
Data: Real price of wastepaper
July-83 July-85 July-87 July-89 July-91 July-93 July-95 July-97 July-99
Lo
g r
eal p
rice
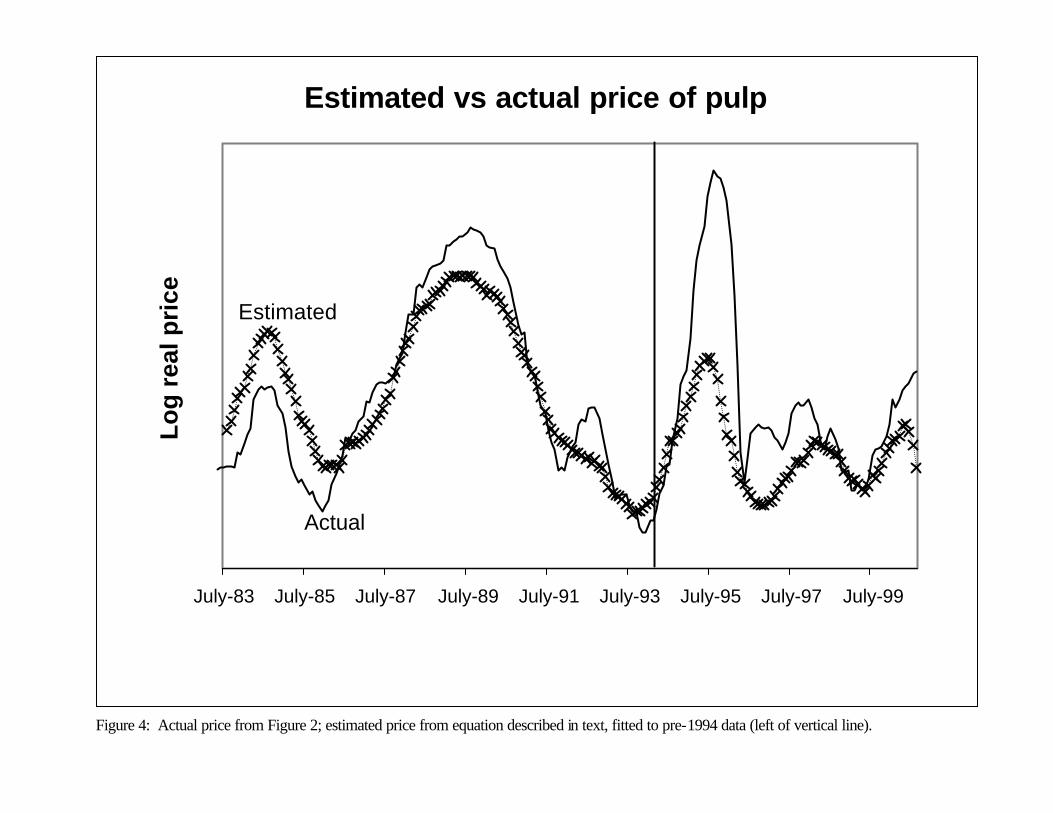
Figure 4: Actual price from Figure 2; estimated price from equation described in text, fitted to pre-1994 data (left of vertical line).
Estimated vs actual price of pulp
July-83 July-85 July-87 July-89 July-91 July-93 July-95 July-97 July-99
Lo
g r
eal p
rice
Estimated
Actual
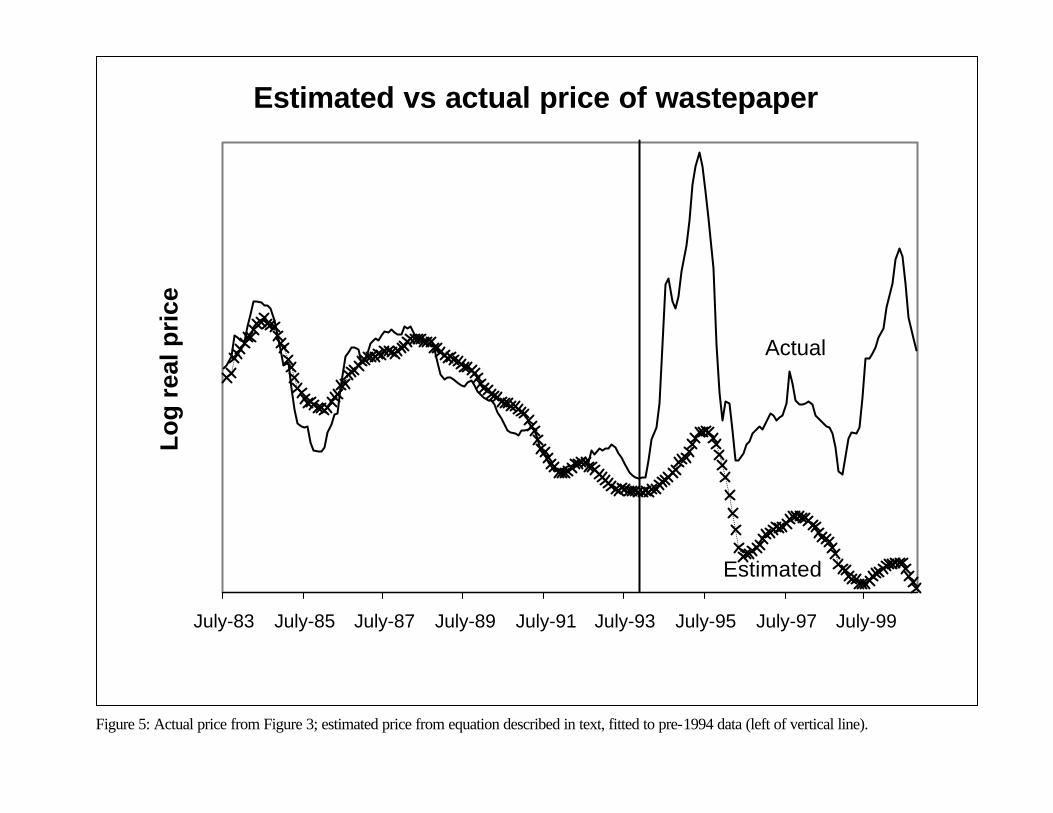
Figure 5: Actual price from Figure 3; estimated price from equation described in text, fitted to pre-1994 data (left of vertical line).
Estimated vs actual price of wastepaper
July-83 July-85 July-87 July-89 July-91 July-93 July-95 July-97 July-99
Lo
g r
eal p
rice
Actual
Estimated
The Global Development And Environment Institute (G-DAE) is a research institute at Tufts University dedicated to promoting a better understanding of how societies can pursue their economic goals in an environmentally and socially sustainable manner. G-DAE pursues its mission through original
research, policy work, publication projects, curriculum development, conferences, and other activities. The "G-DAE Working Papers" series
presents substantive work-in-progress by G-DAE-affiliated researchers. We welcome your comments, either by e-mail directly to the author or to G-DAE, Cabot Center, Fletcher School, Tufts University, Medford, MA 02155 USA;
tel: 617-627-3530; fax: 617-627-2409; e-mail: [email protected]; web: http://ase.tufts.edu/gdae.
Papers in this Series:
00-01 Still Dead After All These Years: Interpreting the Failure of General Equilibrium Theory (Frank Ackerman, November 1999) 00-02 Economics in Context: The Need for a New Textbook (Neva R. Goodwin, Oleg I. Ananyin, Frank Ackerman and Thomas E. Weisskopf, February 1997) 00-03 Trade Liberalization and Pollution Intensive Industries in Developing Countries: A Partial Equilibrium Approach (Kevin Gallagher and Frank Ackerman, January 2000) 00-04 Basic Principles of Sustainable Development (Jonathan M. Harris, June 2000) 00-05 Getting the Prices Wrong: The Limits of Market-Based Environmental Policy (Frank Ackerman and Kevin Gallagher, September 2000) 00-06 Telling Other Stories: Heterodox Critiques of Neoclassical Micro Principles Texts (Steve Cohn, August 2000) 00-07 Trade Liberalization and Industrial Pollution in Mexico: Lessons for the FTAA (Kevin Gallagher, October 2000) 00-08 Waste in the Inner City: Asset or Assault? (Frank Ackerman and Sumreen Mirza, June 2000) 01-01 Civil Economy and Civilized Economics: Essentials for Sustainable Development (Neva Goodwin, January 2001)