Embed Size (px)
Citation preview
Mobile Retailing in Europe And North America A RESEARCH REPORT FROM THE CENTRE FOR RETAIL RESEARCH FOR RETAILMENOT, INC. JUNE 2015
Overview
• Methodology • The Scale of Mobile Retailing • Mobile Purchases • Consumer Expectations and Retailer Strategies • The In-Store Opportuntiy • Why retailers can no longer ignore mobile • Conclusion
2
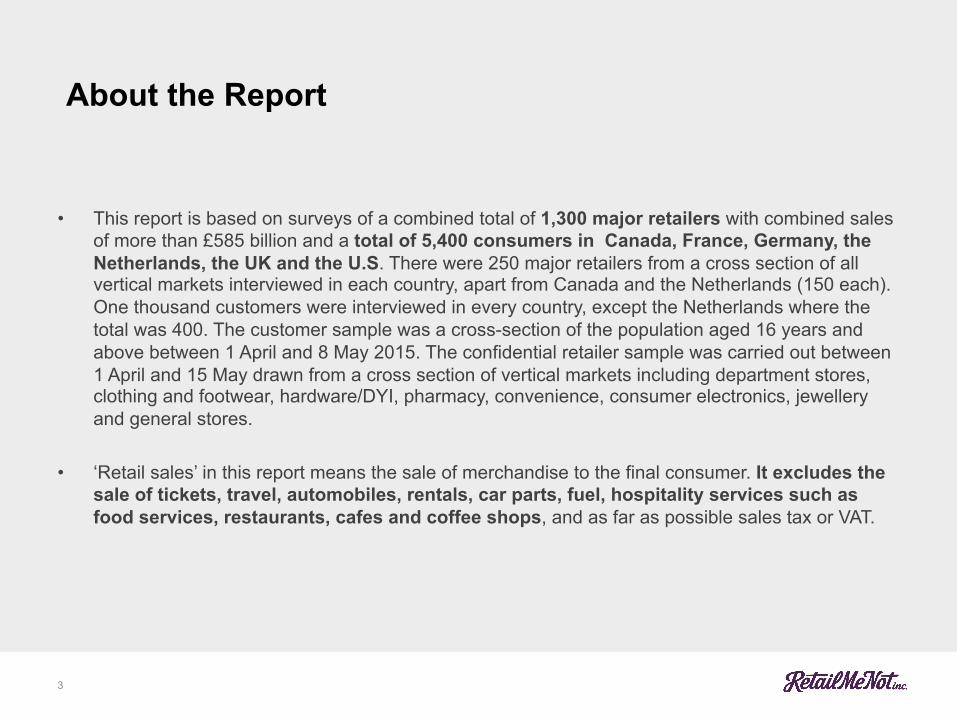
About the Report
• This report is based on surveys of a combined total of 1,300 major retailers with combined sales
of more than £585 billion and a total of 5,400 consumers in Canada, France, Germany, the Netherlands, the UK and the U.S. There were 250 major retailers from a cross section of all vertical markets interviewed in each country, apart from Canada and the Netherlands (150 each). One thousand customers were interviewed in every country, except the Netherlands where the total was 400. The customer sample was a cross-section of the population aged 16 years and above between 1 April and 8 May 2015. The confidential retailer sample was carried out between 1 April and 15 May drawn from a cross section of vertical markets including department stores, clothing and footwear, hardware/DYI, pharmacy, convenience, consumer electronics, jewellery and general stores.
• ‘Retail sales’ in this report means the sale of merchandise to the final consumer. It excludes the
sale of tickets, travel, automobiles, rentals, car parts, fuel, hospitality services such as food services, restaurants, cafes and coffee shops, and as far as possible sales tax or VAT.
3
The Scale of Mobile Retailing
4
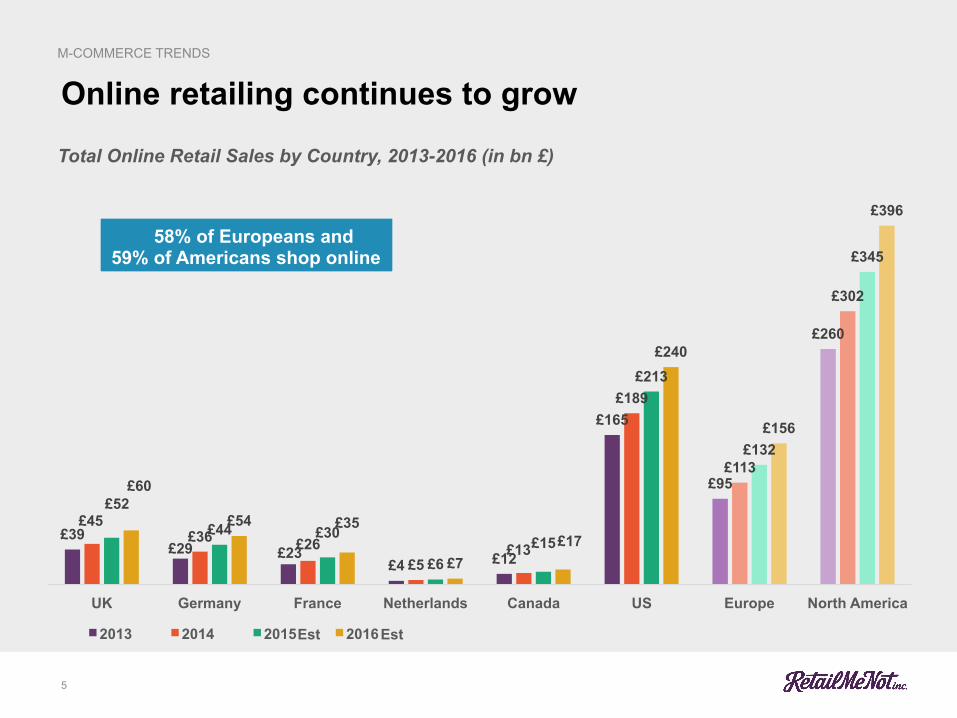
Online retailing continues to grow
5
M-COMMERCE TRENDS
£39 £29 £23
£4 £12
£165
£95
£260
£45 £36 £26
£5 £13
£189
£113
£302
£52
£44 £30
£6 £15
£213
£132
£345
£60
£54 £35
£7 £17
£240
£156
£396
UK Germany France Netherlands Canada US Europe North America
2013 2014 2015 2016
Total Online Retail Sales by Country, 2013-2016 (in bn £)
58% of Europeans and 59% of Americans shop online
Est Est
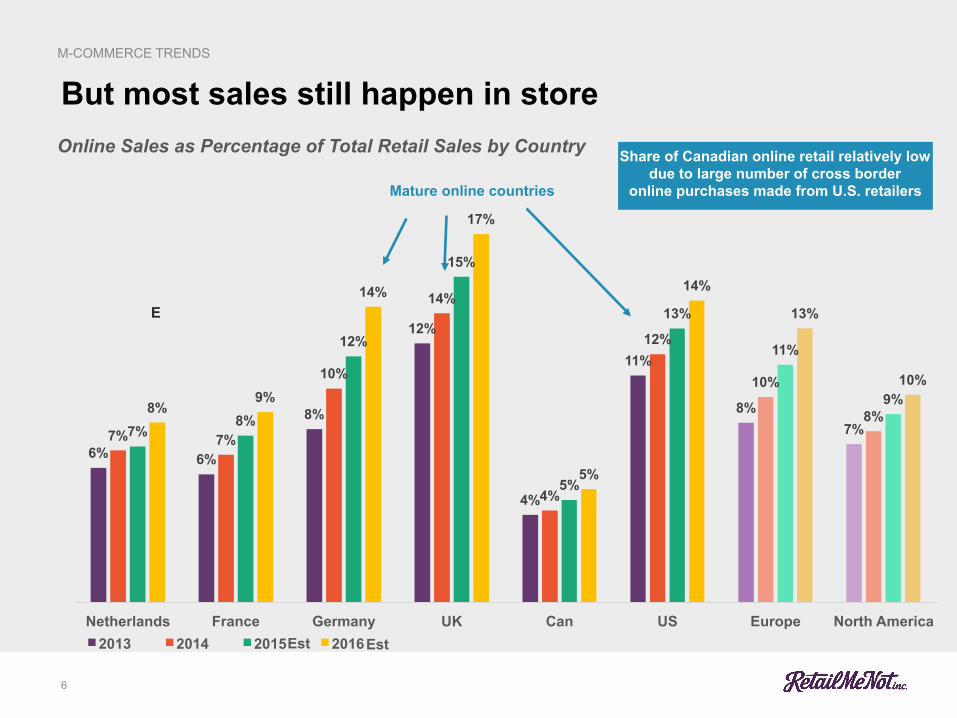
6% 6%
8%
12%
4%
11%
8% 7% 7% 7%
10%
14%
4%
12%
10%
8% 7%
8%
12%
15%
5%
13%
11%
9% 8% 9%
14%
17%
5%
14%
13%
10%
Netherlands France Germany UK Can US Europe North America
Online Sales as Percentage of Total Retail Sales by Country
2013 2014 2015 2016
Mature online countries
Share of Canadian online retail relatively low due to large number of cross border
online purchases made from U.S. retailers
E
But most sales still happen in store
6
M-COMMERCE TRENDS
Est Est
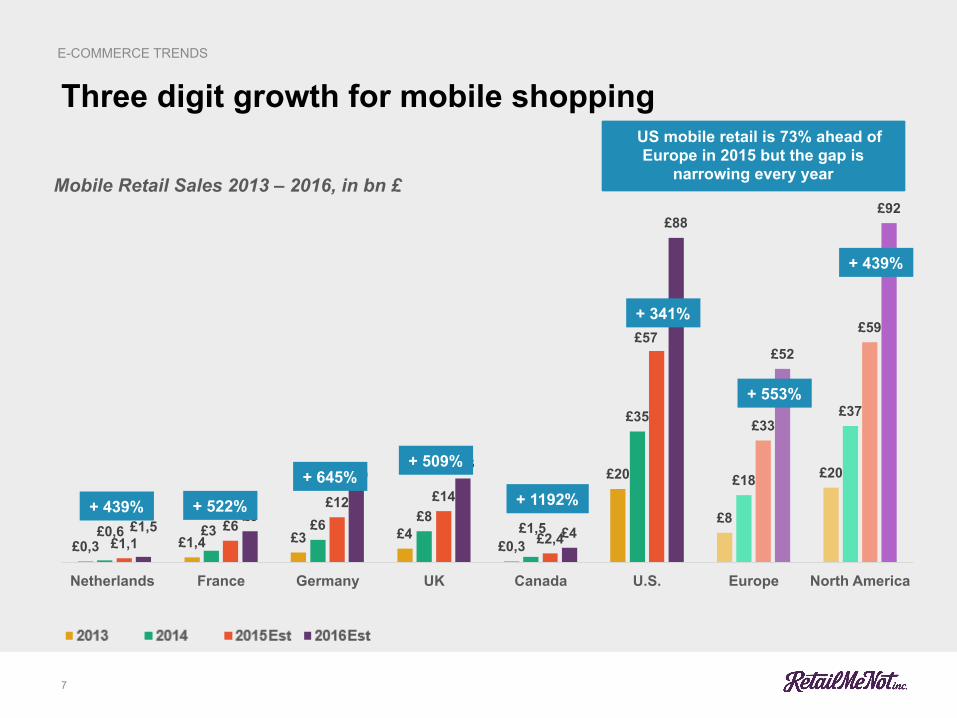
Three digit growth for mobile shopping
7
E-COMMERCE TRENDS
US mobile retail is 73% ahead of Europe in 2015 but the gap is
narrowing every year
£0,3 £1,4 £3 £4 £0,3
£20
£8
£20
£0,6 £3 £6 £8 £1,5
£35
£18
£37
£1,1 £6
£12 £14
£2,4
£57
£33
£59
£1,5 £8
£20 £23
£4
£88
£52
£92
Netherlands France Germany UK Canada U.S. Europe North America
Mobile Retail Sales 2013 – 2016, in bn £
+ 439%
+ 439%
+ 553%
+ 1192%
+ 509% + 645%
+ 522%
+ 341%
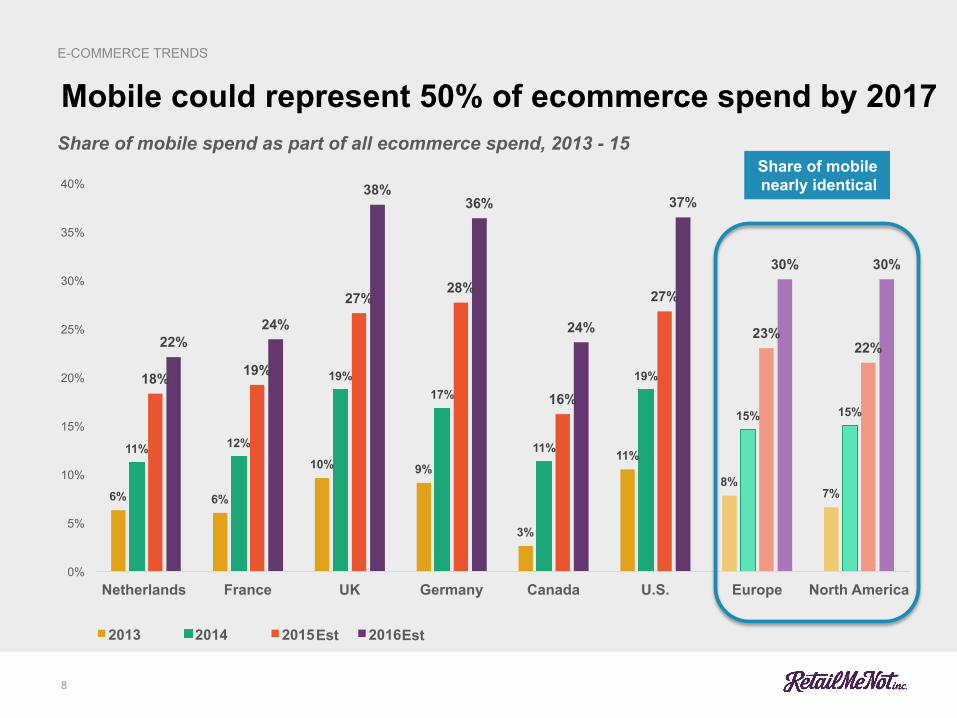
Mobile could represent 50% of ecommerce spend by 2017
8
E-COMMERCE TRENDS
6% 6%
10% 9%
3%
11%
8% 7%
11% 12%
19% 17%
11%
19%
15% 15%
18% 19%
27% 28%
16%
27%
23% 22% 22%
24%
38% 36%
24%
37%
30% 30%
0%
5%
10%
15%
20%
25%
30%
35%
40%
Netherlands France UK Germany Canada U.S. Europe North America
Share of mobile spend as part of all ecommerce spend, 2013 - 15
2013 2014 2015 2016
Share of mobile nearly identical
Est Est
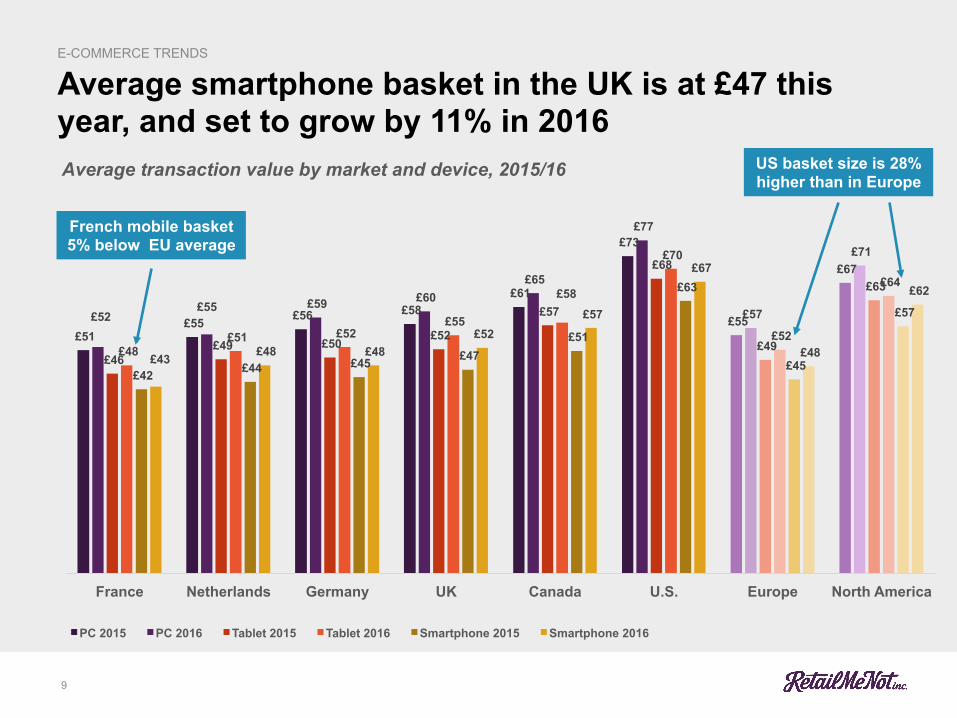
Average smartphone basket in the UK is at £47 this year, and set to grow by 11% in 2016
9
£51 £55 £56 £58
£61
£73
£55
£67
£52 £55 £59 £60
£65
£77
£57
£71
£46 £49 £50
£52
£57
£68
£49
£63
£48 £51 £52
£55
£58
£70
£52
£64
£42 £44 £45 £47 £51
£63
£45
£57
£43 £48 £48 £52
£57
£67
£48
£62
France Netherlands Germany UK Canada U.S. Europe North America
Average transaction value by market and device, 2015/16
PC 2015 PC 2016 Tablet 2015 Tablet 2016 Smartphone 2015 Smartphone 2016
E-COMMERCE TRENDS
US basket size is 28% higher than in Europe
French mobile basket 5% below EU average
Mobile Purchases
10
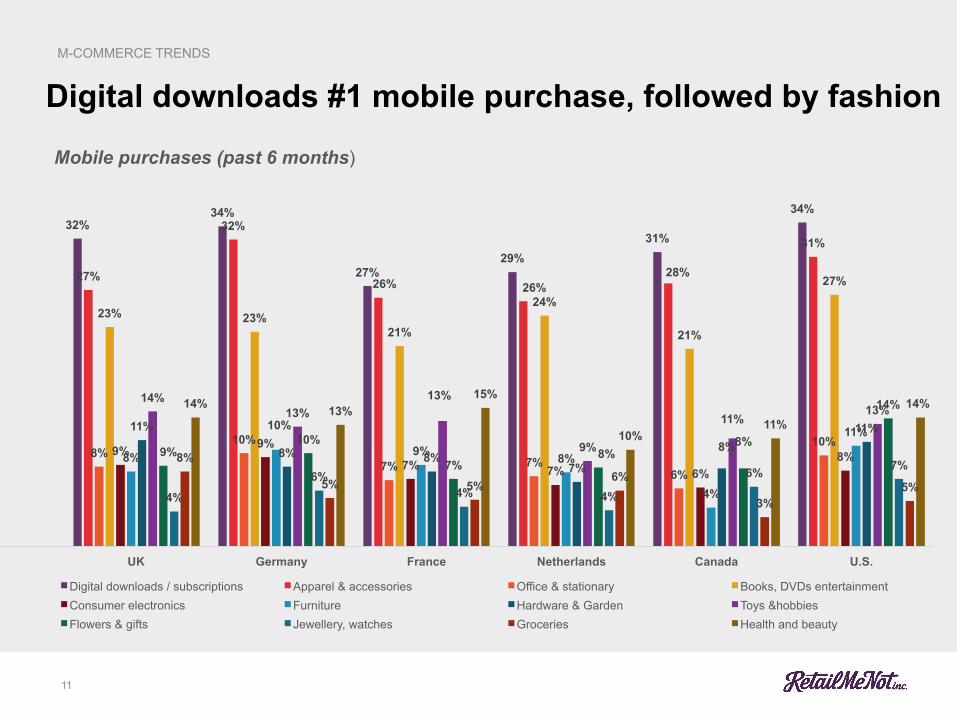
Digital downloads #1 mobile purchase, followed by fashion
11
M-COMMERCE TRENDS
32% 34%
27% 29%
31%
34%
27%
32%
26% 26% 28%
31%
8% 10%
7% 7% 6%
10%
23% 23% 21%
24%
21%
27%
9% 9%
7% 7% 6% 8% 8%
10%
9% 8%
4%
11% 11%
8% 8% 7%
8% 11%
14% 13%
13%
9%
11% 13%
9% 10%
7% 8%
8%
14%
4%
6% 4% 4%
6% 7% 8%
5% 5% 6%
3% 5%
14% 13% 15%
10% 11%
14%
UK Germany France Netherlands Canada U.S.
Mobile purchases (past 6 months)
Digital downloads / subscriptions Apparel & accessories Office & stationary Books, DVDs entertainment Consumer electronics Furniture Hardware & Garden Toys &hobbies Flowers & gifts Jewellery, watches Groceries Health and beauty
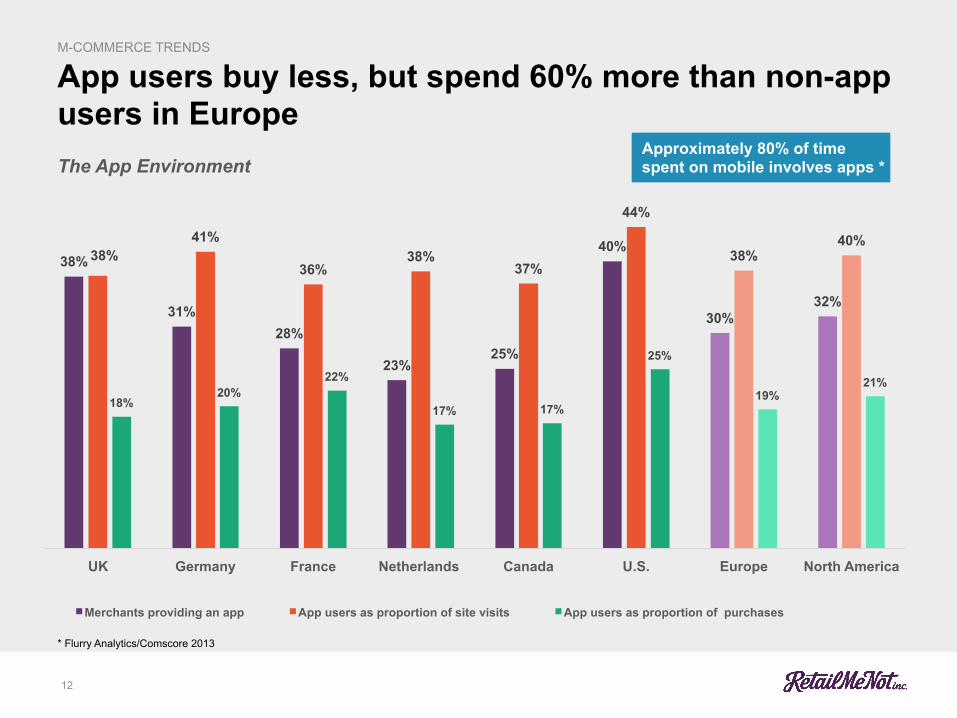
App users buy less, but spend 60% more than non-app users in Europe
12
M-COMMERCE TRENDS
The App Environment
38%
31% 28%
23% 25%
40%
30% 32%
38% 41%
36% 38%
37%
44%
38% 40%
18% 20%
22%
17% 17%
25%
19% 21%
UK Germany France Netherlands Canada U.S. Europe North America
Merchants providing an app App users as proportion of site visits App users as proportion of purchases
Approximately 80% of time spent on mobile involves apps *
* Flurry Analytics/Comscore 2013
Consumer Expectations and Retailer Strategies
13
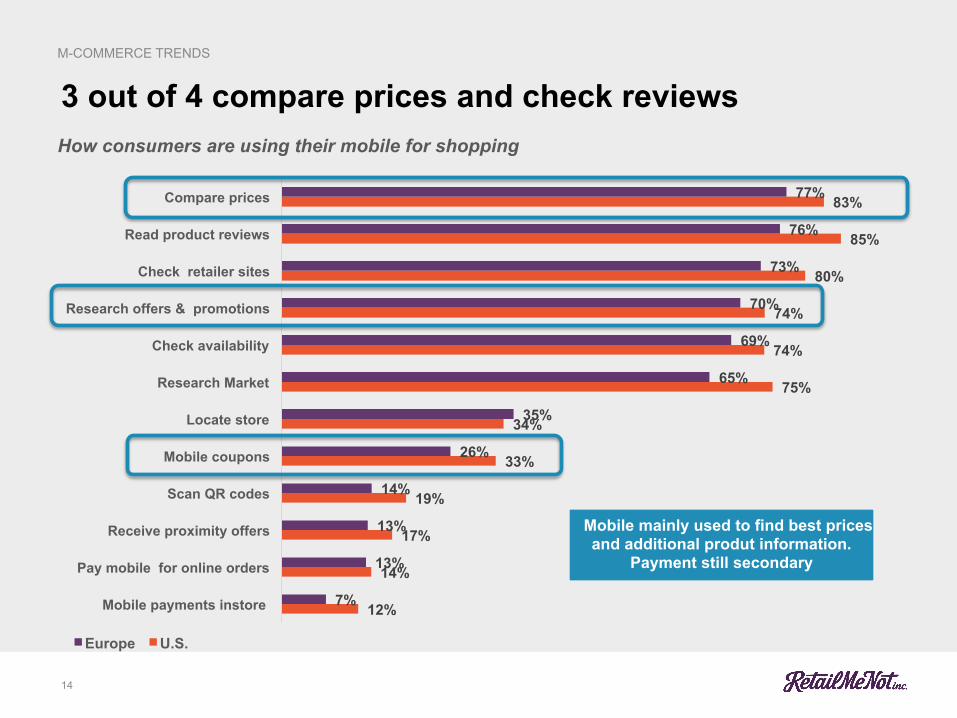
3 out of 4 compare prices and check reviews
14
M-COMMERCE TRENDS
How consumers are using their mobile for shopping
12%
14%
17%
19%
33%
34%
75%
74%
74%
80%
85%
83%
7%
13%
13%
14%
26%
35%
65%
69%
70%
73%
76%
77%
Mobile payments instore
Pay mobile for online orders
Receive proximity offers
Scan QR codes
Mobile coupons
Locate store
Research Market
Check availability
Research offers & promotions
Check retailer sites
Read product reviews
Compare prices
Europe U.S.
Mobile mainly used to find best prices and additional produt information.
Payment still secondary
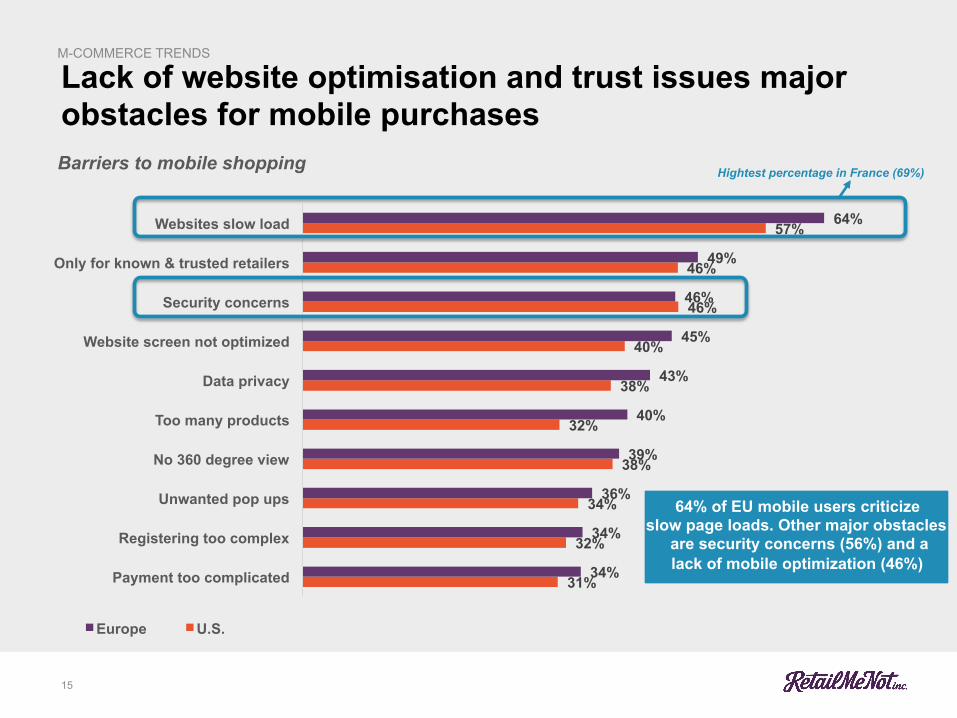
Lack of website optimisation and trust issues major obstacles for mobile purchases
15
M-COMMERCE TRENDS
Barriers to mobile shopping
64% of EU mobile users criticize slow page loads. Other major obstacles
are security concerns (56%) and a lack of mobile optimization (46%)
31%
32%
34%
38%
32%
38%
40%
46%
46%
57%
34%
34%
36%
39%
40%
43%
45%
46%
49%
64%
Payment too complicated
Registering too complex
Unwanted pop ups
No 360 degree view
Too many products
Data privacy
Website screen not optimized
Security concerns
Only for known & trusted retailers
Websites slow load
Europe U.S.
Hightest percentage in France (69%)
The In-Store Opportunity
16
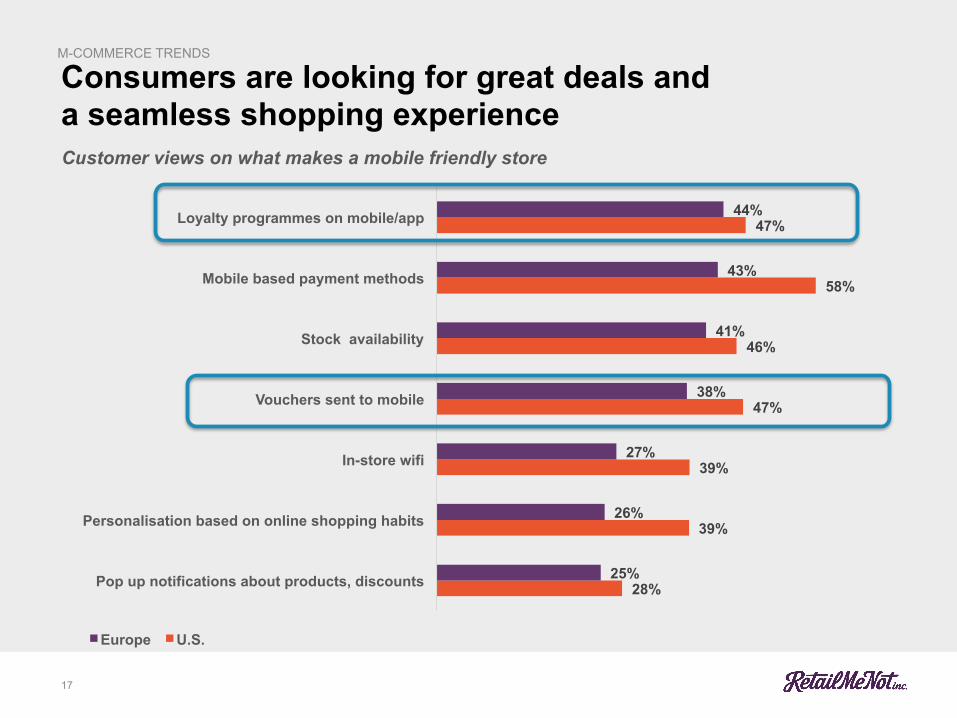
Consumers are looking for great deals and a seamless shopping experience
17
M-COMMERCE TRENDS
Customer views on what makes a mobile friendly store
28%
39%
39%
47%
46%
58%
47%
25%
26%
27%
38%
41%
43%
44%
Pop up notifications about products, discounts
Personalisation based on online shopping habits
In-store wifi
Vouchers sent to mobile
Stock availability
Mobile based payment methods
Loyalty programmes on mobile/app
Europe U.S.
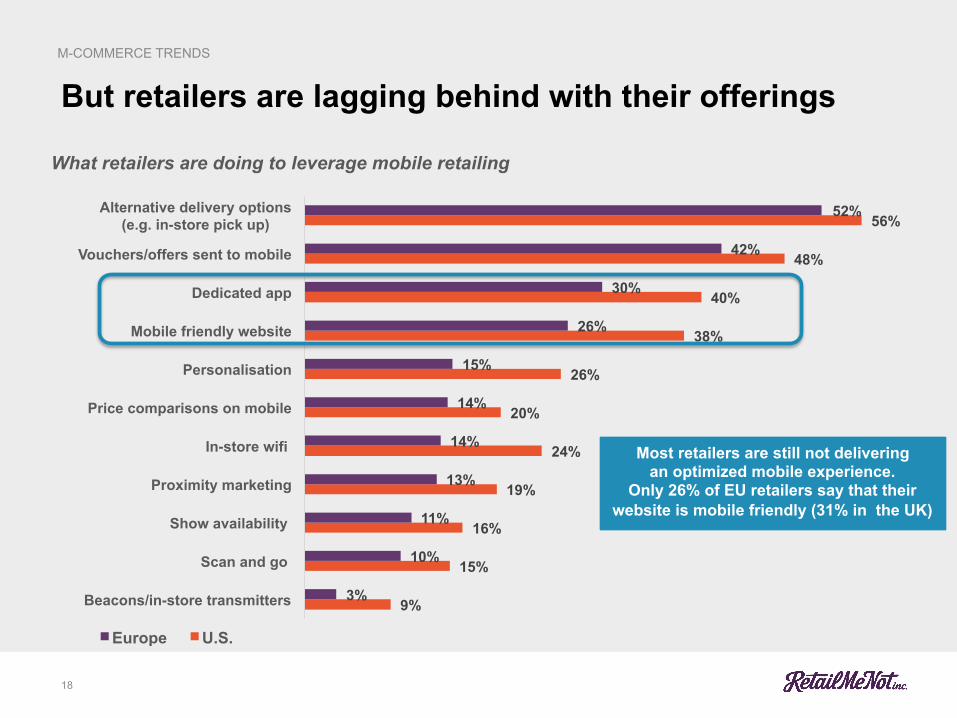
9%
15%
16%
19%
24%
20%
26%
38%
40%
48%
56%
3%
10%
11%
13%
14%
14%
15%
26%
30%
42%
52%
Beacons/in-store transmitters
Scan and go
Show availability
Proximity marketing
In-store wifi
Price comparisons on mobile
Personalisation
Mobile friendly website
Dedicated app
Vouchers/offers sent to mobile
Alternative delivery options (e.g. in-store pick up)
Europe U.S.
But retailers are lagging behind with their offerings
18
M-COMMERCE TRENDS
What retailers are doing to leverage mobile retailing
Most retailers are still not delivering an optimized mobile experience.
Only 26% of EU retailers say that their website is mobile friendly (31% in the UK)
Why retailers can no longer ignore mobile
19
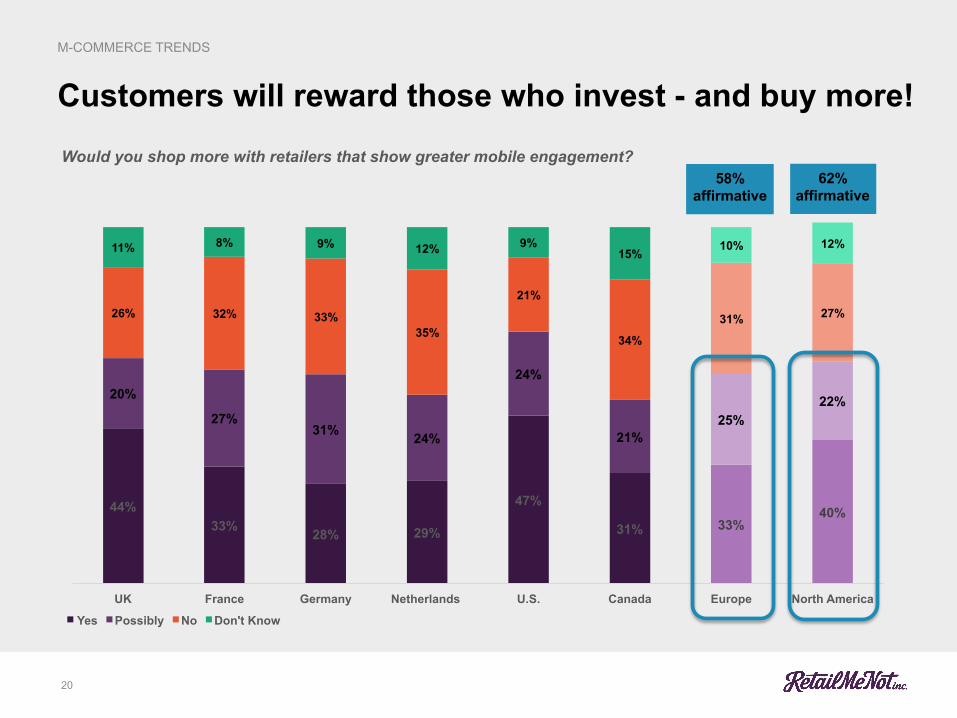
Customers will reward those who invest - and buy more!
20
M-COMMERCE TRENDS
44% 33% 28% 29%
47%
31% 33% 40%
20%
27% 31% 24%
24%
21% 25%
22%
26% 32% 33% 35%
21%
34%
31% 27%
11% 8% 9% 12% 9% 15%
10% 12%
UK France Germany Netherlands U.S. Canada Europe North America
Yes Possibly No Don't Know
58% affirmative
62% affirmative
Would you shop more with retailers that show greater mobile engagement?
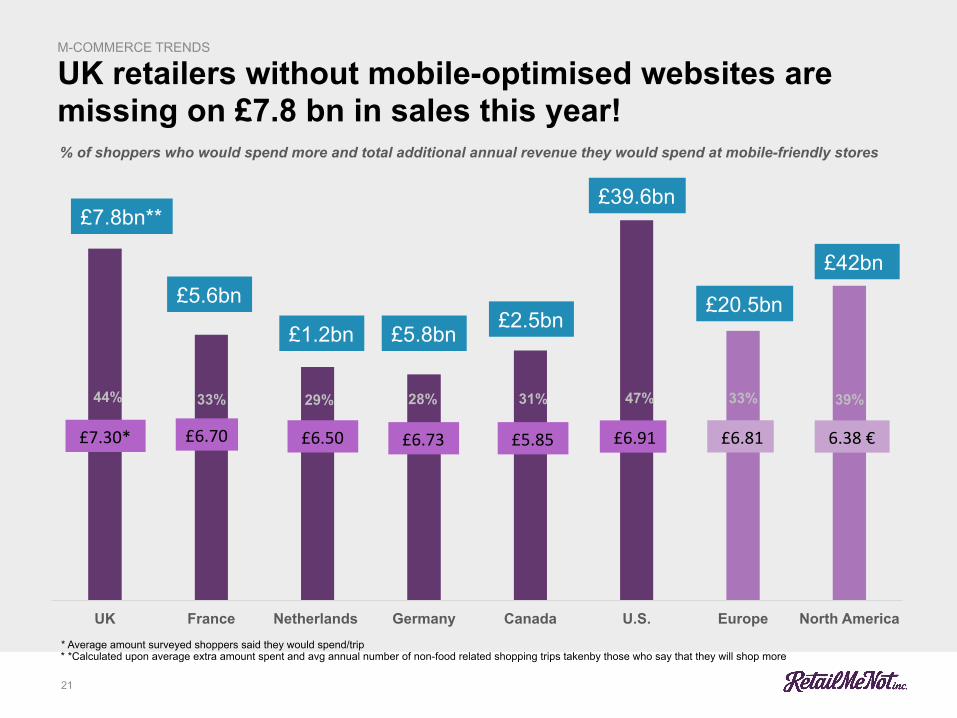
UK retailers without mobile-optimised websites are missing on £7.8 bn in sales this year!
21
M-COMMERCE TRENDS
44% 33% 29% 28% 31% 47% 33% 39%
UK France Netherlands Germany Canada U.S. Europe North America
£7.30* £6.70 £6.50 £6.73 £5.85 £6.91 £6.81 6.38 €
% of shoppers who would spend more and total additional annual revenue they would spend at mobile-friendly stores
£7.8bn**
£5.6bn
£1.2bn £5.8bn £2.5bn
£39.6bn
£20.5bn
£42bn
* Average amount surveyed shoppers said they would spend/trip * *Calculated upon average extra amount spent and avg annual number of non-food related shopping trips takenby those who say that they will shop more
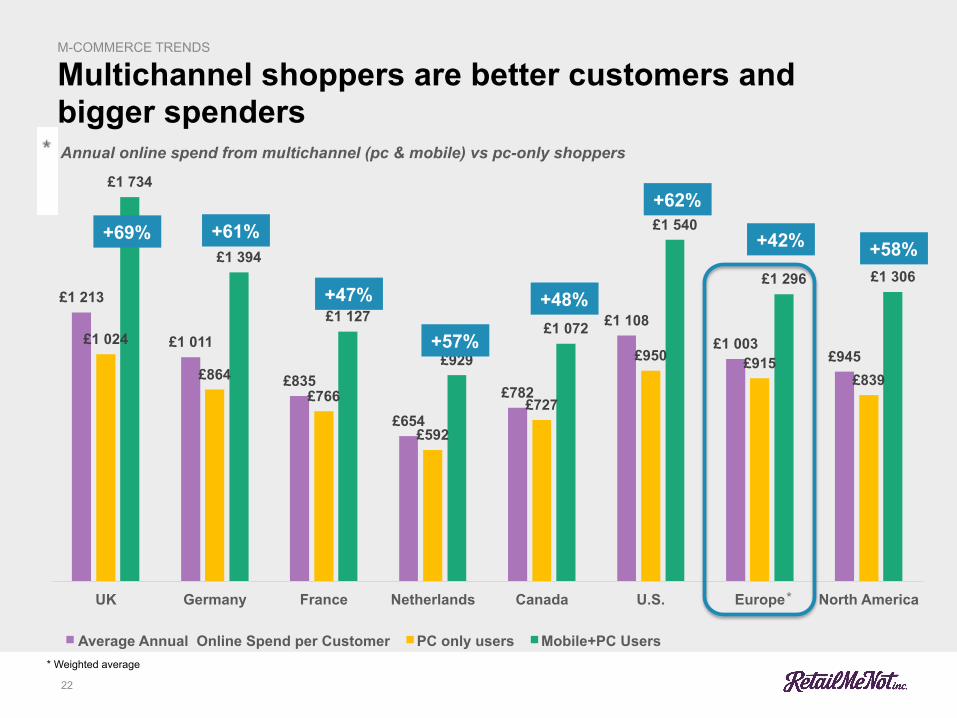
£1 213
£1 011
£835
£654
£782
£1 108 £1 003
£945 £1 024
£864 £766
£592
£727
£950 £915 £839
£1 734
£1 394
£1 127
£929
£1 072
£1 540
£1 296 £1 306
UK Germany France Netherlands Canada U.S. Europe North America
Average Annual Online Spend per Customer PC only users Mobile+PC Users
Multichannel shoppers are better customers and bigger spenders
22
M-COMMERCE TRENDS
+62% +61% +69%
+48%
+57%
+47%
+42% +58%
Annual online spend from multichannel (pc & mobile) vs pc-only shoppers
*
* Weighted average
Conclusions
• In just 7 years mobile has taken a major place in retail and could represent 50% or more of all ecommerce spend in Europe by 2017
• The average mobile basket is slighly below the average online basket as consumers are for now using their smartphones or tablets primarily for smaller purchases. Mobile shoppers buy mostly digital downloads (such as apps or subscriptions), fashion and entertainment media (books, cds, media) for now
• While the majority of transactions still happen online or in-store, mobile devices have become a key element in the shopping journey. Consumers use them to find the best prices and deals, redeem vouchers, check instore availabilty or get additional product information such as reviews
• Barriers to mobile transactions are poor performance and security concerns, but also the complexity of transmitting credit card details or personal information
• Despite the interest from consumers, many retailers are yet not living up to their expectations : only 1 out of 4 European retailers consider their website mobile friendly
• Investments in mobile technologies will pay off. Consumers who use their mobile during their shopping journey spend on average 45% more than pc only shoppers. And for mobile friendly stores there’s an opportunity of additional sales of £7.8 bn in the UK this year. In other words, retailers who are not seizing the mobile opportunity are leaving money on the table and may lose their clients to their competitors.
23